1. Introduction
Providing roadside safety for road users is a critical priority for transportation authorities, given the high number of vehicle accidents that occur along roadsides. Data from the National Highway Traffic Safety Administration’s Fatality Analysis Reporting System (FARS) [
1] indicates that 21% of deaths in vehicle crashes result from roadside crashes, leading to 8884 fatalities. These crashes often involve vehicles colliding with fixed objects, such as trees and utility poles. Trees are struck most frequently, contributing to 45% of these fatalities, followed by utility poles at 11%. While removing roadside hazards is the preferred method of enhancing safety, it is often impractical due to aesthetic, environmental, and logistical reasons [
2]. As a countermeasure, barriers, including guardrails, are installed to protect vehicles from roadside hazards.
Guardrails are the most widely installed barriers, and they are engineered to safely guide vehicles back onto the road and bring them to a gradual stop rather than causing a sudden halt [
3,
4]. The Federal Highway Administration (FHWA) [
5] highlights that the functionality of guardrails is contingent upon their condition, with even minor dents potentially impacting their performance. Damaged guardrails can pose greater hazards than the fixed objects they are meant to protect against if not promptly identified and repaired. Department of Transportation (DOT) agencies maintain detailed records of guardrails to monitor their condition and ensure road safety. This involves creating inventories and reporting any damage that requires immediate maintenance. Traditional inspection methods are prone to human errors and require significant time and labor, highlighting the need for adopting automated methods in infrastructure assessment, including that of guardrails.
Transportation agencies highlight that the most common type of guardrail damage is face deformation, particularly dents, which vary in severity based on the extent of the deformation and the number of posts affected. Severe deformations can significantly compromise guardrail functionality and lead to fatal accidents if not promptly addressed. Vertical tears, although less common, weaken the rail’s strength and can cause the guardrail to collapse or allow vehicles to penetrate it, as reported by the California Department of Transportation [
6]. End terminals and posts are also critical elements in guardrail safety. The American Association of State Highway and Transportation Officials (AASHTO) [
7] states that end terminals are designed to mitigate serious injuries when the barrier’s end is struck by absorbing energy, resulting in deformation. They also provide tension to the guardrail beam and protection against side impacts. Damaged end terminals can deform into a spearhead that penetrates the vehicle or causes it to lose stability, thus making repair work for end terminals a very high priority [
5]. Guardrail posts maintain the guardrail’s stability to resist collisions. Therefore, deflected or missing posts compromise guardrail performance, as reported by the American Traffic Safety Services Association (ATSSA) [
8].
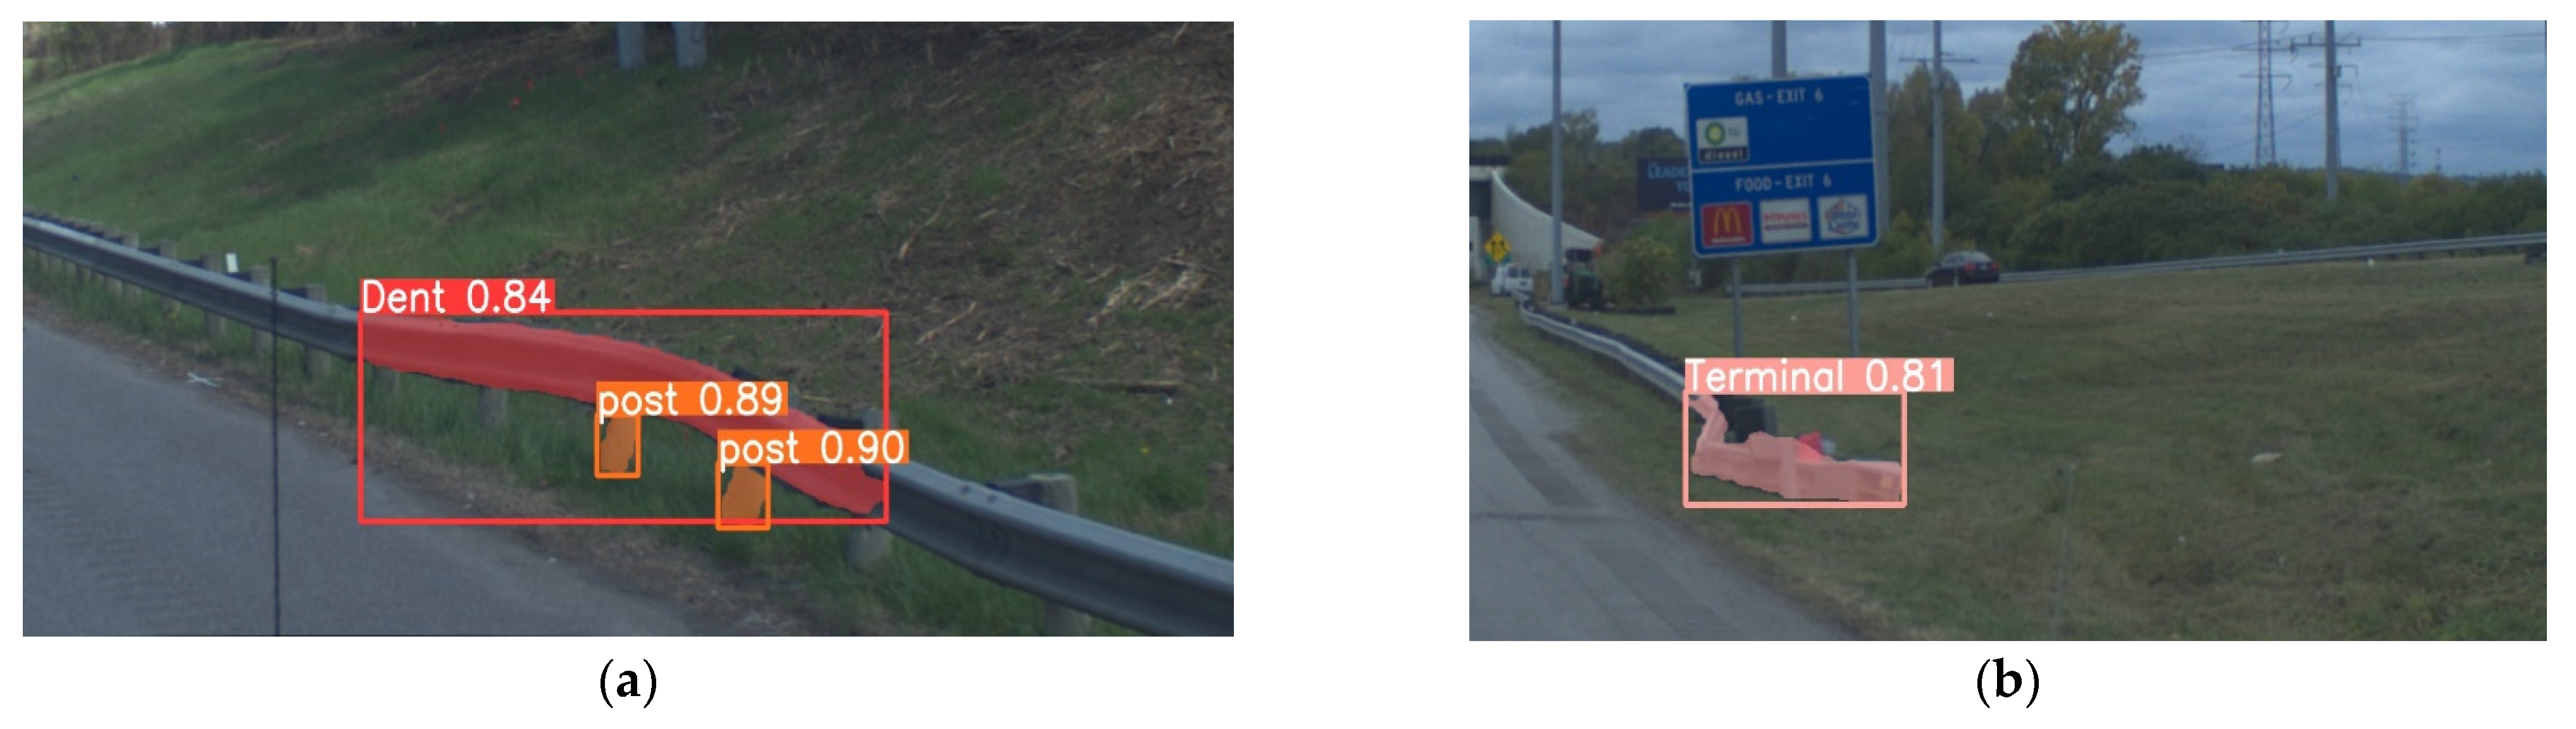
Figure 1 illustrates an example of the aforementioned damage to guardrails.
2. Background
Despite the advances in infrastructure assessment and artificial intelligence (AI), automating guardrail assessment remains a challenging endeavor. While research on automating guardrail inspection is limited, it has primarily focused on various aspects of identifying specific guardrail properties, such as skewness, presence of rust, and type of rail. A few studies focused on automating the assessment of guardrails but did not provide a comprehensive methodology.
Kasuga et al. [
9] developed a model to identify rust on guardrails. Image classification models include contextual information from the background of guardrails, like grass and other irrelevant objects surrounding guardrails, which impacts the accuracy of the prediction. To overcome this issue, a semantic segmentation model was used to extract guardrail features and then fed into a machine-learning model to perform the classification task. The results showed a 10% improvement in performance compared with the baseline CNN and proved to be effective in handling background objects present in images. However, the training and testing were conducted on a small dataset, which raises concerns about generalizability.
Mukherjee et al. [
10] explored the process of automating inspection tasks for various road elements, including guardrails. They utilized a segmentation model to detect guardrails, followed by an analysis of the output segmentation mask to calculate the contours. These contours were then analyzed using a proposed Convex Hull Solidity formula, which compares the contour area to the convex hull area. This correlation measures the skewness and the angle of the guardrail, relying on threshold values that are highly subjective and vary by location. The authors integrated GPS (Global Positioning System) technology to geo-reference the locations of damaged barriers, enhancing the ability to create accurate road maintenance plans and inventory.
Jin et al. [
11] sought to automate the assessment of guardrails by identifying deficiencies using image preprocessing and advanced deep learning algorithms. The authors used a modified U-net segmentation model that separates guardrails from their surroundings. Following that, the authors identified defects using two key techniques: firstly is the detection of corrosion by analyzing changes in grayscale histogram values, which indicates areas where the guardrail’s protective layer has been compromised; secondly, structural deformities are identified using anomaly detection based on wavelet transformations by examining signal variations to identify dents in the guardrail structure. Despite achieving over 85% accuracy in spotting both corrosion and structural issues, the study highlights potential challenges to their approach. Variabilities in lighting and the angle of image capture can change how guardrails are visually represented in the images, and this might affect the reliability of histogram and wavelet-based analyses that are critical for identifying defects. Furthermore, the computational time required by the U-net model, averaging 6.71 s per image, thus limits its utility in real-time applications.
Ai & Qing [
12] conducted an extensive report on the automation of guardrail condition evaluation and detection. The methodology employed in this study involves using LiDAR, complemented by imagery analysis. LiDAR technology was used to extract important data on the guardrail, including its dimensions and terminals, enabling the creation of a comprehensive inventory. The authors also used LiDAR to identify guardrail deficiencies, including damage, such as face dents, terminal, and post. LiDAR struggles to detect objects that are tiny in size or that are out of range. For this reason, the study’s researchers used imagery analysis for bolt localization to identify missing bolts. The study showcased promising results in the automation of building an inventory and in assessment. However, the evaluation was conducted on a limited number of testing sections, raising concerns about the result’s applicability to different road conditions and types of guardrails. Another limitation is that the distance of the guardrail must be within the range of the LiDAR. Otherwise, discontinuity issues in the point cloud data and acquiring a LiDAR system lead to high expense, let alone the cost of a more advanced lidar.
While existing research efforts have made progress in identifying specific guardrail properties and deficiencies, they have not provided a comprehensive, real-time solution for automating guardrail assessment Several challenges hinder the development of such systems: the high cost and limited range of LiDAR sensors, the variability in lighting conditions, and the substantial computational power required for real-time applications. This study introduces an affordable methodology that overcomes these challenges by leveraging computer vision and deep learning to fully automated guardrail assessment. It presents a real-time, optimized system designed to reliably assist DOTs in identifying and prioritizing guardrail damage in various weather and environmental conditions, which can be deployed on cutting-edge devices like phones. This system delivers a detailed report that significantly enhances road user safety and facilitates more efficient maintenance planning, aiming to directly contribute to saving lives on the road.
3. Methodology
3.1. System Description
The system integrates a camera sensor and GPS device onto a vehicle’s ladder rack. The sensors are then connected to a laptop through cable connections, as shown in
Figure 2.
The camera records visual data, and the GPS sensor logs the coordinates for each frame captured. The interaction between these sensors and the laptop is managed using the Robot Operating System (ROS). Each sensor functions within a dedicated node that systematically stores data in ROS bag files as ROS messages. These bags contain images, coordinates, and timestamps of each logged message. The data collection framework, shown in
Figure 3, demonstrates an outline of how data is received from the sensors and saved into ROS bag containers.
Several camera placements were tested, including side-mounted, roof-centered, and front-facing positions. The front-facing position was determined to be optimal as it provided an unobstructed view along the direction of travel, enabling operations across any highway lane. The camera was positioned at an angle of 12 degrees from the vehicle’s front, maximizing the capture of contextual information on guardrail conditions. The camera’s software was configured to automatically adjust settings such as exposure and brightness, thereby making it adaptive to varying lighting conditions and improving overall image quality.
3.2. Data Collection and Dataset Curation
Data collection to identify guardrail deficiencies was conducted from November 2022 to April 2024, focusing on Ohio highways that are known for high accident rates. This process involved weekly and monthly data gathering, covering various routes, as depicted in the maps shown in
Figure 4. Data were collected under various weather conditions and daylight settings across all seasons, ensuring a comprehensive dataset that covers all the scenarios that might be encountered in deployment. Each data point was recorded with timestamps and georeferenced using GPS coordinates.
3.3. Annotation
LabelMe software was used to annotate the collected data [
13]. The annotation process involved three classes: Dent, Terminal, and Post. For each recorded damage, at least five frames were annotated at various distances. These damages were annotated for a segmentation task, as well as for a second-stage classification model to identify the severity of the dent class. Deformations, like dents and tears, have been included in the dent class. Posts that are deflected and not aligned with their neighboring posts were labeled as “Post”. Damaged terminals have been annotated as “Terminal”.
Image augmentation is a widely used approach used to diversify and increase training data to reflect the conditions encountered in deployment, closely ensuring its practicality in real-world scenarios. This study employed two augmentation techniques:
Occlusion: Cut-outs in the images were created by covering objects that are too far away or objects that are not relevant for training with a white background, as demonstrated in
Figure 5. This approach helps the model to learn to recognize partially visible objects and simulate real-world conditions where guardrail views may be obstructed by passing vehicles or objects, such as trees. Furthermore, by covering objects that are not relevant for training, the model can focus on the important features and improve its accuracy [
14].
Scaling: Variations in object distances are introduced, followed by padding the scaled images with a gray background to preserve the original dimensions. This technique helps the model recognize defects at various scales.
Figure 6 is an example of this technique.
3.4. YOLO Model Training & Validation
In infrastructure assessment and autonomous vehicle applications, the selection of a model capable of processing frames quickly and accurately is crucial. YOLOv8 [
15], the latest version of the YOLO computer vision object detection algorithm, is known for its efficiency in real-time applications. It stands as the state-of-the-art computer vision framework, providing speed and accuracy in object localization and identification, excelling intasks like classification, detection, and segmentation. YOLOv8 offers a range of model architectures with varying sizes and complexities, from the lightest ‘Nano’ to the largest ‘Xlarge’.
For this study, multiple YOLOv8 models were trained using an A-100 Nvidia GPU (Nvidia, Santa Clara, CA, USA). The dataset consisted of 4500 images, later augmented, with a split of 85–15% between the training and validation datasets. The attached diagram outlines the training and validation framework, highlighting the methodical approach adopted. The models underwent extensive evaluations using both the validation dataset and real-time testing during field data collection.
Upon achieving optimal model weights on the validation dataset, the models were employed to generate preliminary annotations on newly collected data in a real-time setting. These initial annotations formed the basis for the annotation process, aiding in understanding the model’s behavior in real-world conditions and identifying areas needing improvement. During this phase, human annotators thoroughly reviewed and refined the annotations while simultaneously assessing the model’s performance. This dual approach allowed them to identify weaknesses in the model performance that required further attention and additional data, ensuring that the annotations remained both accurate and relevant to the intended application. This cycle is illustrated in
Figure 7.
3.5. Detection Processing
Although YOLO is effective in detection tasks, it is prone to making occasional false detections. To mitigate this, background images were included during training, helping the model distinguish between relevant objects and background noise. However, further refining of the model does not often yield significant improvement after reaching a certain performance plateau. To overcome the issue, a filtering process was devised to exclude false detections. This process involved the following: assigning a unique ID to the damage only if it is detected in more than two consecutive frames with a confidence score above a specified threshold. Typically, this threshold is set at 0.5 but, for terminal damage, it has been adjusted to 0.3 due to the critical nature and potential severity of that damage. This method effectively reduces false positives and increases the reliability of the detection. Additionally, the system excludes detections that might arise in unlikely damaged areas, such as the top right or left quarter regions of the image. Additionally, Non-Maximum Suppression (NMS) is set at a threshold of 0.1. NMS is an important technique for eliminating redundant overlapping bounding boxes, keeping only the box with the highest confidence for each unique object.
3.6. Tracking
Tracking involves monitoring detected objects across a sequence of frames by assigning a unique identifier to each object. The Yolov8 package provides traditional trackers that are common in computer vision, such as Botsort and Bytetrack. These trackers are computationally efficient and utilize motion analysis to predict the subsequent location of the moving object, making them suitable for scenarios where the camera is stationary and the captured objects move quickly. However, their performance degrades when the camera itself is in motion and the object is stationary, such as during guardrail inspections where the guardrail remains static as the vehicle passes, potentially causing the tracker to misinterpret the guardrail as moving within the camera’s field of view.
Deep OC–SORT [
16] is an enhanced version of SORT that overcomes these challenges by integrating deep learning and adaptive re-identification techniques. It is effective in scenarios where the background, lighting conditions, and camera angle drastically change. Moreover, it incorporates camera motion compensation, which adjusts tracking parameters to account for camera movement in guardrail inspection.
Deep OC–SORT and Botsort were tested and compared across multiple sections to evaluate their tracking performance. For instance,
Figure 8 and
Figure 9 depict two frames capturing the same guardrail damage at different distances. For
Figure 8, where the Botsort tracker was tested, different IDs were assigned to the same damage, demonstrating inconsistencies in tracking accuracy.
In contrast, in
Figure 9, the Deep OC–SORT tracker maintained consistent IDs for the same damage across all evaluated frames, highlighting its superior ability to track objects accurately over time.
3.7. Severity Assessment
For severity assessment, this research adheres to the guidelines set by the FHWA [
5] and ODOT for assessing guardrail damages:
The severity of the dent class is assessed using a second-stage classification model. After a defect is detected and assigned a unique ID by the tracker, an image crop that includes the deformation and its surroundings is fed into the classifier to assess the severity. This crop size is set to either 448 pixels or the width of the predicted mask of the damage, whichever is greater. This ensures that the entire deformed area is covered and provides more contextual information from the surroundings, including details about any potentially missing or deflected posts, which is critical in determining the severity.
The classification model is trained to categorize the severity of the dent into two classes, labeled as 0 for minor dents and 1 for severe dents, following the predefined severity criteria. The dataset consisted of 2500 unique instances, augmented by scaling and occlusion. The dataset is divided into a train-validation split with an 85–15% ratio. An example of the annotation is shown in
Figure 10.
While the Pennsylvania Department of Transportation (PennDOT) assesses damaged posts with the angle of the post governing the severity, with a larger angle indicating more significant damage [
17], this research incorporates both missing and deflected posts as features within the classification model. Additionally, the number of deflected posts is independently assessed by a detection model. Specifically, three or more deflected posts in a frame or location indicate severe post damage and fewer than three indicate minor damage. For the terminal class, any detected terminal damage is given high priority due to its criticality and the hazards it might pose. Therefore, the terminal class indicates severe damage, which is assigned as a high priority.
3.8. Framework Optimization
Deploying real-time models, like YOLO, on edge devices that have limited computation resources, like smartphones or drones, requires optimization. Optimization techniques involve converting the model to use lower precision floating points, known as quantization. Reducing the precision from 32-bit floating points to 16-bits significantly decreases memory usage and inference latency, making complex NN architecture deployable on devices that have limited hardware but come with a slight decrease in model accuracy, due to reduced numerical precision.
Pruning the model is another technique that involves removing redundant weight parameters or parameters that do not add any information. It helps reduce model size and enhance processing speed. For this study, TensorRT [
18] has been utilized to optimize the system. TensorRT is an optimization framework that supports the real-world deployment of deep learning models. This framework leverages techniques, such as quantization, pruning, tensor fusion, kernel tuning, and GPU-specific optimizations, while balancing a trade-off between speed and accuracy on edge devices.
Figure 11 shows an inference instance of different model sizes and their optimized versions for detecting dents on guardrails in real time on a highway. To the left are the standard models, and to the right are the optimized models. Each highlights the detection confidence and the processing speed in milliseconds. When optimized, the large model’s prediction time reduces from 31.39 ms to 7.06 ms, and the Nano model’s prediction time improves from 3.69 ms to 1.44 ms.
3.9. Workflow
The workflow, shown in
Figure 12, begins by inputting an image into the segmentation model for detection. If the detection’s confidence is above the confidence threshold, it proceeds to a processing phase incorporated with the tracker. During this phase, a unique ID is assigned only if the object is detected for two consecutive frames, which helps suppress any false detections and increases the confidence of the reported detection.
For the dents class, a confidence threshold of 0.5 is used. If the dent is assigned to an ID, it is passed into a classification model, which will determine its severity, considering contextual information, like missing or deflected posts. For posts and terminals, the confidence is lowered to 0.3. The figure below illustrates the outline of the workflow of the dents class. Other classes follow the same workflow but with no classification model.
3.10. ROS Deployment
The detection, tracking, classification, and processing workflow is incorporated into ROS nodes to be deployed in real-time, as shown in
Figure 13. The ROS Framework involves:
GPS and Camera Nodes: The GPS Node publishes longitude, latitude, altitude, and speed messages, and the Camera Node publishes raw image data.
The Detection Node subscribes to GPS and Camera nodes to receive the coordinates and image data. This node performs detection on the images and then sends bounding boxes to a processing node.
Processing Node: performs processing and filtering techniques for each class mentioned in the workflow.
Tracker Node: Processed predictions are passed into the Tracker Node, which assigns an ID according to each class setting.
Recording Node: All processed data, GPS locations, timestamps of each deficiency, and images of the damage are recorded and stored in a ROS bag for post-processing analysis.
3.11. Post-Processing
The recorded ROS bags contain all the important information for field operations, containing various messages under predefined topics. After the fieldwork has been conducted, the messages in these bags are extracted, which include the following:
Frames: Every image frame that contained detected damage
Locations: GPS coordinates corresponding to the location of each recorded frame.
Detection: Messages that contained bounding boxes, classes, and tracked IDs also signified severity.
When published, each message has a timestamp. All messages are assigned the same timestamp as the timestamp of the image frame published from the camera node, except for GPS messages. GPS messages have independent timestamps due to their different data acquisition rates. To accurately correlate the location data with the corresponding image frames, it is necessary to interpolate the positions based on the timestamps. The process involves matching each image frame’s timestamp with the nearest GPS timestamp, allowing for precise alignment of location data with visual data, ensuring that each frame can be accurately placed in its geographical context.
In post-processing, damages are grouped based on timestamps and tracked IDs to ensure consistent tracking of the same object when driving on rough roads and to overcome any re-id issues that might arise. Grouping helps simplify analysis and maintain the count of the instances of damage on a single guardrail.
The grouping rules are as follows:
Temporal Grouping: Detections are grouped by the first and last occurrence of the unique tracked ID.
Non-Intersection Grouping: If the timestamps of two damage IDs overlap and never occur in at least one frame, then these two objects will be assigned the same group ID.
Intersection Grouping: If the timestamps of two damage IDs overlap and intersect in at least one image frame, each object is assigned to a different group ID.
An example of the grouping methodology is depicted in
Table 1 and
Figure 14. IDs 294 and 298 overlap but intersect at least once in one frame, and therefore each object will have its separate group ID. IDs 306 and 307 overlap but never intersect in any frame, and therefore they will share the same group ID.
4. Results
This section details the evaluation process for the results, incorporating both numerical metrics and manual testing. Numerical metrics provide valuable insights for detection, classification, and tracking tasks. However, manual testing is crucial for a comprehensive evaluation of overall system performance in reporting damages. This method offers real-world perspectives that numerical analyses lack, which is especially important for deployment. Manually assessing the overall approach effectively identifies and helps address any behavioral weaknesses across different road scenarios.
4.1. Performance of the Object Detection Model
The Yolov8 segmentation model showed convergence after 160 epochs of training. Conventional object detection metrics were used to evaluate the YOLO large model.
Evaluation metrics:
True Positive (TP): The model correctly predicts an object that matches a ground truth label.
False Positive (FP): The model incorrectly predicts an object where there is no ground truth label.
True Negative (TN): The model correctly identifies no object where there is no ground truth label.
False Negative (FN): The model fails to predict an object where there is a ground truth label.
From these outcomes, performance metrics are calculated as follows:
Average Precision (AP): Calculates the average precision at various recall levels, summarizing the precision–recall curve to reflect class-specific accuracy
Mean Average Precision (mAP) is the average AP across all classes. This is the most widely used metric in object detection tasks as it provides the most comprehensive evaluation. Commonly used with a 50% Intersection over the Union (IoU) threshold, mAP assesses how accurately the model predicts bounding boxes that overlap at least 50% with ground truth boxes.
The validation dataset consisted of 250 images with a total of 314 instances, including 174 dents, 120 posts, and 15 terminals.
Analysis of the Precision–Recall Curve shown in
Figure 15:
Terminal Class Detection: Precision and Recall are high, indicating that all terminal detections are accurate.
Dent Class Detection: Precision is high, and recall gradually declines but stays relatively high, indicating that, while most dents are detected, some are missed as the threshold increases.
Post Class Detection: Although precision at 0.675 is relatively lower than that of other classes, it shows that a portion of post-detections are false positives and false negatives. The sharp decline in precision as recall increases suggests that the model lowers its threshold to detect more posts, leading to more incorrect predictions.
mAP@0.5 for all classes 0.873
Analysis Confusion Matrix is shown in
Figure 16:
Dent Class: The model successfully identifies damage, with a slight 7% false negative, which suggests that a small portion of the dents have been missed.
Terminals: The model effectively detected terminals with no false negatives or false positives recorded
Posts: Detection of posts presented a challenge, with a significant 39% not detected
Background: There were 25 instances of false positive detections. Of these,12 detections were reported as false positives belonging to dents; four of these instances were actual dents and had not been annotated at a far distance, and the model successfully detected them, thus they were deemed as false detections. The remaining 13 false detections were classified as posts.
Conclusion from the precision–recall curve and confusion matrix:
The model is effective in detecting dents and terminals with high accuracy. The issue with dent class detection is minor and mostly related to false detections. More cases need to be tested for the terminals class.
Post detection is challenging due to sudden angle changes on rough roads that might seem to make some posts slanted, therefore generating false positives.
The sharp drops in precision for the post-class suggest that this class requires reevaluation of how posts are defined in the training set.
The detection model results indicate that, as detailed in the methodology, further filtering and processing techniques should be used to refine the results for the dents and posts, further suppressing false detections.
When it comes to infrastructure inspection, especially in applications like guardrail assessments, false negatives are a primary concern, especially for dents and terminals. This is mainly due to the significant risks caused by undetected damage, as overlooking this damage can have dangerous consequences for road users. The performance, however, indicates a minimal number of false negatives, which is suitable for practical use.
When selecting a model architecture for deployment, the key is to balance computational resources, performance metrics, and prediction time. Larger models typically provide higher accuracy because they can detect finer details, which is particularly important for complex parts of guardrails, like posts. However, the trade-off often involves greater computational demands and slower processing times. Various model architectures of varying sizes were evaluated to determine the most effective configuration for real-world applications. The results are illustrated in
Figure 17.
Although larger models demonstrate superior detail recognition capabilities, the Nano model was selected for the framework due to its optimal balance of performance and efficiency. It processes images swiftly while maintaining adequate accuracy for detecting key features such as dents and terminals on guardrails. This choice ensures efficient real-time processing without significant sacrifices in detection accuracy, making it a practical solution for ongoing guardrail inspection tasks. Examples of detection are shown in
Figure 18.
4.2. Performance of the Classification Model
The classification model was evaluated using a balanced dataset of 250 instances for each of the classes: “severe” and “not severe” examples of model prediction are shown in
Figure 19.
Matrix results in
Figure 20 show that the model successfully classified 90% of the non-severe cases correctly. There is a minimal misclassification where 10% of non-severe cases were incorrectly predicted as severe. For the severe class, the model successfully classified 95% of the severe cases correctly. There is a minimal misclassification where 5% of non-severe cases were incorrectly predicted as severe. The output of the classification model for the most recent five frames, which represents the nearest frames to the occurrence of the damage, will determine and assess the severity of the dent. If the average severity score from these frames exceeds 0.5, the damage is classified as severe.
4.3. Performance of the Tracker
Collecting roadway data from a moving vehicle introduces numerous challenges, including image vibrations from high-speed maneuvers on curves and intense shaking due to rough road conditions. These factors can cause significant motion blur and perspective changes, complicating the tracking process. To rigorously assess tracker performance under these dynamic conditions, a dataset comprising 1110 images was utilized. This dataset, annotated with the ground truth using the CVAT tool, tested the capabilities of three different trackers: Deep OC–SORT, ByteTrack, and Bot-SORT.
The evaluation utilized metrics such as IDF1, ID Precision (IDP), ID Recall (IDR), Recall, Precision, MOTA, and MOTP. These comprehensive metrics provided a robust framework for comparing the performance of the trackers, as detailed in
Table 2. Despite the challenges posed by the dynamic tracking environment, Deep OC–SORT emerged as the most effective tracker. It consistently outperformed ByteTrack and Bot-SORT, primarily due to its robust re-identification capabilities and advanced design, which are well-suited for rapidly changing scenarios. Deep OC–SORT demonstrated superior performance in maintaining accurate object tracks and adapting to rapid scene changes.
4.4. Performance of the Entire Framework
Testing was conducted to evaluate the framework, including the model and the filtering process, to assess its overall reliability in reporting damage. Five field operations were conducted, during which the system captured data for a total of 19,013 frames. Simultaneously, damage observations were manually noted while driving, providing a basis for comparing observed damage with the framework’s output. The fieldwork was planned to encompass diverse environmental conditions and guardrail scenarios, ensuring the system’s evaluation under varied real-world circumstances.
Out of these frames,1271 frame predictions were made, which signifies the robustness of the real-time processing model in identifying the damage with minimal false detections. These identified damages contained 155 dents,20 terminals, and 113 posts. Visually verified damages: 150 dents, 19 terminals, and 120 posts.
The results, after post-processing and using the lightest optimized model (Nano), are as shown in
Table 3.
The entire framework of detection, classification, filtering, and tracking averages 20–40 ms for each frame, making it suitable for real-time applications. Framework achieved an accuracy of 95% for the dents class and 90% for the terminals class, while the posts class achieved 83%, suggesting room for improvement.
4.5. Map Visualization
Once processing is completed, the results are visualized on a map, with each pinpoint representing a specific damage instance. Each damage instance is depicted by a representative frame that showcases the damage. Therefore, the damage has multiple frames. Selecting the frame that has the most accurate representation is important. The middle example is chosen as it provides the most information about the damage. Each item of damage has an image frame saved with the name, as follows:
After the images are saved, GPS locations are matched with frames and projected into a map with the location of each deficiency. For the dents and posts, a clustering algorithm has been used to identify dents and posts present in one rail and prioritize the rails with more dents and posts. Maps are generated for each class separately, with one map containing all classes, as shown in
Figure 21.
Pinpoints in
Figure 21 indicate the following:
Red pinpoints indicate severe dents.
Green pinpoints indicate terminal damage.
Blue pinpoints represent mild dents.
Silver pinpoints denote damaged posts class.
Pinpoints are clustered, indicating the number of dents and posts class damage that are within 25 feet.
5. Conclusions and Summary
This study introduced a practical real-time system for automating the identification and evaluation of guardrail deficiencies using advanced computer vision models and deep learning methods. The framework integrates YOLOv8 for object detection, a second-stage classification model to assess damage severity, and advanced tracking algorithms, such as Deep OC SORT, to maintain consistent object IDs while reducing false detections. By applying quantization and pruning, the system achieves faster inference, assigning a unique ID to a guardrail defect only when it appears in multiple consecutive frames.
Field testing processed 19,013 captured frames, resulting in 1271 reliable detections. The system achieved 95% accuracy for dents, 90% for terminals, and 83% for posts. Each detection is automatically linked to precise GPS coordinates through the Robot Operating System (ROS), producing a map-based output that clusters damage locations according to severity. This setup helps transportation agencies rapidly identify and prioritize critical repairs. The classification module refines detection results by categorizing dents as either minor or severe, taking into account contextual indicators of damage, such as deflected posts or tears in the rail.
Because the models were trained on data gathered during various weather and lighting conditions, the approach remains robust against the visual challenges that arise in real-world inspections. Its average processing speed of 20 to 40 ms per frame enables real-time operation on common devices, such as smartphones. This capability significantly reduces the labor requirements of manual inspections and allows large-scale deployment across extensive road networks, leading to faster identification and resolution of urgent repairs.
Beyond its immediate benefits for highway safety, this approach sets a new benchmark for infrastructure management practices by demonstrating how computer vision and deep learning can be integrated into inspection workflows. The classification module refines detection outputs by distinguishing between minor and severe dents, leveraging contextual signs of damage, such as deflected posts or tears in the rail. This targeted breakdown ensures that the most serious defects are flagged and resolved first, potentially saving lives by reducing the likelihood of catastrophic roadside incidents.
Looking forward, further refinements will focus on improving the detection of tilted or missing posts, which remain challenging under extreme road conditions. Future research will also explore new methodologies to expand this system’s application to other barrier types, such as cable and concrete barriers. Additional innovations include calculating the depth of deformations in real time using stereo cameras and experimenting with different setups to improve the detection and assessment of guardrail posts. These advancements promise to refine the system’s capabilities further, ensuring its adaptability and effectiveness in a broader range of infrastructure safety scenarios.
Author Contributions
Conceptualization, M.D.N., D.M. and A.A.O.; methodology, A.A.O., D.M., M.K., M.M. and M.D.N.; software, A.A.O., D.M., M.K., M.M. and M.D.N.; validation, A.A.O.; formal analysis, A.A.O.; investigation, A.A.O., M.K. and M.M.; resources, M.D.N.; data curation, A.A.O., D.M. and M.N; writing—original draft preparation, A.A.O. and M.K.; writing—review and editing, M.D.N.; super-vision, M.D.N.; project administration, M.D.N. All authors have read and agreed to the published version of the manuscript.
Funding
This research received no external funding.
Data Availability Statement
The data presented in this study are available on request from the corresponding author. Due to privacy concerns, they are not publicly available.
Conflicts of Interest
All authors declare that the research was conducted in the absence of any commercial or financial relationships that could be construed as potential conflicts of interest.
References
- NHTSA; Fatality Analysis Reporting System; National Highway Traffic Safety Administration; IIHS. Collisions with Fixed Objects and Animals; Insurance Institute for Highway Safety: Arlington, VA, USA, 2021.
- Federal Highway Administration. Barrier Guide for Low Volume and Low-Speed Roads; Publication No. FHWA-CFL/TD-05-009; Federal Highway Administration: Washington, DC, USA, 2005.
- Ohio Department of Transportation. Guardrails. Available online: https://www.transportation.ohio.gov/about-us/basics/guardrail (accessed on 10 April 2024).
- Armco Direct. The Physics Behind Crash Barriers. Available online: https://www.armcodirect.co.uk/news/the-physics-behind-crash-barriers/ (accessed on 10 April 2024).
- FHWA. W-BEAM GUARDRAIL REPAIR: A Guide for Highway and Street Maintenance Personnel. 2008. Available online: https://safety.fhwa.dot.gov/local_rural/training/fhwasa08002/ (accessed on 10 April 2024).
- Caltrans. Roadway Departure Technical Brief No.1: Maintenance of Traffic Barrier Systems; Caltrans: Sacramento, CA, USA, 2016.
- American Association of State Highway and Transportation Officials. Chapter 8: Anchorages, Terminals, and Crash Cushions. In Roadside Design Guide, 4th ed.; American Association of State Highway and Transportation Officials: Washington, DC, USA, 2011. [Google Scholar]
- American Traffic Safety Services Association. W-Beam Guardrail Identification & Repair Guidelines; American Traffic Safety Services Association: Fredericksburg, VA, USA, 2022. [Google Scholar]
- Kasuga, K.; Harakawa, R.; Iwahashi, M. Classification of in-vehicle camera images for guardrail inspection support. In Proceedings of the 2020 IEEE 2nd Global Conference on Life Sciences and Technologies (LifeTech), Kyoto, Japan, 10–12 March 2020; pp. 113–114. [Google Scholar]
- Mukherjee, R.; Iqbal, H.; Marzban, S.; Badar, A.; Brouns, T.; Gowda, S.; Arani, E.; Zonooz, B. AI-Driven Road Maintenance Inspection. In Proceedings of the 27th ITS World Congress, Hamburg, Germany, 11–15 October 2021. [Google Scholar]
- Jin, X.; Gao, M.; Li, D.; Zhao, T. Damage detection of road domain waveform guardrail structure based on machine learning multi-module fusion. PLoS ONE 2024, 19, e0299116. [Google Scholar] [CrossRef] [PubMed]
- Ai, C.; Hou, Q.; University of Massachusetts Amherst Umass; Massachusetts Department of Transportation MassDOT; Boudreau, N. Automated Guardrail Inventory and Condition Evaluation; Report No. 22-031; Department of Transportation, Office of Transportation Planning: Watertown, MA, USA, 2022.
- Wada, K. Labelme: Image Polygonal Annotation with Python. Available online: https://github.com/wkentaro/labelme (accessed on 31 January 2025).
- Yun, S.; Han, D.; Oh, S.J.; Chun, S.; Choe, J.; Yoo, Y. CutMix: Regularization Strategy to Train Strong Classifiers with Localizable Features. arXiv 2019, arXiv:1905.04899. [Google Scholar]
- Jocher, G.; Chaurasia, A.; Qiu, J. Ultralytics YOLO (Version 8.0.0). 2023. Available online: https://github.com/ultralytics/ultralytics (accessed on 31 January 2025).
- Maggiolino, G.; Ahmad, A.; Cao, J.; Kitani, K. Deep OC-SORT: Multi-Pedestrian Tracking by Adaptive Re-Identification. arXiv 2023, arXiv:2302.11813. [Google Scholar]
- Pennsylvania Department of Transportation. Shoulder and Guide Rail Condition Survey Field Manual; Pennsylvania Department of Transportation: Harrisburg, PA, USA, 2023.
- NVIDIA. TensorRT SDK. Available online: https://developer.nvidia.com/tensorrt (accessed on 10 April 2024).
Figure 1.
(a) Severe dent damage with three damaged posts; (b) terminal damage.
Figure 1.
(a) Severe dent damage with three damaged posts; (b) terminal damage.
Figure 2.
(a) GPS sensor; (b) camera sensor.
Figure 2.
(a) GPS sensor; (b) camera sensor.
Figure 3.
Data collection workflow.
Figure 3.
Data collection workflow.
Figure 4.
(a) Weekly data collection routes; (b) monthly data collection routes.
Figure 4.
(a) Weekly data collection routes; (b) monthly data collection routes.
Figure 5.
Manual white background cut-out.
Figure 5.
Manual white background cut-out.
Figure 6.
Scaling with gray background padding.
Figure 6.
Scaling with gray background padding.
Figure 7.
Training–Evaluation cycle.
Figure 7.
Training–Evaluation cycle.
Figure 8.
Botsort tracker assigned different IDs to the same damage in two frames.
Figure 8.
Botsort tracker assigned different IDs to the same damage in two frames.
Figure 9.
Deep OC–SORT tracker assigned the same ID to the same damage in two frames.
Figure 9.
Deep OC–SORT tracker assigned the same ID to the same damage in two frames.
Figure 10.
(a) Minor dent damage, (b) severe dent damage with missing and deflected posts.
Figure 10.
(a) Minor dent damage, (b) severe dent damage with missing and deflected posts.
Figure 11.
Model comparison between (a) Standard Large, (b) Optimized Large, (c) Standard Nano, (d) Optimized Nano.
Figure 11.
Model comparison between (a) Standard Large, (b) Optimized Large, (c) Standard Nano, (d) Optimized Nano.
Figure 12.
(a) Input image, (b) detection, (c) tracking, (d) classification, (e) final output.
Figure 12.
(a) Input image, (b) detection, (c) tracking, (d) classification, (e) final output.
Figure 13.
Real-time framework outline.
Figure 13.
Real-time framework outline.
Figure 14.
Grouped IDs vs. image time.
Figure 14.
Grouped IDs vs. image time.
Figure 15.
Precision–Recall curve.
Figure 15.
Precision–Recall curve.
Figure 16.
Confusion matrix for detection model.
Figure 16.
Confusion matrix for detection model.
Figure 17.
Comparison of YOLOv8 models: Speed VS mAP@0.5.
Figure 17.
Comparison of YOLOv8 models: Speed VS mAP@0.5.
Figure 18.
Detection model prediction examples for: (a) dent and post damages; (b) terminal damage.
Figure 18.
Detection model prediction examples for: (a) dent and post damages; (b) terminal damage.
Figure 19.
Classification model prediction instances.
Figure 19.
Classification model prediction instances.
Figure 20.
Confusion matrix for the classification model.
Figure 20.
Confusion matrix for the classification model.
Figure 21.
Full report map.
Figure 21.
Full report map.
Table 1.
Grouped Damages.
Table 1.
Grouped Damages.
| Tacked_id | First Detection Timestamp | Last Detection Timestamp | N |
|---|
| 294 | 1706547810625284608 | 1706547812433562880 | 17 |
| 298 | 1706547811124587008 | 1706547811330543360 | 3 |
| 300 | 1706547813222084096 | 1706547815426034432 | 23 |
| 302 | 1706547822421406208 | 1706547823428697088 | 11 |
| 306 | 1706547825823104768 | 1706547828423374080 | 3 |
| 307 | 1706547827723172608 | 1706547828222339584 | 6 |
Table 2.
Tracker evaluation metrics.
Table 2.
Tracker evaluation metrics.
| Metric | IDF1 | ID Precision (IDP) | ID Recall (IDR) | Recall | Precision | MOTA | MOTP |
|---|
| DeepOC–SORT | 0.954 | 0.959 | 0.950 | 0.988 | 0.999 | 0.976 | 0.004 |
| ByteTrack | 0.777 | 0.852 | 0.715 | 0.817 | 0.974 | 0.750 | 0.003 |
| BoT-SORT | 0.773 | 0.832 | 0.721 | 0.847 | 0.977 | 0.786 | 0.003 |
Table 3.
Manual evaluation results.
Table 3.
Manual evaluation results.
| Class | True Detections | Missed
Detections (Overlooked Damages) | Falsely
Detected as Damage | Total Damages (True Detection + Missed) | Total
Damage
Predictions | Accuracy (True Detections/Total Predictions) | Class |
|---|
| Dents | 148 | 2 | 5 | 150 | 155 | 95.48% | Dents |
| Terminals | 18 | 1 | 1 | 19 | 20 | 90% | Terminals |
| Posts | 113 | 7 | 16 | 120 | 129 | 83.09% | Posts |
| Disclaimer/Publisher’s Note: The statements, opinions and data contained in all publications are solely those of the individual author(s) and contributor(s) and not of MDPI and/or the editor(s). MDPI and/or the editor(s) disclaim responsibility for any injury to people or property resulting from any ideas, methods, instructions or products referred to in the content. |
© 2025 by the authors. Licensee MDPI, Basel, Switzerland. This article is an open access article distributed under the terms and conditions of the Creative Commons Attribution (CC BY) license (https://creativecommons.org/licenses/by/4.0/).


 ,
, 


