1. Introduction
Spatial perception is the direct, real, and integrated perceptual experience of a human in an environment [
1]. Urban perception refers to the preference of urban dwellers for specific urban environments and their cognitive judgements of urban scenes [
2,
3]. Urban spatial perception research makes it possible to assess the relationships between objective environments and human perceptions [
4,
5]. However, human perception is subject to their culture, individual experiences, and perceived interpretations, thus posing a challenge to obtaining a comprehensive understanding of spatial perception [
3,
6].
Among the various perceptual dimensions, visual perception is the first and most direct way in which a person experiences the environment [
7,
8]. Research shows that nearly 80% of the information received by a person every day originates from visual perception [
9]. In recent years, visual perception studies have been conducted on several aspects of street design [
10], architectural design [
11], landscape [
12] and public space [
13]. Focusing on visual perception, these studies have assessed and analysed spatial perceptual preferences, environmental quality and health impacts, landscape visual preferences, and spatial attractiveness and resilience, providing valuable insights into subjective human experiences [
14,
15,
16]. Along with the development of technologies such as computer vision, researchers have opportunities to scale up their studies and quantify urban visual perception to study human-scale urban perception [
17,
18].
As a kind of emerging crowdsourced data, street view images contain the physical landscape and appearance of the city and can directly reflect the realistic urban environment [
19,
20]. The street interface, as the medium through which streets and buildings interact, is a major component of the urban street view [
21,
22]. In particular, building façades, as the main qualifying element of street space, are important factors that affect human visual perception [
23,
24]. With the advantages of high resolutions, wide coverage, large data volumes, and low collection costs, street view images have gradually become one of the main types of data used for urban research [
25,
26]. Therefore, human visual perception data extracted from street views can provide an opportunity for perceptual quantitative studies of building façades and support urban-related analyses [
27,
28,
29].
There have been many studies applying computer vision to image analysis [
30], using methods such as setting human visual distances, visual element metrics, and perceptual dimension scores to extract human perceptions from street view image data for spatial perception research [
31,
32]. However, it has been recognised that current research on visual perception lacks a focus on visual features and therefore fails to fully encompass a comprehensive and nuanced human view of the street environment [
33,
34]. In addition, despite buildings being vital components of the urban landscape, research on the subjective visual perception of building façades is relatively limited [
35]. Moreover, many studies have failed to capture individuals’ subjective perceptions of key visual elements in urban design [
36]. Therefore, reflecting on the process of quantifying and evaluating subjective perceptions is necessary.
In summary, the latest advancements in machine learning, combined with the accessibility of vast street view datasets, offer an unprecedented chance to deepen our comprehension of urban visual perception. This study attempts to quantify visual perceptions and urban building façades, determining the differences between human vision and computer vision. Taking Nanshan District, Shenzhen, as a case study area, this research is based on street view image data. The building façade images are segmented via the pyramid scene parsing network (PSPNet) model, and the building façade images contained in the region of visual concern are extracted via the visual saliency prediction with generative adversarial networks (SalGAN) model to obtain two sets of building façade image data. The computer vision that is used to extract the building façade images represents machine vision, while the SalGAN model simulates human visual perception. Utilising fractal dimensions, the geometric complexities of the two sets are measured and compared separately to explore the different mechanisms employed by computer visual perception and human visual perception to process information. This study can help urban researchers and model developers and provide a reference for conducting quantitative research on urban perception.
2. Data and Methods
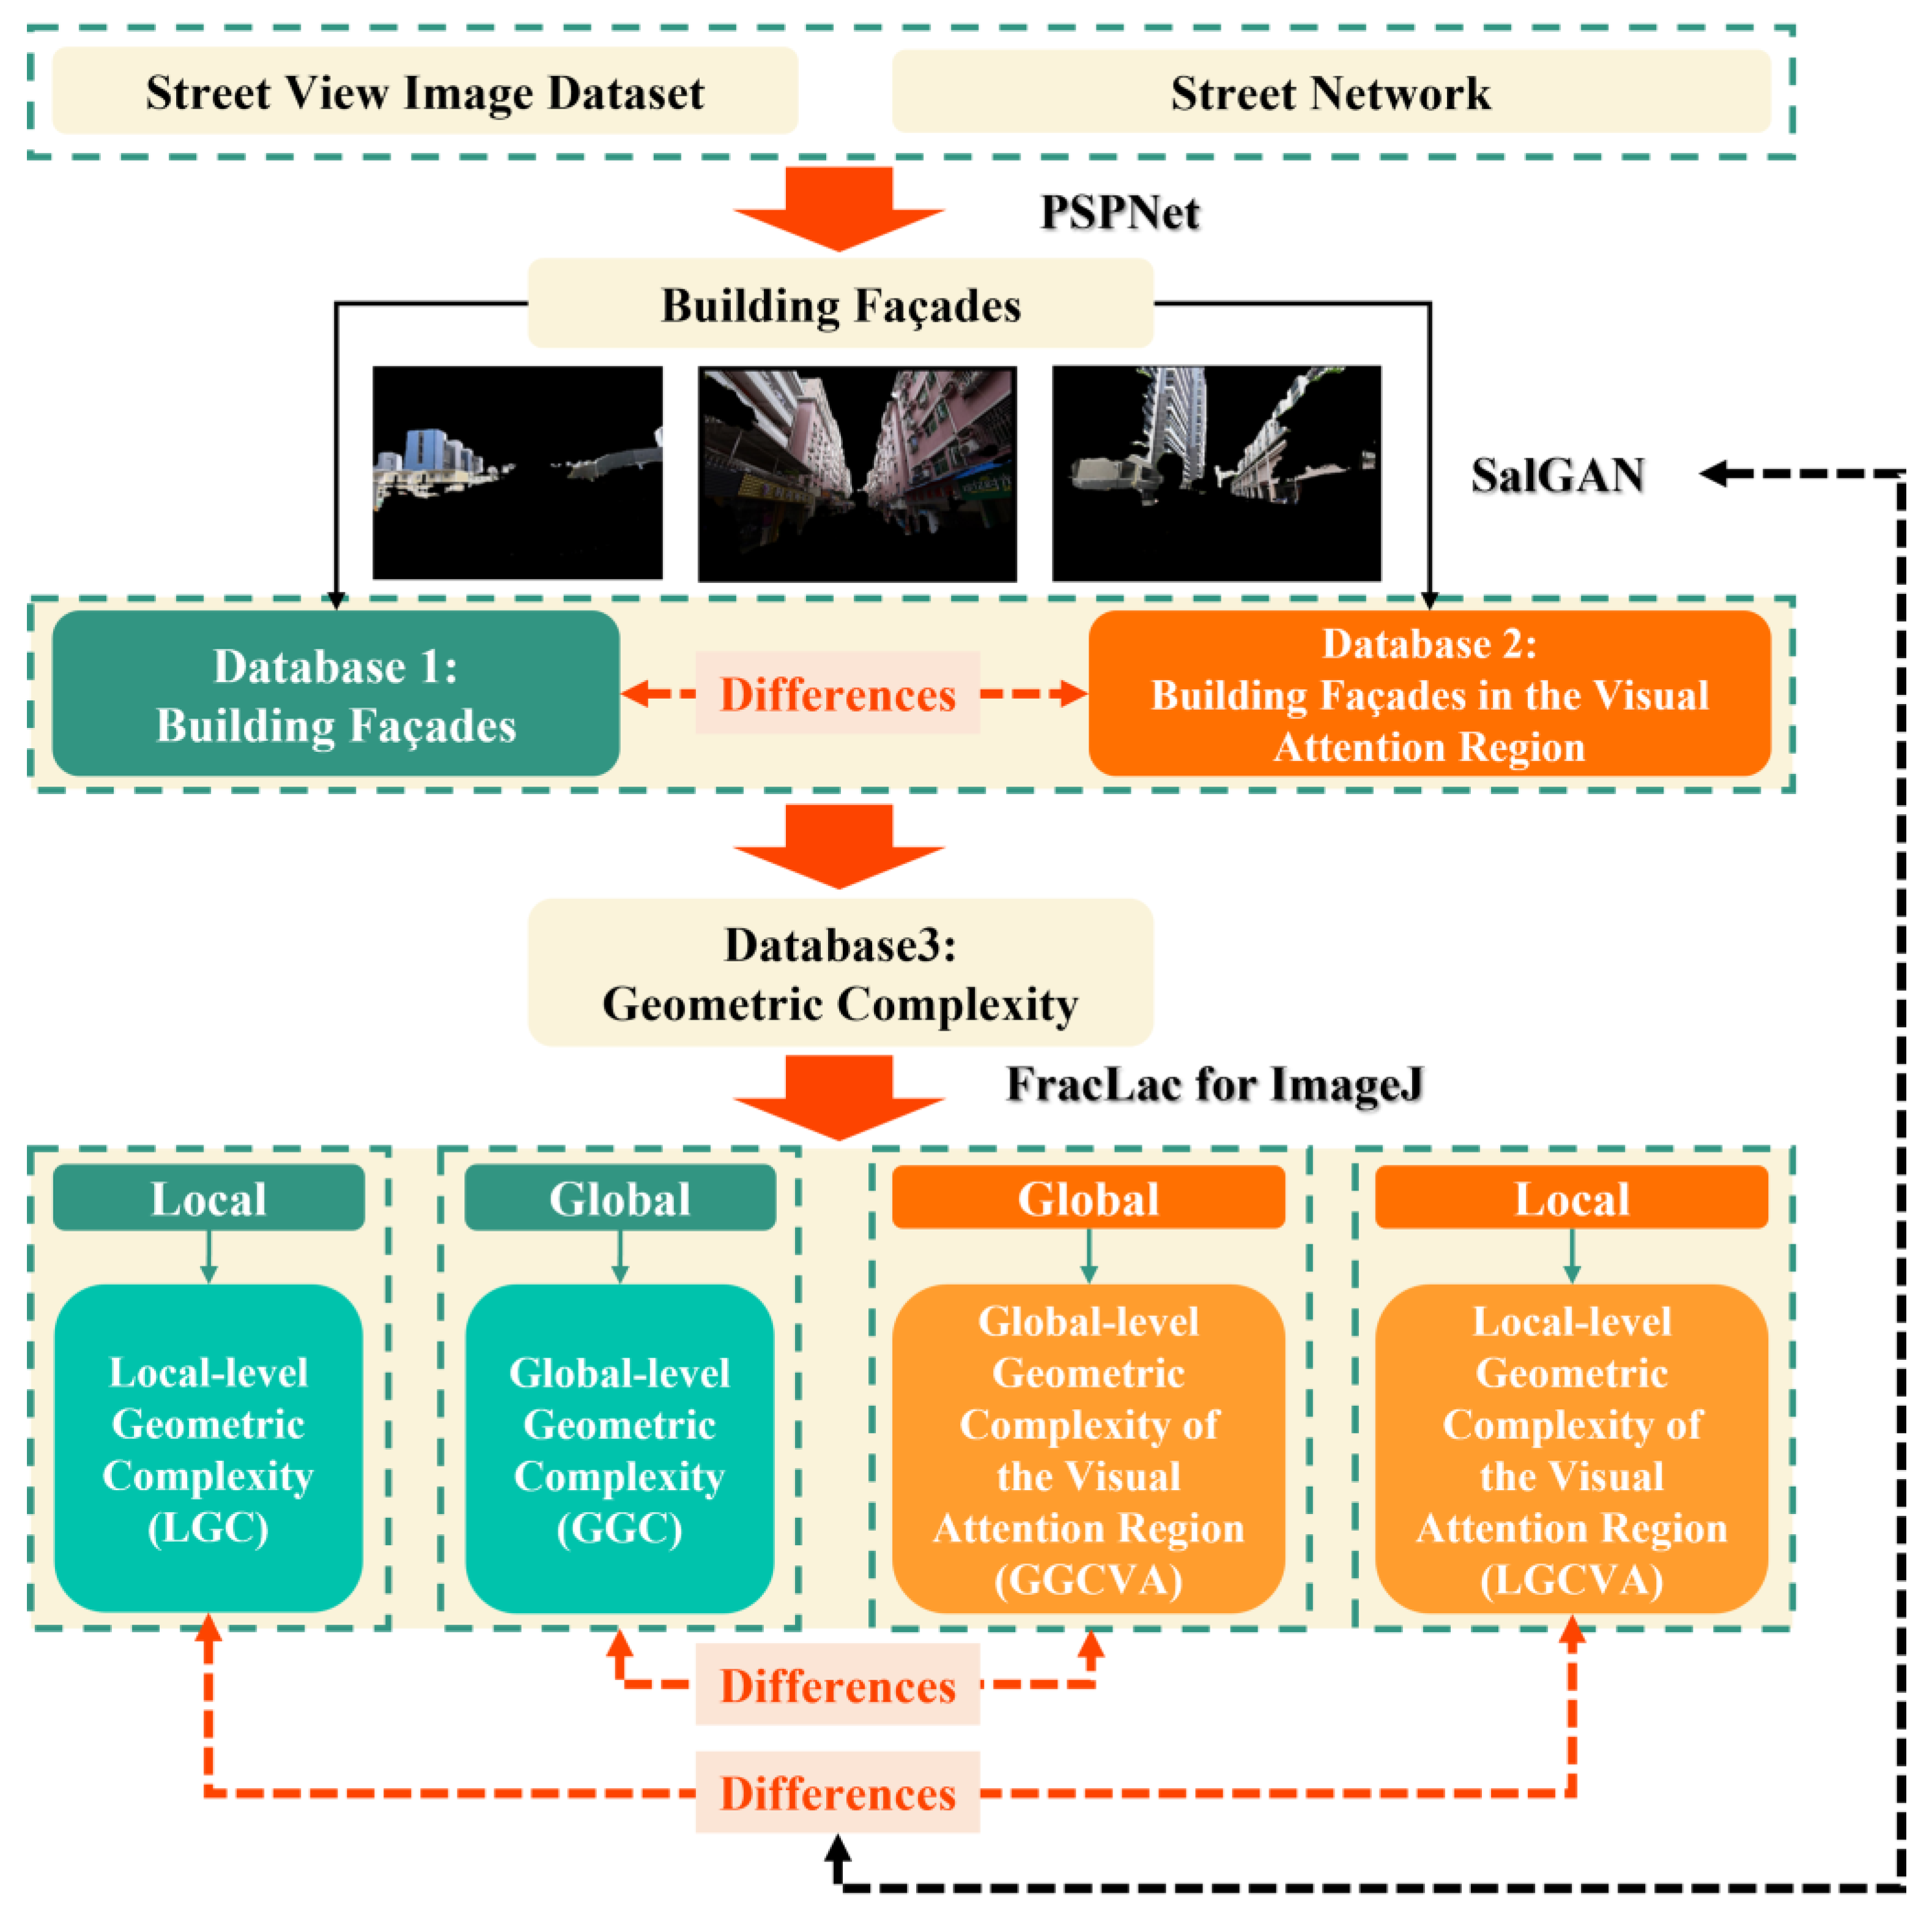
The main steps of the research methodology employed in this study are illustrated in
Figure 1. The framework can be divided into six stages: (1) Street view images are collected through the street network data. (2) The street view images are segmented via PSPNet, which is a type of semantic segmentation model, to obtain the building façades. (3) A visual saliency detection model SalGAN is used to generate saliency images for conducting visual saliency detection on building façade images. (4) First, FracLac (version 2015Sep090313a9330) for ImageJ (version 1.53e) is used to calculate the local-level fractal dimension (d
i) and global-level fractal dimension (D) of the building façade, which is the building façade in the visual attention region. Second, fractal dimensions are used to characterise the geometric complexity level. The geometric complexity indicates the complexity of its corresponding building façade; local-level means calculating the building façade within 10 local grids individually; global-level means calculating the whole building façade directly. Finally, we obtain the local-level geometric complexity (LGC), the global-level geometric complexity (GGC), the global-level geometric complexity of the visual attention region (GGCVA), and the local-level geometric complexity of the visual attention region (LGCVA). (5) Differences between computer vision and human vision are analysed by comparing GGC and GGCVA. (6) The impact of visual preferences on human perceptions is evaluated by comparing LGC and LGCVA.
2.1. Study Area
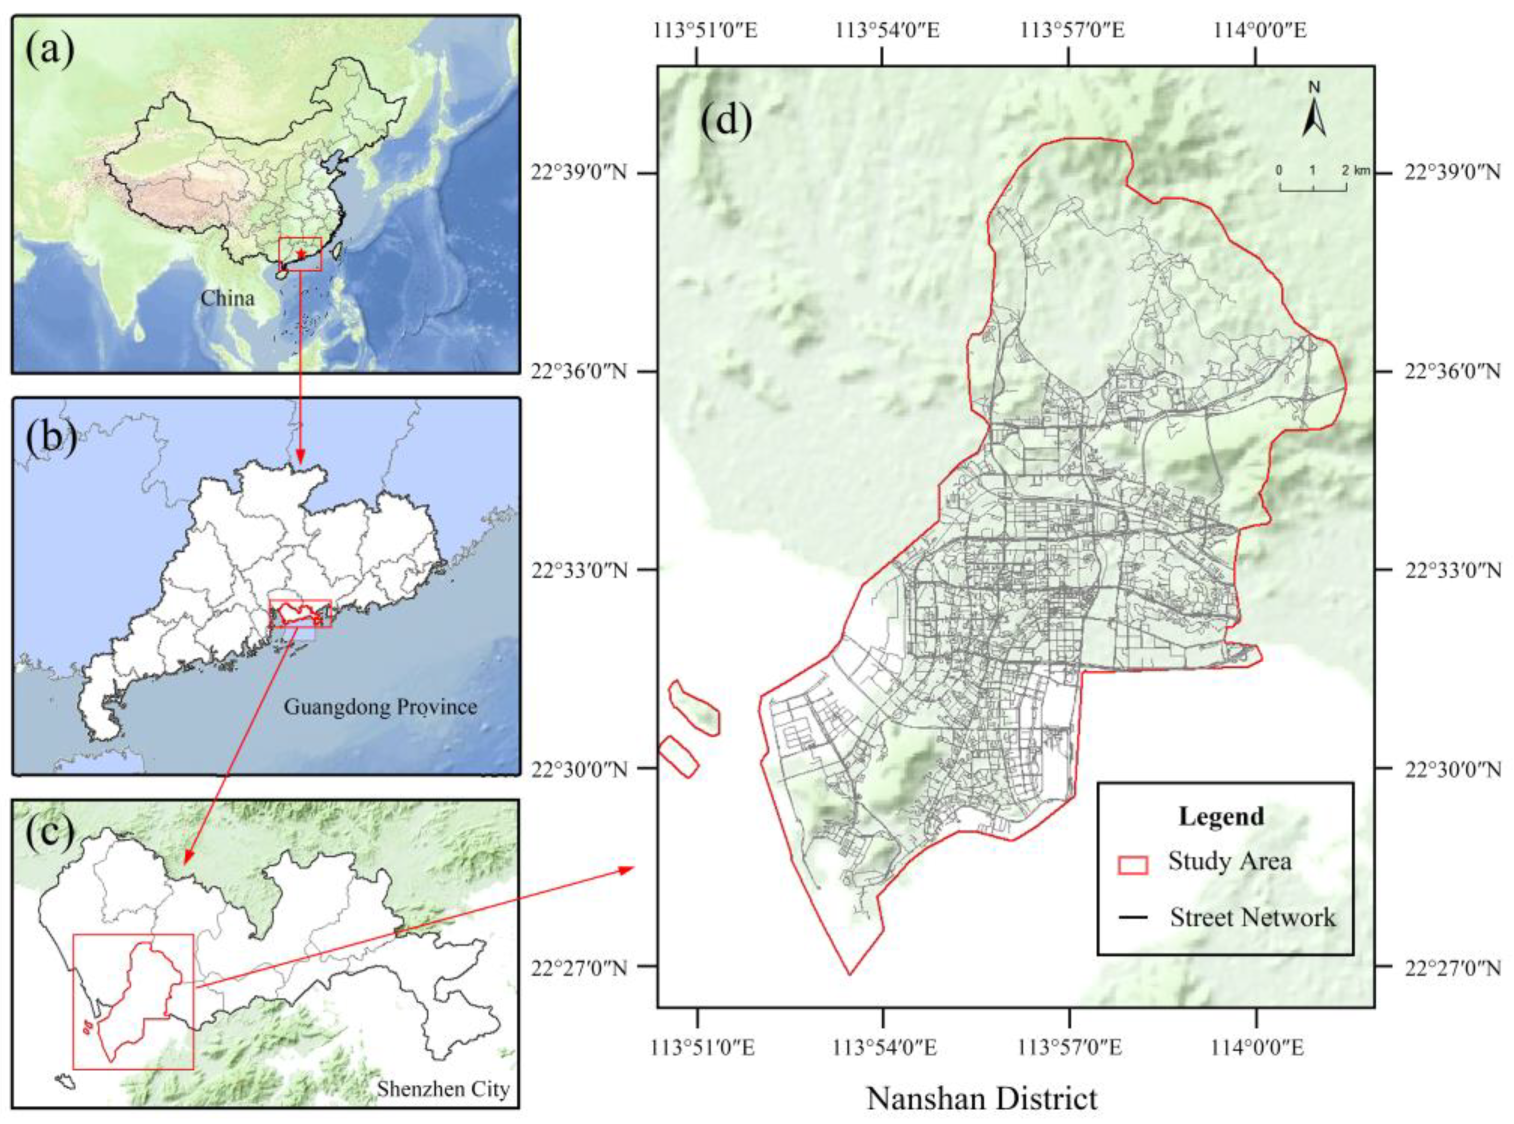
Shenzhen, a prominent megacity in China, is selected as the focus of this study. Among all districts of Shenzhen, Nanshan District, as an important part of Shenzhen, has an essential status and influence (
Figure 2). As of 2020, the building density of Nanshan District reached 23.6%, and the resident population of Nanshan District accounted for 10.23% of the global resident population of Shenzhen, which ranked fourth among the 11 districts of Shenzhen [
37]. Considering the building density and population size of Nanshan District, this area clearly boasts abundant architectural resources and vibrant socioeconomic activities.
2.2. Data
Street view images have rich visual features, contain a large amount of spatial information about the street environment and buildings, and can truly reflect people’s perceptions of the environment [
20]. Therefore, street view images are becoming increasingly common in contemporary urban research and geospatial analyses [
38,
39]. Street view platforms, such as Google and Baidu, frequently offer application programming interfaces (APIs) that allow mass users to download street view data and provide street view browsing services.
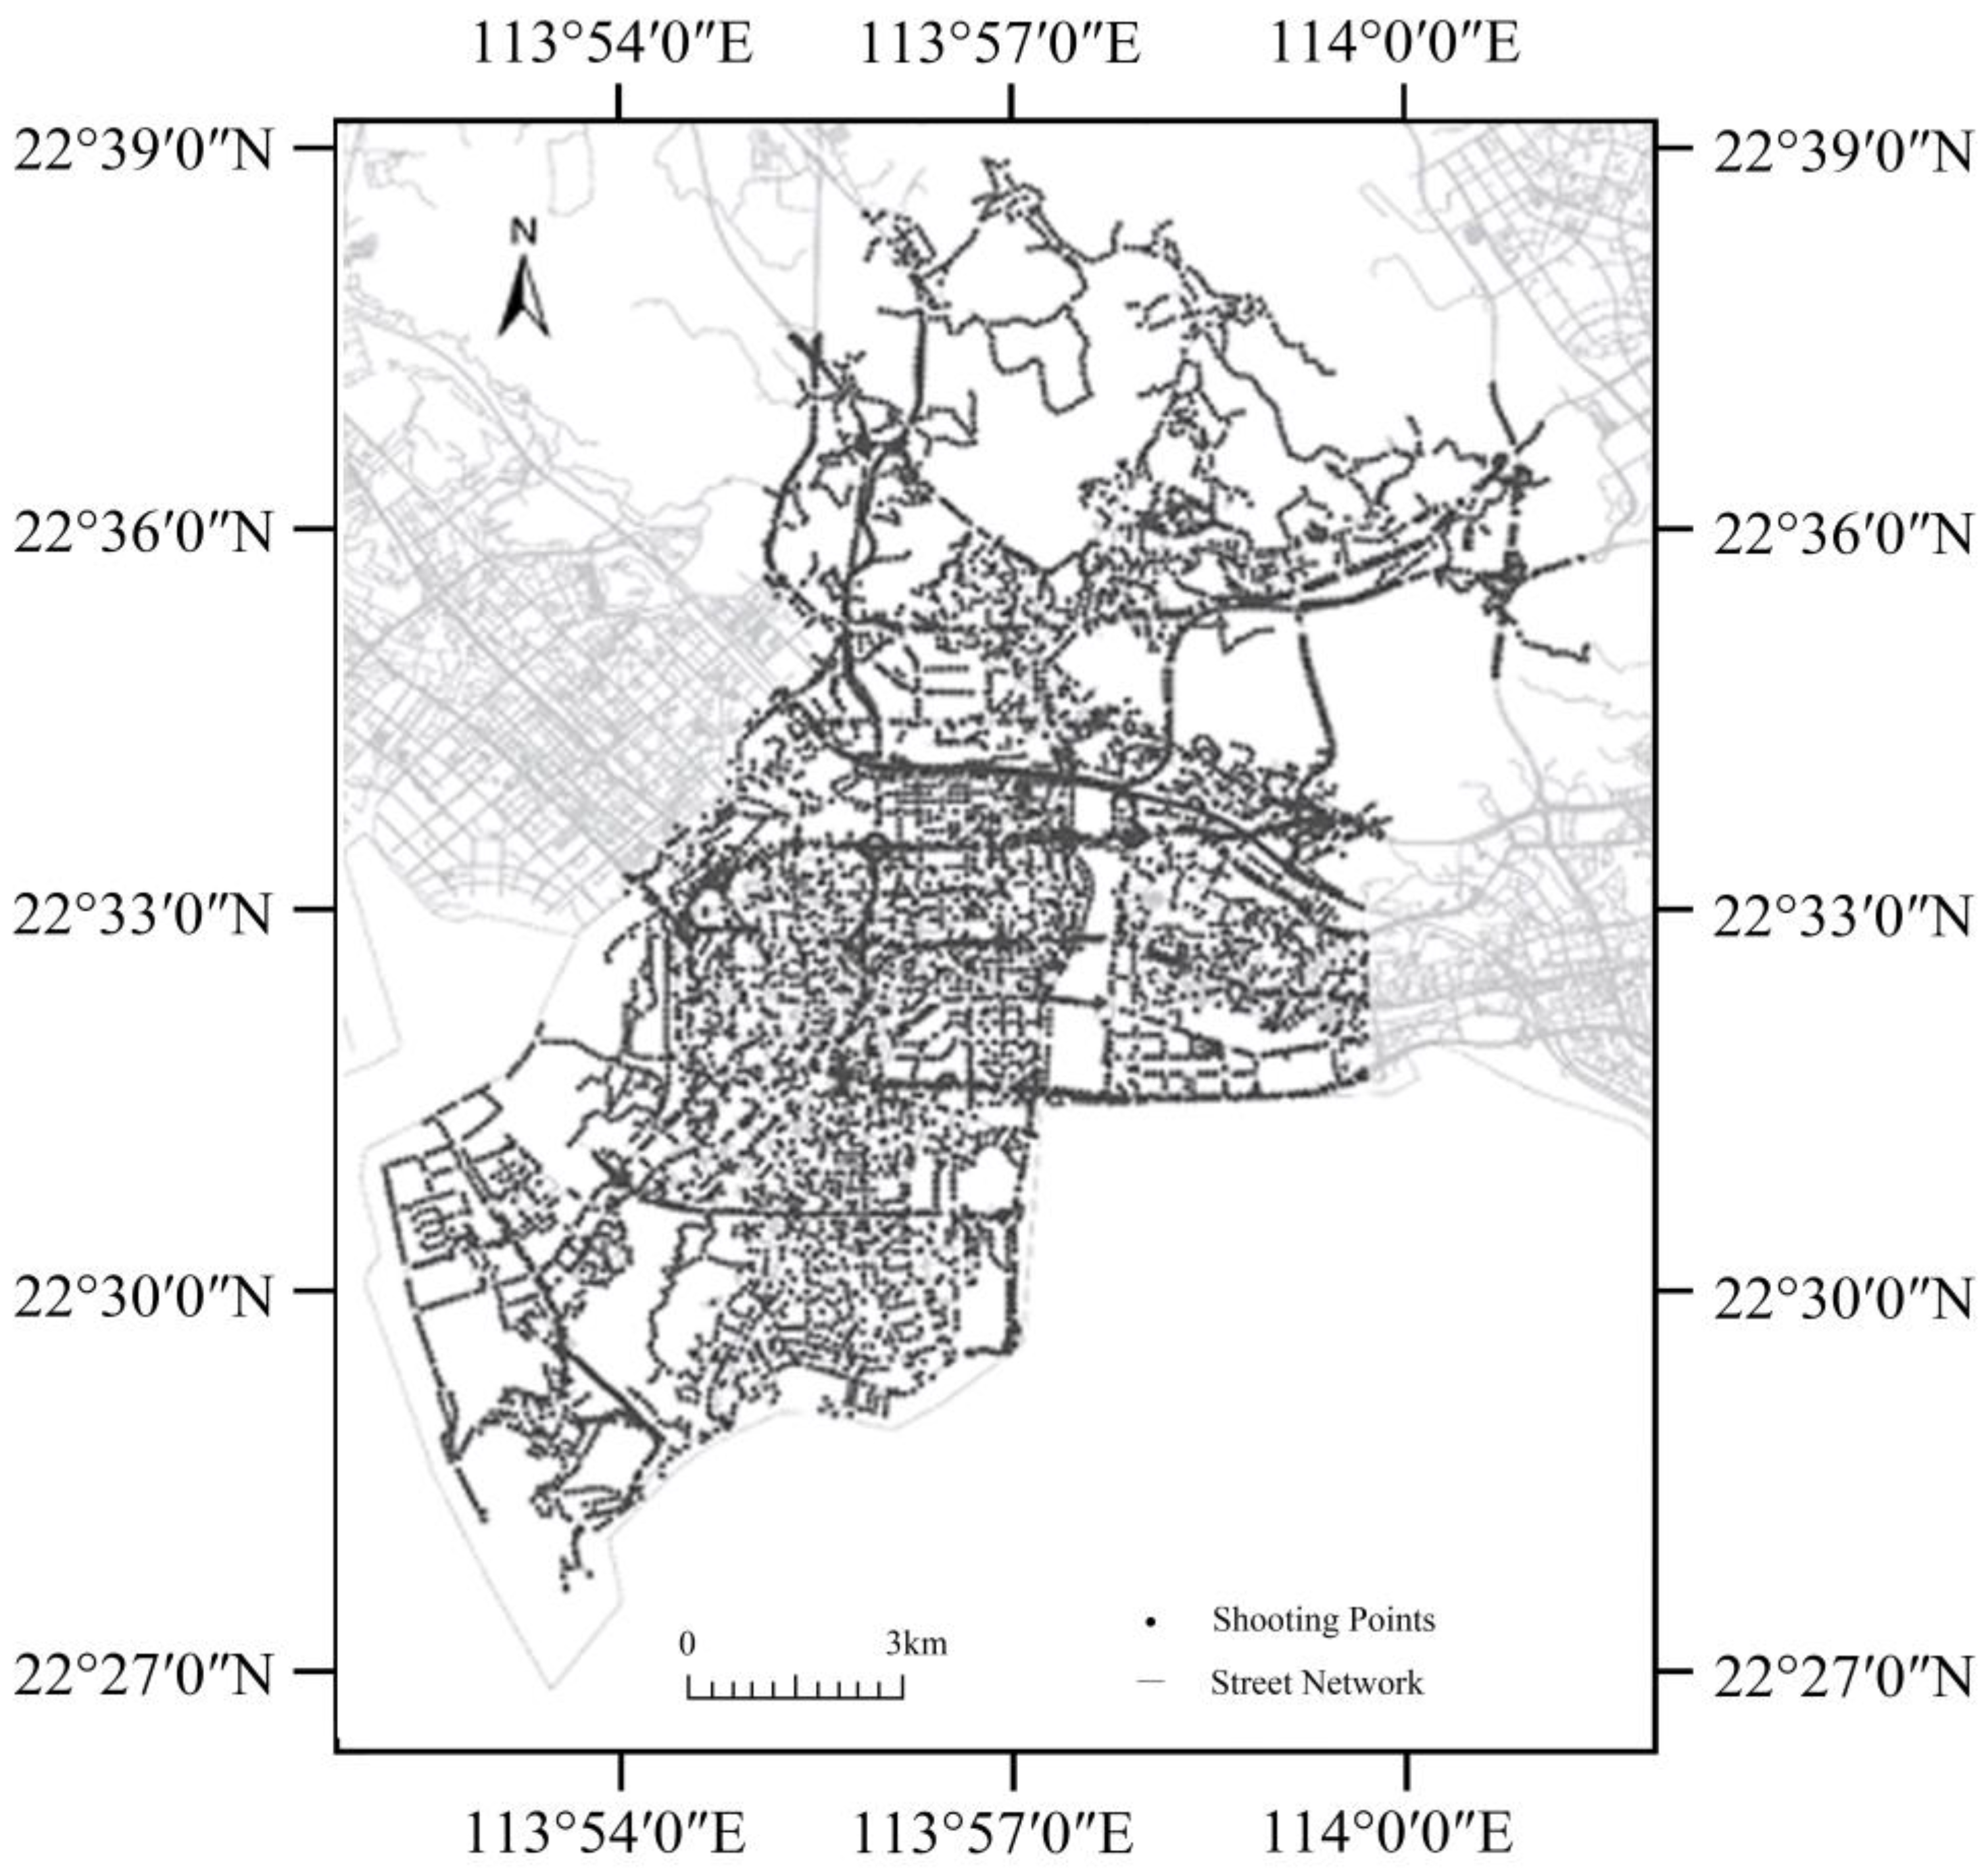
In our study, OpenStreetMap (OSM) is used to collect street network data in Shenzhen, and the data are imported into ArcGIS for further analysis. Then, street view shooting points are generated every 100 m to accurately reflect the spatial distribution characteristics of the streets. A total of 5684 shooting points and corresponding latitude and longitude coordinate data are obtained from Nanshan District, Shenzhen. The distribution of the shooting points is shown in
Figure 3.
The API development interface of Baidu Street View (
https://lbsyun.baidu.com/, accessed on 20 January 2024) is used to obtain street view images for each shooting point. To provide a comprehensive measure of the human perceptions of the street space in the Nanshan district, we batch crawled the street view images of each shooting point at four relative angles (0°, 90°, 180°, and 270°). In this way, we correctly visualise the urban environments and street space via street view images. A total of 126,724 street view images are collected.
2.3. Database Construction
2.3.1. Building Façade Database
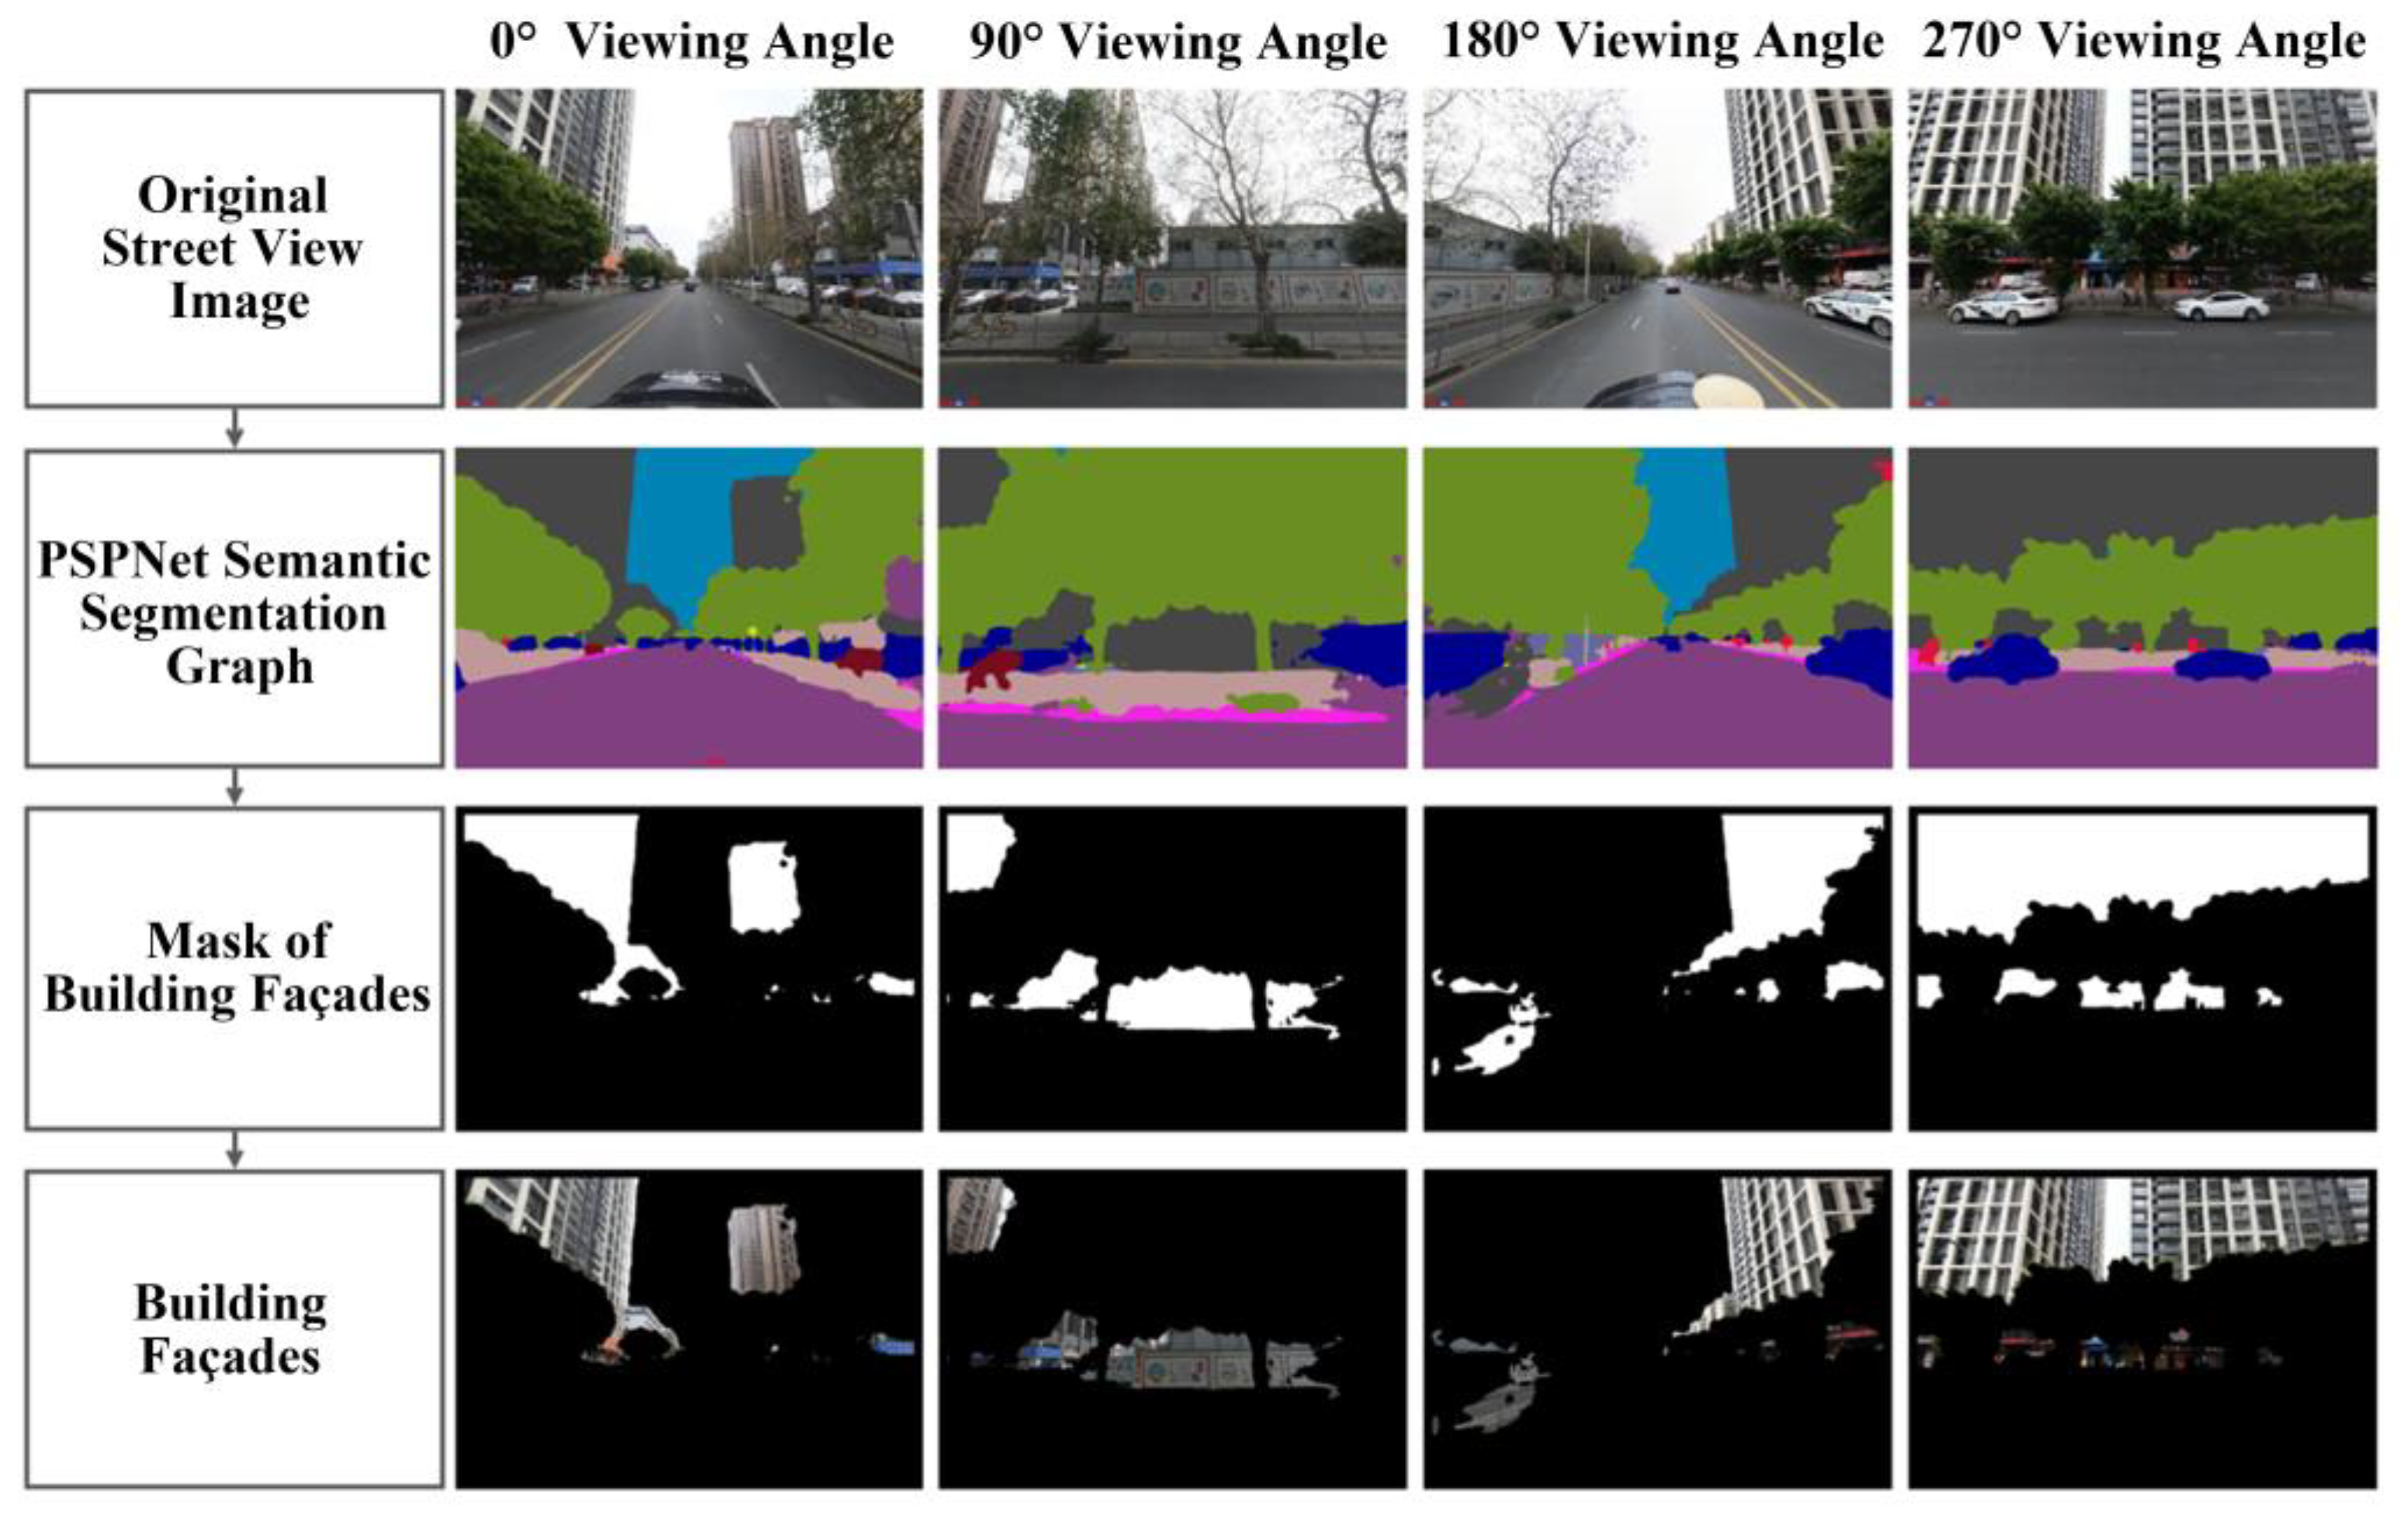
To effectively extract building façade information from street view images, this study adopts the PSPNet model. This model is capable of pixel-level image understanding and segmentation and demonstrates extremely high segmentation accuracy and significant results when processing ImageNet datasets at the pixel level, with accuracy rates exceeding 92.9% [
40]. Herein, first, the PSPNet model is used to segment the building part of each image and differentiate it from the other parts to obtain a binarized mask. Second, image data with only buildings are extracted from the mask. Finally, 18,748 1024 × 700 dpi images of building façades in Nanshan District, Shenzhen, are obtained. Taking the four-angle street view image of the shooting point with its geographic location at 22.586° N, 113.943° E as an example, the process of constructing building façade image data is demonstrated in
Figure 4.
2.3.2. Database of Building Façades in the Visual Attention Region
Research indicates the presence of visual saliency in the human visual processing mechanism, which refers to the phenomenon of processing and focusing on the most attention-grabbing parts of a scene or image [
41,
42,
43]. Moreover, the perception of the external world by human eyes also involves visual nonlinearity [
44] and multichannel and masking effects [
45,
46,
47,
48].
- 2.
Visual saliency detection and saliency level classification
The SalGAN model is a visual saliency detection model based on generative adversarial networks (GANs) [
49,
50]. Essentially, the core principle of the SalGAN model lies in the use of adversarial learning to generate saliency maps that are consistent with human visual perception, which can effectively stimulate the attention of the human eye to the important information contained in complex scenes [
51]. Relevant studies have shown that the SalGAN model performs well, whether directly comparing the saliency images generated by the SalGAN with ground-truth images or using evaluation metrics to quantitatively assess the performance of SalGAN [
52].
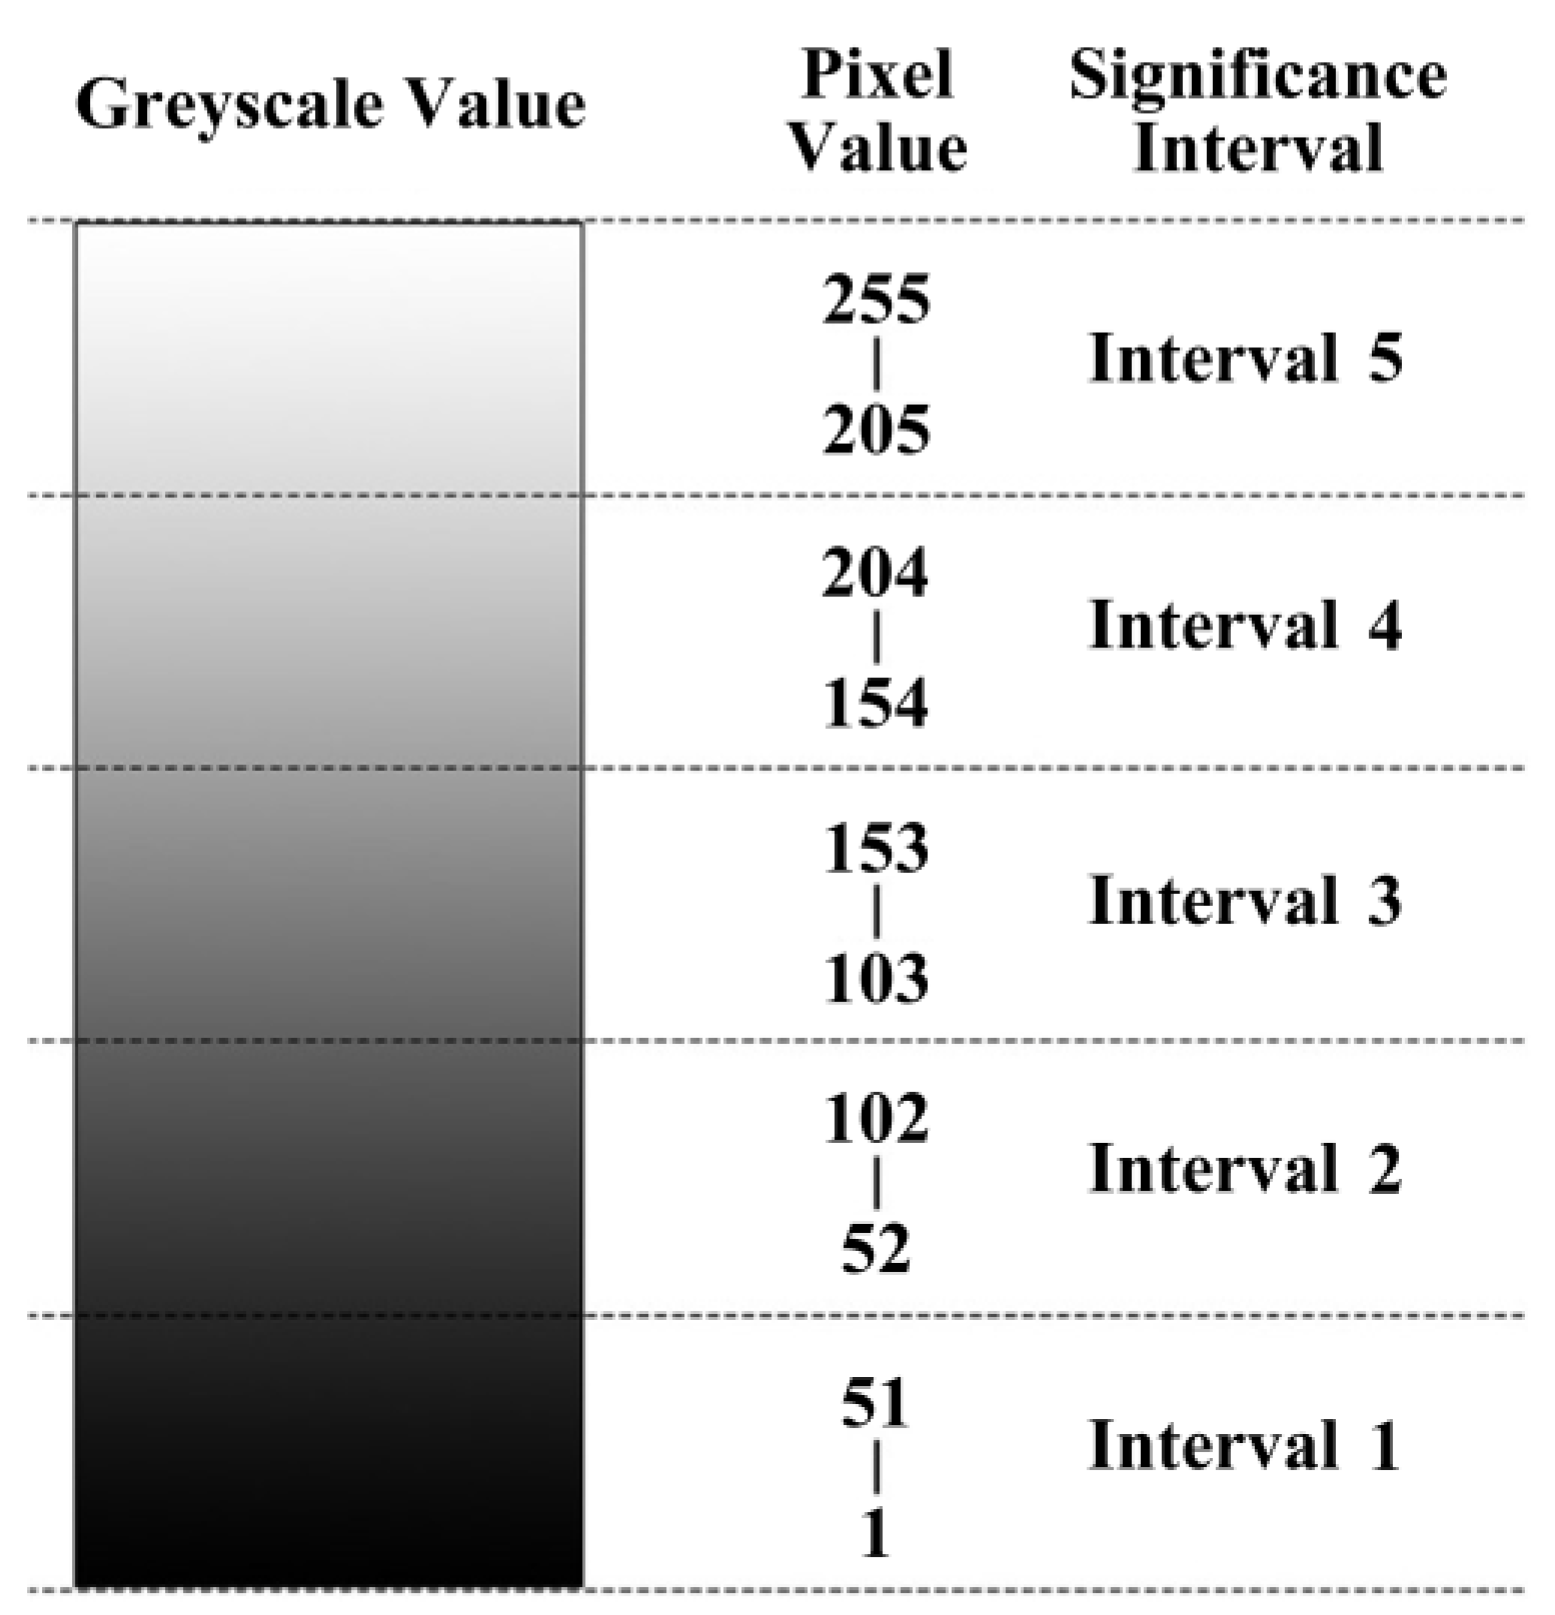
In this research, we employ the SalGAN model to synthesise saliency maps for images of building façades. The regions within these images exhibiting grey values closer to 255 (representing white) are visually more prominent, indicating a greater likelihood of attracting human visual attention to those specific areas.
Initially, we exclude the black portions of the images, which correspond to grey values of 0. The remaining greyscale values ranging from 1 to 255 are subsequently reclassified into five distinct intervals. These five intervals are then utilised to extract the building façade images within the visually attentive regions. The correspondence between the interval division results and the original grey values is shown in
Figure 5.
- 3.
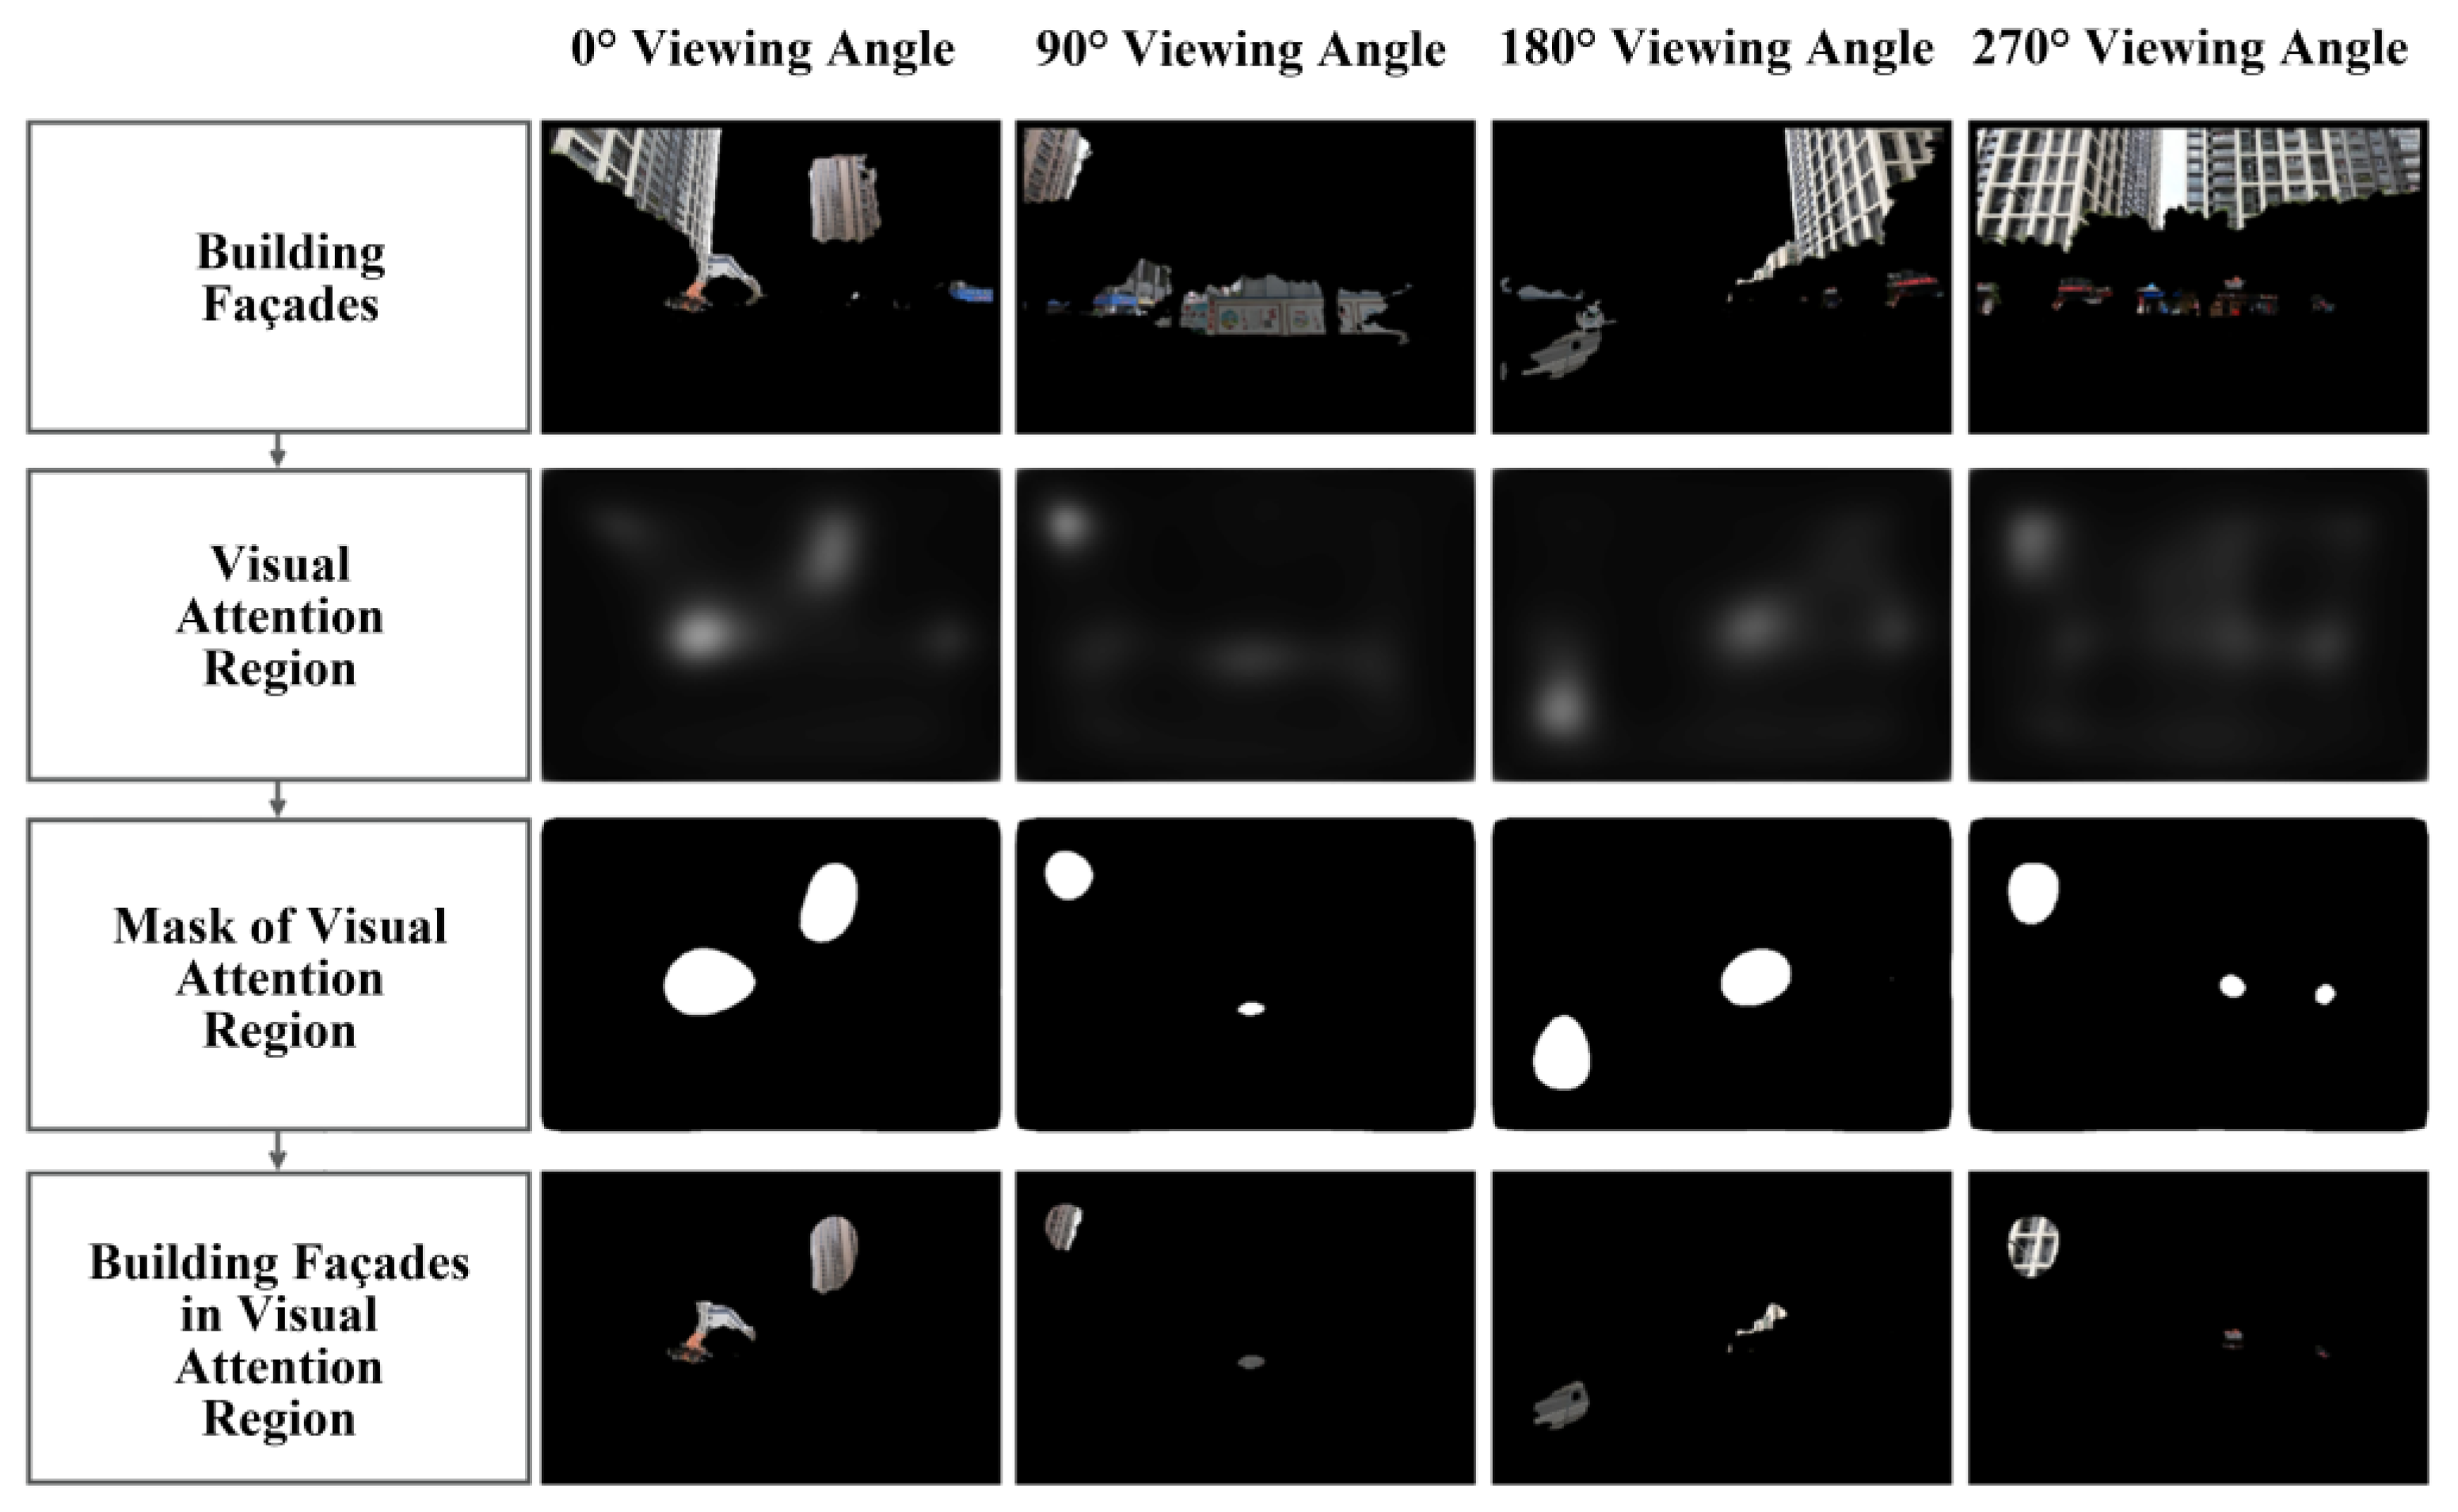
Visual attention region extraction
On the basis of the preceding stage, a threshold ranging from 52 to 102 is established to delineate the visual salient region, specifically the visual attention region. The visual attention region is subsequently differentiated from the other regions to produce a binary mask. Following this, the image data pertaining to the building façade within the visual attention region are extracted from the mask, as illustrated in
Figure 6.
2.3.3. Geometric Complexity Database
The properties of the human visual system indicate that human eyes are very sensitive to high-frequency information such as edge contours. Therefore, the present study defines a term called “geometric complexity” to describe the complexity of building façade contours and the regularity of geometric shapes to explore the geometric characteristics of building façades.
The fractal dimension is often used to measure the complexity of geometry, and its measurement helps with understanding the structural features of images [
53,
54,
55]. Since the box-counting algorithm for the fractal dimension of images is more applicable to architecture because of its wider applicability and intuitive approach, it is used in the present study to measure the geometric complexity of building façades [
31,
56].
- 2.
Measurement of fractal dimension
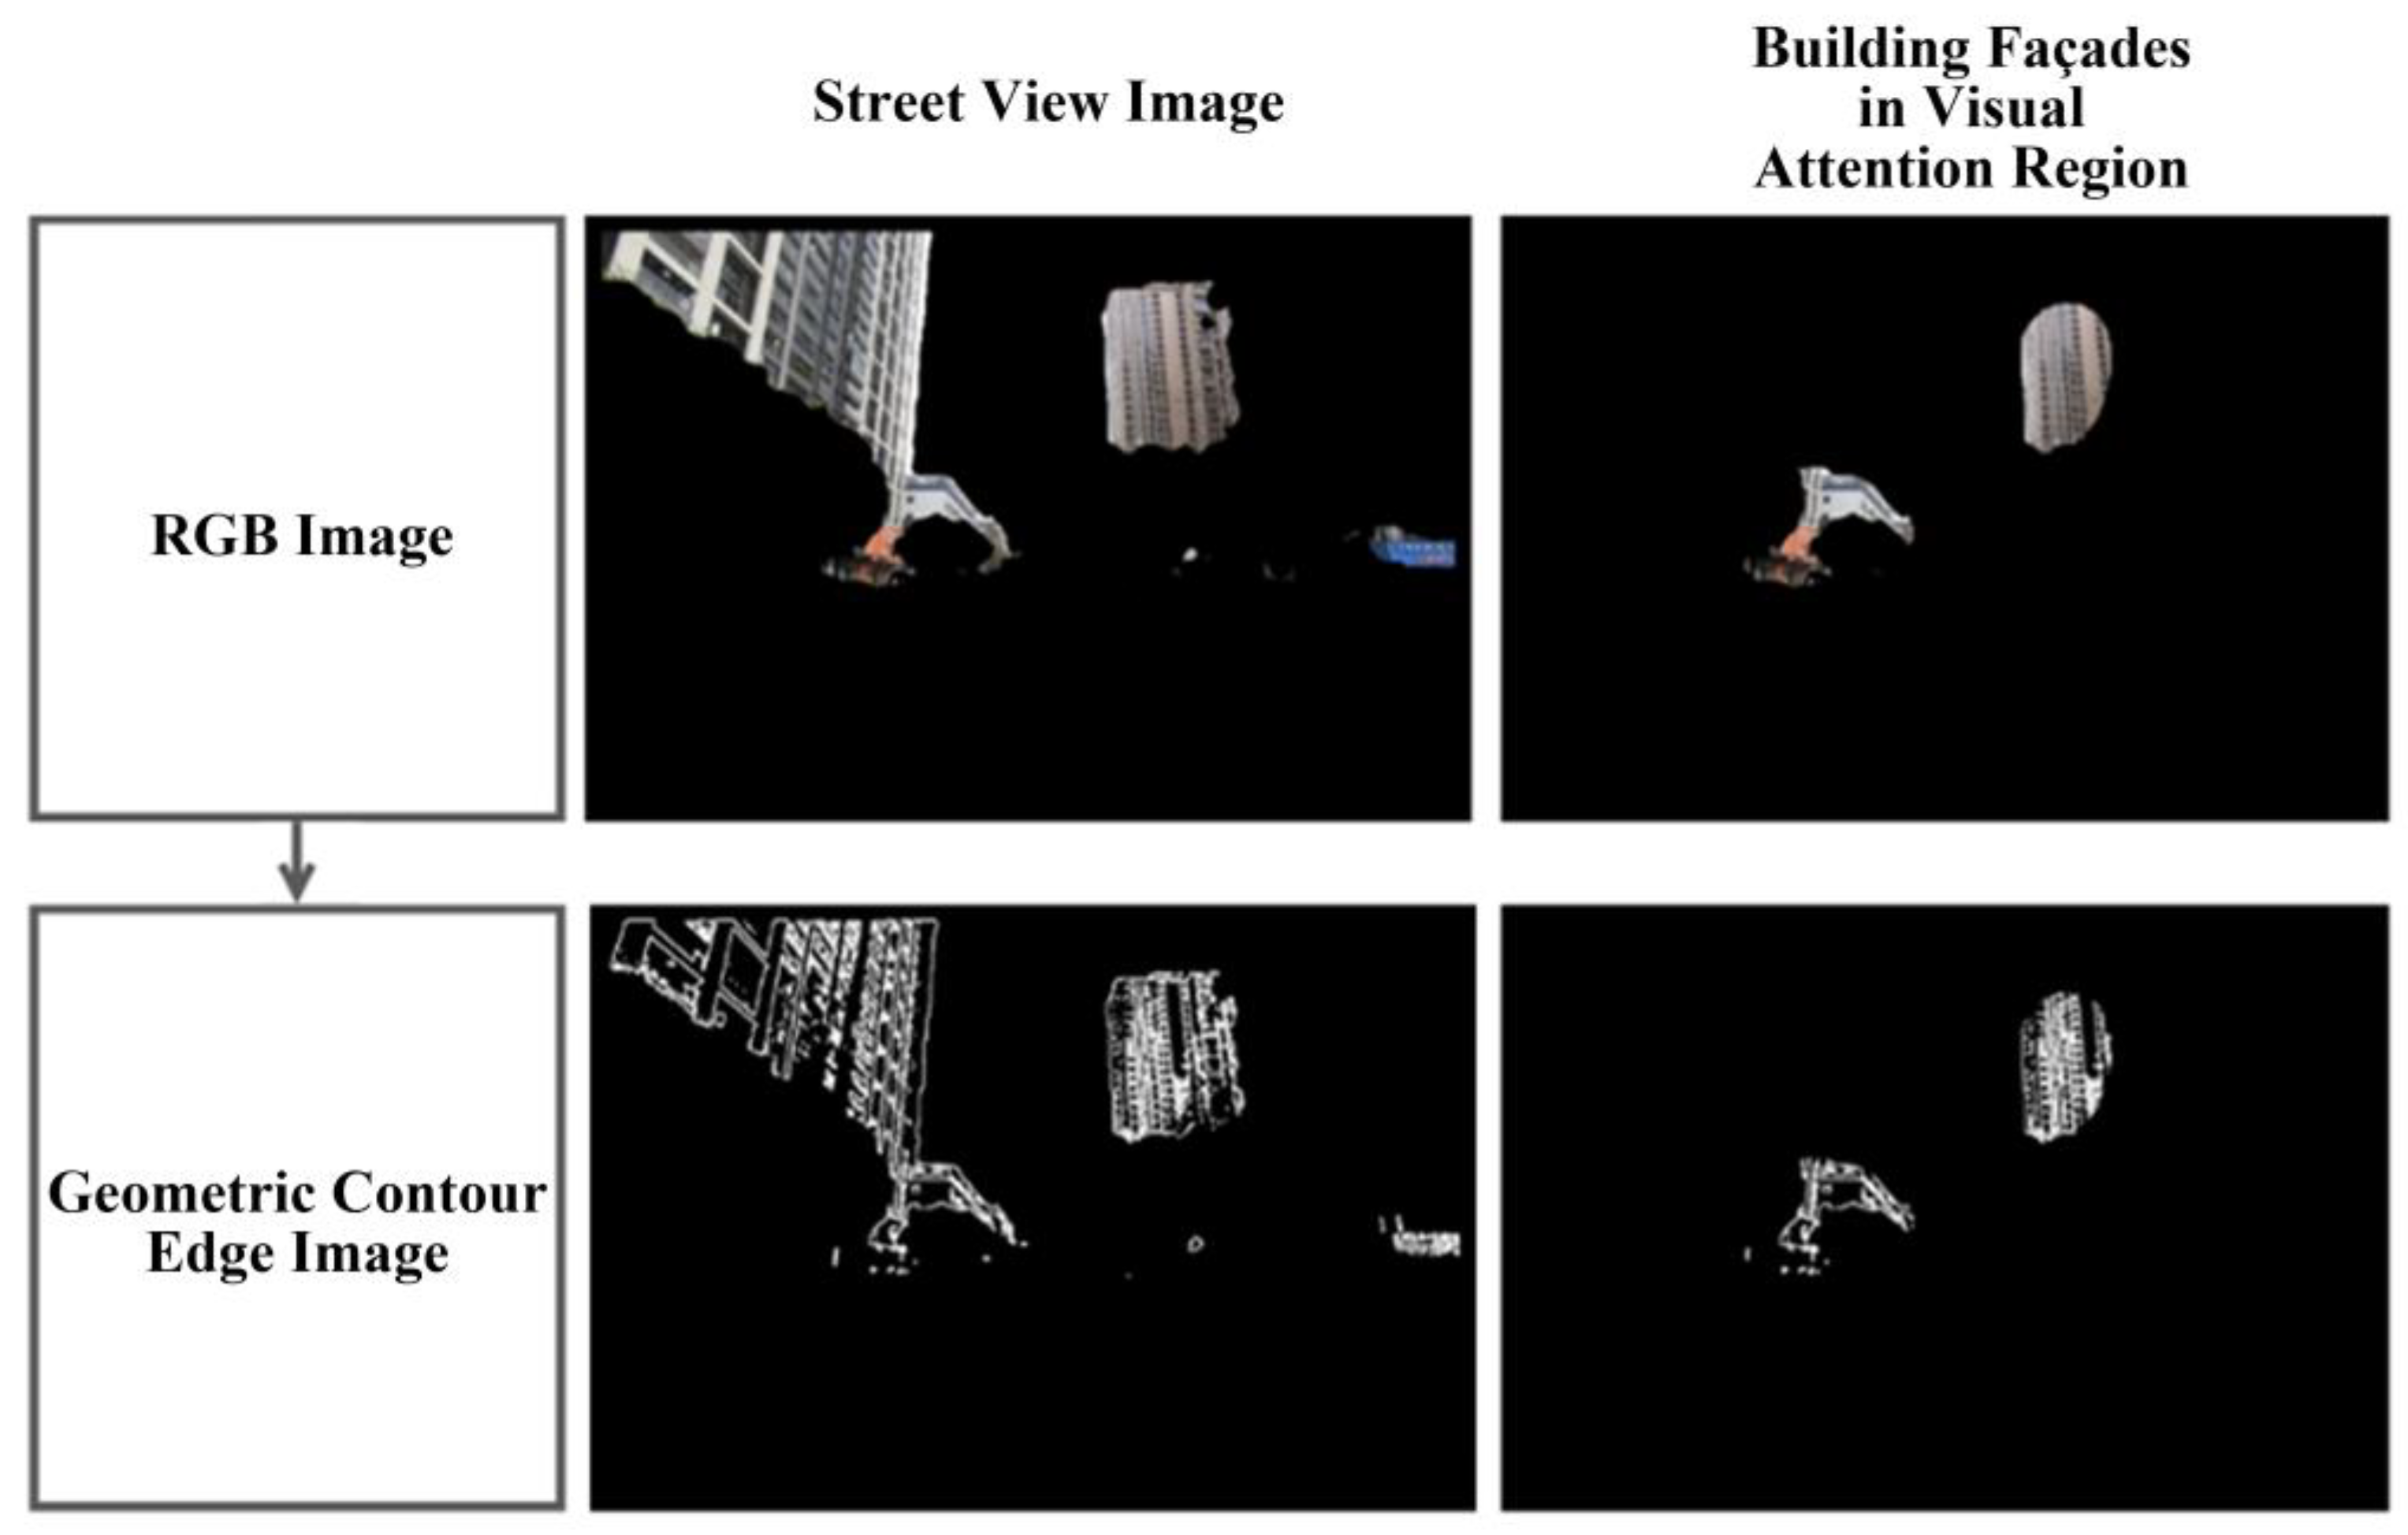
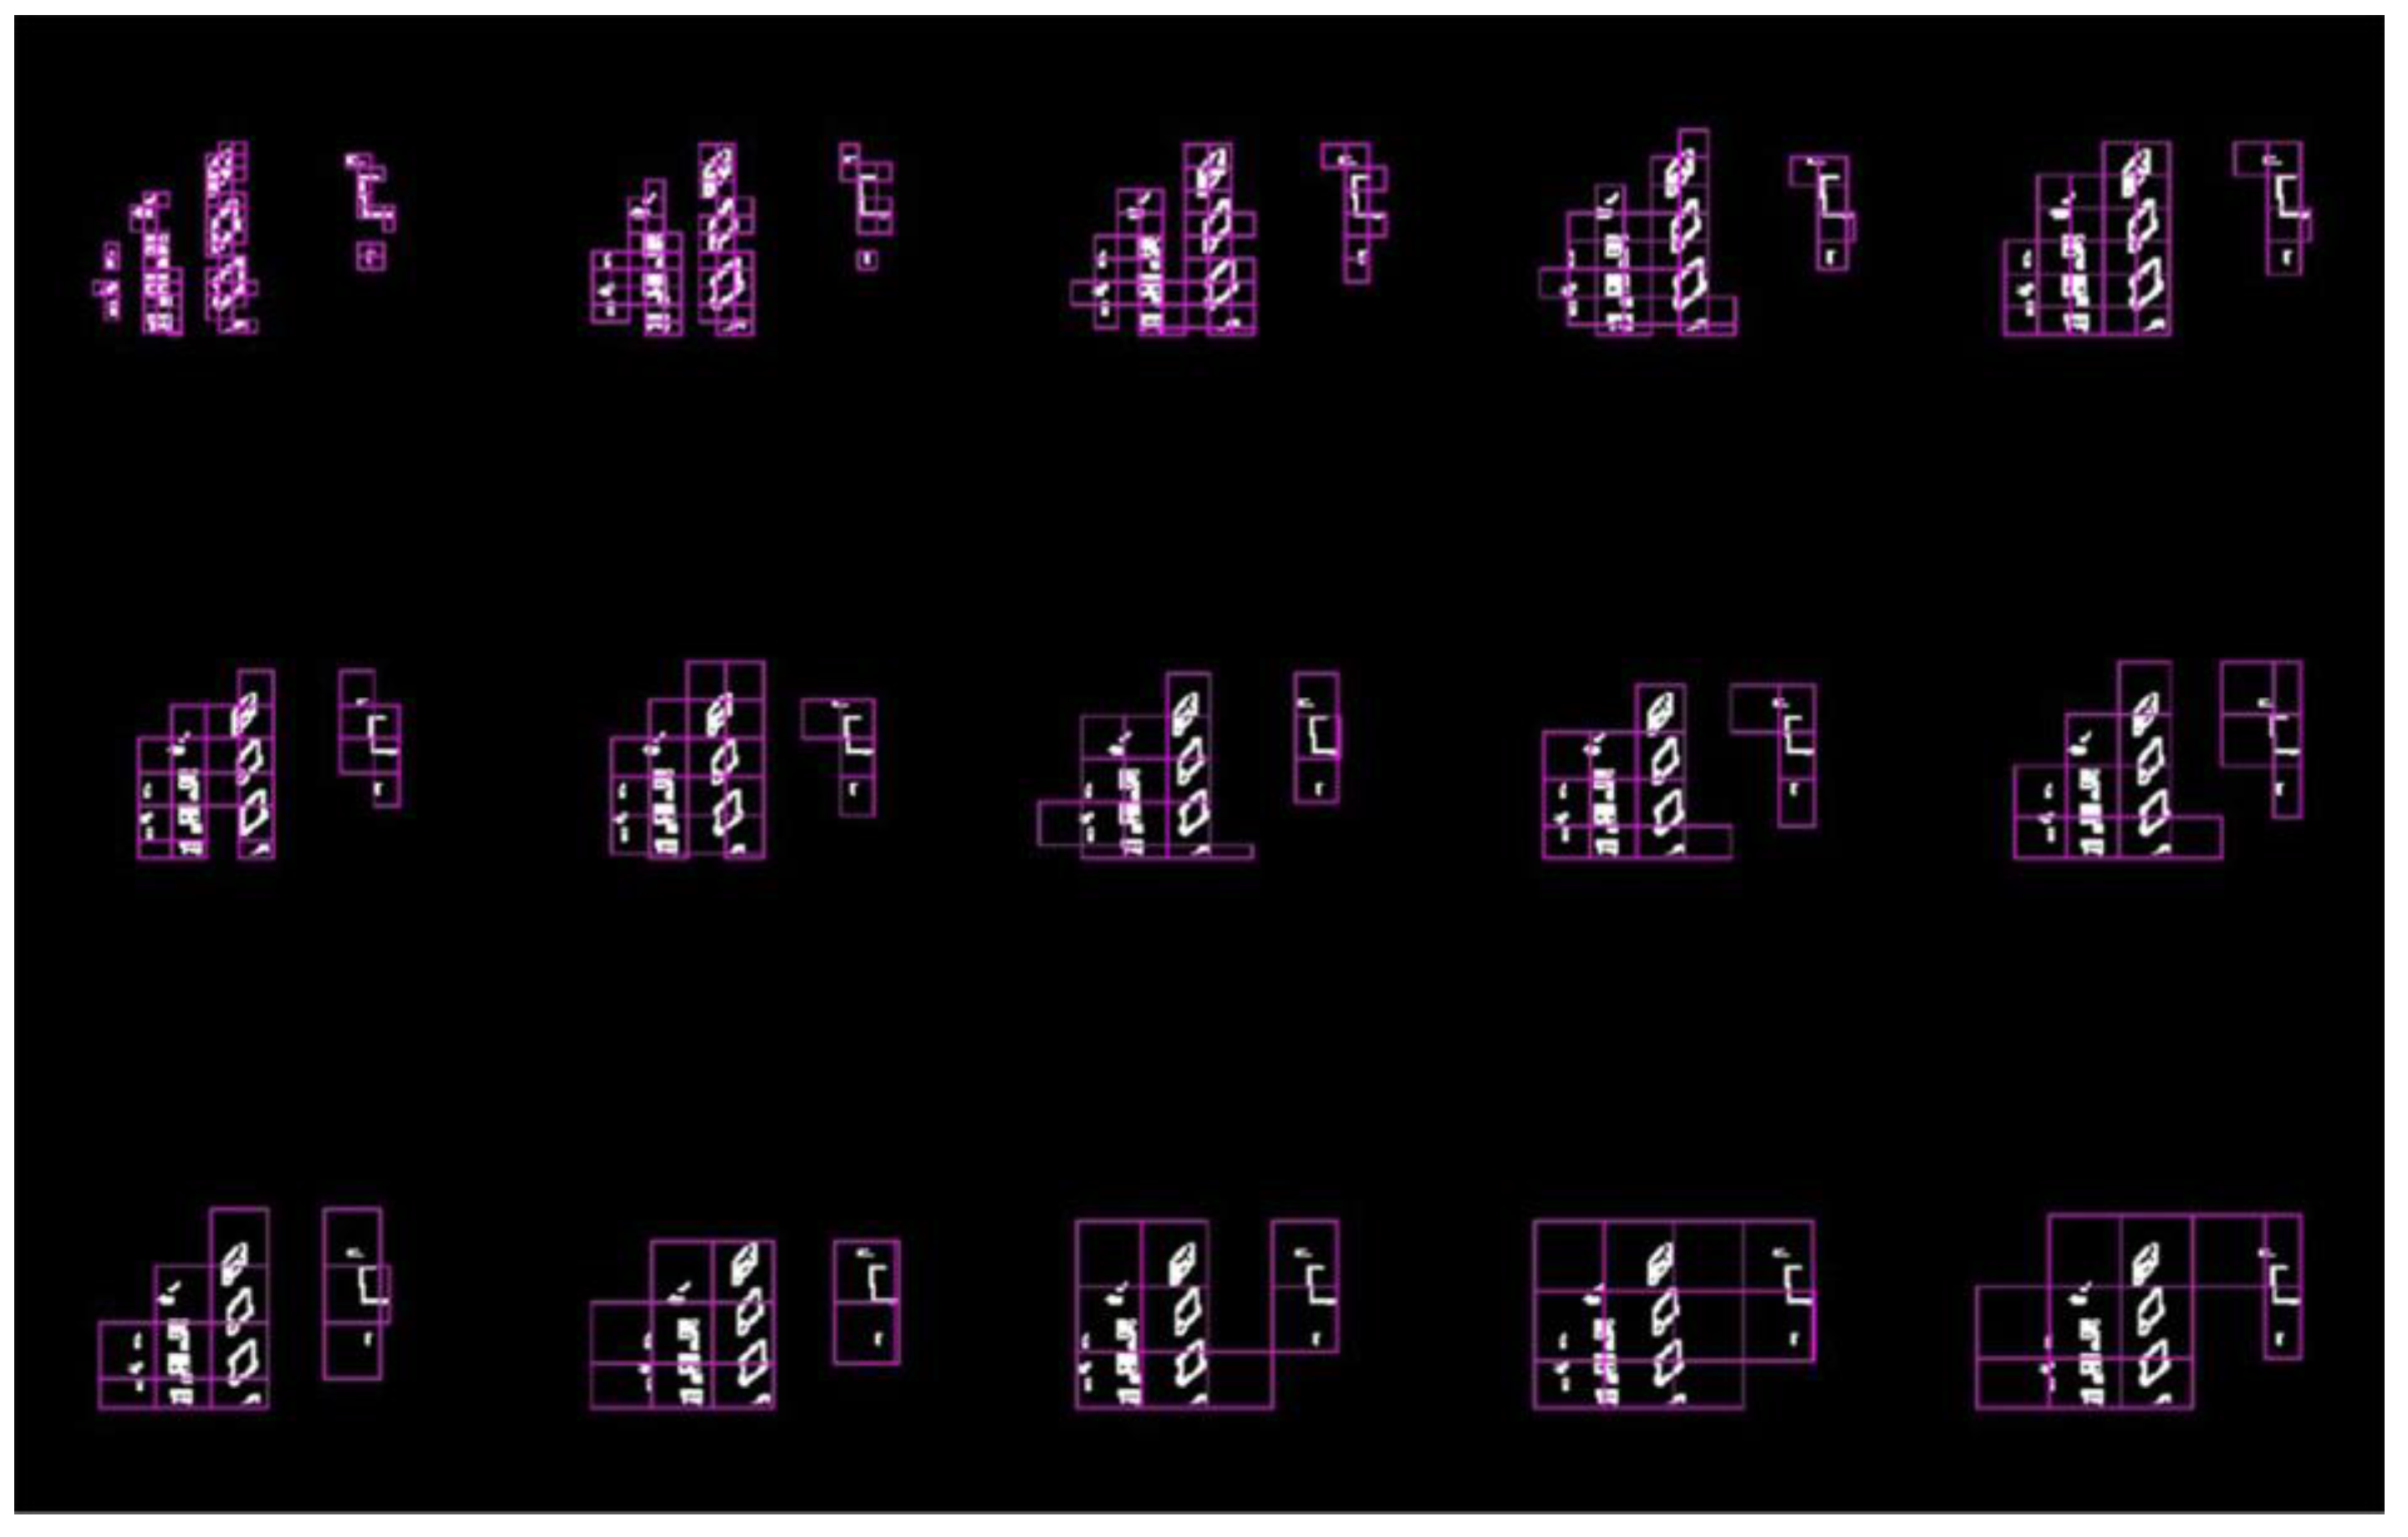
In our study, the building façade images and the building façade images in the visual attention region are processed to extract the geometric contour edges of the building façades in preparation for fractal dimension measurement, as shown in
Figure 7.
FracLac is an open-source fractal analysis plug-in that is developed on the basis of the ImageJ box-counting algorithm. In this study, we utilise this plug-in to quantify the fractal dimensions of both the entire geometric contours of building façade images and those within the visual attention region by employing a predefined grid size for the box-counting method. First, the overall geometry is partitioned into multiple grids at a specified scale. Second, each grid is individually analysed to compute its local-level fractal dimension (di). The global-level fractal dimension (D) is subsequently determined by considering the entire visible image geometry. Finally, the output comprises a set of di values, corresponding to the number of divided grids, and a single D value.
In this study, the R2 metric, which measures the goodness of fit of regression models, is recorded during the fractal dimension measurement process. The results showed that the R2 values are greater than 0.9 for different meshing processes. This finding indicates that the calculated fractal dimension results are reliable. In this case, the di calculated for a single image is used to denote the D.
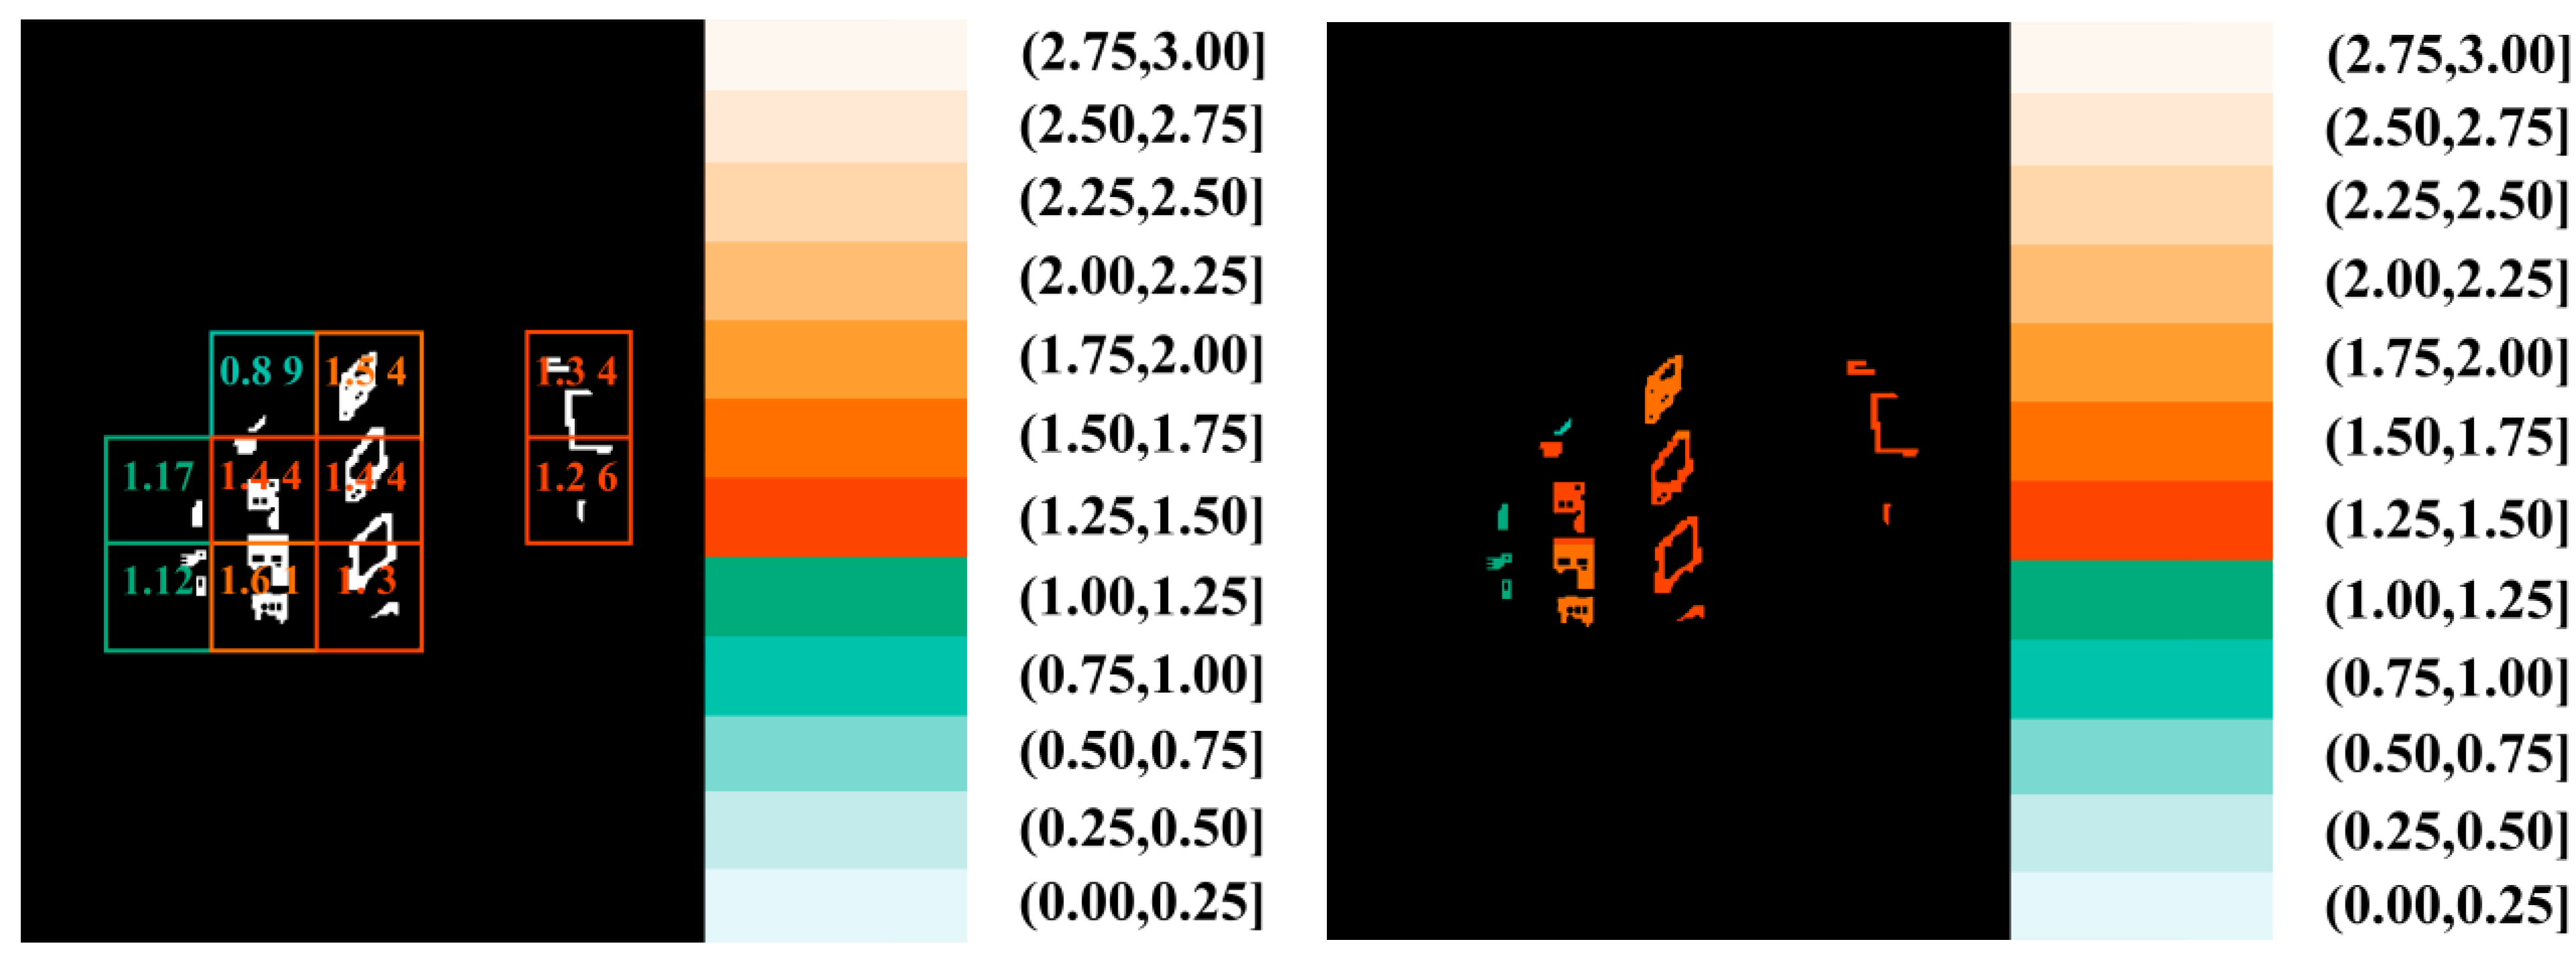
Our study measures both d
i and D, then visualises their distributions to produce a map depicting the d
i distribution. The geometric complexity database of building façades and the geometric complexity database of building façades in the visual attention region are constructed on this basis. During the visualisation process, the fractal dimension values are divided into geometric complexity intervals of 0.25 each. One of the street view images is used as an example to measure its d
i and D. The image is divided into 10 local lattices for measuring the d
i, and the final d
i(
i =
n) is obtained for the 10 local lattices.
Figure 8 shows the fractal dimension values of the 10 local grids and their corresponding colours.
Figure 9 illustrates the meshing process from the minimum grid size to the maximum grid size when the final D is measured. The measured results are shown in
Table 1, and the visualisations are displayed in
Figure 8 and
Figure 9.
- 3.
Geometric complexity construction for shooting points
It can be determined from the previous section that the numerical magnitude of the fractal dimension can effectively characterise the complexity of a geometric structure. The D of the building façade images at the four angles and the building façade images in the visual attention region at each shooting point are measured. The average value is calculated. We obtain the GGC and the GGCVA for each shooting point. Taking the shooting point with its geographic location at 22.586° N, 113.943° E as an example, the geometric complexity calculation results are shown in
Table 2.
3. Results
3.1. Comparative Global-Level Geometric Complexity Analysis
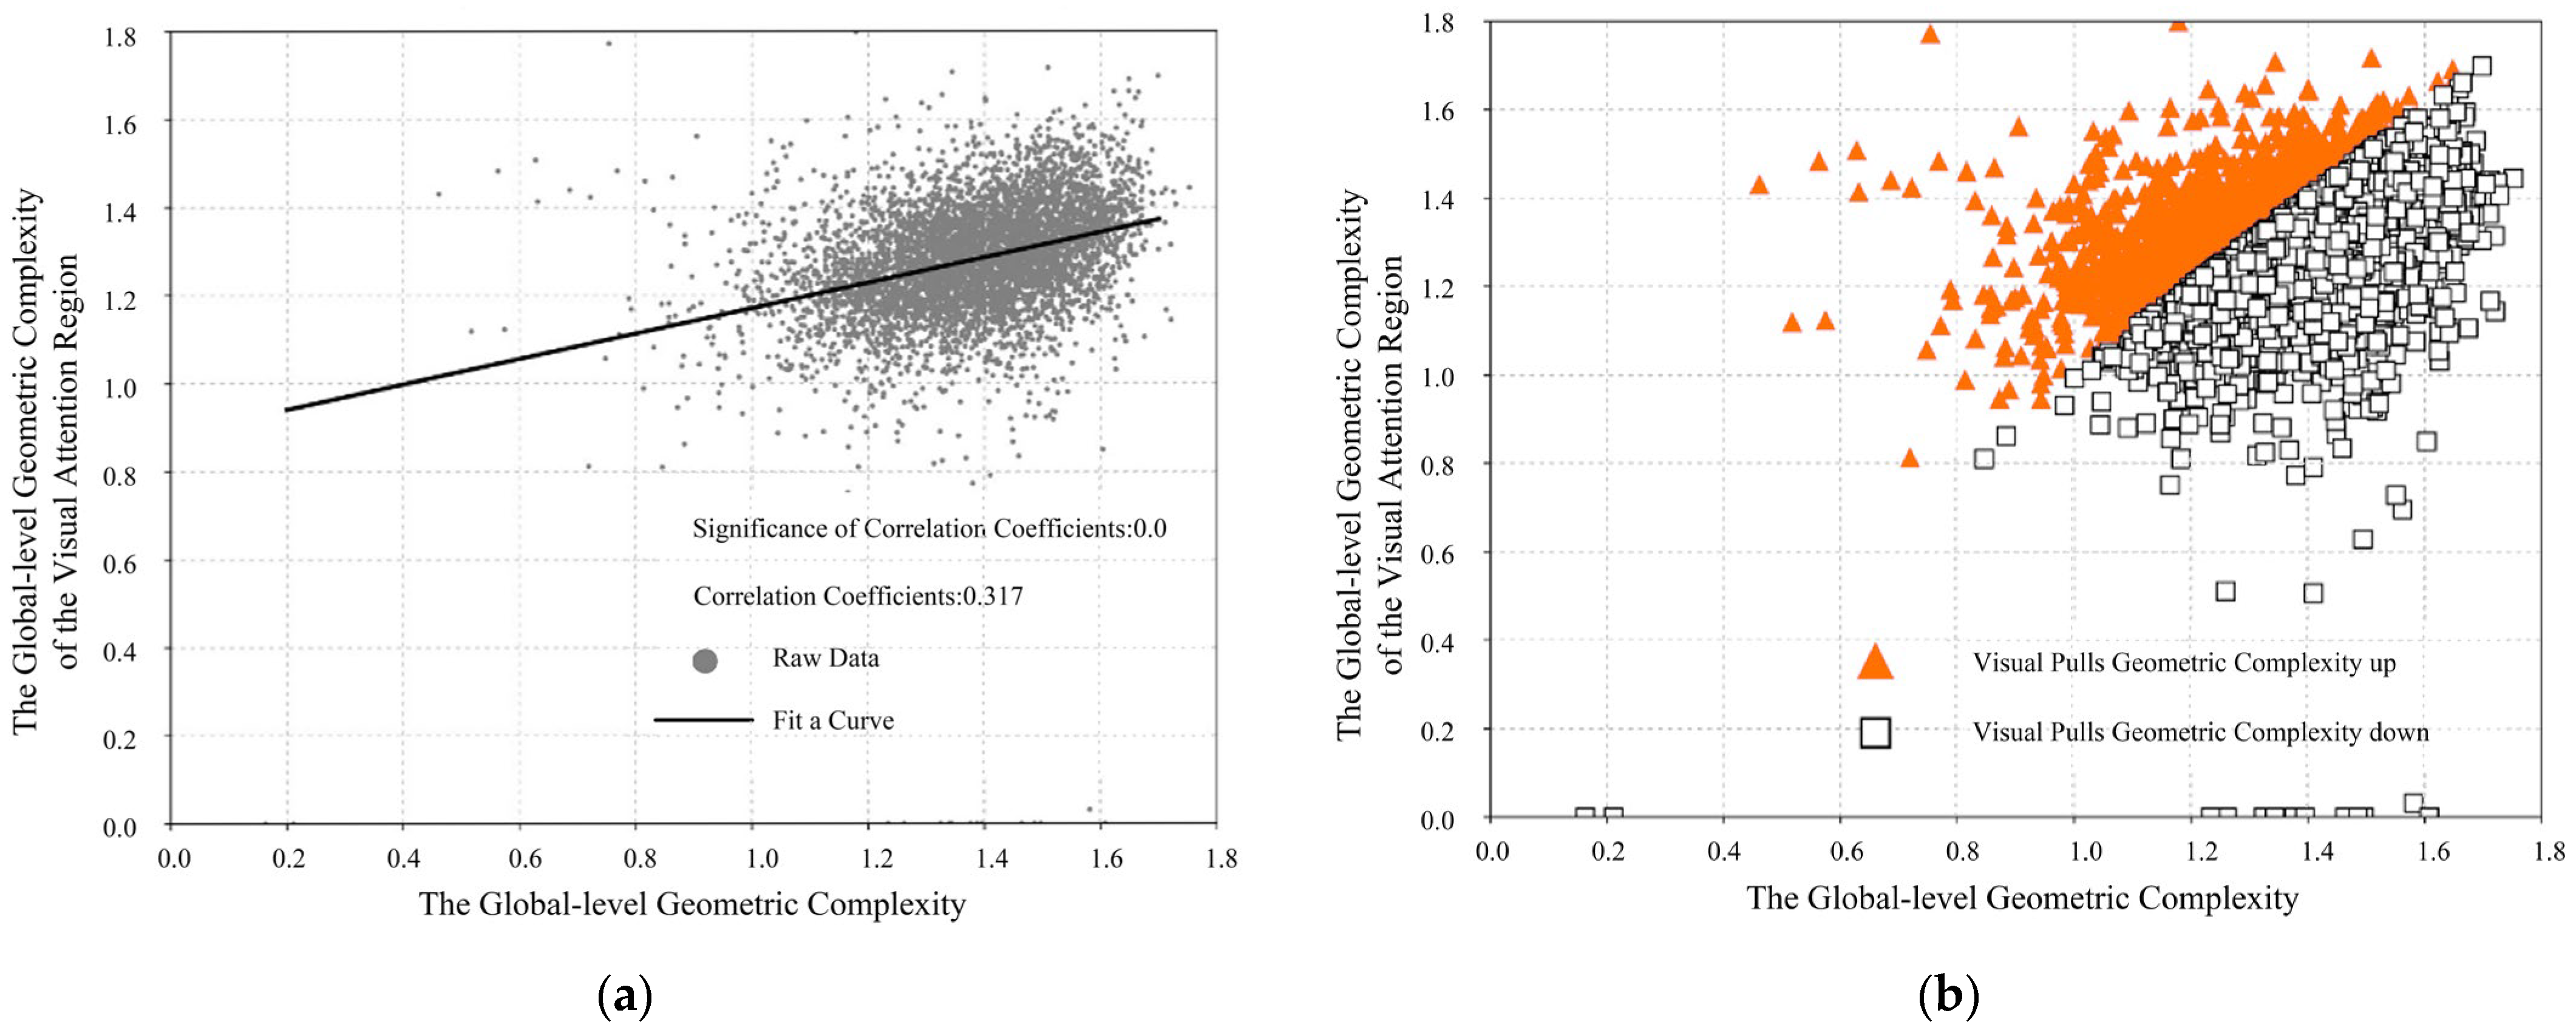
Scatter plots of the GGC versus the GGCVA are plotted in
Figure 10a. The results showed that the correlation coefficient is 0.01, the correlation coefficient is 0.317, and the two had a positive correlation. That is, as the GGC of the building façades increased, the GGCVA of the building façades also increased.
The difference between the two geometric complexities is calculated (the difference value is equal to the GGCVA minus the GGC). A total of 1326 data points are observed for the difference value greater than 0, and another 4356 data points are the opposite. This indicates that 76.7% of the geometric complexity is pulled down and that only 23.3% is pulled up when the SalGAN model is used to perceive the building façades in the area. The visualisation is shown in
Figure 10b.
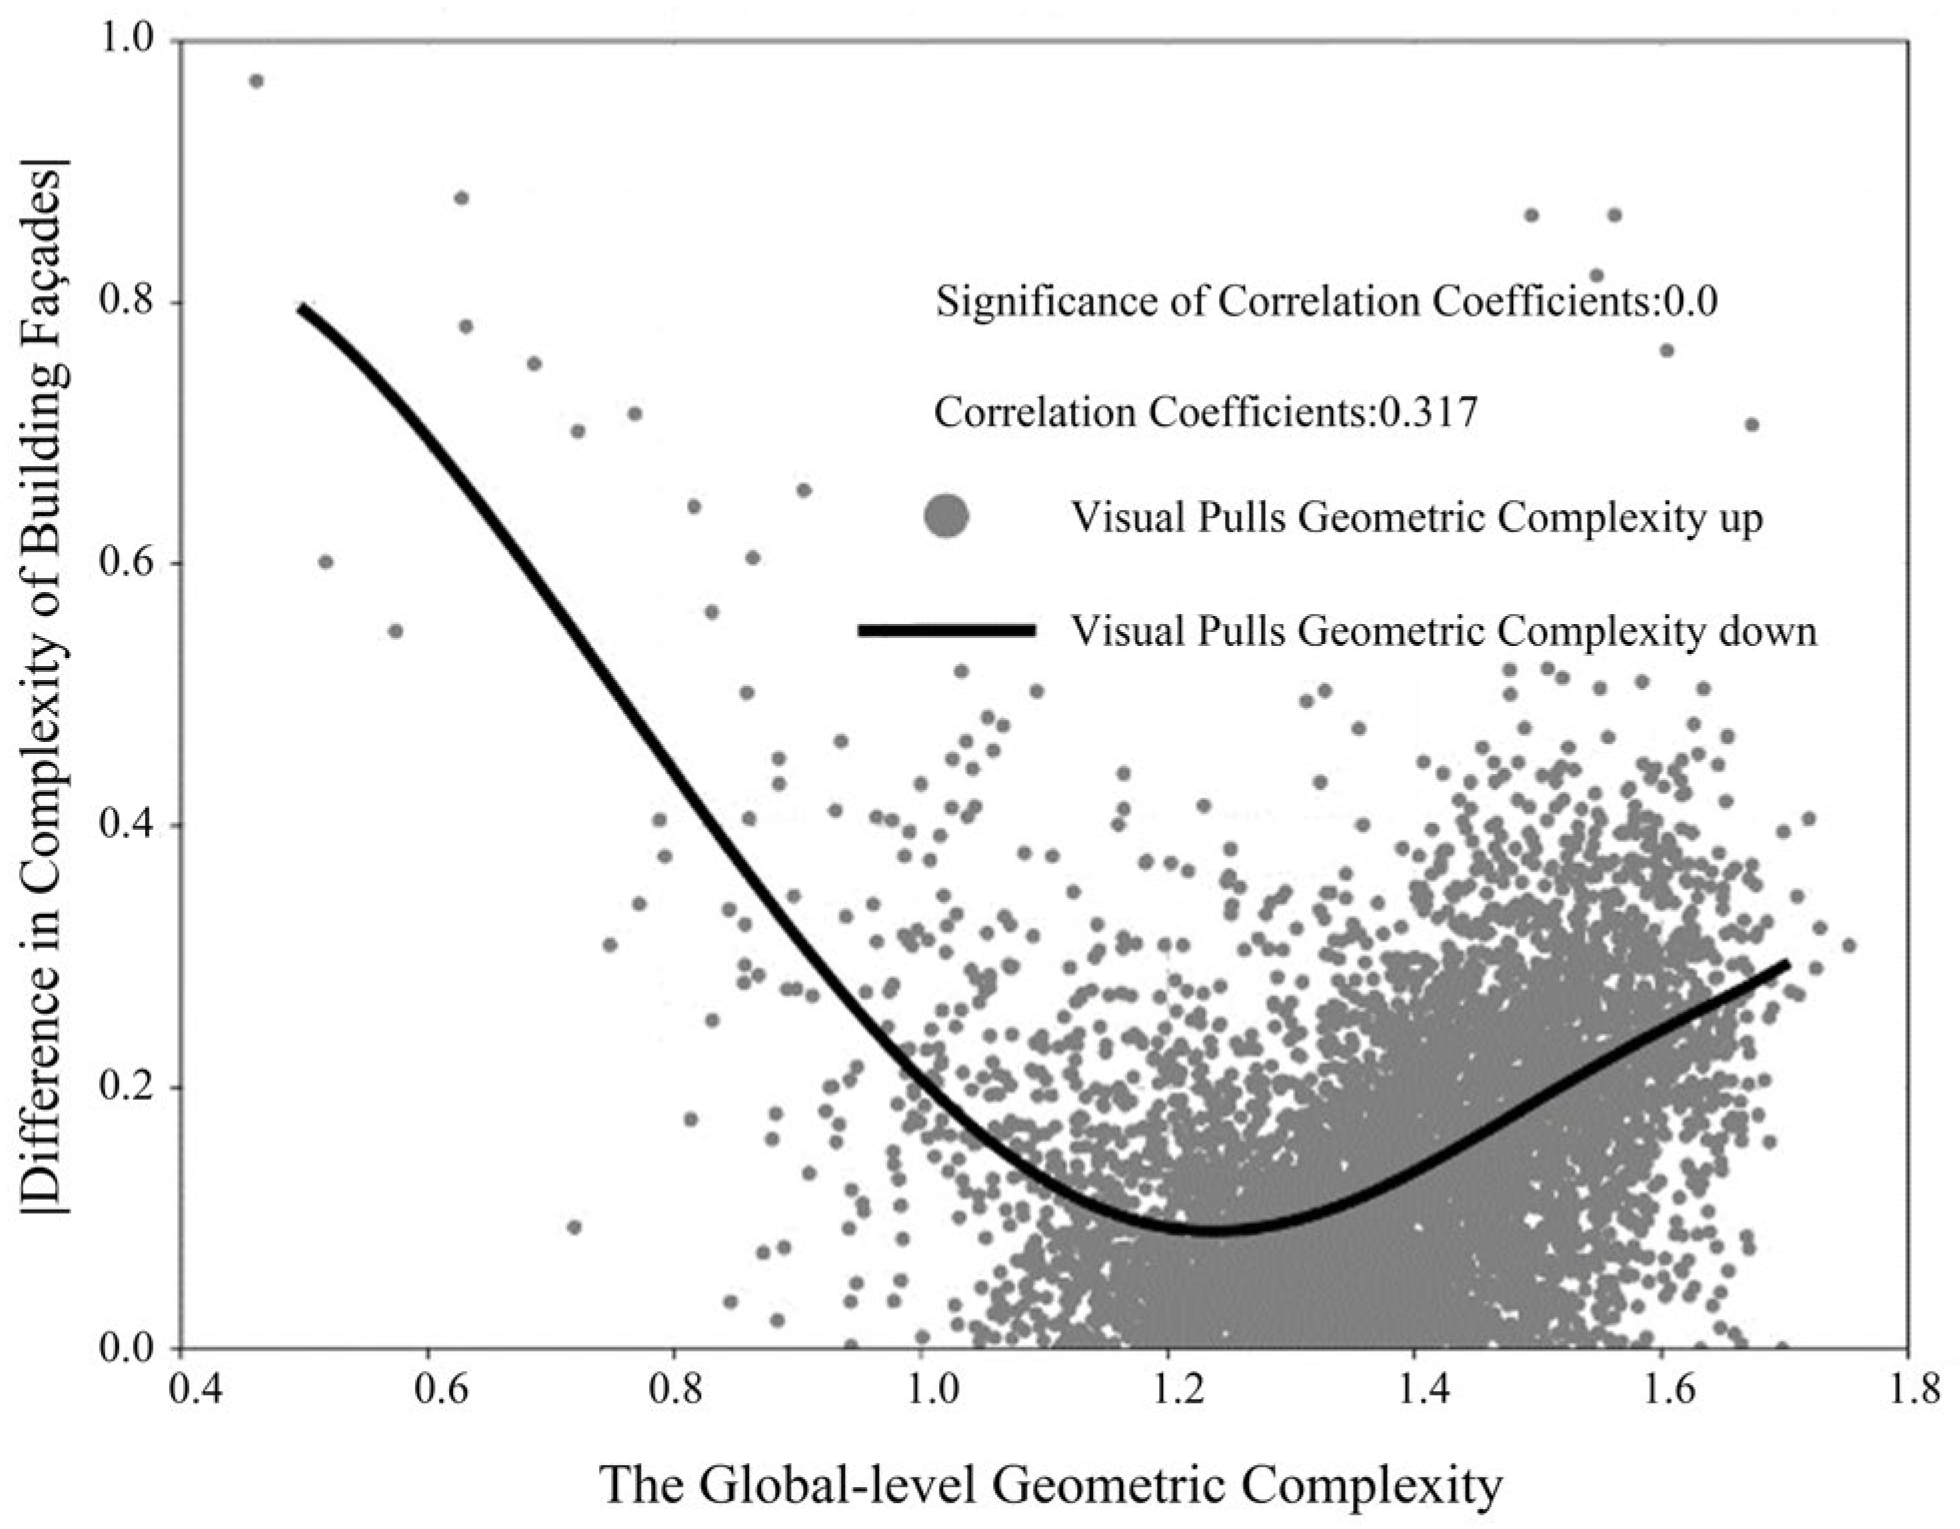
Scatter plots of the absolute values of the differences between the GGC and geometric complexity results are plotted. The results show that the GGC and GGCVA are bounded by a GGC of 1.2383. At the shooting points where the GGC is greater than 1.2383, the GGCVA of building façades is less than the GGC of building façades. The difference between the two values gradually increased with increasing GGC. Similarly, when the GGC is lower than 1.2383, the GGCVA is greater than the GGC of the building façades, and the differences between the two values gradually increase with increasing GGC. The visualisation is shown in
Figure 11.
3.2. Comparative Local-Level Geometric Complexity Analysis
3.2.1. Classification of Building Façades on the Basis of Their Geometric Complexity
In this study, a GGC of 1.2383 is used as the boundary to divide building façades into two types. Building façades with the GGC above 1.2383 are defined as complex building façades, and those with the GGC below 1.2383 are defined as simple building façades. The relationship between the GGC and the GGCVA is analysed and compared.
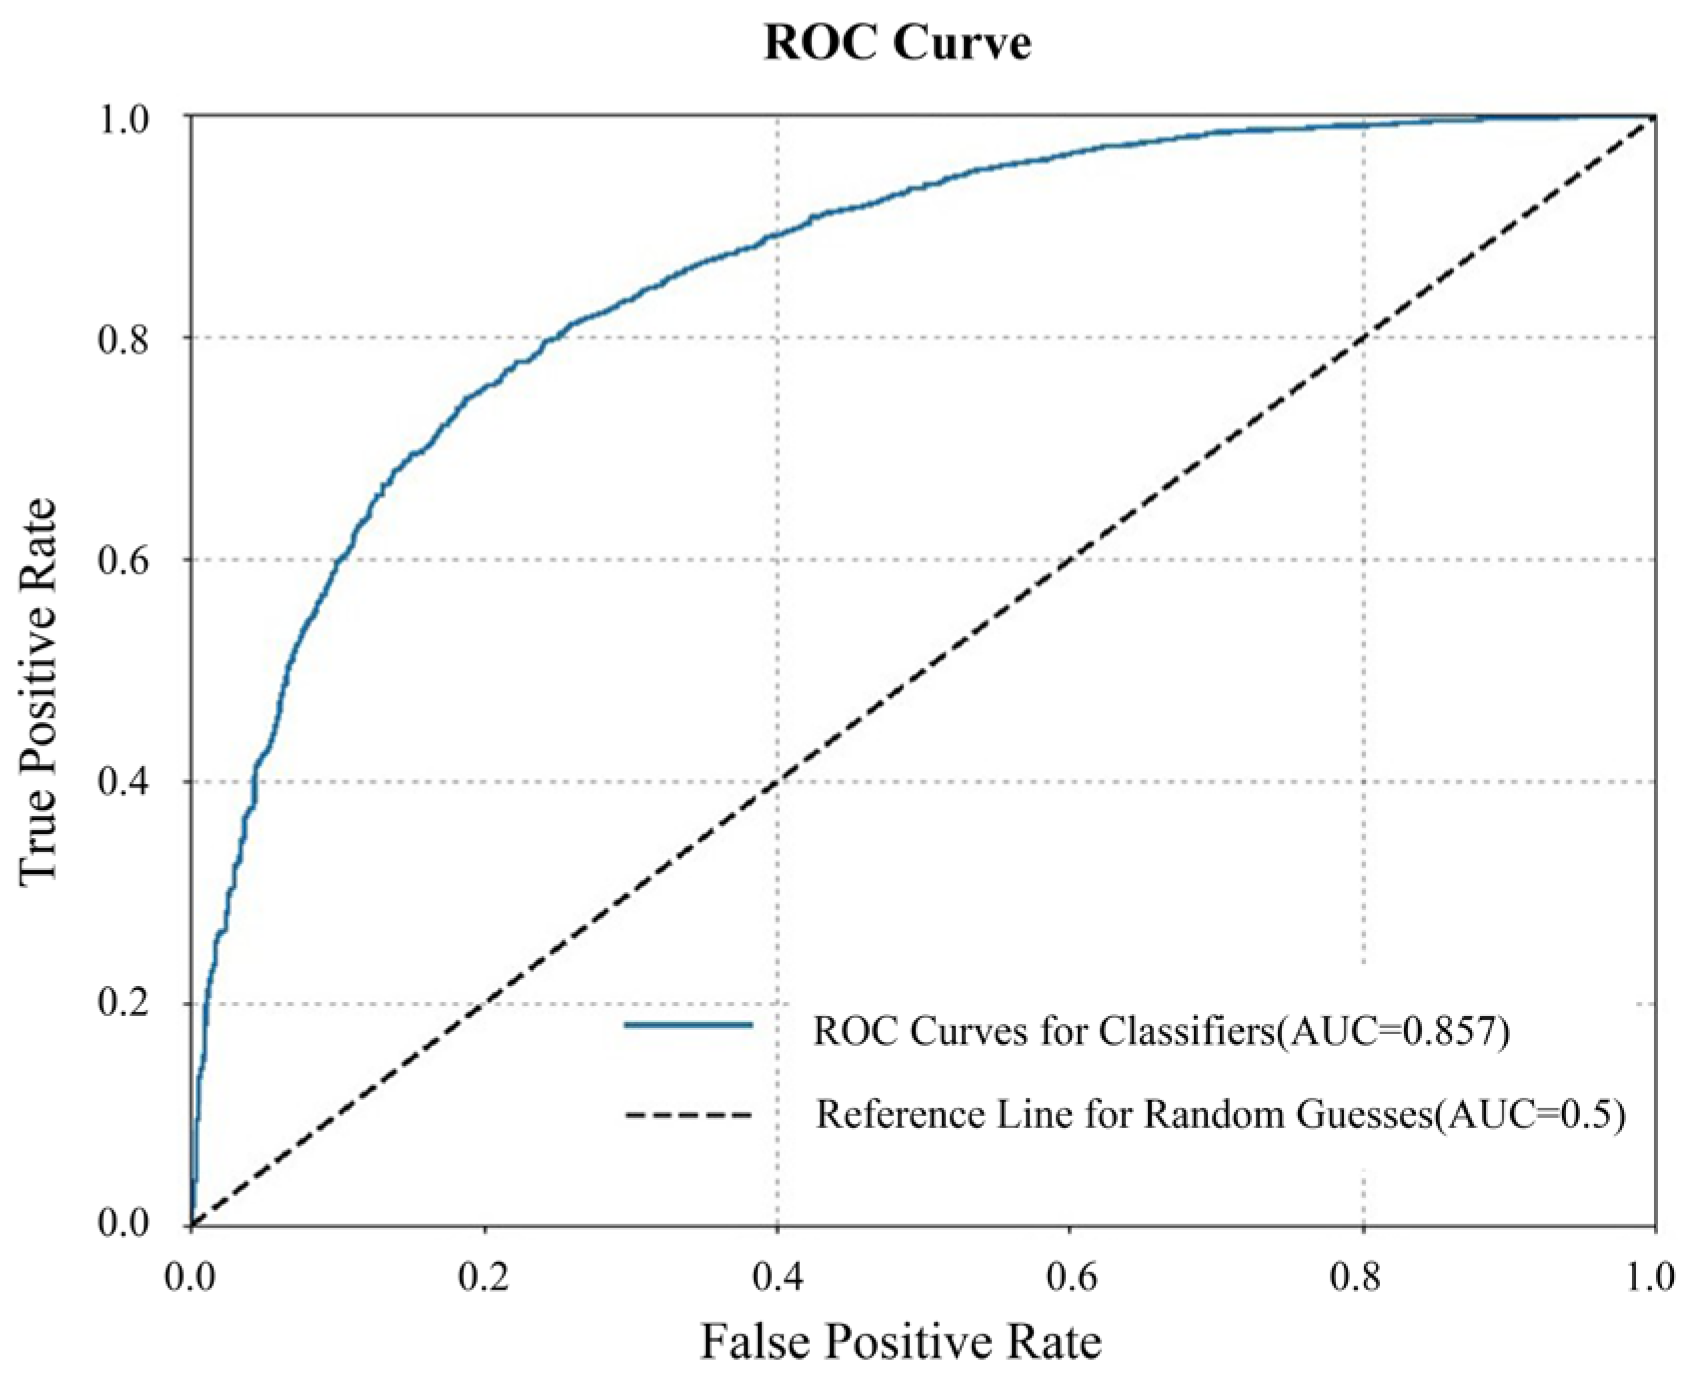
The Area under Curve (AUC) value of the Receiver Operating Characteristic (ROC) curve is used to quantify the performance of the model in our research [
57]. The AUC takes a value within 0.5–1, and the closer its value is to 1, the higher the diagnostic accuracy of the corresponding model.
Figure 12 shows the calculation results, where the AUC value is 0.857, indicating a good classification effect. This finding indicates that it is reasonable for the present study to classify building façades as “complex” and “simple” with a GGC of 1.2383.
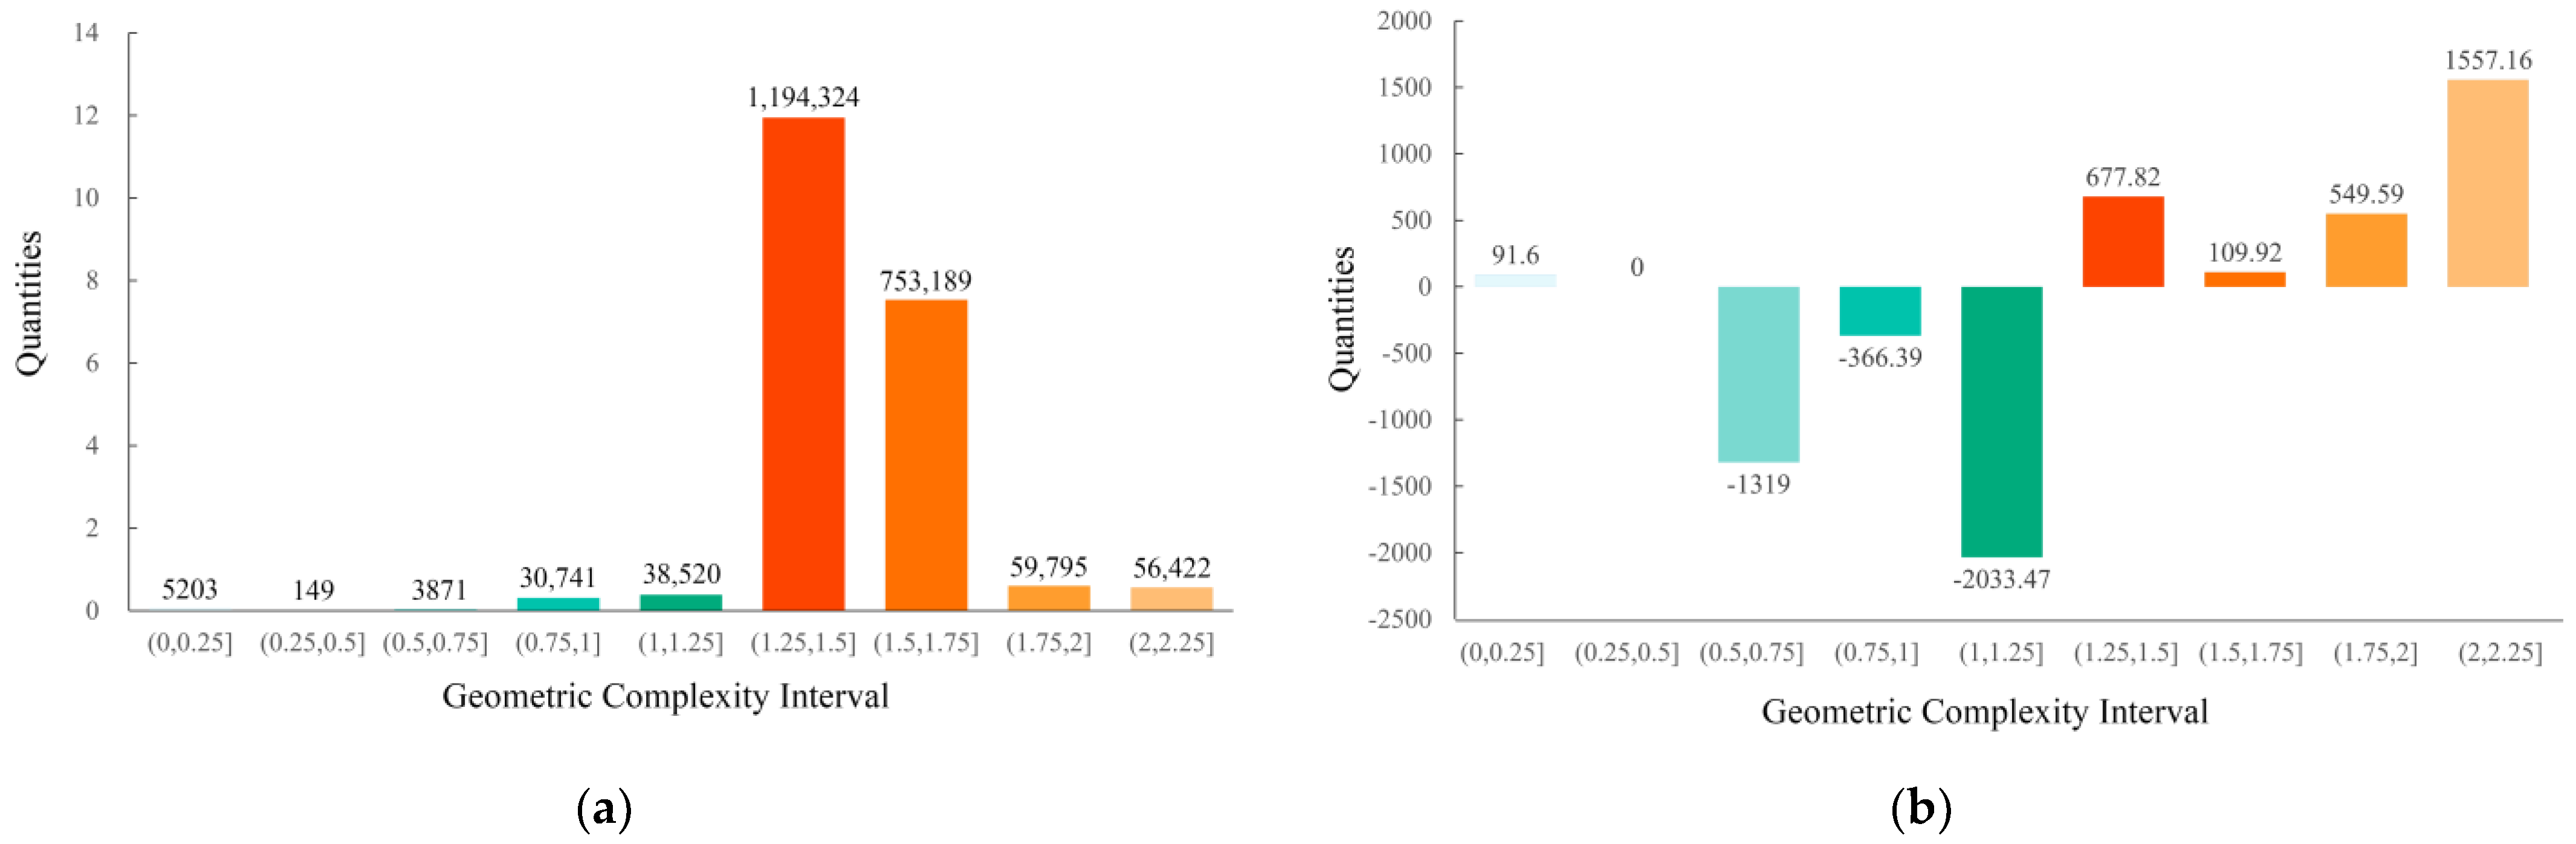
3.2.2. Characterisation of Visual Selective Preferences
The LGC and LGCVA data of all the complex buildings are statistically plotted together in a histogram. The results show that within the interval of 0–1.25, the majority of the percentage differences are negative, whereas within the interval above 1.25, the percentage differences are positive. This phenomenon indicates that the LGCVA attempts to make the low-complexity part of the building façades, which has a high complexity of its own, possess a larger proportion of the perceptual area. The visualisation is shown in
Figure 13.
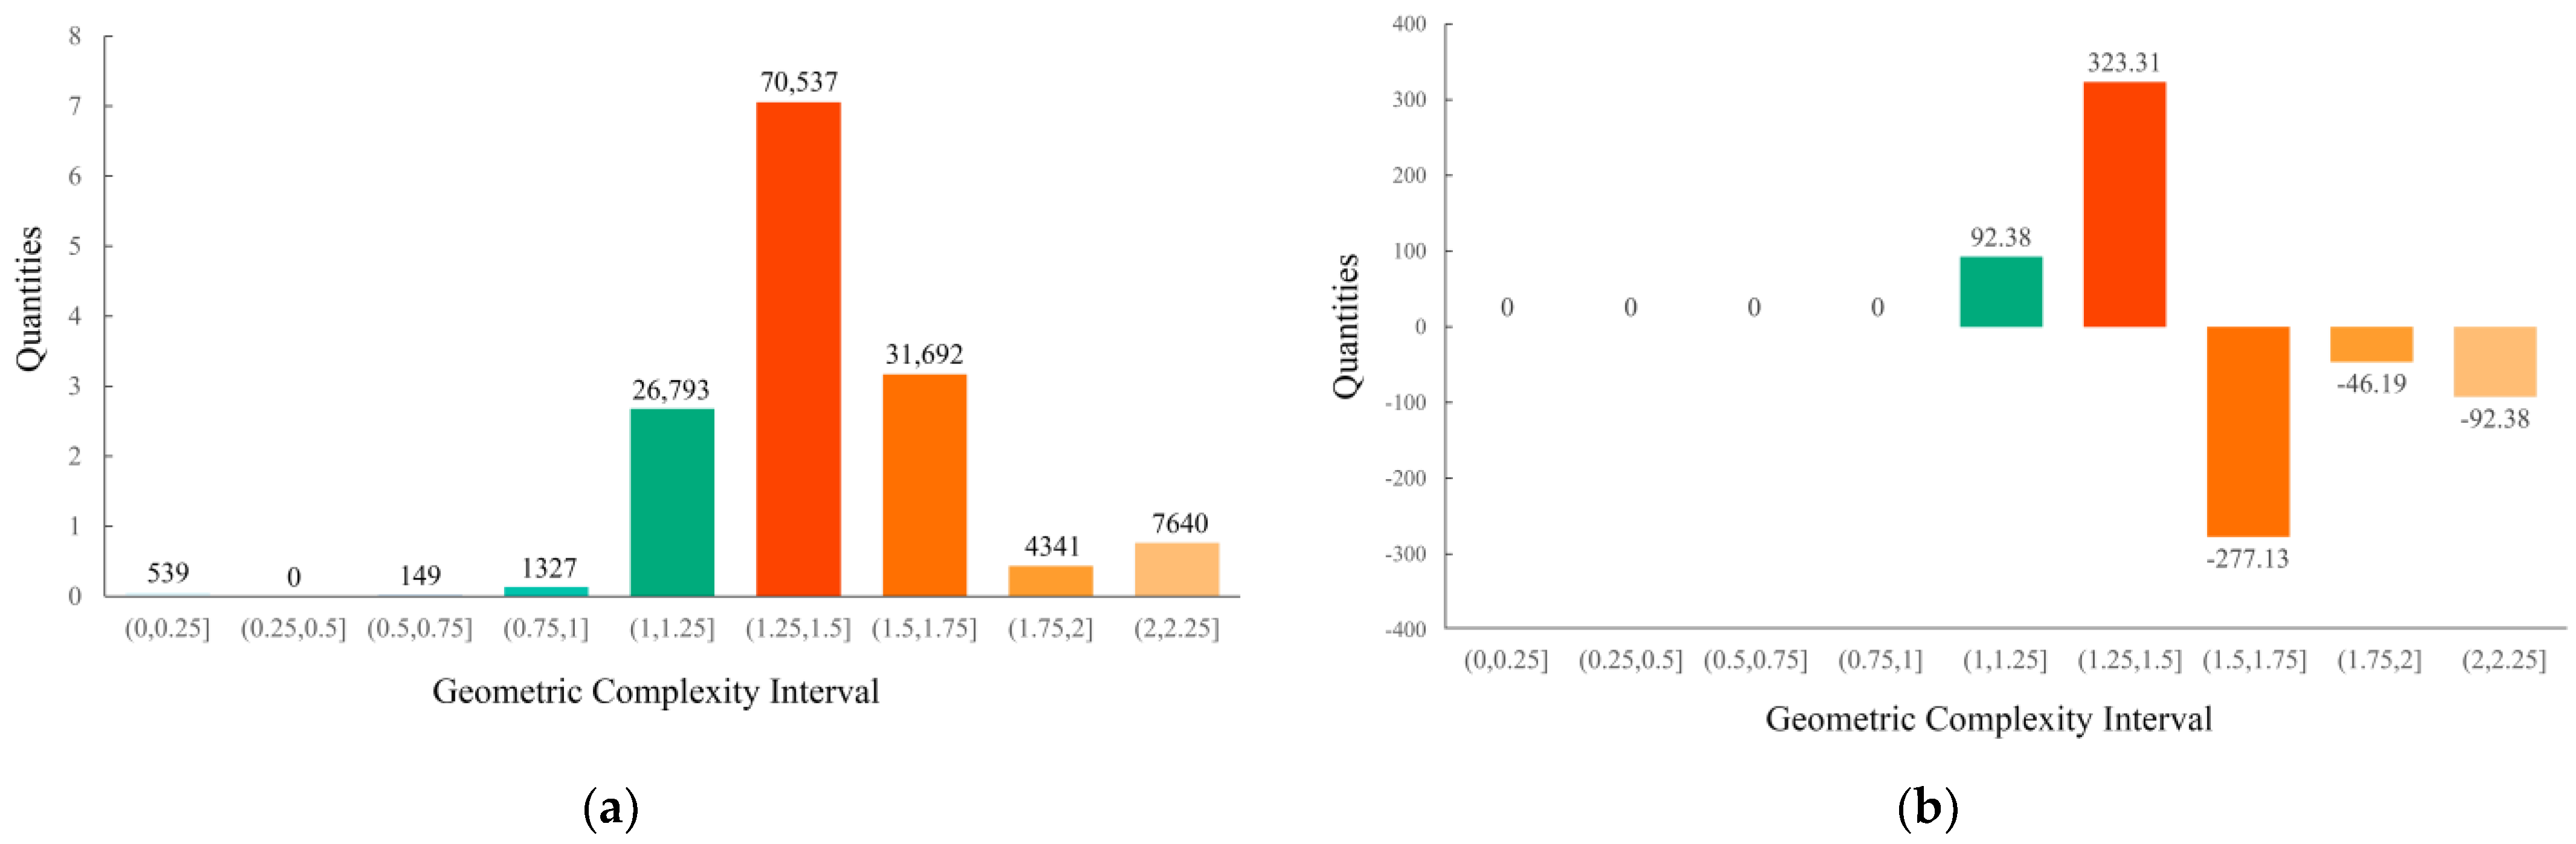
- 2.
Comparative analysis of the LGC and the LGCVA of simple building façades
As above, the LGC and the LGCVA of all the simple buildings are counted together to plot a histogram.
Figure 14a shows that within the interval of 1.25–1.5, the largest difference is found, followed by 1.5–1.75, which is in line with the statistical results obtained for complex buildings.
Figure 14b shows that within the interval of 0–1.5, the global accounted difference is positive, and in the interval above 1.5, the accounted difference is negative, which contradicts the statistical results obtained for complex buildings, indicating that the façade of a building has low complexity itself. This suggests that the use of the SalGAN model when looking at building façades that are themselves low in complexity is intended to increase the characteristics of the visual attention region that the high-complexity parts will occupy. The visualisation is shown in
Figure 14.
4. Discussion
Recent advances in deep learning have led to significant progress in analysing street view images. However, many studies still fail to incorporate robust statistical analyses and causal inferences. In particular, the correlations between the visual elements within street view images are often overlooked [
58]. The spatial dependencies between the locations of these images are also ignored. Moreover, critical factors beyond the physical space, such as human perception, are often excluded.
This study attempts to analyse the visual perceptions of streetscape images and identify these shortcomings. It compares building façades captured by machine vision and human perception. In our study, computer vision is employed to extract building façades, representing machine vision. The SalGAN model, in contrast, simulates human visual perception. This dual approach enables a quantitative comparison between the ways in which street view images are interpreted by both a computer and human eyes. A key finding of this study is the significant difference between the GGC (the global-level geometric complexity) and the GGCVA (the global-level geometric complexity of the visual attention region). By comparing the absolute value of the differences between the two, a clear boundary emerges at a GGC value of 1.2383. When the GGC exceeds this threshold, a sharp distinction appears between the building façades recognised by computer vision and those recognised by human vision. The results suggest that building façades can be divided into two categories, “simple” and “complex”, on the basis of their GGC values. A GGC value of 1.2383 serves as the dividing line. When a GGC is higher than this threshold, the GGCVA is lower than the GGC. As the GGC increases, the gap between the two measures widens. In contrast, when the GGC is lower than 1.2383, the GGCVA exceeds the GGC. This difference increases as the GGC of the building façades increases.
These findings underscore the significant differences between computer vision and human perceptions of building façades. Relying solely on machine vision to analyse urban features such as building façades may not enable the full capture of the subjective experience of human perception [
36]. This finding is similar to that of previous research, which indicates that objective measurements derived from street view images are insufficient for reflecting how humans perceive urban environments [
59]. Additionally, the current urban perception frameworks often fail to consider how human eyes evaluate individual elements within a street view image. For example, relying solely on the fractal dimension to describe architectural forms, or ignoring categories of building materials, may not recognise how human vision cognitively processes these structures [
60,
61]. This suggests that objective metrics alone cannot fully address the complexities of urban spatial perception. To improve the accuracy of urban perception research, it is essential to develop models that integrate the cognitive processes underlying human visual perception.
Furthermore, the use of the SalGAN model in this study revealed intriguing visual preference patterns. Specifically, when complex building façades are observed, the model exhibits an increased focus on simpler façades within the visual field. Conversely, when simpler façades are observed, the attention shifts towards more complex façades. This pattern suggests that the SalGAN model may capitalise on the inherent visual preference of the human eye to capture the visual attention region. It should be noted that instead of using the model to verify the inherent visual saliency characteristics of the human eye, we used the model to obtain the visual preference patterns of the human eye when observing building façades. Our results make a contribution to a deeper understanding of the visual saliency prediction model and provide greater interpretability in simulating human visual perception.
5. Conclusions
In the present study, we compare the differences between human eye vision and computer vision by quantifying visual perceptions of urban building façades. The visual perception process responds to GGC (the global-level geometric complexity), and significant perceptual differences are induced as the GGC changes. A critical value is obtained for the GGC, which can classify the building façades into two categories: “simple” and “complex”. When “simple” buildings are perceived, human eyes tend to focus on more intricate, localised regions; conversely, when “complex” buildings are perceived, greater attention is given to simpler components. This observation aligns with the characterisation of human visual selective preferences; however, the objectively measured geometric complexity of building façades by computer vision does not exhibit a similar pattern. This finding indicates that accounting for or disregarding the visual perception of human eyes when modelling can significantly impact the perceptions of urban space.
This research underscores the importance of human perception factors in the realm of urban spatial perception and contributes to the existing body of knowledge on the quantification of such perceptions. The study concludes that in the future, human perception-based fusion models can be further introduced to construct a more complete spatial perception model and enhance machine learning programs, leading to designs that are more in line with human behavioural and cognitive characteristics.
The limitations of the present study should also be explored and emphasised in future work. First, this study directly inputs the collected images for visual saliency detection purposes, but overall, it involves a statistical analysis of big data, and the trend of the analysed results still has credibility. Second, the study has focused only on empirical evidence derived from Nanshan District, Shenzhen. In the future, the proposed model can be applied to other cities to explore more universal visual perception laws. In addition, since the acquisition of street view images is affected by various factors such as lighting and weather, the results of human eye perception may also vary, so our analysis is somewhat time-sensitive and representative for a moment. We will utilise richer street view images for visual perception assessment, making the conclusions more comprehensive and generalisable. Finally, only a single visual saliency detection model has been chosen to simulate the human visual attention mechanism in this paper. We will include comparative studies involving different models to obtain more comprehensive and multidimensional analyses of data and conclusions.
Author Contributions
Conceptualization, J.Y. and C.-C.L.; methodology, C.-C.L. and C.T.; software, C.-C.L. and C.T.; validation, Y.W.; formal analysis, Y.W. and C.T.; investigation, J.Y., Y.W. and C.T.; resources, J.Y.; data curation, C.-C.L.; writing—original draft preparation, C.-C.L.; writing—review and editing, Y.W., C.T. and X.L.; visualization, Y.W. and C.T.; supervision, X.L.; project administration, X.L.; funding acquisition, J.Y. All authors have read and agreed to the published version of the manuscript.
Funding
This research was funded by the Shenzhen Stability Support Program (Grant No. [20220810221952002]).
Data Availability Statement
Data available on request due to restrictions.
Conflicts of Interest
The authors declare no conflicts of interest.
Abbreviations
The following abbreviations are used in this manuscript:
| OSM | OpenStreetMap |
| LGC | Local-level geometric complexity |
| GGC | Global-level geometric complexity |
| GGCVA | Global-level geometric complexity of the visual attention region |
| LGCVA | Local-level geometric complexity of the visual attention region |
| AUC | Area under Curve |
| ROC | Receiver Operating Characteristic |
References
- Merleau-Ponty, M. The World of Perception; Routledge: London, UK, 2004. [Google Scholar]
- Porzi, L.; Rota Bulò, S.; Lepri, B.; Ricci, E. Predicting and understanding urban perception with convolutional neural networks. In Proceedings of the 23rd ACM International Conference on Multimedia, Brisbane, Australia, 26–30 October 2015; pp. 139–148. [Google Scholar]
- Wei, J.; Yue, W.; Li, M.; Gao, J. Mapping human perception of urban landscape from street-view images: A deep-learning approach. Int. J. Appl. Earth Obs. Geoinf. 2022, 112, 102886. [Google Scholar] [CrossRef]
- Salesses, P.; Schechtner, K.; Hidalgo, C.A. The collaborative image of the city: Mapping the inequality of urban perception. PLoS ONE 2013, 8, e68400. [Google Scholar] [CrossRef] [PubMed]
- Van Kamp, I.; Leidelmeijer, K.; Marsman, G.; De Hollander, A. Urban environmental quality and human well-being: Towards a conceptual framework and demarcation of concepts; a literature study. Landsc. Urban Plan. 2003, 65, 5–18. [Google Scholar] [CrossRef]
- Ewing, R.; Handy, S. Measuring the unmeasurable: Urban design qualities related to walkability. J. Urban Des. 2009, 14, 65–84. [Google Scholar] [CrossRef]
- Dubey, A.; Naik, N.; Parikh, D.; Raskar, R.; Hidalgo, C.A. Deep learning the city: Quantifying urban perception at a global scale. In Computer Vision–ECCV 2016, Proceedings of the 14th European Conference, Amsterdam, The Netherlands, 11–14 October 2016, Proceedings, Part I 14; Springer: Cham, Switzerland, 2016; pp. 196–212. [Google Scholar]
- Hu, K.; Xu, Z.; Wang, X.; Wang, Y.; Li, H.; Zhang, Y. Research on street color environment perception based on CEP-KASS framework. Buildings 2023, 13, 2649. [Google Scholar] [CrossRef]
- Desimone, R.; Duncan, J. Neural mechanisms of selective visual attention. Annu. Rev. Neurosci. 1995, 18, 193–222. [Google Scholar] [CrossRef]
- Zhang, F.; Fan, Z.; Kang, Y.; Hu, Y.; Ratti, C. “Perception bias”: Deciphering a mismatch between urban crime and perception of safety. Landsc. Urban Plan. 2021, 207, 104003. [Google Scholar] [CrossRef]
- Wang, R.; Liu, Y.; Lu, Y.; Zhang, J.; Liu, P.; Yao, Y.; Grekousis, G. Perceptions of built environment and health outcomes for older Chinese in Beijing: A big data approach with street view images and deep learning technique. Comput. Environ. Urban Syst. 2019, 78, 101386. [Google Scholar] [CrossRef]
- Zhang, K.; Tang, X.; Zhao, Y.; Huang, B.; Huang, L.; Liu, M.; Luo, E.; Li, Y.; Jiang, T.; Zhang, L. Differing perceptions of the youth and the elderly regarding cultural ecosystem services in urban parks: An exploration of the tour experience. Sci. Total Environ. 2022, 821, 153388. [Google Scholar] [CrossRef]
- Qi, Y.; Yue, L.; Guo, T.; Zhou, D.; Ren, Y.; Wang, M.; Liu, Y.; Yang, Y. A Study on the Perception of Local Characteristics in Cultural Street Vending Spaces, Taking Xi’an Baxian Temple as an Example. Buildings 2024, 14, 192. [Google Scholar] [CrossRef]
- Cinnamon, J.; Jahiu, L. 360-degree video for virtual place-based research: A review and research agenda. Comput. Environ. Urban Syst. 2023, 106, 102044. [Google Scholar] [CrossRef]
- Yan, J.; Huang, X.; Wang, S.; He, Y.; Li, X.; Hohl, A.; Li, X.; Aly, M.; Lin, B. Toward a comprehensive understanding of eye-level urban greenness: A systematic review. Int. J. Digit. Earth 2023, 16, 4769–4789. [Google Scholar] [CrossRef]
- Meng, Y.; Li, Q.; Ji, X.; Yu, Y.; Yue, D.; Gan, M.; Wang, S.; Niu, J.; Fukuda, H. Research on campus space features and visual quality based on street view images: A case study on the chongshan campus of liaoning university. Buildings 2023, 13, 1332. [Google Scholar] [CrossRef]
- LeCun, Y.; Bengio, Y.; Hinton, G. Deep learning. Nature 2015, 521, 436–444. [Google Scholar] [CrossRef]
- Tang, F.; Zeng, P.; Wang, L.; Zhang, L.; Xu, W. Urban Perception Evaluation and Street Refinement Governance Supported by Street View Visual Elements Analysis. Remote Sens. 2024, 16, 3661. [Google Scholar] [CrossRef]
- Zhang, J.; Fukuda, T.; Yabuki, N. Development of a city-scale approach for façade color measurement with building functional classification using deep learning and street view images. ISPRS Int. J. Geo Inf. 2021, 10, 551. [Google Scholar] [CrossRef]
- He, J.; Zhang, J.; Yao, Y.; Li, X. Extracting human perceptions from street view images for better assessing urban renewal potential. Cities 2023, 134, 104189. [Google Scholar] [CrossRef]
- Glaser, M. The City at Eye Level: Lessons for Street Plinths; Eburon Uitgeverij BV: Utrecht, The Netherlands, 2012. [Google Scholar]
- Li, Y.; Li, M.; Xu, Y.; Tao, J. “Interface-element-perception” model to evaluation of urban sidewalk visual landscape in the core area of Beijing. Front. Archit. Res. 2024, 13, 960–977. [Google Scholar] [CrossRef]
- Ashihara, Y. The aesthetic townscape. J. Aesthet. Art Crit. 1986, 44, 416–417. [Google Scholar]
- Wang, R.; Huang, C.; Ye, Y. Measuring Street Quality: A Human-Centered Exploration Based on Multi-Sourced Data and Classical Urban Design Theories. Buildings 2024, 14, 3332. [Google Scholar] [CrossRef]
- He, N.; Li, G. Urban neighbourhood environment assessment based on street view image processing: A review of research trends. Environ. Chall. 2021, 4, 100090. [Google Scholar] [CrossRef]
- Li, Y.; Yabuki, N.; Fukuda, T. Measuring visual walkability perception using panoramic street view images, virtual reality, and deep learning. Sustain. Cities Soc. 2022, 86, 104140. [Google Scholar] [CrossRef]
- Lee, S.; Maisonneuve, N.; Crandall, D.; Efros, A.A.; Sivic, J. Linking past to present: Discovering style in two centuries of architecture. In Proceedings of the IEEE International Conference on Computational Photography, Houston, TX, USA, 24–26 April 2015. [Google Scholar]
- Liang, X.; Chang, J.H.; Gao, S.; Zhao, T.; Biljecki, F. Evaluating human perception of building exteriors using street view imagery. Build. Environ. 2024, 263, 111875. [Google Scholar] [CrossRef]
- Najar, K.; Nylander, O.; Woxnerud, W. Public’s Visual Preferences Survey Facilitates Community-Based Design and Color Standards Creation. Buildings 2024, 14, 2929. [Google Scholar] [CrossRef]
- Martinez, P.; Al-Hussein, M.; Ahmad, R. A scientometric analysis and critical review of computer vision applications for construction. Autom. Constr. 2019, 107, 102947. [Google Scholar] [CrossRef]
- Jin, X.; Wang, J. Assessing Linear Urban Landscape from dynamic visual perception based on urban morphology. Front. Archit. Res. 2021, 10, 202–219. [Google Scholar] [CrossRef]
- Wang, L.; Han, X.; He, J.; Jung, T. Measuring residents’ perceptions of city streets to inform better street planning through deep learning and space syntax. ISPRS J. Photogramm. Remote Sens. 2022, 190, 215–230. [Google Scholar] [CrossRef]
- Ito, K.; Kang, Y.; Zhang, Y.; Zhang, F.; Biljecki, F. Understanding urban perception with visual data: A systematic review. Cities 2024, 152, 105169. [Google Scholar] [CrossRef]
- Liang, X.; Zhao, T.; Biljecki, F. Revealing spatio-temporal evolution of urban visual environments with street view imagery. Landsc. Urban Plan. 2023, 237, 104802. [Google Scholar] [CrossRef]
- Zhang, J.; Yu, Z.; Li, Y.; Wang, X. Uncovering Bias in Objective Mapping and Subjective Perception of Urban Building Functionality: A Machine Learning Approach to Urban Spatial Perception. Land 2023, 12, 1322. [Google Scholar] [CrossRef]
- Qiu, W.; Li, W.; Liu, X.; Zhang, Z.; Li, X.; Huang, X. Subjective and objective measures of streetscape perceptions: Relationships with property value in Shanghai. Cities 2023, 132, 104037. [Google Scholar] [CrossRef]
- Available online: https://www.szns.gov.cn/ (accessed on 25 January 2024).
- Kang, J.; Körner, M.; Wang, Y.; Taubenböck, H.; Zhu, X.X. Building instance classification using street view images. ISPRS J. Photogramm. Remote Sens. 2018, 145, 44–59. [Google Scholar] [CrossRef]
- Yang, R.; Deng, X.; Shi, H.; Wang, Z.; He, H.; Xu, J.; Xiao, Y. A novel approach for assessing color harmony of historical buildings via street view image. Front. Archit. Res. 2024, 13, 764–775. [Google Scholar] [CrossRef]
- Fu, X.; Jia, T.; Zhang, X.; Li, S.; Zhang, Y. Do street-level scene perceptions affect housing prices in Chinese megacities? An analysis using open access datasets and deep learning. PLoS ONE 2019, 14, e0217505. [Google Scholar] [CrossRef]
- Kastner, S.; Ungerleider, L.G. Mechanisms of visual attention in the human cortex. Annu. Rev. Neurosci. 2000, 23, 315–341. [Google Scholar]
- Kadir, T.; Brady, M. Saliency, scale and image description. Int. J. Comput. Vis. 2001, 45, 83–105. [Google Scholar] [CrossRef]
- Torralba, A.; Oliva, A.; Castelhano, M.S.; Henderson, J.M. Contextual guidance of eye movements and attention in real-world scenes: The role of global features in object search. Psychol. Rev. 2006, 113, 766. [Google Scholar] [CrossRef]
- Vinke, L.N.; Bloem, I.M.; Ling, S. Saturating nonlinearities of contrast response in human visual cortex. J. Neurosci. 2022, 42, 1292–1302. [Google Scholar] [CrossRef]
- Chou, C.-H.; Li, Y.-C. A perceptually tuned subband image coder based on the measure of just-noticeable-distortion profile. IEEE Trans. Circuits Syst. Video Technol. 1995, 5, 467–476. [Google Scholar] [CrossRef]
- Senders, J.W. Distribution of visual attention in static and dynamic displays. In Proceedings of the Human Vision and Electronic Imaging II, San Jose, CA, USA, 10–13 February 1997; pp. 186–194. [Google Scholar]
- Macknik, S.L.; Livingstone, M.S. Neuronal correlates of visibility and invisibility in the primate visual system. Nat. Neurosci. 1998, 1, 144–149. [Google Scholar] [CrossRef]
- Zhang, X.; Lin, W.; Xue, P. Just-noticeable difference estimation with pixels in images. J. Vis. Commun. Image Represent. 2008, 19, 30–41. [Google Scholar] [CrossRef]
- Simonyan, K.; Zisserman, A. Very deep convolutional networks for large-scale image recognition. arXiv 2014, arXiv:1409.1556. [Google Scholar]
- Pan, J.; Ferrer, C.C.; McGuinness, K.; O’Connor, N.E.; Torres, J.; Sayrol, E.; Giro-i-Nieto, X. Salgan: Visual saliency prediction with generative adversarial networks. arXiv 2017, arXiv:1701.01081. [Google Scholar]
- Pan, J.; Sayrol, E.; Nieto, X.G.-i.; Ferrer, C.C.; Torres, J.; McGuinness, K.; OConnor, N.E. Salgan: Visual saliency prediction with adversarial networks. In Proceedings of the CVPR Scene Understanding Workshop (SUNw), Honolulu, HI, USA, 21–26 July 2017. [Google Scholar]
- Cong, R.; Lei, J.; Fu, H.; Cheng, M.-M.; Lin, W.; Huang, Q. Review of visual saliency detection with comprehensive information. IEEE Trans. Circuits Syst. Video Technol. 2018, 29, 2941–2959. [Google Scholar] [CrossRef]
- Hausdorff, F. Dimension und äußeres Maß. Math. Ann. 1918, 79, 157–179. [Google Scholar] [CrossRef]
- Mandelbrot, B.B. The Fractal Geometry of Nature/Revised and Enlarged Edition; W.H. Freeman and Co.: New York, NY, USA, 1983. [Google Scholar]
- Peitgen, H.-O.; Jürgens, H.; Saupe, D.; Feigenbaum, M.J. Chaos and Fractals: New Frontiers of Science; Springer: Berlin/Heidelberg, Germany, 2004; Volume 106. [Google Scholar]
- Bovill, C. Fractal Geometry in Architecture and Design; Birkhäuser: Boston, MA, USA, 1996. [Google Scholar]
- Judd, T. Understanding and Predicting Where People Look in Images. Ph.D. Thesis, Massachusetts Institute of Technology, Cambridge, MA, USA, 2011. [Google Scholar]
- Ogawa, Y.; Oki, T.; Zhao, C.; Sekimoto, Y.; Shimizu, C. Evaluating the subjective perceptions of streetscapes using street-view images. Landsc. Urban Plan. 2024, 247, 105073. [Google Scholar] [CrossRef]
- Rossetti, T.; Lobel, H.; Rocco, V.; Hurtubia, R. Explaining subjective perceptions of public spaces as a function of the built environment: A massive data approach. Landsc. Urban Plan. 2019, 181, 169–178. [Google Scholar] [CrossRef]
- Ma, L.; Zhang, H.; Lu, M. Building’s fractal dimension trend and its application in visual complexity map. Build. Environ. 2020, 178, 106925. [Google Scholar] [CrossRef]
- Chamasemani, N.F.; Kelishadi, M.; Mostafaei, H.; Najvani, M.A.D.; Mashayekhi, M. Environmental Impacts of Reinforced Concrete Buildings: Comparing Common and Sustainable Materials: A Case Study. Constr. Mater. 2023, 4, 1–15. [Google Scholar] [CrossRef]
Figure 1.
Research framework of the present study.
Figure 1.
Research framework of the present study.
Figure 2.
Study area location: (a) China; (b) Guangdong Province; (c) Shenzhen City; (d) Nanshan District.
Figure 2.
Study area location: (a) China; (b) Guangdong Province; (c) Shenzhen City; (d) Nanshan District.
Figure 3.
Spatial distribution of the shooting points used to obtain street view images in Nanshan District, Shenzhen.
Figure 3.
Spatial distribution of the shooting points used to obtain street view images in Nanshan District, Shenzhen.
Figure 4.
Example of the building façade image data construction process.
Figure 4.
Example of the building façade image data construction process.
Figure 5.
Correspondence between different levels of visual attention and grayscale values.
Figure 5.
Correspondence between different levels of visual attention and grayscale values.
Figure 6.
Example of the process of extracting visual attention region.
Figure 6.
Example of the process of extracting visual attention region.
Figure 7.
Example of the geometric profile edges of the extracted building façades and building façades in the visual attention region.
Figure 7.
Example of the geometric profile edges of the extracted building façades and building façades in the visual attention region.
Figure 8.
Example visualisations of the local-level fractal dimension (di) measurement results.
Figure 8.
Example visualisations of the local-level fractal dimension (di) measurement results.
Figure 9.
Example mesh division visualisation of the global-level fractal dimension (D) measurement results.
Figure 9.
Example mesh division visualisation of the global-level fractal dimension (D) measurement results.
Figure 10.
Relationship between the GGC and the GGCVA: (a) scattered data visualisation and fitting plots; (b) visualisation of the data for distinguishing a difference of 0.
Figure 10.
Relationship between the GGC and the GGCVA: (a) scattered data visualisation and fitting plots; (b) visualisation of the data for distinguishing a difference of 0.
Figure 11.
Relationship between the GGC and the absolute value of the geometric complexity difference.
Figure 11.
Relationship between the GGC and the absolute value of the geometric complexity difference.
Figure 12.
ROC curve for determining the reasonableness of the dichotomous approach.
Figure 12.
ROC curve for determining the reasonableness of the dichotomous approach.
Figure 13.
Differences among the numbers of grids for complex buildings within the 9 intervals: (a) LGC; (b) LGCVA (difference in quantity = number of building façade grids − number of building façade grids in the visual attention region; percentage difference = percentage of the number of building façade grids − percentage of the number of building façade grids in the visual attention region).
Figure 14.
Differences among the numbers of grids for simple buildings within the 9 intervals: (a) LGC; (b) LGCVA (difference in quantity = number of building façade grids − number of building façade grids in the visual attention region; percentage difference = percentage of the number of building façade grids − percentage of the number of building façade grids in the visual attention region).
Table 1.
Example of local-level and global-level fractal dimension (di and D) calculation results.
Table 1.
Example of local-level and global-level fractal dimension (di and D) calculation results.
| Measurement | Fractal Dimension | Minimum Grid Size | Maximum Grid Size | R2 |
|---|
| Local-level d1 | 1.17 | 1 | 2 | 1.00 |
| Local-level d2 | 1.12 | 1 | 3 | 0.99 |
| Local-level d3 | 0.89 | 1 | 2 | 1.00 |
| Local-level d4 | 1.44 | 1 | 6 | 0.94 |
| Local-level d5 | 1.61 | 1 | 4 | 0.99 |
| Local-level d6 | 1.54 | 1 | 5 | 0.99 |
| Local-level d7 | 1.44 | 1 | 5 | 0.99 |
| Local-level d8 | 1.30 | 1 | 6 | 0.99 |
| Local-level d9 | 1.34 | 1 | 5 | 0.99 |
| Local-level d10 | 1.26 | 1 | 5 | 0.95 |
| Global-level D | 1.23 | 5 | 32 | 0.99 |
Table 2.
Example geometric complexity measurements for shooting points.
Table 2.
Example geometric complexity measurements for shooting points.
| Geometric Complexity | 0° Viewing Angle | 90° Viewing Angle | 180° Viewing Angle | 270° Viewing Angle | The Current
Shooting Point
(Mean Value) |
|---|
| GGC | 1.5361 | 1.4879 | 1.4167 | 15998 | 1.510125 |
| GGCVA | 1.4348 | 1.3158 | 1.1486 | 1.2534 | 1.28815 |
| Disclaimer/Publisher’s Note: The statements, opinions and data contained in all publications are solely those of the individual author(s) and contributor(s) and not of MDPI and/or the editor(s). MDPI and/or the editor(s) disclaim responsibility for any injury to people or property resulting from any ideas, methods, instructions or products referred to in the content. |
© 2025 by the authors. Licensee MDPI, Basel, Switzerland. This article is an open access article distributed under the terms and conditions of the Creative Commons Attribution (CC BY) license (https://creativecommons.org/licenses/by/4.0/).


