Article

Spatio-Temporal Analysis of Beijing Residents’ Lifestyles: Data-Driven Insights into Apartment Interior Design

Academic of Arts and Design, Beijing City University, Beijing 101309, China
*
Author to whom correspondence should be addressed.
Buildings 2025, 15(4), 576; https://doi.org/10.3390/buildings15040576
Submission received: 30 December 2024 / Revised: 22 January 2025 / Accepted: 11 February 2025 / Published: 13 February 2025
(This article belongs to the Special Issue Advances of Healthy Environment Design in Urban Development)

Abstract

The urbanization of Beijing has precipitated a shift in the design of living spaces, with the focus transitioning from the design of new houses to existing residential properties. The concept of the living environment is inherently multifaceted, evolving in response to societal and lifestyle shifts. The employment of computer-assisted observation in acquiring lifestyle data about residential behavior circumvents the subjectivity inherent in questionnaires, thereby providing a novel approach to considering user behavior within the design process. This observational study utilizes video data collected by the Oriental Culture & Design Center, offering a comprehensive depiction of the daily lives of Beijing residents. The Noldus Observer XT program was utilized to encode and analyze the data, thereby facilitating the acquisition of insights into urban dwelling patterns in China. Over 14 days, 53,550 behavioral codes were recorded for six households, meticulously organized axially based on a 24 h cycle to capture the behavioral facts of living spaces. Through the synthesis of quantitative data analysis and qualitative observations, this study aims to provide a comprehensive overview of the general lifestyle patterns exhibited by these urban residents. In addition, based on the insights gained, we propose four directions for the future design of living spaces. This comprehensive temporal dataset on living behaviors offers significant data support for design practitioners and researchers developing residential spaces. This study’s findings can optimize living environments for mental health and well-being by providing empirical data and design recommendations grounded in real-life observations.

1. Introduction

In the context of Beijing’s rapid urbanization, there has been a shift in the residential design paradigm, with an increasing emphasis on the renovation of existing housing, particularly in established districts. While this transition has addressed numerous pressing concerns, the intricacies inherent in the process necessitate a nuanced approach. The interplay between housing ownership patterns and the heterogeneity of residents’ demands poses substantial challenges, impeding the efficacy of government-funded renovations in addressing all issues concurrently. Consequently, a considerable gap persists in the systematic enhancement in housing quality. Concurrently, families with existing children express a heightened demand for social housing [1]. The design and remodeling of existing housing by families on their own initiative continue to be the mainstay of residential design.
Domestic spaces reflect people’s physical and spiritual needs through various human activities and are where people spend most of their lives [2]. The built environment influences people’s productivity and well-being while satisfying safety [3,4,5]. User-centered design (UCD) is increasingly recognized as necessary to provide occupants with a comfortable living experience and achieve the design of living spaces [6,7]. China abolished its long-standing “one-child policy” and, starting in 2016, adopted the “two-child policy” to address declining birth rates [8]. The relationship between parents and children is much closer in Chinese families, and family space is an important entry point for studying living space [9].
While emphasizing dwelling dimensions holds significance, the cultural relativist paradigm underscores the imperative of investigating need fulfillment within the framework of culturally specific norms [10]. Consequently, user-centered design transforms an approach encompassing both external factors and social and cultural facets centered around the user [11]. Nevertheless, establishing a direct correlation between culture and the examination of living spaces proves implausible; instead, it necessitates scrutiny through distinct variables [12]. The daily activity patterns of residents are very regular and are closely related to land use and urban built environments [13]. Given that the amalgamation of various variables configures the living milieu, a profound understanding of user culture, the fulfillment of user requisites, and the extraction of user attributes becomes indispensable in residential space design [14]. From a consumer standpoint, delving into user culture constitutes a pivotal aspect to contemplate in design [15]. Hence, exploring the nexus between culture and the design of living spaces should scrutinize user-centricity and living behaviors as the nexus connecting the investigation of housing and its associated design domains.
In contrast, for the design of living spaces, the personal experience of the user’s perspective and the information received from the user may not describe their actual needs [16]. User observation, a core method of user research, consists of observing phenomena that directly reflect the behavior of the observed, and researchers use observation to derive a general understanding of specific activities and environments to help develop designs [17].
Owing to the difficulty of obtaining observational data about living spaces, a lot of data are needed to analyze the overall picture of life. Currently, only some existing user observations are carried out to study the generalization of living spaces. Inadequate attention to users in living spaces may lead to incorrect design decisions and development assumptions [18]. Accordingly, furniture design for living spaces needs to systematically consider the user’s needs and incorporate relevant design criteria to meet the user’s needs.
In this study, the non-participatory observation of stable families with children in Beijing was conducted, and the data were coded and transcribed through the Noldus Observer XT. Lifestyle data were then visualized to obtain an analyzable lifestyle map. By examining the lifestyle data from different perspectives, this study proposes design insights and suggests paths for future home remodeling that families and design firms can explore and consider.

2. Materials and Methods

2.1. Ethnographic User Observation

User-centered research methods can be divided into methods for communicating with the user, methods for investigating what users do, and methods for analyzing what users do, including communicating with the user [19]. User observation is the first step in driving innovation [20]. Widely used in all phases of design [21], user observation can be broadly classified into three categories: Type A, matter extraction (hypothesis search); Type B, hypothesis validation; and Type C, effect confirmation [22]. Type A is an effective method for users that need research in furniture and living space design derivation. This study uses an ethnographic user observation method to derive users’ hidden needs and provide a database from which designers and researchers can obtain hypotheses.
Ethnographic-based user observation studies have been widely used in the study of living space [23,24,25], dating back to the study of kitchens by the Viennese architect Margarete Schutte Lihotzky in 1926 [26]. In such an observation process, the collaboration-based user observation process is optimized through memos and the researcher’s notes [27]. Moreover, in ethnographic observations, the considerations of use and culture influence the conduct of research [28,29].
Figure 1 represents the understanding of the user’s lifestyle in the living space based on the framework of the “user–space–object” relationship of the living culture, and by observing these three factors, we can understand the ideology of the living culture and people’s lifestyles to export the direction of interior design better.

2.2. Noldus Observer XT

To enhance the efficacy of the extant user observation methodology within residential environments, this paper improves a user observation framework grounded in user culture, supplemented by the application of Observer XT 16 software. Leveraging computer-aided user observation facilitates the expeditious acquisition of profound insights into user behavior and their interactions with computing systems during the developmental phase of exporting design direction [30]. This study systematically categorizes coding schemas, observational data, independent variables, data filters, and analytical outcomes from video data sourced from the OCDC. Filters can be intricately devised based on an amalgamation of independent variables, behavioral parameters, and temporal criteria, offering a versatile toolset for designers and researchers.
The Observer XT is a behavioral coding and analysis software that supports all research project steps, including coding scheme development, data entry, data management, data analysis, and researcher data sharing [31]. It has been applied in a range of user research processes, such as the tracking of the behaviors of children on the autism spectrum [32], classroom acoustical design and repetitive behaviors in children with autism [33], pilot behavior [34], and the driver–vehicle interface [35]. There is also a large volume of research on living spaces for furniture design and space planning [36,37].

2.3. Sample Selection

The spatial distribution reveals that the hotspots of the residents’ daily activities are mainly concentrated in the central city, which is located on Fifth Ring Road [38]. To understand the actual usage of living space for a nuclear family in Beijing and to obtain more stable residential lifestyle data, considering the problem of population flow in Beijing, this research surveyed the state of affairs of families with children living in two- and three-bedroom apartments. The survey chose 25 typical families living around Fifth Ring in Beijing. The sample households were divided into four groups according to the children’s age. Table 1, Table 2, Table 3 and Table 4 describe the household code, household size, and the age of the children for the selected households. At the same time, semi-structured interviews were conducted with the users of each household to understand their perceptions of the space.
During the interviews, it was ascertained that in Group D families, the age of the children, the children’s residence in school, and the change in their learning situation had led to a decrease in parent–child interactions. Consequently, the present study was videotaped, and stratified random sampling was used based on three non-overlapping groups of children’s age strata that had previously been delineated. Simple random sampling was conducted within each stratum in Groups A, B, and C.
Regarding the protection of participants’ privacy, a series of rigorous measures was implemented. The process of obtaining informed consent from participants was elucidated in detail, ensuring their voluntary participation in this study after comprehending the research purposes, data usage, storage, and potential sharing methods. To mitigate the privacy concerns associated with the 24 h video-recording in private household environments, we strictly limited the scope and duration of recording, collecting only the necessary data for this study. This study endeavored to minimize observer effects when video-recording family activities, and unnatural behaviors were reduced by familiarizing participants with the video equipment before recording.
Problematic parts were removed by filming from fixed cameras in households and recording the residential life of Beijing residents over 24 h for 21 days to screen the image data. To obtain more regular lifestyle videos, the shooting time was chosen to be March-April, avoiding children’s vacations. Finally, 14 days of video from each household was selected as the information used for the following analysis step. The camera arrangement is shown in Table 5.
In this research, participants were protected by blurring video data, removing facial recognition information, and deleting or coding any information that could identify the participants.

2.4. Setting Code Schema

According to Figure 2a, studies on lifestyle types were divided by OCDC in 2011, and the behavioral classification was updated based on the observed life videos. A thorough review of the videos was conducted, and the various behaviors exhibited by the subjects were meticulously documented using a card-based system. Following this, card clustering was used to systematically group the behaviors into 11 main behavior categories and 40 sub-behavior codes. Most of the behavioral activities in the living space were covered. When behaviors did not fit neatly into these categories, they were recorded in the INSIGHT column. The behavior card classification method generated 11 main behaviors.
Table 6 shows the coding settings for data input, mainly considering the recorded codes as user, behavior, space, and object codes.
After obtaining licenses from Hanssem and obtaining approval from OCDC, the videos were coded by 11 researchers affiliated with the Graduate School of Techno Design at Kookmin University in 2022. Trained researchers were assigned to code the video materials using the Noldus Observer XT. Before initiating the initial round of video observation, a card sorting method was employed to convene all the video observation team members for a collective discussion and establish a behavioral code, as shown in Table 7, through the typing of the behaviors. This approach was adopted to mitigate potential observer bias, ensuring the clear delineation of the behaviors to be observed and the norms for their documentation. Table 7 describes the behavioral codes, sub-behavioral codes, and descriptions of each behavior that help the researcher better understand this study when recording and reviewing.

2.5. Observation Process

Entering the code of observation can be conducted quickly via shortcut keys. It is also possible to adjust the pace of observation recording, slowing down or speeding up according to different behavioral characteristics. The position of the image can be adjusted via the progress bar to repeat or confirm the observation. It is also possible to click on the code of each entry to find the impact at that time. Take the example of the content shown in Figure 3, which shows the mother finishing eating, feeding her child, and leaving the living room.
Researchers were trained to initiate the observation coding process. Utilizing the designated behavioral coding schema, the researchers meticulously documented each transition of the participants. The behavioral codes were recorded in the following sequence for each behavior in a single observation sequence: user–behavior–sub-behavior–space–object–insight. Researchers are instructed to record the facts of the behavior through observation rather than making judgments about the behavior. Insights are only added as additional data in later data analysis.

3. Results

3.1. Living Behavior Dataset

A total of 53,550 coded records were recorded in this Beijing resident life study. The research objects could be identified based on the different data models for the subsequent, more focused, qualitative analysis. The data were exported into Excel (Table 8), and the data were filtered and counted after fixing the variables according to the different studies.
  • The Excel file contains information about the behavior of the users in the observation, as well as the space and the objects used.
  • The “Case Code” column shows the households’ coding and the recording date, with a total of six household codes: ab2.01; c3.04; a2.02; c2.02; b2.01; and c3.02. Each household contains 14 days of data in the format xx months xx day.
  • The “Time” column indicates when the behavior occurred in the hour: minute: second format in 24 h format.
  • The “Duration” column records the duration of the behavior; the duration is only present in the code of the start of the behavior, and the data are blank in the stop code.
  • The “User” column records the emitter of the behavior.
  • The “Behavior” column indicates the specific behavior performed, which is divided into 41 types and grouped into 11 main behavior categories (specific codes are detailed in Table 6).
  • The “Space” column indicates where the behavior occurred.
  • The “Start–Stop” column expresses the start attribute of the behavior, divided into start and stop.
  • The “Insight” column records the researcher’s perception of the behavior during observation.

3.2. Behavior Duration and Frequency Data

Data filtered by workday–weekend in the living room show the total duration of each family member’s behavior in the living room (in minutes) and its proportion of a member’s total usage time of the space during the same period. The top four behaviors with the longest total duration are included in Table 9. The behaviors in the living room on weekdays are mainly concentrated on RE (c3.04; a2.02; b2.01), CM (a2.02; c2.02), UO (ab2.01; b2.01), and EA (c3.04; a2.02; b2.01). The living room activities on weekends are diverse. However, the proportion of RE behaviors increases overall. The children’s living room use behaviors are more similar: in both cases, they are dominated by resting behaviors (ab2.01–0.74; c3.04–0.64; a2.02–0.67; b2.01–0.61; c3.02–0.29).

3.3. User Behavior Timeline Data

As illustrated in Figure 4, the Observer XT program enables the visualization of data results and the acquisition of a timeline of user behavior. The primary intervals of the father’s family activities are visible, and the associated behaviors are color-coded. This arrangement provides a convenient foundation for the analysis of future research on different types of behaviors. For instance, composite behavioral research can concentrate on intervals characterized by poor spatial repetition and repeated behavioral crossover, facilitating more profound observations to derive insights for analyzing user problems and characteristics. Visual data analysis facilitates designers’ research and enables communication between designers and users.
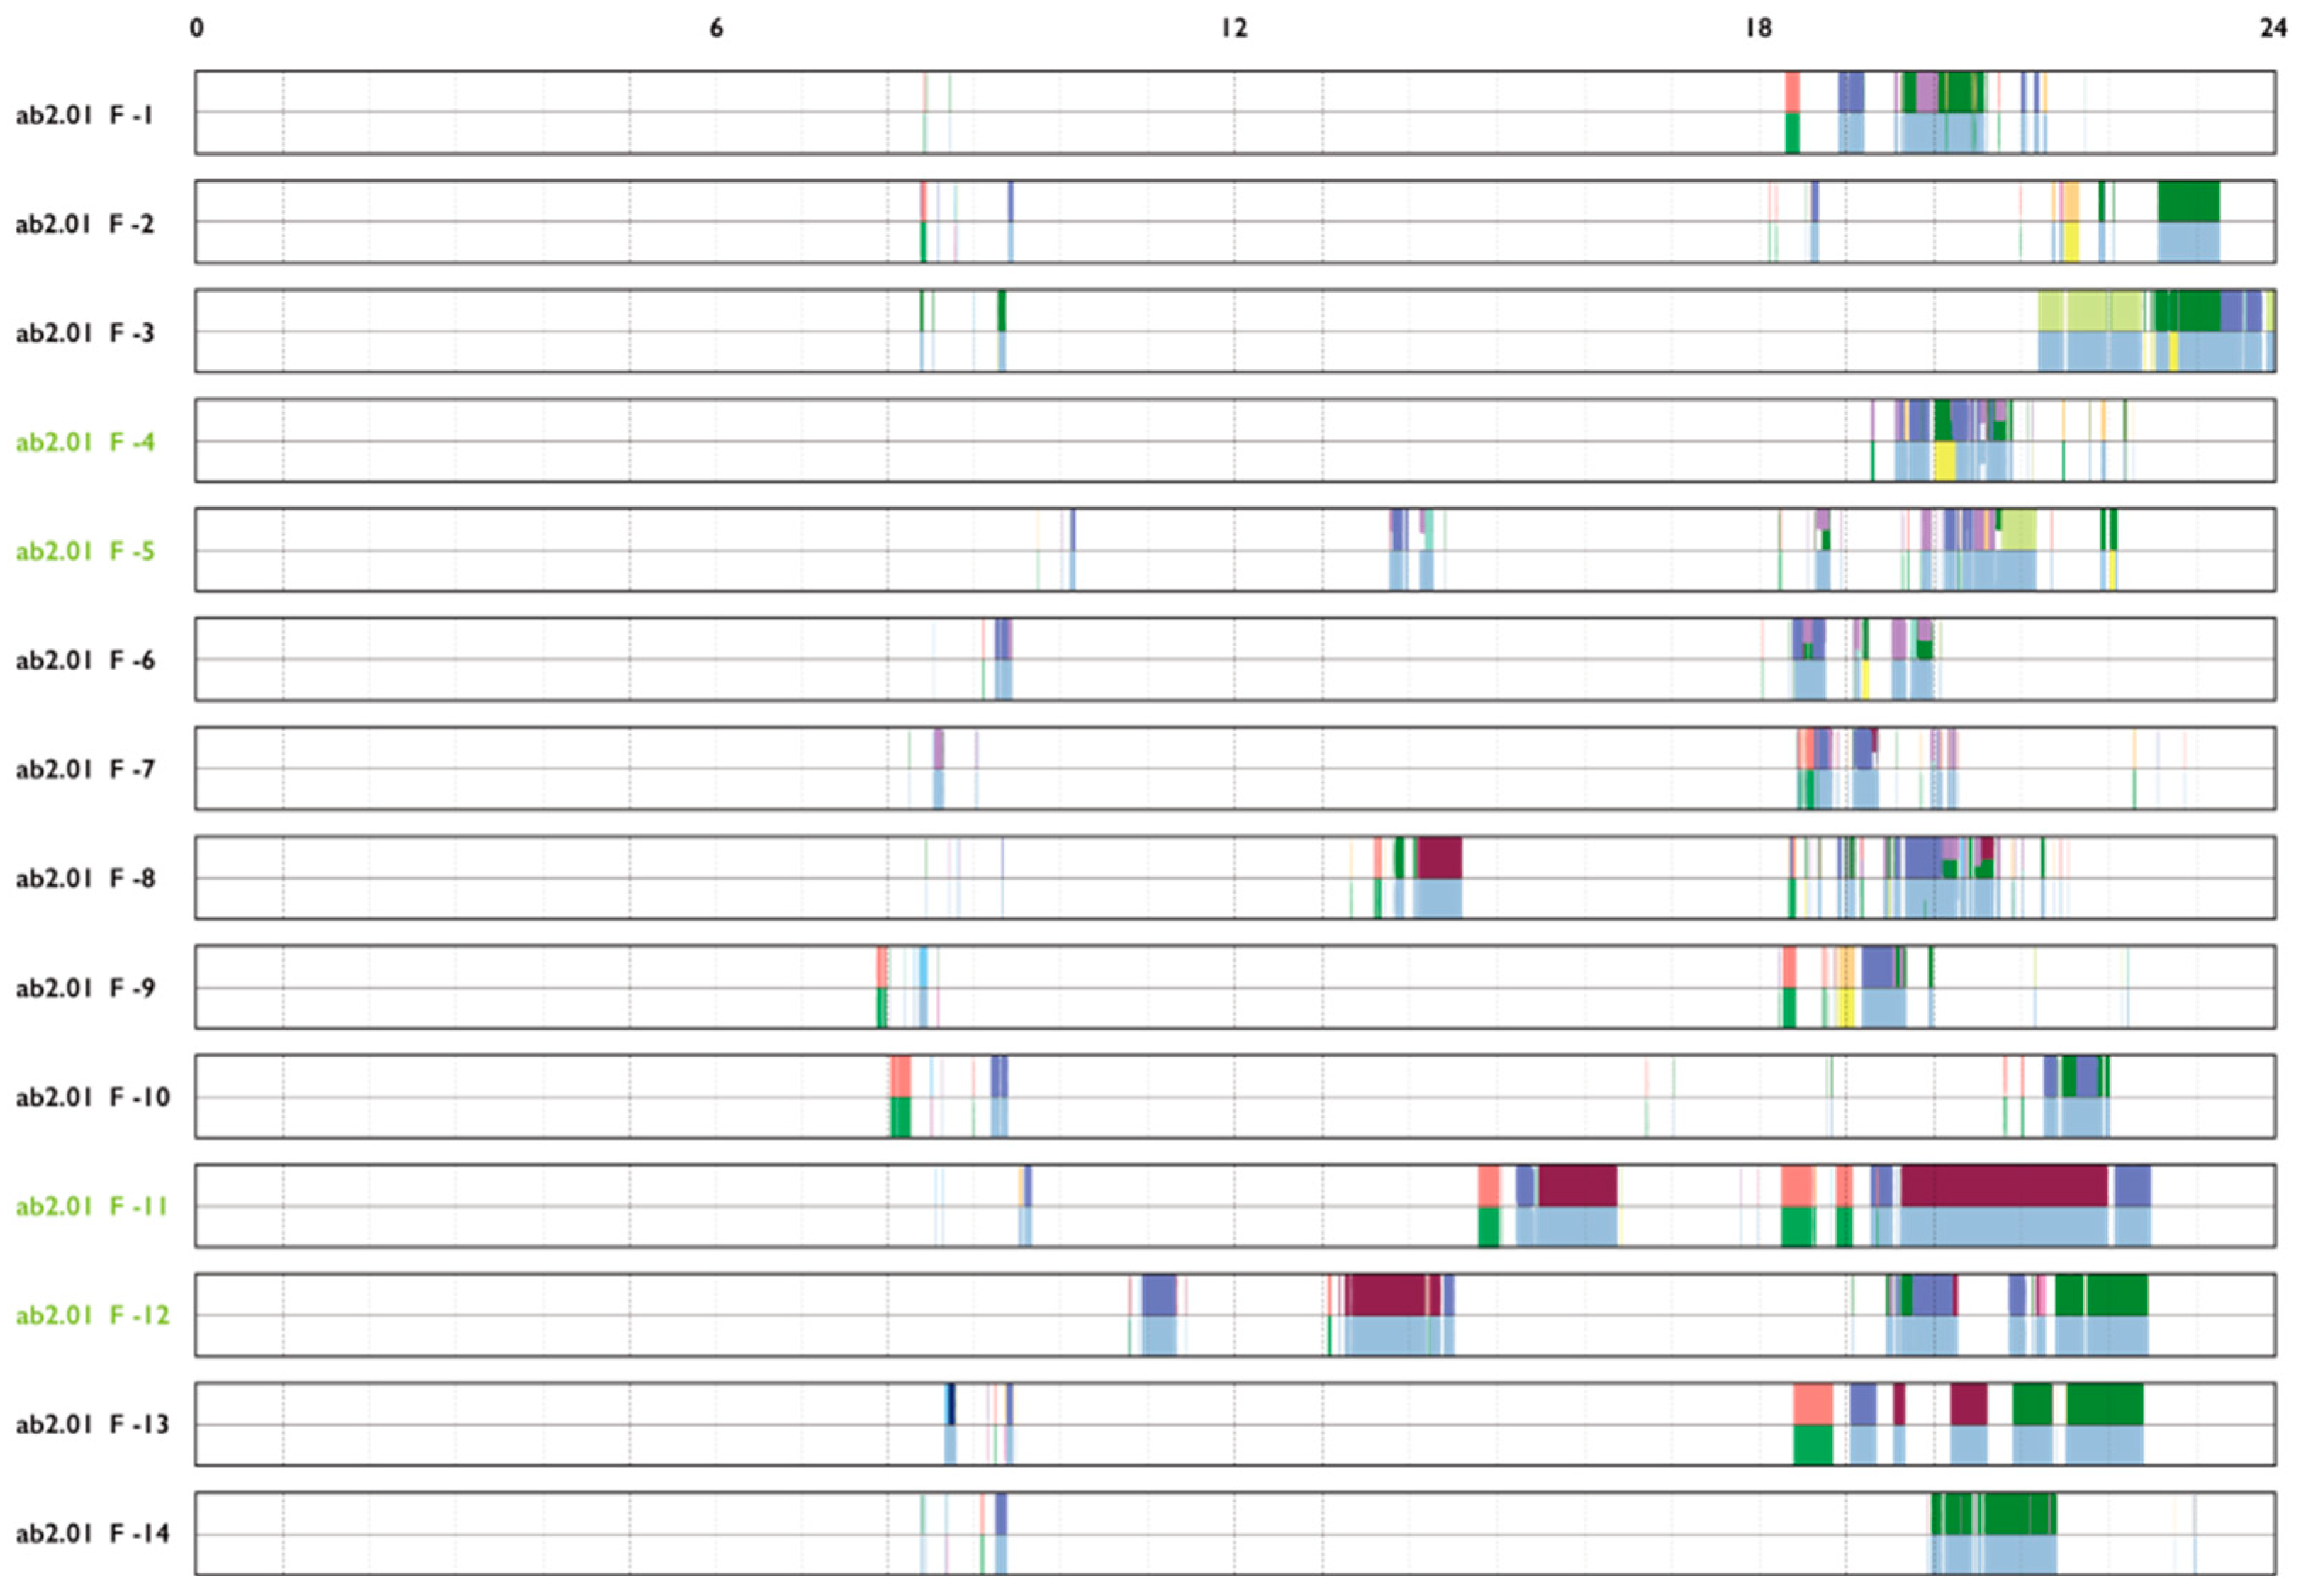
As shown in Figure 5, the timeline provides a comprehensive overview of pertinent information, which can be expeditiously retrieved using the user code, the date, and the designated space for the act and behavior.
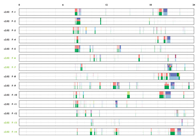
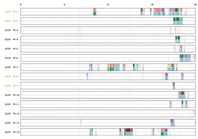
Figure 6 is a graphical representation of the spatio-temporal data of residential behavior. On the left side of the figure, the coding of the families (six families) and the users (F—father; M—mother; G—grandmother; K—kid) is presented. The figure also presents the day on which the data were collected (1–14). The upper portion of the axial data depicts behavioral patterns, while the lower portion focuses on spatial elements. Notably, the data for each day were recorded in a 24 h format. Color coding facilitates the identification of specific behaviors and spatial locations, thereby providing a visual representation that can be subjected to subsequent analysis. Table 10 shows the results of visualizing the behavioral and spatial–temporal data of 6 families and 21 persons for 14 days each. A subsequent analysis of the obtained data revealed a certain regularity of recurrence in the spatio-temporal data of the behaviors, showing a midweek weekend pattern. This finding aligns with the expectations formulated before this research.

4. Discussion

4.1. General Analysis of Lifestyles

The data can be filtered by “user–object,” “user–space,” and “user–behavior” benchmarks to obtain data from different perspectives. The utilization of “user–space” frequency and interval, “user–behavior” weight disparity, and “user–object” usage frequency as filters for the data underscores the versatility of this method.
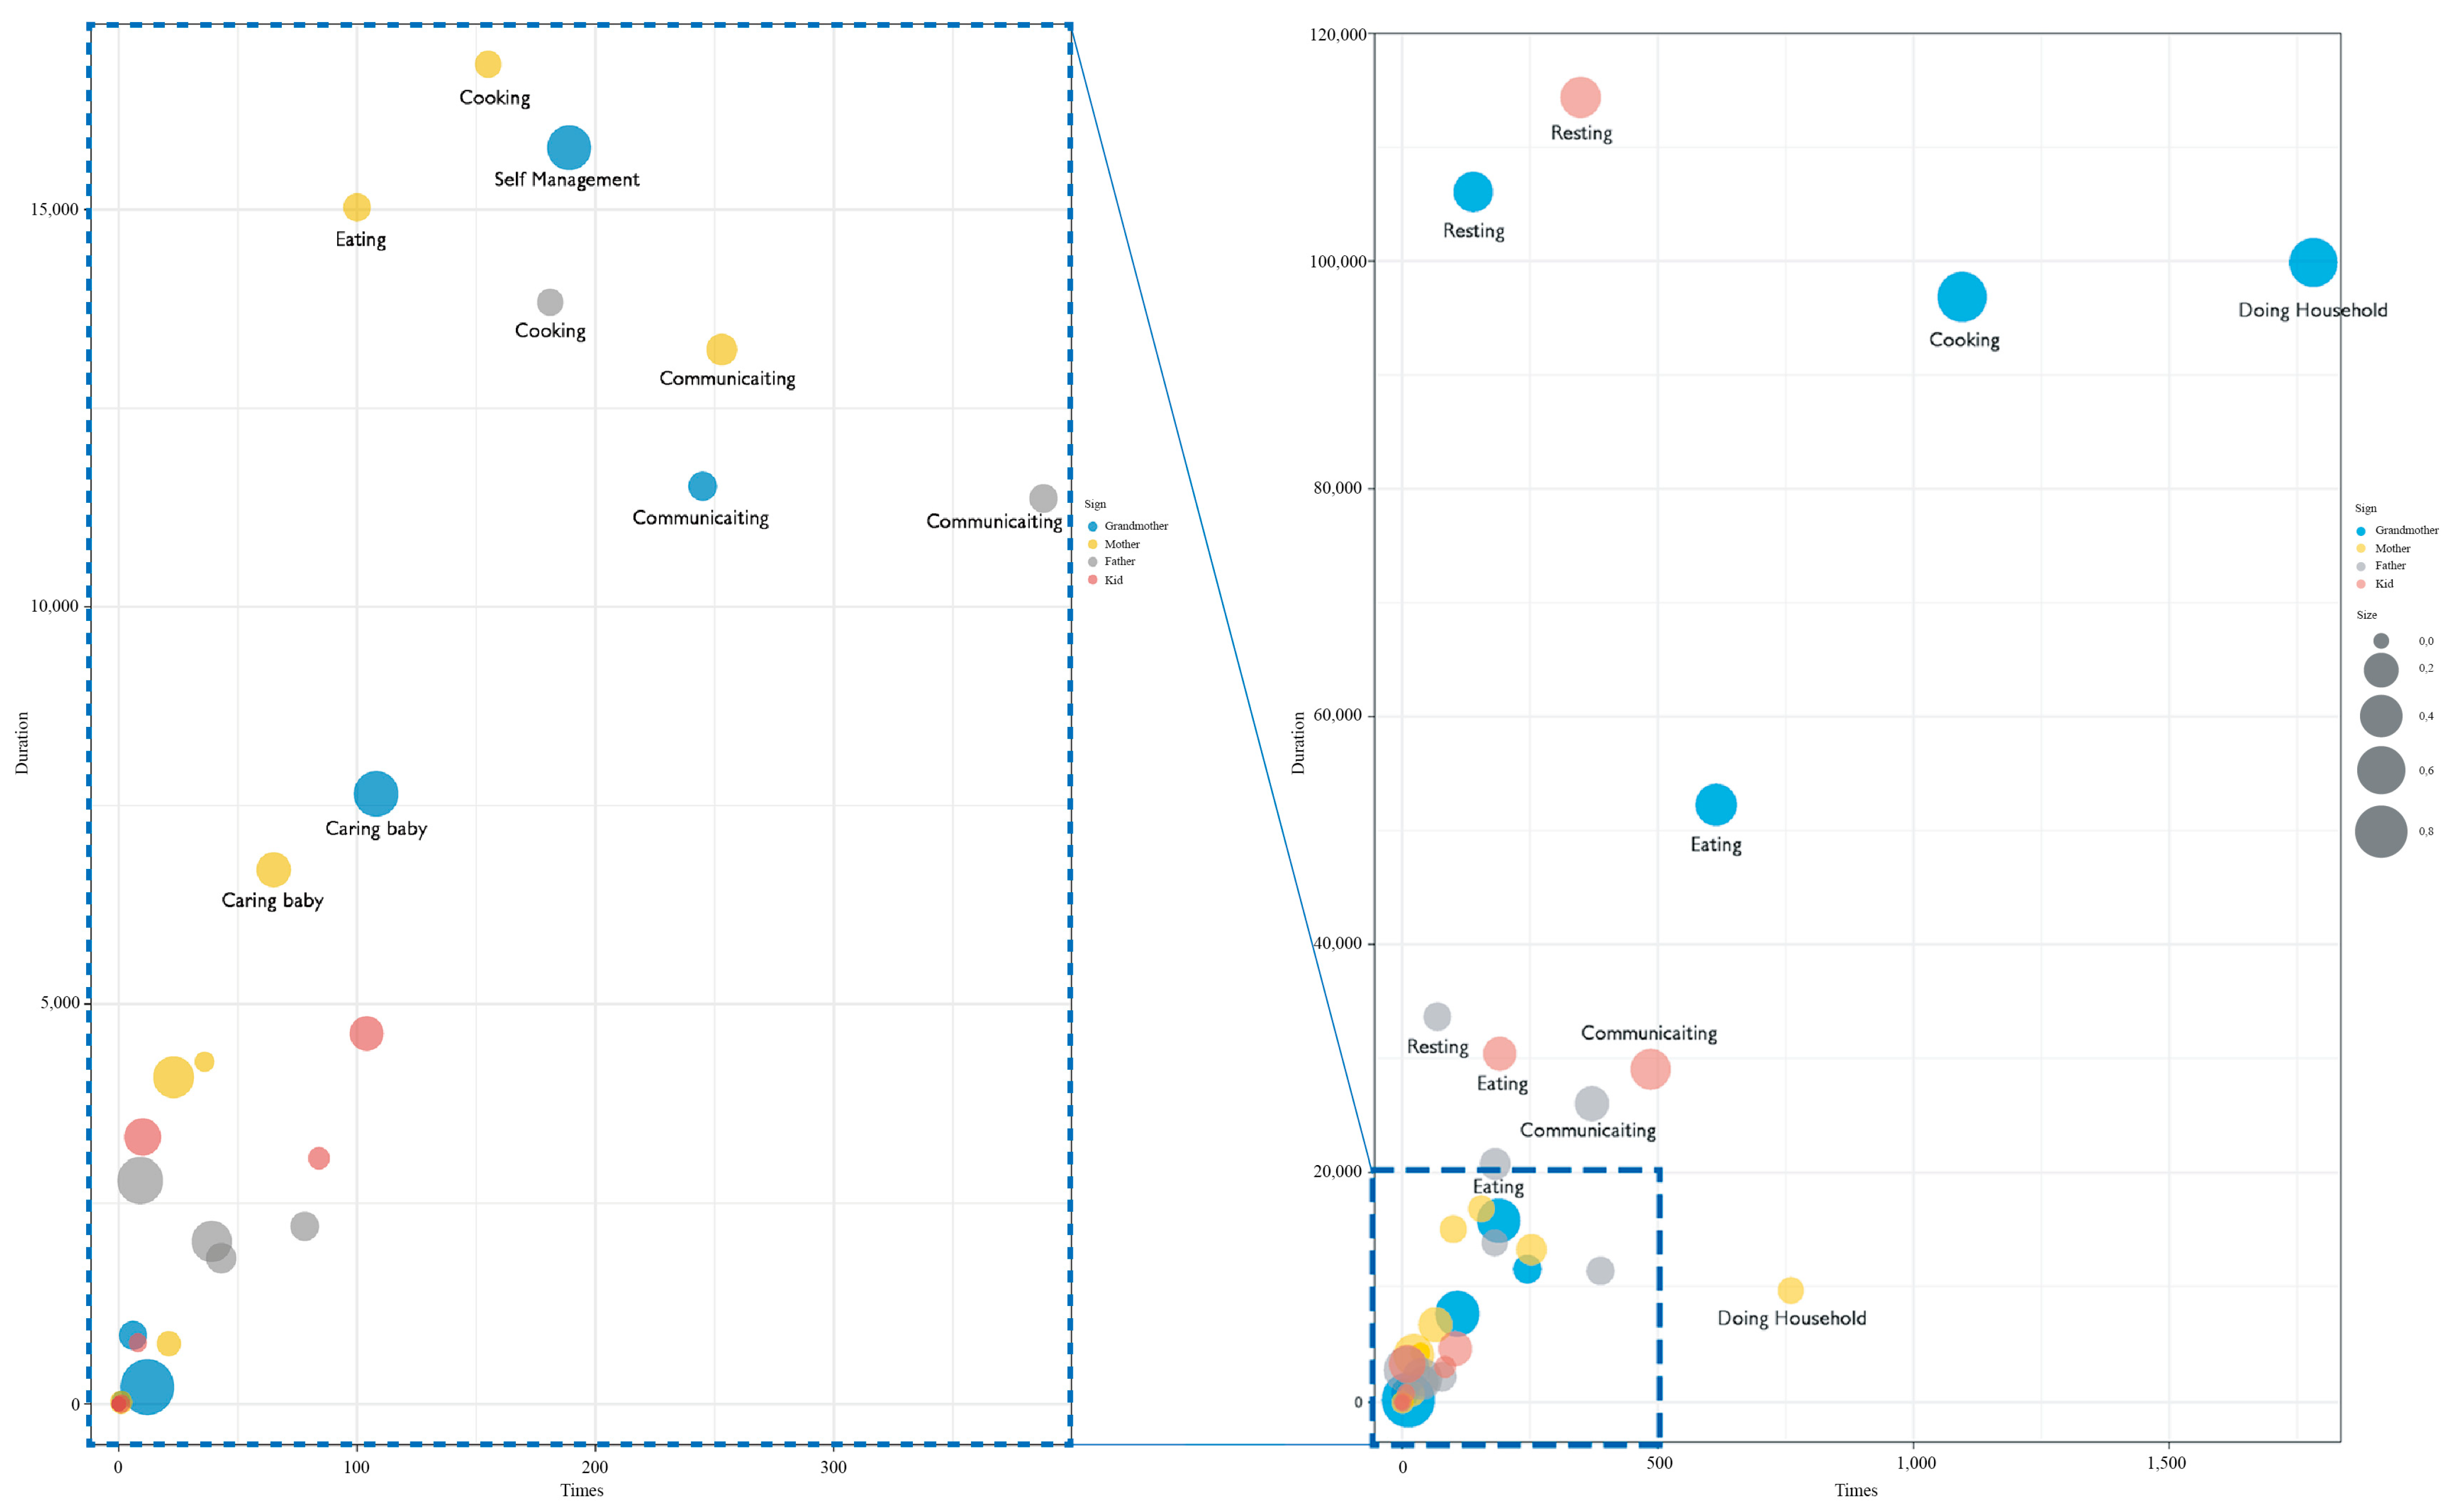
The combined statistics of the duration and frequency of the users’ behaviors are shown in Figure 7. The left side of Figure 7 illustrates a breakdown of the blue area in the right-hand graph. The grandmother has the highest index of most behaviors, including DH (more than 1500 times, 100,000 s); CO (more than 100 times, 90,000 s), EA (more than 500 times, 50,000 s), and RE (more than 200 times, 100,000 s), followed by the child’s RE (more than 250 times 100,000 s), CM, and EA behaviors. Next is the father’s RE and CM behaviors. Overall, resting behavior is the primary life behavior among family members. While grandmothers do not constitute the primary occupants of the domestic environment, they nevertheless allocate a more significant proportion of their time and behavior to the household. This also confirms that the three-generation family with the parent–grandparent co-parenting of children is a prevalent phenomenon in Chinese families, especially at the preschool stage [39].
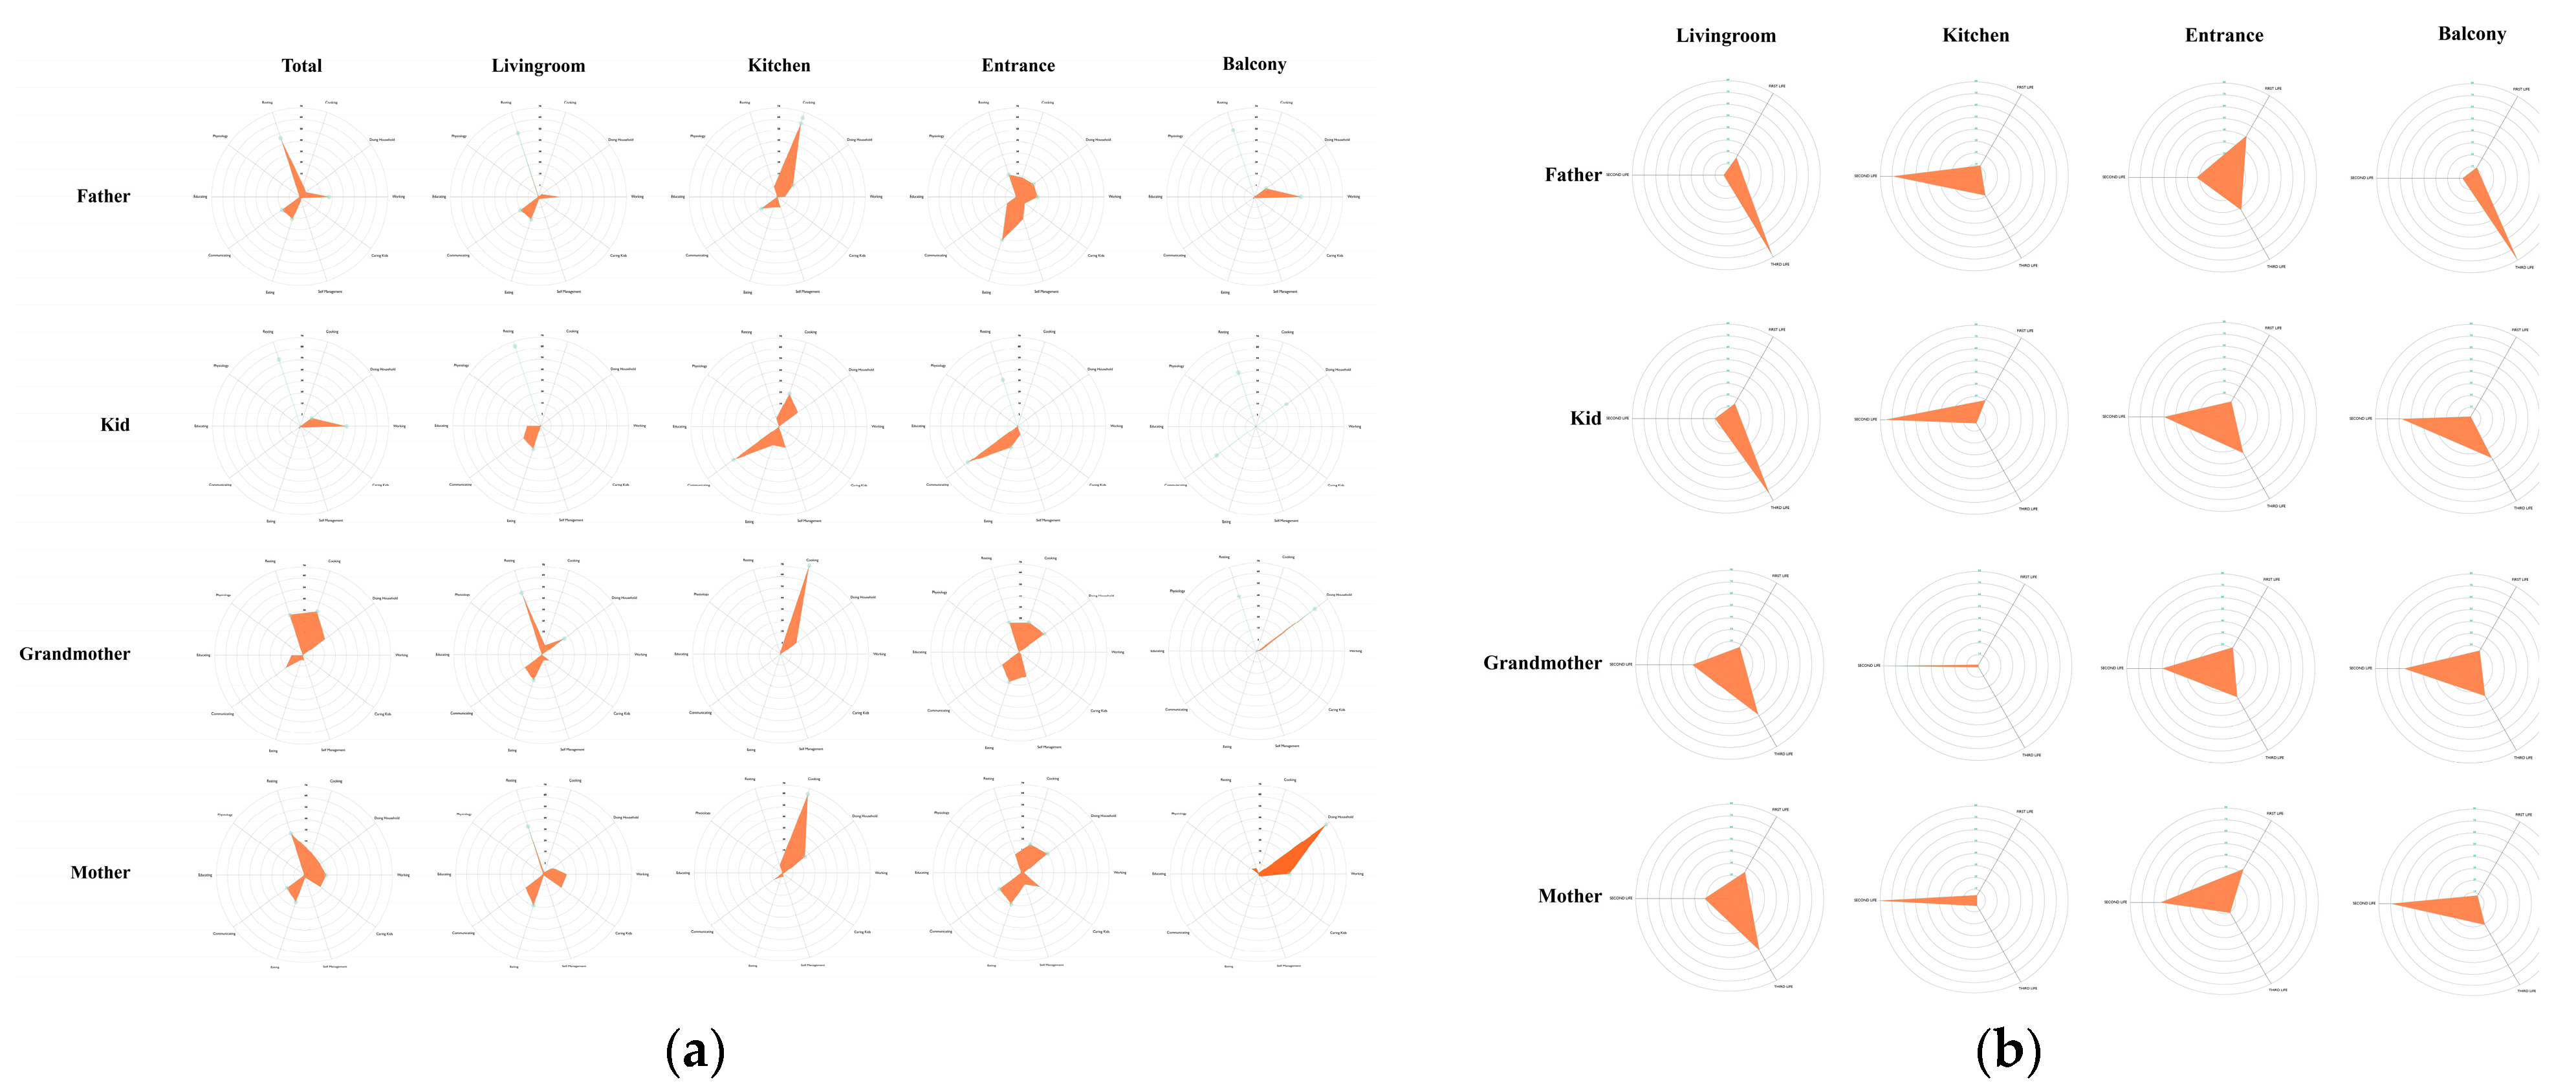
Figure 8a was obtained by collating the mean values of the duration of users’ 11 types of behavior in the different spaces. A cursory examination of the images reveals that the behaviors exhibited by the father, mother, and grandmother in the entrance and balcony areas bear a striking resemblance. A further analysis reveals that the behaviors the grandmother and mother exhibited in each space are analogous. A notable distinction emerges between the behaviors the children and the parents exhibited, particularly concerning inter-behavioral proportions.
According to the three types of behavioral division of living and housing science, the data from 11 behaviors were summarized to obtain a ratio graph of the three types of living behaviors, as shown in Figure 8b. According to the graph, the following is evident. 1. Fathers have a relatively high proportion of the third style of life behaviors in each space compared to mothers. 2. Mothers and grandmothers have similar behavior patterns, but grandmothers have a high proportion of the second style of life behaviors. 3. The father’s behavior on the balcony is like that of the mother and grandmother. However, his actions are more like those of the third style of life behaviors. The father’s living room behavior is like that seen in the interactive model on the balcony. The proportions of the three types of behaviors demonstrate that within the domestic space, gender differences are evident, particularly in the leisure and hedonic behaviors and domestic behaviors of fathers and mothers.
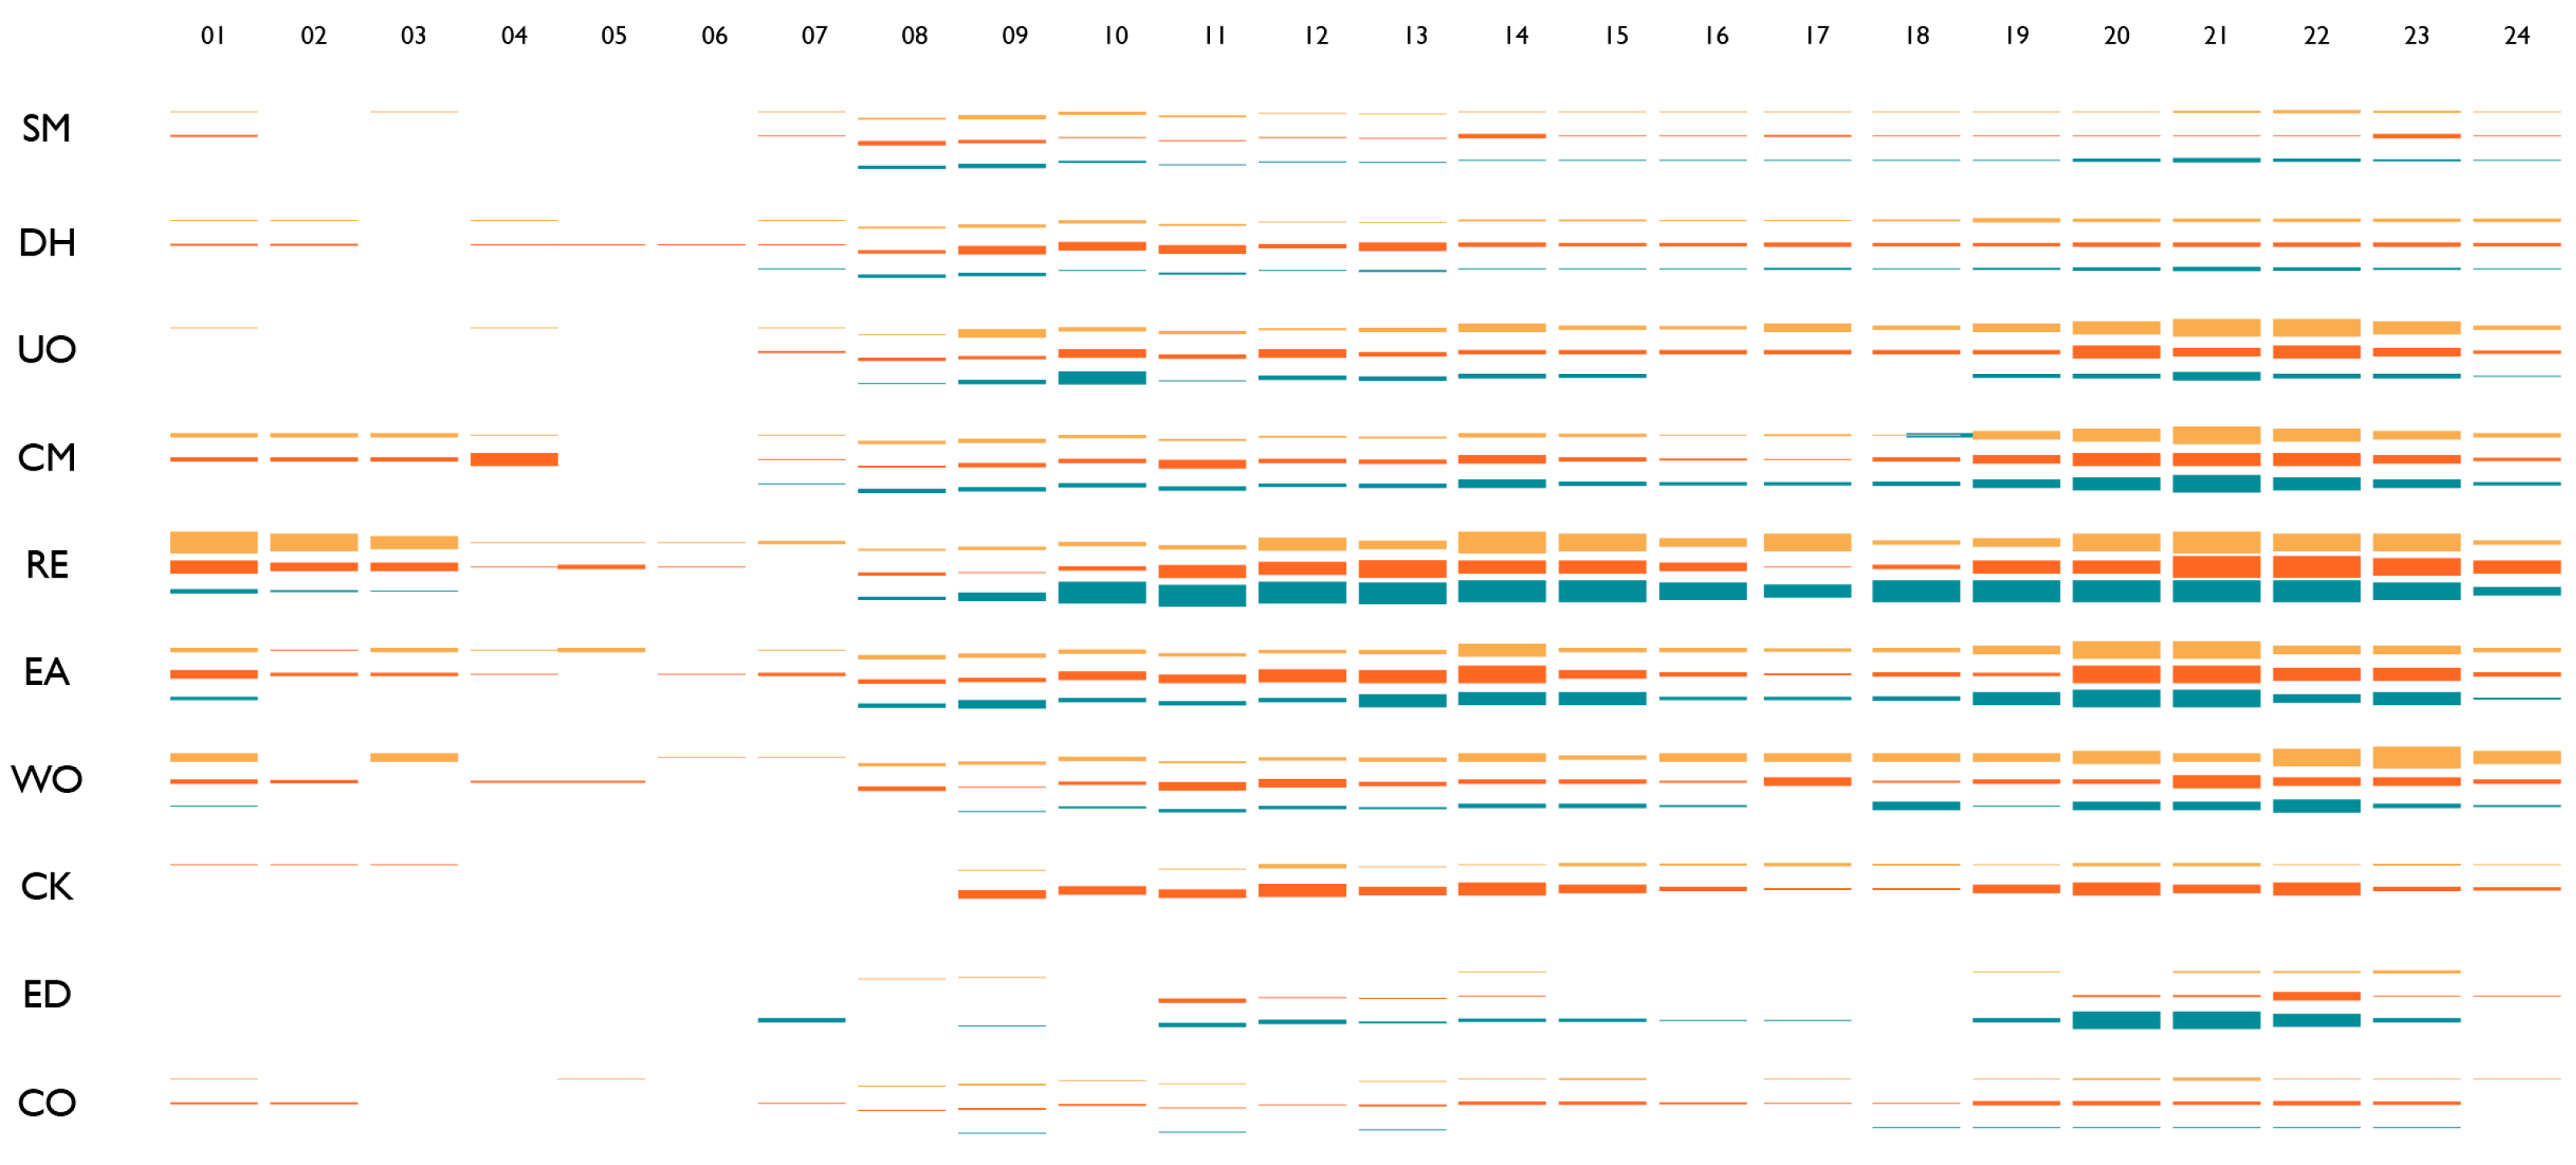
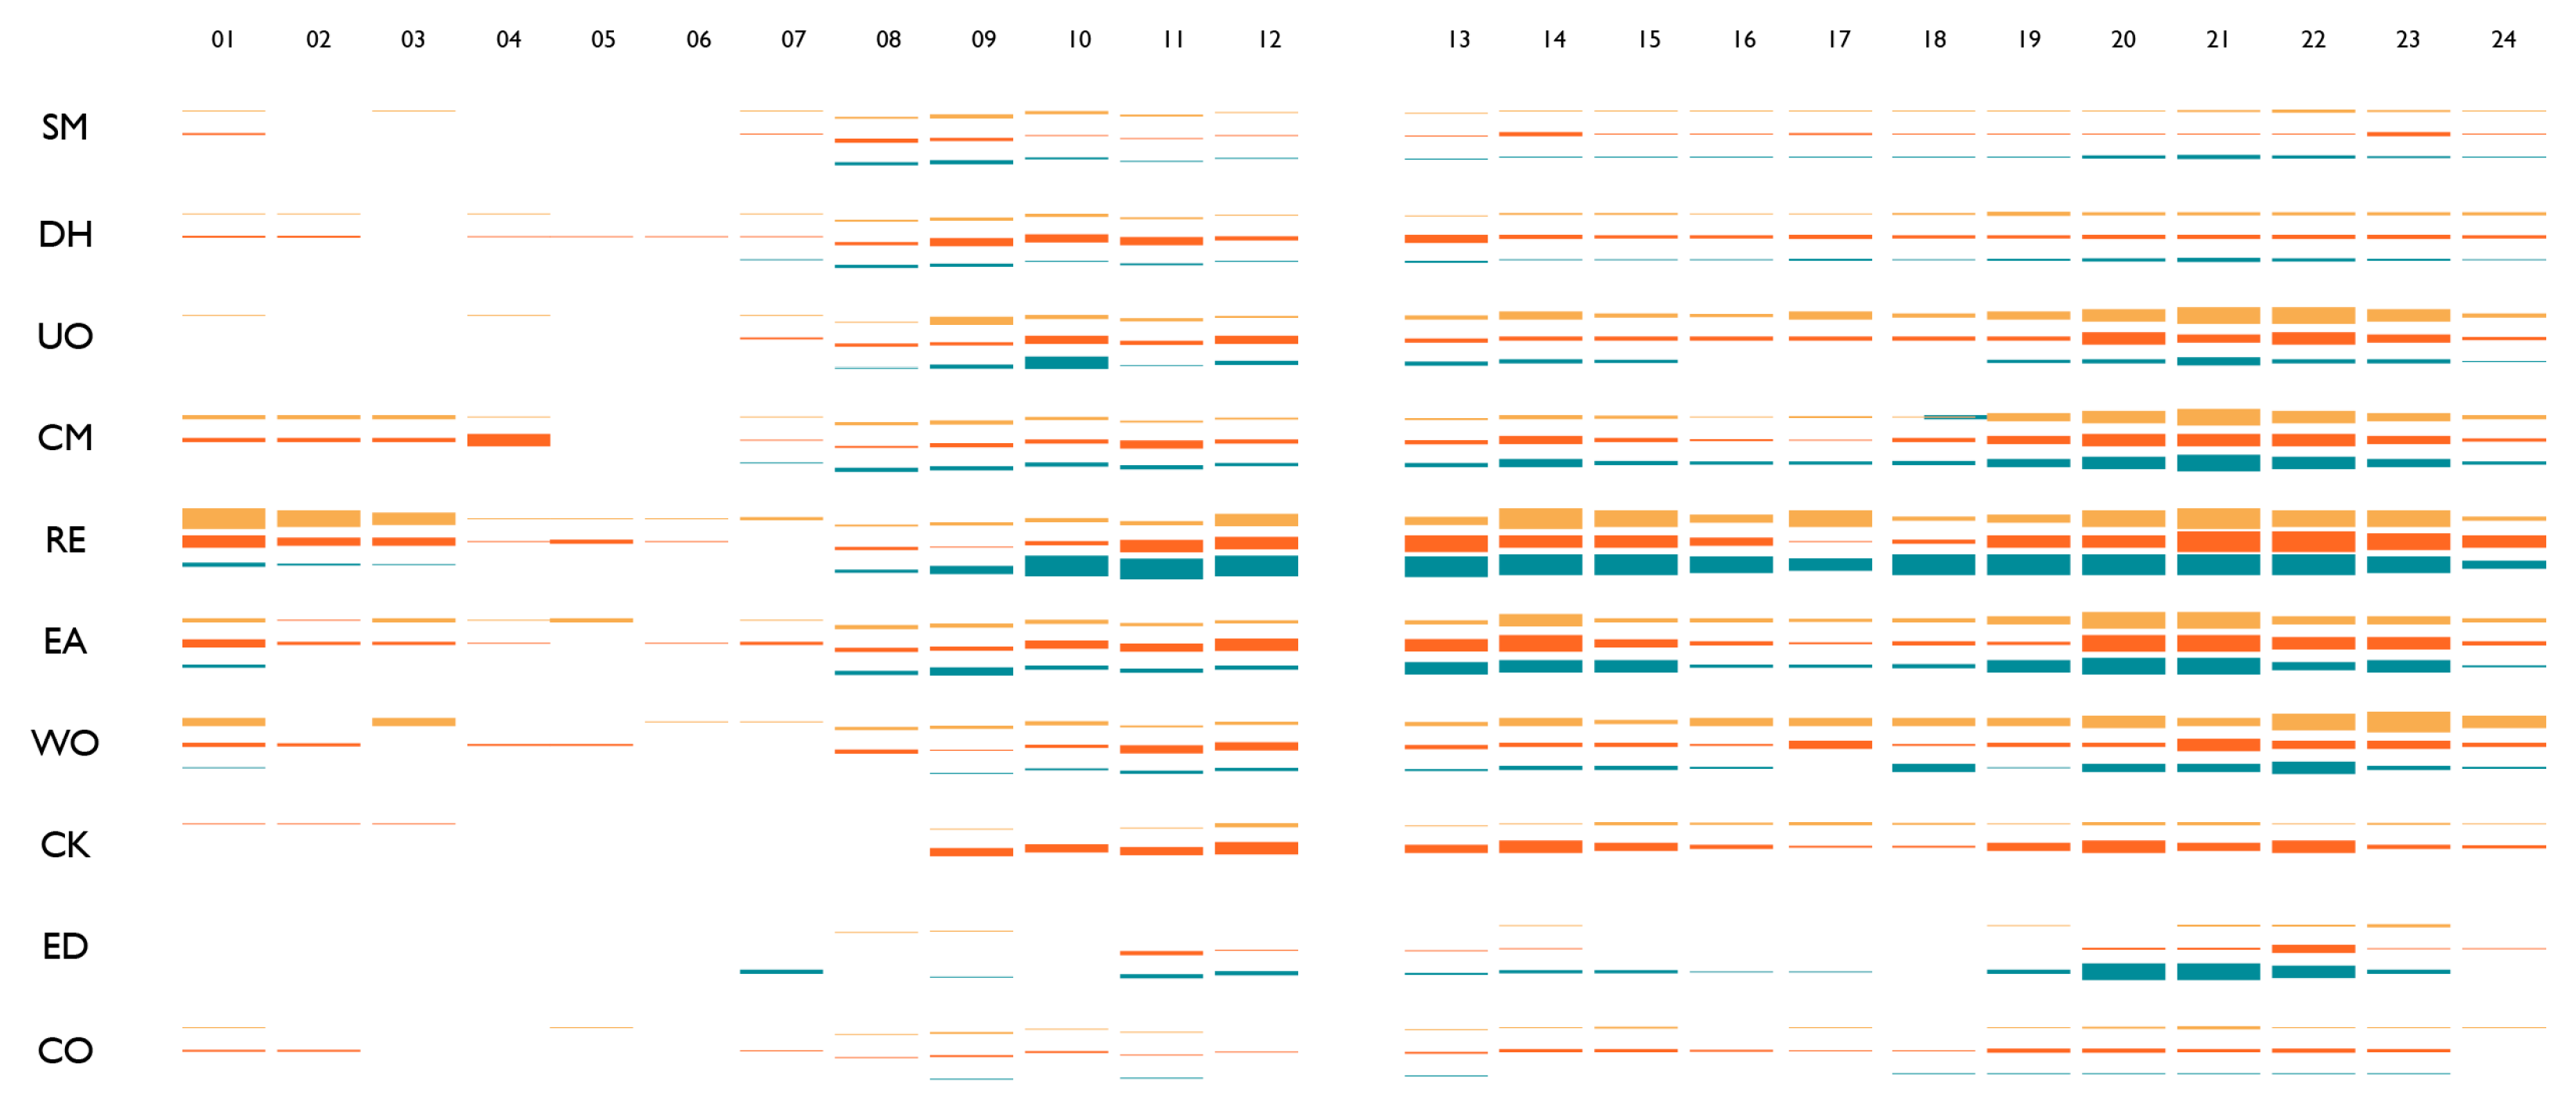
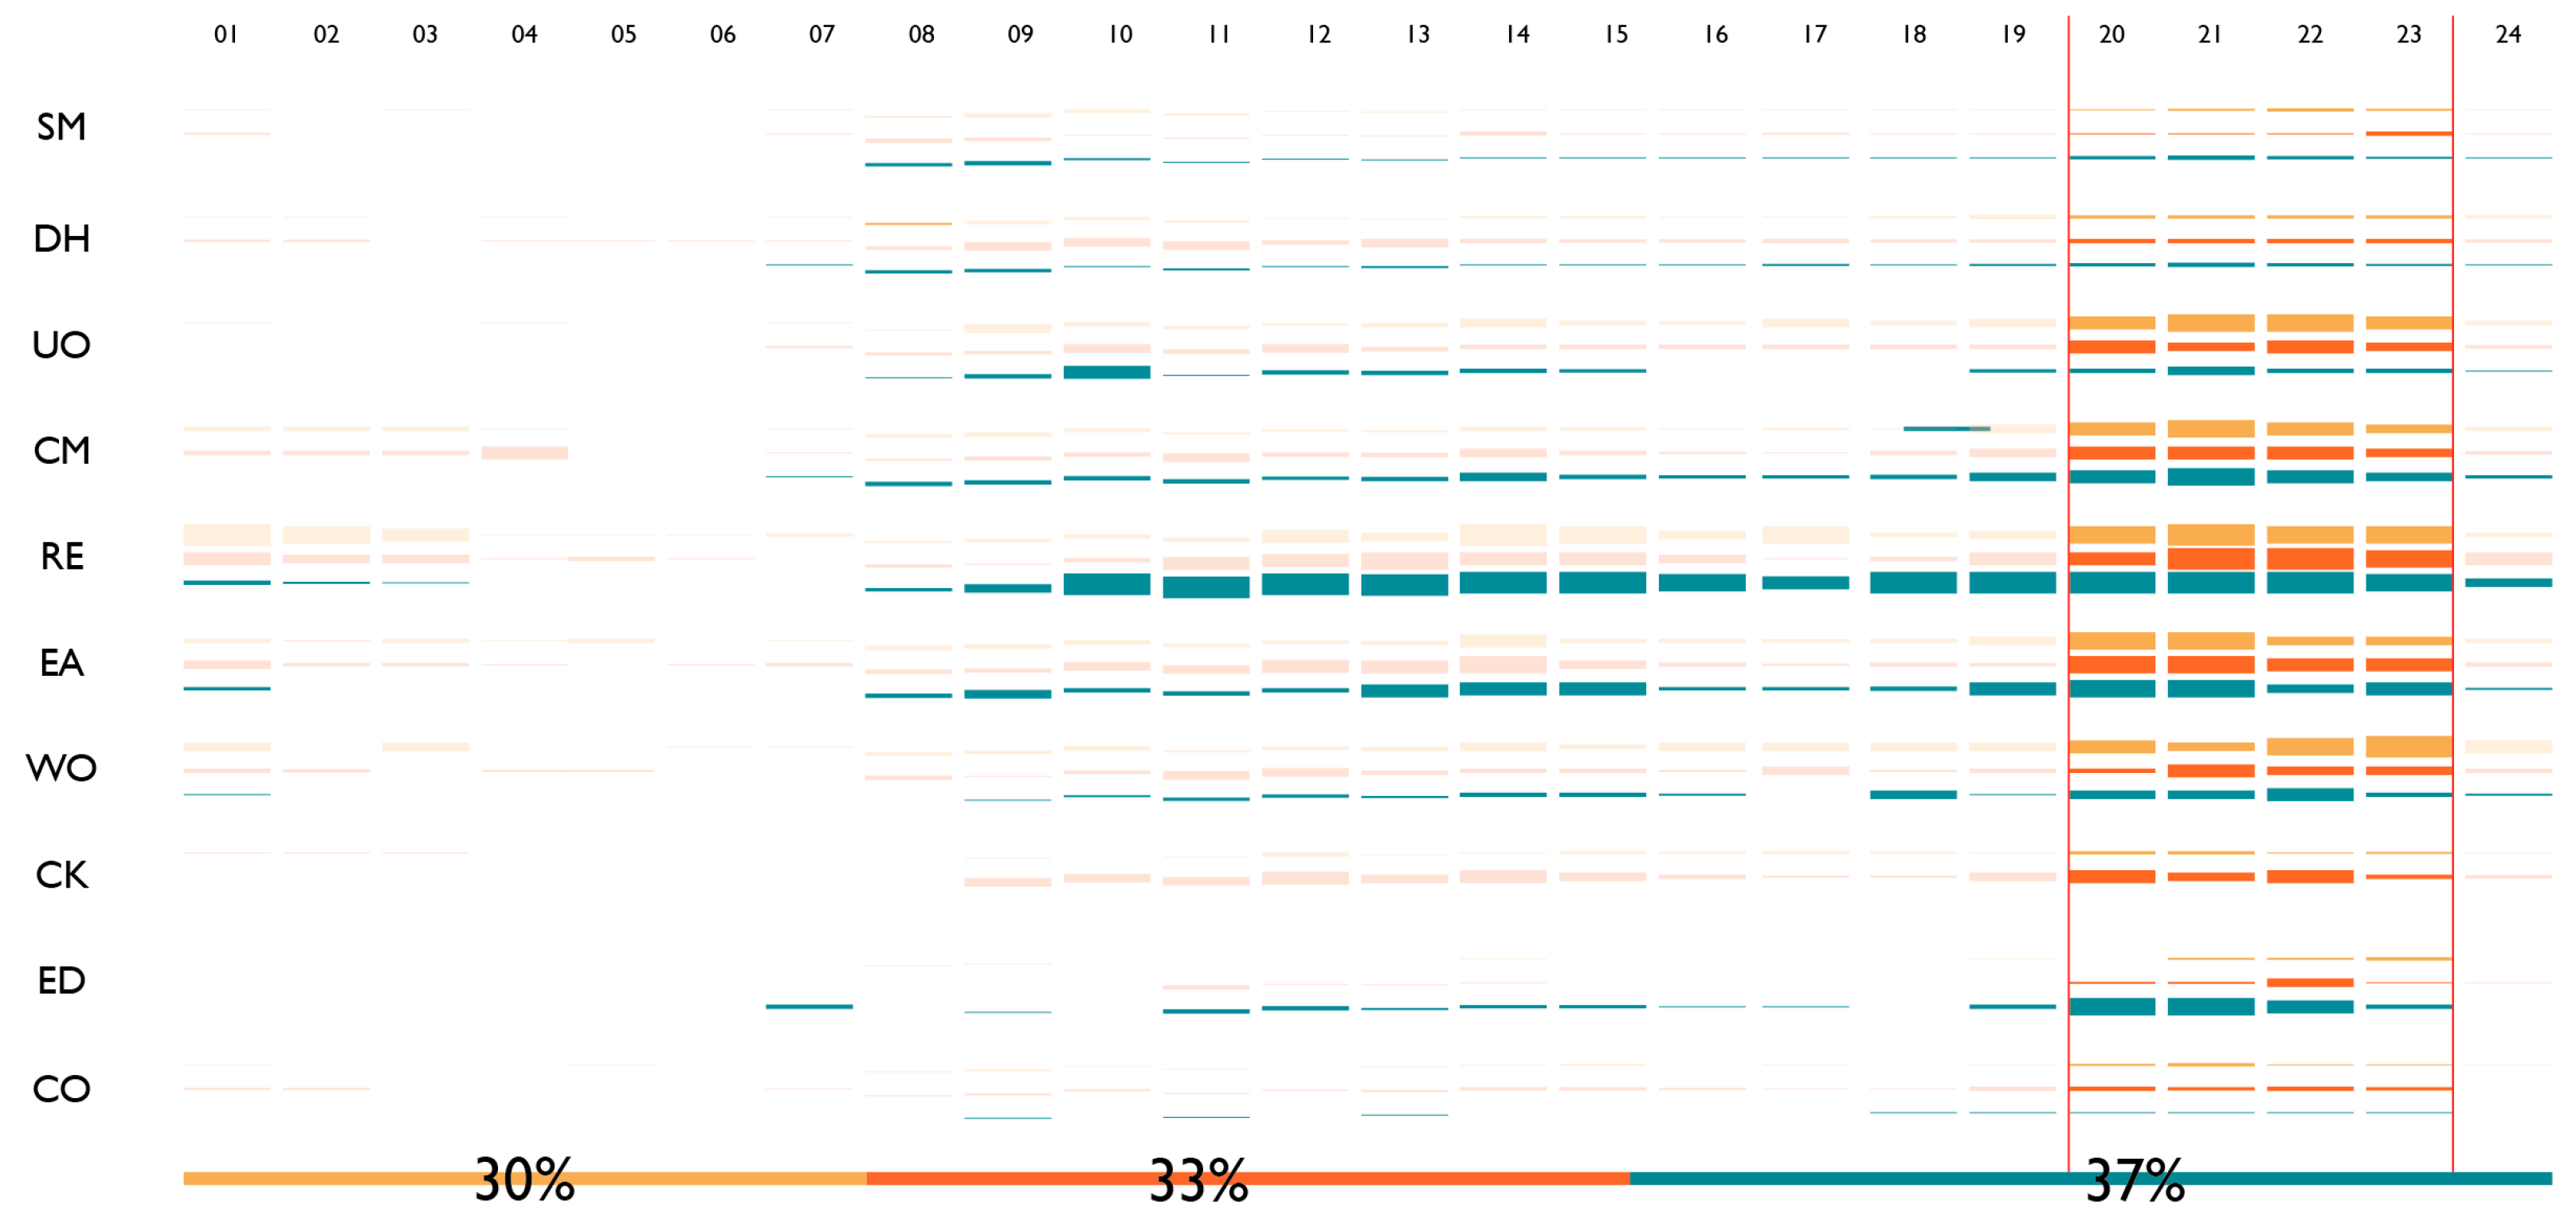
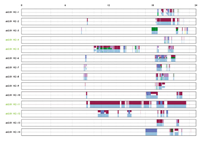
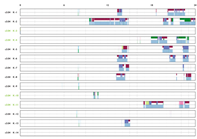
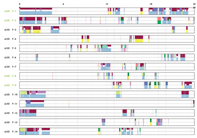
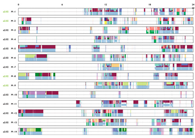
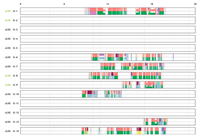
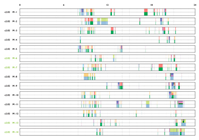
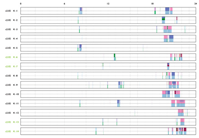
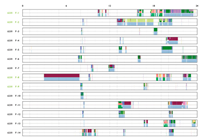
The data for 288 days from six families were integrated to generate a life behavior timeline characteristic graph. In Figure 8, yellow represents the father’s behavior, red represents the mother’s, and blue represents the child’s behavior. Figure 9, Figure 10, Figure 11 and Figure 12 is divided into 24 h, and the thickness of the behavior line segment indicates the frequency of the behavior occurring in that current period. By conceptualizing behavioral data within the living space, its multifaceted nature can be deconstructed through diverse lenses, establishing a foundational framework for subsequent analysis.

4.2. The Design Direction of the Interior Through Lifestyles

Through the organization of quantitative data, users can be categorized. Subsequently, a qualitative analysis was undertaken to delineate distinct user archetypes and succinctly compile attributes associated with each user category. Consequently, derived from the overarching analysis, interior design strategies for diverse user typologies for Beijing residents can be delineated along four distinct trajectories.
  • Design that considers temporal differences in behavior.
Figure 10 shows that in dual-income families, there is less behavior in the morning than in the afternoon; the whole family eats breakfast at home, which is not always the case because parents go to work, and children go to school; and breakfast takes less time than lunch or dinner. The child is young and falls asleep at dawn, so the parents use the living room; the child’s behaviors are average from 9 a.m. onwards. The peak of family activity is between 20 and 21 h; the child’s primary learning time is between 19 and 22 h. Resting is the main family activity event in the living room; for all family members, the living room is a place for all-weather relaxation; fathers use the living room more extensively, and children use the living room for more extended periods. Between 10 and 14 h and between 18 and 22 h are periods of high diversity and long durations of family behaviors. Interior design should consider the intersection of the diverse behaviors of family members. Resting is the most critical behavior in the living room; relaxation in the living room occurs almost all day. The two main mealtimes and mealtime activities are evenly distributed throughout the day. Interactive activities may occur between different behaviors, especially during meals; between the study and work behaviors in the living room; and between most behaviors in relative proximity throughout the home. Consequently, when undertaking spatial planning and design, it is imperative to consider the sequence of behaviors observed during the morning hours and the high-frequency crossover of behaviors in the afternoon. The configuration of space and furniture must be designed to accommodate the temporal variability in behaviors in their totality, thereby facilitating the transition between periods of high and low density of behaviors.
2.
Living room design centered on child behavior.
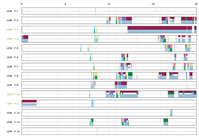
Figure 11 shows that the child’s main activities in the living room are resting, eating, communicating, and educating; parental activities increase as the child’s activities increase; learning work in the living room may conflict with the parent’s recreational activities. On weekdays, children should go to school, but the child’s living room hours starting at 9 o’clock are clearly shown in this chart. Therefore, most weekends are estimated to be spent by children using the living room during the day. The child’s resting behavior is the longest; although the child spends significantly less time using electricity than the parent, electricity use is still the child’s main activity. In many households, furniture does not fit the child’s size. The child’s eating and entertainment activities are estimated to be difficult to focus on. Therefore, the child element must be considered during the planning and design of the space. It has been observed that the needs of children are frequently overlooked in the design of family spaces. However, children are the most significant users of these spaces, particularly in learning, eating, entertainment, and other behavioral aspects of their lives. Inadequate furniture dimensions and impractical home layouts can potentially inflict physiological harm on children. Furthermore, the absence of designated independent space for children in Beijing family apartments hinders the cultivation of their autonomy. Interior design should consider the intersection of the diverse behaviors of family members. Resting is the most critical behavior in the living room; relaxation in the living room occurs almost all day. The two main mealtimes and mealtime activities are evenly distributed throughout the day. Interactive activities may occur between different behaviors, especially during meals; between the study and work behaviors in the living room; and between most behaviors in relative proximity throughout the home.
3.
Common family behavior linked to eating behavior.
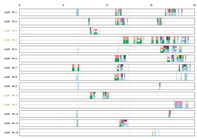
Figure 12 shows that behavior changes in the living room are based on eating behavior. The diversity of different behaviors increases when eating. It can be assumed that people move according to different eating behaviors. Resting behavior, electricity use behavior, and communication behavior are highly related to meals; during the eating period, these acts increase noticeably. Children eat lunch later than their parents and dinner earlier than their parents; their behaviors are average from 9 a.m onwards. The activities at dinner are the most frequent and diverse. There is the most family interaction at dinner and after dinner. In addition to dinner, families eat snacks in the living room. Other behaviors can also occur when eating snacks. Families often drink water in the living room, which is related to having a hot water bucket in the living room. Family members’ mealtimes are relatively concentrated, but meals can be eaten at different times. Different family members have different behavioral characteristics at mealtimes. The use location of the living room space when the family eats is also different, especially when using the sofa; the father usually sits on it and uses it, but the child has a small stool because of their height.
4.
The consideration of the home office and the massive use of electronic devices in the digital age.
Two-income Chinese families usually have two or three bedrooms, so there is no study room; therefore, the living room becomes the place to work at home and for the children to study. The most used things in the living room are TVs, cell phones, and computers, so electronics are the main items used in the living room. The area where the children study is separate from where the parents work. All actions in the family, such as eating, resting, and studying, are accompanied by using electrical appliances; mobile phone charging problems also occur. The office furniture may not meet the needs of office workers because there is no dedicated office space at home, and other furniture needs to be moved frequently to meet these needs.

5. Conclusions

This study summarizes the user research process related to interior design under the design framework system that combines user culture-form and discusses the utility of the Observer XT in this process. The framework system evaluates specific knowledge that can be used to continuously assess the quality of design alternatives before providing design practitioners with relevant decision-making information. This enhances the efficiency, quality, and consistency of user-centered design (UCD) decision-making, optimizing the decision process for user-centered interior and furniture design.
Based on the lifestyle dimension, four design directions for residential space were postulated and substantiated through an investigation into Beijing residents’ living morphologies to validate this methodology’s efficacy. This study highlighted several key aspects of family behavior in living spaces, particularly in the context of dual-income families in China. Firstly, the design of living spaces should account for temporal differences in behavior, acknowledging that family activities vary throughout the day, with peaks in activity and a high diversity of behaviors occurring during specific times. The configuration of space and furniture must adapt to these temporal variations, facilitating smooth transitions between periods of high and low behavior density. Secondly, the living room design should be centered around child behavior, recognizing that children are significant users of this space for learning, eating, entertainment, and rest. Inadequate furniture dimensions and impractical home layouts can pose physiological risks to children, emphasizing the need for child-friendly designs. Thirdly, common family behaviors are closely linked to eating behavior, with mealtimes as focal points for increased diversity and interaction among family members. Lastly, this study underscores the importance of considering the home office and the prevalent use of electronic devices in the digital age, as the living room often doubles as a workspace and study area due to the limited number of bedrooms in Chinese homes. These findings emphasize the need for holistic and adaptive living room designs that cater to modern families’ diverse and dynamic needs. In the process of redesigning existing residential properties, the demolition of existing space is often more challenging than altering the layout. However, the redesign of residential spaces should prioritize the needs of children and be adaptable to behavioral changes. Consequently, the variability, mobility, and accessibility of furniture become the primary focus, superseding the emphasis on space remodeling.
Considering this research’s industrial and academic contributions, observing residential space behaviors is labor-intensive, requiring substantial effort. The user observation process based on the USO framework system and Observer XT software can significantly reduce the recording and analysis of redundant data. Sharing observation results among observers can shorten the time required for observations while systematically extracting a substantial amount of data generated during long-term observations, thereby reducing data analysis challenges. Additionally, this study provides a logical and rational basis for subsequent qualitative analyses, enabling design practitioners to conduct user observation research theoretically and systematically. It is imperative to acknowledge that the process of coding and recording behaviors necessitates the establishment of clear standards and comprehensive training to mitigate potential biases in the observation process.
From an academic perspective, this study transforms traditional qualitative user observation methods into more scientifically and rigorously engineered problems, addressing concerns about overly subjective judgments in observation methods lacking reasonable logic. Furthermore, this research explores the framework built using the user observation database proposed in the USO framework, facilitating knowledge transfer among individuals within an organization during the design process in different fields. This study offers a general analysis grounded in the 11 main categories of spatio-temporal data. Future research has the potential to expand on and delve deeper into existing data. For example, the broad classification of “resting” encompasses a wide range of actions that could be further subdivided into more specific categories, thereby facilitating a more nuanced examination of the phenomena. Alternatively, this database could catalyze subsequent research, prompting the formulation of additional sub-questions to guide more in-depth investigation.
Inevitably, this study has some limitations despite some advances. The first is that it is an observational study. In the framework of this observational study, supplementing the data to compensate for the disadvantages of the survey is overly subjective, but inevitably, the sample size cannot be guaranteed. The second is that the composition of families and family cycles are diverse, and this study cannot comprehensively cover and categorize families in different situations, which is also the future direction of our team’s research. Another constraint of the present study is that due to the implementation of stratified random sampling for the selection of subgroups across diverse age groups, establishing a control group for direct comparison was not viable. This limitation imposes a restriction on this study’s capacity to make specific comparisons and draw conclusions that would be bolstered by the incorporation of a control group in subsequent research endeavors.

Author Contributions

F.L.: conceptualization, methodology, and writing—review; Y.W.: data curation; Q.A.: writing—original draft, writing—review and editing, and visualization. All authors have read and agreed to the published version of the manuscript.

Funding

This work was supported by the China National Arts & Crafts Society, CNACS2024-I-1, and Research on the Inheritance and Innovation Path of Jingzuo Furniture under the Change of Beijing Urban Lifestyle, Beijing City University, KYQH202449. This work was also supported by the Oriental Cultural & Design Center.

Institutional Review Board Statement

All subjects gave their informed consent for inclusion before they participated in this study. This study was conducted in accordance with the Declaration of Helsinki, and the protocol was approved by the Ethics Committee of Kookmin University (A2022-0501).

Informed Consent Statement

Informed consent was obtained from all subjects involved in this study.

Data Availability Statement

The data presented in this study are openly available in Mendeley Data: https://data.mendeley.com/datasets/b9bpyw7grt; https://data.mendeley.com/datasets/5874fmcfn3.

Acknowledgments

We thank all the participants in the recording and all the researchers for coding.

Conflicts of Interest

The authors declare no conflicts of interest.

References

  1. Jin, C.; Chen, Z. Housing Inclusion Perspective: The Causal Structure of Housing Cost Burden, Fertility Intentions, and Social Housing in Urban China. Sustainability 2024, 16, 9352. [Google Scholar] [CrossRef]
  2. Andargie, M.S.; Touchie, M.; O’Brien, W. A review of factors affecting occupant comfort in multi-unit residential buildings. Build. Environ. 2019, 160, 106182. [Google Scholar] [CrossRef]
  3. Ellsworth-Krebs, K.; Reid, L.; Hunter, C.J. Integrated framework of home comfort: Relaxation, companionship and control. Build. Res. Inf. 2019, 47, 202–218. [Google Scholar] [CrossRef]
  4. Mitton, M.; Nystuen, C. Residential Interior Design: A Guide to Planning Spaces; John Wiley & Sons: Hoboken, NJ, USA, 2021. [Google Scholar]
  5. Yang, H.; Lee, W.; Lee, H. IoT smart home adoption: The importance of proper level automation. J. Sens. 2018, 2018, 6464036. [Google Scholar] [CrossRef]
  6. Heydarian, A.; Pantazis, E.; Wang, A.; Gerber, D.; Becerik-Gerber, B. Towards user-centered building design: Identifying end-user lighting preferences via immersive virtual environments. Autom. Constr. 2017, 81, 56–66. [Google Scholar] [CrossRef]
  7. Choi, W. Design Approach to Support Prospective Memory for Independent Living among Aging People. Arch. Des. Res. 2016, 29, 79–96. [Google Scholar] [CrossRef]
  8. Liu, J.; Liu, T.X. Two-child policy, gender income and fertility choice in China. Int. Rev. Econ. Financ. 2020, 69, 1071–1081. [Google Scholar] [CrossRef]
  9. Xu, X.; Hanafi, Z.; Razak, N.A. Exploring Sociodemographic Correlates of Fathers’ and Mothers’ Behavioral Control. Behav. Sci. 2024, 14, 1203. [Google Scholar] [CrossRef] [PubMed]
  10. Ytrehus, S. Interpretation of housing needs? A critical discussion. Hous. Theory Soc. 2000, 17, 166–174. [Google Scholar] [CrossRef]
  11. Choi, K.R.; Choi, J.M.; Sato, K. Socio-Cultural Factors for New Product Acceptance in Home Environment Design. J. Hum.-Environ. Syst. 2008, 11, 65–71. [Google Scholar] [CrossRef]
  12. Rapoport, A. Theory, culture and housing. Hous. Theory Soc. 2000, 17, 145–165. [Google Scholar] [CrossRef]
  13. Ettema, D.; van der Lippe, T. Weekly rhythms in task and time allocation of households. Transportation 2009, 36, 113–129. [Google Scholar] [CrossRef]
  14. Gao, C.; Wang, Y. Study on the Coupling Association between Human and House under the Influence of the Evaluation Index of Urban Residents’ Behavior. J. Phys. Conf. Ser. 2021, 1838, 012056. [Google Scholar] [CrossRef]
  15. Ganvir, L.; Kalita, C.P. Adoption of Socio-Cultural Aspects in PSS Design for Smart Home Products: An Integrative Review. Arch. Des. Res. 2022, 35, 7–29. [Google Scholar] [CrossRef]
  16. Kuo, T.C.; Wu, H.H.; Shieh, J.I. Integration of environmental considerations in quality function deployment by using fuzzy logic. Expert Syst. Appl. 2009, 36, 7148–7156. [Google Scholar] [CrossRef]
  17. Kim, H.J.; Choi, K.R.; Sung, Y.J. Multi-Functional Furniture Design in Small Living Space. J. Korea Furnit. Soc. 2011, 22, 190–198. [Google Scholar]
  18. Pea, R.D. User centered system design: New perspectives on human-computer interaction. J. Educ. Comput. Res. 1987, 3, 129–134. [Google Scholar]
  19. Daae, J.; Boks, C. A classification of user research methods for design for sustainable behaviour. J. Clean. Prod. 2015, 106, 680–689. [Google Scholar] [CrossRef]
  20. Rosted, J. User-Driven Innovation. Results and Recommendations; Fora: Copenhagen, Denmark, 2005. [Google Scholar]
  21. Won, H. Designs for sensing radiation: Deployment of a tangible interface and a visual projection interface for user interaction. Arch. Des. Res. 2020, 33, 57–71. [Google Scholar] [CrossRef]
  22. Tsukada, A.; Maeda, T.; Yanagisawa, H.; Kaneko, S.; Mirakami, T.; Tozaki, M.; Tamaru, E.; Hasuike, K. Proposal for User-observation Design Assistant System Focused on Field Work. IFAC Proc. Vol. 2010, 43, 245–250. [Google Scholar] [CrossRef]
  23. Jaglarz, A. Color as a Key Factor in Creating Sustainable Living Spaces for Seniors. Sustainability 2024, 16, 10251. [Google Scholar] [CrossRef]
  24. Zhou, M.; Li, M.; Ono, K.; Watanabe, M. A Comparative Study of the User Interaction Behavior and Experience in a Home-Oriented Multi-User Interface (MUI) During Family Collaborative Cooking. Future Internet 2024, 16, 478. [Google Scholar] [CrossRef]
  25. Nippert-Eng, C. Watching Closely: A Guide to Ethnographic Observation; Oxford University Press: Oxford, UK, 2015. [Google Scholar]
  26. Lee, R.P. A Study on the early modernist woman architect, Margarete Schutte-Lihotzky-A Revolution of woman’s space or an assignment to the new industrialization? Korean Inst. Inter. Des. J. 2005, 14, 20–27. [Google Scholar]
  27. Yanagisawa, H.; Kozuka, Y.; Matsunaga, M.; Murakami, T. Observation support system for recording, reviewing and sharing observed design problems. In Proceedings of the International Association of Societies of Design Research (IASDR 2009), Seoul, Republic of Korea, 18–22 October 2009; pp. 1–10. [Google Scholar]
  28. Janesick, V.J. Ethnographic inquiry: Understanding culture and experience. In Forms of Curriculum Inquiry; State University of New York Press: New York, NY, USA, 1991; pp. 101–119. [Google Scholar]
  29. Lopez-Dicastillo, O.; Belintxon, M. The challenges of participant observations of cultural encounters within an ethnographic study. Procedia-Soc. Behav. Sci. 2014, 132, 522–526. [Google Scholar] [CrossRef]
  30. Martin, J.L.; Clark, D.J.; Morgan, S.P.; Crowe, J.A.; Murphy, E. A user-centred approach to requirements elicitation in medical device development: A case study from an industry perspective. Appl. Ergon. 2012, 43, 184–190. [Google Scholar] [CrossRef] [PubMed]
  31. Ducharme, D.A.; Arcand, I. Using Noldus Observer XT for research on deaf signers learning to read: An innovative methodology. Behav. Res. Methods 2009, 41, 833–840. [Google Scholar] [CrossRef] [PubMed]
  32. Cohen, I.L.; Gardner, J.M.; Karmel, B.Z.; Kim, S.Y. Rating scale measures are associated with Noldus EthoVision-XT video tracking of behaviors of children on the autism spectrum. Mol. Autism 2014, 5, 15. [Google Scholar] [CrossRef] [PubMed]
  33. Kanakri, S.M.; Shepley, M.; Tassinary, L.G.; Varni, J.W.; Fawaz, H.M. An observational study of classroom acoustical design and repetitive behaviors in children with autism. Environ. Behav. 2017, 49, 847–873. [Google Scholar] [CrossRef]
  34. Sun, R.; Zhang, G.; Yuan, Z. The Preliminary Application of Observer XT (12.0) in a Pilot-Behavior Study. In Proceedings of the Engineering Psychology and Cognitive Ergonomics: 15th International Conference, EPCE 2018, Held as Part of HCI International 2018, Las Vegas, NV, USA, 15–20 July 2018; Proceedings 15. Springer International Publishing: Berlin/Heidelberg, Germany, 2018; pp. 686–700. [Google Scholar]
  35. Noldus LP, J.J.; Spink, A.J.; Bollen, R.; Heffelaar, T. Smart mobility: Driver state estimation and advanced driver-vehicle interfaces. In Mobility Engineering, Proceedings of the CAETS 2015 Convocation on Pathways to Sustainability, New Delhi, India, 13–15 October 2015; Springer: Singapore, 2017; pp. 11–18. [Google Scholar]
  36. Huang, Y. The Analysis of User Research Method Based on User Cultural Factors-Focus on Behavior in Children’s Roomactors; Kookmin University: Seoul, Republic of Korea, 2008; Available online: http://www.riss.kr/link?id=T11475238 (accessed on 1 January 2022).
  37. Kim, M.; Choi, K.R. A Study on Kitchen Use Behaviors through User Observation-Focused on Small-sized Apartments in Shanghai, China. Korean Inst. Inter. Des. J. 2015, 24, 121–128. [Google Scholar]
  38. Liu, J.; Meng, B.; Wang, J.; Chen, S.; Tian, B.; Zhi, G. Exploring the Spatiotemporal Patterns of Residents’ Daily Activities Using Text-Based Social Media Data: A Case Study of Beijing, China. ISPRS Int. J. Geo-Inf. 2021, 10, 389. [Google Scholar] [CrossRef]
  39. Guan, C.Q.; Wang, Y.; Wang, Y. Grandparenting Role on Math Online Learning in Chinese Multigenerational Households. Sustainability 2022, 14, 11551. [Google Scholar] [CrossRef]
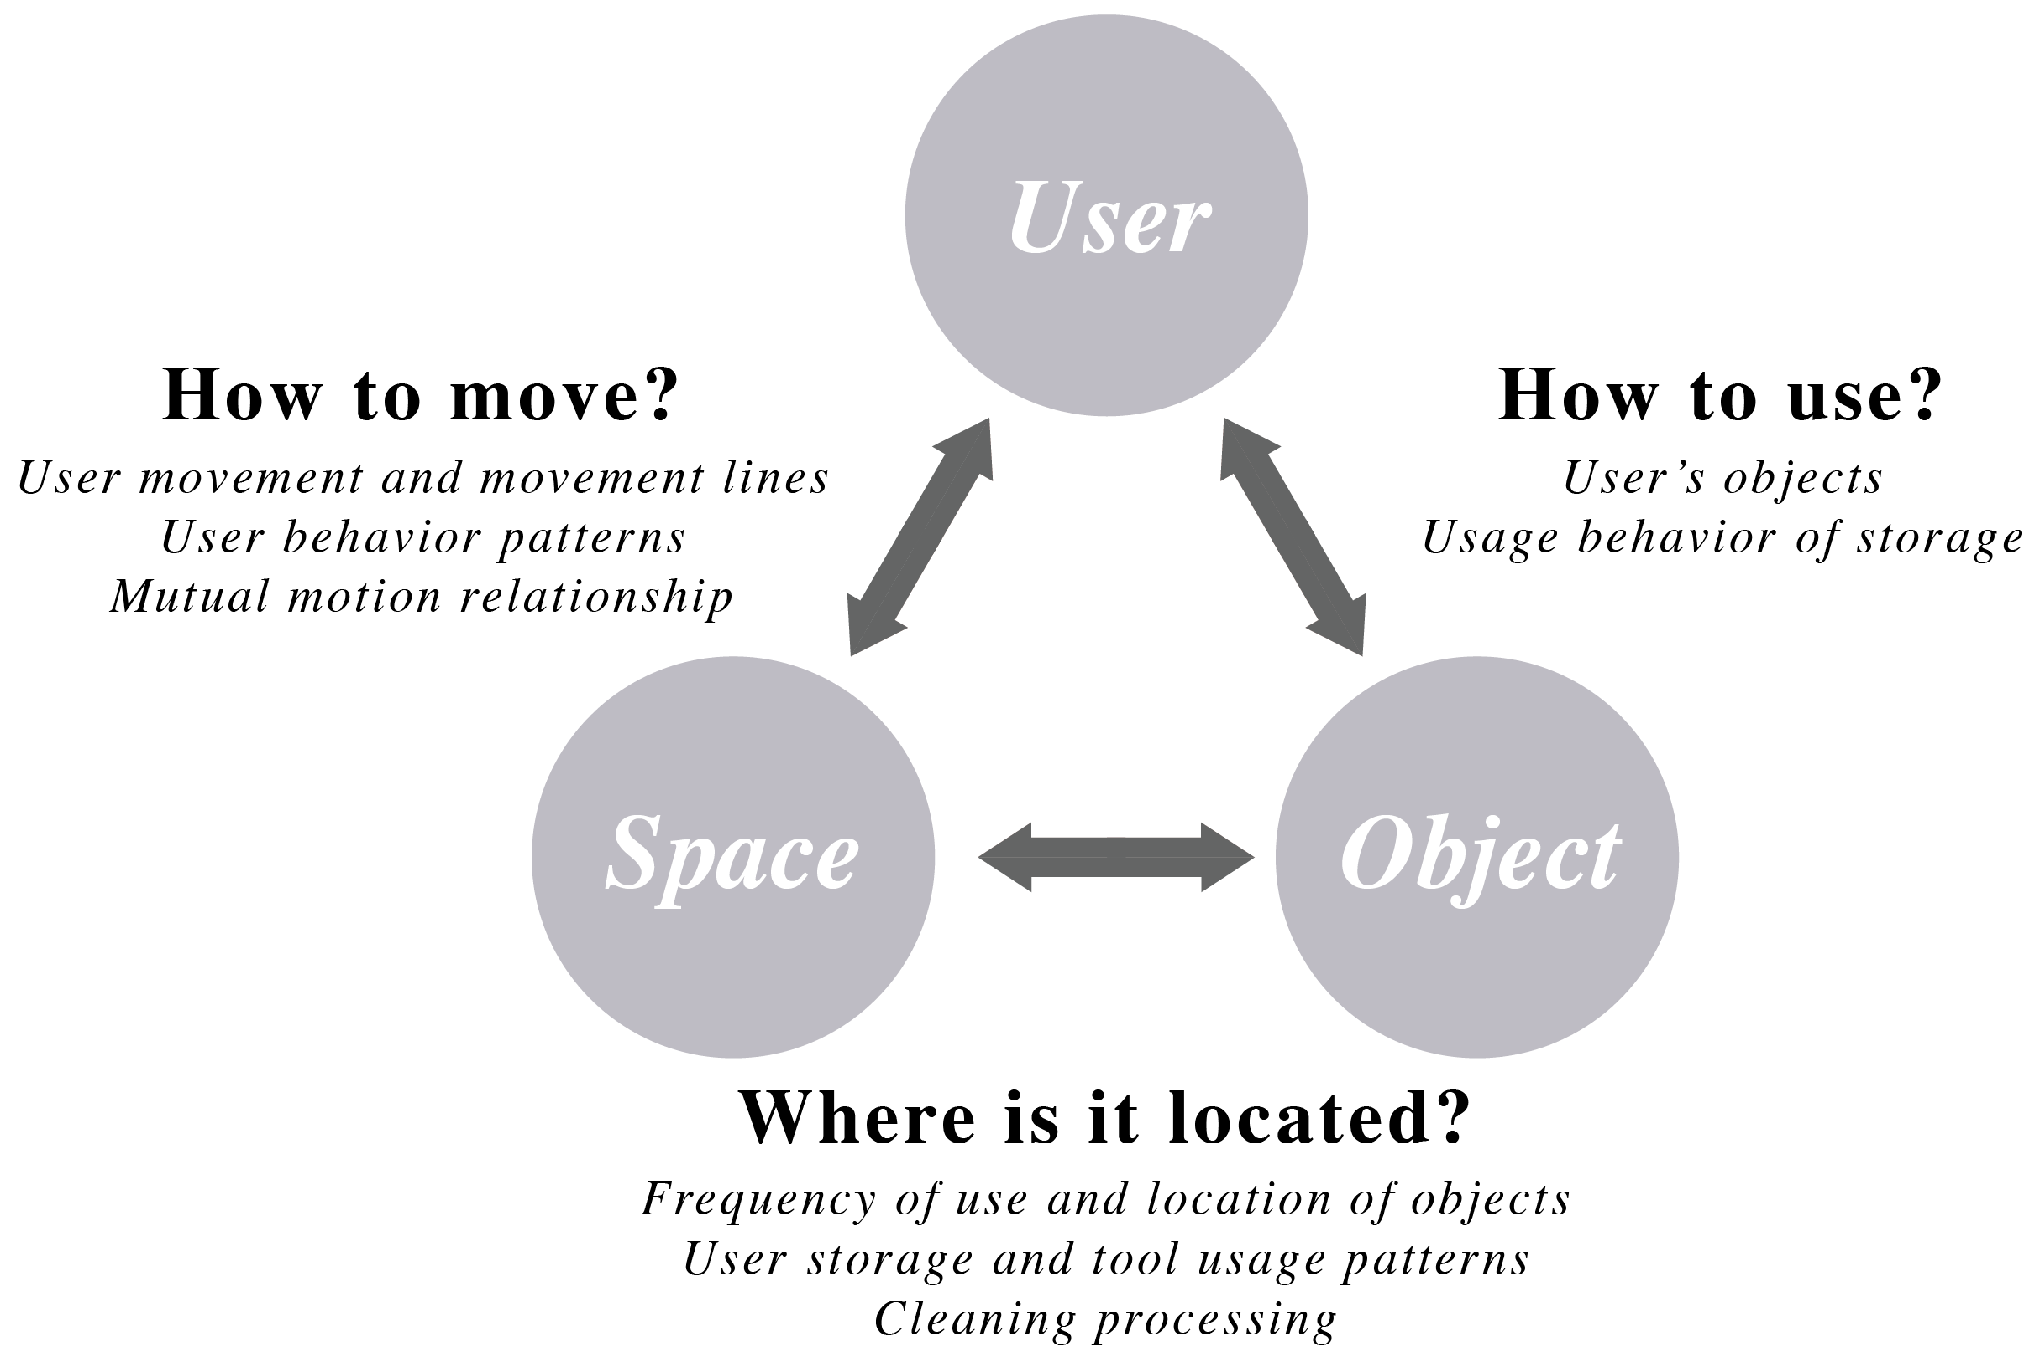
Figure 1. User–space–object factors in user observation.
Buildings 15 00576 g001
Figure 2. (a) Description of existing living behavior classification; (b) behavioral codes for composite lifestyle were reorganized through behavioral card classification method.
Buildings 15 00576 g002
Figure 3. Code input interface.
Buildings 15 00576 g003
Figure 4. Visualization interface in the Noldus Observer XT.
Buildings 15 00576 g004
Figure 5. Timeline of 14-day behaviors of ab2.01 father case.
Buildings 15 00576 g005
Figure 6. Timeline data legend.
Buildings 15 00576 g006
Figure 7. Distribution of frequency and duration of behaviors.
Buildings 15 00576 g007
Figure 8. (a) Behavior ratio of 11 main behaviors; (b) behavior ratio of 3 styles of life behaviors.
Buildings 15 00576 g008
Figure 9. Spatio-temporal data on residential behavior.
Buildings 15 00576 g009
Figure 10. Temporal differences in behavior.
Buildings 15 00576 g010
Figure 11. Child’s behavior in living room.
Buildings 15 00576 g011
Figure 12. Eating-centered behavior.
Buildings 15 00576 g012
Table 1. Research participant information—Group A (0–3 years old).
Family CodePlanInformation
a2.01Buildings 15 00576 i00188 m2—Girl, 3rd
a2.02Buildings 15 00576 i00289 m2—Boy, 3rd
a2.03Buildings 15 00576 i00390 m2—Girl, 2nd
a2.04Buildings 15 00576 i004100 m2—Boy, 3rd
a3.01Buildings 15 00576 i005102 m2—Boy, 3rd
ac3.01Buildings 15 00576 i00670 m2—Boy, 9th; Girl, 1st
ac3.02Buildings 15 00576 i007110 m2—Boy, 10th; Girl, 1st
Table 2. Research participant information—Group B (4–7 years old).
Family CodePlanInformation
ab2.01Buildings 15 00576 i00880 m2—Boy, 6th; Boy, 3m
ab3.01Buildings 15 00576 i009150 m2—Boy, 7th; Boy, 7m
b3.01Buildings 15 00576 i010141 m2—Boy, 7th
b2.01Buildings 15 00576 i01189 m2—Girl, 5th
b2.02Buildings 15 00576 i012141 m2—Boy, 7th
Table 3. Research participant information—Group C (9–12 years old).
Family CodePlanInformation
c3.01Buildings 15 00576 i013138 m2—Girl, 9th
c3.02Buildings 15 00576 i014143 m2—Boy, 9th
c3.03Buildings 15 00576 i01580 m2—Girl, 8th
c3.04Buildings 15 00576 i01676 m2—Boy, 7th
c2.01Buildings 15 00576 i017120 m2—Girl, 10th
c2.02Buildings 15 00576 i01889 m2—Boy, 8th
c2.03Buildings 15 00576 i01965 m2—Boy, 10th
Table 4. Research participant information—Group D (13–17 years old).
Family CodePlanInformation
d2.01Buildings 15 00576 i02094 m2—Boy, 13th
d2.02Buildings 15 00576 i02170 m2—Boy, 13th
d2.03Buildings 15 00576 i02299 m2—Boy, 16th
d2.04Buildings 15 00576 i023150 m2—Boy, 13th
d3.01Buildings 15 00576 i024135.5 m2—Boy, 16th
d3.02Buildings 15 00576 i02575 m2—Boy, 16th
Table 5. Recorded family information.
Family CodeRecorded Plan
ab2.01Buildings 15 00576 i026
c3.04Buildings 15 00576 i027
a2.02Buildings 15 00576 i028
c2.02Buildings 15 00576 i029
b2.01Buildings 15 00576 i030
c3.02Buildings 15 00576 i031
Table 6. Coding categories.
User CodeBehavior CodeSpace CodeObject Code
Mother
Father
Kid1
Kid2
Grandmother
Grandfather
Guest
Nanny
Cooking (CO)
Doing housework (DH)
Working (WO)
Caring for kid (CK)
Self-management (SM)
Eating (EA)
Communicating (CM)
Education (ED)
Resting (RE)
Physiological activities (PAs)
Using object (UO)
Living room
Bathroom
Kitchen
Entrance
Utility
Dining room
Main room
Room1
Room2
Cooking Object
Housework Object
Office Object
Bedding
Personal Object
Food
Furniture
Electronics
Kid Object
Table 7. Coding categories.
Behavior CodingSub-Behavior CodingDescription
Cooking (CO)
Act of cooking in all processes, specifically refers to cooking
Preparing foodProcess of preparing food, including washing vegetables, panning rice, cutting vegetables, and other acts in preparation process of cooking
DishwashingWashing dishes and cooking utensils
Cooking foodMain process of cooking, frying, steaming, and other acts in process of cooking
CleaningCleanup of cooking areas and other related cleanup actions
Doing housework (DH)
Housework-related behaviors
Organizing thingsBehaviors of organizing stuff
Cleaning roomAct of cleaning up room
LaundryAct of washing clothes and other fabrics
Working (WO)
Work-related behaviors
ReadingSpecifically refers to act of reading at work
WritingActs of writing and other writing-related actions
Using electronicsUse of electric appliances at work
Caring for kid (CK)
Parenting behaviors that are specific to parents and relate to their children
Dressing kidBehaviors of helping kids get dressed
Cleaning kidBehaviors of helping kids keep proper hygiene, such as wiping child’s mouth
Feeding kidFeeding children, such as food and snacks; helping them drink water, take medicine, etc.
Holding kidAct of caring that refers specifically to holding child
Playing with kidRecreational activities with children
Self-management (SM)
Behaviors of taking care of one’s body and beauty
Exercising-
Skin care-
Taking medicineAct of taking medicine and using health care products
DressingBehaviors such as putting on clothes and shoes
Eating (EA)
Behaviors related to eating
Eating mealAct of eating regular meals such as breakfast, lunch, and dinner
Eating snack-
Drinking-
Communicating (CM)
Communication-related behaviors
ConversationCommunicative act of dialog, specifically verbal communication
Physical interactionPhysical interaction, specifically act of physical contact
Receiving guests-
Education (ED)
Child-related educational behaviors
TeachingSpecifically referring to parents teaching children
PunishingChastising child, including verbal punitive behaviors
Art activityArt-related activities (e.g., singing, dancing, painting, playing instruments, etc.)
StudyingHere, exclusively refers to children’s learning behaviors, and parents’ learning behaviors are categorized as “working”
Resting (RE)
Leisure-related behaviors
Taking napNaps, brief acts of rest
Reading bookRecreational reading (does not refer to learning through reading)
Taking photoTake photos and videos and perform other actions
SleepingRefers specifically to sleeping
Watching TV-
Doing hobbies-
Playing gamesRecreational playing behavior, game-related behaviors
Non-in-person chattingTalking on phone, chatting online, and other related behaviors
Physiological activities (PAs)Physiological activitiesPhysiological behaviors, such as urination and defecation
Using object (UO)Using objectRefers specifically to use of objects that cannot be recorded at same time as other acts, including appliances and furniture
Table 8. Data output.
Case CodeTime (h.m.s)Duration (s)UserBehaviorObjectSpaceStart–StopInsights
ab2.01-101808:10:51196.404MotherPreparing foodFood ingredientKitchenState starts
ab2.01-101808:14:080MotherPreparing foodFood ingredientKitchenState stops
ab2.01-101808:14:08203.954MotherCooking foodCookerKitchenState starts
ab2.01-101808:17:320MotherCooking foodCookerKitchenState stops
ab2.01-101808:22:1653.0112FatherToileting BathroomState starts
ab2.01-101808:23:090FatherToileting BathroomState stops
ab2.01-101808:23:4862.8544Kid1Toileting BathroomState starts
ab2.01-101808:24:510Kid1Toileting BathroomState stopsm: wear socks
Table 9. Behavior duration data in living room.
WorkdayWeekend
CodeUser1st2nd3rd4th1st2nd3rd4th
ab2.01FUO50.0EA24.1CM19.8RE11.6RE75.3EA50.5UO37.6CM29.4
0.410.200.160.100.440.300.220.17
MEA25.8UO22.4CM21.7CK11.8EA67.8UO55.5CM49.6DH27.9
0.260.220.220.120.340.280.250.14
K1RE146.9CM21.3EA19.6ED9.7RE51.8CM15.4EA11.2ED9.7
0.740.110.100.050.240.070.050.04
K2RE156.0CM26.3EA25.5UO1.3RE188.9EA35.3CM32.0UO1.1
0.750.130.120.010.730.140.120.00
c3.04FRE82.9EA23.7UO21.5CM8.5RE313.3UO64.7EA18.9SM9.0
0.540.150.140.060.750.160.050.02
MRE30.4UO22.9EA17.7CM11.0UO24.1RE21.2ED15.4SM12.4
0.300.230.180.110.260.230.160.13
KRE111.0EA42.2UO11.3CM3.9RE24.2UO16.7EA7.5ED3.5
0.640.240.070.020.170.120.050.02
a2.02FRE112.2CO26.9EA25.7WO23.0RE291.3EA74.7WO26.2CM8.1
0.550.130.130.110.700.180.060.02
MRE292.9EA128.5CK94.0WO68.3RE275.7EA159.1WO91.8DH20.9
0.440.190.140.100.420.240.140.03
KRE233.4EA59.6UO23.8CM21.3RE130.3EA17.3UO14.6CM5.8
0.670.170.070.060.310.040.030.01
GCM55.7RE23.4CK23.2DH13.6CM22.4RE22.3CK14.8CO10.7
0.370.160.150.090.260.260.170.13
c2.02FEA24.1CM23.8UO6.3DH2.4EA14.7CM12.8UO7.8WO7.2
0.400.390.100.040.300.260.160.15
MDH21.4CM20.9WO12.2ED6.2WO36.9DH11.1CM9.8EA3.6
0.250.240.140.070.560.170.150.06
KED37.4CM27.4EA23.4UO3.6RE7.0ED7.0CM4.3UO2.3
0.390.280.240.040.110.110.070.04
b2.01FUO58.7RE40.7EA21.4CM13.5RE109.6UO105.5CM68.3WO64.1
0.390.270.140.090.270.260.170.16
MUO15.8EA15.0CM11.3CK10.1UO31.5CM24.5CK20.5EA21.3
0.200.190.140.130.280.220.180.19
KRE122.2EA30.6CM28.6SM5.1RE66.9EA21.6CM17.5SM2.7
0.610.150.140.030.230.080.060.01
GRE123.4WO73.2DH71.0EA51.2UO86.5RE81.9EA58.5DH37.2
0.340.200.200.140.260.240.170.11
c3.02FWO83.6WO15.1CM8.1EA6.3WO195.1CM30.9UO12.1EA6.6
0.670.120.060.050.750.120.050.03
MUO46.0WO21.5EA18.5CM15.0UO73.0CM23.7EA21.8SM13.4
0.410.190.170.140.480.160.140.09
KRE54.5ED45.8UO39.1EA15.3ED33.0RE15.3CM14.8EA8.6
Table 10. Behavior duration data in kitchen.
Family CodeFatherMotherKid1Kid2/Grandmother
ab2.01Buildings 15 00576 i032Buildings 15 00576 i033Buildings 15 00576 i034Buildings 15 00576 i035
c3.04Buildings 15 00576 i036Buildings 15 00576 i037Buildings 15 00576 i038-
a2.02Buildings 15 00576 i039Buildings 15 00576 i040Buildings 15 00576 i041Buildings 15 00576 i042
c2.02Buildings 15 00576 i043Buildings 15 00576 i044Buildings 15 00576 i045-
b2.01Buildings 15 00576 i046Buildings 15 00576 i047Buildings 15 00576 i048Buildings 15 00576 i049
c3.02Buildings 15 00576 i050Buildings 15 00576 i051Buildings 15 00576 i052-
Disclaimer/Publisher’s Note: The statements, opinions and data contained in all publications are solely those of the individual author(s) and contributor(s) and not of MDPI and/or the editor(s). MDPI and/or the editor(s) disclaim responsibility for any injury to people or property resulting from any ideas, methods, instructions or products referred to in the content.