Article

The Passive Control of Nonlinear Dynamic Response Using the Force Analogy Method in a Chimney Located in a Wind- and Seismic-Prone Region in Mexico

by
Hugo Hernández Barrios
1,*,
Carlos Mauricio Patlán Manjarrez
2 and
Roberto Gómez Martínez
3
1
School of Civil Engineering, Universidad Michoacana de San Nicolás de Hidalgo, Morelia 58030, Mexico
2
School of Civil Engineering, Universidad Nacional Autónoma de México, Mexico City 04510, Mexico
3
Institute of Engineering, Universidad Nacional Autónoma de México, Mexico City 04510, Mexico
*
Author to whom correspondence should be addressed.
Buildings 2025, 15(3), 459; https://doi.org/10.3390/buildings15030459
Submission received: 30 December 2024 / Revised: 21 January 2025 / Accepted: 26 January 2025 / Published: 2 February 2025
(This article belongs to the Special Issue Research in Structural Engineering and Mechanics)

Abstract

This study investigates the control of seismic and wind-induced responses in reinforced concrete chimneys, incorporating material nonlinearity and soil–structure interaction. Using the Force Analogy Method (FAM), an innovative approach for nonlinear dynamic analysis, the performance of tuned mass dampers (TMDs) is evaluated under diverse loading scenarios, including seismic sequences with mainshock–aftershock events and wind-induced loads, due to synoptic and hurricane winds, modeled as stochastic processes. The FAM approach enables computationally efficient analysis, effectively capturing the complex interactions between seismic and wind actions across varying soil foundation conditions. The results demonstrate the effectiveness of TMDs in reducing structural responses across various loading and foundation scenarios, emphasizing their efficiency in enhancing the safety and resilience of slender structures. This research provides valuable insights into the application of vibration control strategies for safeguarding critical infrastructure against extreme environmental loads.

1. Introduction

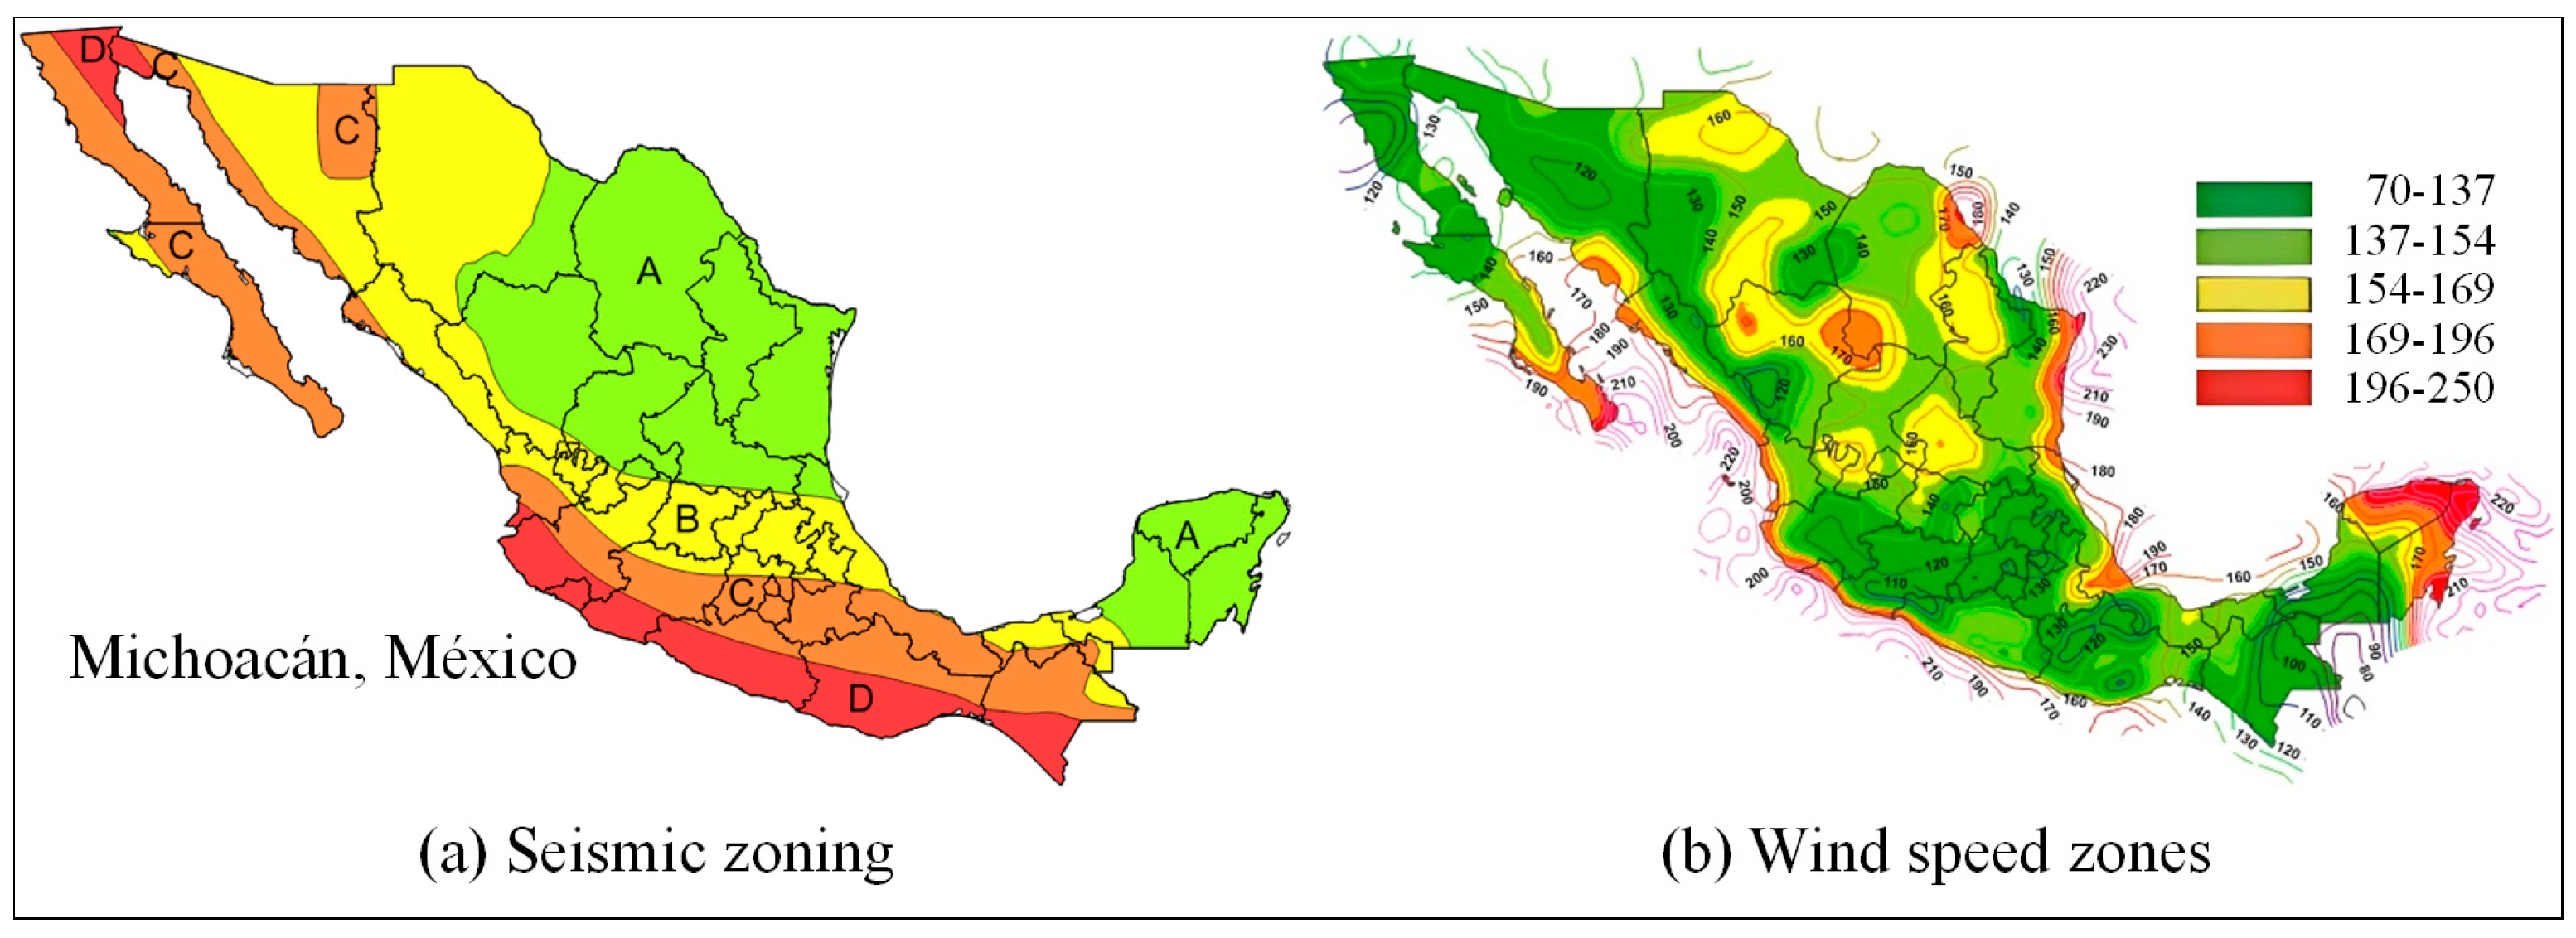
The coastal region of Michoacán, Mexico, is a crucial area for international trade due to its strategic geographical location, serving as the primary point of importation in the country. This region is also abundant in mineral resources, which has led to the development of significant steel production and processing industries. However, the civil infrastructure in Mexico’s Pacific coastal zones faces significant challenges from two main sources: the strong winds generated by frequent tropical cyclones and high-magnitude seismic events. Notably, two of the most devastating earthquakes in Mexican history, which resulted in substantial economic losses and fatalities, originated in Michoacán. The earthquake on 19 September 1985 (Mw 8.1) inflicted extensive damage in Mexico City and surrounding areas, claiming an estimated 10,000 lives and leading to the destruction or severe damage of thousands of buildings. More recently, the earthquake on 19 September 2022 (Mw 7.6) caused damage to approximately 3300 homes, 863 schools, and 41 hospital buildings. Figure 1a illustrates the seismic zoning map of Mexico, where Zone D corresponds to seismic accelerations on rock exceeding 200 cm/s2 [1], designating it as the region with the highest seismic activity.
Tropical cyclones in this region occur most frequently between September and November, and their frequency and intensity have been exacerbated in recent years due to climate change. Figure 1b illustrates a wind regionalization map of a 200-year return period, averaged over a 3 s interval [2]. Along the Pacific Coast, design wind speeds at a height of 10 m over flat terrain can attain levels as high as 250 km/h (69.44 m/s).
The performance of civil infrastructure in this area, classified as both seismic and wind-prone, presents significant challenges, particularly for slender structures. These structures are particularly vulnerable to high dynamic demands, which necessitates innovative design solutions along with effective vibration mitigation strategies. This study specifically examines a chimney, which is a common component in power generation plants, refineries, and industrial complexes, used for the release of gases and vapors. Their slenderness ratio makes them susceptible to important vibrations under seismic and wind loads, underscoring the critical need for vibration control strategies to preserve structural integrity and functionality.
The dynamic behavior of chimneys in response to wind loads has been the subject of extensive study. Previous research has explored the responses of both steel chimneys [3,4,5,6,7] and reinforced concrete chimneys [8,9,10,11,12], primarily concentrating on phenomena such as vortex shedding, crosswind responses, and dynamic property identification through wind tunnel testing and numerical simulations. However, many analyses operate under the assumption of a fixed-base condition, ignoring the impact of soil–structure interaction (SSI), which can lead to an underestimation of the dynamic response. Other studies [13,14] highlight the significance of incorporating soil flexibility as it affects the natural frequency and effective damping of the structure, particularly in slender chimneys.
Additionally, accounting for material nonlinearity is essential for analyzing chimneys subjected to seismic and wind loads. These structures may exhibit inelastic behavior under extreme conditions, necessitating analytical methods that incorporate this nonlinearity. Traditional approaches, such as stiffness matrix updates and finite element methods, have been utilized in prior research to model nonlinear behavior [15,16,17]. In this work, we employ the Force Analogy Method (FAM), a computationally efficient alternative to conventional stiffness-based approaches [18]. Despite its underexplored status, the FAM facilitates the analysis of inelastic responses while reducing computational demands, making it particularly suitable for studies involving prolonged durations or combined loading scenarios, such as seismic and extreme wind events. The FAM has proven effective in analyzing the inelastic responses of buildings and bridges under seismic and wind demands with high precision and efficiency [18,19,20,21,22,23,24,25,26,27,28,29,30,31,32,33,34,35,36,37,38,39,40,41,42,43,44,45,46,47,48,49,50].
Structural vibration control has proven effective in mitigating excessive responses in chimneys. Passive control systems, such as tuned mass dampers (TMDs), have been utilized to reduce wind-induced displacements and accelerations in slender structures, including steel [51,52], concrete [53], and masonry chimneys [54]. However, the application of TMDs to reinforced concrete chimneys with soil–structure interaction (SSI) under extreme wind or seismic loads remains relatively unexplored.
This study assesses the nonlinear dynamic response of an 80 m tall reinforced concrete chimney situated in Mexico’s Pacific coastal region and proposes a vibration control system based on a TMD installed at the chimney cap. The methodology incorporates SSI, material nonlinearity through the FAM, and the effects of seismic sequences as well as high-velocity wind scenarios.
Wind actions are modeled using synthetic records generated through spectral techniques, considering mean wind speeds ranging from 5 m/s to 25 m/s for synoptic winds and from 30 m/s to 65 m/s for tropical cyclones. For the seismic analysis, two ground motion records from the same station, representing a mainshock and its aftershock, were employed.
The results offer guidelines for the application of TMDs in slender chimneys subjected to high dynamic and wind demands, taking into account different soil types. These findings contribute to enhancing the structural safety and resilience of this critical infrastructure in the face of extreme environmental events.

2. Nonlinear Dynamic Response Using the Force Analogy Method (FAM)

2.1. Basic Concepts

The Force Analogy Method (FAM) serves as an effective tool for addressing structural problems that involve material nonlinearity. It substitutes the source of nonlinearity with changes in displacements, which are termed “inelastic” or “residual displacements”.
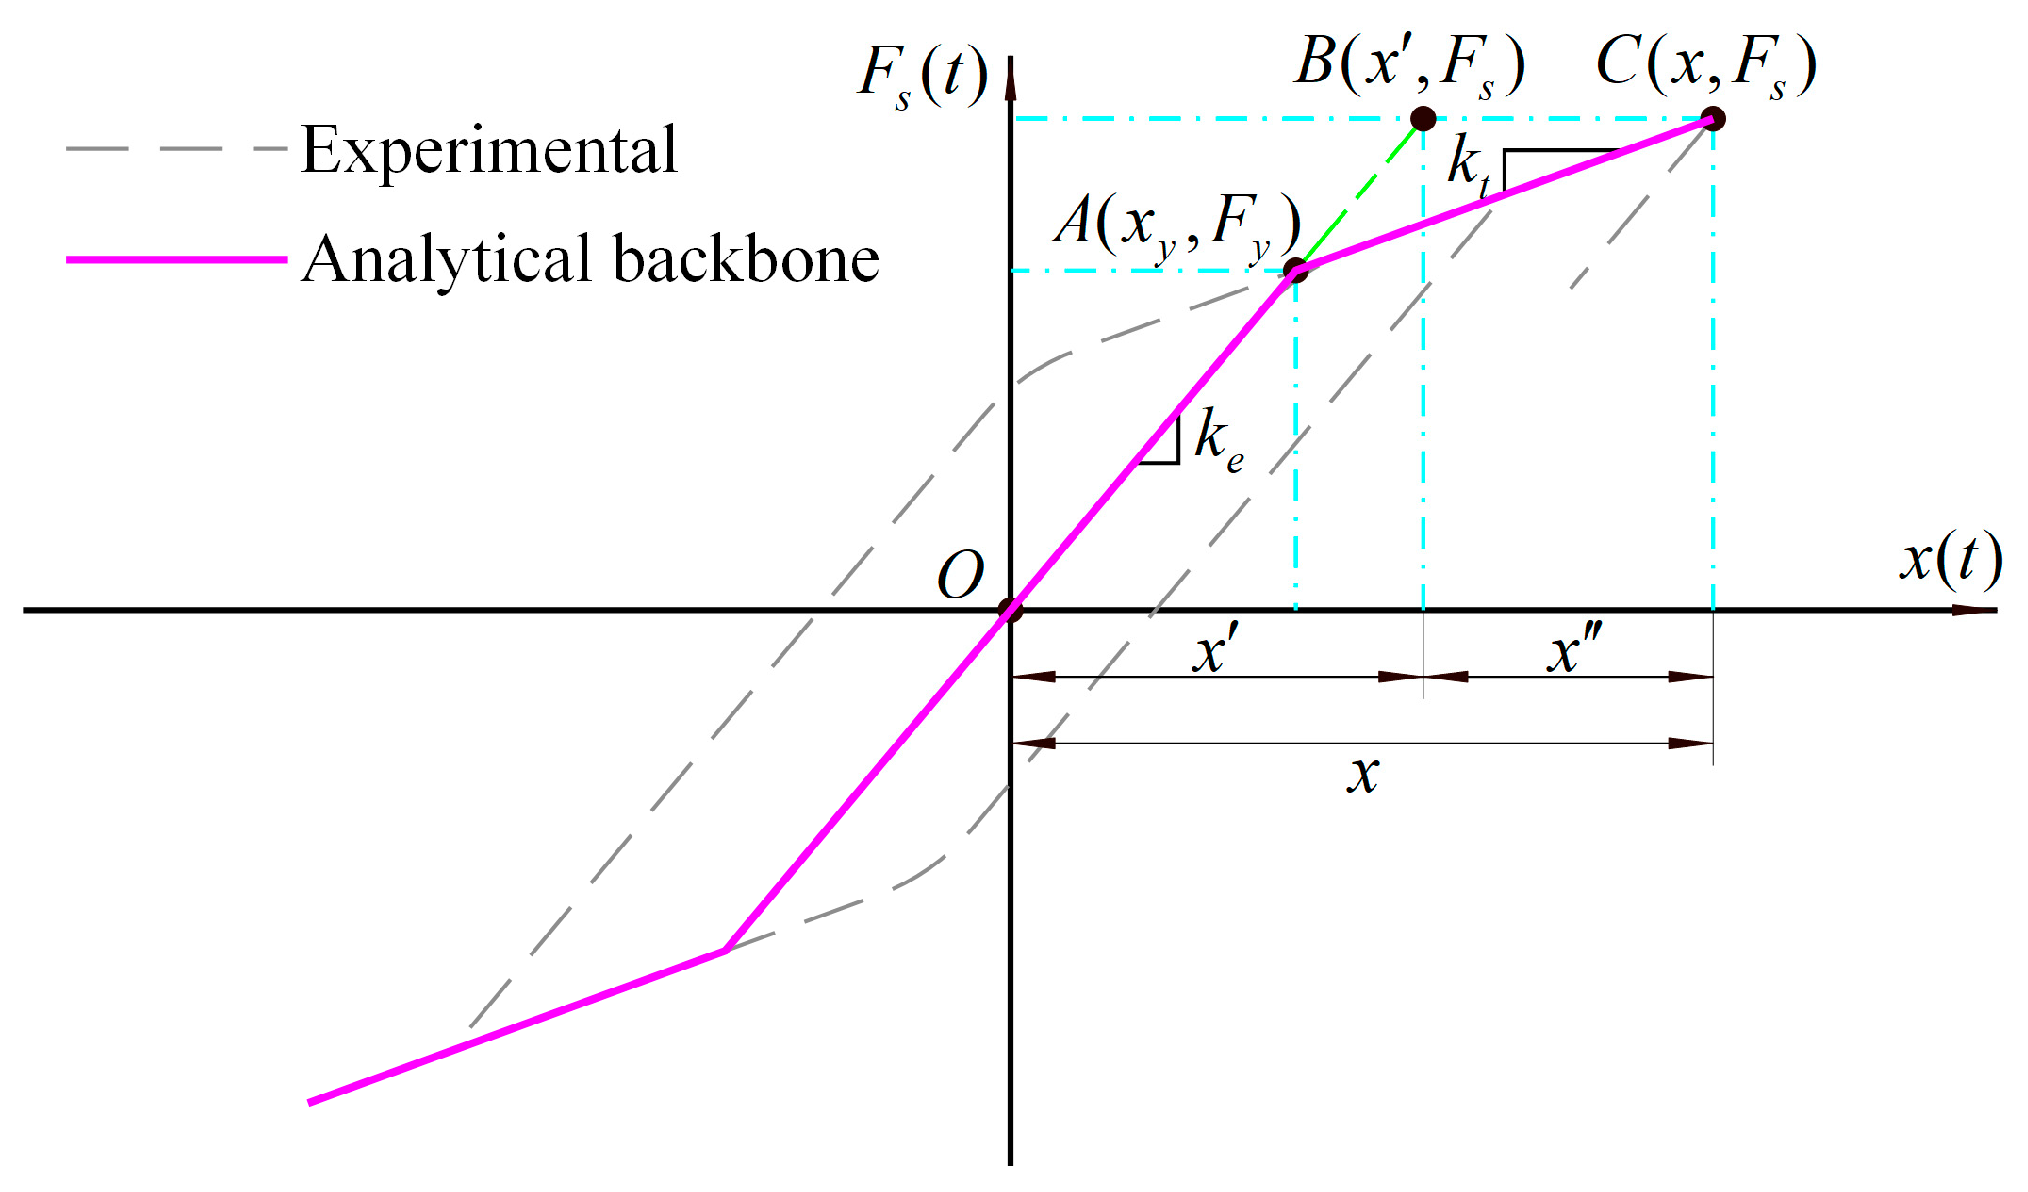
One of its key advantages is its computational efficiency, as the stiffness matrix is computed only once at the beginning of the analysis. When employed, external forces produce inelastic deformations in plastic hinges, manifested as elongations and buckling in braces, rotations in beams and columns, yielding in base isolators, and even geometric nonlinear effects. FAM was reportedly first introduced by Wong and Yang [18] for inelastic structural analysis. Figure 2 illustrates the fundamental force–displacement relationship that characterizes this method.
The total displacement in a structure, denoted as x , as described in Equation (1), comprises a linear elastic component, x , and an inelastic component, x , which is determined by the constitutive laws at each plastic hinge. While the elastic component disappears upon unloading, the inelastic component persists.
x = x + x .
For any displacement x , the force F s is defined as the product of elastic stiffness and elastic displacement:
F s = k e x x .
Equation (3) captures the force–displacement relationships that incorporate inelastic behavior using the FAM:
if   x x y x > x y , then   x = F s / k e , x = 0 x = F s / k e , x > 0 .
For forces below the proportionality limit, F y , the total displacements equate to the elastic displacements, resulting in zero inelastic displacements. However, for forces that exceed this limit, the total displacement aligns with point C in Figure 2. By employing the FAM, the elastic slope is projected to the force F s , which allows us to determine the elastic displacement. The inelastic displacement is then calculated as the difference between the total and elastic displacements.
The fundamental equation for nonlinear analysis utilizing the FAM is expressed as follows:
K K K T K x Λ = F e f ,
where x = x 1 x 2 x n T represents the response of the unconstrained degrees of freedom (DOFs), n denotes the number of unconstrained DOFs, Λ = Λ 1 Λ 2 Λ q T indicates the inelastic response at the plastic hinges, q refers to the total number of plastic hinges, F e represents the external forces applied to the unconstrained DOFs, and f = f 1 f 2 f q T signifies the actions occurring at the plastic hinges.
The stiffness matrices utilized in the FAM include K , which is the stiffness matrix for the unconstrained DOFs; K , which correlates the displacements of the unconstrained DOFs to the inelastic responses at the plastic hinges; and K , which connects the inelastic responses at the plastic hinges to the corresponding actions. Each of these matrices is assembled from the individual elements comprising the structure [50].

2.2. Flexural Model for Concrete Elements

One of the most prominent material nonlinearity models used for the analysis of reinforced concrete structures is the model developed by Takeda, Sozen, and Nielsen [55]. This model effectively captures the cyclic flexural behavior of beams and columns, allowing for an accurate representation of inelastic performance. It was subsequently adapted for the FAM by Li et al. [44].
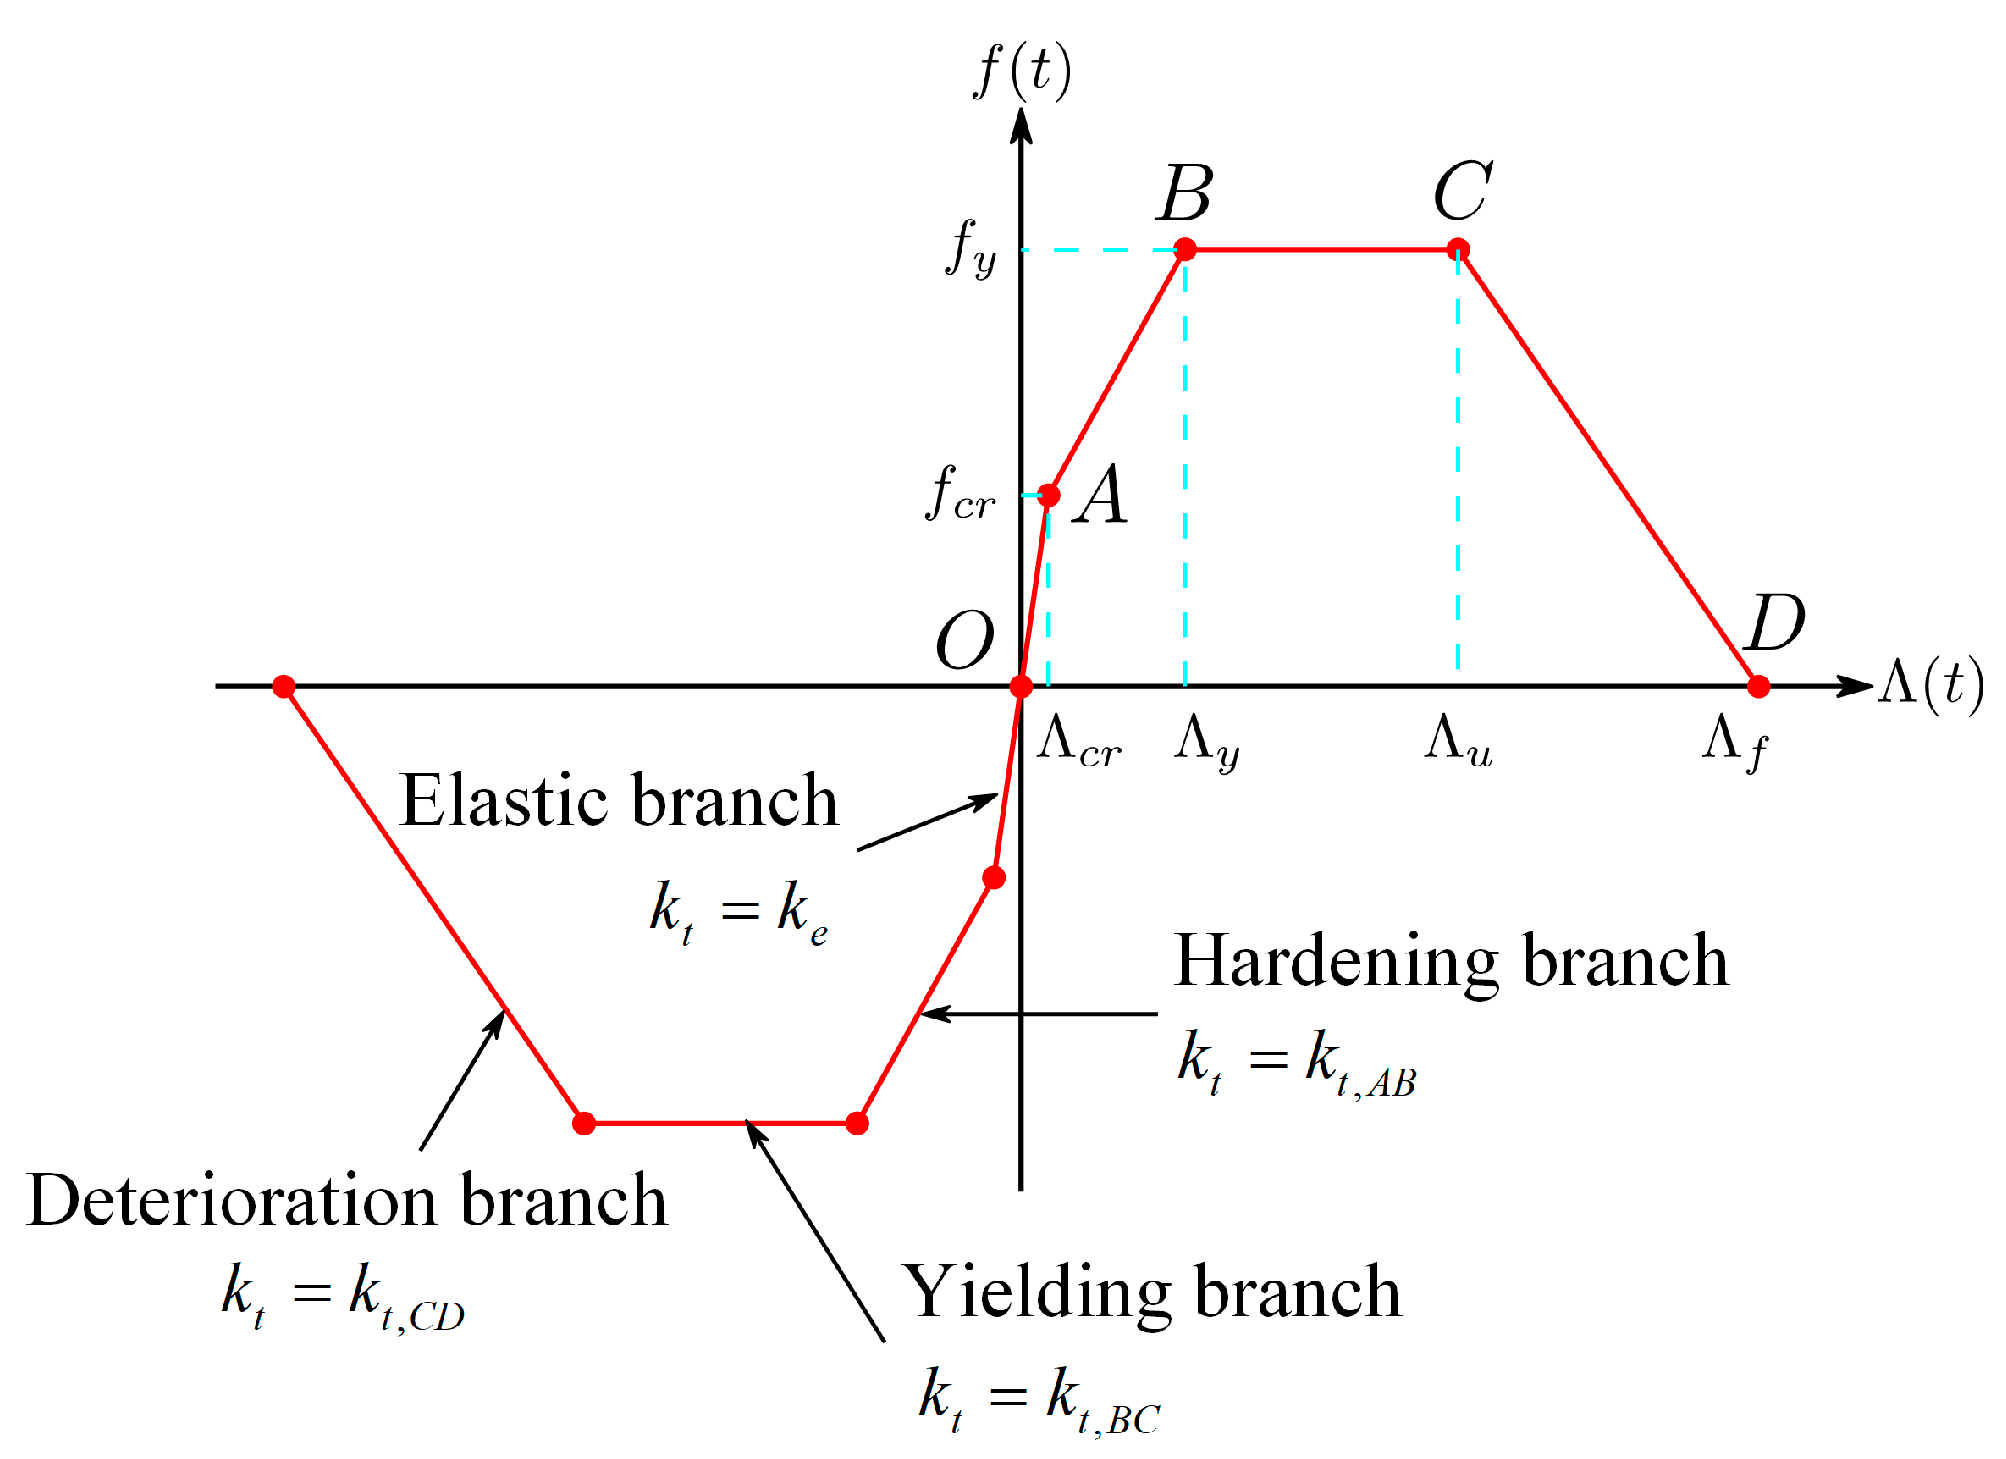
The model is characterized by a monotonic backbone, as shown in Figure 3, which delineates the elastic (OA), hardening (AB), yielding (BC), and degradation (CD) regions [44].
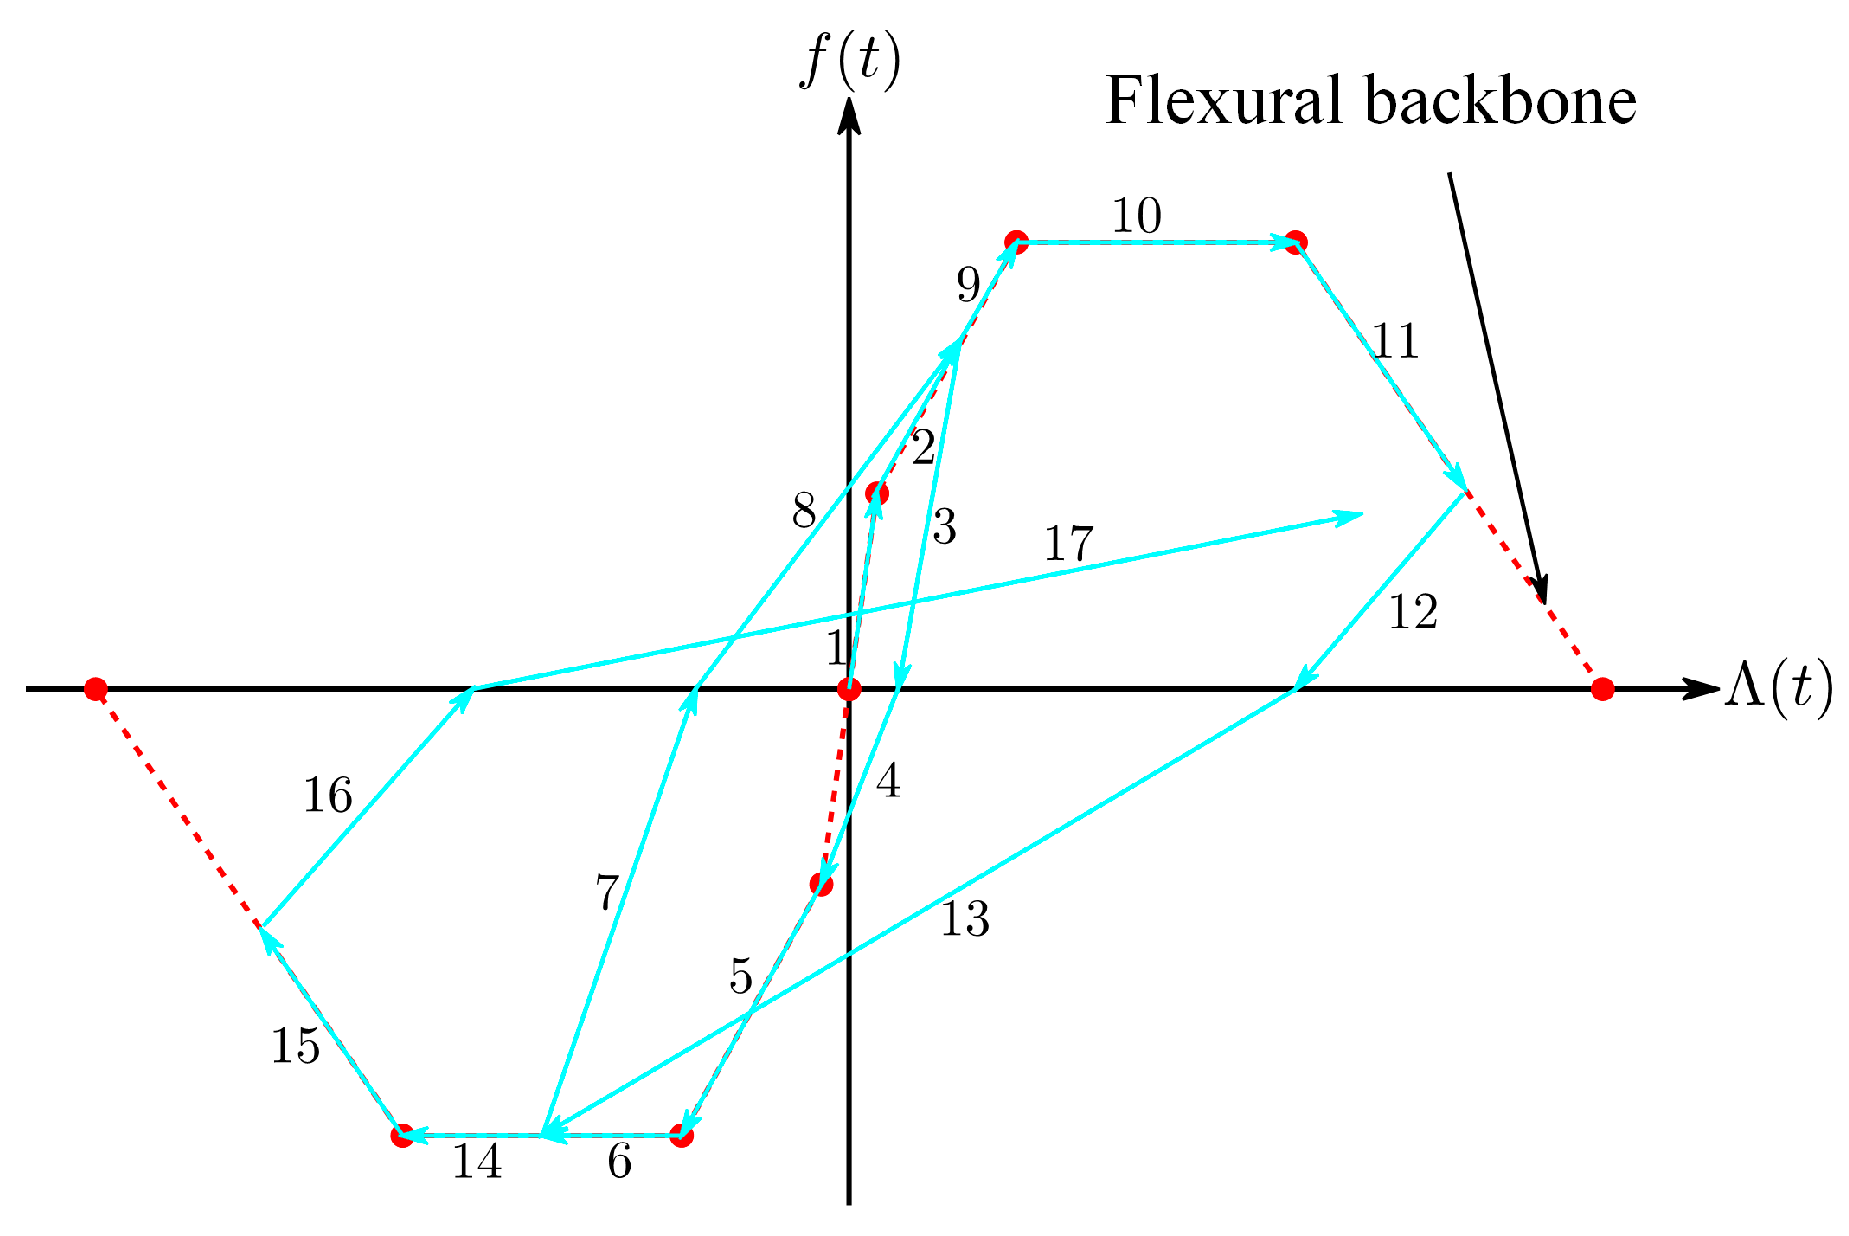
The cyclic response of this model (Figure 4) accurately reflects key characteristics of reinforced concrete in flexure, including stiffness and strength deterioration [50].
There are two primary approaches to characterize cyclic behavior: experimentally derived data and analytically computed moment–curvature relationships. The backbone is established by the cracking moment f c r , yielding moment f y , cracking rotation Λ c r , yielding rotation Λ y , rotation at the onset of strength deterioration Λ u , and fracture rotation Λ f .
The behavior of the model is influenced by the governing equations of its hysteretic loops. When considering the tangent stiffness of the model as k t , the equation that governs local plastic behavior is given by
f = Γ Λ = k t ( Λ Λ i n t ) + f i n t ,
where k t represents the tangent stiffness of the local hinge behavior, f i n t is the moment at the intersection of the hysteretic branch, Λ i n t denotes the rotation at this intersection, and Γ is the function that describes local behavior in terms of rotation Λ .
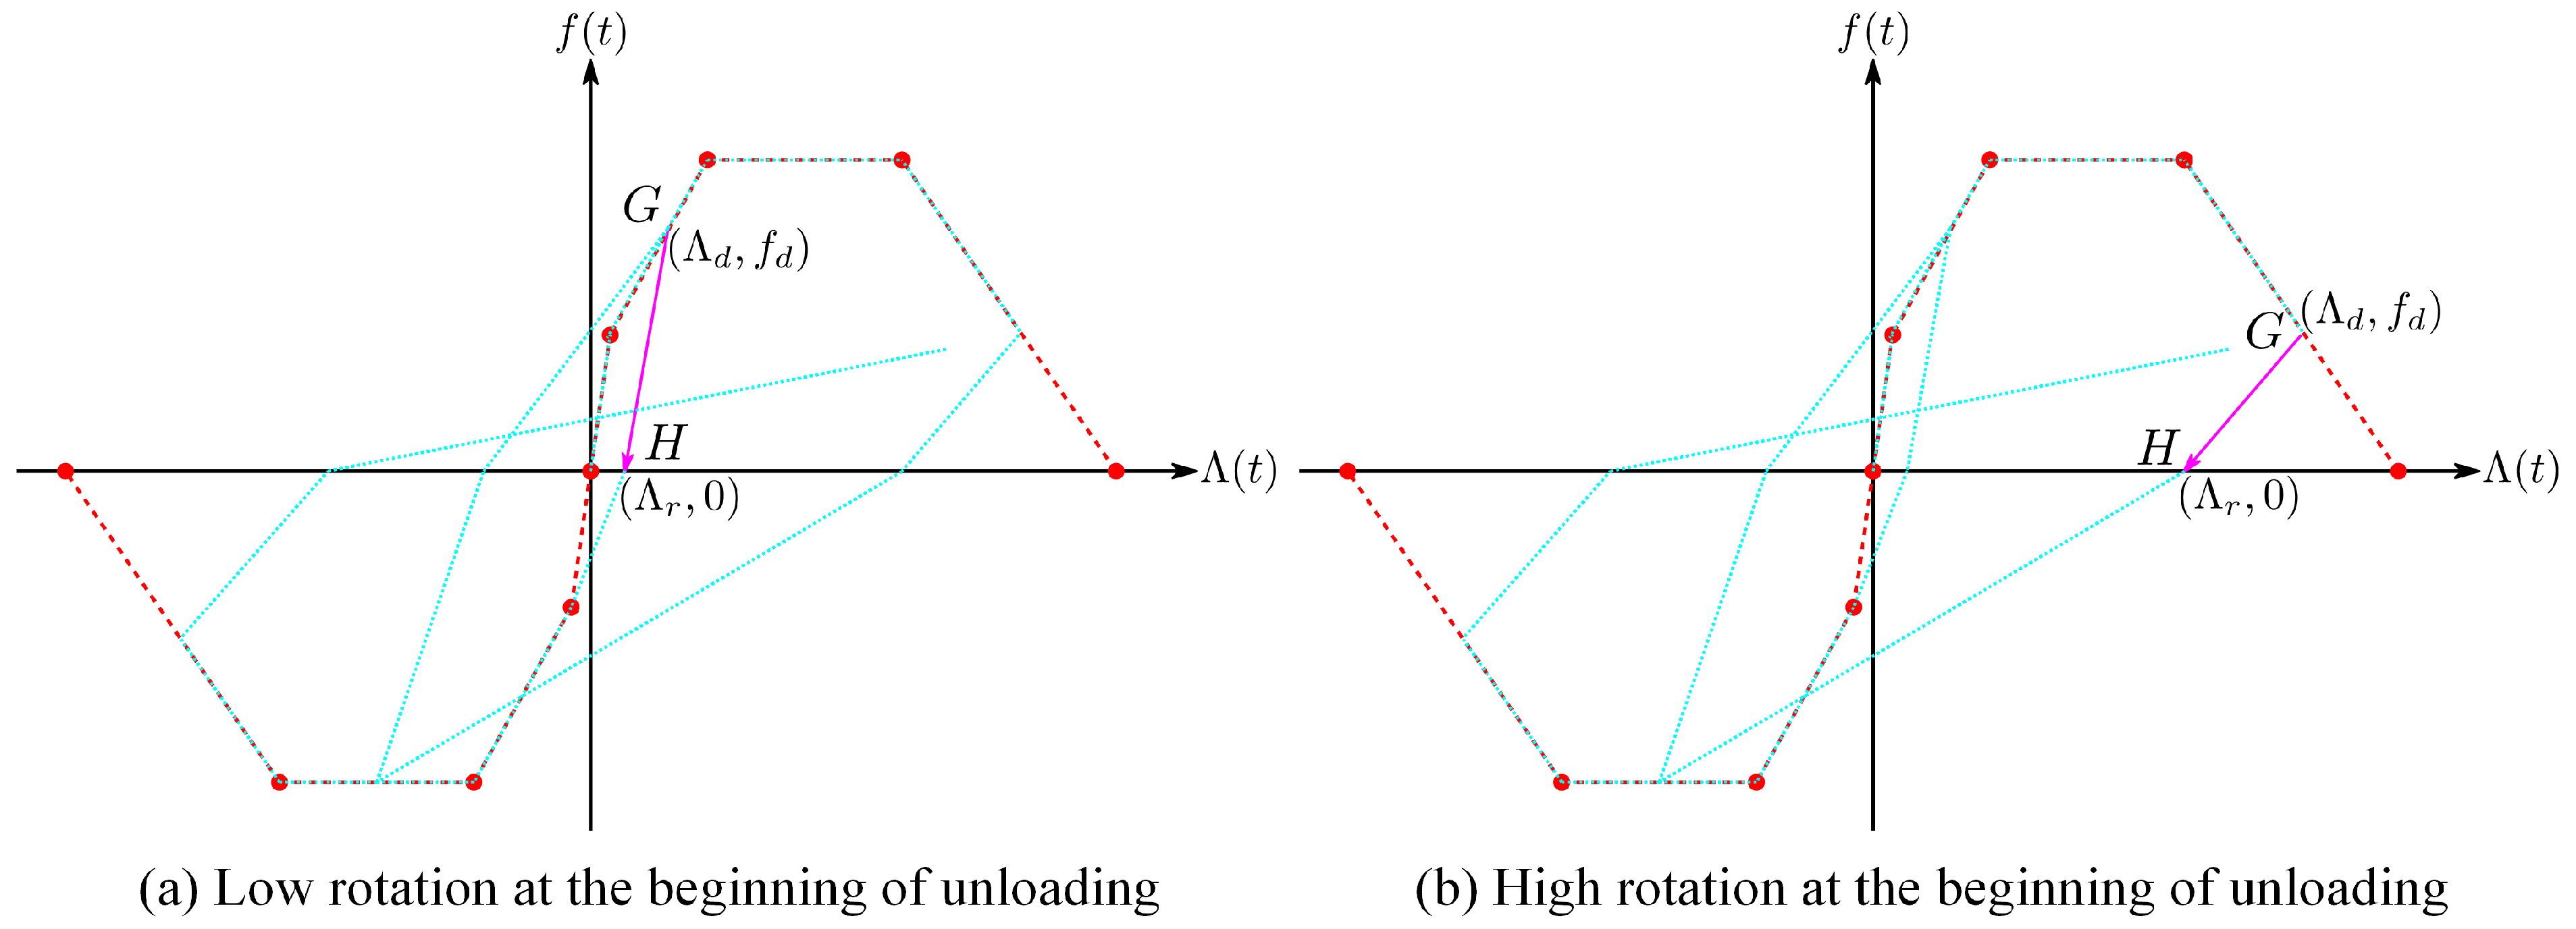
During dynamic analysis, unloading and load reversals take place, which are dictated by updated functions f = Γ Λ . The unloading branch is activated after cracking occurs when the load reverses direction. The unloading branch (GH) for the flexural hinge is illustrated in Figure 5. The tangent stiffness during unloading, as proposed by Sezen and Chowdhury [56], is expressed as follows:
k t = 1.7 k t , A B Λ y Λ d 0.4 ,
where Λ d is the rotation at the beginning of unloading.
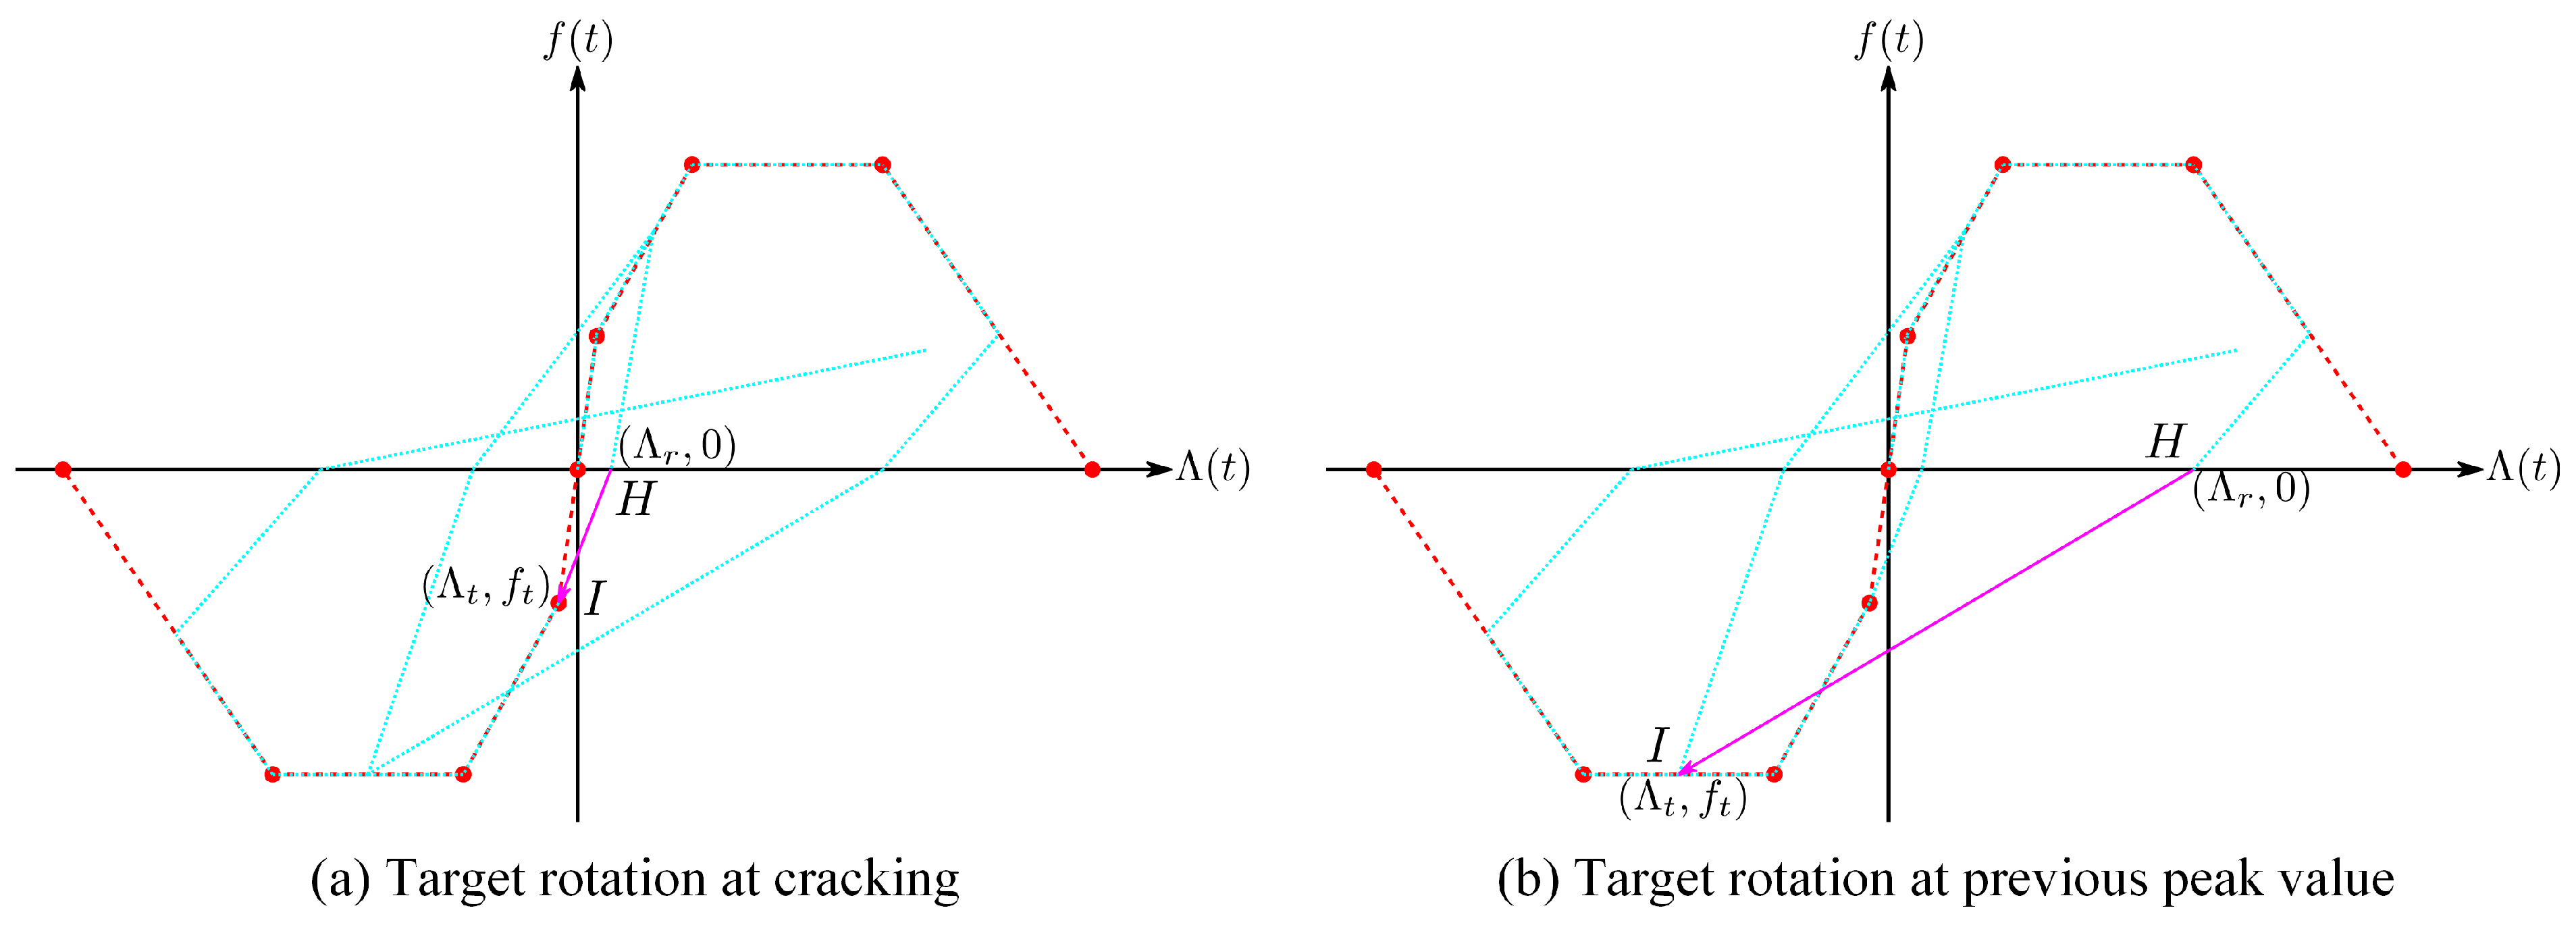
Unloading concludes when the force reaches zero, marking the beginning of load reversal. At this moment, reloading begins, aiming to reach the peak rotation previously achieved in the same loading direction. If the section has not yet cracked in the reloading direction, the target corresponds to the cracking point, as proposed by Xu and Zhang [57]. Figure 6 illustrates the reloading branch (HI) for these conditions.
The reloading stiffness is defined as the slope of the moment–rotation curve that connects the unloading endpoint to the maximum rotation point in the reloading direction:
k t = f t Λ t Λ r ,
where Λ r is the rotation at the end of unloading, while f t and Λ t denote the moment and rotation at the target point in the reloading direction.
Table 1 provides a summary of the plastic behavior exhibited by the branches that characterize hysteretic flexural behavior.

2.3. Time History Nonlinear Analysis

Utilizing the static condensation process [50], the fundamental equation of the FAM is expressed as follows:
K ¯ K ¯ K ¯ T K ¯ x d Λ = F e f ,
where
K ¯ = K d d K d r K r r 1 K r d , K ¯ = K d K d r K r r 1 K r , K ¯ = K K r T K r r 1 K r .
In this context, the subscript d refers to degrees of freedom with applied forces, while the subscript r denotes degrees of freedom without applied forces.
The condensed and continuous equation of motion is written as follows:
M d d x ¨ d ( t ) + C d d x ˙ d ( t ) + K ¯ x d ( t ) = F e ( t ) ,
where M d d represents the mass matrix corresponding to the translational degrees of freedom, C d d = a 1 M d d + a 2 K ¯ is the damping matrix considering proportional damping, and K ¯ is the condensed stiffness matrix.
For seismic analysis, the external force function is defined as follows:
F e ( t ) = M d d x ¨ g ( t )
where x ¨ g ( t ) is the earthquake ground acceleration register. In the case of wind analysis, it is expressed as follows:
F e ( t ) = 1 2 ρ c D a ( U ( Z , t ) ) 2
where ρ represents the air density, c D is the drag coefficient, a denotes the exposed area perpendicular to the wind direction, and U ( Z , t ) is the relative wind velocity.
By substituting the elastic displacement with x d ( t ) = x d ( t ) x d ( t ) , Equation (10) can be rewritten as
M d d x ¨ d ( t ) + C d d x ˙ d ( t ) + K ¯ x d ( t ) = F e ( t ) + K ¯ x d ( t ) .
Equation (11) is solved using the state space formulation [50]. By defining the state vector z ( t ) = x d ( t ) x ˙ d ( t ) T , the discrete and condensed form of the equation of motion in state space formulation is
z ˙ k + 1 = A z k + 1 + F k + 1 + G x k + 1 .
where
A = 0 I M d d 1 K ¯ M d d 1 C d d , F k + 1 = 0 M d d 1 F e , k + 1 , G = 0 M d d 1 K ¯ ,
Here, A represents the state transition matrix, F k + 1 is the discrete state space force vector, G is the inelastic displacement transition matrix, z k + 1 is the discrete state space response of the structure, and k = 1 , 2 , , p , where p denotes the total length of the force vector.
The calculation of inelastic displacements is approached by reformulating Equation (4) incrementally ( Λ k + 1 = Λ k + Δ Λ ). In this process, the stiffness matrices are replaced with their condensed forms, leading to the following expression:
f k + 1 + K ¯ Δ Λ = K ¯ T x d , k + 1 K ¯ Λ k .
In this equation, f k + 1 denotes the discrete actions occurring at the plastic hinges.
To calculate f k + 1 and Δ Λ , Equation (14) along with the flexural model relationships outlined in Table 1 are utilized based on the iterative process proposed by Patlán, Hernández-Barrios, and Gómez [49].
The FAM is applied individually to each plastic hinge, denoted by i (where i = 1 , 2 , , q ), with q representing the total number of plastic hinges. The iteration variable j is initialized to zero, and the convergence criterion is set as | f k + 1 j f k + 1 j 1 | < t o l , where t o l = 1 × 10 6 | f k + 1 j | is the convergence tolerance.
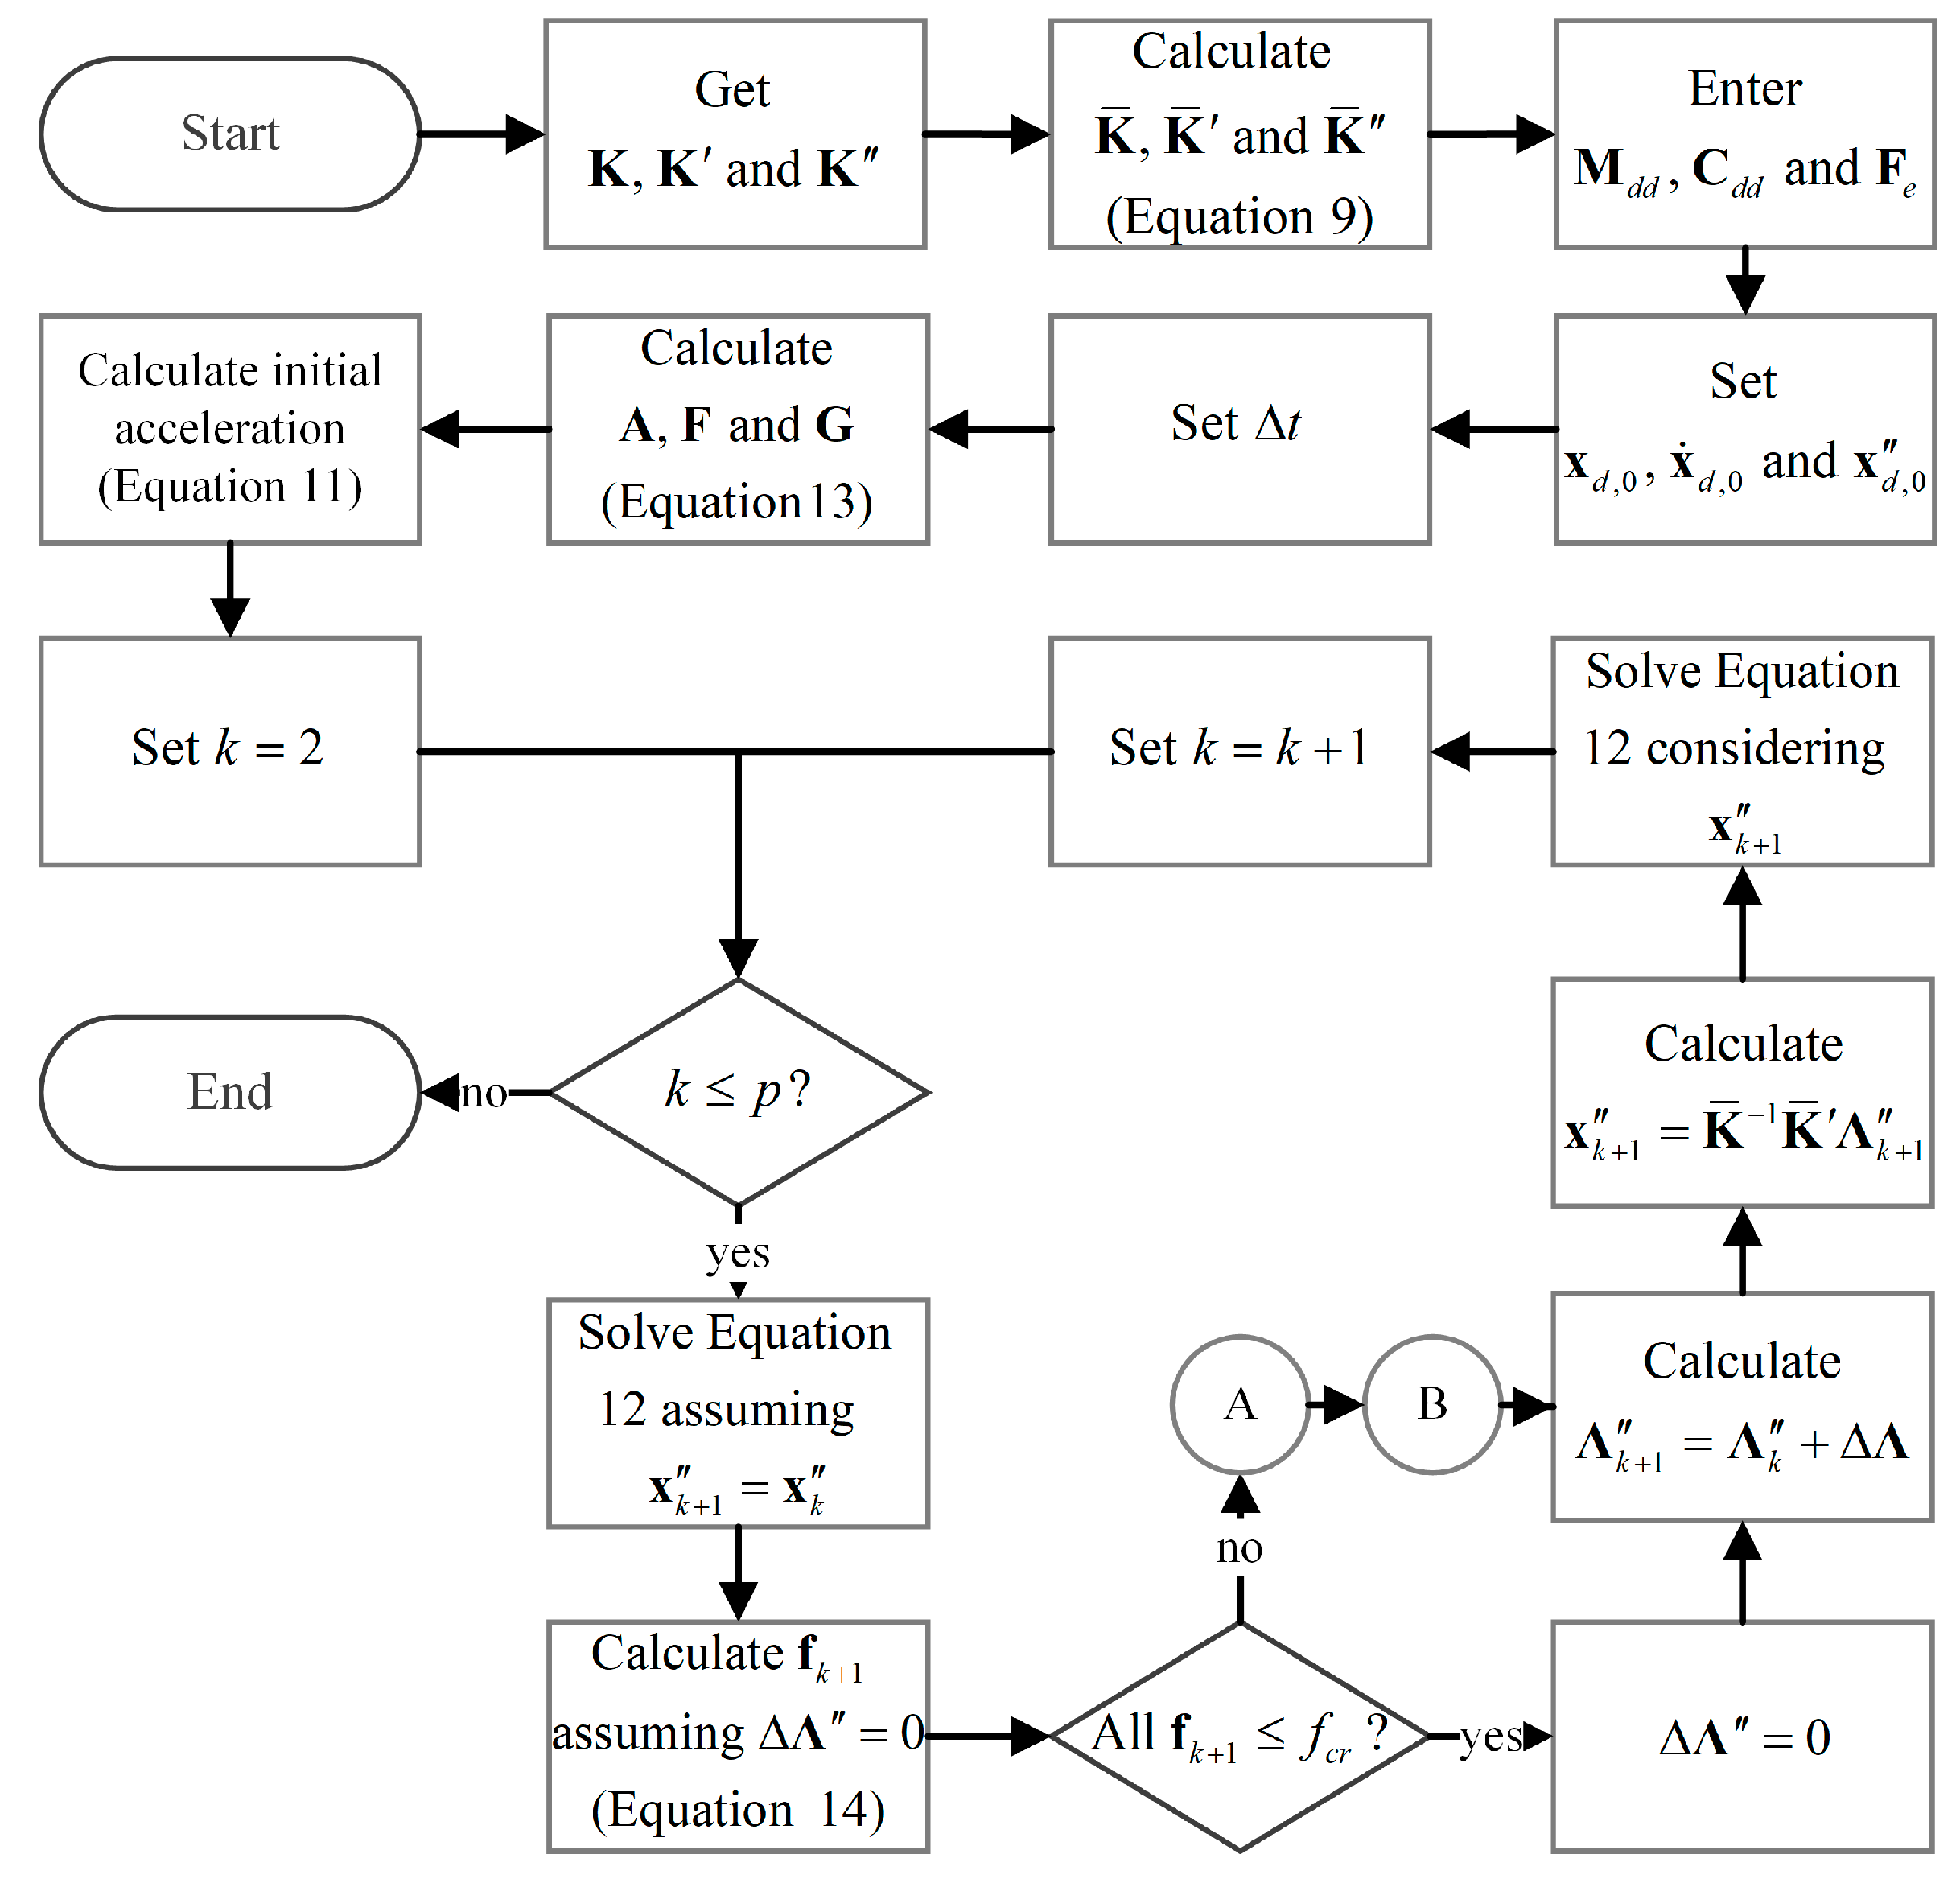
Figure 7 provides a flowchart for the iterative time history analysis. In this process, Equation (12) is solved following the methodology proposed by Li and Wong [50]. Figure 8 provides a detailed expansion of the segment marked between points A and B in Figure 7, offering further insight into the computational sequence. Throughout this process, both the total and plastic responses of each hinge are calculated using the following relations:
Λ k + 1 , i j = f k + 1 , i j k e , i + Λ k , i + Δ Λ i , j ,
Δ Λ i , j = Λ k + 1 , i j f k + 1 , i j k e , i Λ k , i .
The impact of the TMD and the SSI is included by adjusting Equation (11). This change adds one extra degree of freedom for the TMD and two more degrees of freedom for the SSI. The structure and foundation are linked via springs and dampers that represent the flexibility of the soil. The foundation allows for both translational and rotational displacements, influenced by inertial, stiffness, and damping forces. Numerous studies [53,58,59,60] have utilized this methodology to incorporate SSI effects into dynamic analysis, providing thorough mathematical formulations applied in this work.

3. Application Example

A reinforced concrete chimney located in Michoacán, Mexico, was chosen as the application example due to its strategic significance in the industrial and port sector along the Pacific Coast. This region is distinguished by a high level of seismic activity and frequent hurricane winds. The chimney, depicted in Figure 9a, is a non-prismatic cylindrical structure with variable cross-sections and a total height of 80 m. It features an interior masonry lining supported by concrete corbels placed at 10 m intervals, as illustrated in Figure 9b.
The longitudinal reinforcement of the flue is detailed in Figure 9c, with transverse reinforcement spaced 240 mm apart. The concrete used possesses a compressive strength of 24.52 MPa and a modulus of elasticity of 24,623.10 MPa, while the steel reinforcement has an elasticity modulus of 200 GPa.
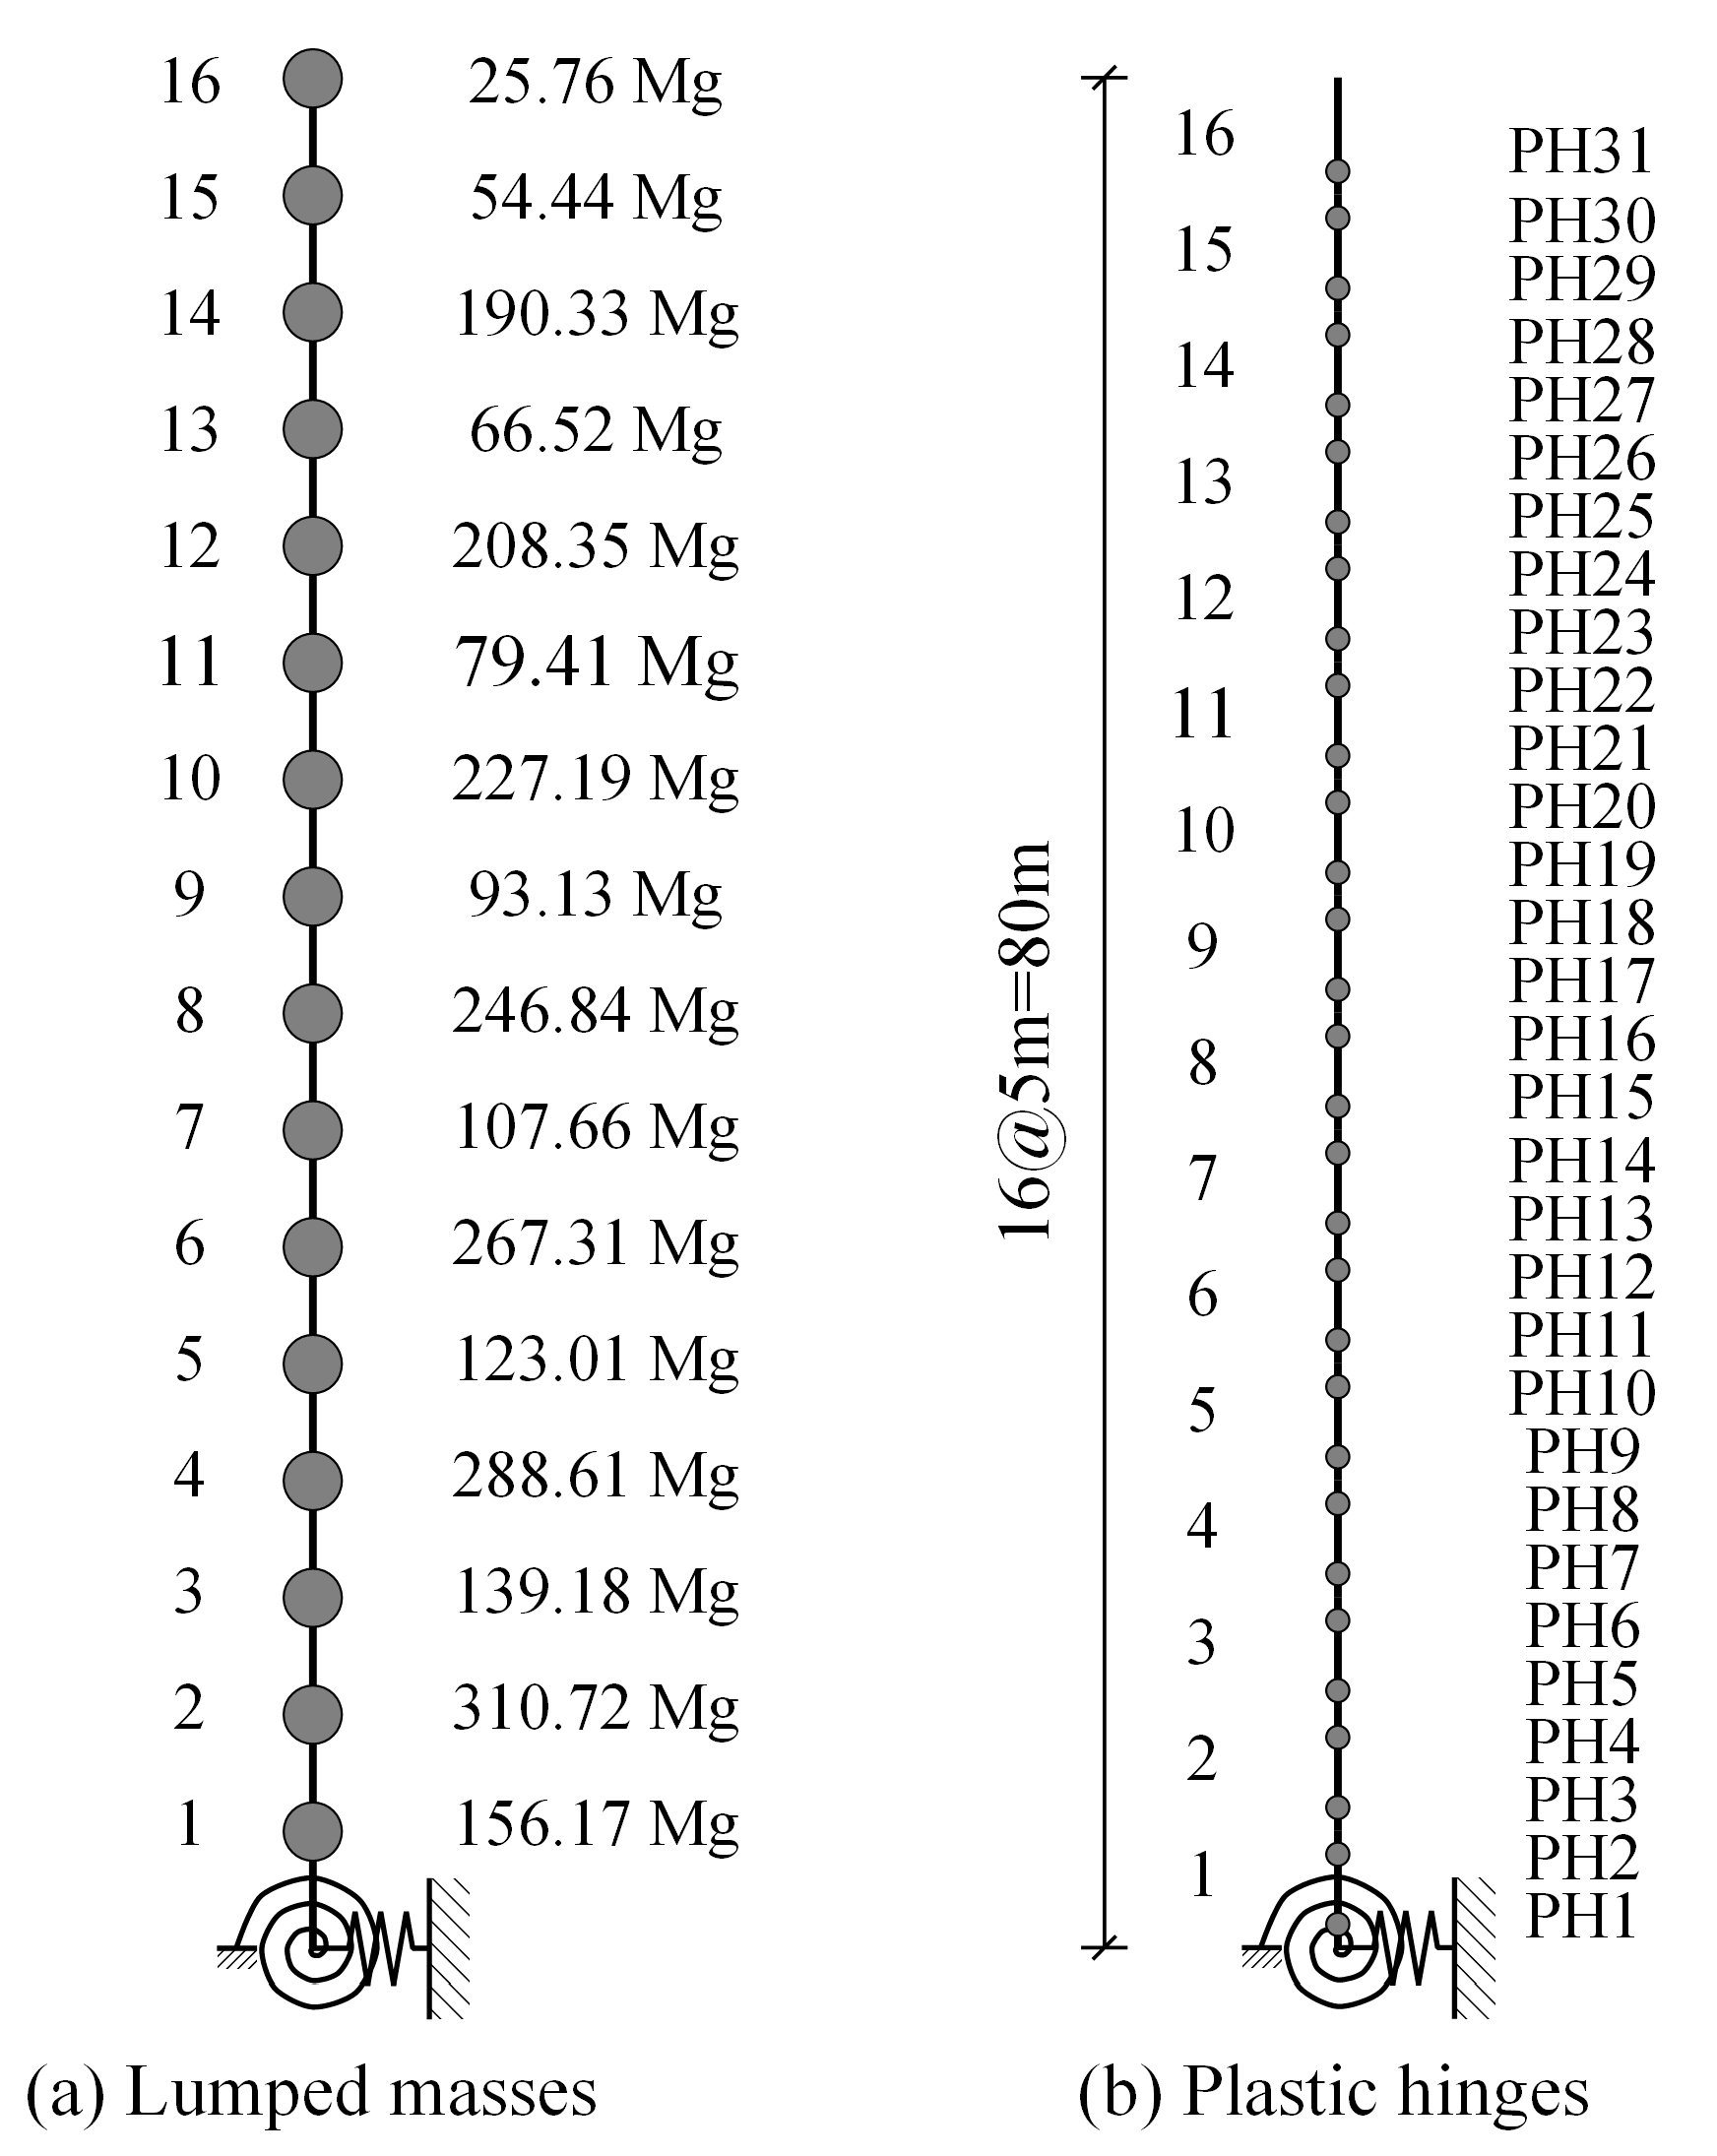
The structure was discretized into 16 elements, each measuring 5 m in height. The mass matrix was established by calculating the weight of the materials, including both the concrete shell and the interior masonry lining. Figure 10a schematically illustrates the nodal distribution along with the corresponding concentrated masses at each node. A total of 31 plastic hinges were modeled, with their flexural behavior defined by moment–rotation relationships. Figure 10b shows the locations of these plastic hinges.
The system features a total of 31 degrees of freedom (DOFs), including 16 translational DOFs and 15 rotational DOFs. The stiffness matrix of element j is determined by
K j = 12 1 + χ E I j L j 3 6 1 + χ E I j L j 2 12 1 + χ E I j L j 3 6 1 + χ E I j L j 2 6 1 + χ E I j L L j 2 4 + χ E I j 1 + χ E I j L j 6 1 + χ E I j L j 2 2 χ 1 + χ E I j L j 12 1 + χ E I j L j 3 6 1 + χ E I j L j 2 12 1 + χ E I j L j 3 6 1 + χ E I j L j 2 6 1 + χ E I j L j 2 2 χ 1 + χ E I j L j 6 1 + χ E I j L j 2 4 + χ E I j 1 + χ E I j L j ,
where
χ = 12 E I j b G A j L j 2 ,
Here, K j is the stiffness matrix in the local coordinate system; E is the elastic modulus of the material; I j is the moment of inertia; L j is the element length; χ is a parameter that accounts for shear deformation; b is the cross-sectional shear correction factor, valued at 1.5 for the section under consideration; and A j is the cross-sectional area.
The stiffness matrix that relates plastic rotation to the restoring force of element j is defined as follows:
K j = 6 1 + χ E I j L j 2 6 1 + χ E I j L j 2 4 + χ E I j 1 + χ E I j L j 2 χ 1 + χ E I j L j 6 1 + χ E I j L j 2 6 1 + χ E I j L j 2 2 χ 1 + χ E I j L j 4 + χ E I j 1 + χ E I j L j .
Likewise, the stiffness matrix relating plastic rotation to the residual moment of element j is expressed as
K j = 4 + χ E I j 1 + χ E I j L j 2 χ 1 + χ E I j L j 2 χ 1 + χ E I j L j 4 + χ E I j 1 + χ E I j L j .
The stiffness matrices for each element are transformed to align with the global coordinate system and are assembled following the standard procedures of finite element analysis. In this assembly, translational DOFs are positioned first within the global matrix, followed by rotational DOFs.
The resulting global stiffness matrices are
K = [ K d d ] 16 × 16 [ K d r ] 16 × 15 [ K r d ] 15 × 16 [ K r r ] 15 × 15 31 × 31 , K = [ K d ] 16 × 31 [ K r ] 15 × 31 31 × 31 ,   and   [ K ] 31 × 31
where elements indexed with subscript d correspond to translational DOFs, while those with subscript r correspond to rotational DOFs. The condensed matrices obtained are [ K ¯ ] 16 × 16 , [ K ¯ ] 16 × 31 , and [ K ¯ ] 31 × 31 .
The plastic hinges were characterized analytically using moment–curvature diagrams. The specifications for longitudinal and transverse reinforcement utilized in this analysis are detailed in Table 2. In this context, A s represents the longitudinal reinforcement ratio, while V s t / V c denotes the transverse volumetric reinforcement ratio.
The cracking moment, denoted as f c r , and the plastic rotation at cracking, ϕ c r , were calculated using the transformed section properties along with the following equations:
f c r = f r + P A t I t y ,
and
ϕ c r = f r + P A t 1 E c y ,
where P is the applied axial load (N), A t is the area of the transformed section (mm2), I t is the moment of inertia of the transformed section (mm4), E c is the modulus of elasticity of the concrete (MPa), y is the distance to the furthest tension fiber in MPa, and f r is the tensile strength of the concrete, determined using the following equation:
f r = 0.63 f c .
The calculated values for the hinges are summarized in Table 3.
To evaluate the yield ϕ y , ultimate ϕ u , and fracture ϕ f curvatures, the XTRACT software version 3.0.8 [61] was employed to compute the moment–curvature diagrams for each section. The ultimate curvature was defined as 85% of the maximum curvature (see Table 4).
The plastic hinge backbones were characterized by the cracking moment f c r and yield moment f y , along with the curvatures at cracking ϕ c r , yield ϕ y , ultimate ϕ u , and fracture ϕ f points.
The plastic rotations were calculated based on the obtained curvatures, utilizing the plastic hinge length, l p , defined by the following equation:
Λ = l p ϕ .
Various methodologies for determining the plastic hinge length have been proposed in the literature [62,63,64,65,66,67,68]. In this study, we adopted the expression by Bae and Bayrak [68], which considers the impact of the axial load level on the element.
The plastic hinge length is given by
l p h = 0.3 P P 0 + 3 A s A g 0.1 L h + 0.25 0.25 ,
where L = 5   m is the frame length, h is the cross-sectional diameter, and P 0 is the nominal axial load expressed as
P 0 = 0.85 f c A g A s + f y A s .
In Equations (25) and (26), A s refers to the area of the longitudinal steel reinforcement, while A g indicates the total cross-sectional area of the concrete.
Using Equation (24), we determined the plastic hinge lengths and corresponding rotations to characterize the 16 backbones. A summary of the plastic hinge backbones is provided in Table 5.

3.1. Model Considering Soil–Structure Interaction

Based on the properties described, four models incorporating foundation flexibility were developed. The foundation mass is denoted as m 0 = 3.1552 × 10 6   kg , and its moment of inertia is I m , 0 = 1.2221 × 10 8   kg   m 2 .
The soil–structure interaction analysis considered four representative soil types: rock, dense soil, stiff soil, and soft soil. The stiffness and damping coefficients for these soil types were derived using expressions proposed by Gazetas [69]. A summary of the soil and foundation properties is provided in Table 6.
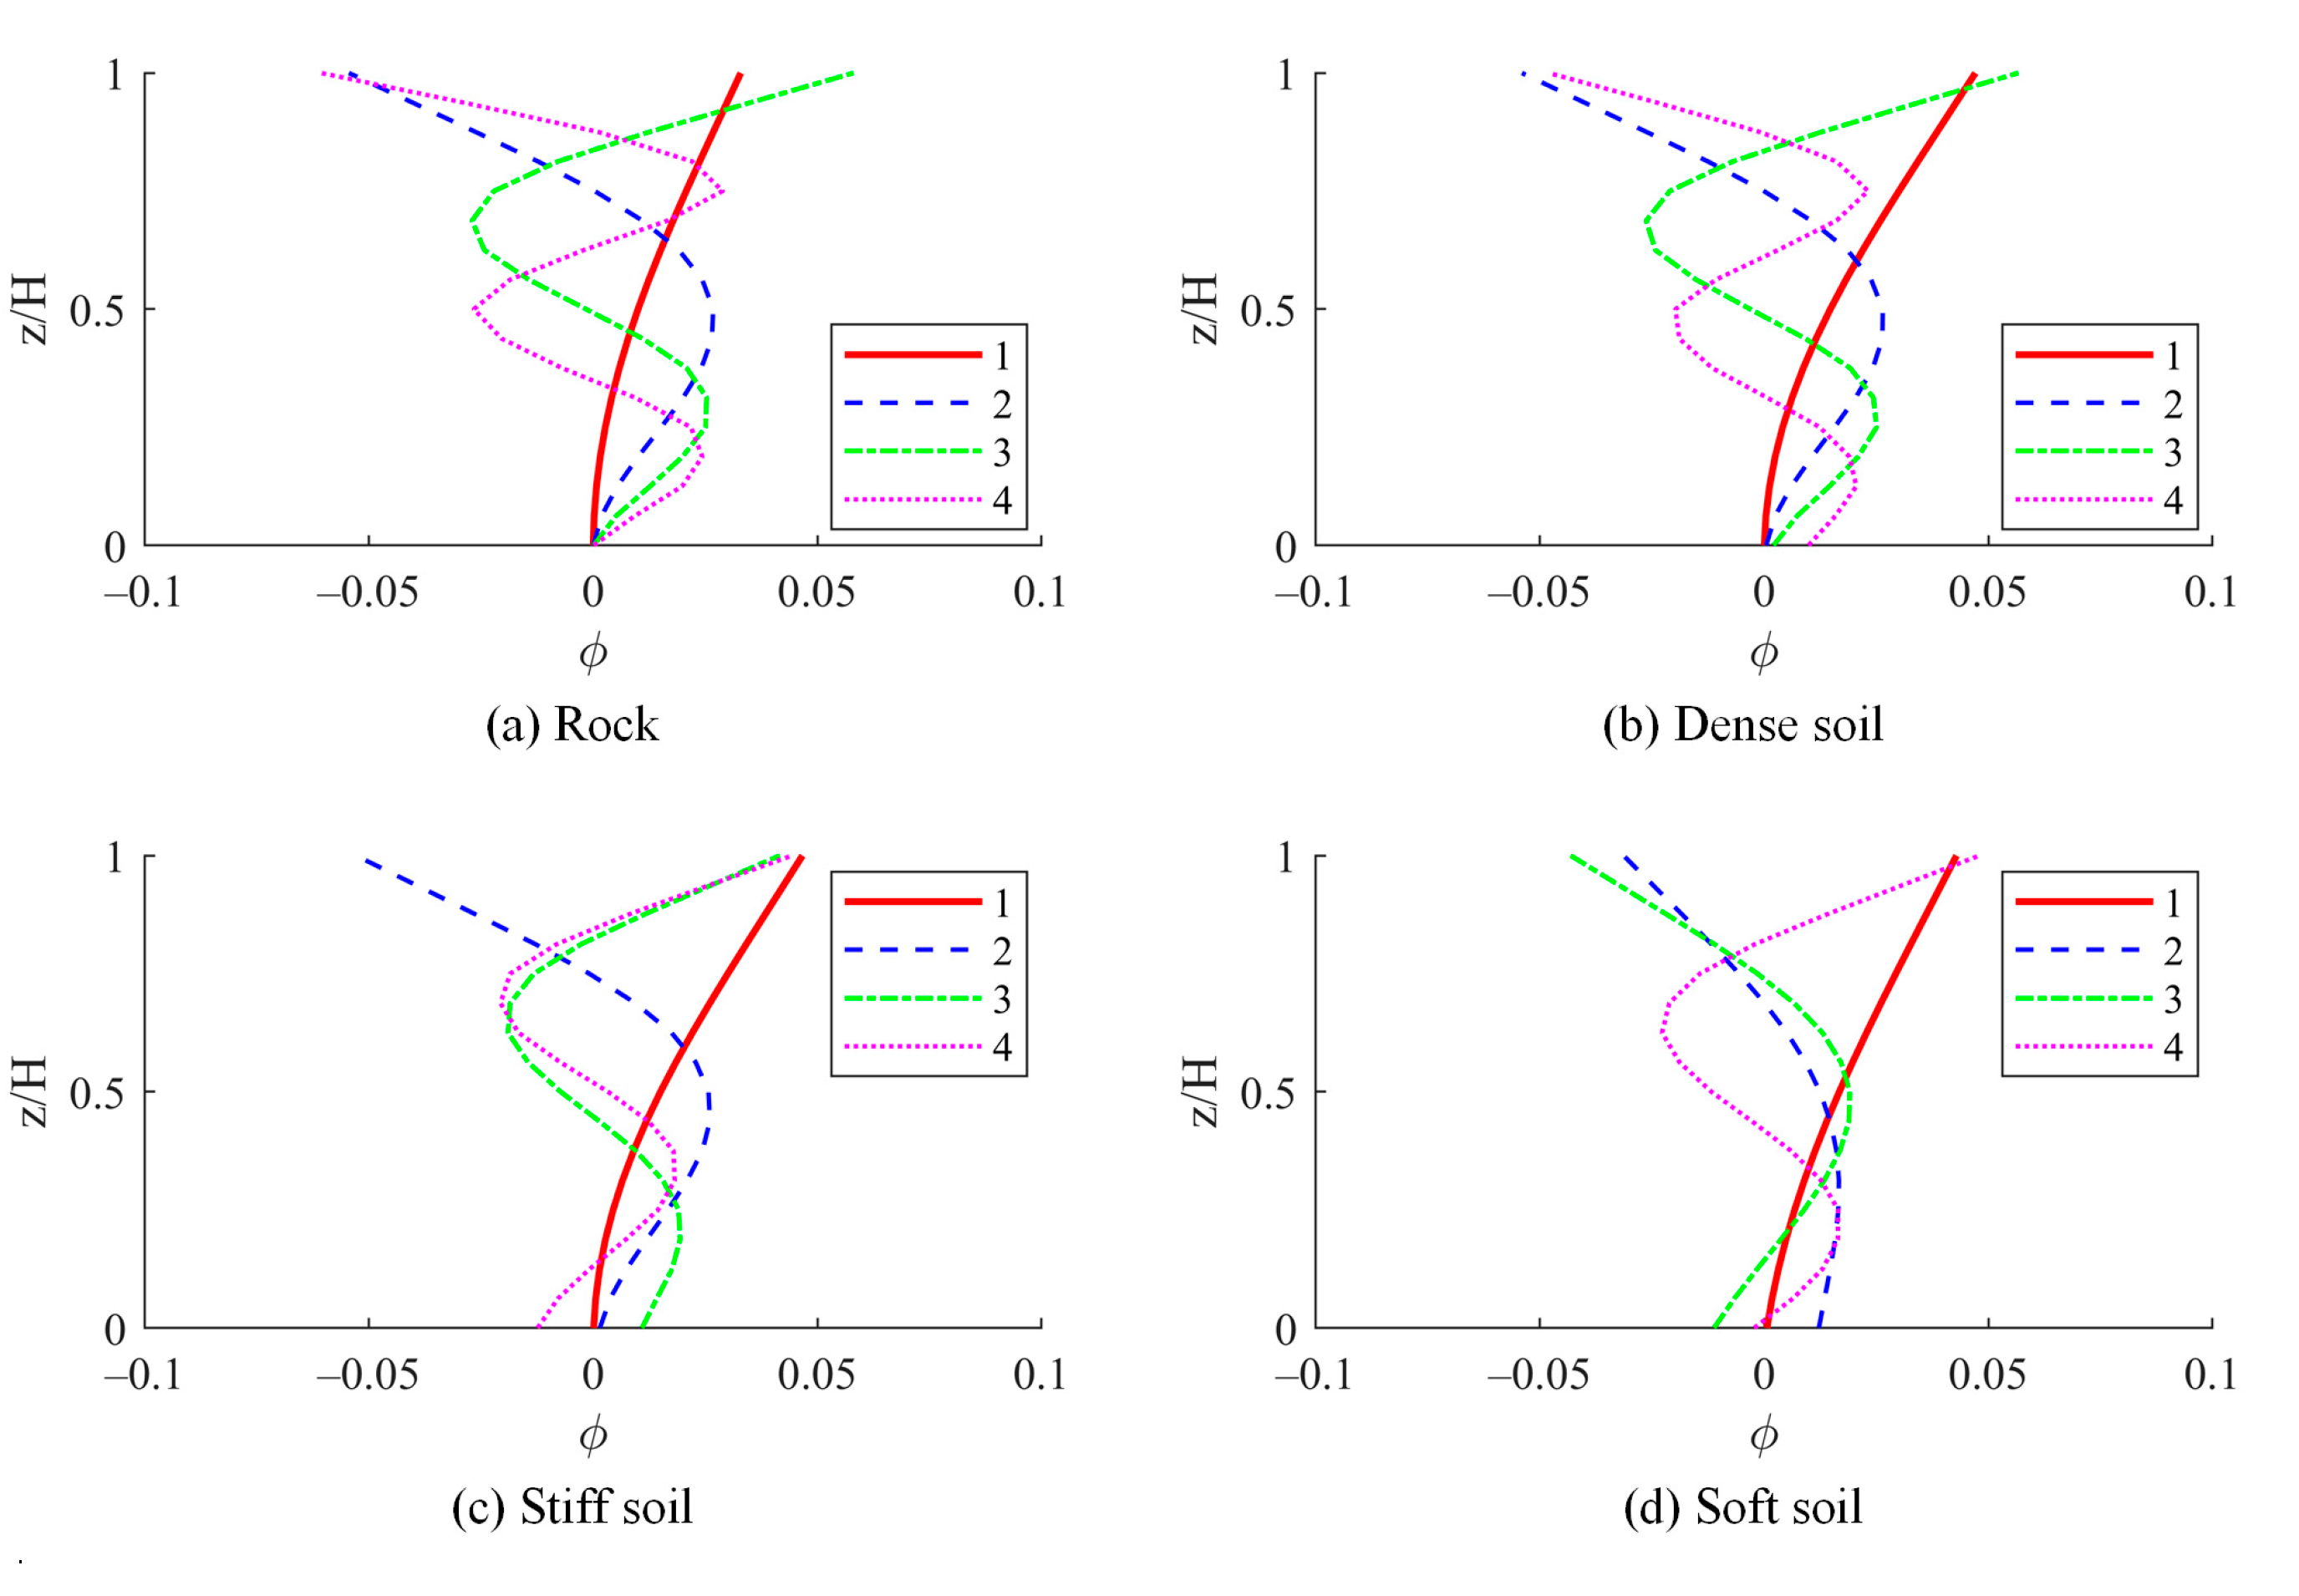
The modal periods and shapes of the chimney were determined with consideration for soil–structure interaction. Table 7 compares the first four periods of fixed-base versus flexible-base models. It is evident that the fundamental period varies according to the soil type, while the other periods remain relatively stable. Additionally, Figure 11 illustrates a comparison of the first four mode shapes of the chimney across different soil conditions.

3.2. Model Considering a Control Device

To mitigate the response of the chimney, a tuned mass damper (TMD) was installed at the chimney cap. This device was tuned to the fundamental period, utilizing a mass ratio of 2%. Given the different support conditions exhibited by the models, the fundamental period varied among them. As a result, the mass ratio for the TMD design remained constant, while only the period was adjusted.
The dynamic properties of the models featuring a TMD at the chimney cap, designed according to the guidelines established by Bachmann et al. [70], are summarized in Table 8.
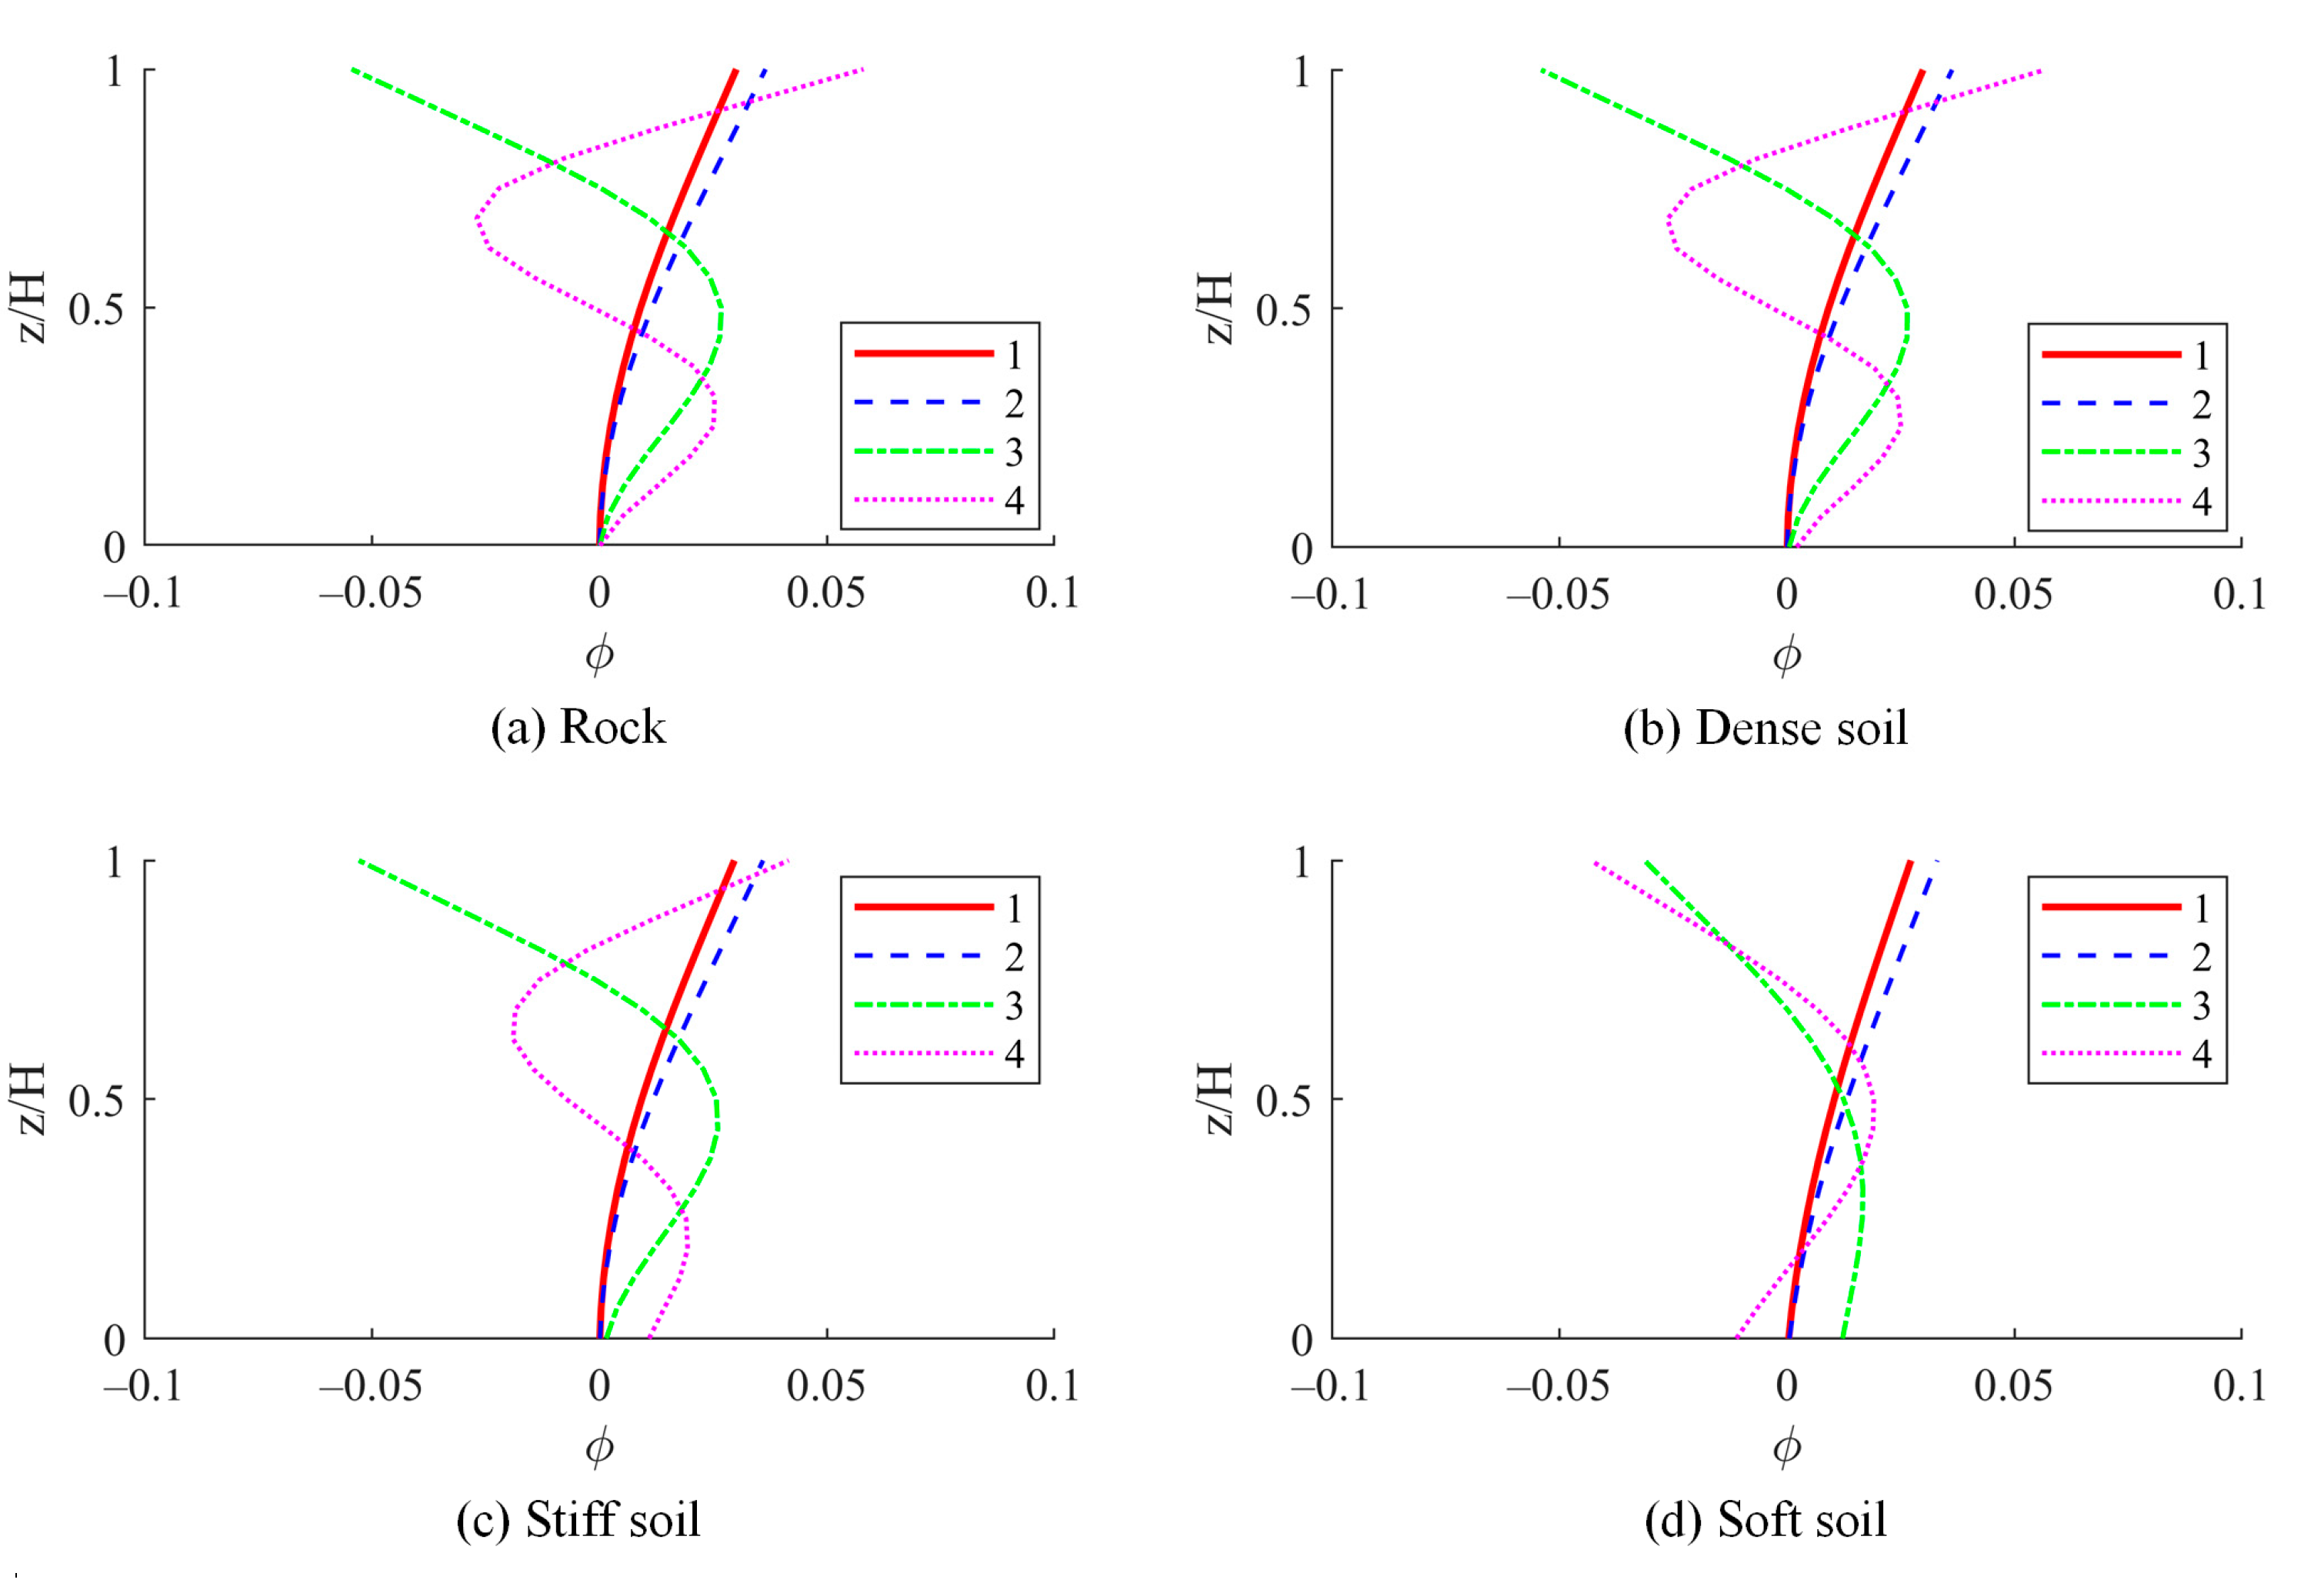
The vibration periods and modes of the models that incorporate a TMD were determined. The periods for the first four modes are detailed in Table 9. Furthermore, Figure 12 illustrates a comparison of the first four vibration modes of the chimney with a TMD across various soil conditions.

3.3. Earthquake Analysis

For the earthquake analysis, records obtained from the Caleta de Campos station in Michoacán, oriented along the S00E direction, were utilized. This seismic sequence encompasses the mainshock that occurred on 19 September and its subsequent aftershock on 21 September 1985. Figure 13 illustrates the ground acceleration record and the input energy spectrum corresponding to the analyzed sequence.
The dynamic response was determined considering a damping factor of 3% in the first two vibration modes of the structure. The inelastic response of the models, both uncontrolled and equipped with a TMD, was evaluated for foundations on various soil types: rock, dense soil, stiff soil, and soft soil.
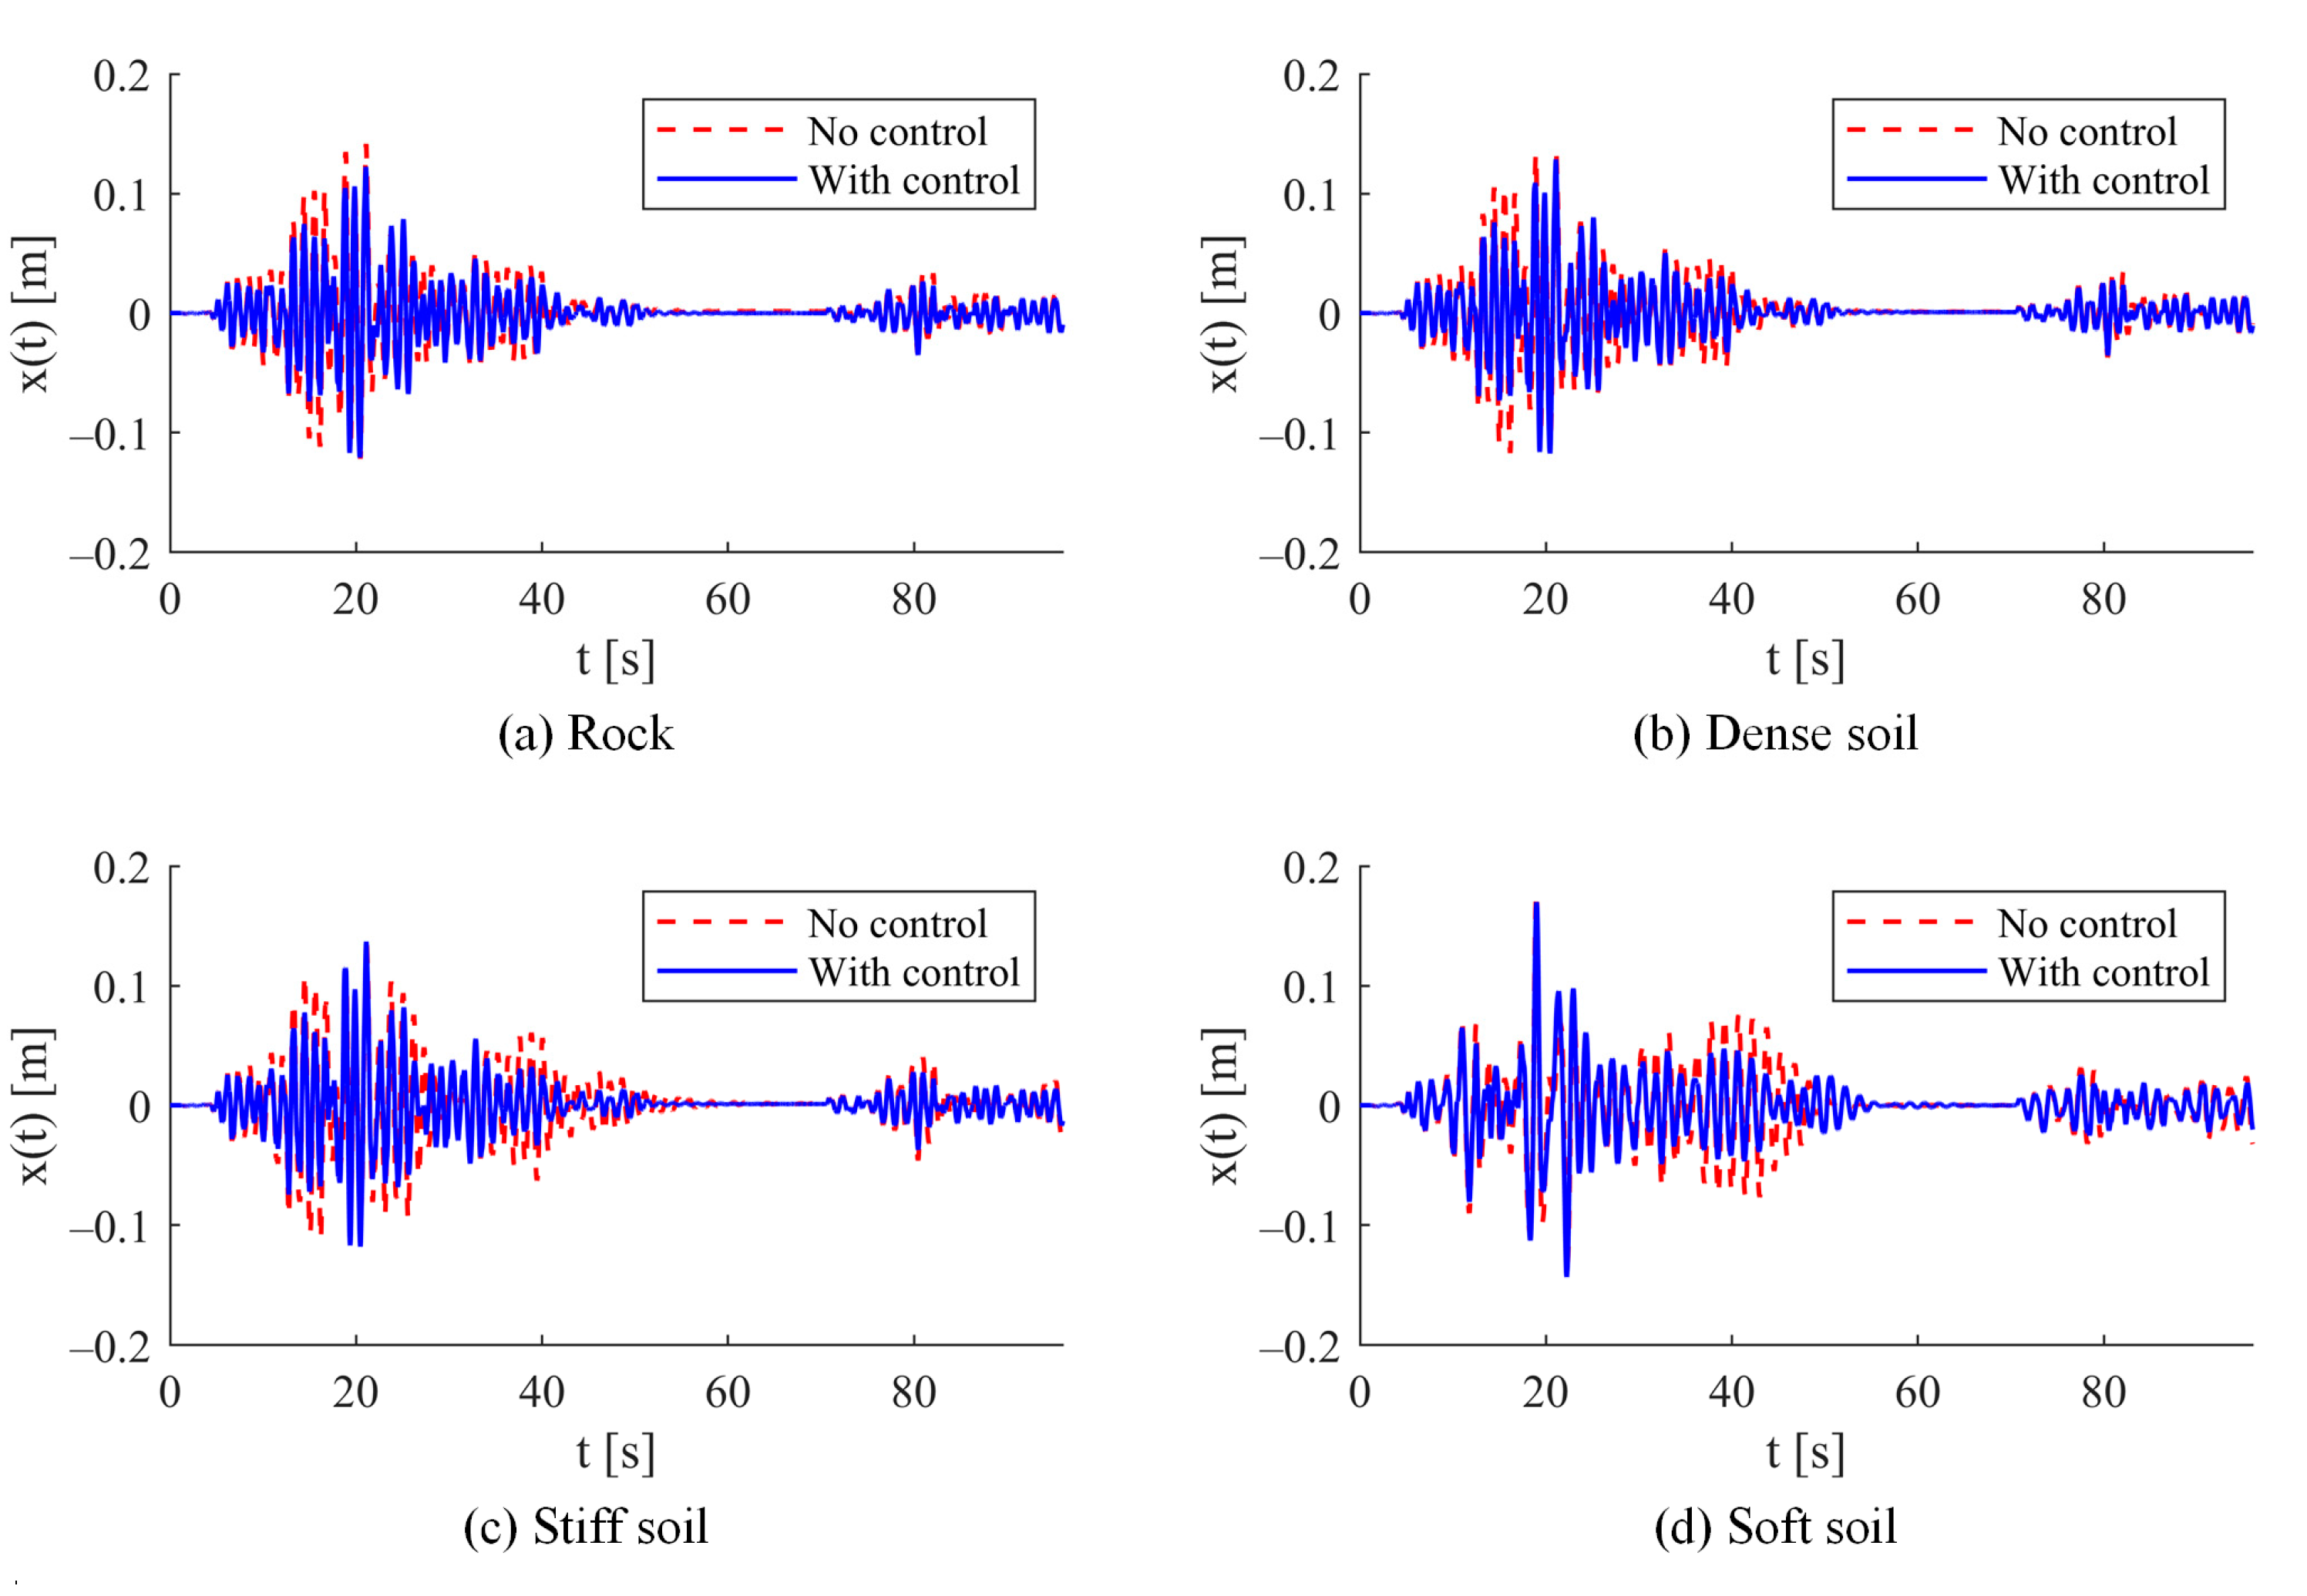
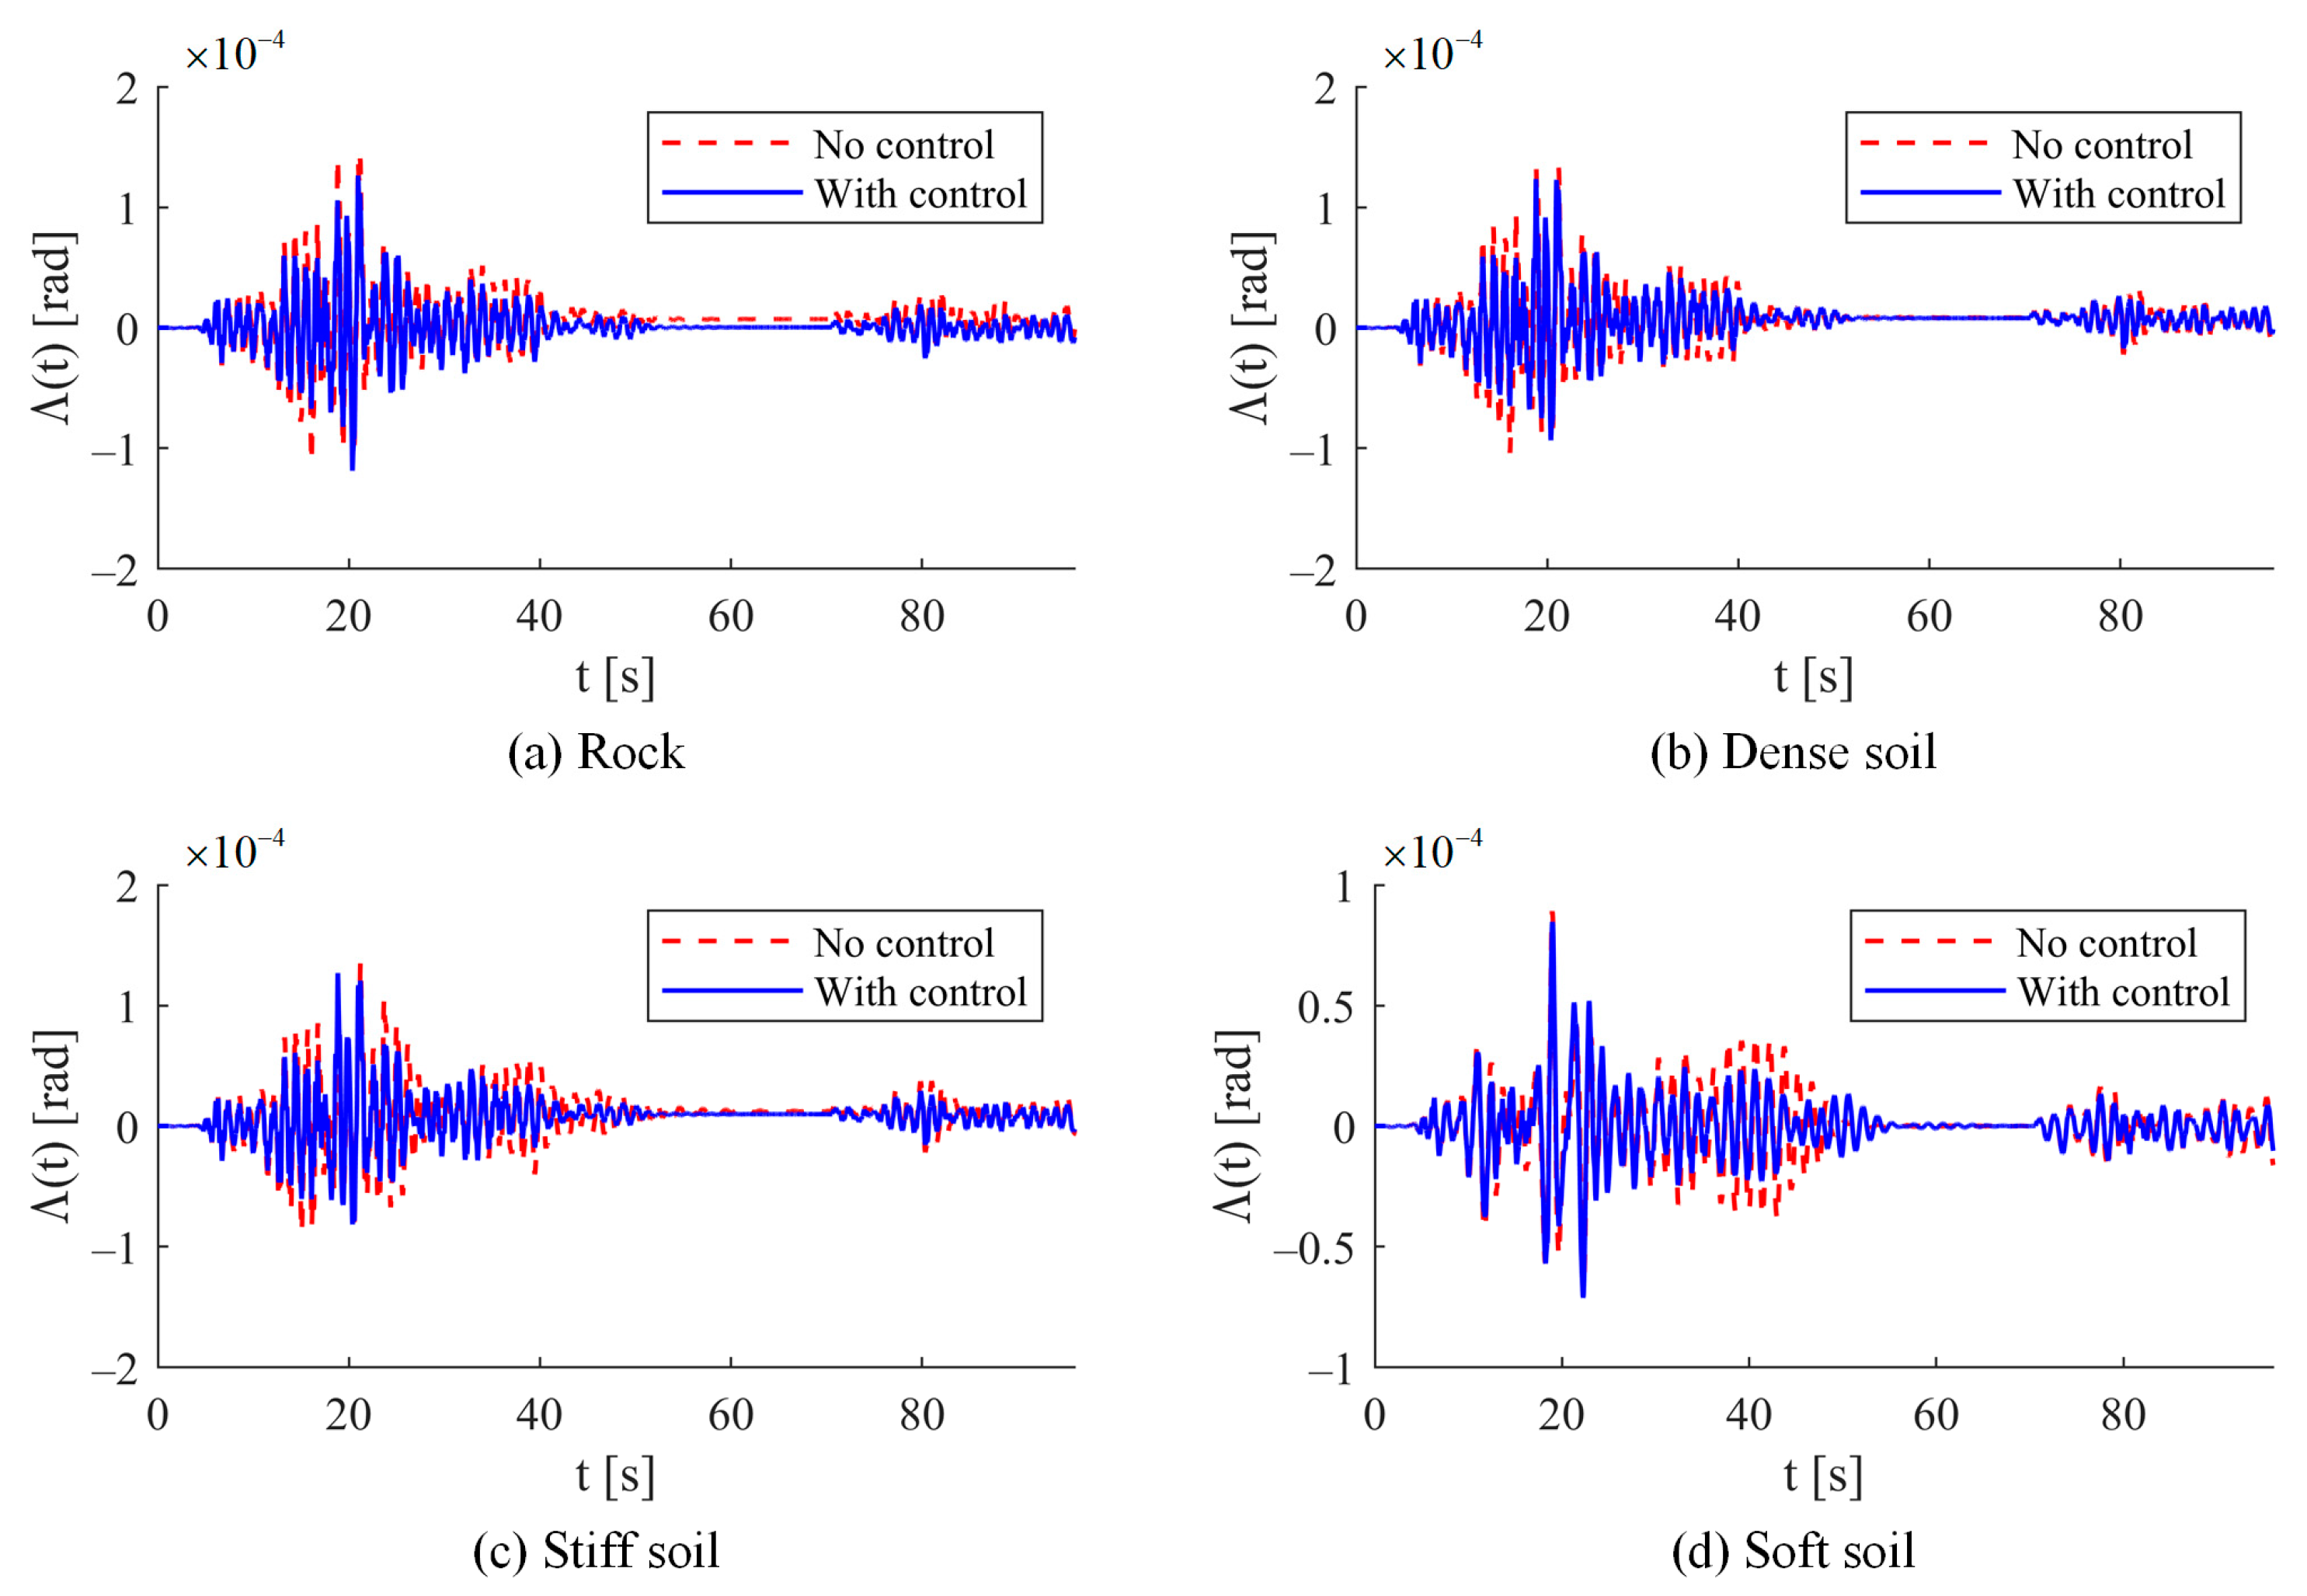
Figure 14, Figure 15 and Figure 16 show the displacements at the chimney cap, as well as the moments and rotations at the plastic hinge at the base. The highest amplitude of response was obtained during the mainshock. The maximum displacement without control reached 18 cm on soft soil, which is 28% greater than that observed on the other soil types. The response at the plastic hinge at the base of the chimney surpassed the cracking rotation in all scenarios, although it did not achieve the yield point of the section. The maximum recorded rotation was 1.404 × 10⁻⁴ rad, occurring on rock.
Soil–structure interaction altered the dynamic properties, with notable differences being observed among the various soil types, particularly pronounced in soft soil. The TMD significantly reduced the response across all conditions, demonstrating greater efficiency on rigid soils. In the case of soft soil, the effectiveness of the control was more evident following the intense phase of the mainshock.
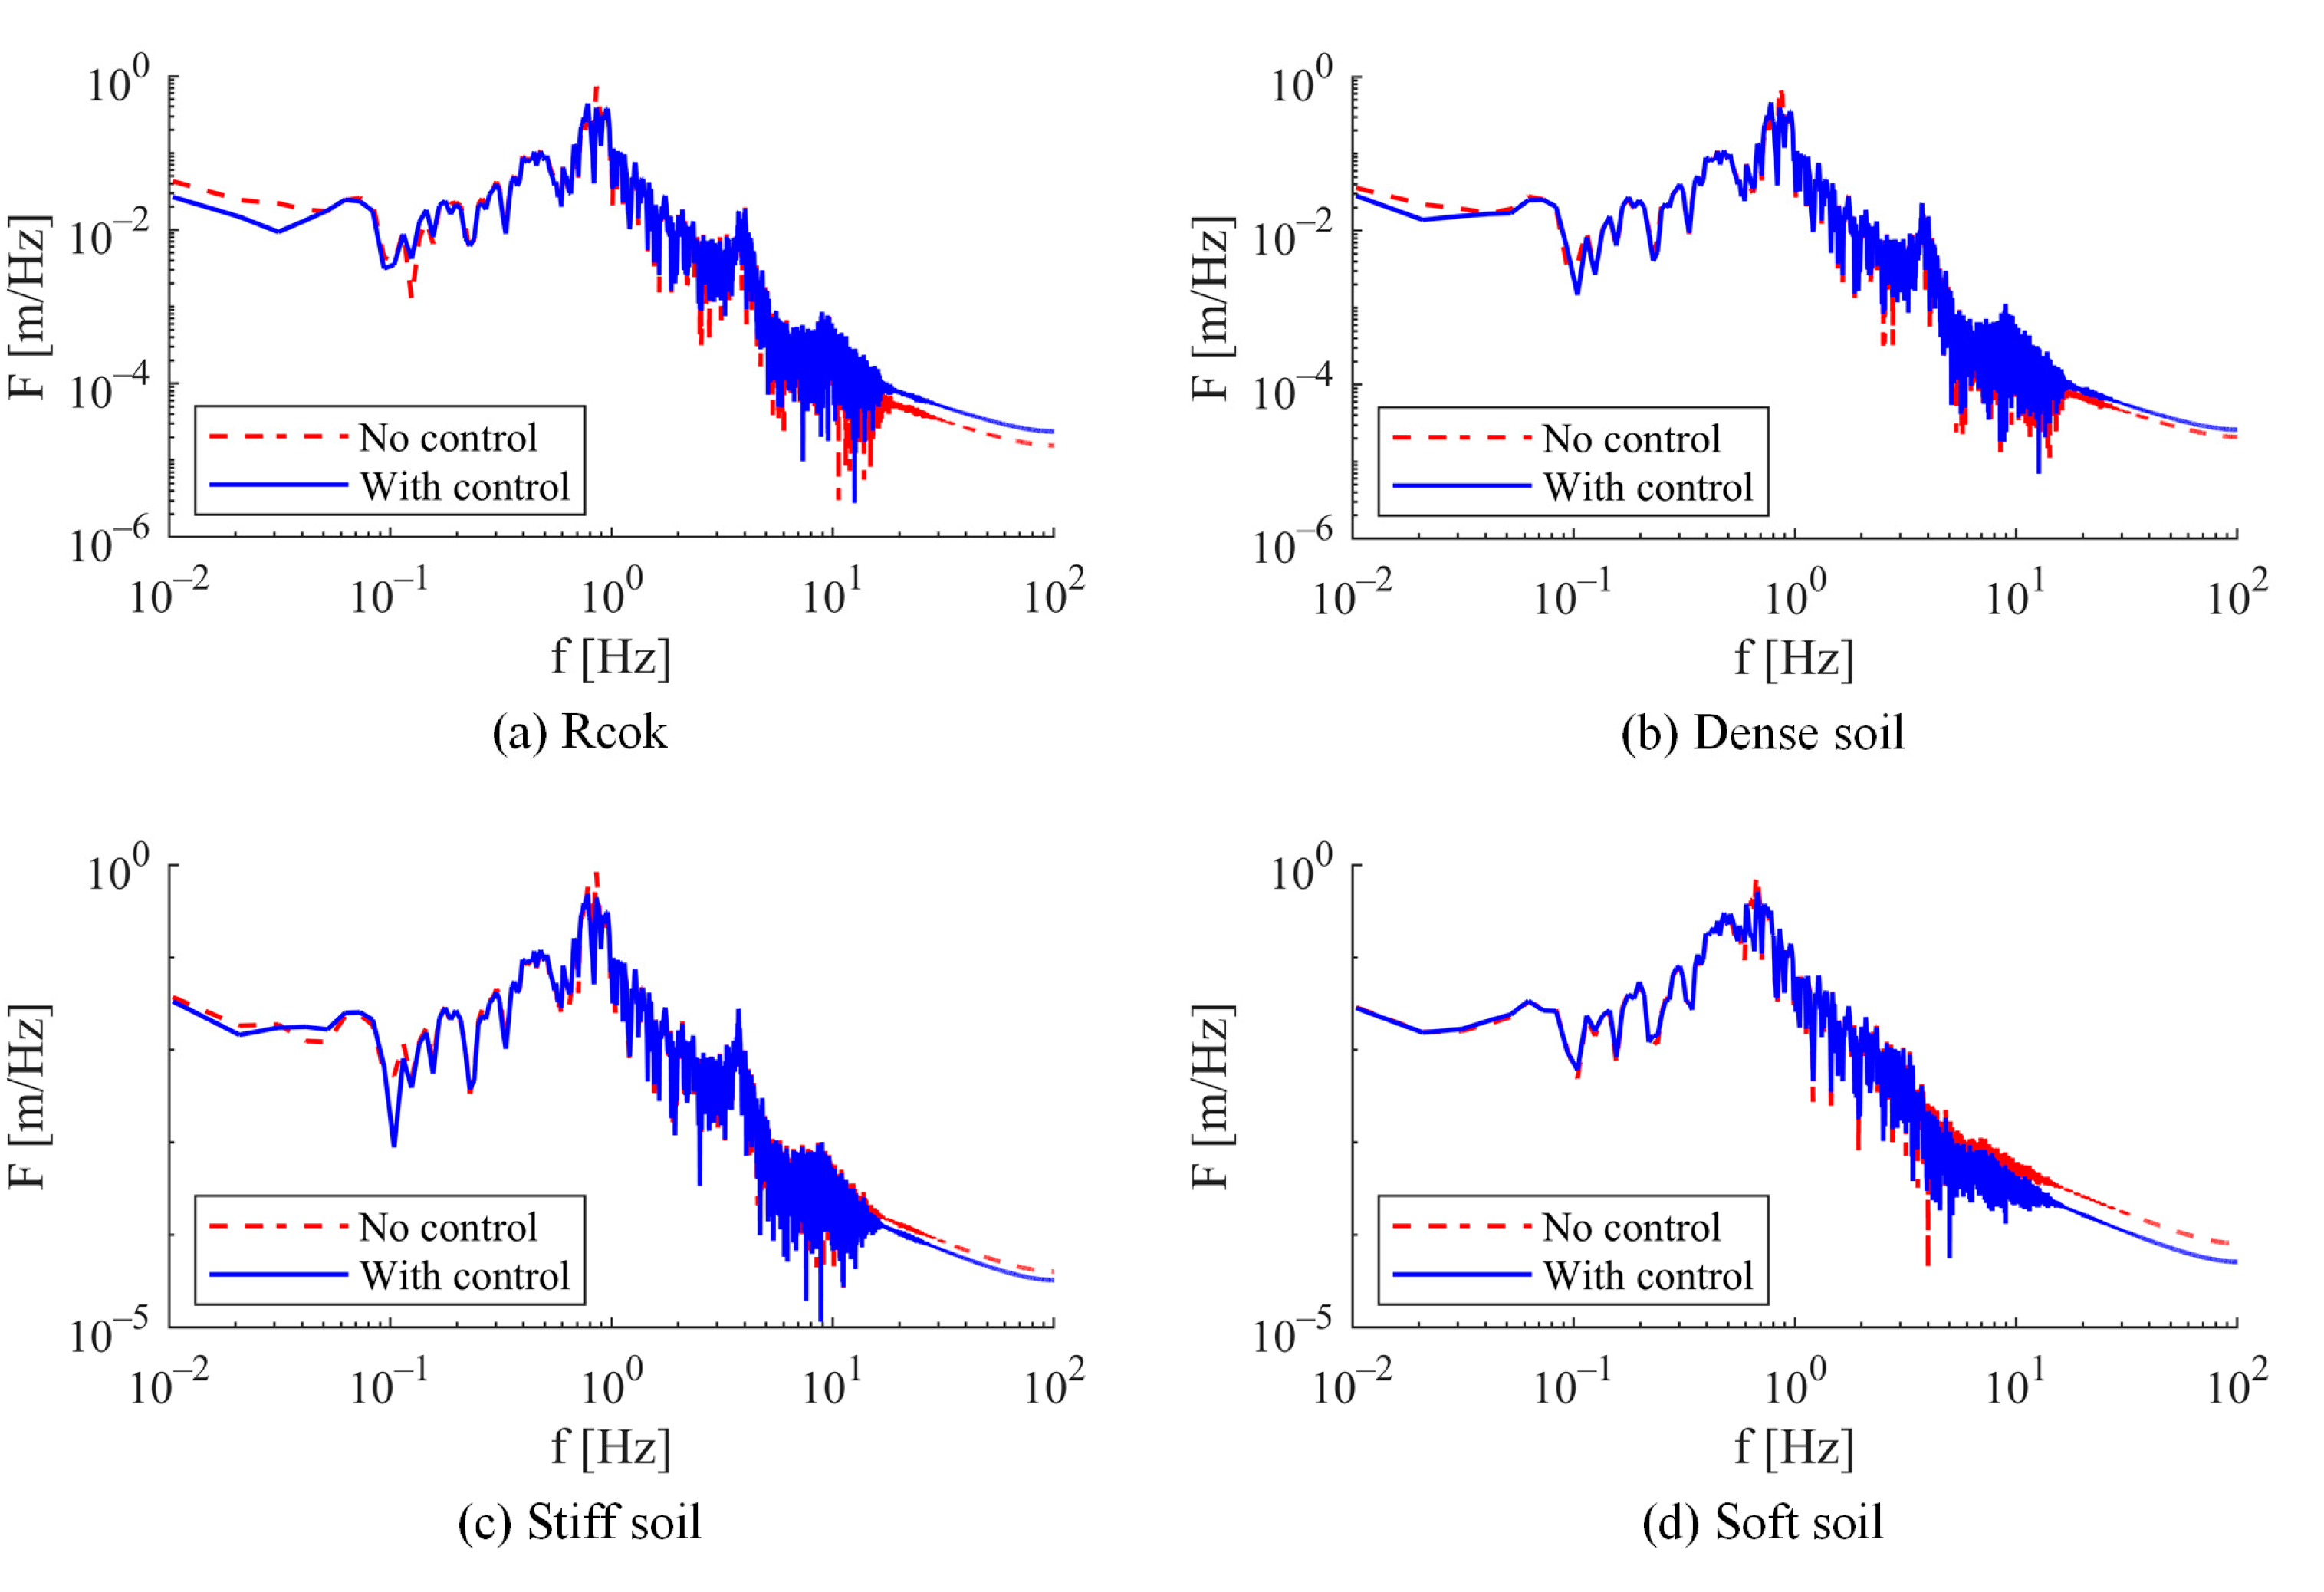
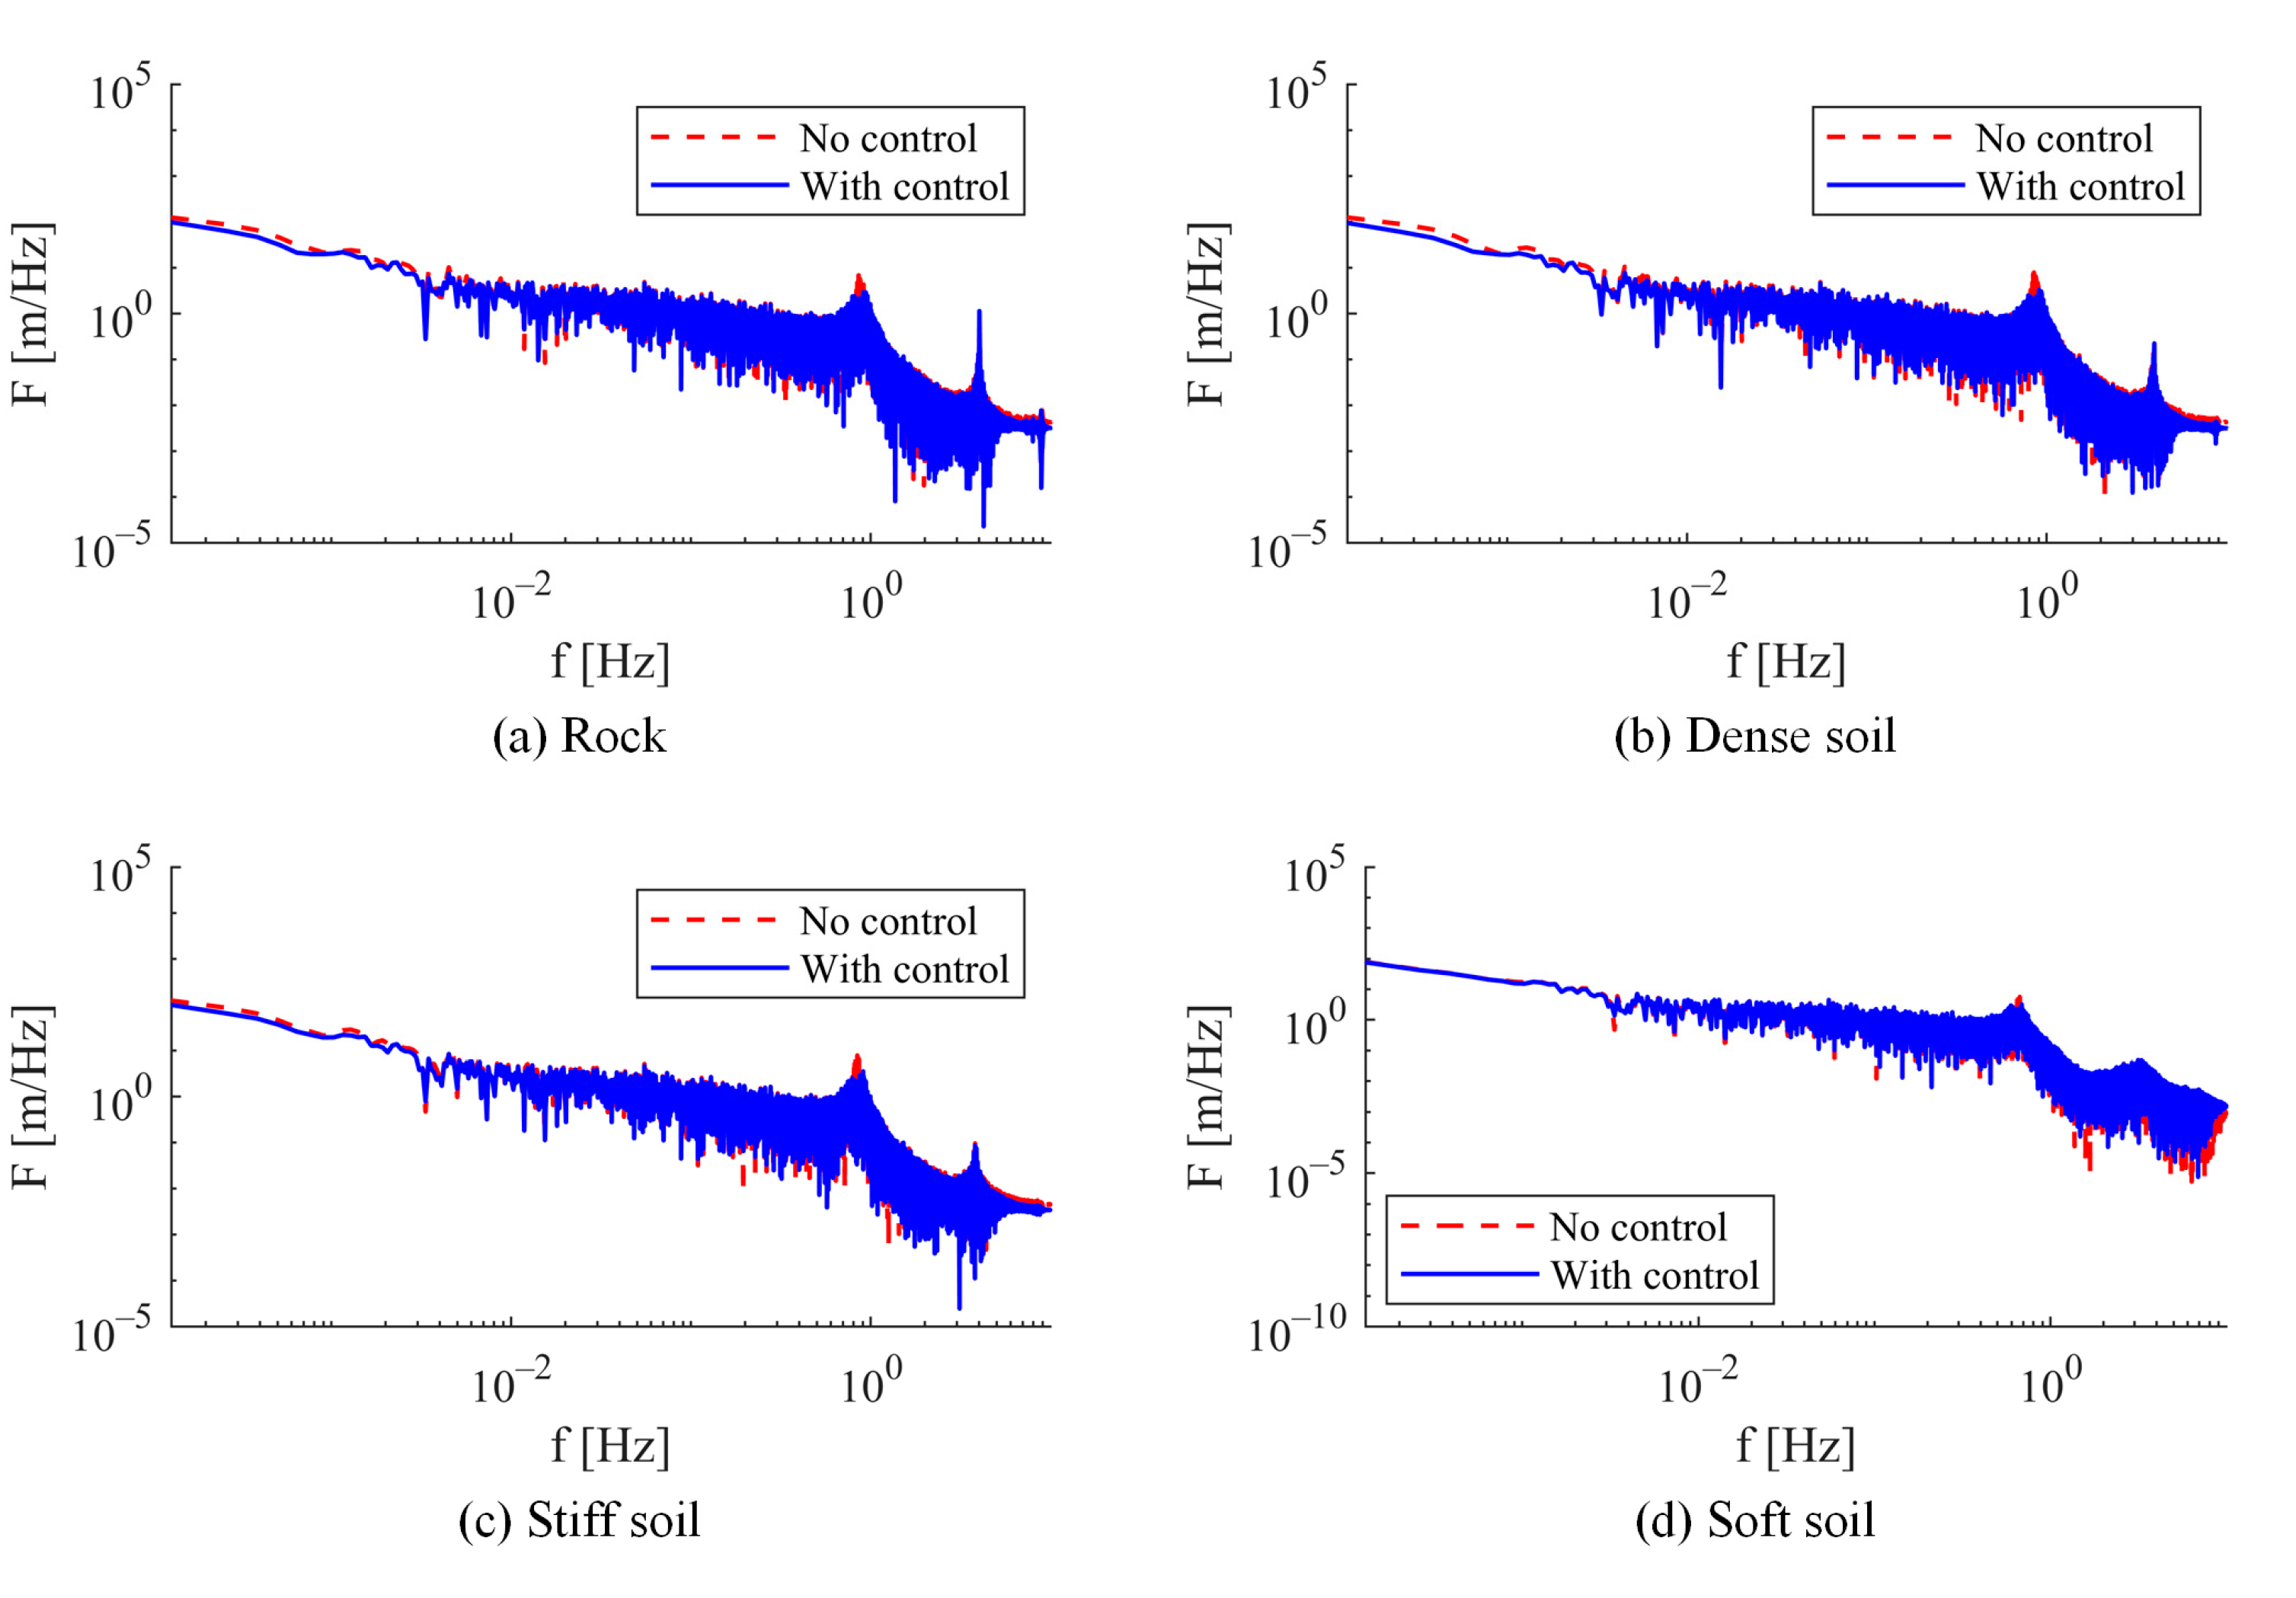
The displacement response at the chimney cap was analyzed in the frequency domain, with the Fourier amplitude spectrum presented in Figure 17. The findings reveal that the maximum amplitude without control aligns with the fundamental period of the system for each soil type. Upon implementing the control system, a reduction in amplitude at the fundamental frequency was observed. Conversely, at frequencies higher than the fundamental, the controlled response exceeds that of the uncontrolled response, particularly in the case of firmer soils. This trend gradually diminishes with increasing soil flexibility, ultimately resulting in a lower amplitude compared to the uncontrolled response. This phenomenon can be attributed to soil–structure interaction, which modifies the dynamic properties of the system and channels more energy into the fundamental mode.
The maximum response profiles for displacements and accelerations, illustrated in Figure 18 and Figure 19, were evaluated across various soil types, both with and without the implementation of the TMD. The most significant overall reduction in displacement was recorded on rock, achieving a reduction of 12.4%, while the smallest reduction, measured at 3.46%, was observed on stiff soil. In terms of accelerations, the greatest overall reduction was 9.8% on rock, whereas the smallest reduction of 4.8% was noted on stiff soil. These findings suggest that the effectiveness of the TMD diminishes as the flexibility of the soil increases.
Table 10 and Table 11 summarize the maximum mechanical response values along with their corresponding reduction percentages. The highest percentage reduction was recorded for displacements x , with a 13.6% decrease on rock, contrasted with a modest reduction of only 2.7% on stiff soil. This indicates that the flexibility of the soil significantly reduces the effectiveness of the TMD compared to the reductions achieved on rock.

3.4. Wind Analysis

The chimney under study is situated in a region with a latitude of 17°57′, an elevation of 10 m above mean sea level, an average annual temperature of τ = 27.8   ° C , a barometric pressure of 759.14 mmHg, and a terrain roughness height of z 0 = 0.05   m . The drag coefficient of the structure is assumed to be c d = 0.5 .
The wind excitations consist of synthetic wind records representing a storm’s development over a duration of 7800 s. The initial mean wind speeds varied from 5 m/s to 25 m/s, considering increments of 5 m/s. These were modeled as synoptic winds using the methodology proposed by Shinozuka and Deodatis [71], with a vertical decay coefficient set at 5. For wind speeds ranging between 30 m/s and 65 m/s, also in 5 m/s increments, hurricane gusts were evaluated. This was carried out by employing the approach described by Fernández Lorenzo et al. [72] and the empirical velocity profile suggested by Snaiki and Wu [73], using a vertical decay coefficient of 10. Figure 20 shows the wind history simulations used for wind analysis.
Incremental dynamic analyses were performed to assess the chimney’s response, incorporating 1% viscous damping for the fundamental modes, soil–structure interaction across four different soil types, and utilizing a TMD installed at the chimney cap.
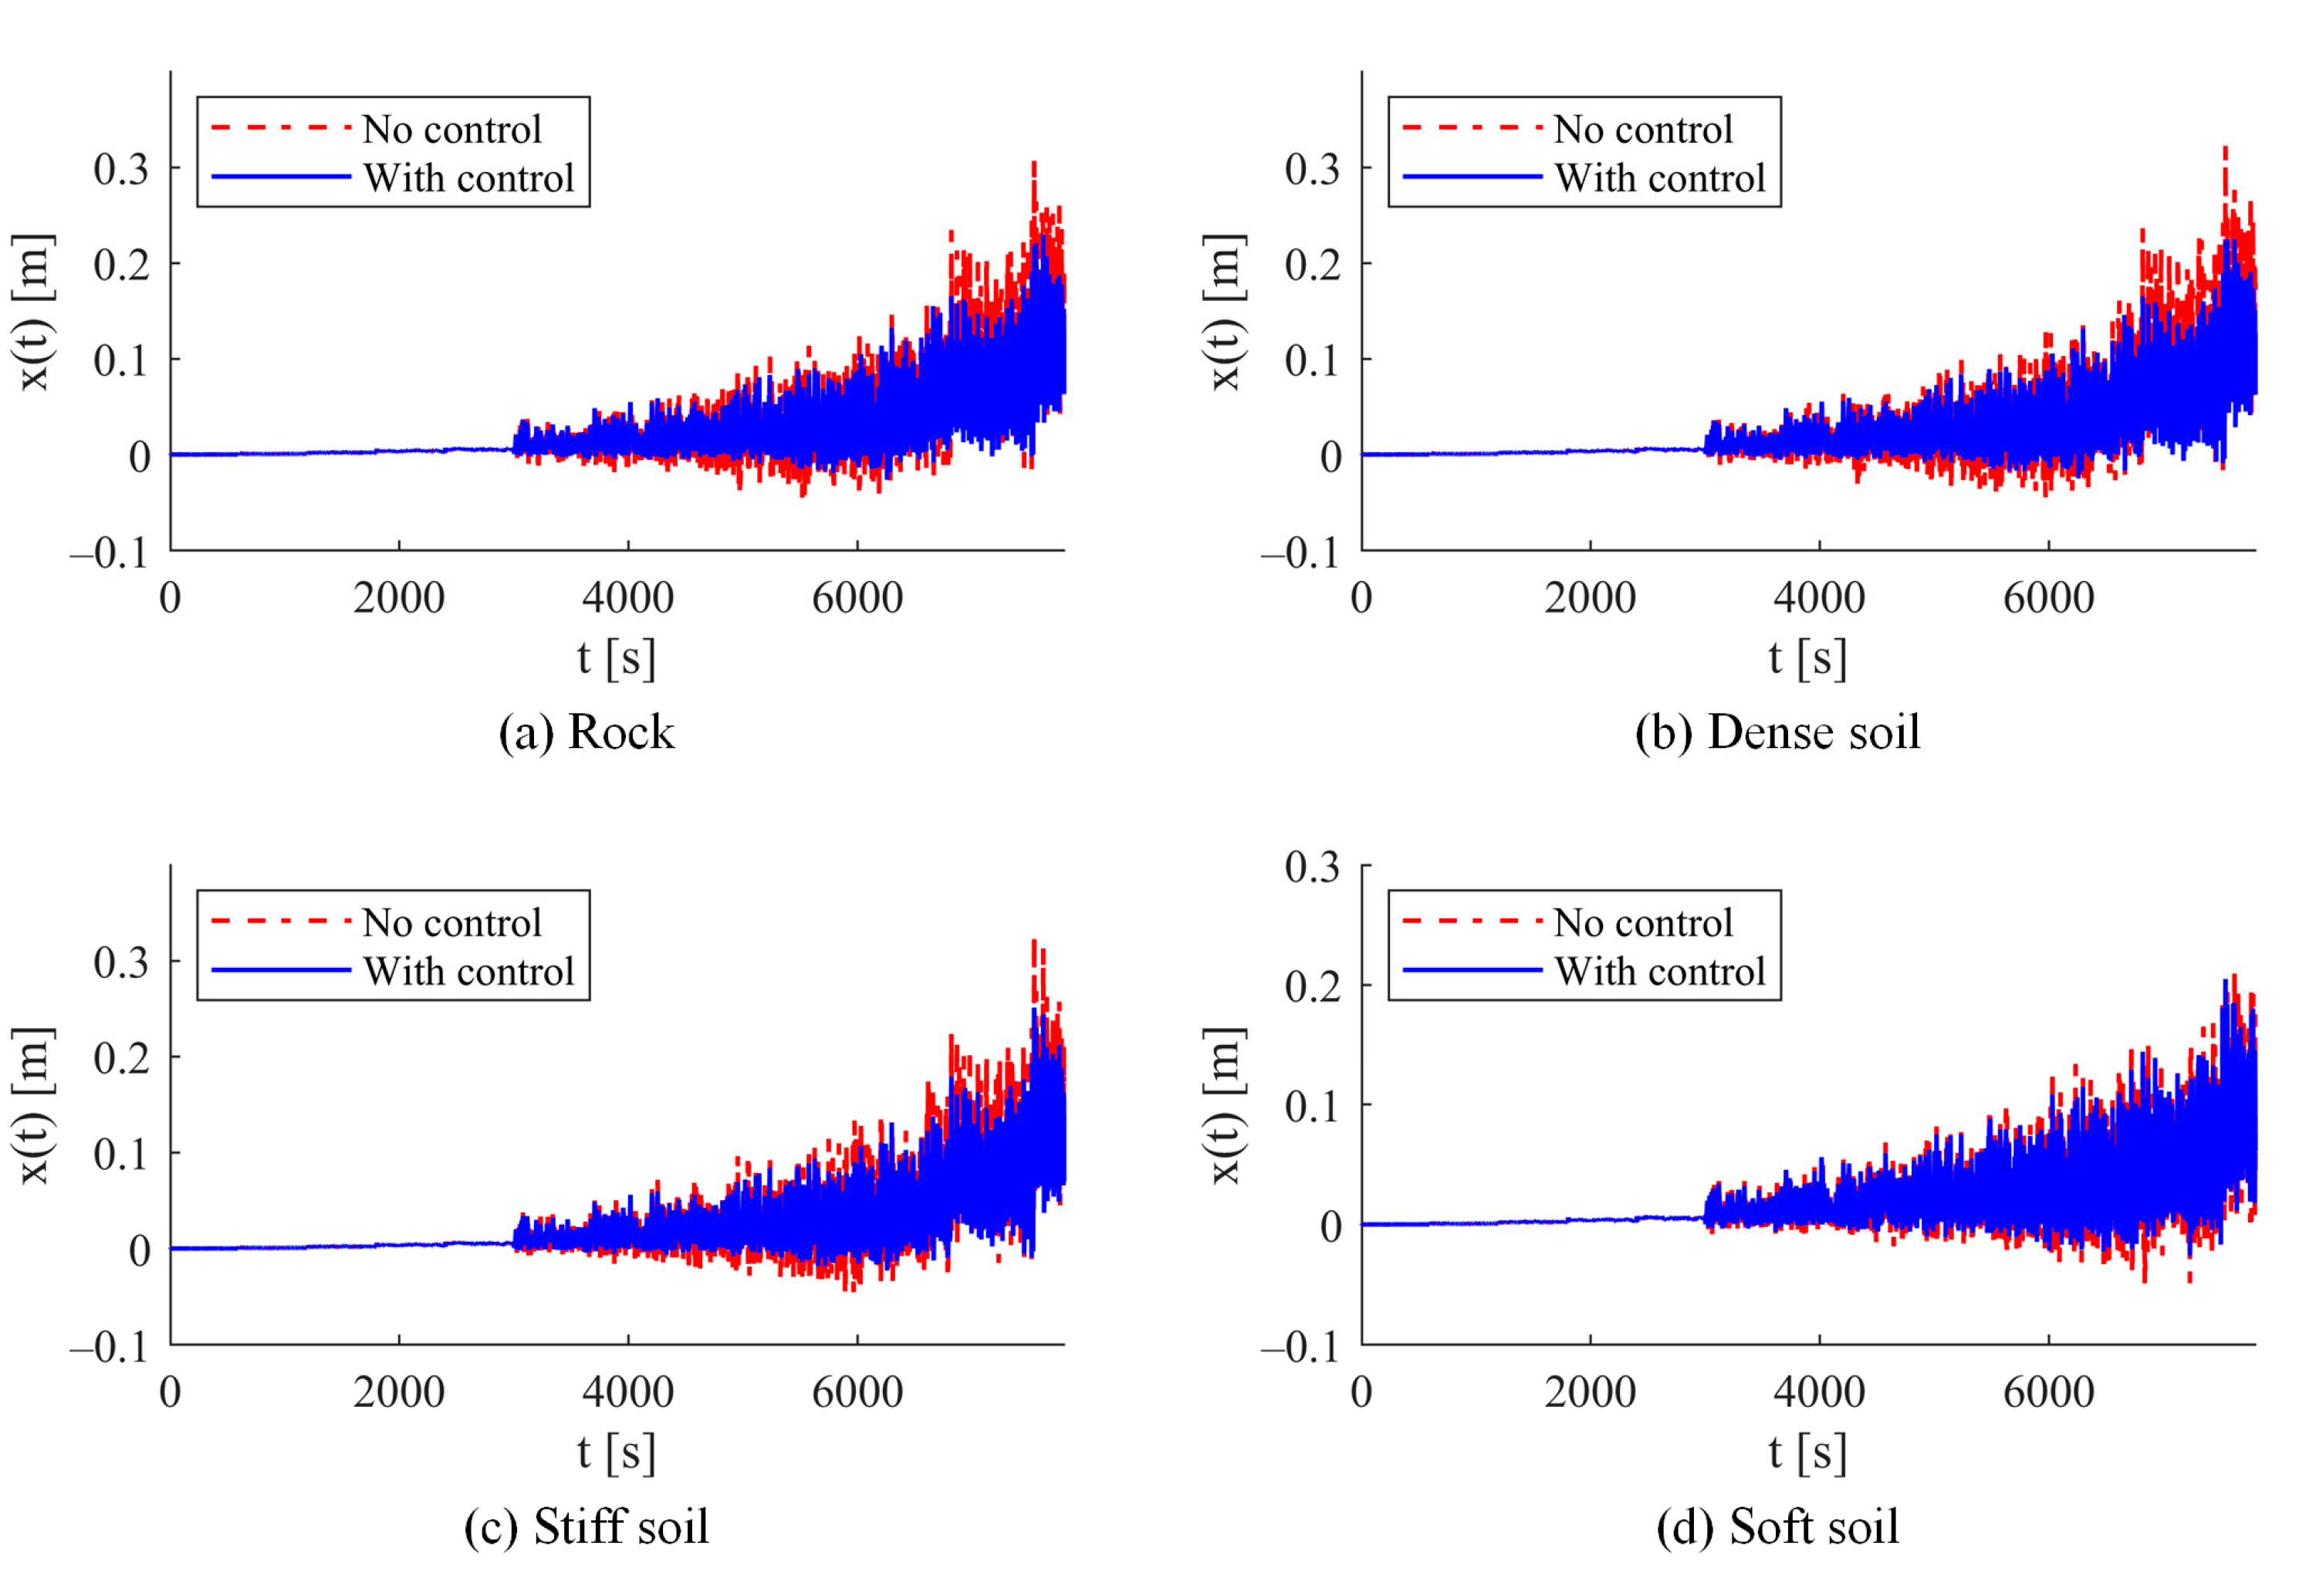
Figure 21, Figure 22 and Figure 23 illustrate the displacements at the chimney cap, along with the moments and rotations occurring at the plastic hinge located at the base. The results demonstrate that the maximum response is achieved near the conclusion of the analysis, coinciding with peak wind velocity. The maximum displacement recorded without control was 33 cm on stiff soil, while the minimum displacement noted was 21 cm on soft soil. In terms of moments, the maximum value without control reached 290,200 kN·m, and the corresponding rotation was 3.46 × 10⁻⁴ rad on dense soil; the minimum values recorded were 221,470 kN·m and 2.20 × 10⁻⁴ rad on soft soil.
The tuned mass damper proves to be more effective in mitigating the response on firmer soils, although its efficiency decreases as the soil becomes more flexible. Moreover, the response control significantly influences displacements and rotations at the plastic hinge, more so than it does at the moments.
The Fourier amplitude spectrum of the chimney cap displacement is illustrated in Figure 24. The results indicate that the displacement response exhibits a broader frequency range compared to the seismic excitation, with significant amplitudes observed at lower frequencies. This broadening is attributed to the synthetic wind record, which covers a wider frequency range. In the uncontrolled response, the amplitude at the structure’s fundamental frequency is pronounced, along with a substantial contribution from the second mode. When the control system is implemented, a noticeable reduction in the amplitude of the spectrum is observed compared to the uncontrolled response, which aligns with the expected outcomes of this system.
The maximum response profiles illustrated in Figure 25 and Figure 26 were assessed across various soil types, both with and without the TMD. The most significant reduction in displacement was recorded on dense soil, achieving a decrease of 30.2%. In a similar vein, the highest overall reduction in accelerations reached 19.0%, also on dense soil. These findings highlight that the effectiveness of the TMD diminishes as soil flexibility increases.
Table 12 and Table 13 present a summary of the maximum values for mechanical components along with their respective response reductions. The most significant percentage of reduction was noted in dense soil, with similar values observed in rock and rigid soil. Specifically, both displacement and acceleration in dense soil were reduced by up to 30.3% and 17.1%, respectively. In contrast, on soft soil, the reduction was limited to just 3.1% for displacements. These findings consistently demonstrate that the effectiveness of the control system diminishes as soil flexibility increases.

4. Discussion of Results

The results indicate that the TMD significantly enhances the chimney’s response to earthquake and wind excitations. The device achieved reductions of up to 13.6% for earthquakes and 30.3% for wind actions in displacement response. Similar reductions were noted in base moments across rock, rigid, and dense soil conditions. However, maximum acceleration and base shear exhibited the smallest decreases among the analyzed parameters.
Soil flexibility played a critical role in the effectiveness of the control device. More substantial reductions in response were observed on firmer soils compared to soft soil, where the reduction percentages were generally less than half of those achieved on firmer soils. Consequently, soil flexibility adversely affects the efficiency of the control device.
In terms of the inelastic behavior of the structure, the control device significantly reduced the maximum rotation demand at the plastic hinge located at the base of the chimney across most soil types. This reduction was greater than that observed in the moments at the hinge. However, for soft soil, the impact of the control system on response was limited. For earthquakes, the reduction was only notable outside of the intense phase, while for wind excitation, the differences were negligible.
Incremental analyses demonstrated that the use of a TMD enhances the structural response when accounting for soil–structure interaction. The most favorable results were achieved on firm soils. This simple device reduces the demands on the original structure, making it a suitable solution for reducing the structural response of similar constructions subjected to seismic and wind forces, particularly when founded on firm soil.
The findings of this study are consistent with those reported by Elias [53] regarding earthquake response control of a reinforced concrete chimney with consideration for SSI. Specifically, reduction percentages on rock were recorded as 13.6% in this study, compared to 19.6% reported by Elias [53]. Differences arise because Elias [53] performed elastic analyses, while this study used the FAM to include material nonlinearity.
In terms of wind excitation, the uncontrolled structural response on soft soil was found to be less than that on more rigid soils without control. This suggests that wind demands are more destructive for chimneys under firm soil conditions, a conclusion also supported by Galsworthy and Naggar [13].
The results indicate that soil flexibility may reduce the effectiveness of the control device when subjected to both earthquake and wind excitations. This finding aligns with other studies [53], which demonstrated that the response with the TMD could surpass the uncontrolled response depending on the excitation.
Comparing the numerical results obtained in this study with experimental data proves challenging due to the absence of real vibration records for chimneys fitted with vibration control systems. Nonetheless, the numerical findings align with the conclusions drawn by Galsworthy and Naggar [13] as well as Elias [53].
The FAM has demonstrated reliability in reproducing experimental results through the flexural model utilized in this study, as evidenced in Li et al. [44]. Moreover, previous research [29,30,39,41] has compared the FAM with refined finite element models, revealing that the FAM not only accurately predicts outcomes but also does so with significantly reduced computational costs for both static and nonlinear dynamic analyses. Additional validations supporting the FAM’s results are presented by Patlán, Hernández-Barrios, and Gómez [49], as well as Patlán [74,75]. These validations reinforce the application of the FAM for the nonlinear dynamic analyses conducted in this study.

5. Conclusions

This study examines the control of vibrations caused by extreme earthquake and wind forces in slender structures, taking into account the effects of soil–structure interaction (SSI) and material nonlinearity by using the Force Analogy Method (FAM). Through extensive dynamic analyses, the effectiveness of a tuned mass damper (TMD) was assessed across various soil types, identifying the conditions under which this control system operates most efficiently.
The implementation of the FAM introduces a novel approach in this context, providing a robust framework for understanding the nonlinear behavior and the complex interactions between soil and structure, including control devices. Its application proved crucial in accurately predicting the dynamic response of the structure under extreme loading conditions, revealing insights that the linear analysis failed to capture. This innovative methodology facilitated a thorough evaluation of the TMD’s performance in mitigating responses induced by earthquake and wind forces, emphasizing its potential for broader applications in structural control.
In the context of earthquake analysis, the implementation of the TMD resulted in substantial reductions in displacements and base moments, with peak displacements being reduced by as much as 13.6% under rock conditions. The presence of SSI modified the dynamic properties of the structure, with the most significant effects being observed on soft soils, where the TMD’s efficacy was primarily evident during the post-intense phase of the earthquake. The findings indicate that the TMD performs optimally on rock, with its effectiveness diminishing as soil flexibility increases.
For wind excitations, the TMD achieved a remarkable reduction of up to 30.3% in maximum displacements when evaluated under dense soil conditions, with comparable performance noted on rock and rigid soils. However, its effectiveness diminishes in soft soils due to alterations in dynamic properties arising from SSI, highlighting the necessity for adaptive control systems in such scenarios. Incremental analyses demonstrated that as the wind velocity increases, the maximum response of the structure intensifies, emphasizing the importance of utilizing optimized control devices for extreme conditions.
Incorporating material nonlinearity through the FAM and SSI in the analysis revealed critical effects that a linear model would overlook. This approach underscores the significance of considering these factors when designing control systems. The findings suggest that while the TMD is effective in mitigating dynamic responses, its design must be specifically tailored to the soil and structural characteristics to maximize performance.
These results highlight the importance of integrating SSI effects and material nonlinearity into the design of slender structures with passive control systems subjected to extreme events. This integration promotes more informed and responsible design practices, ensuring the effectiveness of these systems under realistic and complex conditions.
Future research should prioritize the development of alternative control systems aimed at enhancing effectiveness on soft soils and during extreme events, especially for structures that are highly vulnerable. Moreover, extending the analyses conducted in this study to encompass more complex structures, such as bridges or communication towers, would be beneficial for validating the general applicability of the findings.
Author Contributions

Conceptualization, C.M.P.M., H.H.B. and R.G.M.; methodology, C.M.P.M.; software, C.M.P.M.; validation, C.M.P.M. and H.H.B.; formal analysis, C.M.P.M.; data curation, C.M.P.M.; writing—original draft preparation, C.M.P.M., H.H.B. and R.G.M.; writing—review and editing, C.M.P.M., H.H.B. and R.G.M.; visualization, C.M.P.M., H.H.B. and R.G.M.; supervision, H.H.B.; project administration, H.H.B. All authors have read and agreed to the published version of the manuscript.

Funding

This research received no external funding.

Data Availability Statement

The data that support the findings of this study are available from the corresponding author upon reasonable request.

Acknowledgments

The authors would like to acknowledge CONAHCYT-Becas México for financially supporting the second author in conducting doctoral studies at Universidad Nacional Autónoma de México under the supervision of the first author. The authors acknowledge the support provided by the Instituto de Ciencia, Tecnología e Innovación del Estado de Michoacán, ICTI, through project PICIR22-07-C, Vulnerabilidad eólica de estructuras de baja altura, ubicadas en la Sierra-Costa de Michoacán. Acknowledgement is also extended to the Universidad Michoacana de San Nicolás de Hidalgo, through the CIC, for its contributions to the development of this work.

Conflicts of Interest

The authors declare no conflicts of interest.

References

  1. MOC-2015. Manual de Diseño de Obras Civiles, Diseño Por Sismo; Comisión Federal de Electricidad: México City, México, 2015. [Google Scholar]
  2. MOC-2020. Manual de Diseño de Obras Civiles, Diseño Por Viento; Comisión Federal de Electricidad: México City, México, 2020. [Google Scholar]
  3. Ruscheweyh, H.; Galemann, T. Full-Scale Measurements of Wind-Induced Oscillations of Chimneys. J. Wind Eng. Ind. Aerodyn. 1996, 65, 55–62. [Google Scholar] [CrossRef]
  4. Belver, A.V.; Ibán, A.L.; Lavín Martín, C.E. Coupling between Structural and Fluid Dynamic Problems Applied to Vortex Shedding in a 90m Steel Chimney. J. Wind Eng. Ind. Aerodyn. 2012, 100, 30–37. [Google Scholar] [CrossRef]
  5. Lipecki, T.; Bęc, J.; Jamińska, P. A Comparative Study of Along-Wind and Crosswind Responses of Steel Chimneys According to Polish and Eurocode Standards. Czas. Tech. 2015, 2B, 107–126. [Google Scholar] [CrossRef]
  6. Arunachalam, S.; Lakshmanan, N. Across-Wind Response of Tall Circular Chimneys to Vortex Shedding. J. Wind Eng. Ind. Aerodyn. 2015, 145, 187–195. [Google Scholar] [CrossRef]
  7. Liang, S.; Yang, W.; Song, J.; Wang, L.; Hu, G. Wind-Induced Responses of a Tall Chimney by Aeroelastic Wind Tunnel Test Using a Continuous Model. Eng. Struct. 2018, 176, 871–880. [Google Scholar] [CrossRef]
  8. Sanada, S.; Suzuki, M.; Matsumoto, H. Full Scale Measurements of Wind Force Acting on a 200m Concrete Chimney, and the Chimney’s Response. J. Wind Eng. Ind. Aerodyn. 1992, 43, 2165–2176. [Google Scholar] [CrossRef]
  9. Cheng, C.-M.; Kareem, A. Acrosswind Response of Reinforced Concrete Chimneys. J. Wind Eng. Ind. Aerodyn. 1992, 43, 2141–2152. [Google Scholar] [CrossRef]
  10. Ciesielski, R.; Oruba, R. Low-Speed Wind Gusts Used for Experimental Evaluation of Eigenfrequencies of Tall Reinforced Concrete Chimneys. J. Wind Eng. Ind. Aerodyn. 1996, 65, 97–106. [Google Scholar] [CrossRef]
  11. Cavacece, M.; Valentini, P.P. An Experimental and Numerical Approach to Investigate the Dynamic Response of a Four-flue Chimney of a Thermo-electrical Plant. Struct. Des. Tall Spec. Build. 2003, 12, 283–291. [Google Scholar] [CrossRef]
  12. Chien, C.-W.; Jang, J.-J. Case Study of Wind-Resistant Design and Analysis of High Mast Structures Based on Different Wind Codes. J. Mar. Sci. Technol. 2008, 16, 275–287. [Google Scholar] [CrossRef]
  13. Galsworthy, J.K.; Naggar, M.H.E. Effect of Foundation Flexibility on the Across-Wind Response of Reinforced Concrete Chimneys with Free-Standing Liners. Can. Geotech. J. 2000, 37, 676–688. [Google Scholar] [CrossRef]
  14. Gorski, P.; Chmielewski, T. A Comparative Study of along and Cross-Wind Responses of a Tall Chimney with and without Flexibility of Soil. Wind Struct. 2008, 11, 121–135. [Google Scholar] [CrossRef]
  15. Wilson, J.L. Code Recommendations for the Aseismic Design of Tall Reinforced Concrete Chimneys. In Proceedings of the CICIND’s 53rd meeting, Bilbao, Spain, 8–12 January 2000. [Google Scholar]
  16. Wilson, J.L. Earthquake Response of Tall Reinforced Concrete Chimneys. Eng. Struct. 2003, 25, 11–24. [Google Scholar] [CrossRef]
  17. Murali, G.; Mohan, B.; Sitara, P.; Jayasree, P. Response of Mild Steel Chimney Under Wind Loads. Int. J. Eng. Res. Appl. 2012, 2, 490–498. [Google Scholar]
  18. Wong, K.K.F.; Yang, R. Inelastic Dynamic Response of Structures Using Force Analogy Method. J. Eng. Mech. 1999, 125, 1190–1199. [Google Scholar] [CrossRef]
  19. Wong, K.K.F.; Wang, Y. Energy-based Design of Structures Using Modified Force Analogy Method. Struct. Des. Tall Spec. Build. 2003, 12, 393–407. [Google Scholar] [CrossRef]
  20. Wang, Z.; Wong, K.K. Stochastic Dynamic Analysis of Inelastic Structures Using Force Analogy Method. J. Eng. Mech. 2007, 133, 414–421. [Google Scholar] [CrossRef]
  21. Wong, K.K.F.; Wang, Z. Seismic Analysis of Inelastic Moment-resisting Frames Part I: Modified Force Analogy Method for End Offsets. Struct. Des. Tall Spec. Build. 2007, 16, 267–282. [Google Scholar] [CrossRef]
  22. Wong, K.K.F.; Wang, Z. Seismic Analysis of Inelastic Moment-resisting Frames Part II: Energy Dissipation in Deformable Panel Zones. Struct. Des. Tall Spec. Build. 2007, 16, 283–299. [Google Scholar] [CrossRef]
  23. Zhang, X.; Wong, K.K.F.; Wang, Y. Performance Assessment of Moment Resisting Frames during Earthquakes Based on the Force Analogy Method. Eng. Struct. 2007, 29, 2792–2802. [Google Scholar] [CrossRef]
  24. Li, G.; Li, H. Seismic Response Analysis of Structure with Energy Dissipation Devices Using Force Analogy Method. Struct. Des. Tall Spec. Build. 2011, 20, 291–313. [Google Scholar] [CrossRef]
  25. Song, S.Q.; Li, G. Inelastic Dynamic Analysis of Steel Structure Using Force Analogy Method. Appl. Mech. Mater. 2012, 166–169, 304–309. [Google Scholar] [CrossRef]
  26. Li, G.; Li, H.; Zhang, Y. Displacement Estimation of Nonlinear Structures Using the Force Analogy Method. Struct. Des. Tall Spec. Build. 2015, 24, 59–72. [Google Scholar] [CrossRef]
  27. Toloue, I.; Liew, M.S.; Harahap, I.S.H. The Effect of Element Types on Force Analogy Method Analysis. J. Eng. Technol. Sci. 2017, 49, 785–798. [Google Scholar] [CrossRef]
  28. Bahar, H.; Bahar, A. A Force Analogy Method (FAM) Assessment on Different Static Condensation Procedures for Frames with Full Rayleigh Damping. Struct. Des. Tall Spec. Build. 2018, 27, e1468. [Google Scholar] [CrossRef]
  29. Ningthoukhongjam, S.S.; Singh, K.D. Mass Irregularity Effect on Seismic Response of Moment-resisting Steel Frame by Nonlinear Time History Analysis Using Force Analogy Method. Struct. Des. Tall Spec. Build. 2021, 30, e1823. [Google Scholar] [CrossRef]
  30. Ningthoukhongjam, S.S.; Singh, K.D. Analysis of Mid-Rise Moment Resisting Steel Frames by Nonlinear Time History Analysis Using Force Analogy Method. J. Inst. Eng. India Ser. A 2021, 102, 901–918. [Google Scholar] [CrossRef]
  31. Wong, K.K.F.; Yang, R. Earthquake Response and Energy Evaluation of Inelastic Structures. J. Eng. Mech. 2002, 128, 308–317. [Google Scholar] [CrossRef]
  32. Wong, K.K. Seismic Energy Dissipation of Inelastic Structures with Tuned Mass Dampers. J. Eng. Mech. 2008, 134, 163–172. [Google Scholar] [CrossRef]
  33. Wong, K.K.F. Seismic Applications of Nonlinear Response Spectra Based on the Theory of Modal Analysis. Procedia Eng. 2011, 14, 1645–1652. [Google Scholar] [CrossRef]
  34. Wong, K.K.; Zhao, D. Uncoupling of Potential Energy in Nonlinear Seismic Analysis of Framed Structures. J. Eng. Mech. 2007, 133, 1061–1071. [Google Scholar] [CrossRef]
  35. Wang, Z.; Wong, K.K.F. Energy Evaluation of Inelastic Structures Subjected to Random Earthquake Excitations. Struct. Des. Tall Spec. Build. 2009, 18, 559–571. [Google Scholar] [CrossRef]
  36. Wong, K.K.; Johnson, J. Seismic Energy Dissipation of Inelastic Structures with Multiple Tuned Mass Dampers. J. Eng. Mech. 2009, 135, 265–275. [Google Scholar] [CrossRef]
  37. Li, L.; Liu, Q.; Li, H. Inelastic Structural Control Based on MBC and FAM. Math. Probl. Eng. 2011, 2011, 460731. [Google Scholar] [CrossRef]
  38. Wong, K.K.F.; Harris, J.L. Seismic Fragility and Cost Analyses of Actively Controlled Structures. Struct. Des. Tall Spec. Build. 2013, 22, 569–583. [Google Scholar] [CrossRef]
  39. Safaei, S.; Taslimi, A.; Tehrani, P. A Study on the Accuracy of Force Analogy Method in Nonlinear Static Analysis. Struct. Des. Tall Spec. Build. 2019, 28, e1654. [Google Scholar] [CrossRef]
  40. Iancovici, M.; Ionică, G.; Pavel, F.; Moța, F.; Nica, G.B. Nonlinear Dynamic Response Analysis of Buildings for Wind Loads. A New Frontier in the Structural Wind Engineering. J. Build. Eng. 2022, 47, 103708. [Google Scholar] [CrossRef]
  41. Nica, G.B.; Munteanu, R.I.; Calofir, V.; Iancovici, M. Modelling Nonlinear Behavior of 3D Frames Using the Force Analogy Method. Structures 2022, 35, 1162–1174. [Google Scholar] [CrossRef]
  42. Chao, S.; Loh, C. Inelastic Response Analysis of Reinforced Concrete Structures Using Modified Force Analogy Method. Earthq. Eng. Struct. Dyn. 2007, 36, 1659–1683. [Google Scholar] [CrossRef]
  43. Li, G.; Zhang, Y.; Li, H.-N. Seismic Damage Analysis of Reinforced Concrete Frame Using the Force Analogy Method. J. Eng. Mech. 2013, 139, 1780–1789. [Google Scholar] [CrossRef]
  44. Li, G.; Zhang, Y.; Li, H. Nonlinear Seismic Analysis of Reinforced Concrete Frames Using the Force Analogy Method. Earthq. Eng. Struct. Dyn. 2014, 43, 2115–2134. [Google Scholar] [CrossRef]
  45. Munteanu, R.I.; Moţa, F.; Calofir, V.; Baciu, C. New Approach to Nonlinear Dynamic Analysis of Reinforced Concrete 3D Frames; An Accurate and Computational Efficient Mathematical Model. Appl. Sci. 2022, 12, 1692. [Google Scholar] [CrossRef]
  46. Li, G.; Zhang, F.; Zhang, Y.; Li, H. Nonlinear Hysteretic Behavior Simulation of Reinforced Concrete Shear Walls Using the Force Analogy Method. Struct. Des. Tall Spec. Build. 2015, 24, 504–520. [Google Scholar] [CrossRef]
  47. Li, G.; Fahnestock, L.A.; Li, H.-N. Simulation of Steel Brace Hysteretic Response Using the Force Analogy Method. J. Struct. Eng. 2013, 139, 526–536. [Google Scholar] [CrossRef]
  48. Calofir, V.; Nica, B.G.; Pavel, F. A Nonlinear Model to Analyze the Structures Pounding Forces During Earthquakes. Arab. J. Sci. Eng. 2020, 45, 8303–8314. [Google Scholar] [CrossRef]
  49. Patlán, C.M.; Hernández-Barrios, H.; Gomez, R. Nonlinear Dynamic Analysis Using the Force Analogy Method and the Ibarra–Medina–Krawinkler Model. Struct. Des. Tall Spec. Build. 2024, 34, e2197. [Google Scholar] [CrossRef]
  50. Li, G.; Wong, K.K.F. Theory of Nonlinear Structural Analysis: The Force Analogy Method for Earthquake Engineering, 1st ed.; Wiley: Singapore, 2014. [Google Scholar] [CrossRef]
  51. Ciesielski, R.; Flaga, A.; Kawecki, J. Aerodynamic Effects on a Non-Typical Steel Chimney 120 m High. J. Wind Eng. Ind. Aerodyn. 1996, 65, 77–86. [Google Scholar] [CrossRef]
  52. Tranvik, P.; Alpsten, G. Structural Behaviour under Wind Loading of a 90 m Steel Chimney. Wind Struct. 2005, 8, 61–78. [Google Scholar] [CrossRef]
  53. Elias, S. Effect of SSI on Vibration Control of Structures with Tuned Vibration Absorbers. Shock Vib. 2019, 2019, 7463031. [Google Scholar] [CrossRef]
  54. Longarini, N.; Zucca, M. A Chimney’s Seismic Assessment by a Tuned Mass Damper. Eng. Struct. 2014, 79, 290–296. [Google Scholar] [CrossRef]
  55. Takeda, T.; Sozen, M.A.; Nielsen, N.N. Reinforced Concrete Response to Simulated Earthquakes. J. Struct. Div. 1970, 96, 2557–2573. [Google Scholar] [CrossRef]
  56. Sezen, H.; Chowdhury, T. Hysteretic Model for Reinforced Concrete Columns Including the Effect of Shear and Axial Load Failure. J. Struct. Eng. 2009, 135, 139–146. [Google Scholar] [CrossRef]
  57. Xu, S.; Zhang, J. Hysteretic Shear–Flexure Interaction Model of Reinforced Concrete Columns for Seismic Response Assessment of Bridges. Earthq. Eng. Struct. Dyn. 2011, 40, 315–337. [Google Scholar] [CrossRef]
  58. Salvi, J.; Pioldi, F.; Rizzi, E. Optimum Tuned Mass Dampers under Seismic Soil-Structure Interaction. Soil Dyn. Earthq. Eng. 2018, 114, 576–597. [Google Scholar] [CrossRef]
  59. Aydin, E.; Ozturk, B.; Bogdanovic, A.; Noroozinejad Farsangi, E. Influence of Soil-Structure Interaction (SSI) on Optimal Design of Passive Damping Devices. Structures 2020, 28, 847–862. [Google Scholar] [CrossRef]
  60. Huergo, I.F.; Hernández, H. Coupled-two-beam Discrete Model for Dynamic Analysis of Tall Buildings with Tuned Mass Dampers Including Soil–Structure Interaction. Struct. Des. Tall Build 2020, 29, e1683. [Google Scholar] [CrossRef]
  61. TRC; Chadwell, C. XTRACT, Version 3.0.8, Windows; TRC: Windsor, CT, USA, 2007.
  62. Baker, A.L.L.; Amarakone, A.M.N. Inelastic Hyperstatic Frames Analysis. In Proceedings of the international symposium on the flexural mechanics of reinforced concrete; ASCE-ACI: Montreal, QC, Canada, 1964; pp. 85–142. [Google Scholar]
  63. Mattock, A.H. Rotational Capacity of Hinging Regions in Reinforced Concrete Beams. In Proceedings of the ASCE-ACI International Symposium; ACI: Elkhorn, NE, USA, 1965; pp. 143–181. [Google Scholar]
  64. Park, R.; Priestley, M.J.N.; Gill, W.D. Ductility of Square-Confined Concrete Columns. J. Struct. Div. 1982, 108, 929–950. [Google Scholar] [CrossRef]
  65. Sheikh, S.A.; Khoury, S.S. Confined Concrete Columns With Stubs. ACI Struct. J. 1993, 90, 414–431. [Google Scholar] [CrossRef]
  66. Mendis, P. Plastic Hinge Lengths of Normal and High-Strength Concrete in Flexure. Adv. Struct. Eng. 2002, 4, 189–195. [Google Scholar] [CrossRef]
  67. Sakai, K.; Sheikh, S.A. What Do We Know about Confinement in Reinforced Concrete Columns? (A Critical Review of Previous Work and Code Provisions). ACI Struct. J. 1989, 86, 192–207. [Google Scholar]
  68. Bae, S.; Bayrak, O. Plastic Hinge Length of Reinforced Concrete Columns. ACI Struct. J. 2008, 105, 290–300. [Google Scholar] [CrossRef]
  69. Gazetas, G. Formulas and Charts for Impedances of Surface and Embedded Foundations. J. Geotech. Eng. 1991, 117, 1363–1381. [Google Scholar] [CrossRef]
  70. Bachmann, H.; Ammann, W.J.; Deischl, F.; Eisenmann, J.; Floegl, I.; Hirsch, G.H.; Klein, G.K.; Lande, G.J.; Mahrenholtz, O.; Natke, H.G.; et al. Vibration Problems in Structures; Birkhäuser Basel: Basel, Switzerland, 1995. [Google Scholar] [CrossRef]
  71. Shinozuka, M.; Deodatis, G. Simulation of Stochastic Processes by Spectral Representation. Appl. Mech. Rev. 1991, 44, 191–204. [Google Scholar] [CrossRef]
  72. Fernández Lorenzo, I.; Clavelo Elena, B.; Martín Rodríguez, P.; Elena Parnás, V.B. Dynamic Analysis of Self-Supported Tower under Hurricane Wind Conditions. J. Wind Eng. Ind. Aerodyn. 2020, 197, 104078. [Google Scholar] [CrossRef]
  73. Snaiki, R.; Wu, T. A Semi-Empirical Model for Mean Wind Velocity Profile of Landfalling Hurricane Boundary Layers. J. Wind Eng. Ind. Aerodyn. 2018, 180, 249–261. [Google Scholar] [CrossRef]
  74. Patlán, C.M. Control de Vibraciones Sísmicas y Eólicas En Una Estructura Esbelta. Master’s Thesis, Universidad Michoacana de San Nicolás de Hidalgo, Morelia, Mexico, 2020. [Google Scholar]
  75. Patlán, C.M. Control de Vibraciones Eólicas En Estructuras Esbeltas Considerando Interacción Suelo Estructura y Efectos No Lineales. Ph.D. Thesis, Universidad Nacional Autónoma de México, Ciudad de México, Mexico, 2025. [Google Scholar]
Figure 1. Regional maps of Mexico.
Buildings 15 00459 g001
Figure 2. The basic force–displacement relationship in the FAM.
Buildings 15 00459 g002
Figure 3. Flexural hinge backbone.
Buildings 15 00459 g003
Figure 4. Hysteretic model. Numerical values indicate the sequence of hysteretic behavior.
Buildings 15 00459 g004
Figure 5. The unloading branch of the flexural hinge.
Buildings 15 00459 g005
Figure 6. The reloading branch of the flexural hinge.
Buildings 15 00459 g006
Figure 7. Step-by-step solution of nonlinear analysis using FAM.
Buildings 15 00459 g007
Figure 8. The iterative procedure used to obtain the actions and responses in the plastic hinges.
Buildings 15 00459 g008
Figure 9. Chimney properties. Distances in mm; elevations in m.
Buildings 15 00459 g009
Figure 10. The numerical model of the chimney.
Buildings 15 00459 g010
Figure 11. A comparison of the chimney’s mode shapes for different soil types.
Buildings 15 00459 g011
Figure 12. A comparison of the chimney’s mode shapes with a TMD for different soil types.
Buildings 15 00459 g012
Figure 13. The S00E component from the Caleta de Campos station.
Buildings 15 00459 g013
Figure 14. Chimney cap displacement in earthquake analysis.
Buildings 15 00459 g014
Figure 15. Moment at plastic hinge in earthquake analysis.
Buildings 15 00459 g015
Figure 16. Rotation at plastic hinge in earthquake analysis.
Buildings 15 00459 g016
Figure 17. Chimney cap displacement in frequency domain for earthquake analysis.
Buildings 15 00459 g017
Figure 18. Comparison of maximum displacements for uncontrolled models and those with TMD.
Buildings 15 00459 g018
Figure 19. Comparison of maximum accelerations for uncontrolled models and those with TMD.
Buildings 15 00459 g019
Figure 20. Wind simulations.
Buildings 15 00459 g020
Figure 21. Wind-induced displacement response.
Buildings 15 00459 g021
Figure 22. The wind-induced moment response at the plastic hinge at the base.
Buildings 15 00459 g022
Figure 23. The wind-induced rotation response at the plastic hinge at the base.
Buildings 15 00459 g023
Figure 24. Wind-induced chimney cap displacement in frequency domain.
Buildings 15 00459 g024
Figure 25. A comparison of maximum displacements under wind loads for models with and without a TMD.
Buildings 15 00459 g025
Figure 26. A comparison of maximum accelerations under wind loads for models with and without a TMD.
Buildings 15 00459 g026
Table 1. Plastic behavior of flexural hinge branches.
Branch f int Λ int k t Γ Λ
Hardening f c r Λ c r f y f c r Λ y Λ c r k t , A B ( Λ Λ c r ) + f c r
Yielding f y Λ y 0.01 k t , B C ( Λ Λ y ) + f y
Deterioration f y Λ u f y Λ f Λ u k t , C D ( Λ Λ u ) + f y
Unloading f d Λ d k t = 1.7 k t , A B Λ y Λ d 0.4 k t , G H ( Λ Λ d ) + f d
Reloading0 Λ r k t = f t Λ t Λ r k t , H I ( Λ Λ r )
Table 2. Longitudinal and transversal reinforcement properties.
Frame A s V s t / V c Frame A s V s t / V c
141040.504%918240.465%
241040.524%1012160.328%
341040.546%119310.348%
441040.570%129310.371%
528500.595%136840.397%
628500.623%146840.241%
728500.419%154750.260%
828500.441%163040.284%
Table 3. Cracking moment and curvature of model sections.
Frame P A t y I t f c r ϕ c r
[kN][cm2][m][m4][kN m][1 × 10⁻³/m]
123,82716304.58153.83153,7460.0406
222,29015574.50142.09143,6260.0411
320,75214864.42131.03133,8590.0415
419,21514174.34120.64124,4480.0419
517,67812604.26103.55110,0100.0431
616,14111954.1894.65101,3580.0435
714,60411314.0986.3293,0390.0438
813,06610684.0178.5585,0460.0440
911,5299353.9366.1373,2760.0450
1099928323.8556.6463,6070.0456
1184557553.7749.3555,5770.0457
1269186993.6843.9048,9740.0453
1353806283.6037.8141,7520.0448
1438435763.5233.2335,7610.0437
1523065103.4428.2229,3140.0422
167694493.3623.7823,3150.0398
Table 4. Yield, ultimate, and fracture points of model sections.
Frame A c o n f f y ϕ y ϕ u ϕ f
[cm2][kN m][1 × 10⁻³/m][1 × 10−3/m][1 × 10−3/m]
11119695,0000.4677.1108.370
21050674,0000.4797.2108.480
3983652,0000.4907.3408.640
4918631,0000.5027.4808.800
5854469,0000.4999.06010.700
6792452,0000.5119.20010.800
7731426,0000.5147.0308.270
8673409,0000.5277.1708.430
9616284,0000.5199.16010.800
10560200,0000.5059.22010.900
11507158,0000.51011.10013.000
12455149,0000.52611.20013.100
13405114,0000.53514.20016.700
14356101,0000.53110.50012.300
1530990,6000.54414.10016.600
1626442,3000.52014.40017.000
Table 5. Plastic hinge backbones for the chimney.
Frame l p f c r Λ c r f y Λ y Λ u Λ f
[m][kN m][1 × 10⁻³ rad][kN m][1 × 10⁻³ rad][1 × 10⁻³ rad][1 × 10⁻³ rad]
12.335153,7460.095695,0001.0916.6019.50
22.317143,6260.095674,0001.1116.7019.70
32.300133,8590.095652,0001.1316.9019.90
42.285124,4480.096631,0001.1517.1020.10
52.128110,0100.092469,0001.0619.3022.70
62.095101,3580.091452,0001.0719.3022.70
72.07793,0390.091426,0001.0714.6017.20
82.06085,0460.091409,0001.0914.8017.40
91.96573,2760.088284,0001.0218.0021.20
101.92463,6070.088200,0000.9717.7020.90
111.88355,5770.086158,0000.9620.9024.50
121.84248,9740.083149,0000.9720.6024.20
131.80141,7520.081114,0000.9625.6030.10
141.76035,7610.077101,0000.9418.5021.70
151.71929,3140.07390,6000.9424.2028.50
161.67823,3150.06742,3000.8724.2028.40
Table 6. Soil and foundation properties.
PropertyRockDense SoilStiff SoilSoft Soil
ρ [kg/m3]2700240019001800
ν 0.2500.3300.4800.490
G [GPa]20.0000.6000.1710.018
V s [m/s]2722500300100
k t [GN/m]1140.035.811.21.2
k θ [GN m]137,000.04610.01690.0181.0
c t [GN s/m]2.9900.5120.2670.085
c θ [GN s m]94.10017.20010.5003.390
Table 7. Lateral periods [s] of chimney with flexible base.
ModeFixed BaseFlexible Base
RockDense SoilStiff SoilSoft Soil
11.161.161.181.211.54
20.250.250.260.270.4
30.110.110.110.120.27
40.060.060.070.10.13
Table 8. Dynamic properties of models with TMD.
Soil Type T m G E N T T M D m T M D k T M D c T M D
[s][Mg][s][Mg][kN/m][kN s/m]
Rock1.164461.198.912507.94
Dense soil1.184511.209.012467.92
Stiff soil1.214591.239.182407.89
Soft soil1.545431.5710.901757.33
Table 9. Lateral periods [s] of models with TMD.
ModeRockDense SoilStiff SoilSoft Soil
11.261.281.311.67
21.091.111.141.45
30.250.260.270.4
40.110.110.120.27
Table 10. Maximum earthquake response on rock and dense soil.
ResponseRockDense Soil
No ControlWith ControlReductionNo ControlWith ControlReduction
x [m]0.140.1213.6%0.140.135.5%
a [m/s2]8.627.997.2%9.829.196.3%
V b [kN]6116.905627.408.0%5975.955570.326.8%
M b [kN m]199,529.93182,743.788.4%190,441.84180,018.025.5%
Table 11. Maximum earthquake response on stiff and soft soil.
ResponseStiff SoilSoft Soil
No ControlWith ControlReductionNo ControlWith ControlReduction
x [m]0.140.142.7%0.180.174.4%
a [m/s2]8.478.144.0%3.933.657.0%
V b [kN]6275.785594.3010.9%2798.632651.775.2%
M b [kN m]191,448.07183,603.554.1%144,611.20137,408.835.0%
Table 12. Maximum wind response on rock and dense soil.
ResponseRockDense Soil
No ControlWith ControlReductionNo ControlWith ControlReduction
x [m]0.310.2325.0%0.320.2230.3%
a [m/s2]6.485.968.1%3.562.9517.1%
V b [kN]9400.829091.703.3%8926.648728.822.2%
M b [kN m]445,557.40351,971.0621.0%459,100.25350,427.5923.7%
Table 13. Maximum wind response on stiff and soft soil.
ResponseStiff SoilSoft Soil
No ControlWith ControlReductionNo ControlWith ControlReduction
x [m]0.330.2523.1%0.210.203.1%
a [m/s2]3.312.8414.3%1.791.5016.0%
V b [kN]8881.398513.174.1%7147.847060.191.2%
M b [kN m]456,794.07361,611.3020.8%298,814.73288,077.493.6%
Disclaimer/Publisher’s Note: The statements, opinions and data contained in all publications are solely those of the individual author(s) and contributor(s) and not of MDPI and/or the editor(s). MDPI and/or the editor(s) disclaim responsibility for any injury to people or property resulting from any ideas, methods, instructions or products referred to in the content.