Article

The Moderating Effect of Education Level and Income on Job Performance of Supervising Engineers

by
Ali Katebi
1,*,
Ahmadreza Keshtkar-Ghalati
2,
Bahareh Katebi
3,
Zahra Alsadat Ardestani
2 and
Ali Bordbar
1
1
Civil Engineering Group, Department of Construction Engineering and Management, Faculty of Engineering, Kharazmi University, Tehran 15719-14911, Iran
2
Faculty of Art & Architecture, Kharazmi University, Tehran 15719-14911, Iran
3
Department of Geotechnics, Building and Housing Research Center (BHRC), Tehran 13145-1696, Iran
*
Author to whom correspondence should be addressed.
Buildings 2025, 15(3), 397; https://doi.org/10.3390/buildings15030397
Submission received: 19 October 2024 / Revised: 8 January 2025 / Accepted: 17 January 2025 / Published: 26 January 2025
(This article belongs to the Section Construction Management, and Computers & Digitization)

Abstract

The proper implementation of the monitoring process in construction projects helps strengthen sustainable development indicators. The aim of this study is to investigate the moderating effects of education and income on the relationship between job performance and effective factors on supervising engineers. Data gathering was performed by questionnaire, and analysis was performed with the PLS-SEM approach. According to the results of the moderator analysis, demographic variables of education and income levels, on the relationship between feedback and competence, as well as the relationship between job identity and job performance, had a significant moderating role. In addition, the moderating effect of demographic variables on the relationship between autonomy and competence, as well as the relationship between affective commitment and job performance, was confirmed. The moderating effect of income demographic variables on the relationship between independence and affective commitment and the relationship between competence and job performance was meaningful. To achieve a better understanding of the effects of variables on job performance, the mediation role of competence and affective commitment was studied in the research model. By using the results of this research, officials and managers of construction organizations can adopt appropriate payment and training policies, to better management of the performance of the supervising engineers.

1. Introduction

Supervising engineers play a critical role in construction projects by safeguarding the environment, ensuring quality, safety, time, and cost management, and attracting stakeholders [1,2,3]. They directly contribute to project productivity. The lack of proper monitoring by supervising engineers is a significant cause of poor quality in construction projects worldwide [4,5]. In Iran, 60% of engineers with poor performance are supervising engineers, and effective monitoring can significantly increase satisfaction rates [2]. The job performance of supervising engineers is crucial for achieving sustainable development goals. Education level and income are important factors that impact their job performance. Quantitative research in this area is essential. Studies have shown that autonomy, feedback, and task identity influence job performance and job satisfaction in various industries, including construction [3,4,5,6,7,8,9,10]. Research consistently highlights that autonomy, feedback, and task identity significantly enhance job performance and satisfaction. Additionally, higher education levels and performance-based income systems correlate with improved job performance and productivity, underscoring the importance of these factors in organizational success [11,12,13,14].
Previous studies in labor economics and organizational sciences have shown that higher education levels are associated with positive professional outcomes, including better job performance [15,16,17,18]. Education plays a crucial role in both productivity and the job market, often serving as a sign of an individual’s capabilities [19,20,21,22]. The level of education also significantly impacts intellectual performance.
Nowadays, in many organizations, a “performance-based income” system is used [23]. In the opinion of Chang and Hahn (2006), when the organization pays the employee salary justly according to their performance, the perceptions of employees will be higher about the distributive justice of the organization [24]. Receiving a salary based on performance will cause employees to measure their performance. Moreover, this method of payment can act somewhat as feedback and cause employees to try to strengthen and improve their performance and productivity [23,25]. Previous studies have assessed the relationship between income and job performance, such as Valaei and Jiroudi (2016) who examined the statistical sample of media industry employees in Malaysia [26].
This study aims to fill the gap in research by examining how demographic variables like education level and income affect the job performance of supervising engineers. By understanding these effects, the study seeks to develop strategies to enhance their performance. The mediation effects of these variables were investigated using the Sobel method to gain a deeper understanding of the role of competence and affective commitment in their performance.
This study examines how demographic variables, specifically education level and income, moderate factors affecting the job performance of structural supervising engineers through structural equations. The findings aim to provide insights for construction industry experts to better understand and enhance the performance of supervising engineers. The paper includes a literature review, conceptual model and hypotheses, methodology, data analysis results, discussion, and conclusion.

1.1. Job Performance

Job performance is crucial in organizational-industry psychology and is influenced by abilities and motivation [27,28,29,30]. There is no universal definition for performance, which involves behaviors aimed at achieving organizational goals [31]. Supervising engineers’ job performance includes supervising projects, providing reports, and preventing delays [31,32,33,34].

1.2. Autonomy

Autonomy refers to the freedom and authority given to employees to plan and execute their work [35]. Higher autonomy leads to a greater sense of ownership and responsibility, potentially improving job performance [36]. Studies have shown autonomy’s positive impact on supervising engineers’ performance [37,38,39,40]. The following hypothesis is presented with regard to that literature:
H1. 
Autonomy affects the job performance of the supervising engineers.

1.3. Feedback

Feedback indicates the effectiveness of employee efforts [35]. It helps employees understand their performance levels and improve where necessary. Research shows that feedback enhances employees’ awareness of their work results and positively affects job performance [41,42]. The following hypothesis is presented concerning the mentioned literature:
H2. 
Feedback affects the job performance of supervising engineers.

1.4. Task Identity

Task identity involves completing a task from start to finish. High task identity allows employees to see the results of their efforts, enhancing their sense of meaningful employment and job performance. Employees with a broader range of tasks tend to perform better [43,44,45]. The following hypothesis is presented with regard to the mentioned literature:
H3. 
Task identity affects the job performance of the supervising engineers.

1.5. Competence

Competence is a complex structure involving the necessary skills for smart performance with professional judgment. It means performing activities at an expected standard and is essential for personal and professional growth. Competence affects job performance and is influenced by autonomy, feedback, and task identity [46,47,48,49,50]. The following hypotheses are discussed concerning the mentioned materials:
H4. 
Competence affects the job performance of supervising engineers.
H4-1. 
Autonomy affects the competence of supervising engineers.
H4-2. 
Feedback affects the competence of supervising engineers.
H4-3. 
Task identity affects the competence of supervising engineers.

1.6. Affective Commitment

Affective commitment is the emotional attachment an employee has to their role and organization [51,52,53,54]. It impacts job performance and is associated with organizational outcomes like citizenship behavior [52,53,54,55,56,57,58,59,60,61,62,63,64,65,66,67]. High affective commitment leads to creative behaviors and better job performance [68,69,70,71,72,73]. It is influenced by autonomy, feedback, task identity, and competence [74,75,76,77,78,79,80,81,82]. The following assumptions are raised according to the above-mentioned literature:
H5. 
Affective commitment affects the job performance of supervising engineers.
H5-1. 
Autonomy affects the affective commitment of supervising engineers.
H5-2. 
Feedback affects the affective commitment of supervising engineers.
H5-3. 
Task identity affects the affective commitment of supervising engineers.
H5-4. 
Competence affects the affective commitment of supervising engineers.

2. Study Method

2.1. Process of Questionnaire Development

Content validity assesses the components of a measurement instrument to ensure they align with the research objective. Experts’ opinions are gathered in two ways: qualitatively and quantitatively. In the quantitative method, the Content Validity Ratio (CVR) and Content Validity Index (CVI) are used. Each questionnaire question should be evaluated for three CVI indices: simplicity, relevance, and clarity. Questions are approved if all three CVI indices score above 0.8.
To calculate the CVI index for each questionnaire item, experts respond to a four-choice question regarding its relevance, with options ranging from “not relevant” to “completely relevant”. The CVI index is then calculated using the following formula:
CVI = (Na + Nb)/N
The CVR coefficient is calculated by Equation (2). In order to calculate this coefficient for each item of the questionnaire, experts are asked to give their opinions on whether each item is useful or not. In the formula for this coefficient, N represents the total number of respondents and NE represents the number of useful answers. The minimum acceptable value for the CVR coefficient depends on the number of experts.
CVR = (NE−N/2)/(N/2)
The questionnaire has been developed in two parts. The questions related to model variables were in the first part, and the demographic information of respondents was included in the second section. All the questionnaire items are based on past valid research and all of them with resources are presented in Table 1. Minor changes were applied in some items to achieve a better understanding by respondents [83,84].
Content validity of the questions was investigated by the content validity ratio (CVR) and the average content validity index (CVI) [85]. This was performed in three phases with the help of 10 experts in the construction industry, on the initial questionnaire. During this process, the experts presented their comments regarding simplicity, relevance, and clarity of the items [86]. After completing the three stages of the discussion and applying the necessary partial changes, the values of CVR and CVI for all items were equal to 1. Based on existing criteria, this indicates the adequate content validity for all items of the questionnaire [87,88]. For the design of a questionnaire, a five-point Likert scale was used, and the options were formulated from “Strongly agree” to “Strongly disagree” [89,90,91,92].
Table 1. Questionnaire Items.
VariableCodesItemsReferences
Job Performance (JP)JP1I always complete the duties specified in my job description.[93]
JP2I meet all the formal performance requirements of my job.
JP3I fulfill all responsibilities required by my job.
JP4I never neglect aspects of my job that I am obligated to perform.
JP5I often fail to perform important duties. *
Autonomy (Aut)AU1I decide on my own how to go about doing the work.[94,95]
AU2I cannot use my personal initiative and judgment in carrying out my job. *
AU3I have considerable opportunity for independence and freedom in how I do my job.
Feedback (FB)FE1My job provides me clues about how well I am doing.[94,95]
FE2I can figure out how well I am doing, just by doing the work required by my job.
FE3After I finish my job, I don’t know whether I performed well. *
Task Identity (TI)TI1My job is a complete piece of work that has an obvious beginning and end.[94,95]
TI2My job is arranged so that I cannot do an entire piece of work from beginning to end. *
TI3I completely finish the pieces of work I begin.
Competence (Com)CO1I am confident about my ability to do my job.[96]
CO2I am self-assured about my capabilities to perform my work activities.
CO3I have mastered the skills necessary for my job.
Affective Commitment (AC)AC1Supervisor engineering is important to my self-image.[97]
AC2I regret having entered the supervisor engineering profession. *
AC3I am proud to be in the supervisor engineering profession.
AC4I dislike being a supervisor engineer. *
AC5I do not identify with the supervisor engineering profession. *
AC6I am enthusiastic about supervisor engineering.
Note: * = Reverse Items.

2.2. Data Collection Process

Data collection was performed by distributing questionnaires among the supervising engineers. Random sampling method was used to distribute 280 questionnaires among the members of the Iran Construction Engineering Organization (IRCEO); 173 responses were received and 3 of them were deleted due to being incomplete. Finally, 170 responses were approved so the response rate was 61.78%. According to Nulty (2008), the minimum response rate should be equal to 56%, in research using a physical questionnaire [98]. According to Hair et al. (2021), in a model based on PLS-SEM where the effect of five independent variables on a dependent variable is investigated, with an 80 percent power of model assumption and to achieve minimum R2, the minimum sample size for 1, 5, and 10 percent error are 169, 122, and 99, respectively [99]. Therefore, the sample size of this research is sufficient.

2.3. Data Analysis Method

According to Hair et al. (2021), to perform mediation analysis and examination of the moderating variables for a sample size of less than 200 in this study, the PLS-SEM method was used [99]. This method consists of two steps in which the measurement model is assessed first, and then the structural model is investigated [100]. Evaluation of the measurement model involves the analysis of reliability, convergent and discriminant validity, and the quality of the measurement model [101]. The structural model includes the evaluation of path coefficient (β), R2 and f2 index. Then, the quality of the structural model with the Q2 criteria and the overall quality of the model are measured using SRMR (Standardized Root Mean Square Residual) and GoF (Goodness-of-Fit) index [101]. The SmartPLS software (3.2.8) is used in the present [102].
According to the above discussion, the proposed model of the research is presented in Figure 1.

3. Data Analysis and Results

The statistical sample of this study comprises 170 respondents, with 11.18% and 88.82% being female and male, respectively, and 35.88% of respondents were single. The work experience of 57.65% of respondents was more than 10 years, and 40% of respondents had master’s and Ph.D. degrees. The information about the age range of individuals as well as the amount of respondent’s income has been collected by the questionnaire. Table 2 summarizes the demographic characteristics of respondents.

3.1. Evaluation of Measurement Model

The homogeneity test assessed a set of items of a reflective variable [103]. The items of a reflective variable where their factor loadings are greater than 0.7 have the same homogeneity [99]. The factor loadings of the two items were less than 0.7. Therefore, they were deleted, which was equal to 8.7% of the total items, and they were within the permissible range of 15% [99].
The reliability of the measurement model was evaluated by Cronbach’s alpha, the composite reliability, and the rho-A tests, and the results are presented in Table 3. All values were above 0.7. The communality coefficients test was used to assess the reliability of the measurement model, and its results are observed in Table 3. All of these values were more than 0.5. Based on the results of these tests, the reliability of the measurement model was confirmed [99,103,104,105,106].
To evaluate the validity of the measurement model, the convergent validity was examined by the average variance extracted (AVE) and the comparison of the AVE value with the composite reliability. The values of these two indices are presented in Table 3. CR index was larger than the AVE index and all AVE values were larger than 0.5. Therefore, the convergent validity of the measurement model was confirmed by these indices [99,103,106,107].
The cross-loading, the Fornell–Larcker, and the Heterotrait–Monotrait Ratio (HTMT) tests were used to study discriminant validity [99]. The factor loadings of all the research variables were at least 0.1 larger than the correlation with other variables, and the discriminant validity of the measurement model was validated by cross-loading tests [99,105].
The principal diagonal values of the Fornell–Larker matrix for all research variables were larger than the lines and columns of values. Therefore, the discriminant validity was confirmed by the test [101,108]. The cross-loading and the Fornell–Larcker tests are unable to assess the discriminant validity in every circumstance [109]. The HTMT values of the research variables were less than 0.9 (Table 3). Therefore, the discriminant validity was approved by the test [110]. The construct Cross-validated Communality (CV-Com) was studied by the q2 indicators and was larger than 0.02 for all variables (Table 3). This indicates the quality of the measurement model [104,111,112,113].

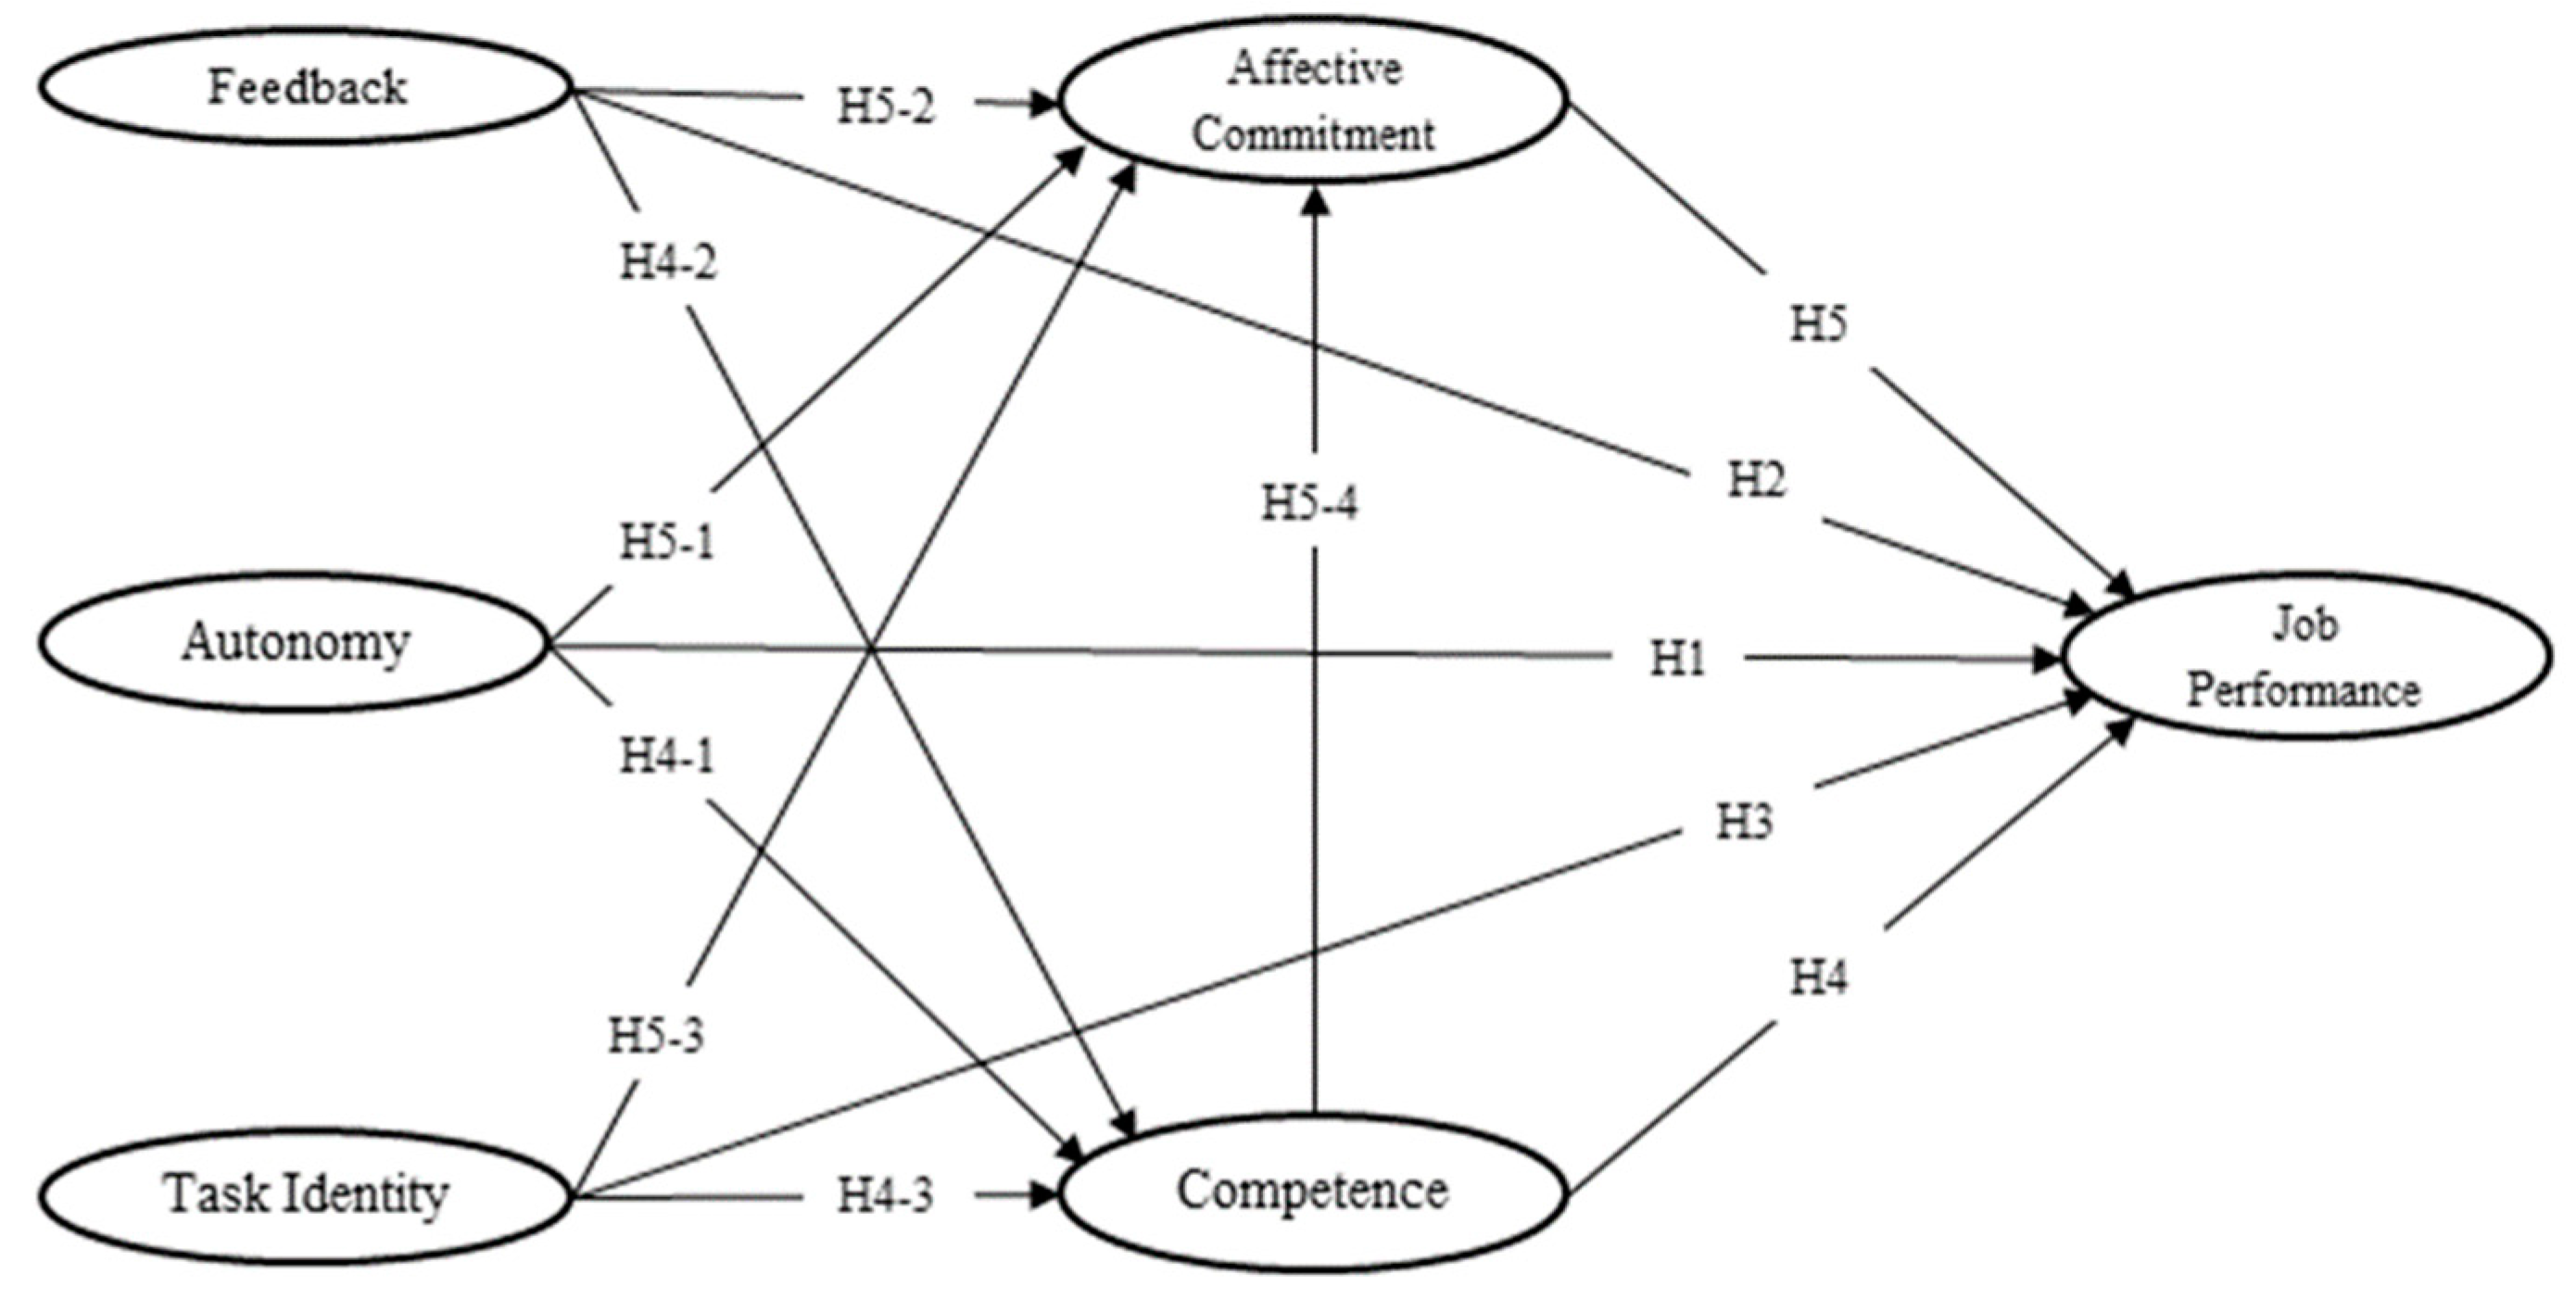
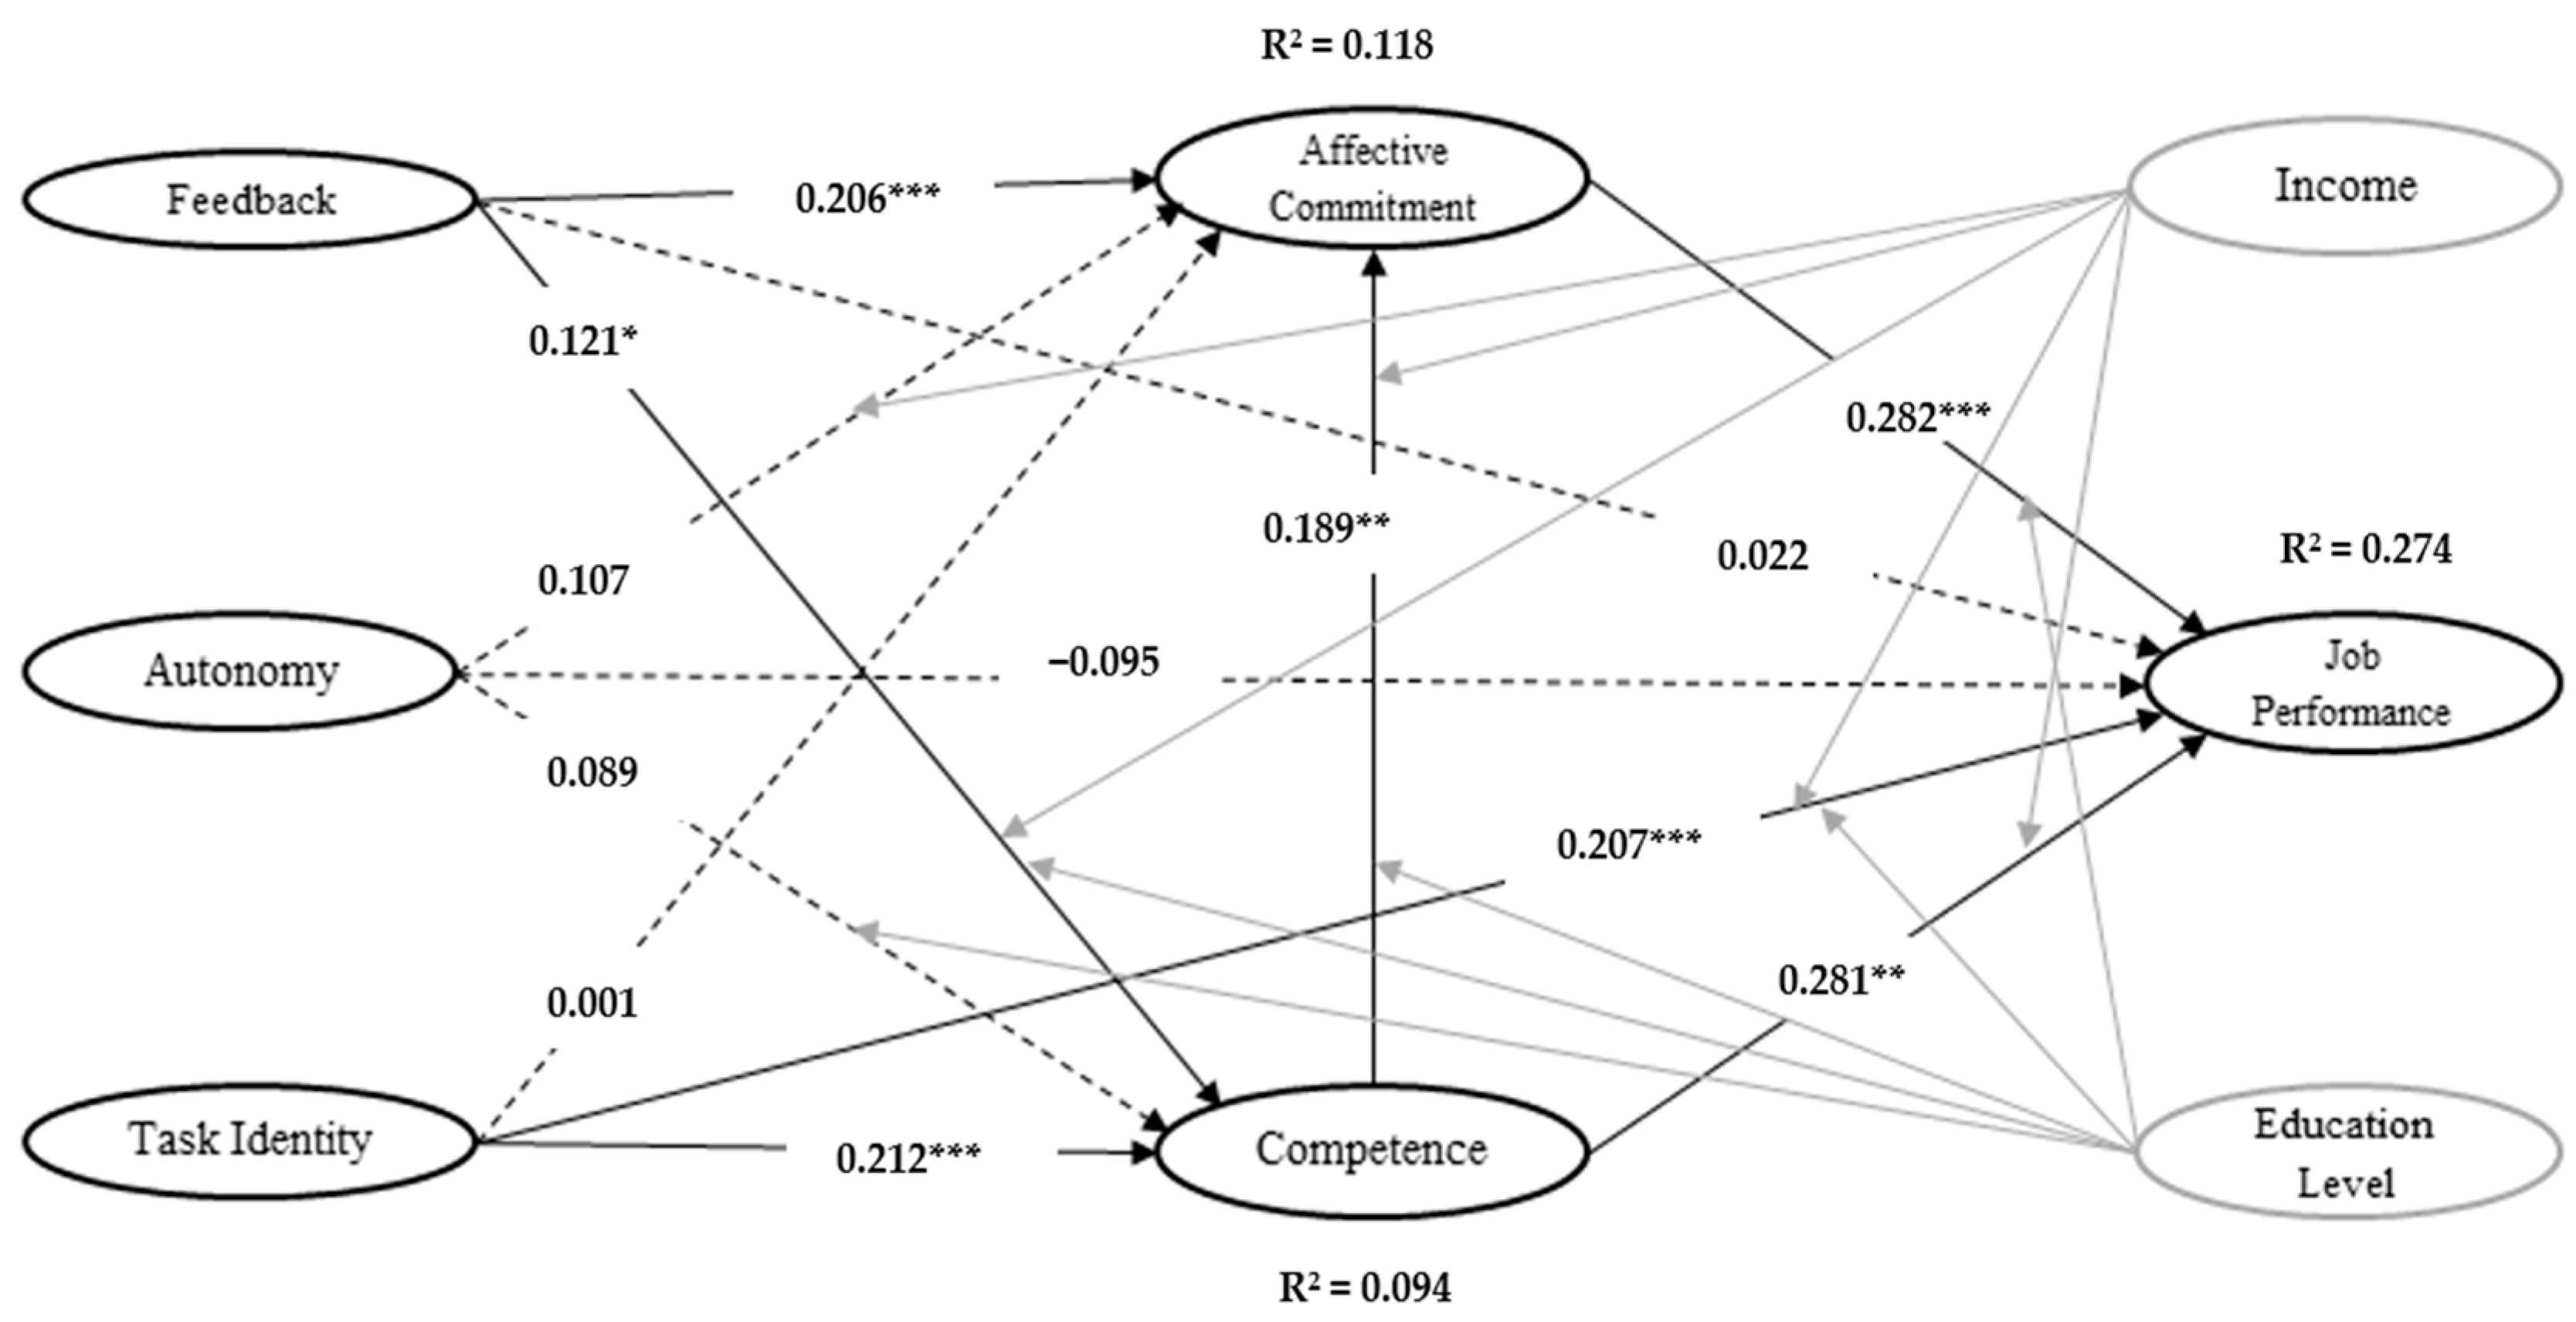
3.2. Structural Model Evaluation

The path coefficient of each of the hypotheses and their significance is presented in Table 4. Among all the hypotheses, the affective commitment variable had the highest impact on job performance (H5). This relationship was confirmed by a direct and positive effect with a 99% confidence level (β = 0.282, p < 0.01). After the affective commitment, the competence variable exhibited the highest impact on job performance (H4). This relationship was confirmed to be a positive direct effect with a 95% confidence level (β = 0.281, p < 0.05). The impact of competence on affective commitment (H5-4) was confirmed at a 95% confidence level (β = 0.189, p < 0.05).
The effect of autonomy on job performance (H1) (β = −0.095, p > 0.1), the effect of autonomy on competence (H4-1) (β = 0.089, p > 0.1), as well as the effect of autonomy on affective commitment (H5-1) (β = 0.107, p > 0.1) were not confirmed at the 90% safety level. The effect of feedback on job performance (H2) (β = −0.001, p > 0.1) was not significant at the 90% confidence level. While the effect of feedback on competence (H4-2) with a 90% confidence level (β = 0.121, p < 0.1), as well as the effect of feedback on affective commitment (H5-2) with a 99% confidence level (β = 0.206, p < 0.01), was confirmed. The effect of task identity on job performance (H3) (β = 0.207, p < 0.01), as well as the effect of task identity on competence (H4-3) (β = 0.212, p < 0.01), was significant at a 99% confidence level while, the effect of the function identity on affective commitment (H5-3) was not confirmed at a 90% confidence level (β = 0.001, p > 0.1). The coefficient of determination (indicator) is greater than 0.2 in the research related to success factors, expressing substantial predictive accuracy [99,109]. In the present study, this indicator for the job performance variable was equal to 0.274, which means a substantial prediction accuracy of the model for the mentioned variable. The index for competence and affective commitment variables was equal to 0.094 and 0.118, respectively [99,109].
The research model with the path coefficients, the significance level of them, and the index of the variables are presented in Figure 2 [69].
The f2 index indicates the substantive effect of a variable when it is removed from the model [107,109]. The evaluation of this indicator is performed by Cohen’s criterion (1988). According to this criterion, the values of 0.02, 0.15, and 0.35 are small, medium, and large effect sizes, respectively [114]. The affective commitment had the greatest effect size on job performance (small-to-medium, f2 = 0.097). The effect size of competence on job performance (small-to-small, f2 = 0.095) was smaller than affective commitment, while these were close to each other. The effect size of task identity on job performance was equal to 0.049 (small-to-medium, f2 = 0.049).
The structural model quality was measured by the Cross-Validated Redundancy (CV-Red) test and the results are presented with the Q2 index [111,112]. The values of the Q2 index were larger than zero for all endogenous variables (Affective Commitment = 0.090; Competence = 0.064; Job performance = 0.182); therefore, the quality and strength of the structural model were confirmed [103,106,107,113]. The SRMR index in this study is equal to 0.052 and is smaller than the critical limit. Therefore, this index confirms the overall fit of the model [110,115,116]. The GoF index is equal to 0.366 in the present study, so the fitting of the research model is strong [104,117,118].

3.3. Mediator Analysis

The effect of mediation variables and affective commitment in the hypotheses of the present study was investigated by the Sobel test [119,120,121,122]. The test allows for assumptions that the relationship between the independent variable and mediator as well as the relationship between the mediator variable and the dependent variable are both meaningful. In this test, if z-value is more than 1.96, the mediation effect is confirmed [122,123]. This test is appropriate to examine the effect of mediation by a sample volume of more than 50 [122]. The impact of mediation affective commitment on the relationship between feedback and job performance (z-value = 2.180) as well as the relationship between competence and job performance (z-value = 2.169) has been confirmed by the Sobel test [122,123].

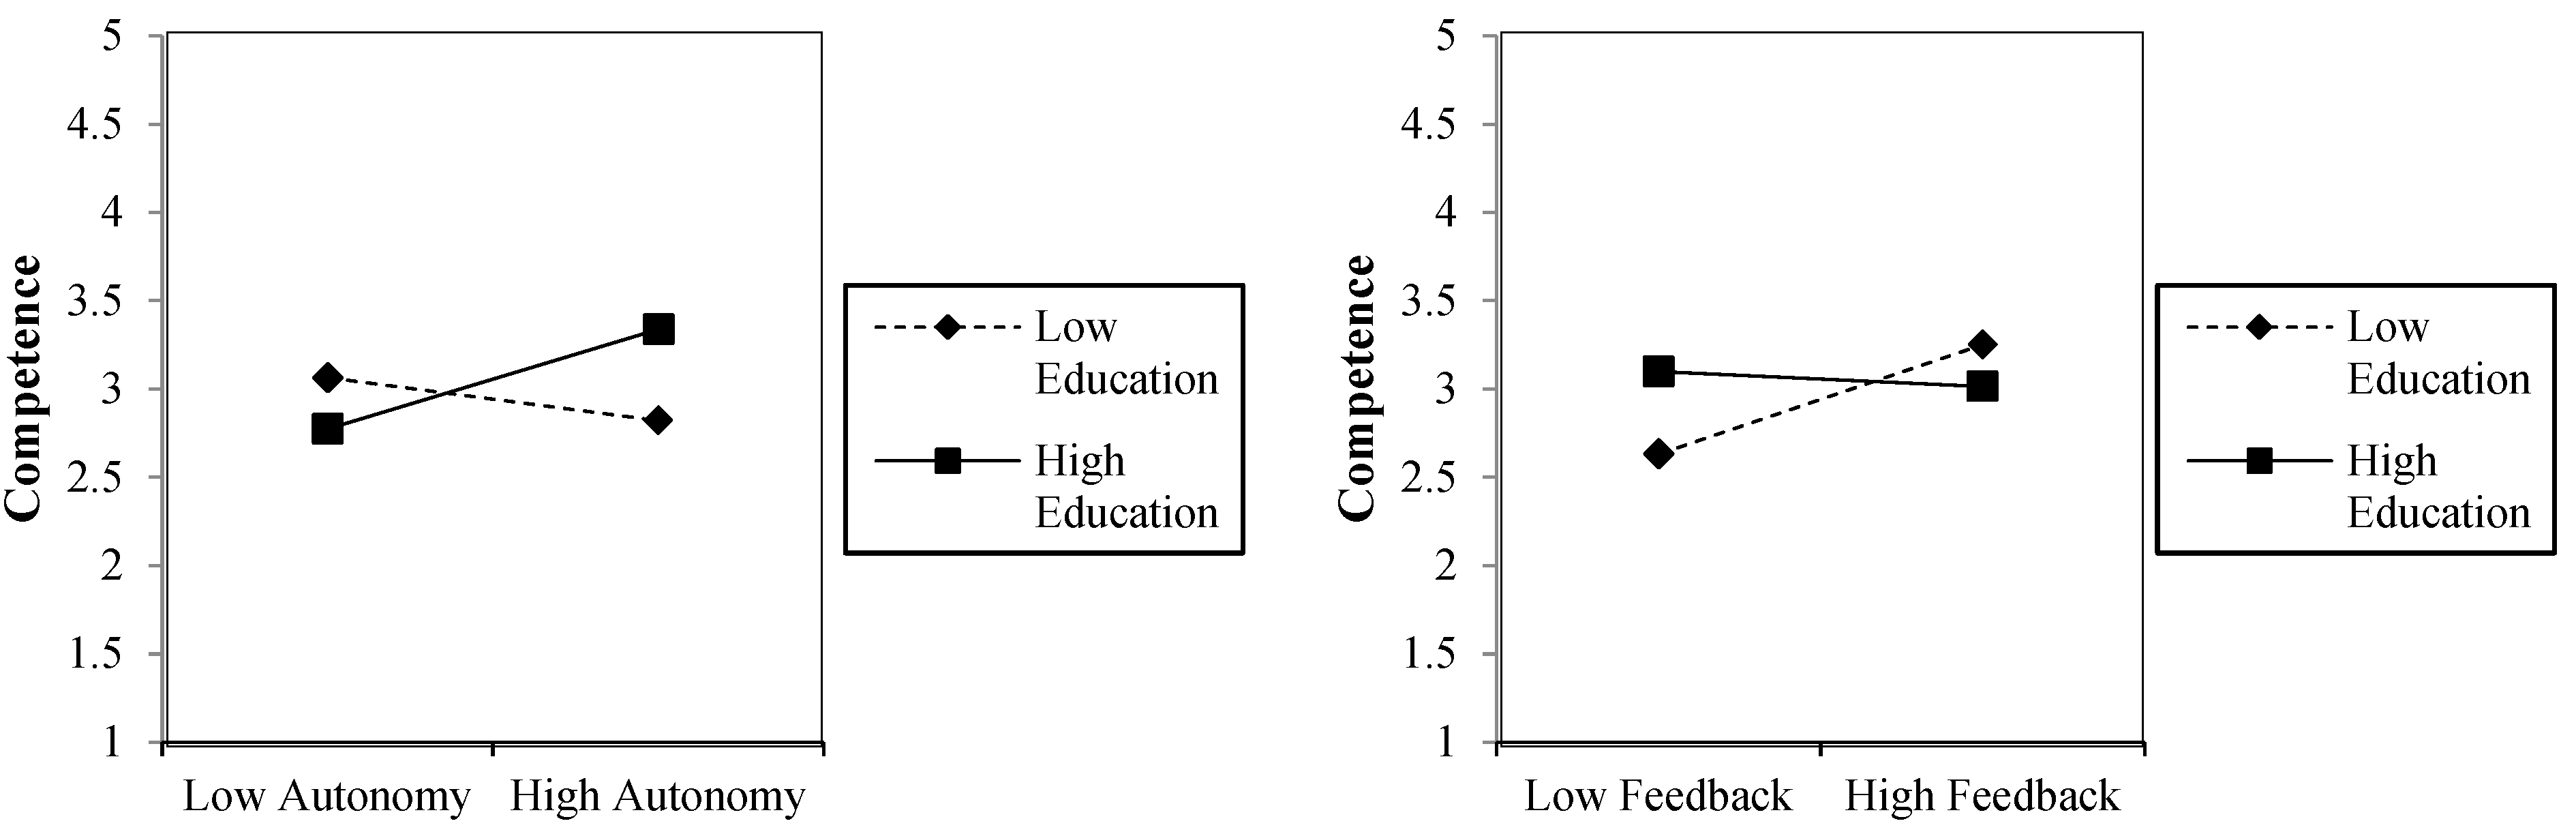
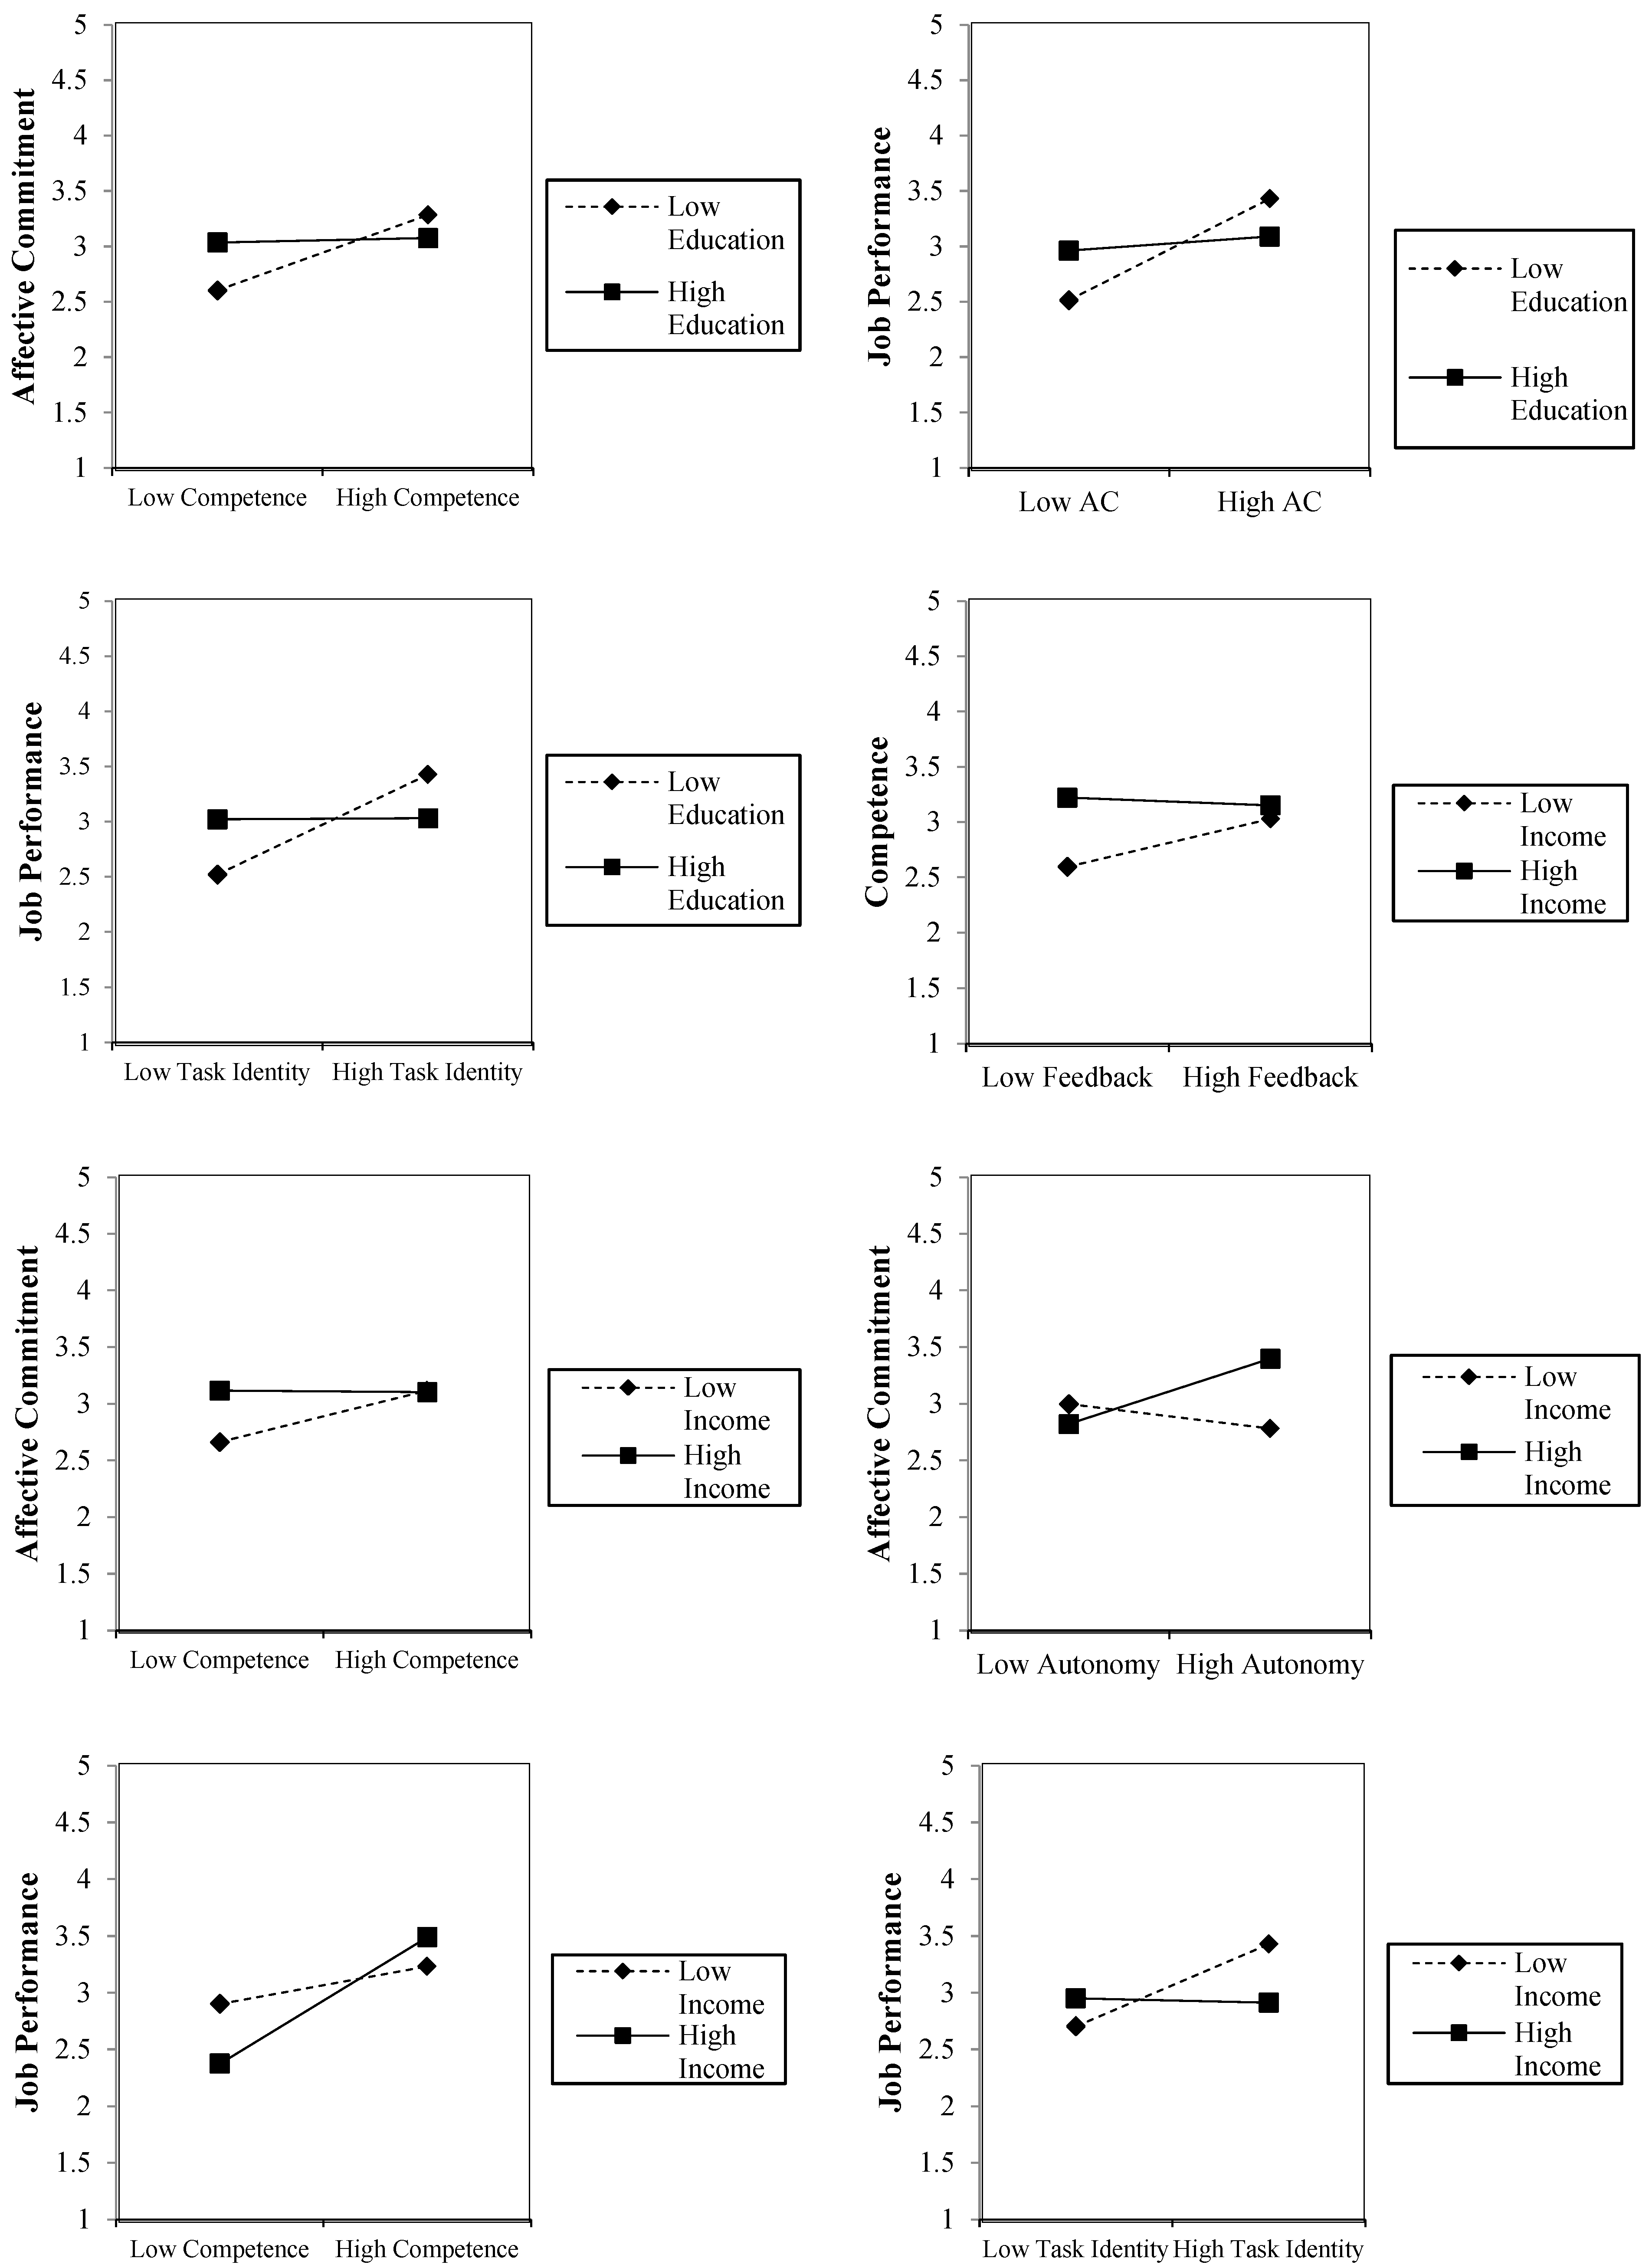
3.4. The Results of the Moderator Analysis

The present study investigated the moderating effect of demographic variables on the level of education and income by using the product Indicator method on all assumptions in the model [124,125]. According to Ifinedo (2016), having some information about the effects of demographic variables causes a deeper understanding of the overall topic [126]. Only those hypotheses that ultimately confirmed the moderator effect were presented in Table 5. The moderator effect of education level on the relationship between autonomy and competence and the relationship between feedback and competence was confirmed. In addition, the moderating effect of education level on the relationship between competence and affective commitment as well as affective commitment and job performance was confirmed. The level of education on job performance and task identity had a moderating effect. The moderator effect of income on the relationship between feedback and competence, as well as the relationship between competence and affective commitment, was confirmed. Furthermore, the moderating effect of income on the relationship between autonomy and affective commitment as well as job performance and Competence was confirmed. The task identity on job performance had a moderating effect.

4. Discussion

The present research model has been proposed by incorporating the models of some previous studies and examining by structural questions the factors affecting the job performance of supervising engineers in construction projects with a quantitative approach. The results of this study illustrated a meaningful and positive effect of competence and affective commitment on job performance. These results are consistent with the findings of many studies [47,48,54,62,70,76]. According to the results, the supervising engineers who have a higher affective commitment present more favorable results in their jobs. Furthermore, the more successful structural supervising engineers are in acquiring the skills required for their careers, the better their job performance. Although the impact of affective commitment on job performance was greater than the impact of competence on job performance, they were close to each other.
The results indicate the significant effect of task identity on job performance. The result is consistent with the results of some previous studies, such as Onukwube and Iyagba (2011), and with the results of some studies such as Johari et al. (2019) [13,14]. According to research findings, a supervising engineer who is allowed to perform the entire monitoring system individually and fully has better job performance. This can be interpreted as an observer individually responsible for the monitoring, and the activity associated with it, being able to identify their strengths and weaknesses, as well as identifying the defects of their work, and they can plan better to improve their career performance.

4.1. The Mediation Effect of Affective Commitment

The results of the mediated analysis in the present study indicate the effect of affective commitment on the relationship between feedback and job performance. As can be seen in the results Section (Table 4), the relationship between feedback and job performance was not significant, while this relationship was meaningful in the absence of an affective commitment variable and its mediation role in the research model. In other words, obtaining feedback from work leads to an increase in the sense of interest and commitment of the supervising engineers, which has been effective in enhancing and improving their job performance.
Other results observed in the mediator analysis have been confirmed by the mediating effect of affective commitment on the relationship between competence and job performance. The development of the capabilities and competencies of the supervising engineers has made them feel more interested in their profession, which may contribute to enhancing and improving their job performance. In other words, some part of the effects of the development of supervising engineers on improving their job performance has been transferred through increasing their affective commitment.

4.2. The Moderator Effect of Education and Income

The present study examined the moderator effect of demographic variables on the level of education and income, and finally, 10 of the assumptions of the moderator effect were found to be meaningful. All of these are discussed using the Dawson graph [127,128]. According to the results of the moderator analysis, the level of autonomy of supervising engineers with lower education levels had a negative effect on their competence. At the same time, the effect of increased autonomy on the growth of competence of supervising engineers with higher education levels was positive (Figure 3). The engineers may have enhanced their competencies with a higher education level, using the right of authority and learning from experience, At the same time, the supervising engineers with a lower education level failed to exercise their authority, which may have been because of a lack of deep academic knowledge in their careers. These individuals may not be able to distinguish the results from new measures that have been made because more authority may have led to a degradation in their qualifications.
According to the results obtained from the moderator analysis, the increase in feedback has a positive effect on the growth rate of supervising engineers with a lower education level. Meanwhile, the effect of increasing feedback on the competence of supervising engineers with higher education levels has been negative (Figure 3). According to the research findings, the higher the amount of feedback received from work, the higher education supervising engineers were more likely to improve their skills and abilities. In other words, the engineers with lower education levels needed more information and feedback so that they could perform better functions. At the same time, the feedback received by experienced engineers with higher education levels tends to lead them to keep their distance from creative ideas. Further studies in this field are suitable for a better understanding of the obtained results.
According to the results of the moderator analysis (Figure 3), increasing the qualifications of supervising engineers with lower education levels increased the level of commitment and increased their affective commitment to improving their job performance. In other words, when the supervising engineers do not have a high level of education, the development of their skills and abilities will strengthen their interest in the profession, and their job performance is enhanced by strengthening their sense of interest in the supervision profession. At the same time, the growth of the qualifications of the supervising engineers with higher education levels has not changed the extent of their affective commitment. The effect of increased commitment rate on the job performance of these individuals was insignificant compared to supervising engineers with low education. It indicates that the supervising engineers with higher education levels have been committed to the profession by spending time and academic knowledge in the field of supervision, and the growth of their qualifications in these people has no role in their sense of interest in the profession.
The results of the moderator analysis indicate that increasing the task identity in supervising engineers’ work with lower education levels increased their job performance. At the same time, increasing the task identity level in the supervising engineers’ jobs with higher education levels has not changed their job performance (Figure 3). The result illustrated that engineers with lower education levels would prefer to be independent in their jobs and be less associated with other people. At the same time, the job performance of supervising engineers with higher education levels is identical with respect to their greater competence in teamwork, in both individual work and teamwork.
According to the moderator analysis of the results (Figure 3), increasing the amount of feedback on work for engineers with low income has led to the growth of their competencies, and their competence has increased their affective commitment. This result can be interpreted as low-income supervising engineers are more likely to pay special attention to the results of their work to gain more expertise, competencies, and consequent revenue. Moreover, acquiring these skills and competencies may increase their interest and enthusiasm for their profession and organization and strengthen their commitment. In other words, an attachment and sense of belonging to the supervision profession in low-income supervisors are more influenced by their skills, and financial factors have less role in their commitment.
The results obtained from Figure 3 indicate that the amount of feedback on experienced engineers with higher incomes resulted in a slight decrease in their qualifications. The growth of their qualifications reduced the level of their affective commitment. These results suggest that awareness and understanding of skills and competencies are damaged by receiving data from the results of their work. The attachment and sense of belonging to the field of supervision of supervising engineers with higher incomes are more affected by financial factors, and the qualifications of these people have a lower role in their commitment.
The results of the moderator analysis demonstrate that increasing autonomy in the job of low-income supervising engineers has weakened their affective commitment. At the same time, an increase in autonomy in the job of supervising engineers with higher incomes has strengthened their affective commitment (Figure 3). Perhaps giving supervising engineers work authority, when they have more earnings and fewer financial concerns, has led them to feel more responsible and more committed.
As mentioned in Figure 3, the growth of the competencies of the supervising engineer has led to the promotion of their job performance. At the same time, the development rate of the high-income supervising engineers was higher than the less-paid supervising engineers. This result reveals that the reduction in financial worries of supervising engineers may increase the skills and abilities that they gain in the field of supervision.
The moderating analysis shows that increasing task identity improves job performance for less-paid supervising engineers. However, for higher-income supervising engineers, enhancing task identity slightly reduces their job performance. Supervising engineers with lower income value the non-material aspects of their job, and improvements in task identity positively affect their job performance and job characteristics (Figure 3).

4.3. Scientific and Practical Benefits of the Research

The purpose of this study was to investigate the moderating effect of demographic variables on the level of education and income on the relationships between job performance engineers and the factors affecting it. In this study, the role of competence mediation and affective commitment in research hypotheses was evaluated by Sobel. Despite numerous results in previous studies, a quantitative approach based on a structural equation was found to investigate the moderator role of education and income on the job performance of supervisors. Previous studies, often in other countries or other industries, have examined the effect of income and education on job performance or have made qualitative approaches. The reliability and productivity of the model of this research were confirmed by indicators related to validity and reliability as well as model fitting. Therefore, this model can be used in future research in other societies and industries. Furthermore, this study, by identifying the moderating effects of two variables income and education level, has more potential for further research in the field of Sociology in the construction industry.
As discussed in earlier Sections, safety, quality, time management, and cost in the construction industry are particularly influenced by the supervisory system and supervising engineers [3,129]. Moreover, the performance of the monitoring system and supervising engineers as its core has a great impact on achieving sustainable development goals, including environmental protection, community, and economic growth [130,131]. Therefore, investigating the factors affecting the job performance of supervising engineers can be beneficial for both activists and the construction industry stakeholders.
The results of the mediator indicate that affective commitment not only has the highest direct effect on the job performance of the individual engineers but also transfers part of the effects of competence and feedback to job performance, emphasizing the importance of affective commitment in predicting the job performance of supervising engineers. According to the results of the mediator, the skills and competencies of the supervising engineers in the field of monitoring increase the degree of responsibility and commitment that can affect their job performance. Therefore, the active authorities in the construction industry should pay special attention to the strengthening of the competencies and the affective commitment of the supervising engineers.
The results of the moderator analysis indicate that supervising engineers with a lower education level are highly influenced by organization policies and behaviors. According to the findings, some of the policies and behaviors of the organization such as the amount of authority granted to supervising engineers with lower education levels and the feedback given to them can create a chain of effects that affect their job performance. According to the findings, the reduction in authority of supervising engineers with a lower education level can contribute to the development of their competence. Enhancement of competence of these people increases their affective commitment rate, which ultimately improves the performance of these engineers.
The study indicates that providing more feedback to supervising engineers with lower education levels boosts their qualifications and affective commitment, thereby improving their job performance. Similarly, for experienced engineers with lower incomes, increased feedback enhances their competence, leading to better performance. Consequently, organizations in the construction industry can foster a positive cycle of improvements in job performance for supervising engineers with lower education levels and salaries (Figure 4).
The moderator analysis reveals that organizational policies and behaviors do not significantly affect supervising engineers with higher education levels. Factors like task identity, competence, and affective commitment also have no notable impact on this group. These engineers seek more power and self-actualization, making them more flexible in their work.
Conversely, the job performance of supervising engineers with lower education levels and incomes improves with increased task identity. Thus, construction industry authorities should involve these engineers less in the work process while using high-income and highly educated engineers for teamwork monitoring.
The study underscores the crucial roles of academic education and payment policies in enhancing the job performance of supervising engineers in the construction industry.

4.4. Research Limitations and Future Study Opportunities

Despite its valuable findings, this research has limitations. Conducted in Iran, results may vary in other countries. It is recommended that future studies use this model internationally for broader insights. Researchers are encouraged to apply this model to different workgroups and consider combining it with other models or adding related variables for a more comprehensive approach. Conducting quantitative studies with different methods or larger sample sizes could also yield better results.

5. Conclusions

The purpose of this study was to investigate the moderating effect of demographic variables on the level of education and income on the relationships between job performance engineers and its effective factors. This research is quantitative, using structural equation modeling with the PLS approach. The results indicate that the affective commitment variable has the greatest impact on the job performance of the building supervising engineers. Moreover, the variable of competence has a meaningful effect on the job performance of supervising engineers. Among other variables studied in the research model, the direct effect of task identity on the job performance of the supervisor was meaningful. The reliability of the results was confirmed by the validity, reliability, and fitting index of the model.
The mediating effect of affective commitment on the relationship between feedback and job performance as well as the relationship between competence and job performance was meaningful. According to the results of the moderator analysis, demographic variables of education and income levels, on the relationship between feedback and competence, as well as the relationship between job identity and job performance, had a significant moderating role. In addition, the moderating effect of demographic variables on the relationship between autonomy and competence, as well as the relationship between affective commitment and job performance, was confirmed.
The moderating effect of the income demographic variable on the relationship between autonomy and affective commitment as well as the relationship between competence and job performance was meaningful.

Author Contributions

Conceptualization, A.K., A.K.-G., B.K., Z.A.A. and A.B. methodology, A.K., A.K.-G., B.K., Z.A.A. and A.B.; software, A.K. and A.B.; validation, A.K. and A.B.; formal analysis, A.K. and A.B.; investigation, A.K. and A.B.; resources, A.K. and A.B.; data curation A.K. and A.B.; writing—review and editing, A.K., A.K.-G., B.K. and A.B.; visualization, A.K. and A.B.; supervision, A.K.; project administration, A.K. All authors have read and agreed to the published version of the manuscript.

Funding

There is no financial support in the present study.

Institutional Review Board Statement

The present study is organized by the Ethics Committee of the Kharazmi University, with an ethics identifier. 1400.023 IR.KHU.REC has been confirmed.

Informed Consent Statement

The respondents were told that their cooperation in the study would be voluntary and if they agreed to cooperate, their responses to the form of the questionnaire will be used only in academic research. Their responses will remain confidential.

Data Availability Statement

The original contributions presented in the study are included in the article, further inquiries can be directed to the corresponding author.

Conflicts of Interest

The authors declare that there are no conflicts of interest.

References

  1. Rekola, M.; Mäkeläinen, T.; Häkkinen, T. The role of design management in the sustainable building process. Arch. Eng. Des. Manag. 2012, 8, 78–89. [Google Scholar] [CrossRef]
  2. Fallah Tafti, E.; Mosalman Yazdi, H.; Javaheri, M. Investigating and evaluating the performance of supervising engineers and prioritizing the factors affecting it. In Proceedings of the 3rd National Conference on Construction Materials and New Technologies in the Construction Industry, Meybod, Iran, 18 February 2016. (In Persian). [Google Scholar]
  3. Shahraki, S.; Saghatforoush, E.; Ravasan, A.Z. Identification and Classification of Factors Affecting the Performance of Building Supervisor Engineers for Construction Industry. J. Eng. Proj. Prod. Manag. 2018, 8, 65–74. [Google Scholar] [CrossRef]
  4. Gupta, V.; Kansal, R. Improvement of construction labor productivity in Chambal Region. Int. J. Res. Eng. Technol. 2014, 3, 34–37. [Google Scholar] [CrossRef]
  5. FIDIC|Quality of Construction|International Federation of Consulting Engineers. Available online: https://www.fidic.org/node/751 (accessed on 3 August 2021).
  6. Spilsbury, M.J.; Brann, J.; Norgbey, S. Quality of Project Supervision Review 2009; Summary Report; Evaluation Office, Quality Assurance Section, UNEP: Nairobi, Kenya, 2010; Available online: https://wedocs.unep.org/xmlui/bitstream/handle/20.500.11822/268/Review_of_the_UNEP_Quality_of_Project_Supervision.pdf?sequence=1&isAllowed=y (accessed on 18 January 2022).
  7. Liu, F. Analysis of supervision engineers’ quality. Shanxi Constr. 2004, 30, 86–87. [Google Scholar]
  8. Hardison, D.; Behm, M.; Hallowell, M.R.; Fonooni, H. Identifying construction supervisor competencies for effective site safety. Saf. Sci. 2014, 65, 45–53. [Google Scholar] [CrossRef]
  9. TCEO. TCEO|Complaints About the Low Wages of Engineering Services; What Happened to the 1400 Tariff?|Tehran Construction Engineering Organization. 2021. Available online: https://www.tceo.ir (accessed on 6 January 2022). (In Persian).
  10. Hackman, J.R.; Oldham, G.R. Development of the job diagnostic survey. J. Appl. Psychol. 1975, 60, 159–170. [Google Scholar] [CrossRef]
  11. Hsu, L.; Liao, P. From job characteristics to job satisfaction of foreign workers in Taiwan’s construction industry: The mediating role of organizational commitment. Hum. Factors Ergon. Manuf. 2016, 26, 243–255. [Google Scholar] [CrossRef]
  12. Said, N.A.; Munap, R. Job characteristics and job satisfaction: A relationship study on supervisors performance. In Proceedings of the 2010 IEEE International Conference on Management of Innovation & Technology, Singapore, 2–5 June 2010; pp. 714–719. [Google Scholar]
  13. Johari, J.; Shamsudin, F.M.; Yean, T.F.; Yahya, K.K.; Adnan, Z. Job characteristics, employee well-being, and job performance of public sector employees in Malaysia. Int. J. Public Sect. Manag. 2019, 32, 102–119. [Google Scholar] [CrossRef]
  14. Onukwube, H.N.; Iyagba, R. Construction professionals job performance and characteristics: A comparison of indigenous and expatriate construction companies in Nigeria. Constr. Econ. Build. 2011, 11, 71–83. [Google Scholar] [CrossRef]
  15. Lazear, E.P. Agency, earnings profiles, productivity, and hours restrictions. Am. Econ. Rev. 1981, 71, 606–620. [Google Scholar]
  16. Howard, A. College experiences and managerial performance. J. Appl. Psychol. 1986, 71, 530–552. [Google Scholar] [CrossRef]
  17. Cappelli, P. A market-driven approach to retaining talent. Harv. Bus. Rev. 2000, 78, 103. [Google Scholar]
  18. Ng, T.W.H.; Feldman, D.C. How broadly does education contribute to job performance? Pers. Psychol. 2009, 62, 89–134. [Google Scholar] [CrossRef]
  19. Spence, M. Market Signalling: Information Transfer in Hiring and Related Processes; Harvard University Press: Cambridge, MA, USA, 1973. [Google Scholar]
  20. Riley, J.G. Weak and Strong Signals. Scand. J. Econ. 2002, 104, 213–236. [Google Scholar] [CrossRef]
  21. Van Der Sluis, J.; Van Praag, M.; Vijverberg, W. Education and entrepreneurship selection and performance: A review of the empirical literature. J. Econ. Surv. 2008, 22, 795–841. [Google Scholar] [CrossRef]
  22. Weick, K.E. Drop your tools: An allegory for organizational studies. Adm. Sci. Q. 1996, 41, 301. [Google Scholar] [CrossRef]
  23. Boon, L.K.; Fern, Y.S.; Sze, C.C.; Yean, O.K. Factors affecting individual job performance. In Proceedings of the International Conference on Management, Economics and Finance, Kuching, Malaysia, 15–16 October 2012. [Google Scholar]
  24. Chang, E.; Hahn, J. Does pay-for-performance enhance perceived distributive justice for collectivistic employees? Pers. Rev. 2006, 35, 397–412. [Google Scholar] [CrossRef]
  25. Mujtaba, B.G.; Shuaib, S. An equitable total rewards approach to pay for performance management. J. Manag. Policy Pract. 2010, 11, 11–121. [Google Scholar]
  26. Valaei, N.; Jiroudi, S. Job satisfaction and job performance in the media industry: A synergistic application of partial least squares path modelling. Asia Pac. J. Mark. Logist. 2016, 28, 984–1014. [Google Scholar] [CrossRef]
  27. Schmidt, F.L.; Hunter, J.E. Development of a causal model of processes determining job performance. Curr. Dir. Psychol. Sci. 1992, 1, 89–92. [Google Scholar] [CrossRef]
  28. Bono, J.E.; Judge, T.A. Core self-evaluations: A review of the trait and its role in job satisfaction and job performance. Eur. J. Pers. 2003, 17, S5–S18. [Google Scholar] [CrossRef]
  29. Katebi, A.; Homami, P.; Najmeddin, M. Acceptance model of precast concrete components in building construction based on Technology Acceptance Model (TAM) and Technology, Organization, and Environment (TOE) framework. J. Build. Eng. 2021, 45, 103518. [Google Scholar] [CrossRef]
  30. Judge, T.A.; Erez, A.; Bono, J.E. The power of being positive: The relation between positive self-concept and job performance. Hum. Perform. 1998, 11, 167–187. [Google Scholar] [PubMed]
  31. Folan, P.; Browne, J. A review of performance measurement: Towards performance management. Comput. Ind. 2005, 56, 663–680. [Google Scholar] [CrossRef]
  32. Sony, M.; Mekoth, N. The relationship between emotional intelligence, frontline employee adaptability, job satisfaction and job performance. J. Retail. Consum. Serv. 2016, 30, 20–32. [Google Scholar] [CrossRef]
  33. Motowidlo, S.J.; Kell, H.J. Chapter 5 job performance. In Handbook of Psychology; Wiley: Hoboken, NJ, USA, 2012; pp. 91–131. [Google Scholar]
  34. Krima, N.A.; Wood, G.; Aouad, G.F.; Hatush, Z. Assessing the performance of Libyan supervising engineers. Constr. Manag. Econ. 2007, 25, 509–518. [Google Scholar] [CrossRef]
  35. Oldham, G.R. Job characteristics and internal motivation: The moderating effect of interpersonal and individual variables. Hum. Relat. 1976, 29, 559–569. [Google Scholar] [CrossRef]
  36. Hackman, J.R.; Lawler, E.E. Employee reactions to job characteristics. J. Appl. Psychol. 1971, 55, 259–286. [Google Scholar] [CrossRef]
  37. Bontis, N.; Richards, D.; Serenko, A. Improving service delivery: Investigating the role of information sharing, job characteristics, and employee satisfaction. Learn. Organ. 2011, 18, 239–250. [Google Scholar] [CrossRef]
  38. Krasman, J. Putting feedback-seeking into “context”: Job characteristics and feedback-seeking behaviour. Pers. Rev. 2013, 42, 50–66. [Google Scholar] [CrossRef]
  39. Hassan, S. Sources of professional employees’ job involvement: An empirical assessment in a government agency. Rev. Public Pers. Adm. 2014, 34, 356–378. [Google Scholar] [CrossRef]
  40. Cui, N.; Xiao, S.F. How Much does Job Autonomy Matter for Job Performance of Chinese Supervising Engineers: A Quantitative Study. East Asian J. Bus. Econ. 2021, 9, 71–82. [Google Scholar]
  41. Bacha, E. The relationship between transformational leadership, task performance and job characteristics. J. Manag. Dev. 2014, 33, 410–420. [Google Scholar] [CrossRef]
  42. Ghosh, P.; Rai, A.; Chauhan, R.; Gupta, N.; Singh, A. Exploring the moderating role of context satisfaction between job characteristics and turnover intention of employees of Indian public sector banks. J. Manag. Dev. 2015, 34, 1019–1030. [Google Scholar] [CrossRef]
  43. Faturochman, M.A. The job characteristics theory: A review. Bul. Psikol. 1997, 5, 1–13. [Google Scholar] [CrossRef]
  44. A Uruthirapathy, A.; Grant, G.G. The influence of job characteristics on IT and non-IT job professional’s turnover intentions. J. Manag. Dev. 2015, 34, 715–728. [Google Scholar] [CrossRef]
  45. Alsop, A. Perspectives on competence. Br. J. Ther. Rehabil. 2001, 8, 258–264. [Google Scholar] [CrossRef]
  46. Hager, P.; Gonczi, A. Professions and competencies. In Boundaries adult Learn; Routledge: London, UK, 1996; pp. 246–260. [Google Scholar]
  47. Eraut, M. Concepts of competence. J. Interprofess. Care 1998, 12, 127–139. [Google Scholar] [CrossRef]
  48. Gonczi, A.; Hager, P.; Athanasou, J. The Development of Competency-Based Assessment Strategies for the Professions; AGPS: Canberra, Australia, 1993; Available online: http://hdl.voced.edu.au/10707/104071 (accessed on 5 March 2022).
  49. Messick, S. The psychology of educational measurement. ETS Res. Rep. Ser. 1984, 1, i-55. [Google Scholar]
  50. Sekaran, U.; Wagner, F.R. Sense of competence: A cross-cultural analysis for managerial application. Group Organ. Stud. 1980, 5, 340–352. [Google Scholar] [CrossRef]
  51. Meyer, J.P.; Allen, N.J. A three-component conceptualization of organizational commitment. Hum. Resour. Manag. Rev. 1991, 1, 61–89. [Google Scholar] [CrossRef]
  52. Qian, S.; Yuan, Q.; Niu, W.; Liu, Z. Is job insecurity always bad? The moderating role of job embeddedness in the relationship between job insecurity and job performance. J. Manag. Organ. 2019, 28, 956–972. [Google Scholar] [CrossRef]
  53. Allen, N.J.; Meyer, J.P. Construct validation in organizational behavior research: The case of organizational commitment. In Problems and Solutions in Human Assessment; Springer: Berlin/Heidelberg, Germany, 2000; pp. 285–314. [Google Scholar]
  54. Ribeiro, N.; Gomes, D.; Kurian, S. Authentic leadership and performance: The mediating role of employees’ affective commitment. Soc. Responsib. J. 2018, 14, 213–225. [Google Scholar] [CrossRef]
  55. Settoon, R.P.; Bennett, N.; Liden, R.C. Social exchange in organizations: Perceived organizational support, leader–member exchange, and employee reciprocity. J. Appl. Psychol. 1996, 81, 219–227. [Google Scholar] [CrossRef]
  56. Vandenberghe, C.; Bentein, K.; Stinglhamber, F. Affective commitment to the organization, supervisor, and work group: Antecedents and outcomes. J. Vocat. Behav. 2004, 64, 47–71. [Google Scholar] [CrossRef]
  57. Hackman, J.R. Group Influences on Individuals in Organizations; Consulting Psychologists Press: Palo Alto, CA, USA, 1992. [Google Scholar]
  58. Heffner, T.S.; Rentsch, J.R. Organizational commitment and social interaction: A multiple constituencies approach. J. Vocat. Behav. 2001, 59, 471–490. [Google Scholar] [CrossRef]
  59. Riketta, M. Attitudinal organizational commitment and job performance: A meta-analysis. J. Organ. Behav. 2002, 23, 257–266. [Google Scholar] [CrossRef]
  60. Meyer, J.P.; Stanley, D.J.; Herscovitch, L.; Topolnytsky, L. Affective, continuance, and normative commitment to the organization: A meta-analysis of antecedents, correlates, and consequences. J. Vocat. Behav. 2002, 61, 20–52. [Google Scholar] [CrossRef]
  61. Vandenberghe, C.; Bentein, K.; Panaccio, A. Affective commitment to organizations and supervisors and turnover: A role theory perspective. J. Manag. 2017, 43, 2090–2117. [Google Scholar] [CrossRef]
  62. Meyer, J.P.; Herscovitch, L. Commitment in the workplace: Toward a general model. Hum. Resour. Manag. Rev. 2001, 11, 299–326. [Google Scholar] [CrossRef]
  63. Cooper-Hakim, A.; Viswesvaran, C. The construct of work commitment: Testing an integrative framework. Psychol. Bull. 2005, 131, 241–259. [Google Scholar] [CrossRef]
  64. Hobfoll, S.E. Social and psychological resources and adaptation. Rev. Gen. Psychol. 2002, 6, 307–324. [Google Scholar] [CrossRef]
  65. Schmidt, K.-H. Organizational commitment: A further moderator in the relationship between work stress and strain? Int. J. Stress Manag. 2007, 14, 26–40. [Google Scholar] [CrossRef]
  66. Lapointe, É.; Vandenberghe, C.; Panaccio, A. Organizational commitment, organization-based self-esteem, emotional exhaustion and turnover: A conservation of resources perspective. Hum. Relat. 2011, 64, 1609–1631. [Google Scholar] [CrossRef]
  67. Lapointe, É.; Vandenberghe, C.; Boudrias, J.-S. Psychological contract breach, affective commitment to organization and supervisor, and newcomer adjustment: A three-wave moderated mediation model. J. Vocat. Behav. 2013, 83, 528–538. [Google Scholar] [CrossRef]
  68. Organ, D.W.; Ryan, K. A meta-analytic review of attitudinal and dispositional redictors of organizational citizenship behavior. Pers. Psychol. 1995, 48, 775–802. [Google Scholar] [CrossRef]
  69. Binnewies, C.; Ohly, S.; Niessen, C. Age and creativity at work: The interplay between job resources, age and idea creativity. J. Manag. Psychol. 2008, 23, 438–457. [Google Scholar] [CrossRef]
  70. Ribeiro, N.; Duarte, A.P.; Filipe, R.; de Oliveira, R.T. How authentic leadership promotes individual creativity: The mediating role of affective commitment. J. Leadersh. Organ. Stud. 2020, 27, 189–202. [Google Scholar] [CrossRef]
  71. Randall, D.M. The consequences of organizational commitment: Methodological investigation. J. Organ. Behav. 1990, 11, 361–378. [Google Scholar] [CrossRef]
  72. Mathieu, J.E.; Zajac, D.M. A review and meta-analysis of the antecedents, correlates, and consequences of organizational commitment. Psychol. Bull. 1990, 108, 171–194. [Google Scholar] [CrossRef]
  73. Cohen, A. Career stage as a moderator of the relationships between organizational commitment and its outcomes: A meta-analysis. J. Occup. Psychol. 1991, 64, 253–268. [Google Scholar] [CrossRef]
  74. Rashid, Z.A.; Sambasivan, M.; Johari, J. The influence of corporate culture and organisational commitment on performance. J. Manag. Dev. 2003, 22, 708–728. [Google Scholar] [CrossRef]
  75. Samad, S.; Selangor, S.A. Unraveling the organizational commitment and job performance relationship: Exploring the moderating effect of job satisfaction. Bus. Rev. 2005, 4, 79–84. [Google Scholar]
  76. Chen, J.; Silverthorne, C.; Hung, J. Organization communication, job stress, organizational commitment, and job performance of accounting professionals in Taiwan and America. Leadersh. Organ. Dev. J. 2006, 27, 242–249. [Google Scholar] [CrossRef]
  77. Yousef, D.A. Organizational commitment: A mediator of the relationships of leadership behavior with job satisfaction and performance in a non-western country. J. Manag. Psychol. 2000, 15, 6–24. [Google Scholar] [CrossRef]
  78. Trivellas, P. Work motivation and job performance of frontline employees: The mediating role of organizational commitment. In Proceedings of the 2011 IEEE International Conference on Industrial Engineering and Engineering Management (IEEM), Singapore, 6–9 December 2011; pp. 1878–1882. [Google Scholar]
  79. Ribeiro, N.; Yücel, İ.; Gomes, D. How transformational leadership predicts employees’ affective commitment and performance. Int. J. Prod. Perform. Manag. 2018, 67, 1901–1917. [Google Scholar] [CrossRef]
  80. Ugboro, I.O. Organizational commitment, job redesign, employee empowerment and intent to quit among survivors of restructuring and downsizing. J. Behav. Appl. Manag. 2006, 7, 232–257. [Google Scholar] [CrossRef]
  81. Humphrey, S.E.; Nahrgang, J.D.; Morgeson, F.P. Integrating motivational, social, and contextual work design features: A meta-analytic summary and theoretical extension of the work design literature. J. Appl. Psychol. 2007, 92, 1332–1356. [Google Scholar] [CrossRef]
  82. Zargar, M.S.; Vandenberghe, C.; Marchand, C.; Ben Ayed, A.K. Job scope, affective commitment, and turnover: The moderating role of growth need strength. J. Occup. Organ. Psychol. 2014, 87, 280–302. [Google Scholar] [CrossRef]
  83. Nikou, S. Factors driving the adoption of smart home technology: An empirical assessment. Telemat. Inform. 2019, 45, 101283. [Google Scholar] [CrossRef]
  84. Katebi, A.; HajiZadeh, M.H.; Bordbar, A.; Salehi, A.M. The Relationship Between “Job Satisfaction” and “Job Performance”: A Meta-analysis. Glob. J. Flex. Syst. Manag. 2021, 23, 21–42. [Google Scholar] [CrossRef]
  85. Almanasreh, E.; Moles, R.; Chen, T.F. Evaluation of methods used for estimating content validity. Res. Soc. Adm. Pharm. 2019, 15, 214–221. [Google Scholar] [CrossRef] [PubMed]
  86. Ifinedo, P. An empirical analysis of factors influencing Internet/e-business technologies adoption by SMEs in Canada. Int. J. Inf. Technol. Decis. Mak. 2011, 10, 731–766. [Google Scholar] [CrossRef]
  87. Lawshe, C.H. A quantitative approach to content validity. Pers. Psychol. 1975, 28, 563–575. [Google Scholar] [CrossRef]
  88. Polit, D.F.; Beck, C.T. The content validity index: Are you sure you know what’s being reported? critique and recommendations. Res. Nurs. Health 2006, 29, 489–497. [Google Scholar] [CrossRef] [PubMed]
  89. Babakus, E.; Mangold, W.G. Adapting the SERVQUAL scale to hospital services: An empirical investigation. Health Serv. Res. 1992, 26, 767. [Google Scholar] [PubMed]
  90. Buttle, F. SERVQUAL: Review, critique, research agenda. Eur. J. Mark. 1996, 30, 8–32. [Google Scholar] [CrossRef]
  91. Hayes, B.E. Measuring Customer Satisfaction: Survey Design, Use, and Statistical Analysis Methods; ASQ Quality Press: Milwaukee, WI, USA, 1998. [Google Scholar]
  92. Devlin, S.J.; Dong, H.K.; Brown, M. Selecting a scale for measuring quality. Mark. Res. 2003, 15, 13. [Google Scholar]
  93. Manzoor, F.; Wei, L.; Bányai, T.; Nurunnabi, M.; Subhan, Q.A. An examination of sustainable HRM practices on job performance: An application of training as a moderator. Sustainability 2019, 11, 2263. [Google Scholar] [CrossRef]
  94. Morris, M.G.; Venkatesh, V. Job characteristics and job satisfaction: Understanding the role of enterprise resource planning system implementation. MIS Q. 2010, 34, 143. [Google Scholar] [CrossRef]
  95. Thatcher, J.B.; Stepina, L.P.; Boyle, R.J. Turnover of information technology workers: Examining empirically the influence of attitudes, job characteristics, and external markets. J. Manag. Inf. Syst. 2014, 19, 231–261. [Google Scholar] [CrossRef]
  96. Spreitzer, G.M. Psychological, empowerment in the workplace: Dimensions, measurement and validation. Acad. Manag. J. 1995, 38, 1442–1465. [Google Scholar] [CrossRef]
  97. Meyer, J.P.; Allen, N.J.; Smith, C.A. Commitment to organizations and occupations: Extension and test of a three-component conceptualization. J. Appl. Psychol. 1993, 78, 538–551. [Google Scholar] [CrossRef]
  98. Nulty, D.D. The adequacy of response rates to online and paper surveys: What can be done? Assess. Eval. High. Educ. 2008, 33, 301–314. [Google Scholar] [CrossRef]
  99. Hair, J.F.; Hult, G.T.M.; Ringle, C.M.; Sarstedt, M.; Danks, N.P.; Ray, S. A Primer on Partial Least Squares Structural Equation Modeling (PLS-SEM); Sage Publications: Thousand Oaks, CA, USA, 2021. [Google Scholar] [CrossRef]
  100. Henseler, J.; Chin, W.W. A comparison of approaches for the analysis of interaction effects between latent variables using partial least squares path modeling. Struct. Equ. Model. Multidiscip. J. 2010, 17, 82–109. [Google Scholar] [CrossRef]
  101. Hair, J.F.; Sarstedt, M.; Ringle, C.M.; Mena, J.A. An assessment of the use of partial least squares structural equation modeling in marketing research. J. Acad. Mark. Sci. 2012, 40, 414–433. [Google Scholar] [CrossRef]
  102. Ringle, C.M.; Wende, S.; Becker, J.M. “SmartPLS 3” Boenningstedt; SmartPLS GmbH: Bönningstedt, Germany, 2015. [Google Scholar]
  103. Henseler, J.; Ringle, C.M.; Sinkovics, R.R. The use of partial least squares path modeling in international marketing. In New Challenges to International Marketing; Emerald Group Publishing Limited: Bingley, UK, 2009. [Google Scholar] [CrossRef]
  104. Tenenhaus, M.; Vinzi, V.E.; Chatelin, Y.M.; Lauro, C. PLS path modeling. Comput. Stat. Data Anal. 2005, 48, 159–205. [Google Scholar] [CrossRef]
  105. Hair, J.F.; Ringle, C.M.; Sarstedt, M. PLS-SEM: Indeed a silver bullet. J. Mark. Theory Pract. 2011, 19, 139–152. [Google Scholar] [CrossRef]
  106. Ringle, C.M.; Sarstedt, M.; Schlittgen, R. Genetic algorithm segmentation in partial least squares structural equation modeling. OR Spectr. 2014, 36, 251–276. [Google Scholar] [CrossRef]
  107. Ringle, C.M.; Sarstedt, M.; Straub, D.W. Editor’s comments: A critical look at the use of PLS-SEM in “MIS Quarterly”. MIS Q. 2012, 36, iii–xiv. [Google Scholar] [CrossRef]
  108. Fornell, C.; Larcker, D.F. Evaluating structural equation models with unobservable variables and measurement error. J. Mark. Res. 1981, 18, 39–50. [Google Scholar] [CrossRef]
  109. Lee, C.-Y.; Chong, H.-Y.; Li, Q.; Wang, X. Joint contract–function effects on BIM-enabled EPC project performance. J. Constr. Eng. Manag. 2020, 146, 4020008. [Google Scholar] [CrossRef]
  110. Henseler, J.; Ringle, C.M.; Sarstedt, M. A new criterion for assessing discriminant validity in variance-based structural equation modeling. J. Acad. Mark. Sci. 2015, 43, 115–135. [Google Scholar] [CrossRef]
  111. Geisser, S. A predictive approach to the random effect model. Biometrika 1974, 61, 101–107. [Google Scholar] [CrossRef]
  112. Stone, M. Cross-validatory choice and assessment of statistical predictions. J. R. Stat. Soc. Ser. B (Methodol.) 1974, 36, 111–133. [Google Scholar] [CrossRef]
  113. Chin, W.W. The partial least squares approach to structural equation modeling. Mod. Methods Bus. Res. 1998, 295, 295–336. [Google Scholar]
  114. Cohen, J. Statistical Power Analysis for the Behavioral Sciences; Routledge: New York, NY, USA, 1998. [Google Scholar] [CrossRef]
  115. Bentler, P.M.; Bonett, D.G. Significance tests and goodness of fit in the analysis of covariance structures. Psychol. Bull. 1980, 88, 588–606. [Google Scholar] [CrossRef]
  116. Dijkstra, T.K.; Henseler, J. Consistent partial least squares path modeling. MIS Q. 2015, 39, 297–316. [Google Scholar] [CrossRef]
  117. Tenenhaus, M.; Amato, S.; Esposito Vinzi, V. A global goodness-of-fit index for PLS structural equation modelling. In Proceedings of the XLII SIS Scientific Meeting; CLEUP: Padova, Italy, 2004; Volume 1, pp. 739–742. [Google Scholar]
  118. Wetzels, M.; Odekerken-Schröeder, G.; Van Oppen, C. Using PLS path modeling for assessing hierarchical construct models: Guidelines and empirical illustration. MIS Q. 2009, 33, 177–195. [Google Scholar] [CrossRef]
  119. Sobel, M.E. Asymptotic confidence intervals for indirect effects in structural equation models. Sociol. Methodol. 1982, 13, 290–312. [Google Scholar] [CrossRef]
  120. Mackinnon, D.P.; Dwyer, J.H. Estimating mediated effects in prevention studies. Eval. Rev. 1993, 17, 144–158. [Google Scholar] [CrossRef]
  121. MacKinnon, D.P.; Warsi, G.; Dwyer, J.H. A simulation study of mediated effect measures. Multivar. Behav. Res. 1995, 30, 41–62. [Google Scholar] [CrossRef]
  122. Preacher, K.J.; Leonardelli, G.J. Calculation for the Sobel Test: An Interactive Calculation Tool for Mediation Tests. 2001. Available online: https://quantpsy.org/sobel/sobel.htm (accessed on 21 March 2022).
  123. Yay, M. The mediation analysis with the Sobel test and the percentile bootstrap. Int. J. Manag. Appl. Sci. 2017, 3, 123–125. [Google Scholar]
  124. Chin, W.W.; Marcolin, B.L.; Newsted, P.R. A partial least squares latent variable modeling approach for measuring interaction effects: Results from a Monte Carlo simulation study and an electronic-mail emotion/adoption study. In Proceedings of the 17th International Conference on Information Systems, Cleveland, OH, USA, 3–6 January 1996. [Google Scholar]
  125. Chin, W.W.; Marcolin, B.L.; Newsted, P.R. A partial least squares latent variable modeling approach for measuring interaction effects: Results from a Monte Carlo simulation study and an electronic-mail emotion/adoption study. Inf. Syst. Res. 2003, 14, 189–217. [Google Scholar] [CrossRef]
  126. Ifinedo, P. The moderating effects of demographic and individual characteristics on nurses’ acceptance of information systems: A canadian study. Int. J. Med. Inform. 2016, 87, 27–35. [Google Scholar] [CrossRef] [PubMed]
  127. Avolio, B.J.; Gardner, W.L.; Walumbwa, F.O.; Luthans, F.; May, D.R. Unlocking the mask: A look at the process by which authentic leaders impact follower attitudes and behaviors. Leadersh. Q. 2004, 15, 801–823. [Google Scholar] [CrossRef]
  128. Dawson, J.F. Moderation in management research: What, why, when, and how. J. Bus. Psychol. 2014, 29, 1–19. [Google Scholar] [CrossRef]
  129. Leather, P.J. Safety and accidents in the construction industry: A work design perspective. Work. Stress 2007, 1, 167–174. [Google Scholar] [CrossRef]
  130. Salehi, A.; Sadat Goosheh, P. Evaluating the role of supervising engineers and designers in optimizing buildings energy consumptions in line with the implementation of national building regulations. In Proceedings of the 3rd National Conference on Climate Building, and Energy Consumption Optimization with Sustainable Development Approach, Tehran, Iran, 15–17 December 2015. (In Persian). [Google Scholar]
  131. Mjakuškina, S.; Kavosa, M.; Lapiņa, I. Achieving Sustainability in the Construction Supervision Process. J. Open Innov. Technol. Mark. Complex. 2019, 5, 47. [Google Scholar] [CrossRef]
Figure 1. Proposed research model.
Buildings 15 00397 g001
Figure 2. Proposed Research Model in the Case of Significant Coefficients. Note: *, **, and *** = significance level of p < 0.1, p < 0.05, p < 0.01, respectively.
Buildings 15 00397 g002
Figure 3. Influence of Education Level and Income on Key Variables.
Buildings 15 00397 g003aBuildings 15 00397 g003b
Figure 4. Strategies for increasing the job performance of supervising engineers with low income and/or low education level. Note: The promotion of the variables presented in white chevrons has a positive effect on the path. The demotion of the variables presented in black chevrons has a positive effect on the path.
Buildings 15 00397 g004
Table 2. Respondents’ Demographic Characteristics.
Respondents’ CharacteristicsFrequencyFrequency PercentageCumulative Frequency Percentage
Gender
Male15188.8288.82
Female1911.18100
Marital Status
Single (Not Married)6135.8835.88
Married10964.12100
Age (Years)
Under 2510.590.59
25 to 356538.2338.82
35 to 458047.0685.88
45 to 552011.7697.64
Over 5542.35100
Work Experience (Years)
Under 52212.9412.94
5 to 105029.4142.35
10 to 155834.1276.47
15 to 202112.3588.82
Over 201911.18100
Education Level
B.S.1026060
M.S.5431.7691.76
Ph.D.148.24100
Monthly Income (USD)
Under 120342020
120 to 240684060
240 to 3604727.6587.65
360 to 480137.6595.30
Over 48084.70100
Table 3. Measurement Model’s Validity, Reliability, and Quality.
VariableCronbach’s AlphaRho-ACRAVEHTMTCV-Com
ACAutComFBJPTI q 2
AC0.9650.9730.9720.851 0.735
Aut0.9400.9810.9610.8910.170 0.665
Com0.8760.8750.9240.8030.2630.182 0.535
FB0.9080.9120.9420.8440.2730.1630.207 0.598
JP0.8890.8920.9230.7510.3910.1030.4460.203 0.545
TI0.7910.8670.9030.8230.1430.3400.3000.2660.352 0.386
Table 4. Path Coefficients and Hypotheses Testing.
Hypothesesβp-ValueT-ValueS/NS
H1Autonomy → Job performance−0.0950.1591.409NS
H2Feedback → Job performance0.0220.7920.264NS
H3Task Identity → Job performance0.207 ***0.0092.618S
H4Competence → Job performance0.281 **0.0102.588S
H4-1Autonomy → Competence0.0890.2231.221NS
H4-2Feedback → Competence0.121 *0.0891.705S
H4-3Task Identity → Competence0.212 ***0.0092.641S
H5Affective Commitment → Job performance0.282 ***0.0003.977S
H5-1Autonomy → Affective Commitment0.1070.1771.351NS
H5-2Feedback → Affective Commitment0.206 ***0.0092.612S
H5-3Task Identity → Affective Commitment0.0010.9890.014NS
H5-4Competence → Affective Commitment0.189 **0.0102.584S
Note: *, **, ***, S, and NS = significance level of p < 0.1, p < 0.05, p < 0.01, significant, and non-significant, respectively.
Table 5. Moderation effect Hypotheses.
ModeratorPathΒp-ValueT-ValueValidation
Education LevelAutonomy → Competence 0.202 **0.0352.110Supported
Education LevelFeedback → Competence−0.176 ***0.0072.706Supported
Education LevelCompetence → Affective Commitment−0.160 *0.0681.830Supported
Education LevelAffective Commitment → Job Performance−0.197 **0.0172.394Supported
Education LevelTask Identity → Job Performance−0.224 ***0.0023.107Supported
IncomeFeedback → Competence −0.126 *0.0531.942Supported
IncomeCompetence → Affective Commitment−0.117 *0.0981.657Supported
IncomeAutonomy → Affective Commitment0.198 ***0.0082.658Supported
IncomeCompetence → Job Performance0.196 *0.0811.750Supported
IncomeTask Identity → Job Performance−0.191 *0.0531.940Supported
Note: *, **, and *** = significance level of p < 0.1, p < 0.05, p < 0.01, respectively.
Disclaimer/Publisher’s Note: The statements, opinions and data contained in all publications are solely those of the individual author(s) and contributor(s) and not of MDPI and/or the editor(s). MDPI and/or the editor(s) disclaim responsibility for any injury to people or property resulting from any ideas, methods, instructions or products referred to in the content.

