
The Application of Variable Weight Theory on the Suitability Evaluation of Urban Underground Space Development and Utilization for Urban Resilience and Sustainability
Abstract
1. Introduction
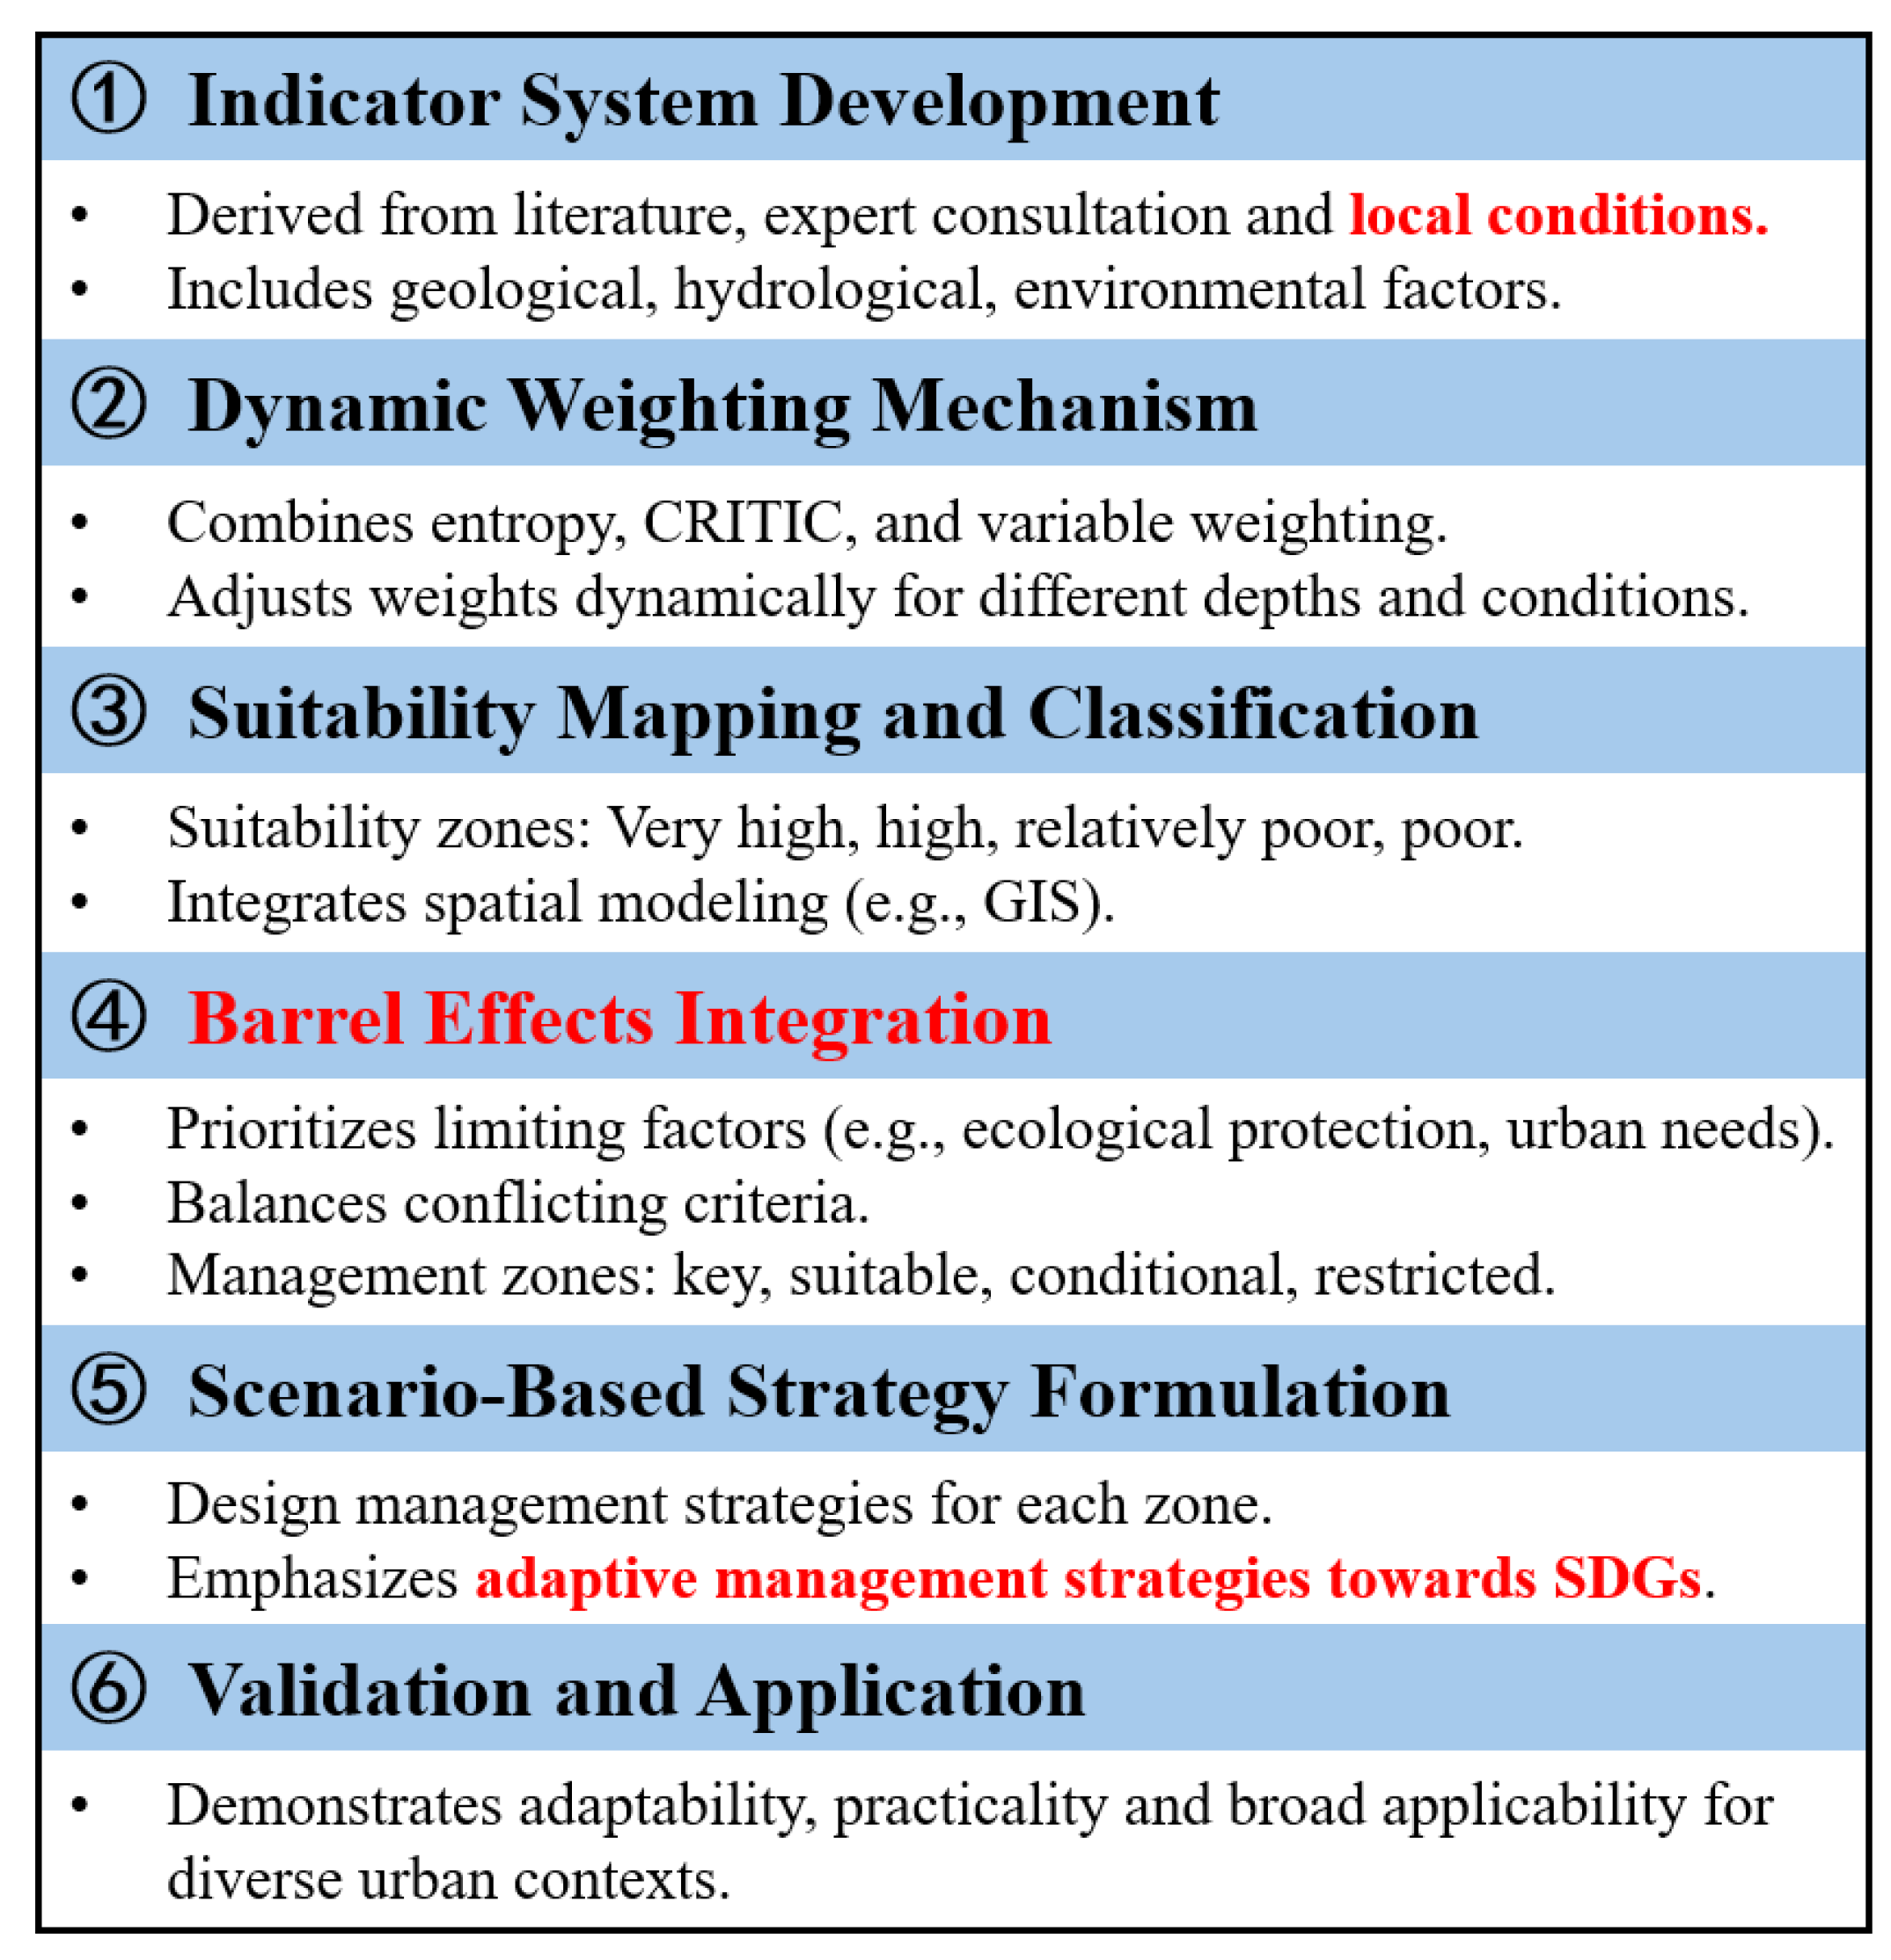
- Construct a new framework for SEUUSD&U for the JNPZ, involving new factors such as groundwater, natural disasters, and barrel effects (key urban development conditions and ecological protection).
- Display the application of VWT with a new variable weight function in SEUUSD&U and propose different levels of management strategies for D&U of UUS in JNPZ, and the application of VWT in SEUUSD&U is currently very limited.
- Provide a more general framework of SEUUSD&U and explore and discuss the relationship between SEUUSD&U, urban resilience and sustainable development under the framework of SDGs.
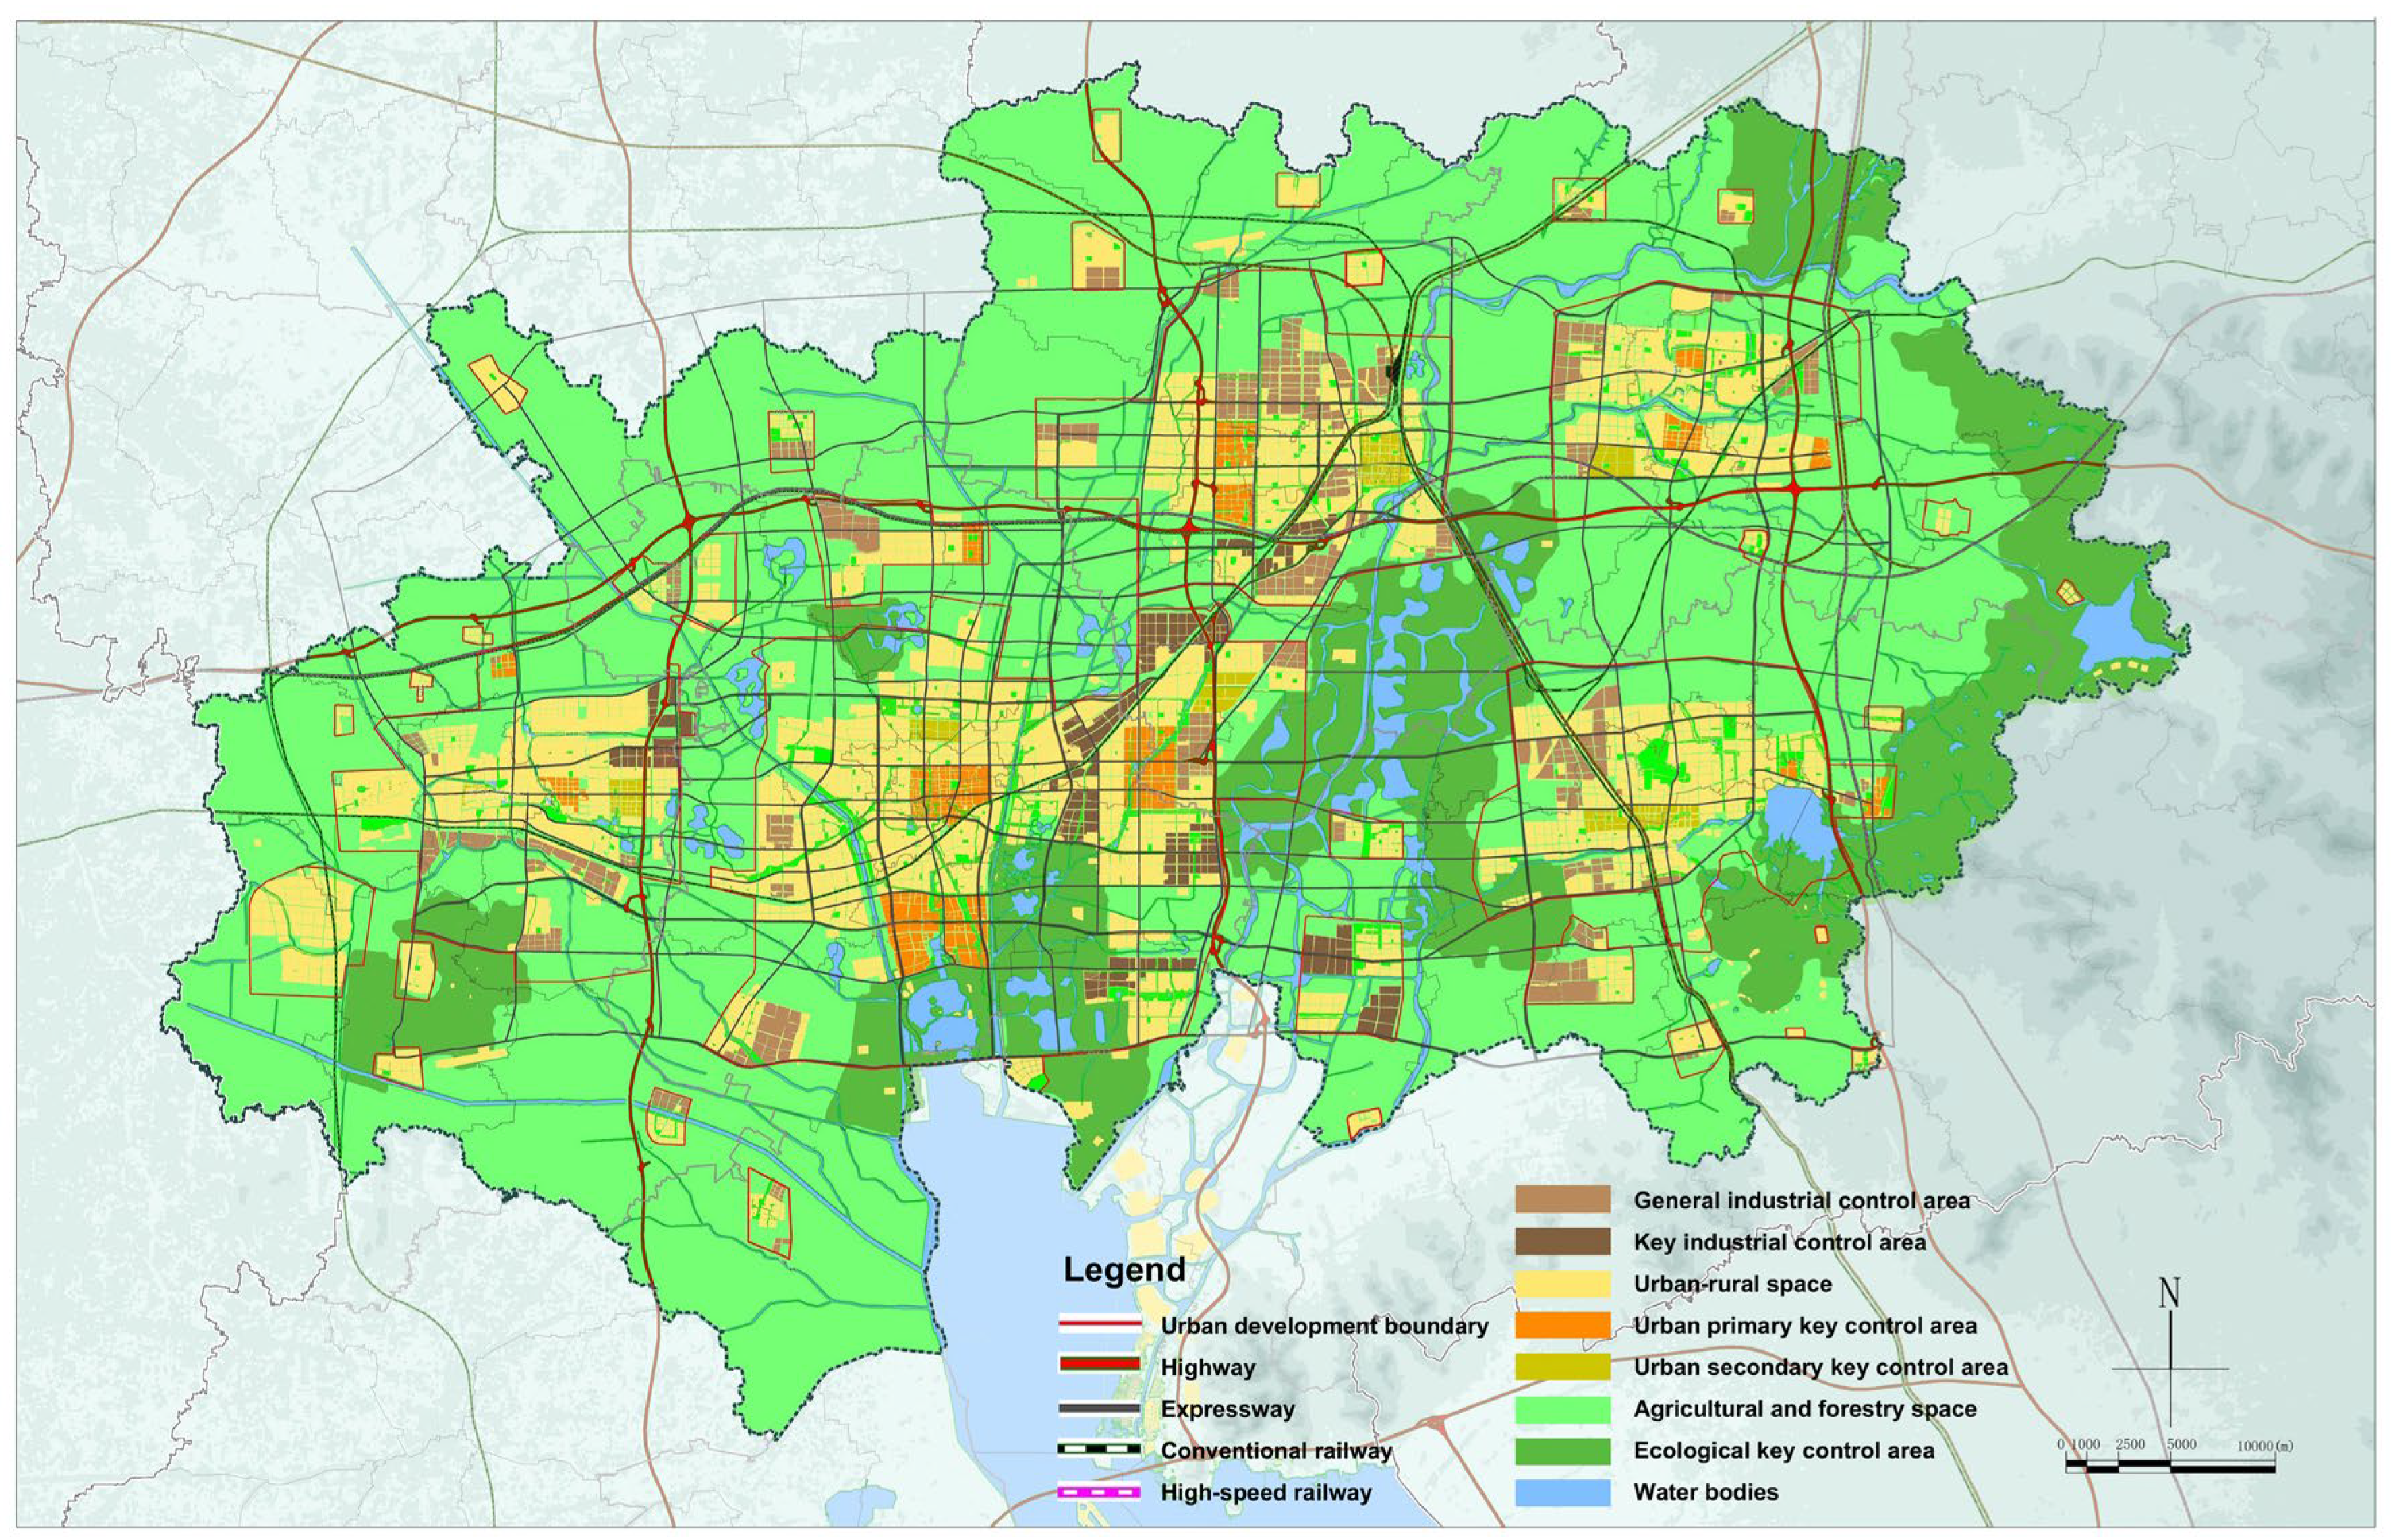
2. Study Area
3. Materials and Methods
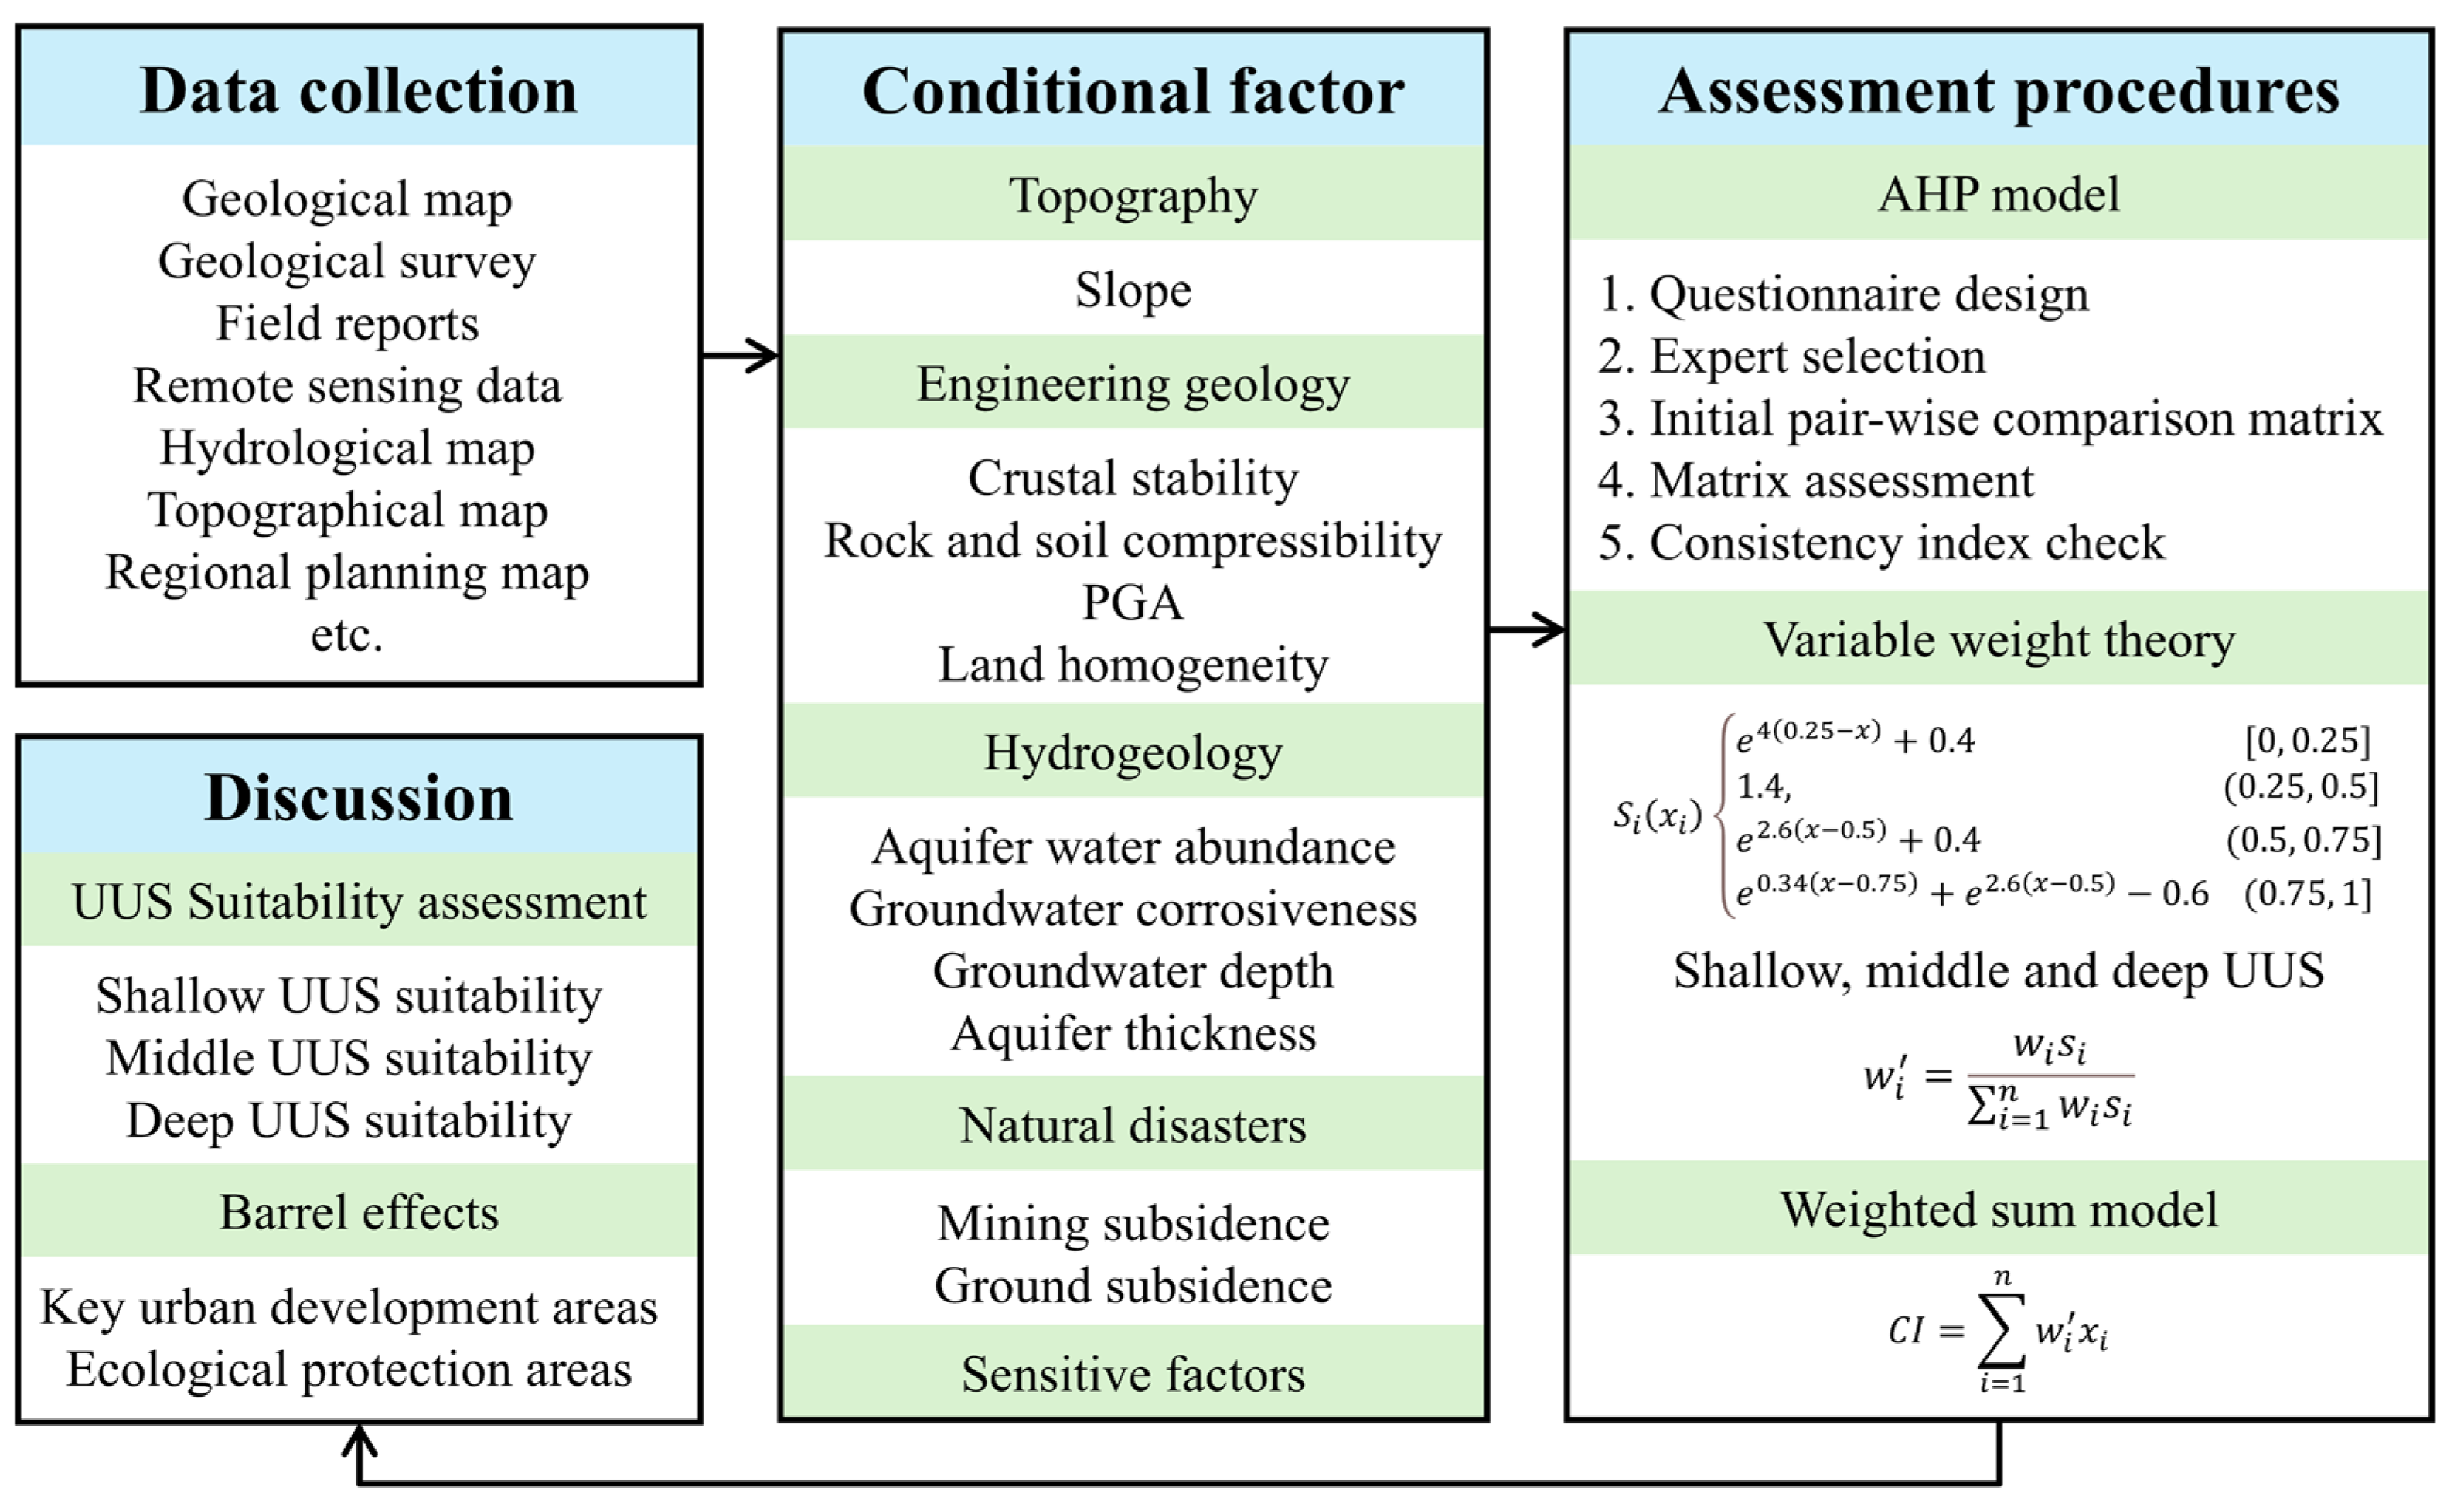
3.1. Methodology Framework
3.1.1. Data Collection
3.1.2. Conditional Factor Determination and Classification
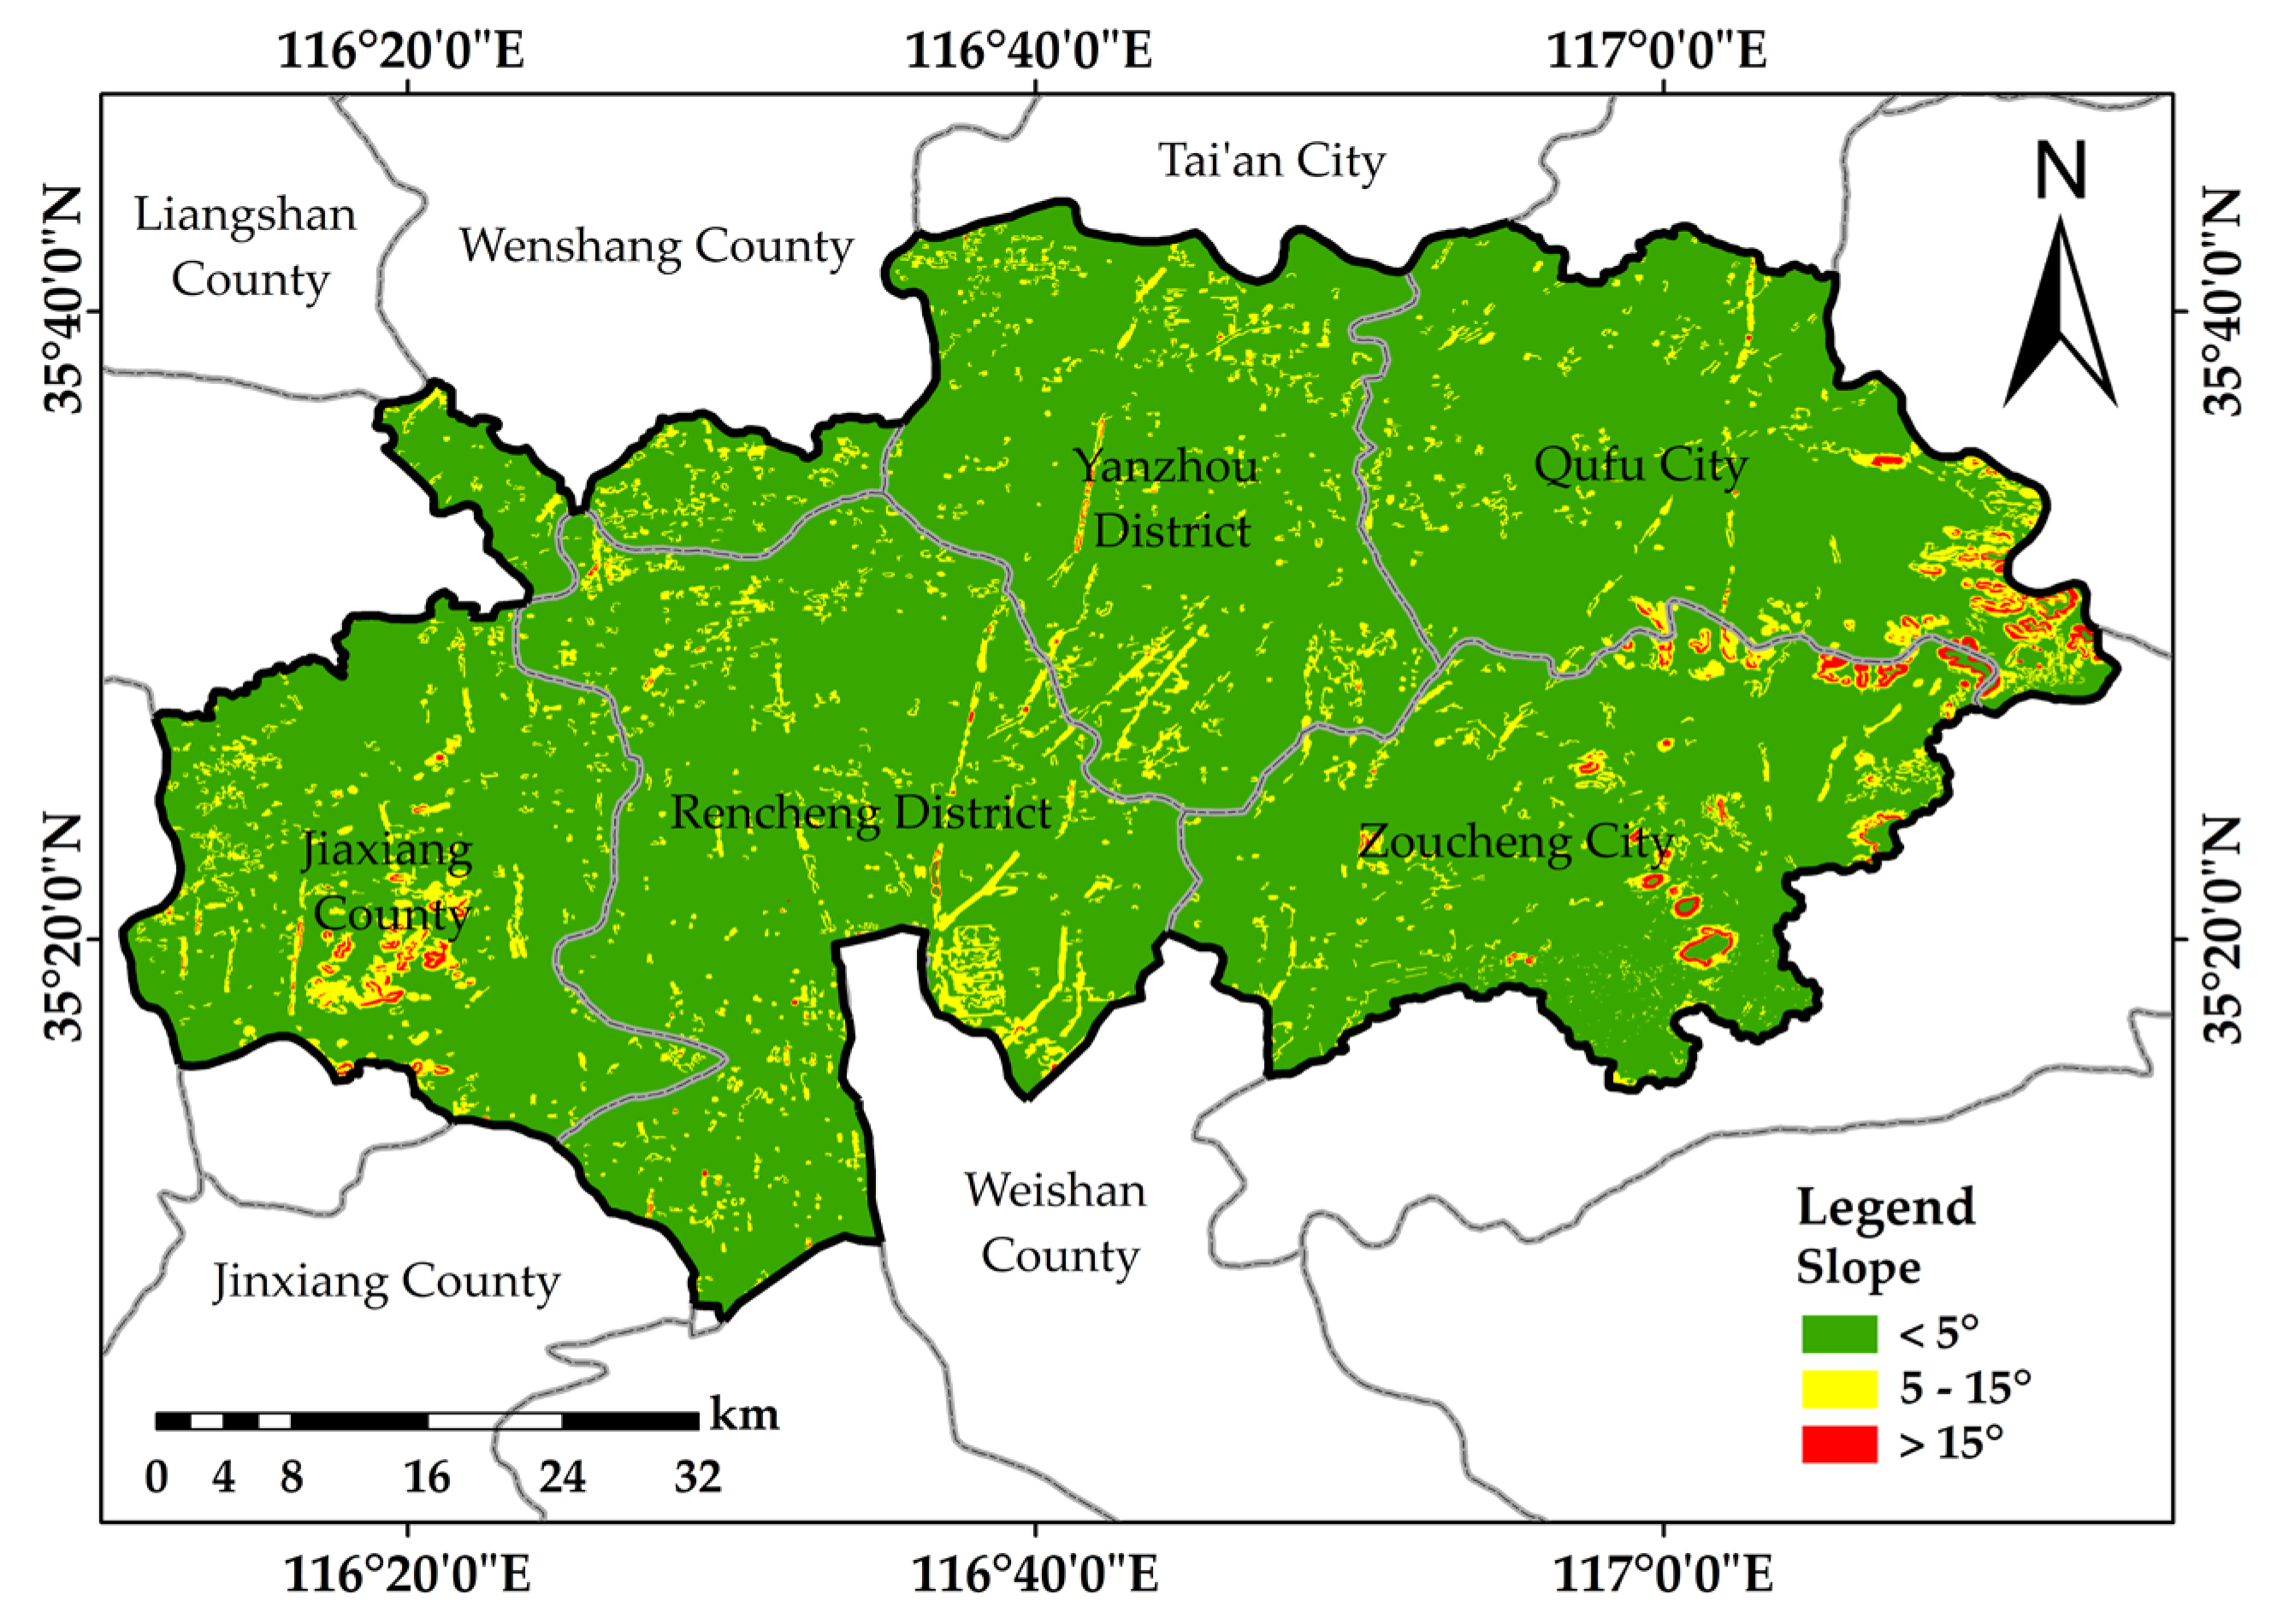
- Topography (B1), specifically considering slope (C1) as a key factor.
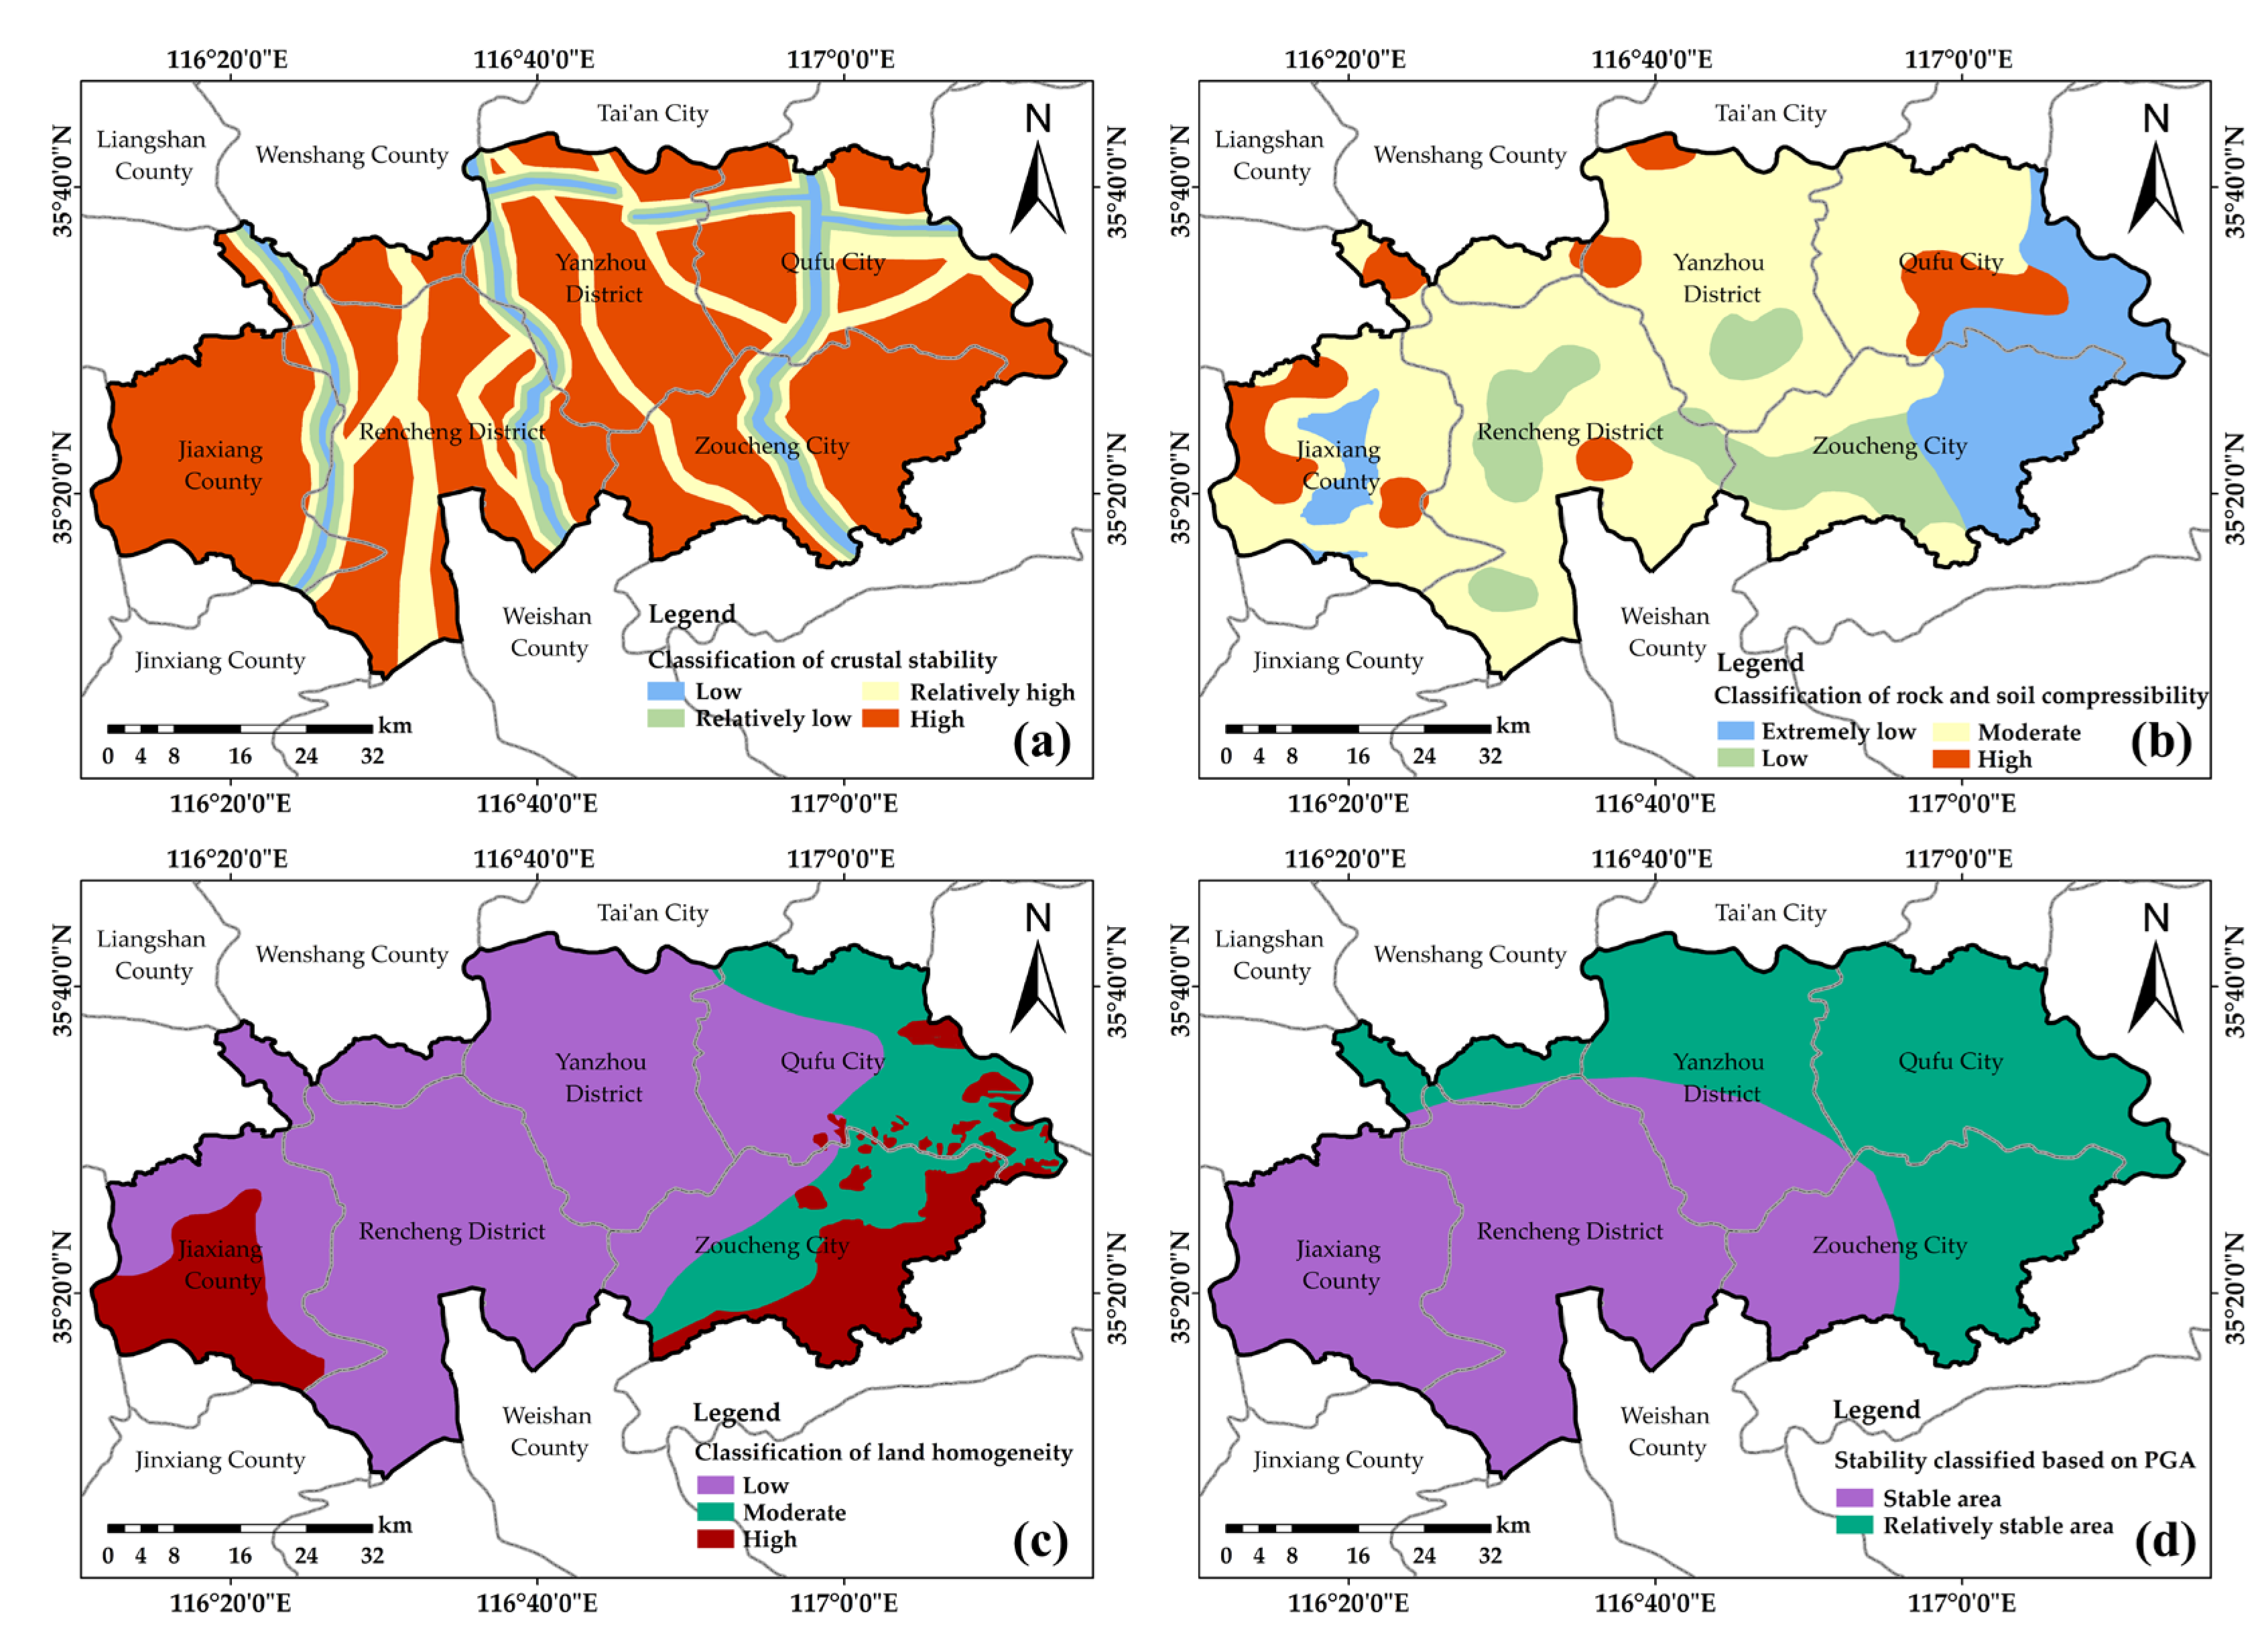
- Engineering geology (B2), including crustal stability (C2), land homogeneity (C3), rock and soil compressibility (C4), and peak ground acceleration (PGA) (C5).
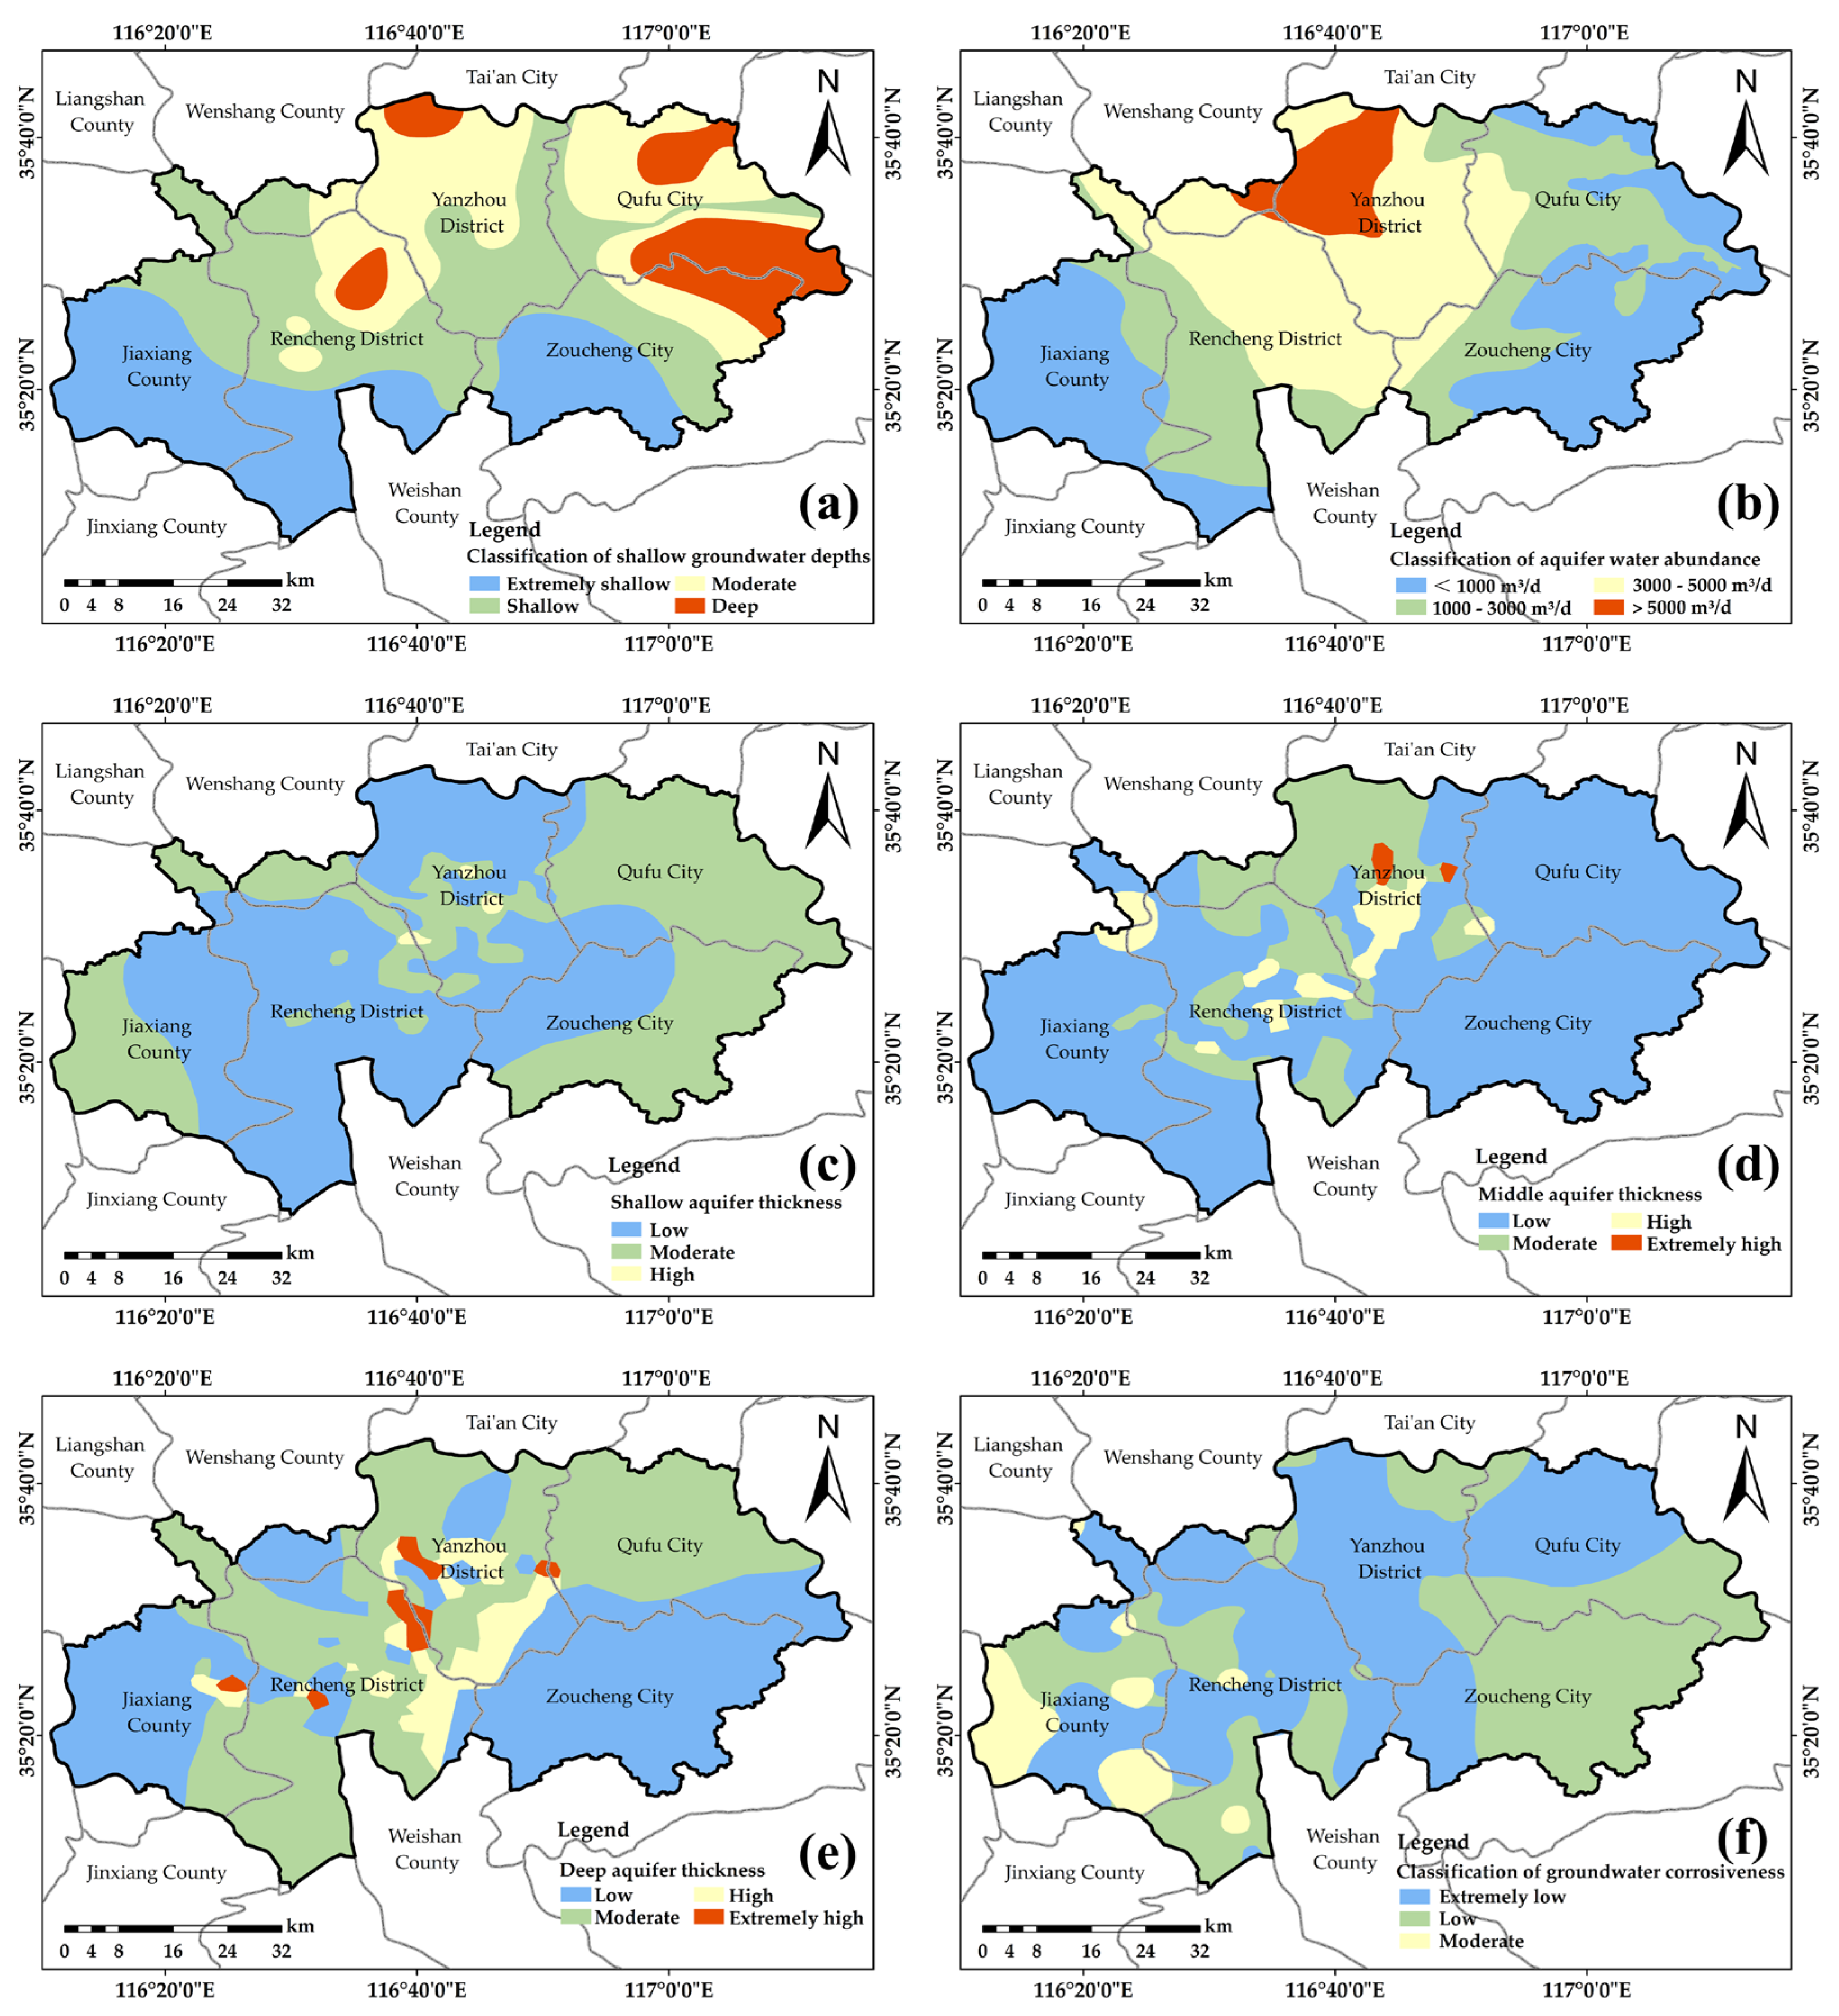
- Hydrogeology (B3), involving factors of shallow groundwater depth (C6), aquifer thickness (C7), aquifer water abundance (C8), and groundwater corrosiveness (C9).
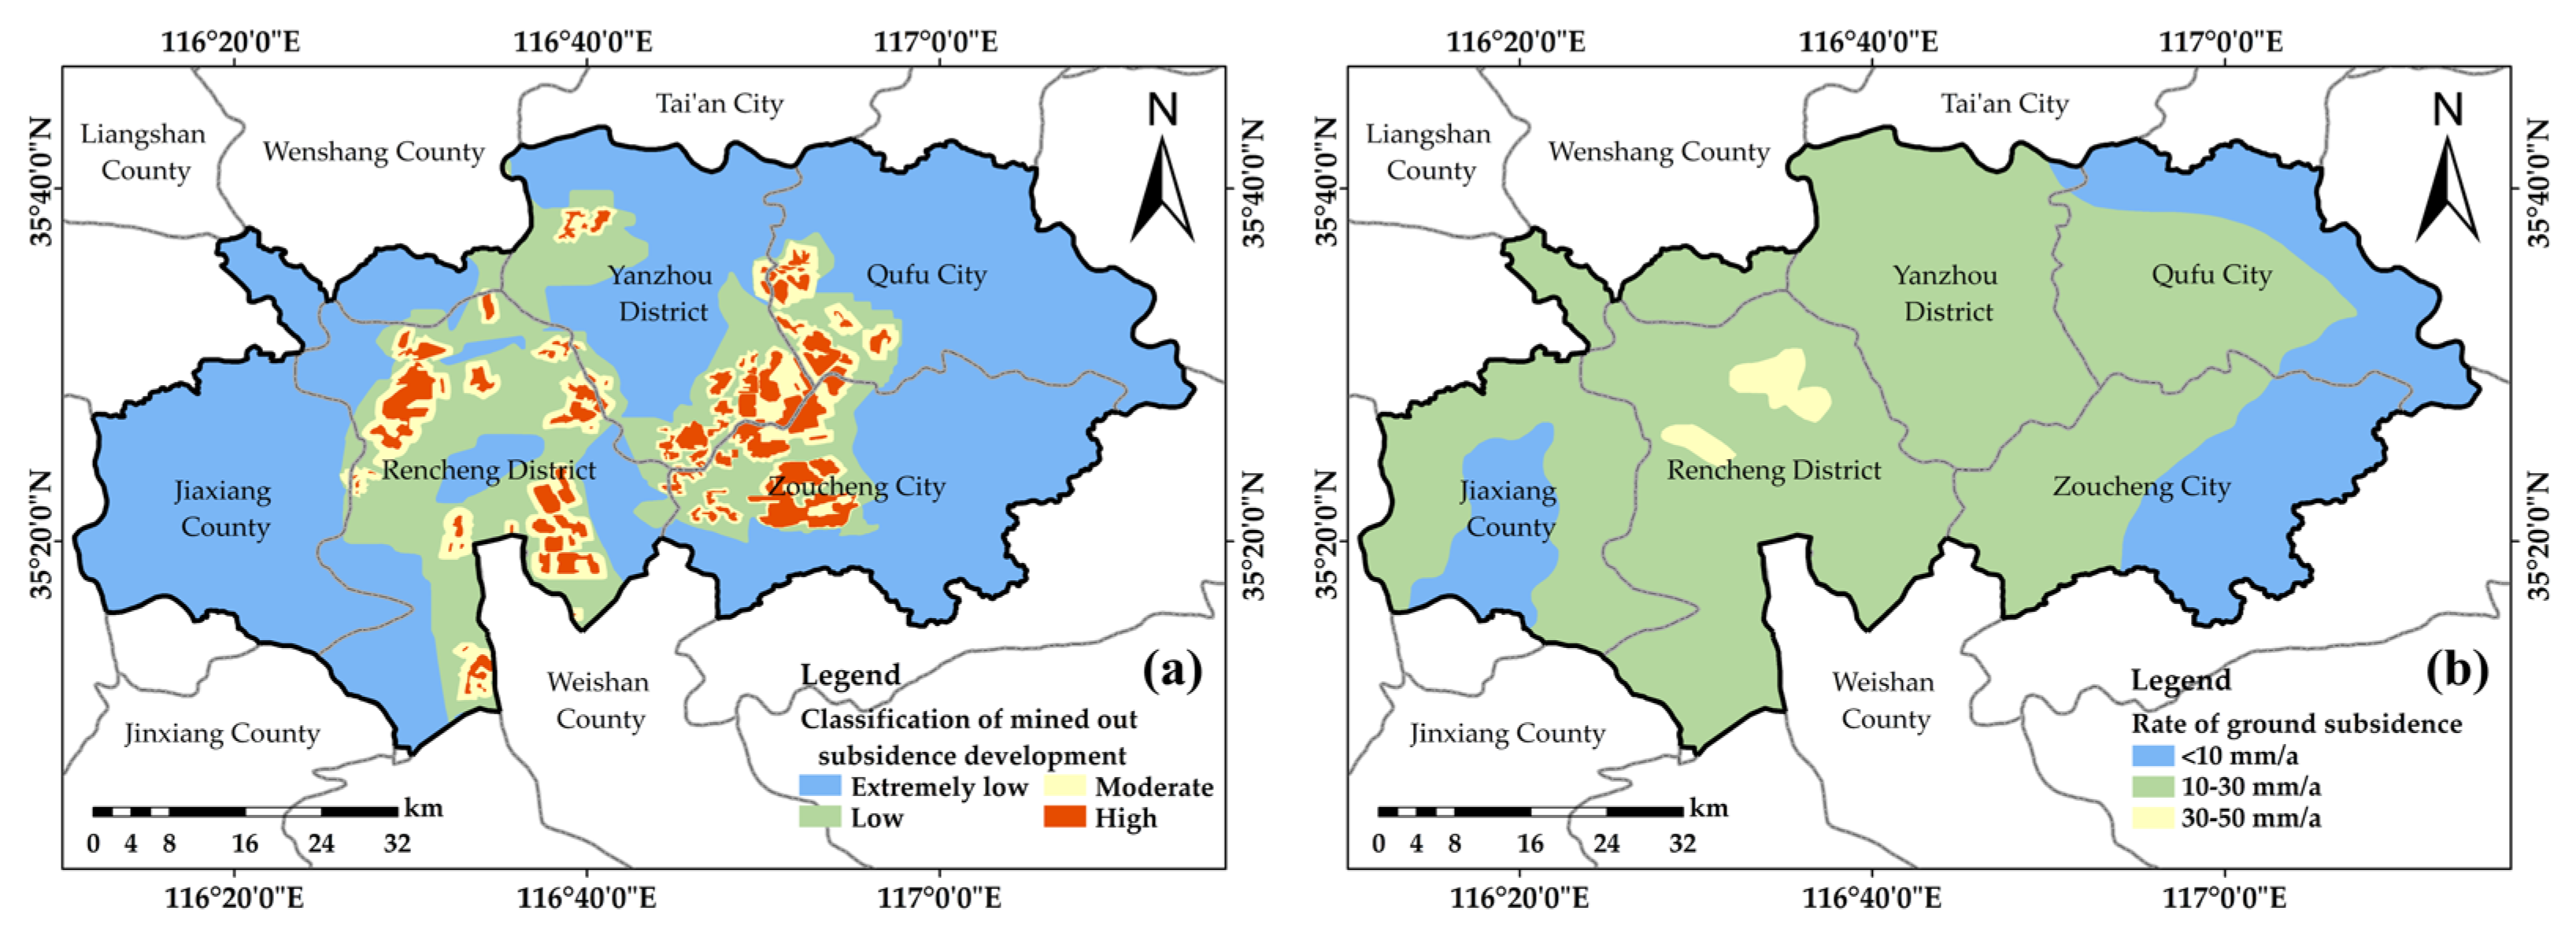
- Natural disasters (B4), which comprise mining subsidence (C10) and ground subsidence (C11).
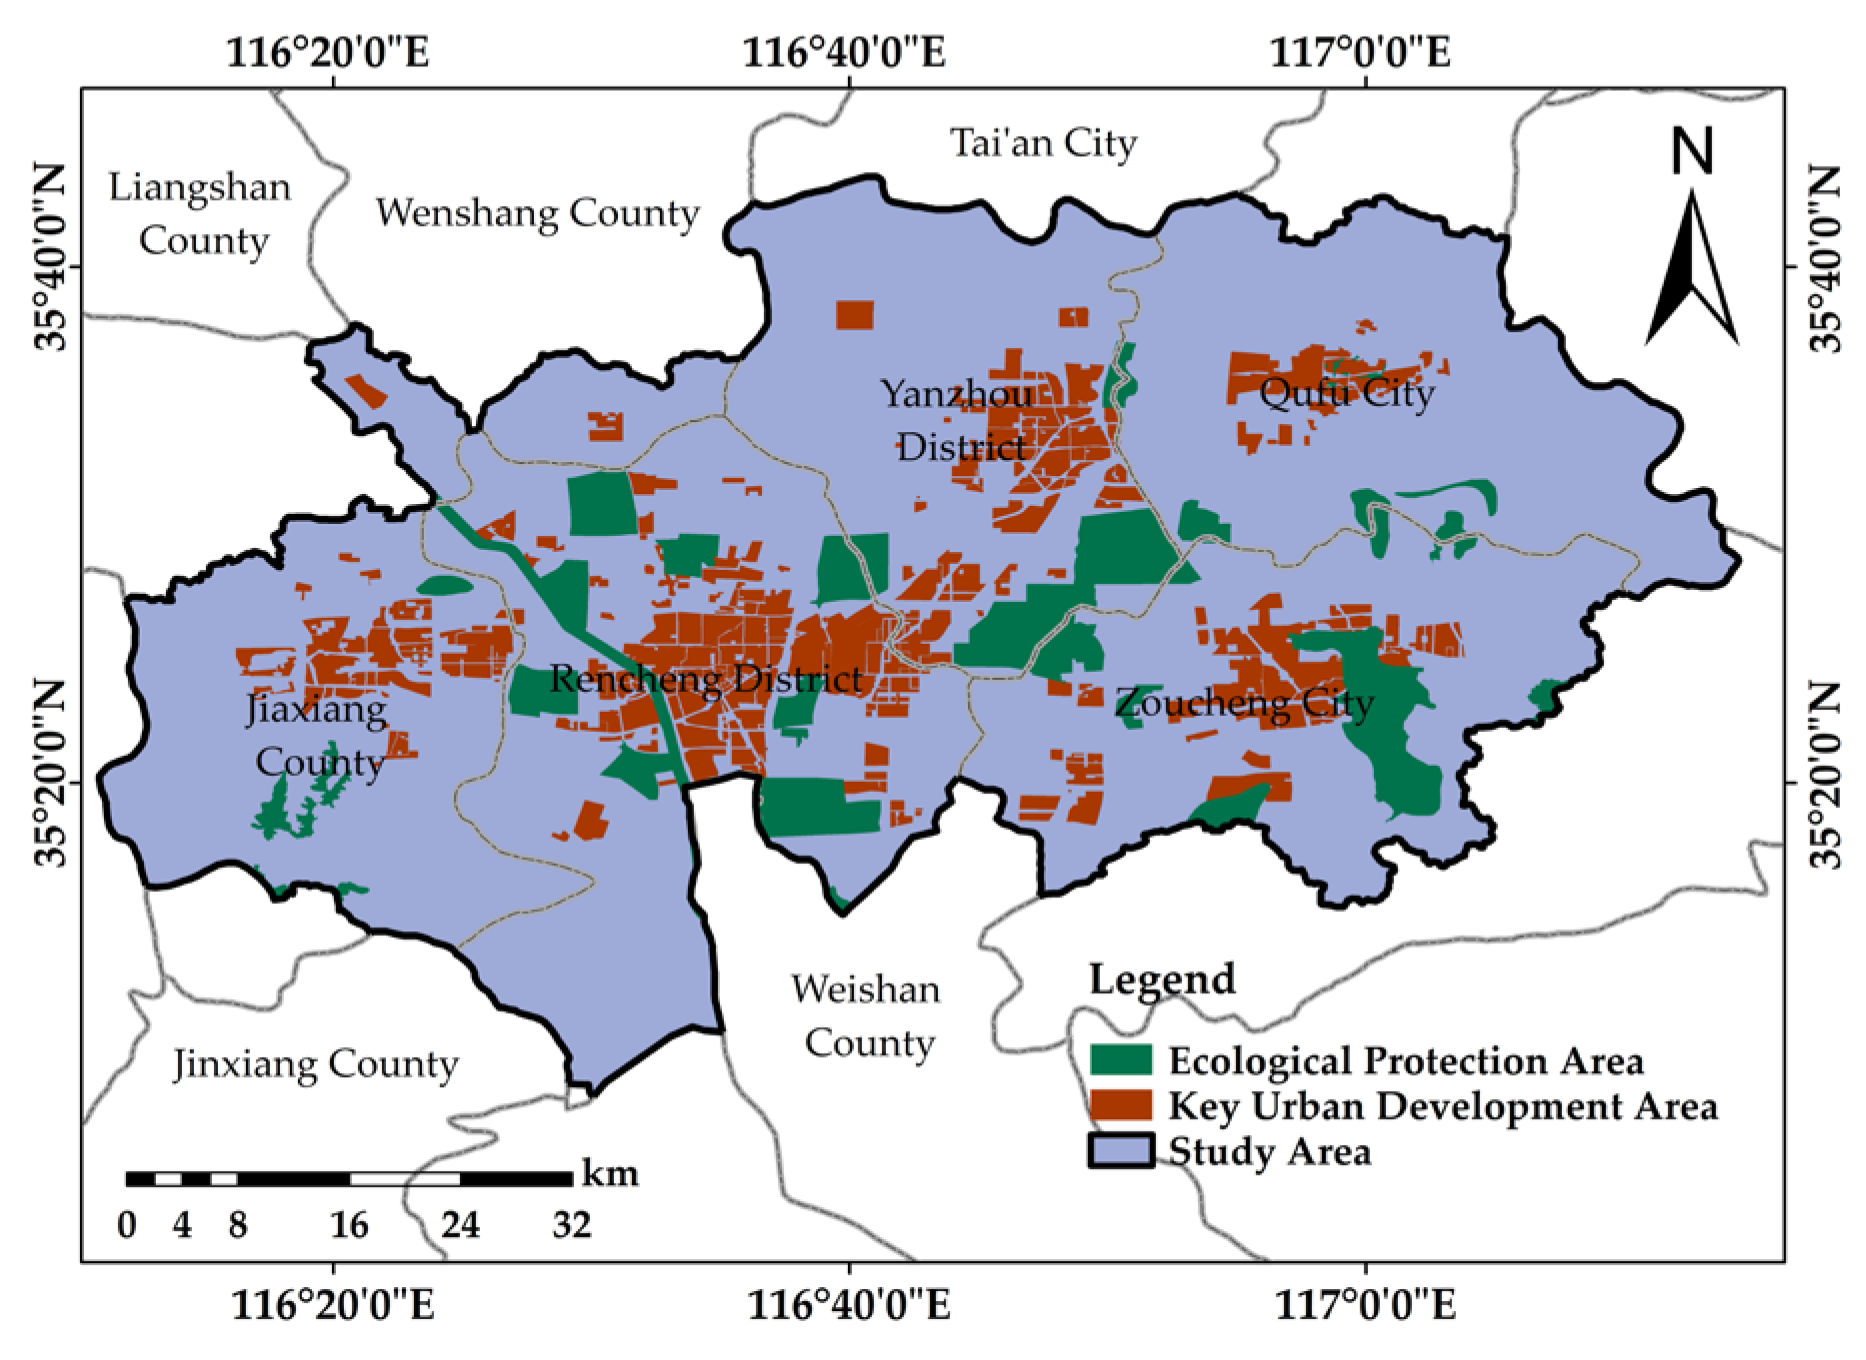
- Sensitive factors, including key urban development areas and ecological protection areas.
Topography
Engineering Geology
Hydrology
Natural Disasters
Sensitive Factors
3.1.3. Score Determination of Different Levels of Conditional Factors
3.2. Models
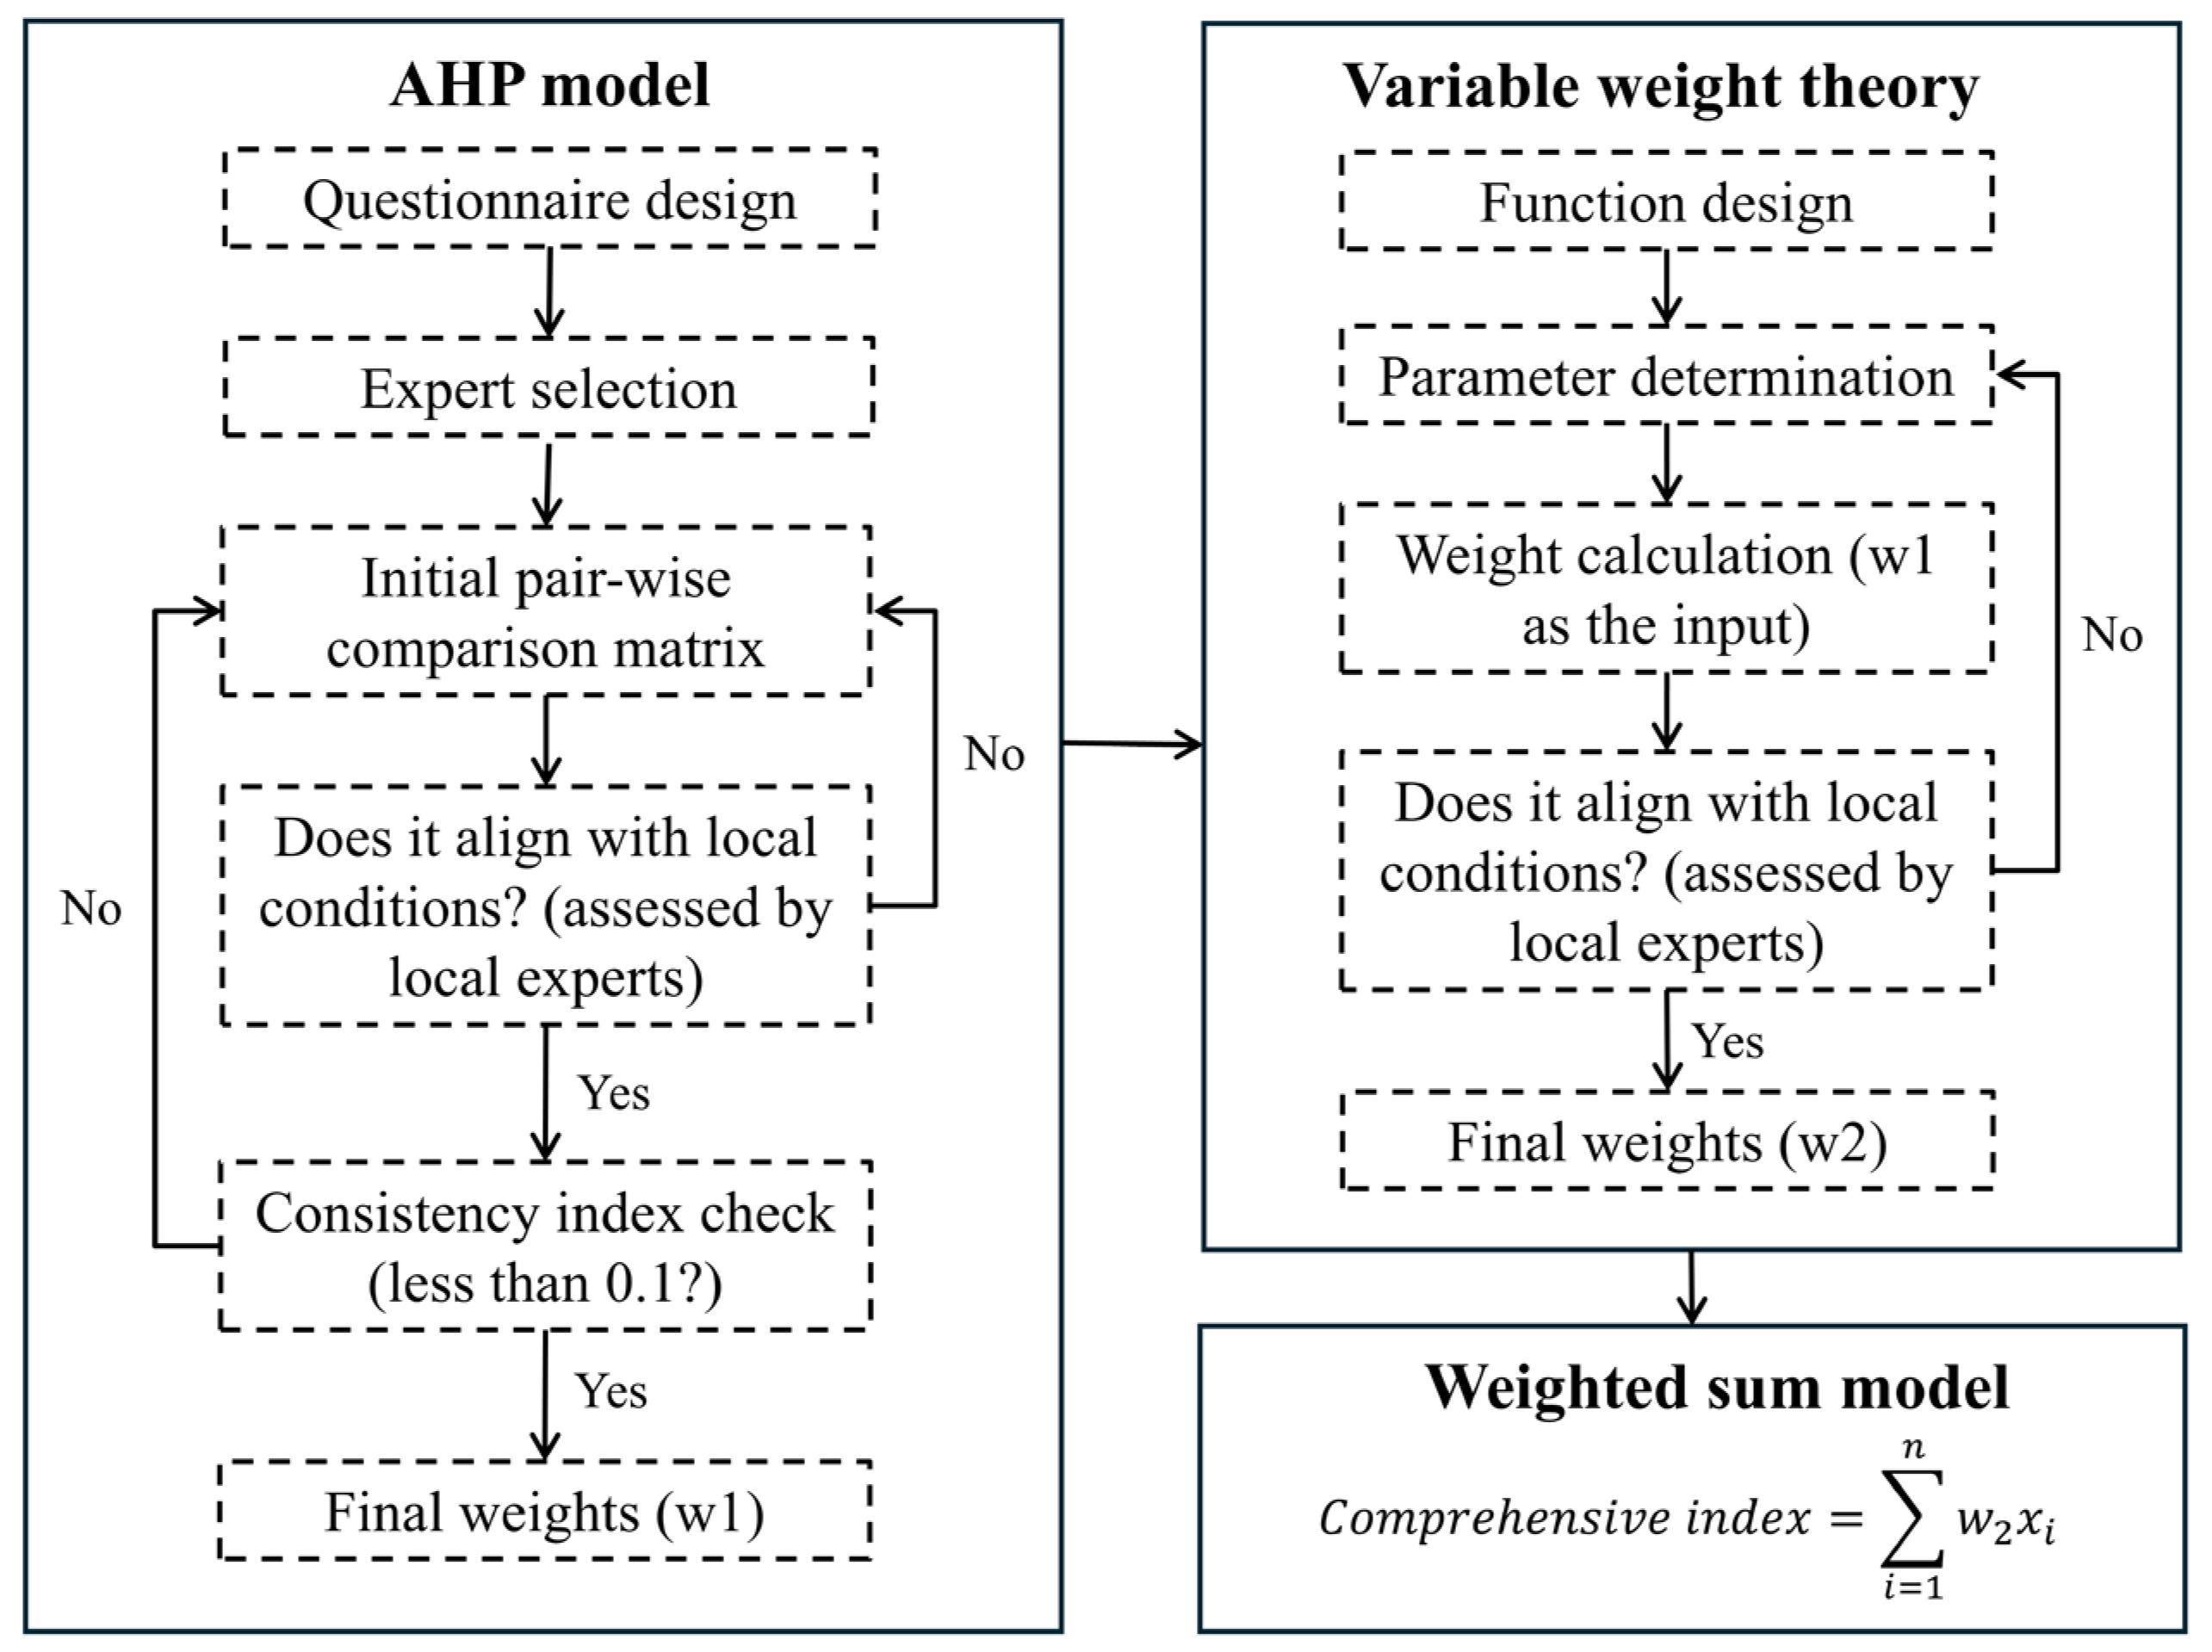
3.2.1. AHP Model
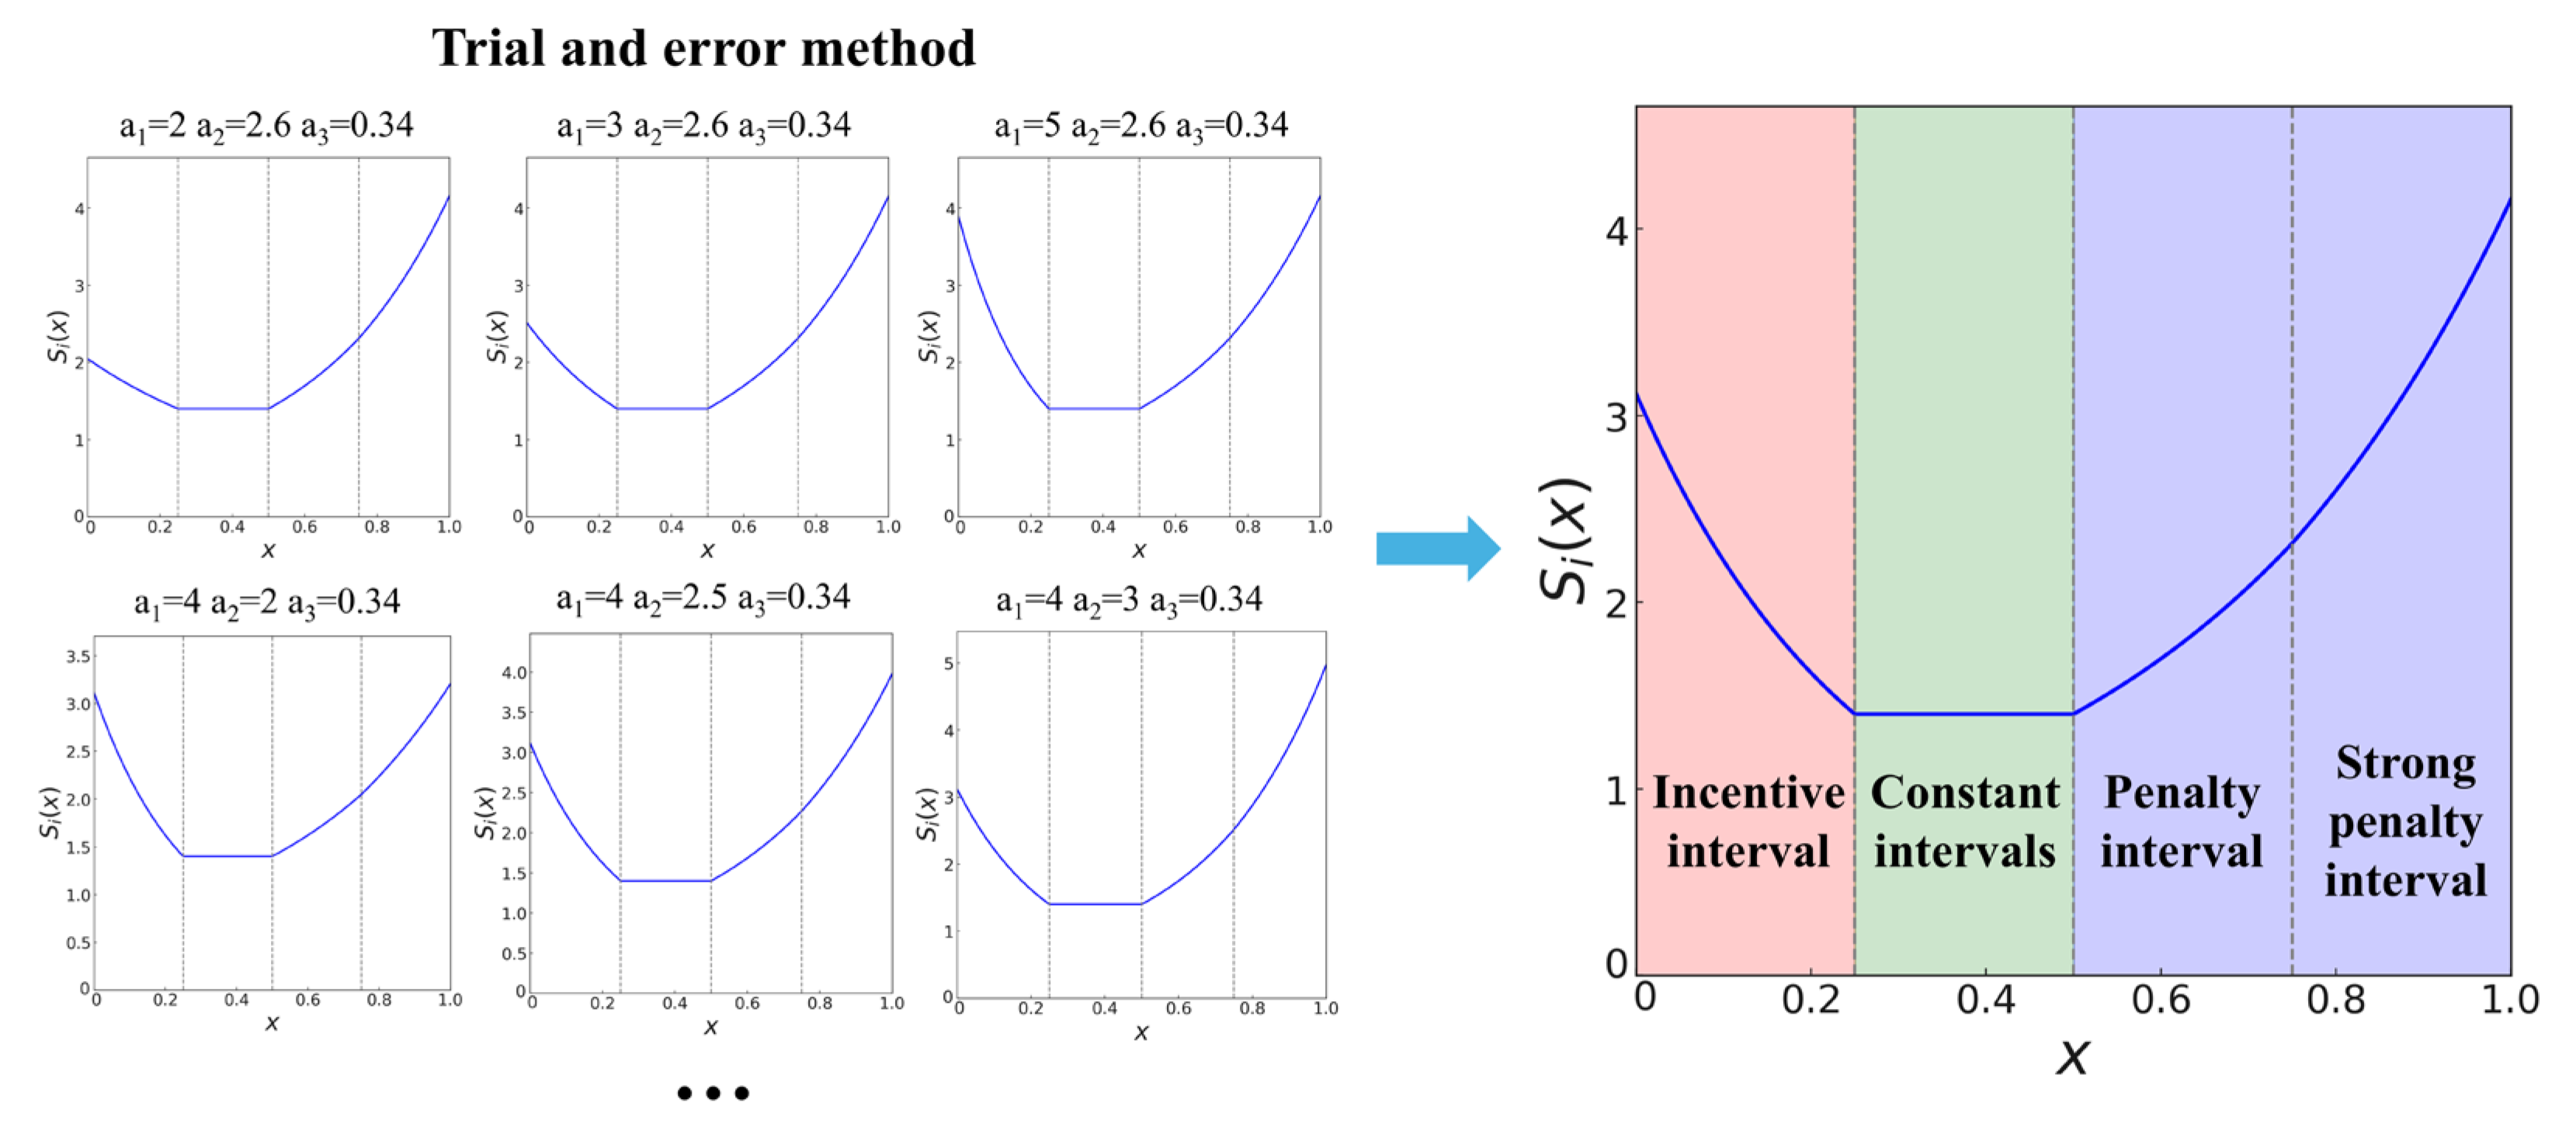
3.2.2. Variable Weight Theory (VWT)
3.2.3. Weighed Sum Model
3.2.4. Barrel Effects in SEUUSD&U
4. Results and Discussions
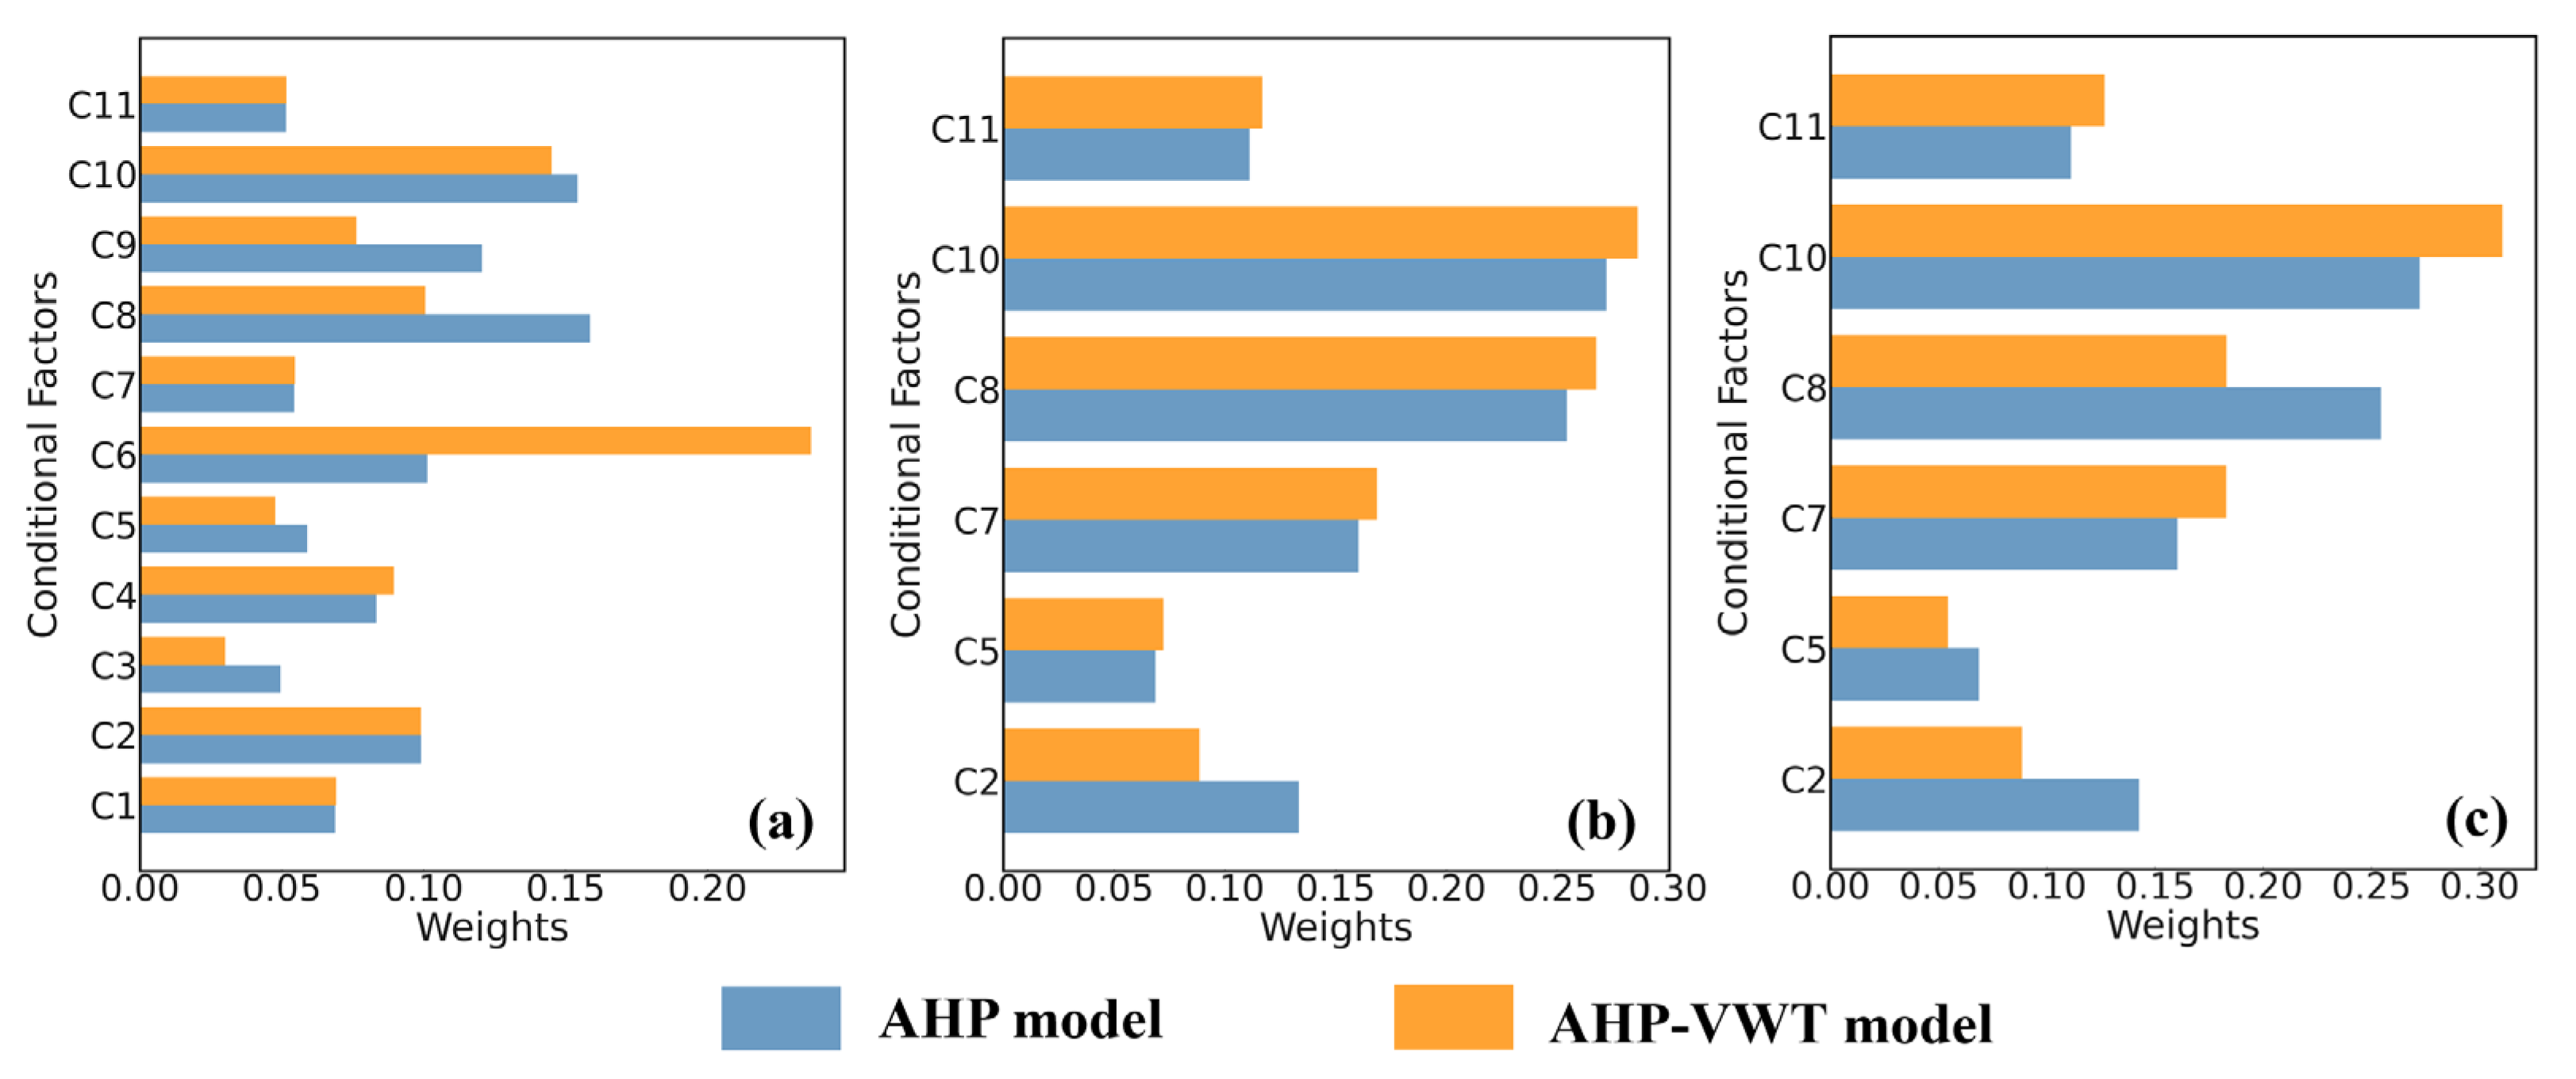
4.1. Weights Determined by AHP Model and AHP-VWT Model
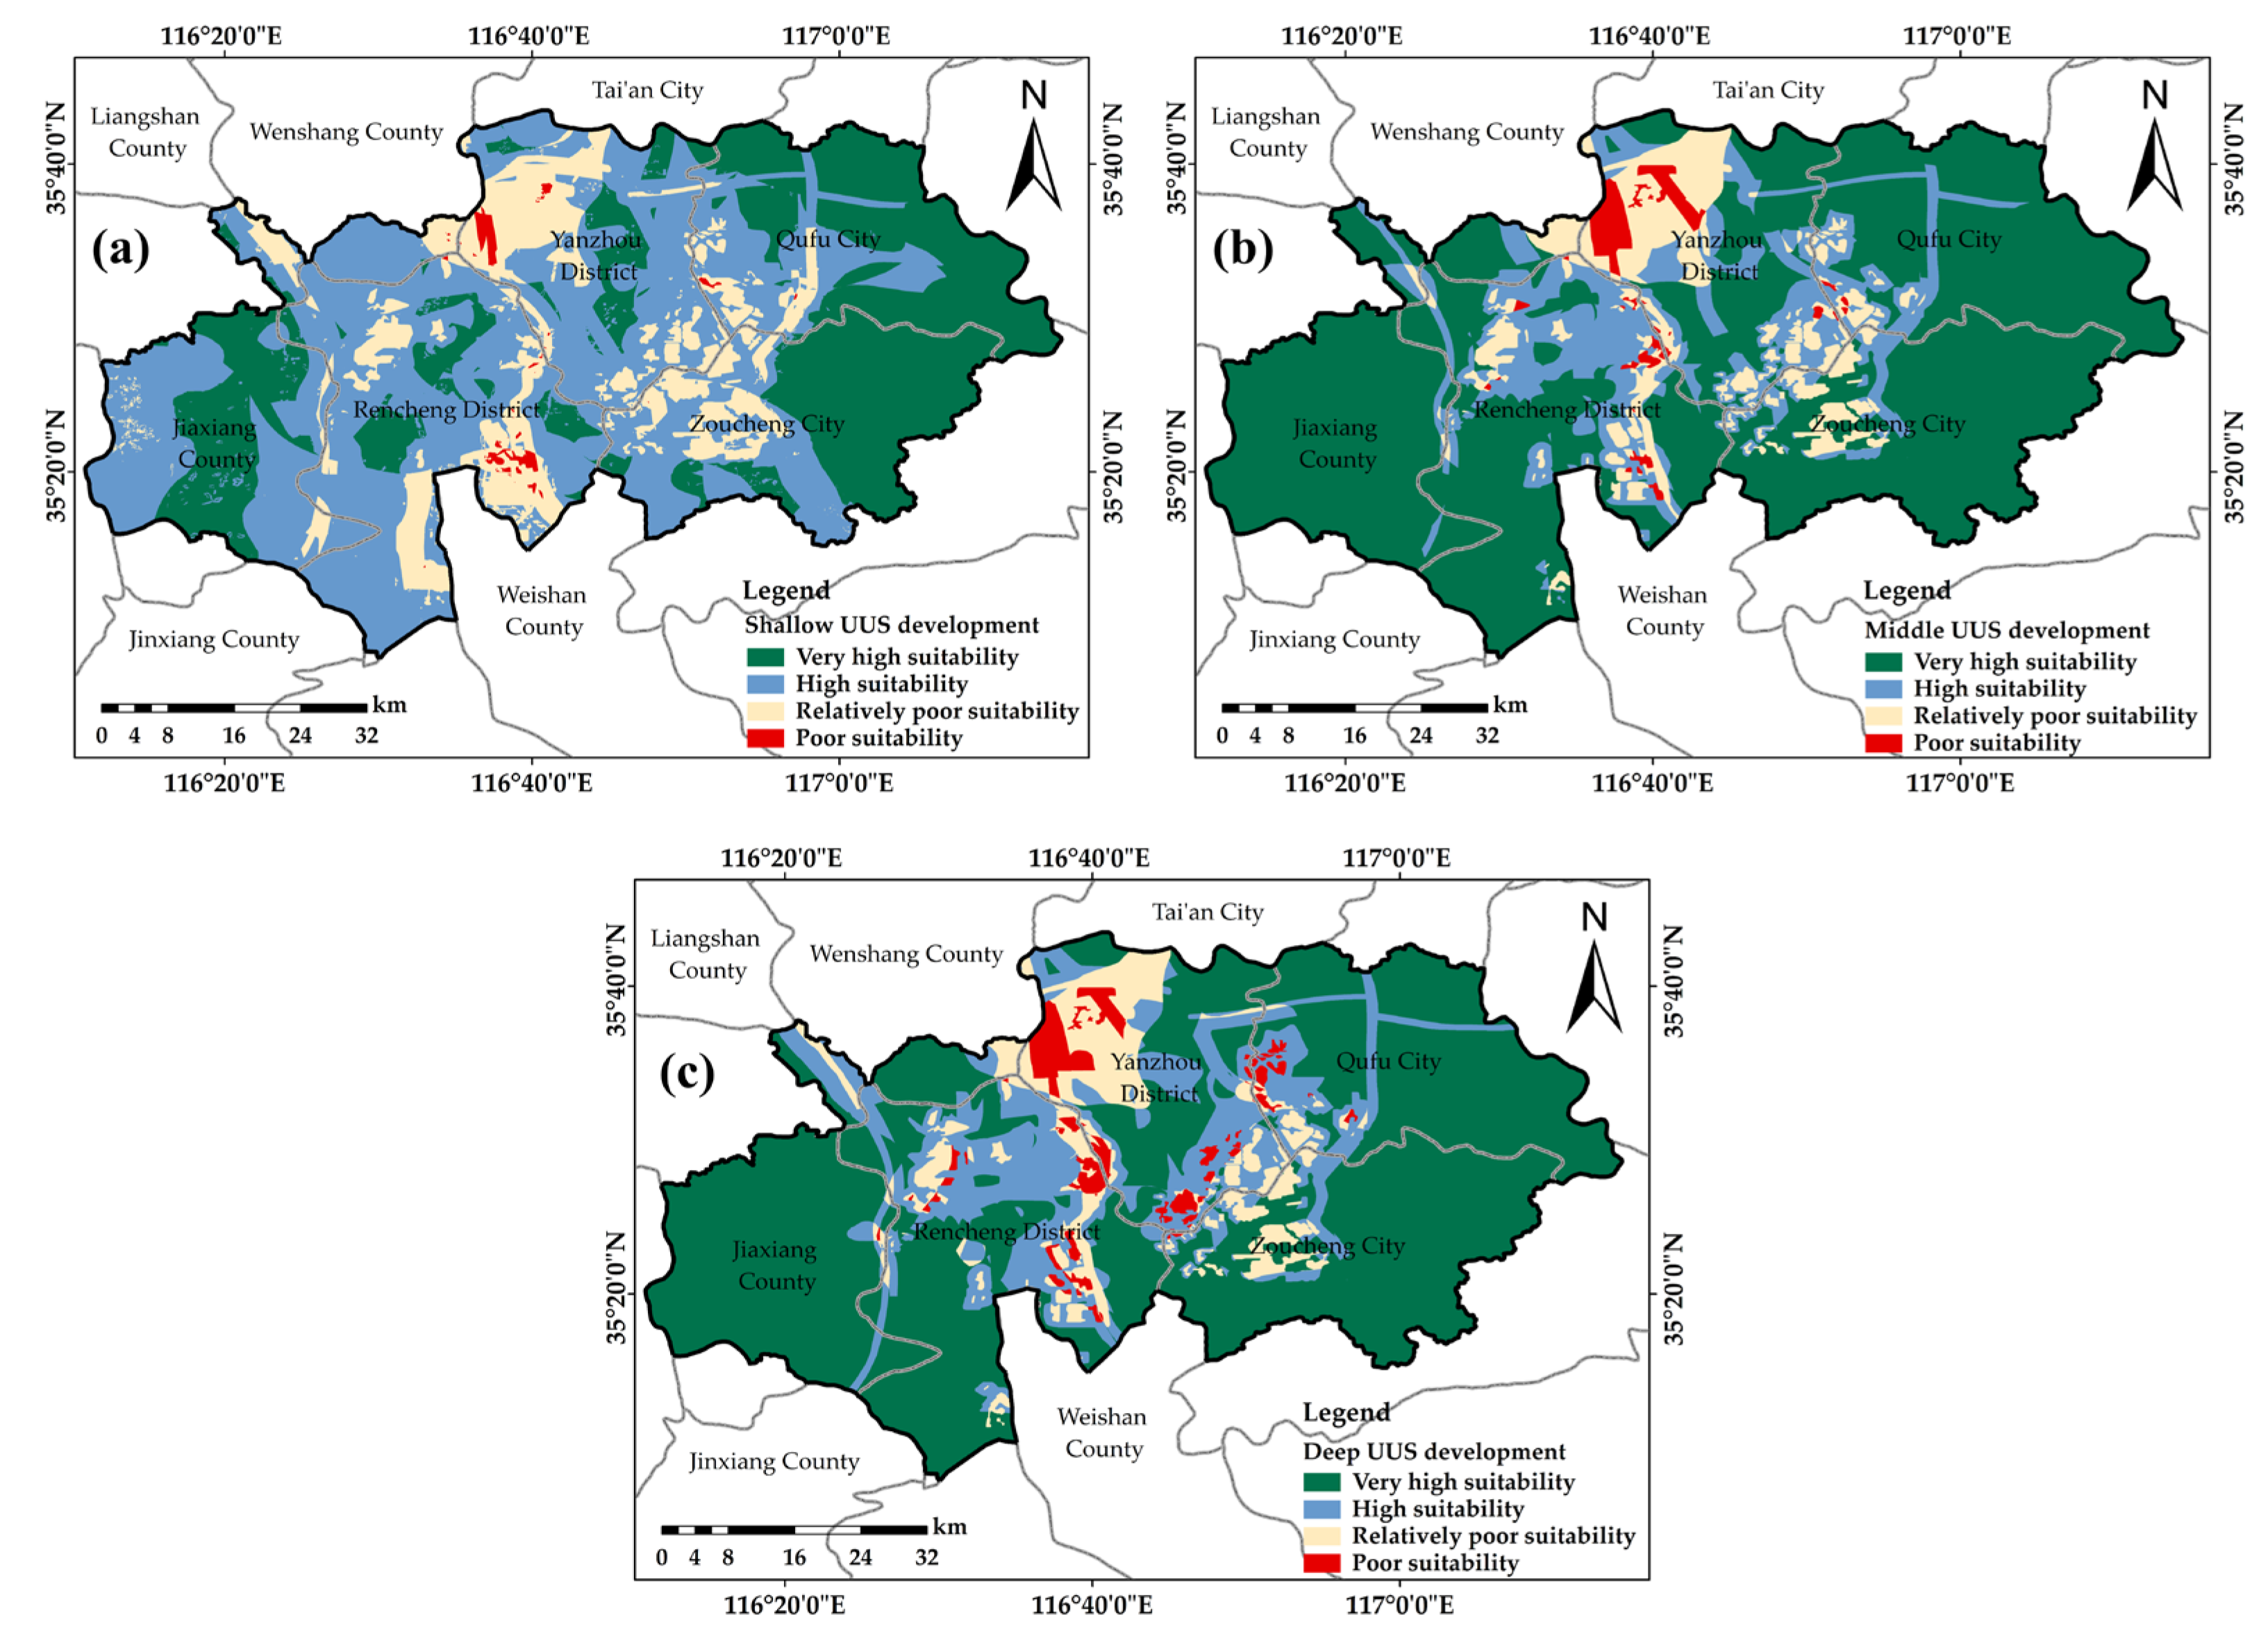
4.2. Maps of SEUUSD&U with Conditional Factors and Sensitive Factors
4.3. The Modified Framework of SEUUSD&U and Correlation with SDGs from a Management Perspective
4.4. Limitations and Future Research
5. Conclusions
Author Contributions
Funding
Data Availability Statement
Acknowledgments
Conflicts of Interest
Appendix A. The Process of AHP Method for Weight Determination

| Hierarchical Structure A | Hierarchical Structure B | Hierarchical Structure C |
|---|---|---|
| SEUUSD&U of JNPZ | Topography (B1) | Slope (C1) |
| Engineering geology (B2) | Crustal stability (C2) | |
| Land homogeneity (C3) | ||
| Rock and soil compressibility (C4) | ||
| PGA (C5) | ||
| Hydrogeology (B3) | Shallow groundwater depth (C6) | |
| Aquifer thickness (C7) | ||
| Aquifer water abundance (C8) | ||
| Groundwater corrosiveness (C9) | ||
| Natural disasters (B4) | Mining subsidence (C10) | |
| Ground subsidence (C11) |
| A | B1 | B2 | B3 | B4 | wi |
|---|---|---|---|---|---|
| B1 | 1 | 1/4 | 1/5 | 1/4 | 0.0688 |
| B2 | 4 | 1 | 1/2 | 2 | 0.2908 |
| B3 | 5 | 2 | 1 | 2 | 0.4348 |
| B4 | 4 | 1/2 | 1/2 | 1 | 0.2056 |
| CR = 0.0331 | |||||
| B2 | C2 | C3 | C4 | C5 | wi |
|---|---|---|---|---|---|
| C2 | 1 | 2 | 2 | 1 | 0.3407 |
| C3 | 1/2 | 1 | 1/2 | 1 | 0.1703 |
| C4 | 1/2 | 2 | 1 | 2 | 0.2865 |
| C5 | 1 | 1 | 1/2 | 1 | 0.2026 |
| CR = 0.0688 | |||||
| B3 | C6 | C7 | C8 | C9 | wi |
|---|---|---|---|---|---|
| C6 | 1 | 2 | 1/2 | 1 | 0.1416 |
| C7 | 1/2 | 1 | 1/3 | 1/2 | 0.3369 |
| C8 | 2 | 3 | 1 | 1 | 0.2832 |
| C9 | 1 | 2 | 1 | 1 | 0.2383 |
| CR = 0.0171 | |||||
| B4 | C10 | C11 | wi |
|---|---|---|---|
| C10 | 1 | 3 | 0.75 |
| C11 | 1/3 | 1 | 0.25 |
| CR = 0 | |||
| B2 | C2 | C5 | C7 | C8 | C10 | C11 | wi |
|---|---|---|---|---|---|---|---|
| C2 | 1 | 2 | 1 | 1/2 | 1/2 | 1 | 0.1334 |
| C5 | 1/2 | 1 | 1/3 | 1/3 | 1/3 | 1/2 | 0.0686 |
| C7 | 1 | 3 | 1 | 1/2 | 1/2 | 2 | 0.1603 |
| C8 | 2 | 3 | 2 | 1 | 1 | 2 | 0.2544 |
| C10 | 2 | 3 | 2 | 1 | 1 | 2 | 0.2722 |
| C11 | 1 | 2 | 1/2 | 1/2 | 1/3 | 1 | 0.1111 |
| CR = 0.0147 | |||||||
| Conditional Factors | Shallow UUS | Middle and Deep UUS |
|---|---|---|
| C1 | 0.0688 | - |
| C2 | 0.0991 | 0.1334 |
| C3 | 0.0495 | - |
| C4 | 0.0833 | - |
| C5 | 0.0589 | 0.0686 |
| C6 | 0.1013 | - |
| C7 | 0.0544 | 0.1603 |
| C8 | 0.1586 | 0.2544 |
| C9 | 0.1205 | - |
| C10 | 0.1542 | 0.2722 |
| C11 | 0.0514 | 0.1111 |
Appendix B. The Procedures of Weight Adjustment by VWT
| Assessment Unit | |||||||||||
|---|---|---|---|---|---|---|---|---|---|---|---|
| 1 | 1 | 0.4 | 0.1 | 0.1 | 0.55 | 0.1 | 0.1 | 0.1 | 0.4 | 0.1 | 0.4 |
| 2 | 1 | 1 | 1 | 0.4 | 0.55 | 0.7 | 0.1 | 0.4 | 0.4 | 0.1 | 0.4 |
| 3 | 0.55 | 0.7 | 0.1 | 1 | 0.1 | 1 | 0.1 | 0.4 | 0.4 | 0.1 | 0.4 |
| 4 | 0.1 | 0.1 | 1 | 1 | 0.1 | 0.7 | 0.1 | 0.1 | 0.1 | 0.1 | 0.4 |
| 5 | 0.1 | 0.1 | 0.55 | 0.1 | 0.55 | 0.1 | 0.1 | 0.1 | 0.1 | 0.1 | 0.1 |
| 6 | 0.1 | 0.1 | 0.55 | 0.7 | 0.1 | 1 | 0.1 | 0.1 | 0.1 | 1 | 0.4 |
| 7 | 0.55 | 0.7 | 1 | 1 | 0.1 | 1 | 0.1 | 0.4 | 0.1 | 1 | 0.4 |
| 8 | 1 | 0.1 | 1 | 0.4 | 0.55 | 0.7 | 0.1 | 0.7 | 0.1 | 1 | 0.4 |
| 9 | 0.1 | 0.4 | 1 | 1 | 0.1 | 0.7 | 0.1 | 0.1 | 0.1 | 0.1 | 0.4 |
| … | … | … | … | … | … | … | … | … | … | … | … |
| … | … | … | … | … | … | … | … | … | … | … | … |
| 5295 | 0.1 | 0.1 | 0.55 | 0.7 | 0.55 | 0.1 | 0.1 | 0.4 | 0.1 | 0.1 | 0.4 |
| 5296 | 1 | 0.1 | 0.55 | 0.7 | 0.55 | 0.1 | 0.1 | 0.1 | 0.4 | 0.1 | 0.1 |
| 5297 | 0.55 | 0.1 | 0.1 | 1 | 0.1 | 1 | 0.1 | 0.1 | 0.4 | 0.1 | 0.1 |
| 5298 | 0.1 | 0.1 | 1 | 1 | 0.55 | 0.4 | 0.1 | 0.4 | 0.4 | 0.1 | 0.4 |
| 5299 | 0.55 | 0.1 | 1 | 1 | 0.55 | 0.4 | 0.1 | 0.7 | 0.1 | 0.1 | 0.4 |
| 5300 | 0.55 | 0.4 | 1 | 0.4 | 0.55 | 0.7 | 0.1 | 0.7 | 0.1 | 0.4 | 0.4 |
| 5301 | 1 | 0.1 | 0.1 | 1 | 0.1 | 1 | 0.1 | 0.1 | 0.1 | 0.1 | 0.1 |
| 5302 | 0.1 | 0.7 | 1 | 1 | 0.1 | 0.7 | 0.1 | 0.1 | 0.1 | 0.1 | 0.4 |
| 5303 | 0.1 | 0.7 | 0.55 | 0.7 | 0.1 | 1 | 0.1 | 0.4 | 0.4 | 0.7 | 0.1 |
| Assessment Unit | |||||||||||
|---|---|---|---|---|---|---|---|---|---|---|---|
| 1 | 0.1641 | 0.0681 | 0.0441 | 0.0976 | 0.0338 | 0.1040 | 0.0558 | 0.1628 | 0.0780 | 0.1583 | 0.0333 |
| 2 | 0.0676 | 0.2402 | 0.0982 | 0.0589 | 0.0324 | 0.0932 | 0.0534 | 0.0982 | 0.0746 | 0.1515 | 0.0318 |
| 3 | 0.0430 | 0.0888 | 0.0387 | 0.1991 | 0.0428 | 0.2121 | 0.0490 | 0.0901 | 0.0684 | 0.1389 | 0.0292 |
| 4 | 0.0594 | 0.0909 | 0.0863 | 0.1909 | 0.0410 | 0.0820 | 0.0470 | 0.1370 | 0.1041 | 0.1332 | 0.0280 |
| 5 | 0.0708 | 0.1082 | 0.0307 | 0.0978 | 0.0339 | 0.1042 | 0.0559 | 0.1631 | 0.1239 | 0.1586 | 0.0529 |
| 6 | 0.0529 | 0.0809 | 0.0229 | 0.0685 | 0.0365 | 0.1811 | 0.0418 | 0.1220 | 0.0927 | 0.2757 | 0.0249 |
| 7 | 0.0337 | 0.0696 | 0.0706 | 0.1561 | 0.0335 | 0.1663 | 0.0384 | 0.0706 | 0.0851 | 0.2531 | 0.0229 |
| 8 | 0.0585 | 0.0894 | 0.0850 | 0.0510 | 0.0280 | 0.0807 | 0.0463 | 0.1263 | 0.1025 | 0.3047 | 0.0276 |
| 9 | 0.0615 | 0.0593 | 0.0893 | 0.1976 | 0.0425 | 0.0848 | 0.0486 | 0.1418 | 0.1077 | 0.1378 | 0.0290 |
| … | … | … | … | … | … | … | … | … | … | … | … |
| … | … | … | … | … | … | … | … | … | … | … | … |
| 5295 | 0.0774 | 0.1184 | 0.0336 | 0.1003 | 0.0371 | 0.1140 | 0.0612 | 0.1125 | 0.1356 | 0.1735 | 0.0365 |
| 5296 | 0.1579 | 0.1039 | 0.0294 | 0.0880 | 0.0325 | 0.1000 | 0.0537 | 0.1566 | 0.0750 | 0.1522 | 0.0507 |
| 5297 | 0.0399 | 0.0881 | 0.0360 | 0.1850 | 0.0398 | 0.1971 | 0.0455 | 0.1328 | 0.0636 | 0.1291 | 0.0430 |
| 5298 | 0.0682 | 0.1043 | 0.0991 | 0.2191 | 0.0327 | 0.0633 | 0.0539 | 0.0991 | 0.0753 | 0.1528 | 0.0321 |
| 5299 | 0.0442 | 0.0973 | 0.0925 | 0.2045 | 0.0305 | 0.0591 | 0.0503 | 0.1375 | 0.1115 | 0.1427 | 0.0300 |
| 5300 | 0.0558 | 0.0776 | 0.1169 | 0.0701 | 0.0385 | 0.1110 | 0.0636 | 0.1738 | 0.1409 | 0.1137 | 0.0379 |
| 5301 | 0.1183 | 0.0779 | 0.0318 | 0.1636 | 0.0352 | 0.1743 | 0.0403 | 0.1174 | 0.0892 | 0.1141 | 0.0380 |
| 5302 | 0.0598 | 0.0856 | 0.0868 | 0.1921 | 0.0412 | 0.0825 | 0.0473 | 0.1378 | 0.1047 | 0.1340 | 0.0282 |
| 5303 | 0.0691 | 0.0990 | 0.0300 | 0.0895 | 0.0477 | 0.2365 | 0.0546 | 0.1005 | 0.0763 | 0.1451 | 0.0516 |
| Assessment Unit | ||||||||||||
|---|---|---|---|---|---|---|---|---|---|---|---|---|
| 1 | 1 | 0.55 | 0.4 | 1 | 1 | 0.4 | 0.0846 | 0.0302 | 0.0641 | 0.3752 | 0.4014 | 0.0445 |
| 2 | 1 | 0.1 | 0.7 | 0.7 | 0.4 | 0.4 | 0.3073 | 0.0680 | 0.1489 | 0.2362 | 0.1701 | 0.0694 |
| 3 | 0.1 | 0.1 | 0.4 | 1 | 0.4 | 0.4 | 0.1174 | 0.0604 | 0.0890 | 0.5205 | 0.1511 | 0.0617 |
| 4 | 0.4 | 0.1 | 1 | 0.1 | 0.1 | 0.4 | 0.0709 | 0.0578 | 0.0851 | 0.4980 | 0.2292 | 0.0590 |
| 5 | 0.7 | 0.1 | 0.1 | 1 | 0.1 | 0.4 | 0.0971 | 0.0533 | 0.1245 | 0.4593 | 0.2114 | 0.054 |
| 6 | 0.4 | 0.1 | 0.7 | 0.4 | 0.7 | 1 | 0.1030 | 0.0840 | 0.1838 | 0.2917 | 0.2101 | 0.1274 |
| 7 | 0.1 | 0.1 | 0.1 | 0.1 | 1 | 0.1 | 0.0981 | 0.0504 | 0.1178 | 0.1870 | 0.4650 | 0.0817 |
| 8 | 0.4 | 0.1 | 0.4 | 0.7 | 0.4 | 0.7 | 0.1096 | 0.0893 | 0.1316 | 0.3104 | 0.2235 | 0.1356 |
| 9 | 0.7 | 0.55 | 0.1 | 0.4 | 0.7 | 0.4 | 0.1527 | 0.0581 | 0.1959 | 0.1960 | 0.3116 | 0.0856 |
| … | … | … | … | … | … | … | … | … | … | … | … | … |
| … | … | … | … | … | … | … | … | … | … | … | … | … |
| 580 | 1 | 0.55 | 0.1 | 0.1 | 0.4 | 0.4 | 0.3058 | 0.0469 | 0.1581 | 0.2509 | 0.1693 | 0.0691 |
| 581 | 0.1 | 0.1 | 0.1 | 0.7 | 0.7 | 0.4 | 0.1441 | 0.0741 | 0.1732 | 0.2575 | 0.2755 | 0.0757 |
| 582 | 1 | 0.55 | 0.1 | 0.4 | 0.1 | 0.1 | 0.2921 | 0.0448 | 0.1510 | 0.1511 | 0.2564 | 0.1046 |
| 583 | 0.7 | 0.1 | 0.1 | 0.1 | 0.7 | 0.4 | 0.1339 | 0.0735 | 0.1717 | 0.2726 | 0.2732 | 0.0751 |
| 584 | 0.7 | 0.1 | 0.1 | 0.7 | 0.1 | 0.4 | 0.1337 | 0.0734 | 0.1715 | 0.2551 | 0.2913 | 0.0750 |
| 585 | 0.1 | 0.55 | 0.7 | 0.4 | 0.1 | 0.4 | 0.1600 | 0.0571 | 0.1801 | 0.1924 | 0.3264 | 0.0840 |
| 586 | 0.7 | 0.1 | 0.1 | 0.1 | 0.4 | 0.4 | 0.1470 | 0.0807 | 0.1886 | 0.2993 | 0.2019 | 0.0824 |
| 587 | 0.4 | 0.55 | 0.1 | 0.4 | 0.1 | 0.1 | 0.1007 | 0.057 | 0.1918 | 0.1920 | 0.3257 | 0.1329 |
| 588 | 0.4 | 0.1 | 0.1 | 0.1 | 0.1 | 0.1 | 0.0885 | 0.0722 | 0.1686 | 0.2676 | 0.2863 | 0.1169 |
| Assessment Unit | ||||||||||||
|---|---|---|---|---|---|---|---|---|---|---|---|---|
| 1 | 0.4 | 0.55 | 0.4 | 1 | 1 | 0.4 | 0.0551 | 0.0312 | 0.0662 | 0.3873 | 0.4144 | 0.0459 |
| 2 | 1 | 0.1 | 0.4 | 0.7 | 1 | 0.4 | 0.2182 | 0.0483 | 0.0711 | 0.1678 | 0.4453 | 0.0493 |
| 3 | 1 | 0.55 | 0.4 | 1 | 0.4 | 0.4 | 0.2400 | 0.0368 | 0.0783 | 0.4578 | 0.1329 | 0.0542 |
| 4 | 0.7 | 0.55 | 0.7 | 1 | 0.4 | 0.4 | 0.1081 | 0.0412 | 0.1299 | 0.5116 | 0.1485 | 0.0606 |
| 5 | 1 | 0.1 | 1 | 0.4 | 0.4 | 0.4 | 0.2688 | 0.0595 | 0.3230 | 0.1391 | 0.1488 | 0.0607 |
| 6 | 0.4 | 0.55 | 0.1 | 0.7 | 1 | 0.4 | 0.0682 | 0.0386 | 0.1300 | 0.1933 | 0.5131 | 0.0568 |
| 7 | 0.1 | 0.55 | 1 | 1 | 0.1 | 0.4 | 0.0897 | 0.0320 | 0.2505 | 0.3976 | 0.1830 | 0.0471 |
| 8 | 1 | 0.1 | 0.4 | 0.7 | 0.4 | 0.4 | 0.3230 | 0.0715 | 0.1053 | 0.2483 | 0.1788 | 0.0730 |
| 9 | 0. | 0.55 | 0.4 | 0.7 | 0.7 | 0.4 | 0.1057 | 0.0598 | 0.1270 | 0.2993 | 0.3203 | 0.0880 |
| … | … | … | … | … | … | … | … | … | … | … | … | … |
| … | … | … | … | … | … | … | … | … | … | … | … | … |
| 676 | 1 | 0.55 | 0.1 | 0.4 | 0.4 | 0.1 | 0.3226 | 0.0495 | 0.1667 | 0.1669 | 0.1785 | 0.1155 |
| 677 | 0.7 | 0.1 | 0.7 | 0.7 | 0.4 | 0.4 | 0.1517 | 0.0833 | 0.1823 | 0.2893 | 0.2084 | 0.0850 |
| 678 | 1 | 0.55 | 0.1 | 0.4 | 0.1 | 0.4 | 0.3037 | 0.0466 | 0.1571 | 0.1572 | 0.2667 | 0.0686 |
| 679 | 0.7 | 0.55 | 0.4 | 0.7 | 0.1 | 0.4 | 0.1463 | 0.0557 | 0.1183 | 0.2790 | 0.3186 | 0.0820 |
| 680 | 0.4 | 0.1 | 0.4 | 0.4 | 0.4 | 0.7 | 0.1219 | 0.099 | 0.1465 | 0.2325 | 0.2488 | 0.1508 |
| 681 | 0.7 | 0.1 | 0.1 | 0.4 | 0.4 | 0.4 | 0.1653 | 0.0907 | 0.2120 | 0.2122 | 0.2270 | 0.0927 |
| 682 | 0.1 | 0.1 | 0.4 | 0.4 | 0.4 | 0.4 | 0.1892 | 0.0973 | 0.1433 | 0.2275 | 0.2434 | 0.3141 |
| 683 | 0.7 | 0.55 | 0.1 | 0.4 | 0.1 | 0.1 | 0.1426 | 0.0543 | 0.1829 | 0.1830 | 0.3105 | 0.1267 |
| 684 | 0.4 | 0.1 | 0.1 | 0.1 | 0.1 | 0.1 | 0.1334 | 0.0686 | 0.1603 | 0.2544 | 0.2722 | 0.1111 |
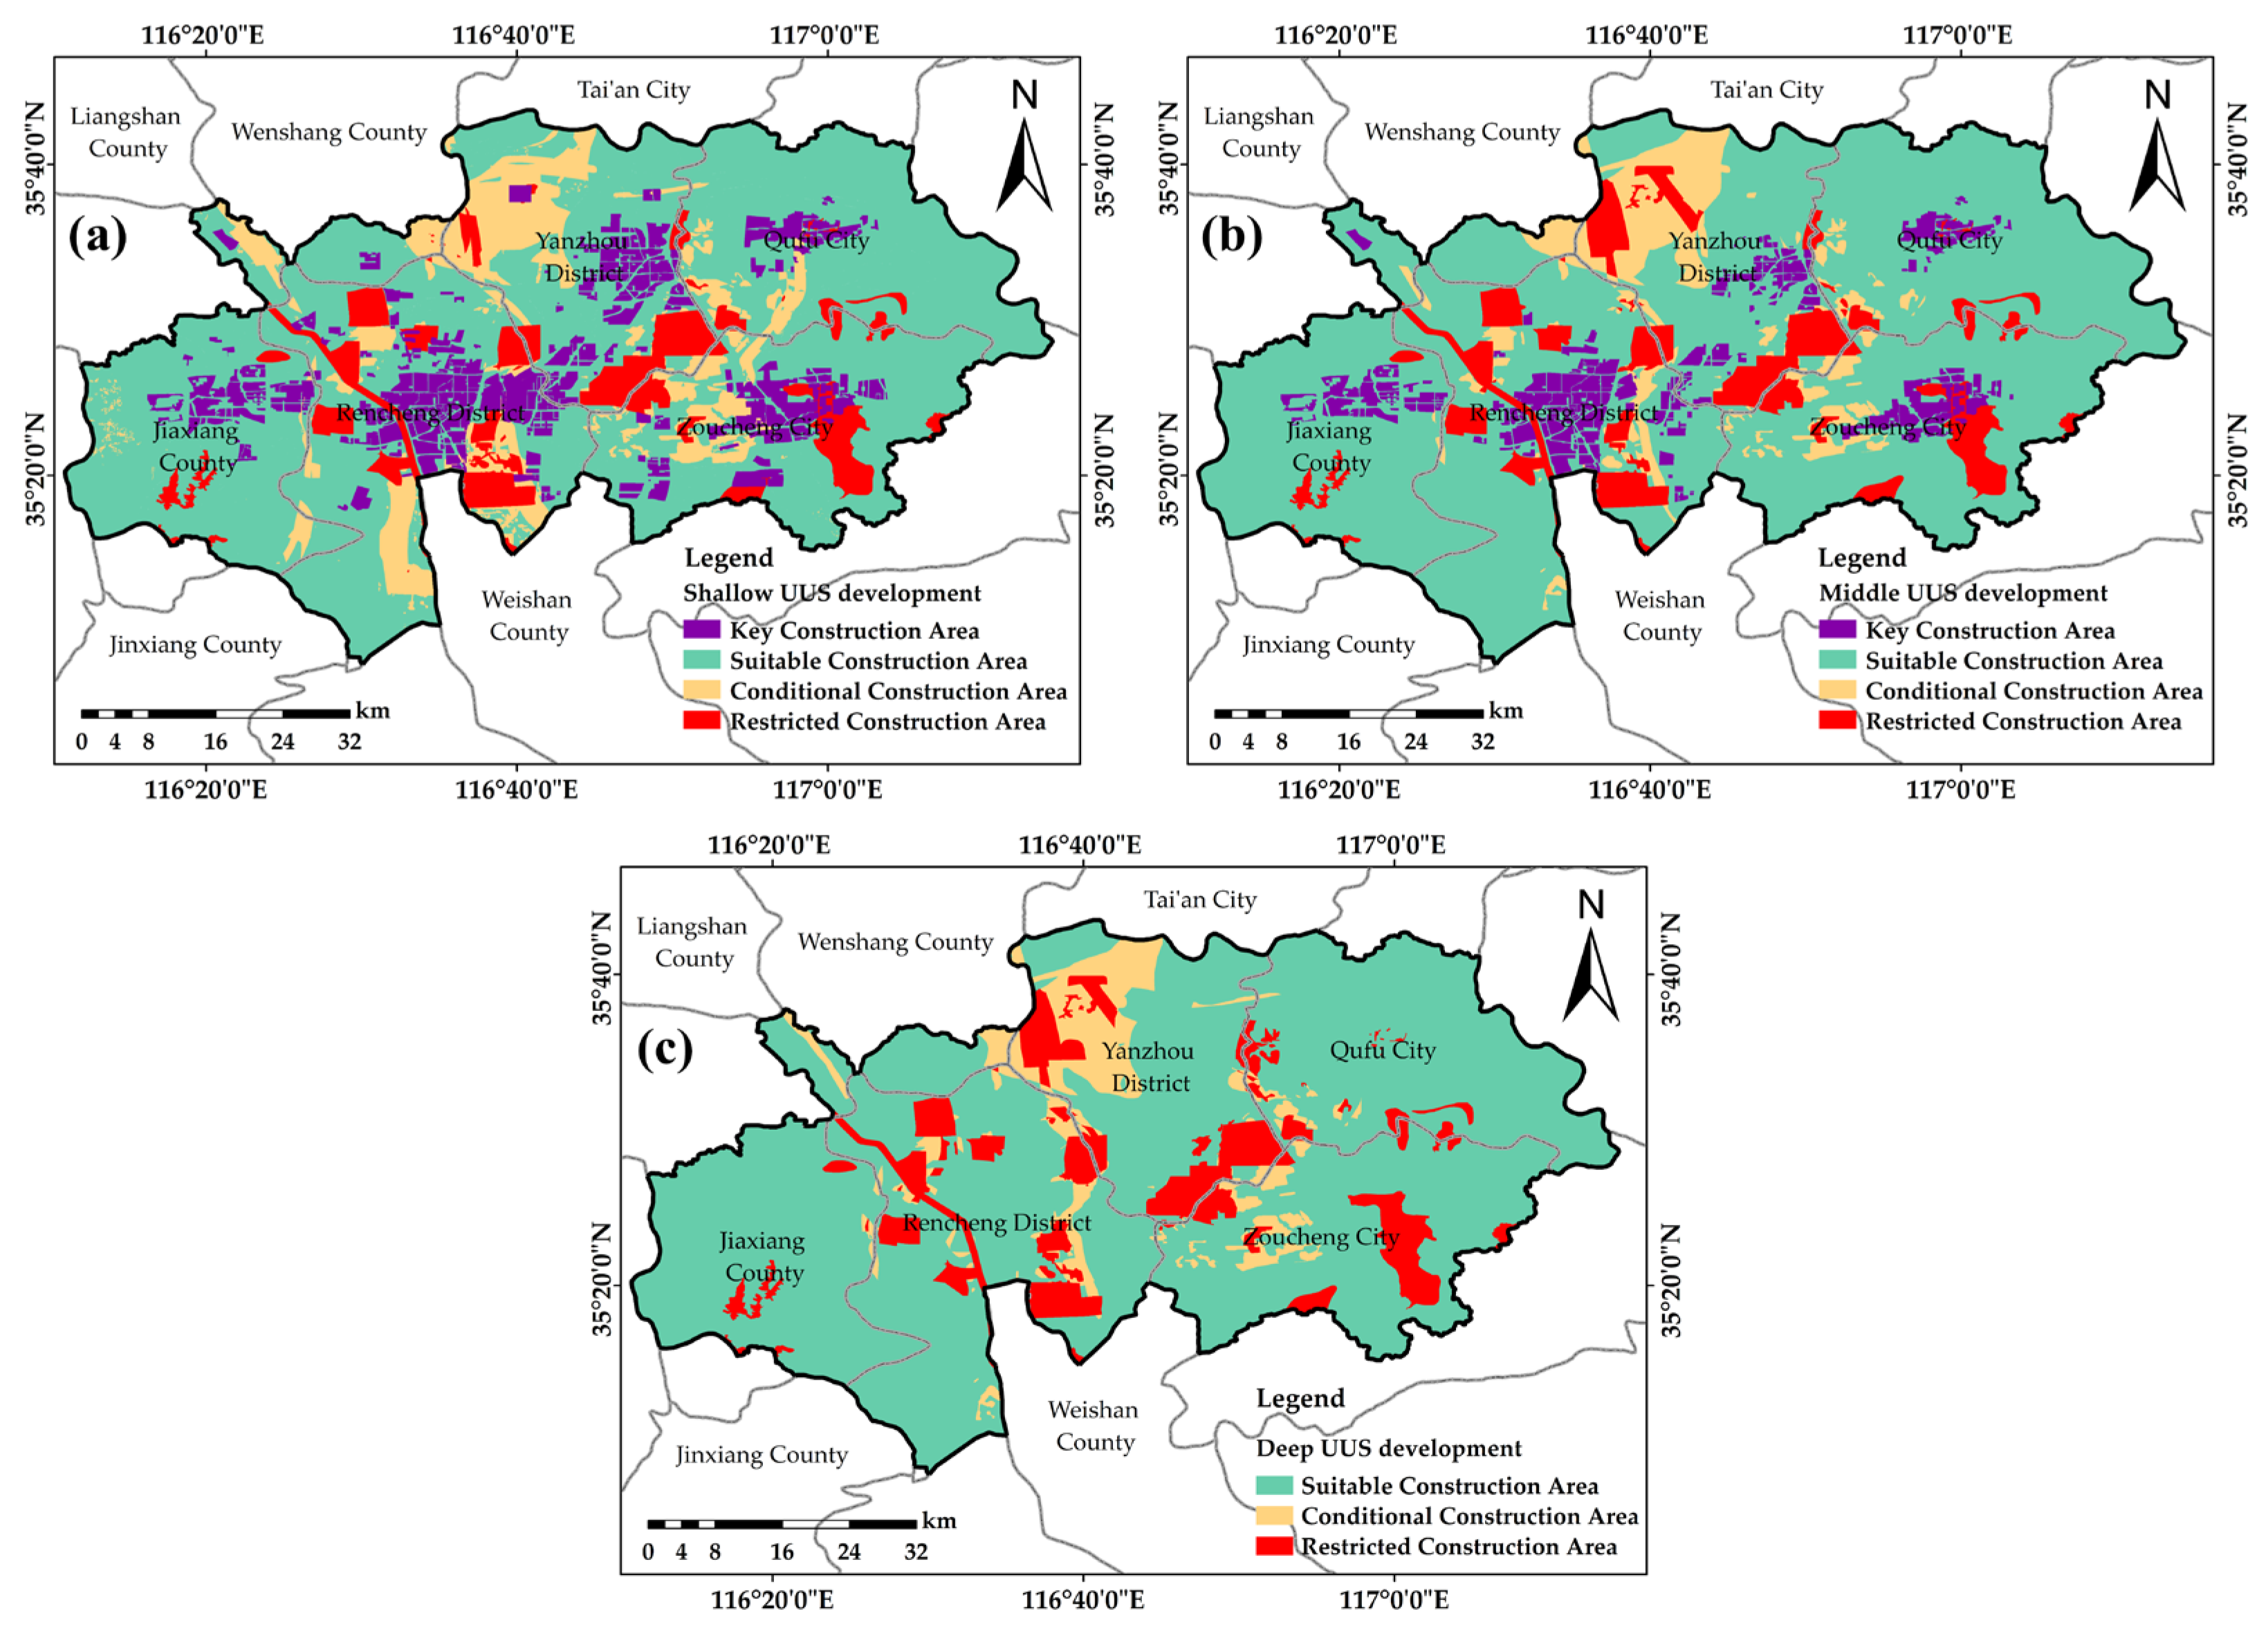
Appendix C. Detailed Development Strategies in the JNPZ
- Key construction area
- 2.
- Suitable construction area
- 3.
- Conditional construction area
- 4.
- Restricted construction area
Appendix D. The Jining City Development Map (2014–2030) and Groundwater Function Assessment Map for Model Verification


References
- Xuan, W. Fuzzy synthetic assessment of geo-engineering suitability for urban underground space. In International Conference on Applied Informatics and Communication; Springer: Berlin/Heidelberg, Germany, 2011; pp. 536–543. [Google Scholar]
- Xia, J.; Huang, G.-L.; Yan, S.-B. Behaviour and engineering implications of recent floodplain soft soil along lower reaches of the Yangtze River in Western Nanjing, China. Eng. Geol. 2006, 87, 48–59. [Google Scholar] [CrossRef]
- Bobylev, N. Mainstreaming sustainable development into a city’s Master plan: A case of Urban Underground Space use. Land Use Policy 2009, 26, 1128–1137. [Google Scholar] [CrossRef]
- McDonald, R.I.; Weber, K.; Padowski, J.; Flörke, M.; Schneider, C.; Green, P.A.; Gleeson, T.; Eckman, S.; Lehner, B.; Balk, D. Water on an urban planet: Urbanization and the reach of urban water infrastructure. Glob. Environ. Chang. 2014, 27, 96–105. [Google Scholar] [CrossRef]
- Luo, W.; Bai, H.; Jing, Q.; Liu, T.; Xu, H. Urbanization-induced ecological degradation in Midwestern China: An analysis based on an improved ecological footprint model. Resour. Conserv. Recycl. 2018, 137, 113–125. [Google Scholar] [CrossRef]
- Peng, J.; Peng, F.-L. A GIS-based evaluation method of underground space resources for urban spatial planning: Part 1 methodology. Tunn. Undergr. Space Technol. 2018, 74, 82–95. [Google Scholar] [CrossRef]
- Von der Tann, L.; Sterling, R.; Zhou, Y.; Metje, N. Systems approaches to urban underground space planning and management–A review. Undergr. Space 2020, 5, 144–166. [Google Scholar] [CrossRef]
- Kaliampakos, D.; Benardos, A.; Mavrikos, A. A review on the economics of underground space utilization. Tunn. Undergr. Space Technol. 2016, 55, 236–244. [Google Scholar] [CrossRef]
- Zhang, C.; Wang, F.; Bai, Q. Underground space utilization of coalmines in China: A review of underground water reservoir construction. Tunn. Undergr. Space Technol. 2021, 107, 103657. [Google Scholar] [CrossRef]
- Yang, C.; Wang, T.; Chen, H. Theoretical and technological challenges of deep underground energy storage in China. Engineering 2022, 25, 168–181. [Google Scholar] [CrossRef]
- Jin, J.G.; Shen, Y.; Hu, H.; Fan, Y.; Yu, M. Optimizing underground shelter location and mass pedestrian evacuation in urban community areas: A case study of Shanghai. Transp. Res. Part A Policy Pract. 2021, 149, 124–138. [Google Scholar] [CrossRef]
- Liu, S.-C.; Peng, F.-L.; Qiao, Y.-K.; Zhang, J.-B. Evaluating disaster prevention benefits of underground space from the perspective of urban resilience. Int. J. Disaster Risk Reduct. 2021, 58, 102206. [Google Scholar] [CrossRef]
- Paraskevopoulou, C.; Cornaro, A.; Admiraal, H.; Paraskevopoulou, A. Underground space and urban sustainability: An integrated approach to the city of the future. In Proceedings of the Changing Cities IV Spatial Design, Landscape and Socioeconomic Dimensions, Crete, Greece, 24–28 June 2019; pp. 24–29. [Google Scholar]
- Makana, L.; Jefferson, I.; Hunt, D.; Rogers, C. Assessment of the future resilience of sustainable urban sub-surface environments. Tunn. Undergr. Space Technol. 2016, 55, 21–31. [Google Scholar] [CrossRef]
- Li, X.; Li, C.; Parriaux, A.; Wu, W.; Li, H.; Sun, L.; Liu, C. Multiple resources and their sustainable development in Urban Underground Space. Tunn. Undergr. Space Technol. 2016, 55, 59–66. [Google Scholar] [CrossRef]
- Peng, Z.; Zhang, Y.; Tan, F.; Lv, J.; Li, L. Variable-weight suitability evaluation of underground space development considering socioeconomic factors. Sustainability 2023, 15, 3574. [Google Scholar] [CrossRef]
- Hao, M.; Ren, W.; Xia, W.; Fu, J.; Zhu, H.; Sun, P.; Wang, K.; Xu, M. Suitability Evaluation of Urban Underground Space Development: A Case Study of Qingdao City. Appl. Sci. 2024, 14, 6617. [Google Scholar] [CrossRef]
- Ni, X.; Li, J.; Xu, J.; Shen, Y.; Liu, X. Grey relation analysis and multiple criteria decision analysis method model for suitability evaluation of underground space development. Eng. Geol. 2024, 338, 107608. [Google Scholar] [CrossRef]
- Deng, F.; Pu, J.; Huang, Y.; Han, Q. 3D geological suitability evaluation for underground space based on the AHP-cloud model. Undergr. Space 2023, 8, 109–122. [Google Scholar] [CrossRef]
- Xu, Z.; Zhou, S.; Zhang, C.; Yang, M.; Jiang, M. A Bayesian network model for suitability evaluation of underground space development in urban areas: The case of Changsha, China. J. Clean. Prod. 2023, 418, 138135. [Google Scholar] [CrossRef]
- Monnikhof, R.; Edelenbos, J.; Van der Krogt, R. How to determine the necessity for using underground space: An integral assessment method for strategic decision-making. Tunn. Undergr. Space Technol. 1998, 13, 167–172. [Google Scholar] [CrossRef]
- Sterling, R.L. Planning for Underground Space, a Case Study for Minneapolis; Front Cover: New York, NY, USA, 1982. [Google Scholar]
- Boivin, D.J. Underground space use and planning in the Quebec City area. Tunn. Undergr. Space Technol. 1990, 5, 69–83. [Google Scholar] [CrossRef]
- Lu, Z.; Wu, L.; Zhuang, X.; Rabczuk, T. Quantitative assessment of engineering geological suitability for multilayer Urban Underground Space. Tunn. Undergr. Space Technol. 2016, 59, 65–76. [Google Scholar] [CrossRef]
- Zhang, M.-S.; Wang, H.-Q.; Dong, Y.; Li, L.; Sun, P.-P.; Zhang, G. Evaluation of urban underground space resources using a negative list method: Taking Xi’an City as an example in China. China Geol. 2020, 3, 124–136. [Google Scholar] [CrossRef]
- Liu, H.; Li, Z.; He, Q. Suitability Assessment of Multilayer Urban Underground Space Based on Entropy and CRITIC Combined Weighting Method: A Case Study in Xiong’an New Area, China. Appl. Sci. 2023, 13, 10231. [Google Scholar] [CrossRef]
- Zhang, Y.; Zhu, J.; Liao, Z.; Guo, J.; Xie, H.; Peng, Q. An intelligent planning model for the development and utilization of urban underground space with an application to the Luohu District in Shenzhen. Tunn. Undergr. Space Technol. 2021, 112, 103933. [Google Scholar] [CrossRef]
- Deng, F.; Cheng, T.; Huang, Y.; Chen, Z.; Han, Q. Evaluation of urban underground space via automated constraint identification and hybrid analysis. Tunn. Undergr. Space Technol. 2024, 153, 106005. [Google Scholar] [CrossRef]
- Dou, F.; Li, X.; Xing, H.; Yuan, F.; Ge, W. 3D geological suitability evaluation for urban underground space development–A case study of Qianjiang Newtown in Hangzhou, Eastern China. Tunn. Undergr. Space Technol. 2021, 115, 104052. [Google Scholar] [CrossRef]
- Zhang, X.; Wang, C.; Fan, J.; Wang, H.; Li, H. Optimizing the analytic hierarchy process through a suitability evaluation of underground space development in Tonghu District, Huizhou City. Energies 2020, 13, 742. [Google Scholar] [CrossRef]
- Wang, P.Z. Fuzzy Sets and Random Set Drop Shadows; Beijing Normal University Press: Beijing, China, 1985. [Google Scholar]
- Zhang, J.; Wu, Q.; Mu, W.; Du, Y.; Tu, K. Integrating the hierarchy-variable-weight model with collaboration-competition theory for assessing coal-floor water-inrush risk. Environ. Earth Sci. 2019, 78, 205. [Google Scholar] [CrossRef]
- Zhang, G.; Wang, E.; Zhang, C.; Li, Z.; Wang, D. A comprehensive risk assessment method for coal and gas outburst in underground coal mines based on variable weight theory and uncertainty analysis. Process Saf. Environ. Prot. 2022, 167, 97–111. [Google Scholar] [CrossRef]
- Wu, Q.; Zhao, D.; Wang, Y.; Shen, J.; Mu, W.; Liu, H. Method for assessing coal-floor water-inrush risk based on the variable-weight model and unascertained measure theory. Hydrogeol. J. 2017, 25, 2089. [Google Scholar] [CrossRef]
- Li, M.; Guo, Y.; Luo, D.; Ma, C. A Hybrid Variable Weight Theory Approach of Hierarchical Analysis and Multi-Layer Perceptron for Landslide Susceptibility Evaluation: A Case Study in Luanchuan County, China. Sustainability 2023, 15, 1908. [Google Scholar] [CrossRef]
- Zhang, Z.; Zhou, A.; Huang, P.; Yang, R.; Ma, C. Using AHP-VW model to evaluate the landslide susceptibility—A case study of Zigui County, Hubei Province, China. Arab. J. Geosci. 2021, 14, 2095. [Google Scholar] [CrossRef]
- Qiang, W.; Bo, L.; Yulong, C. Vulnerability assessment of groundwater inrush from underlying aquifers based on variable weight model and its application. Water Resour. Manag. 2016, 30, 3331–3345. [Google Scholar] [CrossRef]
- Chen, Y.; Xie, S.; Tian, Z. Risk assessment of buried gas pipelines based on improved cloud-variable weight theory. Reliab. Eng. Syst. Saf. 2022, 221, 108374. [Google Scholar] [CrossRef]
- Kang, Q.; Wang, Y.; Zhang, S.; Pu, C.; Zhang, C. Prediction of Stope Stability Using Variable Weight and Unascertained Measurement Technique. Geofluids 2021, 2021, 8821168. [Google Scholar] [CrossRef]
- Tu, W.; Li, L.; Shang, C.; Liu, S.; Zhu, Y. Comprehensive risk assessment and engineering application of mine water inrush based on normal cloud model and local variable weight. Energy Sources Part A Recovery Util. Environ. Eff. 2019, 46, 4298–4313. [Google Scholar] [CrossRef]
- Chen, H.; Tan, X.; Zhang, Y.; Hu, B.; Xu, S.; Dai, Z.; Zhang, Z.; Wang, Z.; Zhang, Y. study on groundwater function zoning and sustainable development and utilization in Jining City planning area. Sustainability 2023, 15, 12767. [Google Scholar] [CrossRef]
- Cui, H.; Ma, C.; Tan, X.; Chen, H.; Hu, B.; Xu, S.; Tan, X.; Zhang, Y. Evaluation of Jining mining subsidence susceptibility based on three multiple-criteria decision analysis methods. Geocarto Int. 2023, 38, 2248069. [Google Scholar] [CrossRef]
- Xu, Y.; Gong, H.; Chen, B.; Zhang, Q.; Li, Z. Long-term and seasonal variation in groundwater storage in the North China Plain based on GRACE. Int. J. Appl. Earth Obs. Geoinf. 2021, 104, 102560. [Google Scholar] [CrossRef]
- Liu, R.; Zhong, B.; Li, X.; Zheng, K.; Liang, H.; Cao, J.; Yan, X.; Lyu, H. Analysis of groundwater changes (2003–2020) in the North China Plain using geodetic measurements. J. Hydrol. Reg. Stud. 2022, 41, 101085. [Google Scholar] [CrossRef]
- Xue, Y.; Chen, H.; Kong, F.; Li, Z.; Qiu, D.; Chen, Q.; Yang, F.; Jiang, X. Land subsidence calculation model under the coupling effect of groundwater and coal mining. Earth Sci. Inform. 2022, 15, 2689–2701. [Google Scholar] [CrossRef]
- Wang, Z.; Ma, C.; Zhang, Y.; Hu, B.; Xu, S.; Dai, Z. Assessment of urban flooding vulnerability based on AHP-PSR model: A case study in Jining City, China. Geocarto Int. 2023, 38, 2252777. [Google Scholar] [CrossRef]
- Fu, H.; Chai, B.; Jin, C.; Kang, H.; Zhang, Y.; Tan, X.; Wang, W. Response and prediction of ecosystem service values to land use change resulting from underground coal mining in high groundwater table areas: A case study of Jining City, China. Environ. Sustain. Indic. 2024, 23, 100441. [Google Scholar] [CrossRef]
- GB/T 51358-2019; Standard for Urban Underground Space Planning. Ministry of Housing and Urban-Rural Development of the People’s Republic of China: Beijing, China, 2019.
- Tong, D.; Tan, F.; Ma, B.; Jiao, Y.-Y.; Wang, J. A suitability evaluation method of urban underground space based on rough set theory and conditional entropy: A case study in Wuhan Changjiang new town. Appl. Sci. 2022, 12, 1347. [Google Scholar] [CrossRef]
- Lai, Y.; Wang, Y.; Cheng, J.; Chen, X.; Liu, Q. Review of constraints and critical success factors of developing urban underground space. Undergr. Space 2023, 12, 137–155. [Google Scholar] [CrossRef]
- Zhou, L.; Dang, X.; Mu, H.; Wang, B.; Wang, S. Cities are going uphill: Slope gradient analysis of urban expansion and its driving factors in China. Sci. Total Environ. 2021, 775, 145836. [Google Scholar] [CrossRef]
- Shi, K.; Liu, G.; Zhou, L.; Cui, Y.; Liu, S.; Wu, Y. Satellite remote sensing data reveal increased slope climbing of urban land expansion worldwide. Landsc. Urban Plan. 2023, 235, 104755. [Google Scholar] [CrossRef]
- Tan, F.; Wang, J.; Jiao, Y.-Y.; Ma, B.; He, L. Suitability evaluation of underground space based on finite interval cloud model and genetic algorithm combination weighting. Tunn. Undergr. Space Technol. 2021, 108, 103743. [Google Scholar] [CrossRef]
- Yang, H.; Yang, X.; Zhan, Y.; Cunningham, D.; Zhao, L.; Sun, X.; Hu, Z.; Huang, X.; Huang, W.; Miao, S. Quaternary activity of the Beihewan Fault in the southeastern Beishan Wrench Belt, Western China: Implications for crustal stability and intraplate earthquake hazards North of Tibet. J. Geophys. Res. Solid Earth 2019, 124, 13286–13309. [Google Scholar] [CrossRef]
- Shuren, W.; Danggong, H.; Qingxuan, C.; Ruichun, X.; Yingtang, M. Assessment of the crustal stability in the Qingjiang river basin of the western Hubei Province and its peripheral area, China. In Engineering Geology; CRC Press: Boca Raton, FL, USA, 2021; pp. 375–385. [Google Scholar]
- Hou, W.; Yang, L.; Deng, D.; Ye, J.; Clarke, K.; Yang, Z.; Zhuang, W.; Liu, J.; Huang, J. Assessing quality of urban underground spaces by coupling 3D geological models: The case study of Foshan city, South China. Comput. Geosci. 2016, 89, 1–11. [Google Scholar] [CrossRef]
- DB41/T 2120-2021; Technical Specification for Evaluation of Geological Environment Suitability for Urban Underground Space Development. Administration for Market Regulation Henan Province: Zhengzhou, China, 2021.
- Xu, X.; Han, Z.; Yang, X.; Zhang, S.; Yu, G.; Zhou, B.; Li, F.; Ma, B.; Chen, G.; Ran, Y. Seismotectonic Map in China and Its Adjacent Regions; Seismological Press: Beijing, China, 2016. [Google Scholar]
- Song, C.; Zheng, H.J. Introduction to ASCE7 seismic design and the comparison with Chinese code GB 50011-2010. Appl. Mech. Mater. 2012, 238, 881–885. [Google Scholar] [CrossRef]
- Li, T.-C.; Lyu, L.-X.; Zhang, S.-L.; Sun, J.-C. Development and application of a statistical constitutive model of damaged rock affected by the load-bearing capacity of damaged elements. J. Zhejiang Univ.-Sci. A 2015, 16, 644–655. [Google Scholar] [CrossRef]
- Cai, M.; Kaiser, P. In-situ rock spalling strength near excavation boundaries. Rock Mech. Rock Eng. 2014, 47, 659–675. [Google Scholar] [CrossRef]
- GB 50011-2010; Code for Seismic Design of Buildings. Ministry of Housing and Urban-Rural Development of the People’s Republic of China: Beijing, China, 2016.
- Douglas, J. Earthquake ground motion estimation using strong-motion records: A review of equations for the estimation of peak ground acceleration and response spectral ordinates. Earth-Sci. Rev. 2003, 61, 43–104. [Google Scholar] [CrossRef]
- Jiang, J.; El Naggar, M.H.; Huang, W.; Xu, C.; Zhao, K.; Du, X. Seismic vulnerability analysis for shallow-buried underground frame structure considering 18 existing subway stations. Soil Dyn. Earthq. Eng. 2022, 162, 107479. [Google Scholar] [CrossRef]
- GB 18306-2015; Seimic Ground Motion Parameters Zonation Map of China. General Administration of Quality Supervision, Inspection and Quarantine of the People’s Republic of China: Beijing, China, 2015.
- Zhu, H.; Gao, X.; Lin, Y.; He, Y. Land-Development-Right Pricing Based on Spatial Characteristics in Urban Local Function Regeneration. Land 2022, 11, 2113. [Google Scholar] [CrossRef]
- Zeng, C.-F.; Chen, H.-B.; Liao, H.; Xue, X.-L.; Chen, Q.-N.; Diao, Y. Behaviours of groundwater and strata during dewatering of large-scale excavations with a nearby underground barrier. J. Hydrol. 2023, 620, 129400. [Google Scholar] [CrossRef]
- Wu, Y.-X.; Lyu, H.-M.; Shen, J.S.; Arulrajah, A. Geological and hydrogeological environment in Tianjin with potential geohazards and groundwater control during excavation. Environ. Earth Sci. 2018, 77, 392. [Google Scholar] [CrossRef]
- Wu, Q.; Liu, Y.; Luo, L.; Liu, S.; Sun, W.; Zeng, Y. Quantitative evaluation and prediction of water inrush vulnerability from aquifers overlying coal seams in Donghuantuo Coal Mine, China. Environ. Earth Sci. 2015, 74, 1429–1437. [Google Scholar] [CrossRef]
- Shi, L.; Qiu, M.; Wang, Y.; Qu, X.; Liu, T. Evaluation of water inrush from underlying aquifers by using a modified water-inrush coefficient model and water-inrush index model: A case study in Feicheng coalfield, China. Hydrogeol. J. 2019, 27, 2105–2119. [Google Scholar] [CrossRef]
- Meng, Z.; Li, G.; Xie, X. A geological assessment method of floor water inrush risk and its application. Eng. Geol. 2012, 143, 51–60. [Google Scholar] [CrossRef]
- Zeng, F.; Wu, K.; He, Q.; Diao, X.; Li, L. Model establishment for ponding in coal mining subsidence areas and its prediction: Case study of Northern Jining, China. Geotech. Geol. Eng. 2017, 35, 83–89. [Google Scholar] [CrossRef]
- Chen, H.; Xue, Y.; Qiu, D. Numerical simulation of the land subsidence induced by groundwater mining. Clust. Comput. 2023, 26, 3647–3656. [Google Scholar] [CrossRef]
- Feng, Q.-y.; Liu, G.-J.; Lei, M.; Fu, E.-J.; Zhang, H.-R.; Zhang, K.-F. Land subsidence induced by groundwater extraction and building damage level assessment—A case study of Datun, China. J. China Univ. Min. Technol. 2008, 18, 556–560. [Google Scholar] [CrossRef]
- Chen, M.; Tomás, R.; Li, Z.; Motagh, M.; Li, T.; Hu, L.; Gong, H.; Li, X.; Yu, J.; Gong, X. Imaging land subsidence induced by groundwater extraction in Beijing (China) using satellite radar interferometry. Remote Sens. 2016, 8, 468. [Google Scholar] [CrossRef]
- Saaty, T.L. A scaling method for priorities in hierarchical structures. J. Math. Psychol. 1977, 15, 234–281. [Google Scholar] [CrossRef]
- Franek, J.; Kresta, A. Judgment scales and consistency measure in AHP. Procedia Econ. Financ. 2014, 12, 164–173. [Google Scholar] [CrossRef]
- Wang, Z.; Xiong, H.; Zhang, F.; Ma, C. Integrated assessment of groundwater vulnerability in arid areas combining classical vulnerability index and AHP model. Environ. Sci. Pollut. Res. 2024, 31, 43822–43834. [Google Scholar] [CrossRef]
- Xiong, H.; Sun, Y.; Ren, X. Comprehensive assessment of water sensitive urban design practices based on multi-criteria decision analysis via a case study of the University of Melbourne, Australia. Water 2020, 12, 2885. [Google Scholar] [CrossRef]
- Chen, J.; Chen, Y.; Yang, S.; Zhong, X.; Han, X. A prediction model on rockburst intensity grade based on variable weight and matter-element extension. PLoS ONE 2019, 14, e0218525. [Google Scholar] [CrossRef]
- Jin, S.; Yan, T.; Deng, Z.; Zhang, W.; Liu, Y.; Meng, Y.; Liu, Y. Evaluation of Favorable Area for Coalbed Methane Development Based on Local Variable Weight Theory. ACS Omega 2024, 9, 17616–17625. [Google Scholar] [CrossRef] [PubMed]
- Mao, X.; Hu, A.; Wu, M.; Zhou, S.; Chen, X.; Li, Y. Evaluation of water inrush hazard in karst tunnel based on improved non-linear attribute variable weight recognition model. Appl. Sci. 2023, 13, 5026. [Google Scholar] [CrossRef]
- Zhang, Z.; Ma, C.; Zhang, D.; Ma, Y.; Huang, P. Assessment of Groundwater Sustainable Development Considering the Impact of Large-Scale Hydraulic Engineering: A Case Study of Zhengzhou City, China. Available online: https://papers.ssrn.com/sol3/papers.cfm?abstract_id=4044452 (accessed on 18 January 2025).
- Li, G.; Hu, Z.; Li, P.; Yuan, D.; Wang, W.; Han, J.; Yang, K. Optimal layout of underground coal mining with ground development or protection: A case study of Jining, China. Resour. Policy 2022, 76, 102639. [Google Scholar] [CrossRef]
- Li, Z.; Chen, Q.; Xue, Y.; Qiu, D.; Chen, H.; Kong, F.; Liu, Q. Numerical investigation of processes, features, and control of land subsidence caused by groundwater extraction and coal mining: A case study from eastern China. Environ. Earth Sci. 2023, 82, 82. [Google Scholar] [CrossRef]
- Xiao, W.; Wang, Z.; Zhang, R.; Li, S. The’golden ten years’: Underground coal mining and its impacts on land use and subsequent social problems: A case study on the Jining city region, China. Int. J. Min. Miner. Eng. 2017, 8, 19–34. [Google Scholar] [CrossRef]
- Colombo, L.; Gattinoni, P.; Scesi, L. Influence of underground structures and infrastructures on the groundwater level in the urban area of Milan, Italy. Int. J. Sustain. Dev. Plan. 2017, 12, 176–184. [Google Scholar] [CrossRef]
- Attanayake, P.M.; Waterman, M.K. Identifying environmental impacts of underground construction. Hydrogeol. J. 2006, 14, 1160–1170. [Google Scholar] [CrossRef]
- Attard, G.; Rossier, Y.; Winiarski, T.; Cuvillier, L.; Eisenlohr, L. Deterministic modelling of the cumulative impacts of underground structures on urban groundwater flow and the definition of a potential state of urban groundwater flow: Example of Lyon, France. Hydrogeol. J. 2016, 24, 1213. [Google Scholar] [CrossRef]
- Sun, W.; Han, F.; Zhang, Y.; Zhang, W.; Zhang, R.; Su, W. Experimental assessment of structural responses of tunnels under the groundwater level fluctuation. Tunn. Undergr. Space Technol. 2023, 137, 105138. [Google Scholar] [CrossRef]
- Yan, Y.; Sun, M.; Li, Y. Evaluating the suitability of underground space development based on social and economic factors. Urban Plan. Transp. Res. 2023, 11, 2233608. [Google Scholar] [CrossRef]
- Dou, F.; Xing, H.; Li, X.; Yuan, F.; Lu, Z.; Li, X.; Ge, W. 3D geological suitability evaluation for urban underground space development based on combined weighting and improved TOPSIS. Nat. Resour. Res. 2022, 31, 693–711. [Google Scholar] [CrossRef]
- Guo, X.; Gui, X.; Xiong, H.; Hu, X.; Li, Y.; Cui, H.; Qiu, Y.; Ma, C. Critical role of climate factors for groundwater potential mapping in arid regions: Insights from random forest, XGBoost, and LightGBM algorithms. J. Hydrol. 2023, 621, 129599. [Google Scholar] [CrossRef]
- Yang, S.; Tan, J.; Luo, D.; Wang, Y.; Guo, X.; Zhu, Q.; Ma, C.; Xiong, H. Sample size effects on landslide susceptibility models: A comparative study of heuristic, statistical, machine learning, deep learning and ensemble learning models with SHAP analysis. Comput. Geosci. 2024, 193, 105723. [Google Scholar] [CrossRef]
- Zhang, Z.; Ma, C.; Zhang, D.; Ma, Y.; Huang, P. Integrating the impact of large-scale hydraulic engineering with a sustainable groundwater development strategy: A case study of Zhengzhou City, China. Sci. Total Environ. 2022, 838, 156579. [Google Scholar] [CrossRef]
- Huang, P.; Wu, X.; Ma, C.; Zhou, A. Geo-Environment Vulnerability Assessment of Multiple Geohazards Using VWT-AHP: A Case Study of the Pearl River Delta, China. Remote Sens. 2023, 15, 5007. [Google Scholar] [CrossRef]
- Williams, B.K. Adaptive management of natural resources—Framework and issues. J. Environ. Manag. 2011, 92, 1346–1353. [Google Scholar] [CrossRef]
- Wang, Y.; Lv, W.; Xue, K.; Wang, S.; Zhang, L.; Hu, R.; Zeng, H.; Xu, X.; Li, Y.; Jiang, L. Grassland changes and adaptive management on the Qinghai–Tibetan Plateau. Nat. Rev. Earth Environ. 2022, 3, 668–683. [Google Scholar] [CrossRef]
- Basheer, M.; Nechifor, V.; Calzadilla, A.; Gebrechorkos, S.; Pritchard, D.; Forsythe, N.; Gonzalez, J.M.; Sheffield, J.; Fowler, H.J.; Harou, J.J. Cooperative adaptive management of the Nile River with climate and socio-economic uncertainties. Nat. Clim. Chang. 2023, 13, 48–57. [Google Scholar] [CrossRef]
- Xia, Z.; Yuan, C.; Gao, Y.; Shen, Z.; Liu, K.; Huang, Y.; Wei, X.; Liu, L. Integrating perceptions of ecosystem services in adaptive management of country parks: A case study in peri-urban Shanghai, China. Ecosyst. Serv. 2023, 60, 101522. [Google Scholar] [CrossRef]
- Lyra, A.; Loukas, A. Simulation and evaluation of water resources management scenarios under climate change for adaptive management of coastal agricultural watersheds. Water Resour. Manag. 2023, 37, 2625–2642. [Google Scholar] [CrossRef]
- Qiao, Y.-K.; Peng, F.-L.; Sabri, S.; Rajabifard, A. Socio-environmental costs of underground space use for urban sustainability. Sustain. Cities Soc. 2019, 51, 101757. [Google Scholar] [CrossRef]
- Peng, F.-L.; Qiao, Y.-K.; Sabri, S.; Atazadeh, B.; Rajabifard, A. A collaborative approach for urban underground space development toward sustainable development goals: Critical dimensions and future directions. Front. Struct. Civ. Eng. 2021, 15, 20–45. [Google Scholar] [CrossRef]
- Admiraal, H.; Cornaro, A. Why underground space should be included in urban planning policy–And how this will enhance an urban underground future. Tunn. Undergr. Space Technol. 2016, 55, 214–220. [Google Scholar] [CrossRef]

| Conditional Factors | Sources | Format | Period |
|---|---|---|---|
| Slope (C1) | China Geological Survey Geological Cloud Platform | Grid | 2022 |
| Crustal stability (C2) | Department of Natural Resources of Shandong Province, Jinan, China | Tiff | 2014 |
| Land homogeneity (C3) | Lunan Geological Engineering Survey Institute of Shandong Province (LGESI), Jining, China | Tiff | 2019 |
| Rock and soil compressibility (C4) | Lunan Geological Engineering Survey Institute of Shandong Province | Tiff | 2019 |
| PGA (C5) | No.801 Hydrogeology and Engineering Geological Brigade of Shandong Provincial Bureau of Geology and Mineral Resources, Guiyang, China | Tiff | 2017 |
| Shallow groundwater depth (C6) | Jining Urban and Rural Water Affairs Bureau, Jining, China | Tiff | 2021 |
| Aquifer thickness (C7) | Jining Survey Institute | Tiff | 2022 |
| Aquifer water abundance (C8) | LGESI, Jining, China | Tiff | 2019 |
| Groundwater corrosiveness (C9) | LGESI, Jining, China | Tiff | 2022 |
| Mining subsidence (C10) | LGESI, Jining, China | Tiff | 2021 |
| Ground subsidence (C11) | Jining Natural Resources and Planning Bureau, Jining, China; LGESI, Jining, China | Tiff | 2021 |
| Exposed Faults | Concealed Faults (m) | Crustal Stability | ||
|---|---|---|---|---|
| Major Faults (m) | Other Faults (Near Unfavorable Areas) (m) | Other Faults (m) | ||
| 0–500 | 0–300 | 0–200 | / | High |
| 500–1000 | 300–1000 | 200–1000 | / | Relatively high |
| 1000–2000 | 1000–2000 | 1000–2000 | 0–1000 | Relatively low |
| >2000 | >2000 | >2000 | >1000 | Low |
| Shear Wave Velocity (m/s) | Soil Types | (kPa) | Rock and Soil Characteristics | Compressibility Rating |
|---|---|---|---|---|
| ≤ 150 | Soft soil | ≤ 130 | Silt and silty soils, newly deposited cohesive and silt soils, plastic loess | High |
| 150 < ≤ 250 | Medium-soft soil | 130 < ≤ 160 | Loose fine, silt, plastic silt | Moderate |
| 160 < ≤ 200 | Slightly dense coarse and medium sand, fine and silty sand except loose, plastic loess | Low | ||
| > 250 | Medium-hard soil (including bedrock) | > 200 | Bedrock, gravel soil, dense, medium-dense gravel, coarse, medium sand, cohesive soil and silt, hard loess | Extremely low |
| Conditional Factors | Classification Criteria | |||
|---|---|---|---|---|
| Good | Poor | |||
| Crustal stability | High | Relatively high | Relatively low | Low |
| Rock and soil compressibility | Extremely low | Low | Moderate | High |
| Shallow groundwater depth | Deep | Moderate | Shallow | Extremely shallow |
| Aquifer thickness | Low | Moderate | High | Extremely high |
| Aquifer water abundance | <1000 m3/d | 1000–3000 m3/d | 3000–5000 m3/d | >5000 m3/d |
| Groundwater corrosiveness | Extremely low | Low | Moderate | High |
| Mining subsidence | Very low possibility | Low possibility | Moderate possibility | High possibility |
| Ground subsidence | Stable | Slow speed | Medium speed | High speed |
| Score (xi) | 0.1 | 0.4 | 0.7 | 1 |
| Slope | <5° | 5–15° | >15° | |
| PGA | <0.1 g | 0.1–0.15 g | >0.15 g | |
| Land homogeneity | High | Moderate | Low | |
| Score (xi) | 0.1 | 0.55 | 1 | |
| 1 | 2 | 3 | 4 | 5 | 6 | 7 | 8 | 9 | 10 | |
|---|---|---|---|---|---|---|---|---|---|---|
| 0 | 0 | 0.52 | 0.89 | 1.12 | 1.26 | 1.36 | 1.41 | 1.46 | 1.49 |
| Conditional Factors | AHP Model | AHP-VWT Model | |||
|---|---|---|---|---|---|
| Shallow UUS | Middle and Deep UUS | Shallow UUS | Middle UUS | Deep UUS | |
| C1 | 0.0688 | - | 0.0691 | - | - |
| C2 | 0.0991 | 0.1334 | 0.0990 | 0.0885 | 0.1426 |
| C3 | 0.0495 | - | 0.0300 | - | - |
| C4 | 0.0833 | - | 0.0895 | - | - |
| C5 | 0.0589 | 0.0686 | 0.0477 | 0.0722 | 0.0543 |
| C6 | 0.1013 | - | 0.2365 | - | - |
| C7 | 0.0544 | 0.1603 | 0.0546 | 0.1686 | 0.1829 |
| C8 | 0.1586 | 0.2544 | 0.1005 | 0.2676 | 0.1830 |
| C9 | 0.1205 | - | 0.0763 | - | - |
| C10 | 0.1542 | 0.2722 | 0.1451 | 0.2863 | 0.3105 |
| C11 | 0.0514 | 0.1111 | 0.0516 | 0.1169 | 0.1267 |
| UUS Suitability | Very High | High | Relatively Poor | Poor | |
|---|---|---|---|---|---|
| Shallow | Area (km2) | 1171.96 | 1825.36 | 543.54 | 20.43 |
| Proportion (%) | 32.91 | 51.26 | 15.26 | 0.57 | |
| Middle | Area (km2) | 2541.59 | 596.91 | 360.34 | 62.45 |
| Proportion (%) | 71.37 | 16.76 | 10.12 | 1.75 | |
| Deep | Area (km2) | 2428.54 | 685.84 | 339.56 | 107.35 |
| Proportion (%) | 68.20 | 19.26 | 9.53 | 3.01 | |
| No. | Goals | Interpretation |
|---|---|---|
| SDG 1 | No Poverty | Contributes by enabling cost-effective underground infrastructure development, providing affordable housing and essential services, reducing urban inequality. |
| SDG 6 | Clean Water and Sanitation | Proper evaluation ensures groundwater protection during the D&U of UUS, minimizing water contamination and enhancing access to clean water. |
| SDG 9 | Industry, Innovation, and Infrastructure | Supports sustainable infrastructure projects, integrating innovative underground space solutions to enhance urban functionality and resilience. |
| SDG 11 | Sustainable Cities and Communities | Links UUS development with sustainable urban planning, reducing surface space congestion, and fostering inclusive and resilient cities. |
| SDG 13 | Climate Action | Encourages climate-resilient underground projects, mitigating heat islands, and protecting urban areas from extreme weather impacts. |
| SDG 15 | Life on Land | Protects ecosystems by restricting UUS development in sensitive ecological zones, promoting harmony between urban growth and natural landscapes. |
Disclaimer/Publisher’s Note: The statements, opinions and data contained in all publications are solely those of the individual author(s) and contributor(s) and not of MDPI and/or the editor(s). MDPI and/or the editor(s) disclaim responsibility for any injury to people or property resulting from any ideas, methods, instructions or products referred to in the content. |
© 2025 by the authors. Licensee MDPI, Basel, Switzerland. This article is an open access article distributed under the terms and conditions of the Creative Commons Attribution (CC BY) license (https://creativecommons.org/licenses/by/4.0/).
Share and Cite
Chen, H.; Tan, X.; Zhang, Y.; Hu, B.; Xu, S.; Dai, Z.; Zhang, Z.; Xiong, H.; Song, X.; Luo, D. The Application of Variable Weight Theory on the Suitability Evaluation of Urban Underground Space Development and Utilization for Urban Resilience and Sustainability. Buildings 2025, 15, 387. https://doi.org/10.3390/buildings15030387
Chen H, Tan X, Zhang Y, Hu B, Xu S, Dai Z, Zhang Z, Xiong H, Song X, Luo D. The Application of Variable Weight Theory on the Suitability Evaluation of Urban Underground Space Development and Utilization for Urban Resilience and Sustainability. Buildings. 2025; 15(3):387. https://doi.org/10.3390/buildings15030387
Chicago/Turabian StyleChen, Hongnian, Xianfeng Tan, Yan Zhang, Bo Hu, Shuming Xu, Zhenfen Dai, Zhengxuan Zhang, Hanxiang Xiong, Xiaoqing Song, and Danyuan Luo. 2025. "The Application of Variable Weight Theory on the Suitability Evaluation of Urban Underground Space Development and Utilization for Urban Resilience and Sustainability" Buildings 15, no. 3: 387. https://doi.org/10.3390/buildings15030387
APA StyleChen, H., Tan, X., Zhang, Y., Hu, B., Xu, S., Dai, Z., Zhang, Z., Xiong, H., Song, X., & Luo, D. (2025). The Application of Variable Weight Theory on the Suitability Evaluation of Urban Underground Space Development and Utilization for Urban Resilience and Sustainability. Buildings, 15(3), 387. https://doi.org/10.3390/buildings15030387