Article

The Influence of Campus Landscape Color Environment on Students’ Emotions: A Case Study of Shandong Agricultural University

1
College of Forestry, Shandong Agricultural University, Shandong Urban and Rural Landscape Architecture Engineering Technology Research Center, Tai’an 271018, China
2
Shandong Jinan Urban Ecosystem Observation and Research Station, Shandong Academy of Forestry, Jinan 250014, China
*
Author to whom correspondence should be addressed.
These authors contributed equally to this work.
Buildings 2025, 15(23), 4290; https://doi.org/10.3390/buildings15234290
Submission received: 15 October 2025 / Revised: 19 November 2025 / Accepted: 23 November 2025 / Published: 26 November 2025
(This article belongs to the Section Architectural Design, Urban Science, and Real Estate)

Abstract

As the daily activity space for students, the external campus environment directly impacts their physical and mental health. While previous studies have demonstrated the restorative effects of outdoor environments on emotional recovery and stress relief, the influence of color elements in the campus environment on individuals remains underexplored. To address this gap, this study investigates the influence of colors in the outdoor environments of campuses built in different periods on the physiological and psychological indicators of university students. The HSV color model was used to analyze environmental colors, while virtual reality (VR) and electroencephalography (EEG) were combined to collect brain activity data, along with synchronous collection of subjective emotional data, providing a comprehensive assessment of individuals’ perceived restoration levels. The results indicate the following: (1) Environmental colors with high brightness and low saturation are more relaxing, and environments with a high proportion of plant colors and a low proportion of building and pavement colors yield the best restorative effects. (2) A comparison across three campuses revealed that the relaxation effects on emotions are sports areas > living areas > teaching areas > learning areas. Among these, neutral and warm colors were found to be more relaxing, and neutral tones within the green (G) hue contain most of the significantly stimulated EEG signals associated with relaxation. This study demonstrates the important role of campus environmental colors in improving students’ mental health, providing theoretical support and practical guidance for color design in restorative campus landscapes.

1. Introduction

In recent years, frequent public health incidents have posed a serious challenge to the physical and mental health of the general public. World Health Organization (WHO) research indicates that approximately 75% of people worldwide are in a sub-healthy state [1]. In China, the detection rate of depression among college students is about 30%, and the mental health problems of the college student group are increasingly prominent. The incidence of stress, anxiety, depression, and other mental health issues continues to rise [2], and the mental health of college students has become a key issue in higher education [3,4]. The campus environment, as the core carrier of students’ daily activities, directly affects their physical and mental health [5]. However, research on the functional relationship between the two remains relatively scarce. Color is the visual element of the landscape that has the most stable, lasting, and rapid impact on people [6]. The deepening of research in environmental psychology [7] and color psychology [8] indicates that environmental colors affect mental health, and this has gradually become an important part of campus design. Current research indicates that colors can directly influence physiological indicators, such as electroencephalograms (EEGs) [9], through visual perception and further affect emotional regulation and psychological recovery by activating neural networks in the brain. It has been found that colors are also associated with psychological perception through the use of psychological scales and emotional scales.
Under the influence of stress, people tend to seek out a color environment that makes them feel relaxed, thereby alleviating their negative emotions [10]. Exposure to colors that cause discomfort increases alertness and reduces relaxation values, thereby interfering with emotional regulation. Currently, research on the benefits of outdoor environments on emotional recovery and stress relief has received widespread attention. Sensory stimuli such as auditory, olfactory, and visual stimuli in urban green spaces have a significant positive impact on people’s emotions and stress recovery [11]. However, existing studies mostly focus on public space environments such as street green spaces and parks [12,13,14], and the research on campus landscapes mostly targets individual plants or architectural elements; the research on the impact of the overall campus environmental colors on physical and mental health has not received sufficient attention. In terms of research methods, subjective evaluation methods are mostly relied on [15], lacking an integrated analysis of physiological indicators and psychological perception. In terms of presentation, traditional static images are primarily used, which makes it difficult to reproduce the dynamic experience of the real scene [16]. With the development of virtual reality (VR) [17] and wearable physiological instruments [18], constructing three-dimensional dynamic scenes and collecting EEG data in real time [12,19] make it possible to break through temporal and spatial limitations and the subjective biases of the traditional research methods. This study uses EEGs to record subtle changes in participants’ brain waves [20], analyzes the impact of different color stimuli on physiological indicators [21], and thereby obtains various psychological feelings such as stress and relaxation when participants view the pictures [22]. When studying human physical and mental states, alpha waves are related to mental relaxation and physical calmness [23]; therefore, the power of an alpha wave (8–13 Hz) is taken as the indicator of this study. However, few scholars have tested the color environment through EEG and summarized specific quantitative data.
This study intends to explore the influence of outdoor campus environmental colors on human emotions (relaxation levels). Existing research has predominantly focused on two dimensions: either the impact of diverse sensory stimuli in urban green spaces on human emotional restoration or comparative studies on the restorative effects of color characteristics of single elements (e.g., plants or buildings). However, current research on environmental restorative benefits within the context of university campuses remains limited. The exploration of the mechanisms through which the campus environment influences students’ emotions is insufficiently in-depth, and the quantitative analysis of outdoor campus environmental colors (encompassing plants, buildings, and pavements) lacks sufficient detail. Therefore, this study aims to address these research gaps by empirically verifying the influence of outdoor campus environmental colors on emotions (relaxation levels). By employing EEG combined with VR technology to monitor changes in students’ α wave power following exposure to landscape environmental colors, this study provides objective physiological evidence for the emotional soothing effects of color environments and proposes optimization strategies for the color design of university campus landscape environments.

2. Materials and Methods

2.1. Research Area

Shandong Agricultural University was founded in 1906 and is a century-old university with a rich cultural heritage. It has three campuses: Daizong Campus (SDAU-I), Panhe Campus (SDAU-II), and Xibei Campus (SDAU-III). The construction times of these three campuses are 1958, 2003, and 2020, respectively. The architectural styles of the three campuses are quite different, and each has its own unique color environment. Conducting a comparative study on the different environments of these three campuses can help to outline the development process of the campus environment and identify the optimal spatial color characteristics.
Based on the functions of the buildings, each campus is divided into four functional areas: teaching area, living area, learning area, and sports area [24,25]. The teaching area mainly refers to the area centered around teaching buildings and laboratories, where teachers and students study and communicate; the living area mainly refers to the area centered around dormitories and canteens; the learning area mainly refers to the area centered around libraries; and the sports area mainly refers to the area centered around gymnasiums and playgrounds.

2.2. Image Acquisition

From June to July 2025, the foliage colors of campus plants remained stable. On sunny days, a Canon DSLR camera EOS 200D (Canon, Tokyo, Japan) was used to select gathering spaces at the main entrances of buildings—those with high foot traffic and frequent usage—across the four functional zones of the three campuses. Three shooting locations were designated for each zone, resulting in a total of 36 shooting locations across all three campuses, as shown in Figure 1.
Between 10:00 a.m. and 4:00 p.m., photographs were taken uniformly along the right side of the road and at a direction perpendicular to the road [26]. The camera was set at a height of 1.5 m, with a picture aspect ratio of 3:2 and a field of view width of 120°, and the depth of field was consistent with the average viewing angle [27]. A total of 483 pictures were collected, with 3 pictures taken at each shooting point. These pictures included elements such as buildings, pavement, plants, sky, and small sculptures. Based on this, 108 effective pictures were selected.

2.3. Image Color Quantization

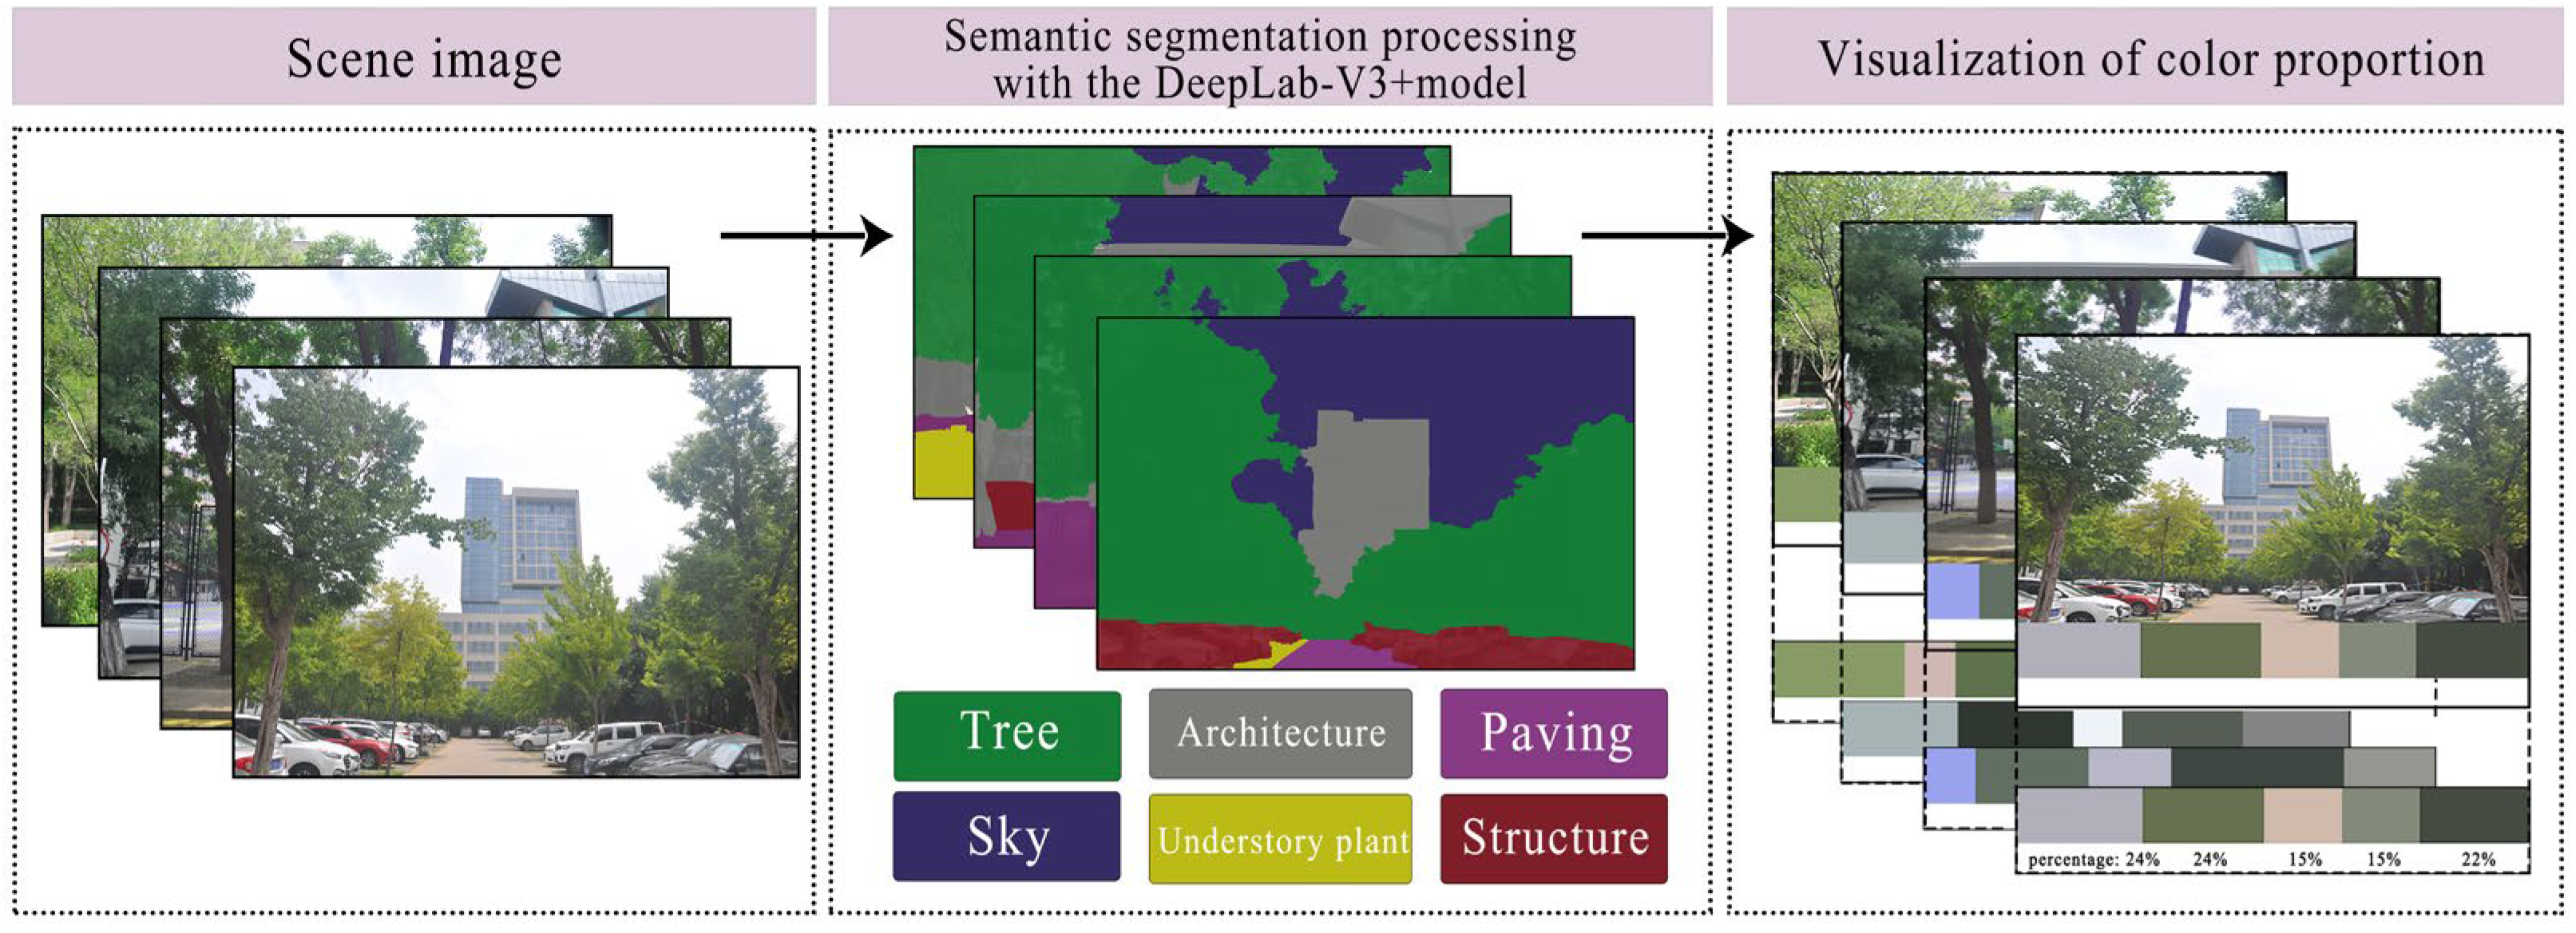
The DeepLab-V3+ model is adopted to perform semantic segmentation on the colors of various elements, such as buildings and plants, in the image [28]. Then, the pixel traversal method [29] is used to extract and summarize the RGB color values of each pixel of these elements [30]. Next, the K-means clustering algorithm [31] is employed to extract the main RGB color values and classify them into several color categories that can be quickly recognized by the human eye. Finally, the Python 3.12 program is utilized to perform batch processing [32] to obtain their color values (Figure 2).
The color value conversion expression is determined using the HSV color model, which consists of three color dimensions: hue (H), saturation (S), and value (V). The hue (H) value represents the different color positions on the color wheel, but not in increments; it is expressed in degrees, ranging from 0° to 360°. Here, 0° and 360°, 60°, 120°, 180°, 240°, and 300° correspond to red (R), yellow (Y), green (G), cyan (C), blue(B), and magenta, respectively. The warm color range is from 0° to 90° and 330° to 360°; the warm-to-cold neutral range is from 90° to 150°; the cool color range is from 150° to 270°; and the cold-to-warm neutral range is from 270° to 330°. Saturation (S) is expressed as a percentage, representing the proportion of the colored part ranging from 0% to 100%. The low saturation range is from 0% to 30%; the medium saturation range is from 31% to 69%; and the high saturation range is from 70% to 100%. Value (V) is expressed as a percentage, ranging from 0% (black) to 100% (white), and indicates the brightness of the color. The low value range is from 0% to 30%; the medium value range is from 31% to 69%; and the high value range occupies 70% to 100% [33].

2.4. Experimental Design

2.4.1. Participants

Research has shown that there is no significant difference in landscape preference between college students and the general public [34]. In this study, 30 students with normal vision (aged 20–25 years old and currently enrolled in the university) were recruited as participants, and all of them signed an informed consent form before the test. This academic research project was approved by the Medical Ethics Committee of Taian City Central Hospital (No.2025-05-160).

2.4.2. EEG Index Testing and Experiment Procedure

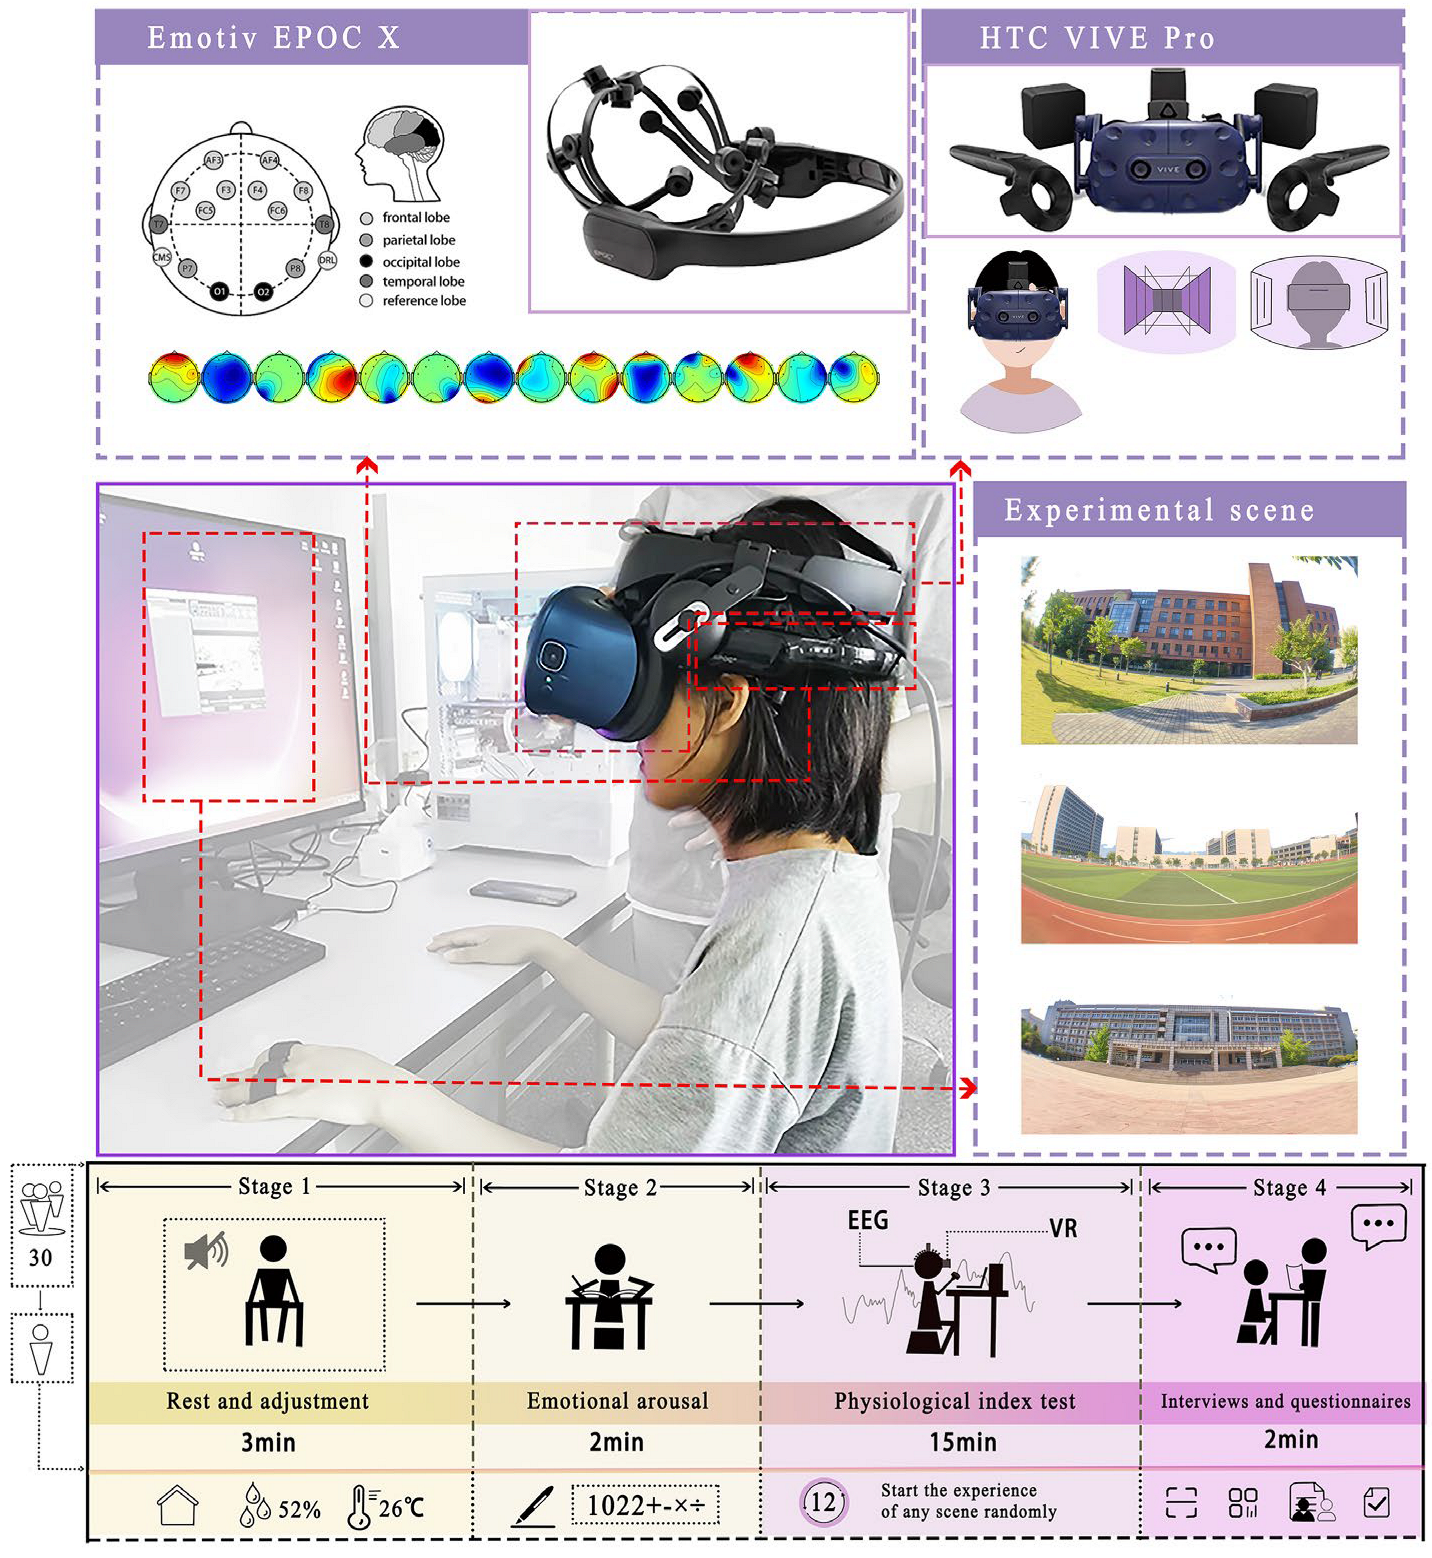
During the test, the doors and windows were kept closed, and the room temperature was maintained at around 26 °C to avoid interference from temperature, noise, and light with the participants’ color evaluation. The VR experience equipment used was the HTC VIVE COSMOS ELITE package (THC, Taiwan, China). The portable EEG device Emotiv Epoc X (EMOTIV Inc., San Francisco, CA, USA) was used to collect the brain waves of the participants. The participants wore VR glasses and conducted color observation in an immersive experience. The data is transmitted to the computer via Bluetooth through electrodes. The accuracy of this device has been proven in previous studies [35,36].
Figure 3 shows that the testing process was divided into four stages: preparation stage, stress induction stage, recovery stage, and evaluation stage. (1) Preparation stage: Participants remained in a quiet state for 3 min to stabilize their baseline physiological state. (2) Stress induction stage: Participants independently completed addition and subtraction within 1022 within 2 min. (3) Recovery stage: Researchers started the EEG test, with a time limit of 15 min. (4) Evaluation stage: After the virtual experience, we conducted a simple interview with the participants for 2 min based on the scene experience. Each participant started the experience from a random scene and proceeded sequentially until they completed all scene experiences. This design ensured that each scene had an equal probability of being the initial experience, thereby avoiding potential random errors [37].

2.4.3. Psychological Indicator Test

The psychological indicators of this study were derived from a subjective evaluation questionnaire, which was designed based on the Likert scale [38] and was used to measure the emotional states of the participants. The subjective perception evaluation included the assessments of hue, value, saturation, and the degree of color-induced relaxation for different scene colors. Specifically, positive attitude statements (“The environmental color of this scene makes me feel relaxed”) were made, and participants were required to indicate whether they strongly agreed, agreed, were unsure, disagreed, or strongly disagreed with these statements by providing scores of 5, 4, 3, 2, or 1 for each item. The average score and standard deviation of 30 questionnaires were calculated for further analysis.

2.4.4. Data Analysis

The data processing was divided into two parts: EEG data and subjective evaluation questionnaire data. The EEG data was preprocessed using MATLAB 2024a and the EEGLAB 2024.1 toolbox to remove artifacts [39], including editing electrode positions, by using the pop chanedit function, and the data was filtered using the pop eegfitnew function to retain the EEG frequency band of 1–30 Hz. Independent component analysis (ICA) was performed using the pop propextended function to identify and eliminate artifacts such as head movement, blinking, and muscle activity, thereby obtaining the final preprocessed data. The data was then imported in batches into Excel 2019 for preliminary analysis, and the average and standard deviations of the α wave energy were calculated. Further analysis was conducted using SPSS 26.0 [40]. We used one-way ANOVA to test for differences in physiological and psychological indicators caused by different colors. A p-value < 0.05 indicated a statistically significant difference. If the variance of the physiological and psychological data did not show homogeneity, the Kruskal–Wallis test was used for further testing [41,42].

3. Results

3.1. Environmental Color Analysis

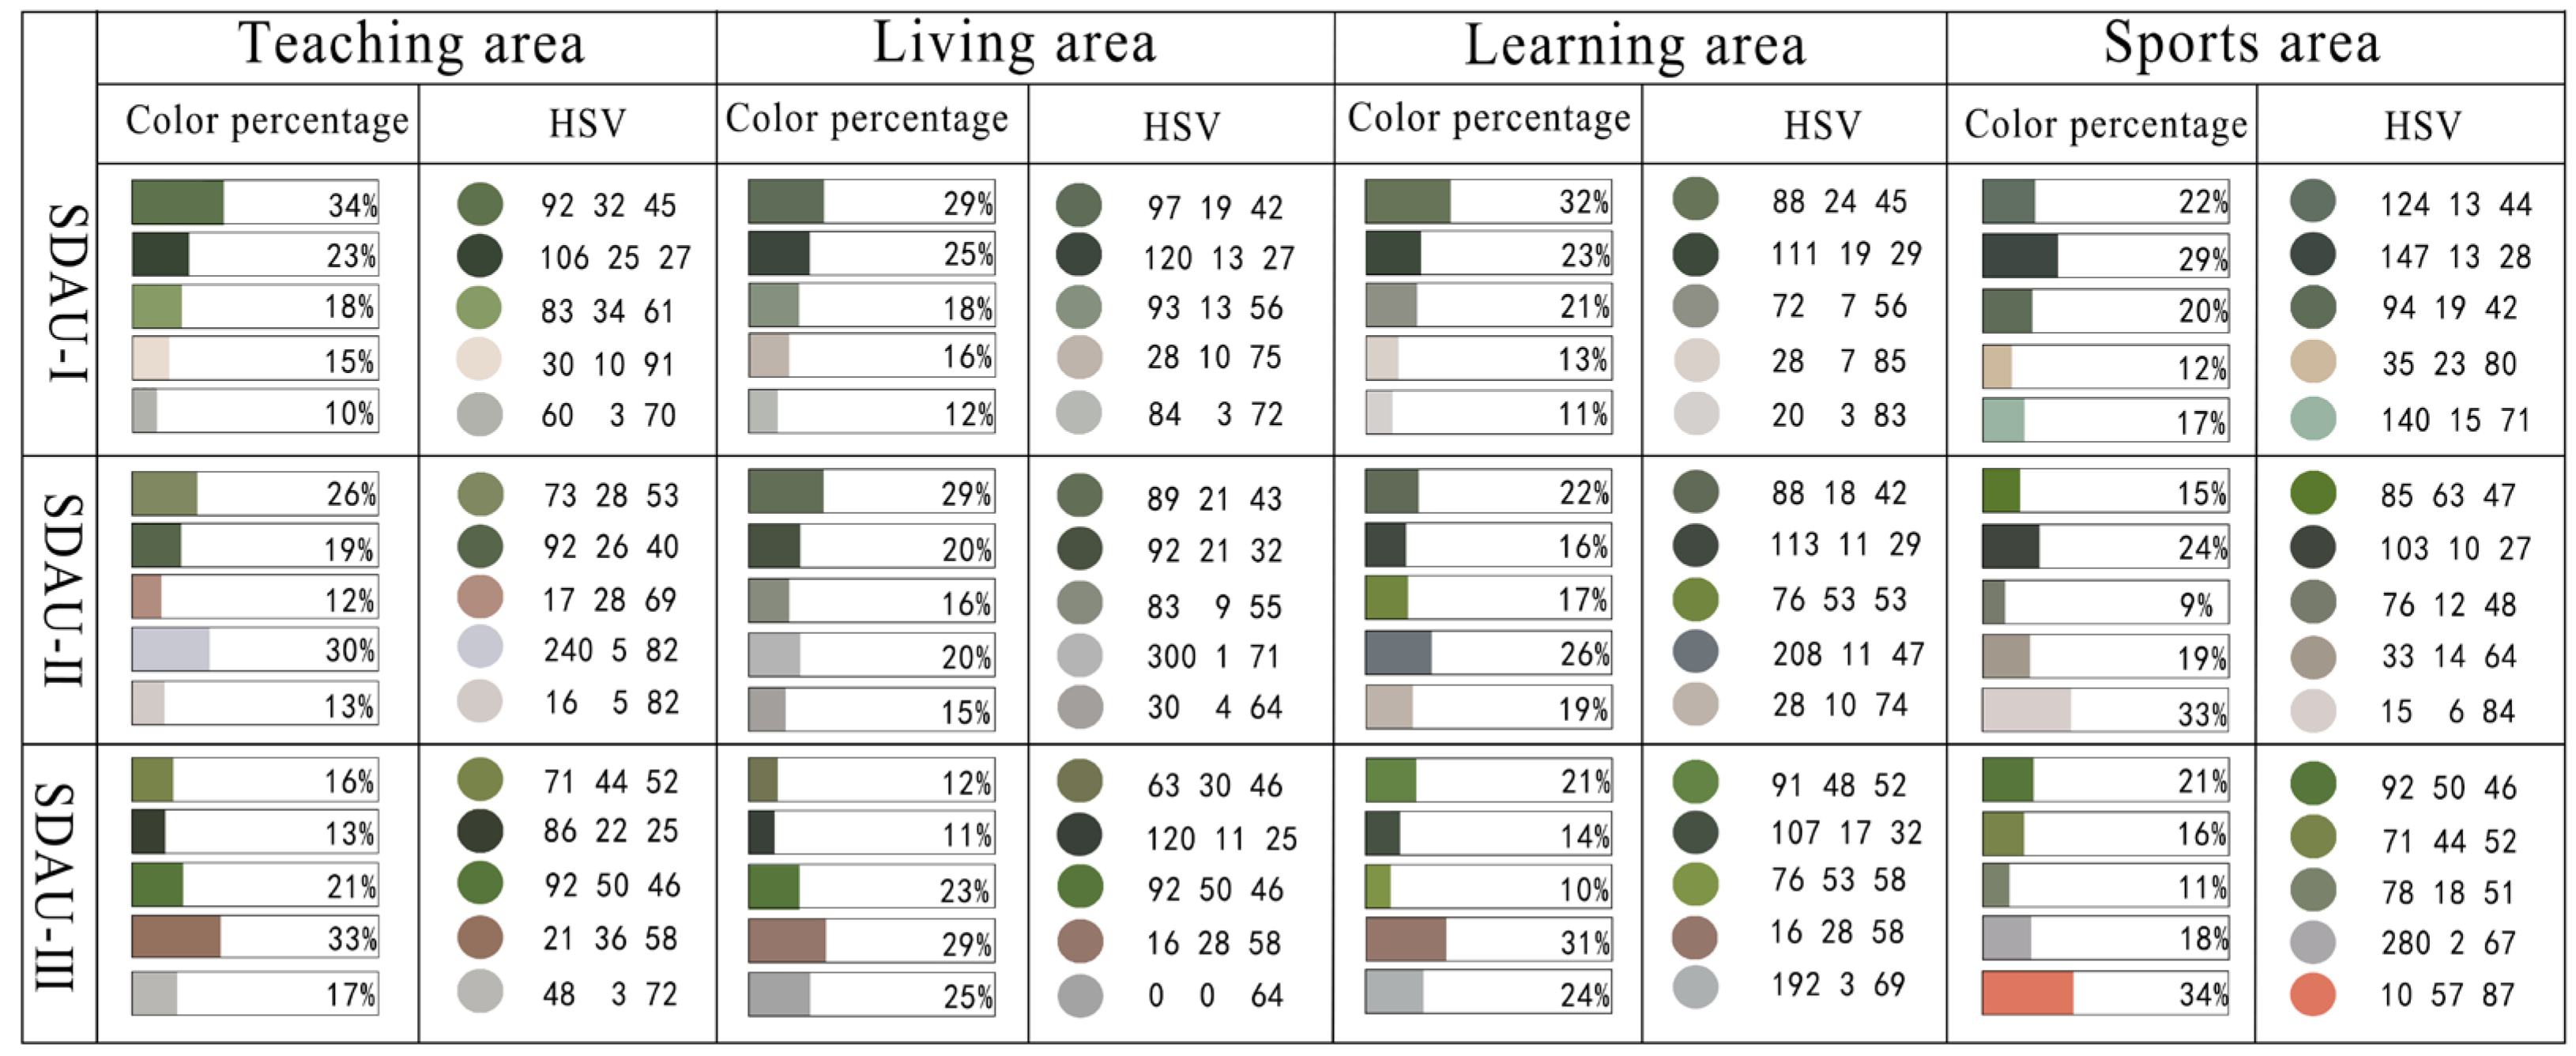
We used the HSV color model for result presentation, obtaining three campus-specific statistical tables and analysis graphs for environmental colors quantification data. The emotional regulation effect of the color environment is related not only to the combination of hue, value, and saturation but also closely to the proportion of various elements in the color environment. In the color proportion charts for each scene in Figure 4, the five color blocks (from top to bottom) represent trees, shrubs, ground cover, buildings, and pavement—with each block corresponding to the proportion of its respective color in the overall color environment. Regarding the overall proportion of color elements on campus: the proportion of plant colors in SDAU-I is higher than that in SDAU-II and SDAU-III SDAU-I is dominated primarily by low-saturation green; SDAU-II contains both low-saturation neutral and warm greens, along with some red plants; and SDAU-III is dominated primarily by medium-saturation warm green. In contrast, the proportions of pavement and building colors in SDAU-I are lower than those in SDAU-II and SDAU-III; SDAU-I features warm gray buildings; SDAU-II includes mostly cold gray buildings; and SDAU-III buildings are in an overall “college red” style.
A comparative analysis of the environmental colors in the teaching areas of three campuses reveals the following findings: The SDAU-I campus exhibits the most diverse color palette. With a saturation of 95.5% falling within the low-saturation range and a brightness of 86.7% concentrated in the medium-brightness range, its color characteristics are distinct. In the SDAU-II campus, 44.4% of the hues are concentrated in the warm tone ranges (R, Y, and YG), and 33.3% in the cool tone range (B), and the remaining hues are scattered sporadically. Its saturation of 86.7% belongs to the low-saturation range, while 75.6% of its brightness is concentrated in the high-brightness range. For the SDAU-III teaching area, 73.3% of the hues are concentrated in the warm tone ranges (R, Y, and YG), and 17.8% in the neutral tone range (G). With a saturation of 73.3% in the medium-saturation range and 95.5% of its brightness dominated by medium levels, the SDAU-III teaching area presents the characteristics of “warm tones with medium saturation and medium brightness”, as shown in Figure 5.
In Figure 6, based on the analysis of the color bar chart for the living areas, the hue distributions across the three campuses are predominantly concentrated in warm and neutral color tones, with saturation stably maintained within the low-saturation range. Detailed color characteristics of each campus are as follows: SDAU-I: In total, 31.1% of the hues are concentrated in warm colors (R and YR), and 60% are distributed in the neutral tone range (G); 95.6% of the saturation falls within the low-saturation range, and 64.4% of the brightness is concentrated in the medium-brightness range. SDAU-II: The hue distribution exhibits significant regularity: 46.7% are distributed in warm colors (Y and YG) and 48.9% in the medium tone ranges (G and P), and the remaining hues are scattered. Additionally, 53.3% of the saturation lies in the medium-saturation range, and 88.9% of the brightness is in the high-brightness range. SDAU-III: In total, 86.7% of the hues are concentrated in the warm tone ranges (R, YR, and YG); 55.6% of the saturation is within the low-saturation range; and 86.7% of the brightness is concentrated in the medium-brightness range.
Regarding the color characteristics of the learning areas, Figure 7 shows the following: SDAU-I: In total, 53.3% of the hues are concentrated in warm tone ranges (R, Y, and YG), and 46.7% is in the neutral tone range (G); 77.8% of the saturation falls within the low-saturation range; and 88.9% of the brightness is distributed in the high-brightness range. SDAU-II: In total, 35.6% of the hues are concentrated in warm tone ranges (R, Y, and YG), and 40% in the neutral tone ranges (G and P); 86.7% of the saturation is in the low-saturation range; and 48.9% of the brightness is in the medium-brightness range. SDAU-III: In total, 68.9% of the hues are distributed in warm tone ranges (R and YG), and 28.9% are in the neutral tone ranges (G, P); 55.6% of the saturation is within the medium-saturation range, and 48.9% of the brightness is in the high-brightness range.
In Figure 8, the color distribution of the SDAU-I movement area exhibits distinct regularity: 30.4% of the area falls within the warm tone ranges (R and YR), and 48.9% fall within the neutral tone range (G). The saturation parameter is stable, with 77.8% concentrated in the medium-saturation range and 71.1% of the brightness distributed in the high-brightness range. SDAU-II: In total, 71.1% of the hues are concentrated in the warm tone ranges (R, YR, and Y); 88.9% of the saturation is in the low-saturation range; and 82.2% of the brightness is concentrated in the medium-brightness range. SDAU-III: In total, 80% of the hues are concentrated in the warm tone ranges (R and YG); 40% of the saturation is in the medium-saturation range; and 84.4% of the brightness is concentrated in the high-brightness range.

3.2. Physiological Data Analysis

Using the EEG α activity physiological data and subjective evaluation scores, a further analysis was conducted on the campus color space scenarios of the four functional areas in the three campuses (Table 1).
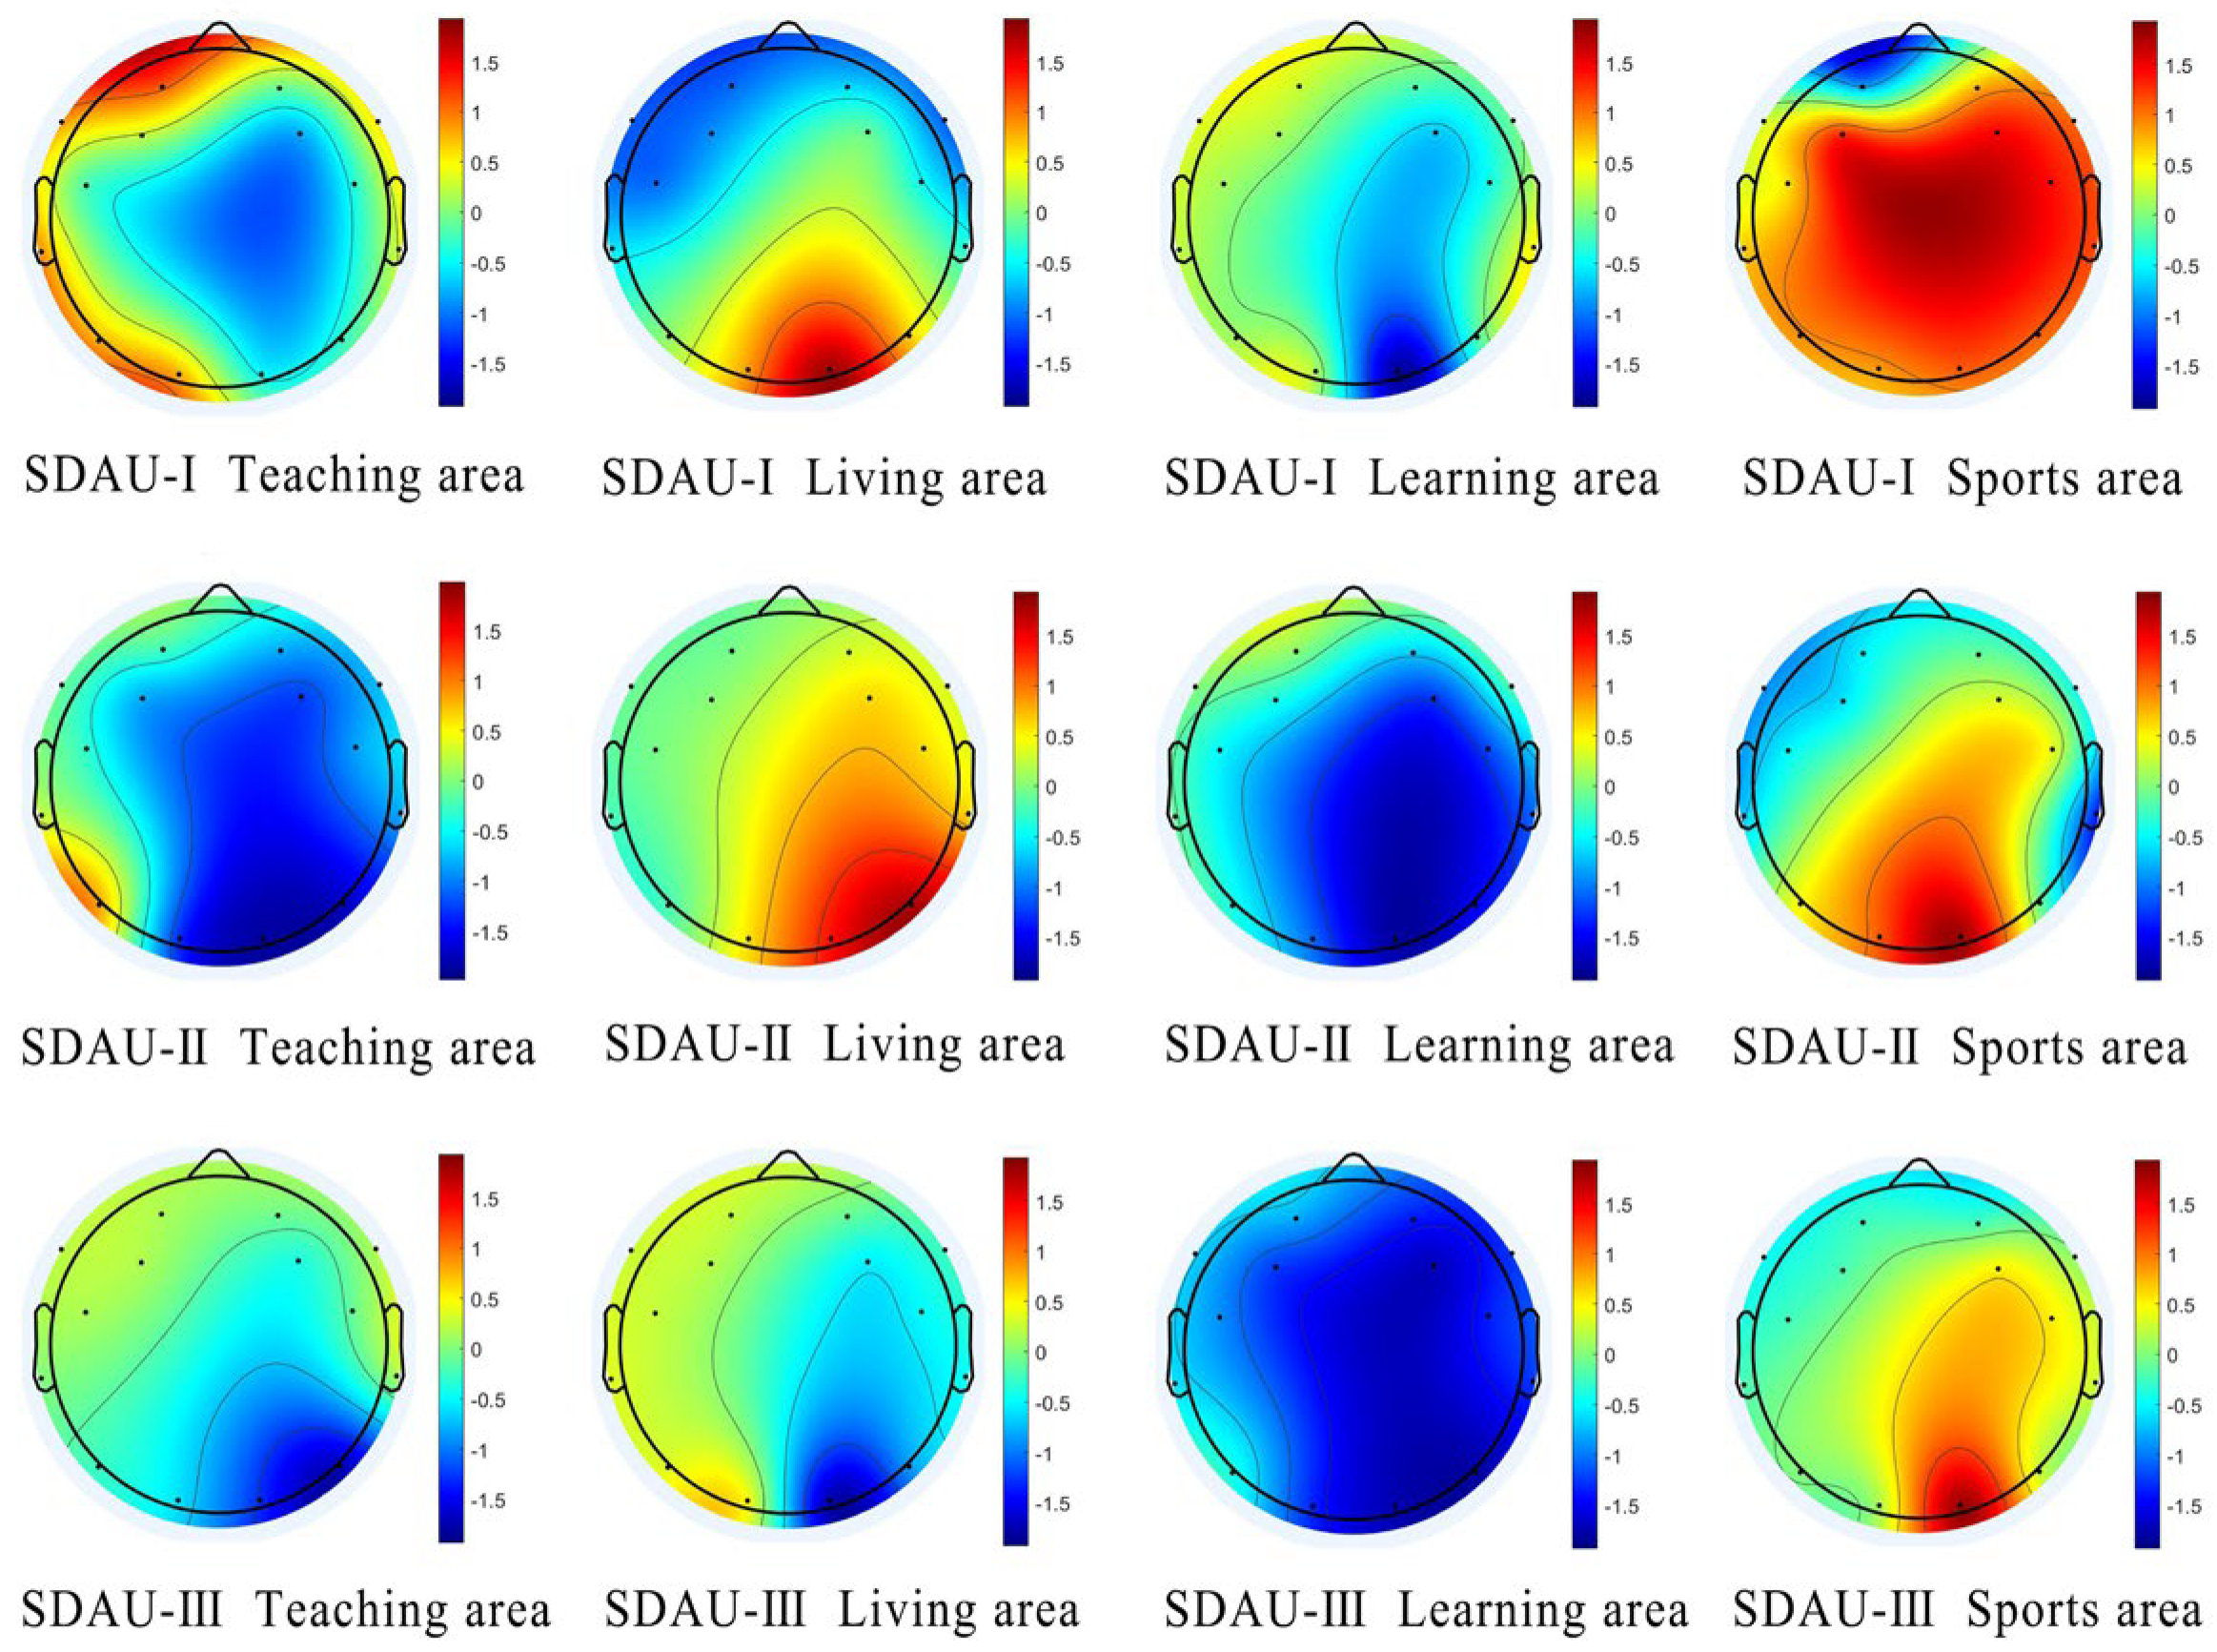
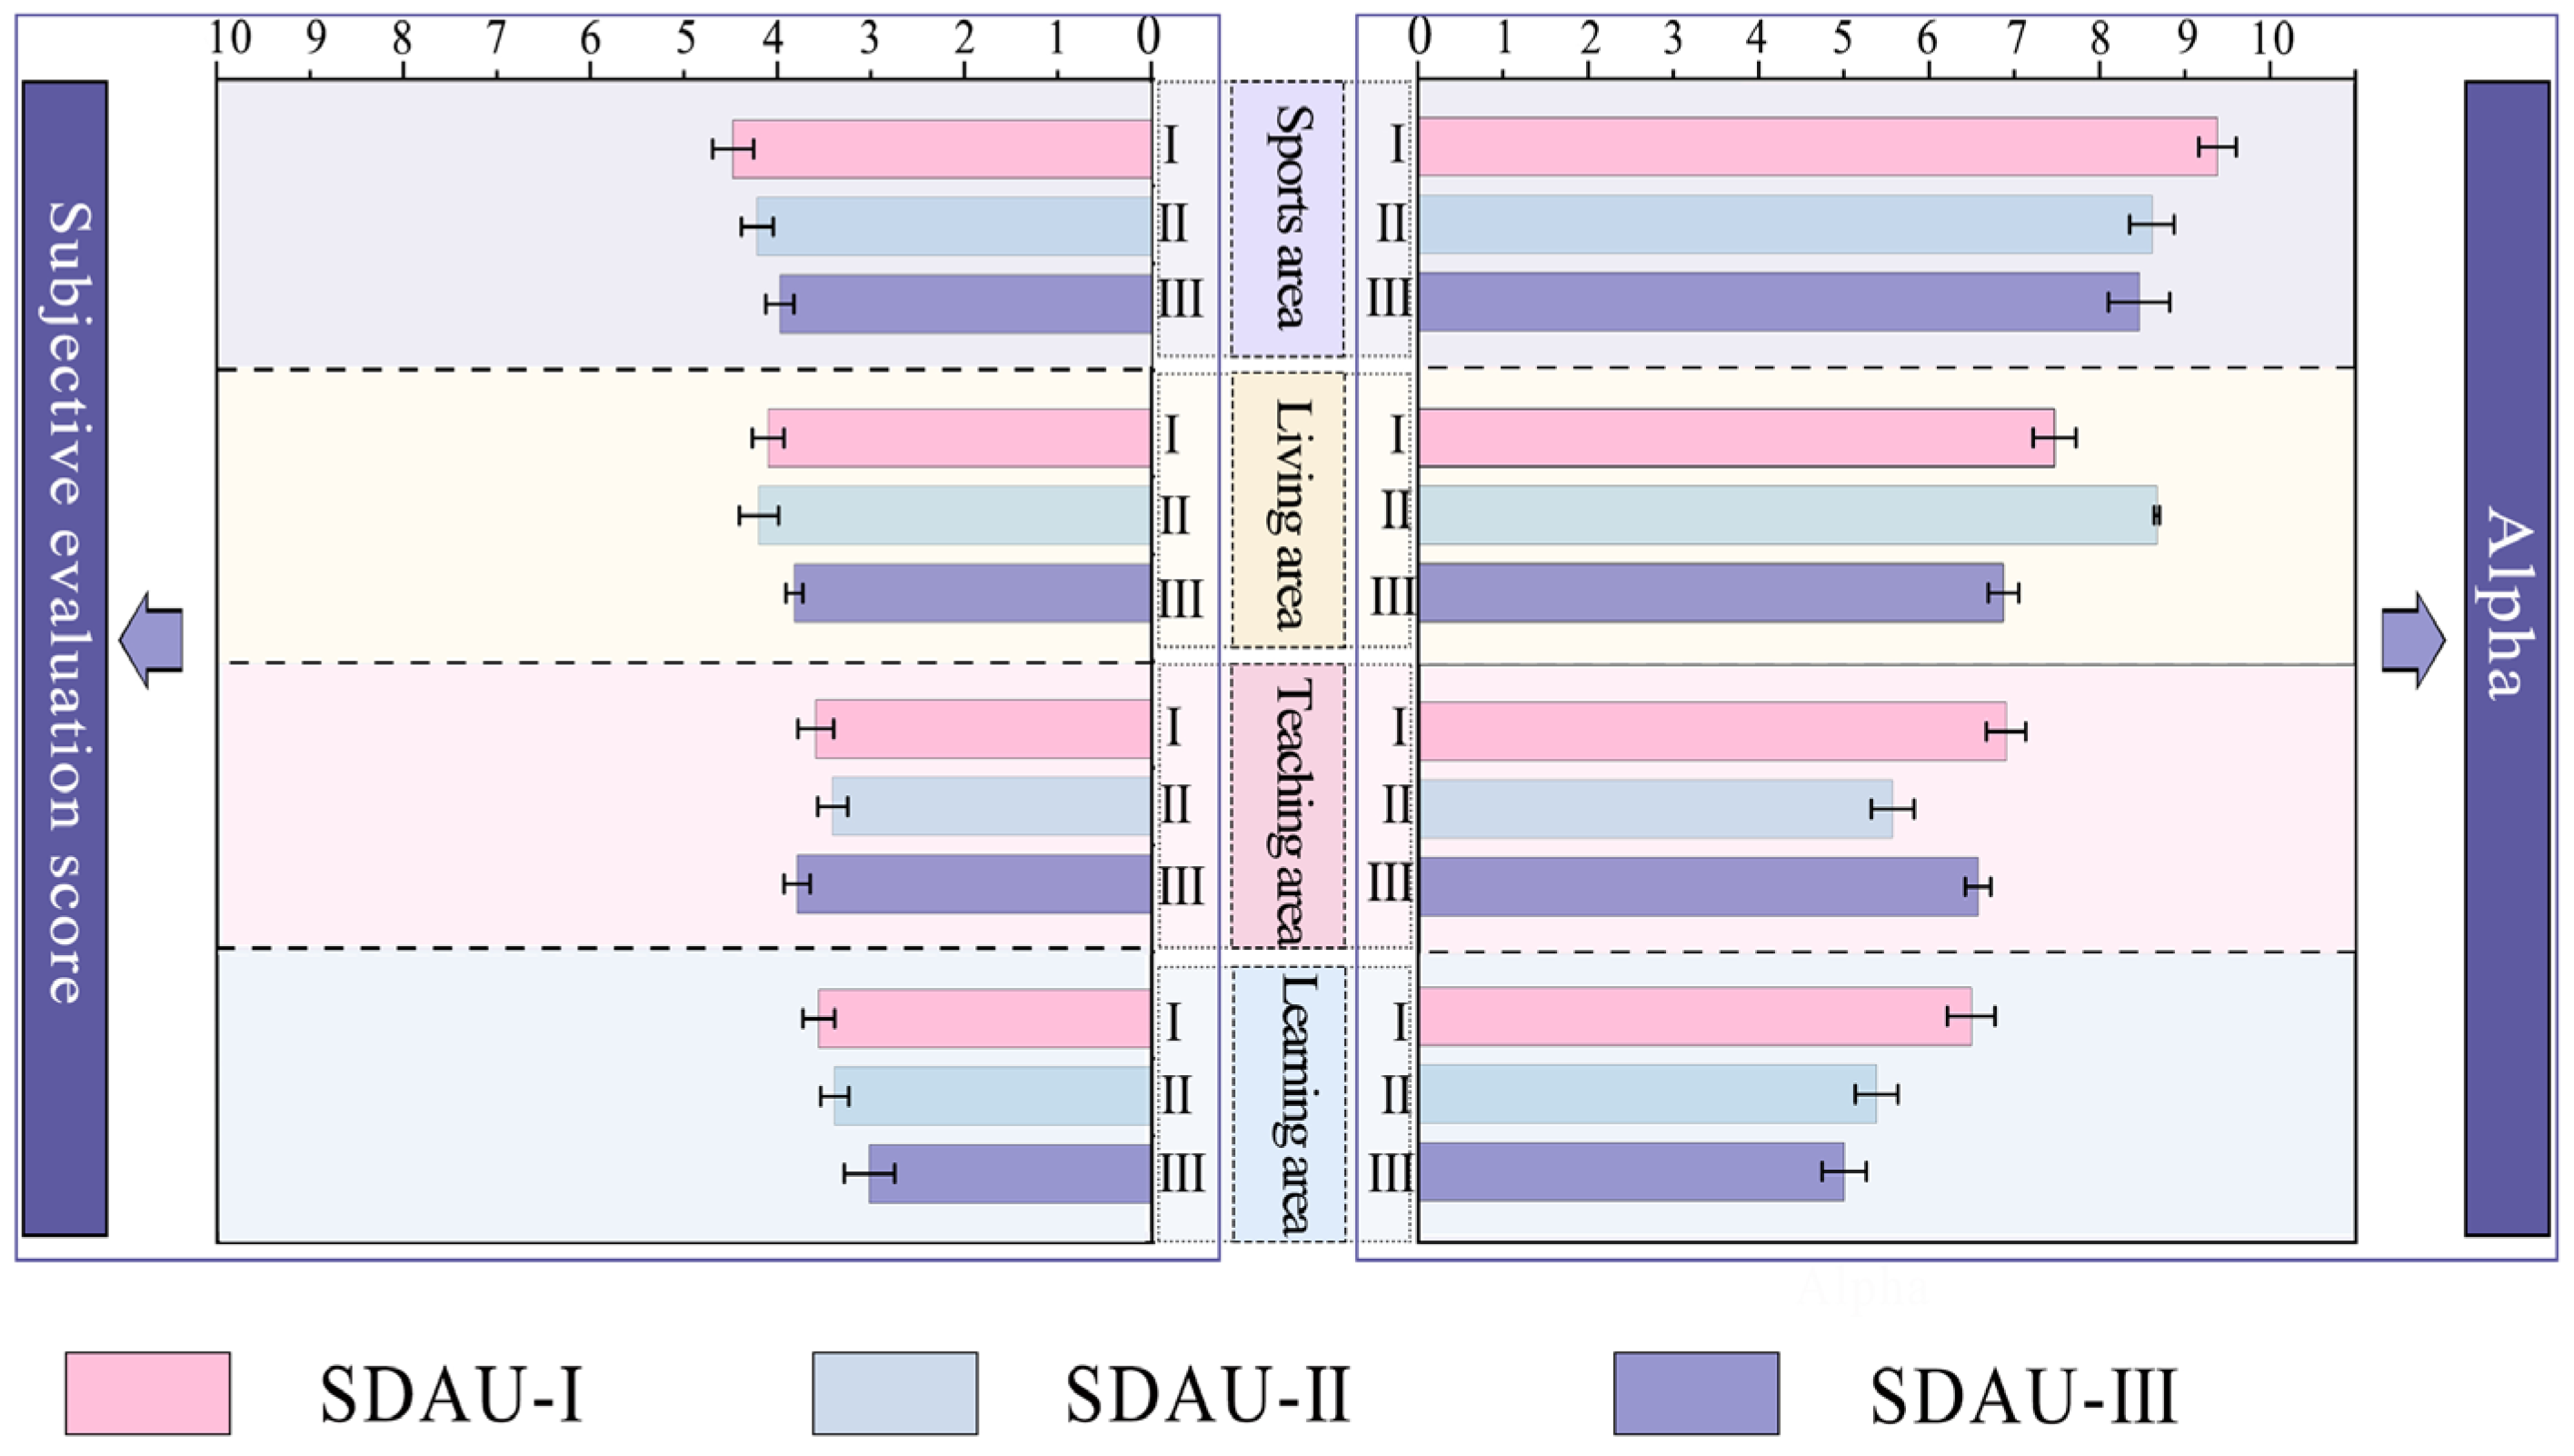
When the participants viewed the color scenes of the teaching areas across the three campuses, SDAU-I (6.89 ± 0.23) > SDAU-III (6.56 ± 0.15) > SDAU-II (5.56 ± 0.25). There were significant differences in the α wave changes (p < 0.0001) between SDAU-III and SDAU-II, whereas no significant difference was observed between SDAU-I and the other two campuses (p > 0.05). These differences could be further corroborated by the subjective evaluation scores. For the living areas, the α wave power (from high to low) was SDAU-II (8.67 ± 0.03) > SDAU-I (7.47 ± 0.25) > SDAU-III (6.87 ± 0.18), with extremely significant differences observed across all campus scenarios (p < 0.0001). In the learning area, SDAU-I (6.49 ± 0.28) > SDAU-II (5.38 ± 0.25) > SDAU-III (5.00 ± 0.26), and a very significant difference (p < 0.0001) was observed at SDAU-I, with significant differences present at the other two campuses (p < 0.05). In the sports area, α wave activity exhibited variations, with SDAU-I (9.39 ± 0.22) > SDAU-II (8.62 ± 0.26) > SDAU-III (8.47 ± 0.36), and a very significant difference (p < 0.0001) was observed at SDAU-I, with significant differences present at the other two campuses (p < 0.05). Thus, the EEG data in the three campuses showed SDAU-I (7.56 ± 0.25) > SDAU-II (7.06 ± 0.2) > SDAU-III (6.73 ± 0.24). In conclusion, the α waves were the highest in the teaching area (SDAU-III), living area (SDAU-II), learning area (SDAU-I), and sports area (SDAU-I), which indicates the optimal relaxation effect in these regions (Figure 9).

3.3. Subjective Evaluation Analysis

We analyzed the subjective evaluation scores for the color scenes of the landscape spaces in the teaching areas of the three campuses. The subjective evaluation scores were as follows: SDAU-III (3.81 ± 0.14) > SDAU-I (3.61 ± 0.19) > SDAU-II (3.43 ± 0.16). There were extremely significant differences observed among the three campuses (p < 0.0001). When participants viewed the color scenes of the living areas, the subjective evaluation scores from high to low were as follows: SDAU-II (4.20 ± 0.21) > SDAU-I (4.10 ± 0.17) > SDAU-III (3.82 ± 0.09). However, no extremely significant differences were observed (p < 0.05). The subjective evaluation scores of the learning areas in the three campuses were as follows: SDAU-I (3.56 ± 0.17) > SDAU-II (3.39 ± 0.15) > SDAU-III (3.02 ± 0.27). There were significant differences in the subjective evaluation scores of the three campuses (p < 0.05). The colors of the SDAU-I sports area (4.49 ± 0.22) > SDAU-II (4.23 ± 0.17) > SDAU-III (3.99 ± 0.15). Significant differences were observed in the subjective evaluation scores among the three campuses (p < 0.05). The results show that the color environments in the teaching area of SDAU-III, the living area of SDAU-II, the learning area of SDAU-I, and the sports area of SDAU-I are more relaxing (Figure 10).

3.4. Composite Analysis of Physiological Data and Subjective Evaluation

In the teaching area, the α wave power followed the order (from highest to lowest) SDAU-I (6.89 ± 0.23) > SDAU-III (6.56 ± 0.15) > SDAU-II (5.56 ± 0.25). Although no significant difference was observed in the α waves in SDAU-I (p > 0.05), the subjective evaluation analysis revealed that the teaching area in SDAU-III had a higher score than the other two, and there were extremely significant differences (p < 0.0001). We used Kruskal–Wallis for further testing. The final test results indicated that the spatial color environment of SDAU-III’s teaching area was more relaxing. For the living area, learning area, and sports area, the physiological and psychological results were consistent. Specifically, the living area of SDAU-II, the learning area of SDAU-I, and the sports area of SDAU-I were more relaxing. Synthesis of the above results showed that the relaxation effect of environmental colors in different campuses was positively correlated with both physiological indicators and subjective emotional evaluations. The α wave power and subjective evaluation scores were, from high to low, SDAU-I > SDAU-II > SDAU-III. Therefore, the environmental colors of the old campus, characterized by high brightness and low saturation, were more relaxing.

4. Discussion

4.1. The Causes for Color Formation in Different Periods

SDAU-I, founded in 1958, boasts a long history spanning multiple decades. Influenced by the Soviet-assisted construction style of the 1950s, its buildings feature the classic “Soviet-style” design [43], characterized by rough-textured cement walls, red bricks, and stone bases. Dominated by color tones of beige, light gray, and brick red, these structures exhibit low saturation and high brightness, fostering a simplistic and solemn campus atmosphere. In subsequent phases, a small number of dormitories, pavements, and sculptures were added, adopting a warm yellow-gray modern minimalist style. Having undergone over half a century of vegetation growth, the campus is adorned with tall trees and dense canopies, boasting a green coverage rate significantly higher than that of the other two campuses. With the expansion of Chinese universities in 1999, a remarkable construction boom emerged in the country’s university campuses [44]. Completed in 2003, SDAU-II is a typical representative of this era. Its architectural style adheres to modernism, with libraries, teaching buildings, and laboratories serving as core public structures. Employing simple square geometric forms and large-area glass windows, these buildings exude a bright and contemporary aesthetic, symbolizing openness, technology, and efficiency. The building facades are primarily rendered in high-brightness, low-saturation cool gray, complemented by blue reflections from glass curtain walls and the silver-gray of steel structures, collectively forming a “cool-toned” architectural expression. Both teaching and laboratory buildings incorporate atrium designs, enhancing outdoor greenery and constructing multi-level outdoor interaction spaces. During this period, the introduction of a large number of garden tree species enriched the campus with diverse colored plants, such as red and purplish-red varieties, while green plants are predominantly warm green with medium saturation and medium-high brightness.
As the most recently constructed campus, SDAU-III was completed in 2020. Its architectural appearance embodies modern design, with exterior walls decorated in red bricks, commonly referred to as “college red” [45,46]. In the contemporary architectural context, the use of red bricks can instantly evoke reverence for academic institutions and historical inheritance, creating a solemn and scholarly atmosphere. The red-brick building complex quickly forms a unified and distinctive visual identity, establishing a unique campus brand image. However, due to its relatively short construction time and the limited growth cycle of plants, the campus exhibits low vegetation coverage. The dominant vegetation consists of evergreen tree species and colored tree species, primarily warm green with medium saturation and medium-high brightness, making it the campus with the lowest green coverage rate among the three.
The adoption of “college red” as the signature color for the SDAU-III campus reflects the prevailing trend among contemporary universities to rapidly establish campus image recognition through distinctive color schemes. This finding reveals a potential contradiction in current campus color design: an imbalance between the pursuit of visual symbolism and campus image, and the consideration of users’ mental health. Therefore, in the planning of campus environmental color design, differentiated schemes should be developed based on the functional purposes of distinct areas, and homogeneous color design across the entire campus should be avoided.

4.2. The Impact of Color Environment on Emotions

Colors can directly modulate human physiological mechanisms and electroencephalographic (EEG) activity through visual perception and subsequently regulate emotions by activating brain neural networks. Notably, the influence of colors on emotions is often subconscious and subtle. Thus, even if students do not actively notice or evaluate environmental colors, their emotional states are already being influenced by the color scheme of their surroundings. This study integrates EEG data with questionnaire responses to precisely and concurrently capture both this subconscious influence and conscious perceptual experiences. The subjective questionnaire data is closely related to the objective physiological data, and both types of data reflect the changes in the participants’ emotional states [47]. Zheng et al. [48] also demonstrated that human psychological and physiological responses to the color environment are consistent. However, there are differences between the two types of data in the teaching area: the α wave power of SDAU-I is the highest (reflecting the strongest physiological relaxation), while the subjective evaluation scores of SDAU-III are the highest. This is because the EEG signals are more sensitive—some subtle reactions in the cerebral cortex cannot be reflected in subjective evaluations [49]. Moreover, subjective emotions often lag behind physiological responses. Thus, discrepancies exist between physiological indicators and subjective evaluations. Jang et al. [50] believe that subjects exhibit higher α wave activity when viewing green plants compared to when viewing other color stimuli. In this study, the α wave power value of SDAU-I was most strongly influenced by the high green looking ratio, and at this time, the stimulation of other color elements on the participants was weakened, thereby affecting the assessment of the overall color environment. In contrast, the subjective evaluation score of SDAU-III was the highest. The reasons for this are as follows: Lu et al. [51] proposed that the “calming effect” of cool colors is limited in the teaching scenario, and an excessively high green looking ratio may inhibit cognitive activity. Conversely, red can moderately enhance alertness, better meeting the cognitive activation requirements of the teaching area, such as exams and academic exchanges. Therefore, the teaching area in SDAU-III exhibits the best relaxation effect. For outdoor spaces in teaching areas, the color scheme should be dominated by warm color schemes (with red as the main color), paired with colors of brightness and medium saturation. This not only regulates the physiological and psychological relaxation values but also creates a positive learning atmosphere, promoting students’ active participation in classroom interactions.
In the living area, the α wave power of SDAU-II was higher than that of the other two campuses. Yang et al. [52] believed that an environment with a higher green looking ratio could significantly increase α wave power, which reflects a more relaxed state. This study found that the living area had the largest green area and the highest green looking ratio, which affected the brain wave signals and led to the continuous enhancement of the α wave. This finding also indicates that an increase in the green looking ratio enhances the α wave power, thereby making people more relaxed. The color characteristics of this living area are dominated by warm tones, high brightness, and medium-to-low saturation. This result is consistent with that of Zhang et al. [53]. Specifically, warm yellow tones are associated with feelings of “relaxation” and “warmth”, and the YR color tone establishes a warm tone, which is more suitable for rest and social spaces in the living area. However, although cold colors environments can evoke emotional experiences of “calmness” and “concentration” [54], excessive use of cool tones in the living area may create an overly cold atmosphere, affecting social interactions in daily life.
In the learning area, both the α wave power of SDAU-I and the subjective emotional scores were the highest. The color combination had the best relaxing effect, and the overall color environment exhibited the characteristic of “warm tone, high brightness, and low saturation”. This result is consistent with the findings of Song et al. [55]. Warm tones and high-brightness colors are more likely to generate positive emotions. As an older campus, SDAU-I boasts a rich variety of thriving plant species, and its green coverage rate is higher than that of the other two campuses. In addition, the green environment is closely related to the emotional response experiences of “calmness” and “comfort”, demonstrating that green spaces can better relieve psychological stress and promote emotional relaxation [56]. Therefore, the learning area of SDAU-I achieved the best relaxation effect, thus helping to create an atmosphere conducive to independent thinking in the learning area.
In the sports area, both the α wave power of SDAU-I and the subjective emotional scores were the highest; this color combination exhibited the best relaxation effect [57]. The color scheme, which mainly consists of bright green and bright blue, is related to the emotional experience of “calmness” and “concentration”. Additionally, cold-colored sports environments, such as blue running tracks or blue sports facilities, have also been found to reduce anxiety and improve emotional stability. Taylor et al. [58] believe that increasing the proportion of cold colors in a sports area can help athletes maintain both concentration and relaxation. Conversely, Wilms and Oberfeld [59,60] believe that prolonged exposure to high-saturation color environments will lead to an increase in heart rate and blood pressure, thereby increasing excitement. In conclusion, to better stimulate athletes’ exercise enthusiasm, it is also necessary to avoid prolonged stays in this space, which may lead to a continuous rise in heart rate and blood pressure, resulting in discomfort or interference with athletes’ concentration during exercise. Therefore, in the design of outdoor exercise areas, the proportion of high-brightness cool colors should be increased, while the proportion of high-saturation colors should be appropriately reduced.
Based on our research findings, functional area-specific optimization strategies are proposed as follows: When renovating an old campus, the original characteristics of the campus should be retained, and its color style should be unified. Especially in teaching areas, a variety of colorful leaf vegetation species should be used; for the buildings and paving, colors such as R and YR should be mainly adopted, with medium brightness and medium-low saturation. In living areas, for subsequent construction, warm colors like Y and YR can be used more frequently. These colors—with high brightness and medium-low saturation as the core palette—help create a warm and cozy atmosphere. In learning areas, the green space can be appropriately expanded, and the buildings and paving can mainly use warm R and YR colors, with high-lightness and low-saturation color combinations that are more conducive to students’ independent learning. In sports areas, sports tracks mainly composed of cool colors (e.g., G and BG) with high brightness and medium saturation can be used to maintain people’s calmness and concentration. Additionally, prominent sports facilities in high-saturation colors (e.g., red and green) should be incorporated to stimulate exercise enthusiasm. Regarding the architectural colors of outdoor exercise areas, neutral colors can be appropriately adopted to minimize interference for athletes during competitions or training.

4.3. Campus Color Optimization Recommendations Based on Research Findings

Architecture and pavements: Warm grays characterized by high brightness and low saturation should be adopted, such as beige, off-white, and light reddish-brown. These hues can foster a minimalist, solemn, yet relaxing atmosphere. Plant configuration: The G hue has been verified as the color that was most effective in inducing brain signal relaxation, with emerald green being the preferred plant color. It is important to emphasize that color effects are relative rather than absolute. The emotional impact of color is associated with the functional purpose of the environmental space—the same color may exert distinct effects across different functional areas. Appropriate color combinations can adversely affect users’ mental health; thus, specific color schemes tailored to each functional zone are discussed below.
Functional area-specific color schemes:
(1)
Teaching areas: Buildings and pavements are recommended to adopt warm color schemes with neutral brightness and neutral saturation. For instance, brick red and orange-red can serve as primary colors, complemented by a small amount of navy-blue glass for decoration, paired with yellowish-green vegetation. This configuration maintains a moderate level of cognitive activation while preventing excessive tension.
(2)
Living areas: Building colors should preferably be selected from high-brightness, neutral–low-saturation warm tones (e.g., beige or off-white), combined with yellowish-green vegetation to create a warm social ambiance.
(3)
Learning areas: Buildings and pavements should utilize warm color schemes with high brightness and low saturation, such as light reddish brown and off-white, integrated with a high proportion of emerald green vegetation to alleviate academic pressure.
(4)
Sports areas: Runways and similar facilities are advised to adopt cool color schemes with high brightness and neutral saturation (e.g., sky blue or teal), accentuated by a small amount of high-saturation red to stimulate vitality. Buildings in this area are suitable for light grayish yellow, paired with emerald green plants.

4.4. Limitations and Future Research

Despite being conducted in a controlled environment, this experiment has some limitations:
(1)
The sampling season of this test was summer. While the outdoor space included plant elements, this study did not account for seasonal changes. In the future, research could focus on exploring the impact of seasonal changes in plant colors on human emotions.
(2)
As a pilot study with a relatively small sample size (N = 30), this research primarily aimed to validate the methodological feasibility of using VR+EEG technology to investigate the mechanisms of color’s influence on emotions within campus environments and to provide preliminary evidence and direction for subsequent large-scale studies. Future studies will expand the sample size to further demonstrate the generalizability of this research’s conclusions.
(3)
Additionally, human perception of the environment is not limited to visual attributes (e.g., colors); it also includes spatial layout, sound, and other sensory stimuli. In future research, these factors can be integrated to investigate the mechanism by which outdoor environments influence human emotions.

5. Conclusions

This study, using virtual reality technology, physiological feedback technology, and quantitative color analysis methods, systematically explored the effects of the environmental colors in four types of functional spaces at Shandong Agricultural University on the physiology and psychology of college students. The research conclusions are as follows:
(1)
Compared with the new campus, the old campus (SDAU-I) increased the physiological relaxation index (α wave) by up to 11.04% due to its lush emerald green vegetation and light-grayish-yellow building colors, thereby more effectively promoting students’ emotional relaxation.
(2)
The emotional regulatory effect of environmental colors is influenced by a combination of hue, lightness, and saturation. Environmental colors with high lightness and low saturation tend to promote greater relaxation. This effect is also closely tied to the composition of environmental elements. The environmental colors of older campuses (characterized by a high proportion of plant colors and a low proportion of building and pavement colors) with long histories are more conducive to students’ emotional relaxation.
(3)
In campus outdoor environments, neutral colors like emerald green and teal, as well as high-lightness warm tones such as off-white and beige, induce greater relaxation. Among these, green is the most effective at stimulating relaxation-related brainwave signals.
(4)
Color selection guidelines for functional areas are important.
Sports areas: The optimal color layout is defined by sky blue and teal tracks, vibrant pure red accents on sports facilities, emerald green vegetation, and light-grayish-yellow buildings. Living areas: It is recommended to adopt beige and off-white for building colors, paired with yellowish-green plants to create a warm atmosphere. Teaching areas: To balance relaxation and concentration, warm-toned building colors such as brick red and orange red can be adopted, complemented by yellowish-green vegetation. However, the saturation of these building colors should be moderated, avoiding the use of overly bright shades in large areas. Learning areas: As spaces dedicated to quiet and focused independent thinking, buildings should primarily feature light reddish brown and off-white, complemented by emerald green vegetation. In conclusion, campus planning must shift its focus from fleeting color trends to the scientifically substantiated impact of color on mental well-being, adopting extensive green vegetation alongside light grayish yellow and off-white as a foundational palette to create restorative landscapes that effectively alleviate student stress.
The research findings of this paper demonstrate that color plays a crucial role in enhancing students’ mental health. Through a comparative assessment of environmental colors in old and new campus areas across different periods, a color-matching paradigm that delivers the optimal effect in alleviating students’ emotional tension is proposed. This work not only offers theoretical support but also provides practical guidance for promoting students’ mental health and designing restorative campus landscapes.

Author Contributions

Conceptualization, Y.L., Y.Y. and D.H.; methodology, Y.L.; software, Y.L. and Y.Y.; validation, X.S., T.W., K.L. and S.M.; formal analysis, S.M.; investigation, Y.L., Y.Y. and X.S.; resources, D.H. and X.Z.; data curation, Y.L., Y.Y. and X.S.; writing—original draft preparation, Y.L. and Y.Y.; writing—review and editing, D.H. and X.Z.; visualization, T.W.; supervision, K.L.; project administration, X.Z.; funding acquisition, X.Z. and D.H. All authors have read and agreed to the published version of the manuscript.

Funding

This research received no external funding.

Institutional Review Board Statement

The study was conducted in accordance with the Declaration of Helsinki and approved by the Institutional Review Board of Medical Ethics Committee Taian City Central Hospital (protocol code NO.2025-05-160 and date of 2025-05-10).

Informed Consent Statement

Informed consent was obtained from all subjects involved in this study.

Data Availability Statement

The datasets generated and analyzed during the current study are available from the corresponding author upon reasonable request.

Conflicts of Interest

The authors declare no conflicts of interest.

References

  1. Sarkodie, S.A.; Owusu, P.A. Global assessment of environment, health and economic impact of the novel coronavirus (COVID-19). Environ. Dev. Sustain. 2021, 23, 5005–5015. [Google Scholar] [CrossRef] [PubMed]
  2. Zhang, Z.; Wang, T.; Kuang, J.; Herold, F.; Ludyga, S.; Li, J.; Hall, D.L.; Taylor, A.; Healy, S.; Yeung, A.S.; et al. The roles of exercise tolerance and resilience in the effect of physical activity on emotional states among college students. Int. J. Clin. Health Psychol. 2022, 22, 100312. [Google Scholar] [CrossRef] [PubMed]
  3. Ohrnberger, J.; Fichera, E.; Sutton, M. The relationship between physical and mental health: A mediation analysis. Soc. Sci. Med. 2017, 195, 42–49. [Google Scholar] [CrossRef] [PubMed]
  4. Tzouvara, V.; Kupdere, P.; Wilson, K.; Matthews, L.; Simpson, A.; Foye, U. Adverse childhood experiences, mental health, and social functioning: A scoping review of the literature. Child Abus. Negl. 2023, 139, 106092. [Google Scholar] [CrossRef]
  5. Ding, Y.; Lee, C.A.; Chen, X.; Song, Y.; Newma, G.; Lee, R.Y.J.; Lee, S.M.; Li, D.Y.; Sohn, W. Exploring the association between campus environment of higher education and student health: A systematic review of findings and measures. Urban For. Urban Green. 2024, 91, 128168. [Google Scholar] [CrossRef]
  6. Yao, C.; Tian, T.; Gao, C.; Zhao, S.; Liu, Q. Visual performance of painting colors based on psychological factors. Front. Psychol. 2022, 13, 966571. [Google Scholar] [CrossRef]
  7. Townsend, J.; Barton, S. The impact of ancient tree form on modern landscape preferences. Urban For. Urban Green. 2018, 34, 205–216. [Google Scholar] [CrossRef]
  8. Lyu, M.; Qu, G.; Shi, J.X.; Sun, D.; Tian, Y. A Method for Studying Building Color Harmony in Coastal Historic and Cultural Districts: A Case Study of Mojiko, Japan. Buildings 2025, 15, 15091496. [Google Scholar] [CrossRef]
  9. Blaszczyk, R.L. The Architectonic Colour: Polychromy in the Purist Architecture of LeCorbusier. J. Des. Hist. 2011, 24, 405–407. [Google Scholar] [CrossRef]
  10. Li, X.; Zhang, Z.; Gu, M.; Jiang, D.; Wang, J.; Lv, Y.M.; Zhang, Q.; Pan, H. Effects of plantscape colors on psycho-physiological responses of university students. J. Food Agric. Environ. 2012, 10, 702–708. [Google Scholar] [CrossRef]
  11. Hedblom, M.; Gunnarsson, B.; Iravani, B.; Knez, I.; Schaefer, M.; Thorsson, P.; Lundström, J.N. Reduction of physiological stress by urban green space in a multisensory virtual experiment. Sci. Rep. 2019, 9, 10113. [Google Scholar] [CrossRef] [PubMed]
  12. Lin, C.-T.; Chang, C.-J.; Lin, B.-S.; Hung, S.-H.; Chao, C.-F.; Wang, I.-J. A Real-Time Wireless Brain-Computer Interface System for Drowsiness Detection. IEEE Trans. Biomed. Circuits Syst. 2010, 4, 214–222. [Google Scholar] [CrossRef] [PubMed]
  13. Hao, J.; Gao, T.; Qiu, L. How do species richness and colour diversity of plants affect public perception, preference and sense of restoration in urban green spaces? Urban For. Urban Green. 2024, 100, 128487. [Google Scholar] [CrossRef]
  14. Li, X.; Ni, G.; Dewancker, B. Improving the attractiveness and accessibility of campus green space for developing a sustainable university environment. Environ. Sci. Pollut. Res. 2019, 26, 33399–33415. [Google Scholar] [CrossRef]
  15. Wankhade, M.; Rao, A.C.S.; Kulkarni, C. A survey on sentiment analysis methods, applications, and challenges. Artifcial Intell. Rev. 2022, 55, 5731–5780. [Google Scholar] [CrossRef]
  16. Browning, M.H.E.M.; Mimnaugh, K.J.; van Riper, C.J.; Laurent, H.K.; LaValle, S.M. Can Simulated Nature Support Mental Health? Comparing Short, Single-Doses of 360-Degree Nature Videos in Virtual Reality with the Outdoors. Front. Psychol. 2020, 10, 2667. [Google Scholar] [CrossRef]
  17. Flavián, C.; Ibáñez-Sánchez, S.; Orús, C. The impact of virtual, augmented and mixed reality technologies on the customer experience. J. Bus. Res. 2019, 100, 547–560. [Google Scholar] [CrossRef]
  18. Shen, Z.; Liu, F.; Huang, S.; Wang, H.; Yang, C.; Hang, T.; Tao, J.; Xia, W.; Xie, X. Progress of flexible strain sensors for physiological signal monitoring. Biosens. Bioelectron. 2022, 211, 114298. [Google Scholar] [CrossRef]
  19. Wang, X.; Ren, Y.; Luo, Z.; He, W.; Hong, J.; Huang, Y. Deep learning-based EEG emotion recognition: Current trends and future perspectives. Fronitiers Psychol. 2023, 14, 1126994. [Google Scholar] [CrossRef]
  20. Li, Y.; Zheng, W.; Wang, L.; Zong, Y.; Cui, Z. From Regional to Global Brain: A Novel Hierarchical Spatial-Temporal Neural Network Model for EEG Emotion Recognition. IEEE Trans. Affect. Comput. 2022, 13, 568–578. [Google Scholar] [CrossRef]
  21. Hong, Y.K.; Cho, J.Y. Characteristics of physical environments that enhance learning: A systematic review of EEG-Based empirical studies. J. Environ. Psychol. 2025, 102, 102525. [Google Scholar] [CrossRef]
  22. Tost, H.; Champagne, F.; Meyer-Lindenberg, A. Environmental influence in the brain, human welfare and mental health. Nat. Neurosci. 2015, 18, 1421–1431. [Google Scholar] [CrossRef] [PubMed]
  23. Mohan, U.R.; Zhang, H.; Ermentrout, B.; Jacobs, J. The direction of theta and alpha travelling waves modulates human memory processing. Nat. Hum. Behav. 2024, 8, 1124–1135. [Google Scholar] [CrossRef] [PubMed]
  24. Peng, Y.; Li, Y.; Cheng, W.; Wang, K. Evaluation and Optimization of Sense of Security during the Day and Night in Campus Public Spaces Based on Physical Environment and Psychological Perception. Sustainability 2024, 16, 1256. [Google Scholar] [CrossRef]
  25. Zhang, J.; Liu, S.; Liu, K.; Bian, F. How does campus-scape influence university students’ restorative experiences: Evidences from simultaneously collected physiological and psychological data. Urban For. Urban Green. 2025, 107, 128779. [Google Scholar] [CrossRef]
  26. Wang, Z.; Li, K.; Dou, L.; Xu, Z.; Liu, J. The recovery effect of plant color on the negative emotions of college students. J. Northwest For. Univ. 2018, 33, 290–296. [Google Scholar] [CrossRef]
  27. Wang, T.; Li, Y.; Tian, L.; Mou, S.; Zhang, X. A Visual Comparative Study of Urban Color Rosearch Methods Based on CiteSpace. Landsc. Archit. Acad. J. 2025, 42, 57–64. [Google Scholar] [CrossRef]
  28. Wieland, M.; Martinis, S.; Kiefl, R.; Gstaiger, V. Semantic segmentation of water bodies in very high-resolution satellite and aerial images. Remote Sens. Environ. 2023, 287, 113452. [Google Scholar] [CrossRef]
  29. Liu, B.; Xue, Y.; Li, M.; Zhu, X.; Pan, Y.; Tian, A.; Li, S.; Xu, J. Vortex spatial phase-shifting digital microscopic holography based on pixel traversal. Opt. Lasers Eng. 2025, 190, 108933. [Google Scholar] [CrossRef]
  30. Zhou, W.; Dong, S.; Fang, M.; Yu, L. CACFNet: Cross-Modal Attention Cascaded Fusion Network for RGB-T Urban Scene Parsing. IEEE Trans. Intell. Veh. 2024, 9, 1919–1929. [Google Scholar] [CrossRef]
  31. Wan, X.; Liu, J.; Gan, X.; Liu, X.; Wang, S.; Wen, Y.; Wan, T.; Zhu, E. One-Step Multi-View Clustering with Diverse Representation. IEEE Trans. Neural Netw. Learn. Syst. 2024, 36, 5774–5786. [Google Scholar] [CrossRef]
  32. Premalatha, V.; Parveen, N. Concurrent attentional reconstruction network for 3D point cloud reconstruction from single image. Appl. Soft Comput. 2025, 172, 112821. [Google Scholar] [CrossRef]
  33. Liu, W.; Li, J.; Rong, H.; Zhou, Z. Constructing a Mathematical Model of Product Color Design Based on Data Mining: Case Study of a Thermos Cup. Coatings 2024, 14, 209. [Google Scholar] [CrossRef]
  34. Yao, Y.; Zhu, X.; Xu, Y.; Yang, H.; Wu, X.; Li, Y.; Zhang, Y. Assessing the visual quality of green landscaping in rural residential areas: The case of Changzhou, China. Environ. Monit. Assess. 2012, 184, 951–967. [Google Scholar] [CrossRef]
  35. Barham, M.P.; Clark, G.M.; Hayden, M.J.; Enticott, P.G.; Conduit, R.; Lum, J.A.G. Acquiring research-grade ERPs on α shoestring budget: α comparison of a modified Emotiv and commercial SynAmps EEG system. Psychophysiology 2017, 54, 1393–1404. [Google Scholar] [CrossRef]
  36. Debener, S.; Minow, F.; Emkes, R.; Gandras, K.; De vos, M. How about taking a low-cost, small, and wireless EEG for a walk? Psychophysiology 2012, 49, 1617–1621. [Google Scholar] [CrossRef]
  37. Wang, X.; Rodiek, S.; Wu, C.; Chen, Y.; Li, Y. Stress recovery and restorative effects of viewing different urban park scenes in Shanghai, China. Urban For. Urban Green. 2016, 15, 112–122. [Google Scholar] [CrossRef]
  38. Miller, B.; Simmering, M. Attitude Toward the Color Blue: An Ideal Marker Variable. Organ. Res. Methods 2023, 26, 409–440. [Google Scholar] [CrossRef]
  39. Pion-Tonachini, L.; Kreutz-Delgado, K.; Makeig, S. ICLabel: An automated electroencephalographic independent component classifier, dataset, and website. Neuroimage 2019, 198, 181–197. [Google Scholar] [CrossRef]
  40. Ji, P.; Zhang, L.; Gao, Z.; Ji, Q.; Xu, J.; Chen, Y.; Song, M.; Guo, L. Relationship between self-esteem and quality of life in middle-aged and older patients with chronic diseases: Mediating effects of death anxiety. BMC Psychiatry 2024, 24, 7. [Google Scholar] [CrossRef] [PubMed]
  41. Cho, K.A.; Seo, Y.H. Dual mediating effects of anxiety to use and acceptance attitude of artificial intelligence technology on the relationship between nursing students’ perception of and intention to use them: A descriptive study. BMC Nurs. 2024, 23, 212. [Google Scholar] [CrossRef]
  42. Shah, W.U.; Hao, G.; Yan, H.; Shen, J.; Yasmeen, R. Forestry Resource Efficiency, Total Factor Productivity Change, and Regional Technological Heterogeneity in China. Forests 2024, 15, 152. [Google Scholar] [CrossRef]
  43. Zhang, Y.; Schoonjans, Y.; Gantois, G. The emergence and evolution of workers’ villages in early New China. Plan. Perspect. 2024, 39, 153–177. [Google Scholar] [CrossRef]
  44. He, J. Concept·Practice·Outlook—Contemporary Campus Planning and Design. China Sci.2010, 7, 489–493. Available online: https://qikan.cqvip.com/Qikan/Article/Detail?id=34835829 (accessed on 5 November 2025).
  45. Fanea-Ivanovici, M.; Baber, H. Sustainability at Universities as a Determinant of Entrepreneurship for Sustainability. Sustainability 2022, 14, 454. [Google Scholar] [CrossRef]
  46. Lowe, R.A.; Knight, R. Building the ivory tower: The social functions of late nineteenth century collegiate architecture. Stud. High. Educ. 2006, 7, 81–91. [Google Scholar] [CrossRef]
  47. Peng, X.; Jin, Y.; Sun, J.; Zhao, L.; Liu, S.Y.Y.; Li, R. Exploring the effect of stress arousal on the positive emotional design of multimedia learning. Educ. Inf. Technol. 2024, 29, 20267–20298. [Google Scholar] [CrossRef]
  48. Zheng, S.; Zhou, Y.; Qu, H. Physiological and psychological responses to tended plant communities with varying color characteristics. J. For. Res. 2024, 35, 32. [Google Scholar] [CrossRef]
  49. Wang, F.; Yang, L.; Sun, Y.; Cai, Y.; Xu, X.; Liu, Z.; Liu, Q.; Zhao, H.; Ma, C.; Liu, J. A Nanoclay-Enhanced Hydrogel for Self-Adhesive Wearable Electrophysiology Electrodes with High Sensitivity and Stability. Gels 2023, 9, 323. [Google Scholar] [CrossRef] [PubMed]
  50. Jang, H.S.; Gim, G.M.; Jeong, J.S.; Kim, J.S. Changes in physiologi-caland psychological conditions of humans to color stimuli of plants. J. People Plants Environ. 2019, 2, 127–143. [Google Scholar] [CrossRef]
  51. Lu, S.; Oh, W.; Ooka, R.; Wang, L. Effects of Environmental Features in Small Public Urban Green Spaces on Older Adults’ Mental Restoration: Evidence from Tokyo. Int. J. Environ. Res. Public Health 2022, 19, 5477. [Google Scholar] [CrossRef]
  52. Yang, M.; Dijst, M.; Faber, J.; Helbich, M. Using structural equation modeling to examine pathways between perceived residential green space and mental health among internal migrants in China. Environ. Res. 2020, 183, 109121. [Google Scholar] [CrossRef]
  53. Zhang, N.; Zhao, L.; Shi, J.; Gao, W. Impact of visual and textural characteristics of street walls on stress recovery. Sci. Rep. 2024, 14, 15115. [Google Scholar] [CrossRef]
  54. Sun, Y.; Qi, N.; Zhan, J.; Yin, J. The Impact of Cool and Warm Color Tones in Classrooms on the Perceived Emotions of Elementary School Students in Northwest China. Buildings 2024, 14, 3309. [Google Scholar] [CrossRef]
  55. Song, L.; Zhang, G.; Ma, L.; Silvennoinen, J.; Cong, F. Comparative analysis of color emotional perception in art and non-art university students: Hue, saturation, and brightness effects in the Munsell color system. BMC Psychol. 2025, 13, 650. [Google Scholar] [CrossRef]
  56. Li, Z.; Hu, L.; Lin, A.L.; Chen, J.; Xu, Y. The greener, the richer, the happier?—Spatial distribution and coupling analysis of urban green space and residents’ emotion based on social media data. Ecol. Indic. 2025, 177, 113754. [Google Scholar] [CrossRef]
  57. Nakshian, J.S. The Effects of Red and Green Surroundings on Behavior. J. Gen. Psychol. 1964, 70, 143–161. [Google Scholar] [CrossRef]
  58. Taylor, C.; Franklin, A. The relationship between color-object associations and color preference: Further investigation of ecological valence theory. Psychon. Bull. Rev. 2012, 19, 190–197. [Google Scholar] [CrossRef]
  59. Wilms, L.; Oberfeld, D. Color and emotion: Effects of hue, saturation, and brightness. Psychol. Res. 2018, 82, 896–914. [Google Scholar] [CrossRef]
  60. Liu, X.L.; Zhang, F.Y.; Gao, Q.R.; Li, T.L.; Zhang, R.H.; Jia, Y.Y. Optimizing the Ecological Network to Construct an EcologicalSecurity Pattern in a Metropolitan Area: A Case Study of theJinan Metropolitan Area, China. Sustainability 2025, 17, 7342. [Google Scholar] [CrossRef]
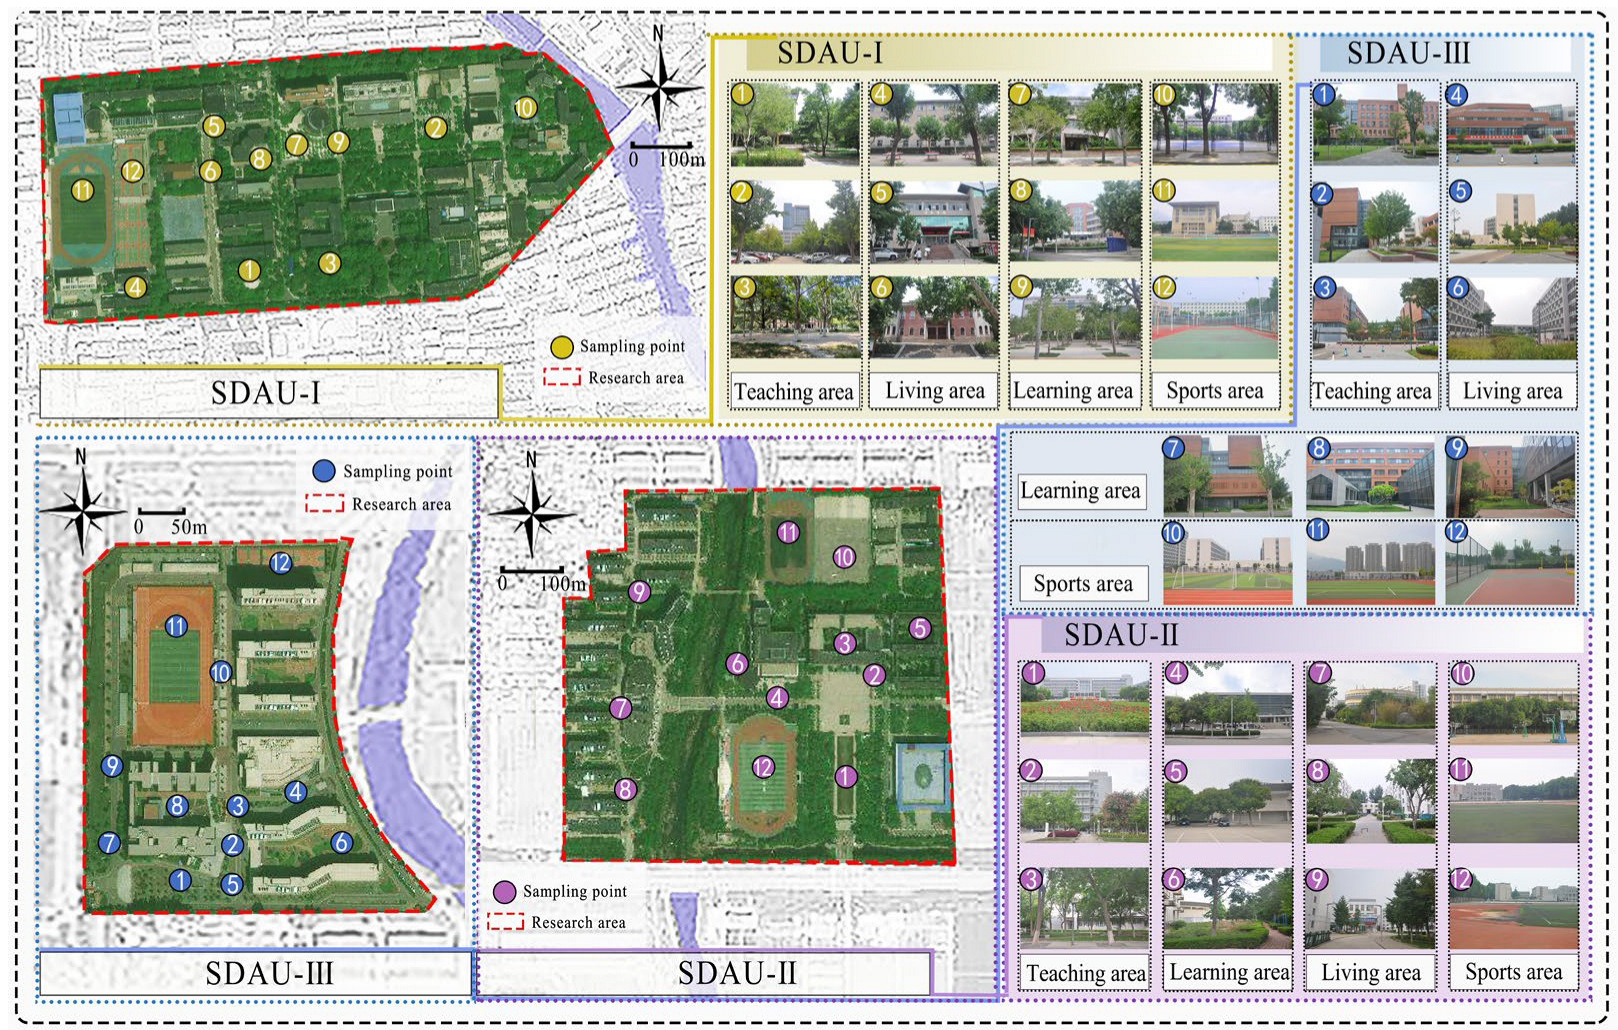
Figure 1. Images of 4 types of sample spaces.
Buildings 15 04290 g001
Figure 2. Semantic segmentation processing diagram of the DeepLab-V3+ model.
Buildings 15 04290 g002
Figure 3. Test equipment and measurement flow chart.
Buildings 15 04290 g003
Figure 4. Average values of HSV color extraction results.
Buildings 15 04290 g004
Figure 5. Expression of HSV color characteristics in the teaching area.
Buildings 15 04290 g005
Figure 6. Expression of HSV color characteristics in the living area.
Buildings 15 04290 g006
Figure 7. Expression of HSV color characteristics in the learning area.
Buildings 15 04290 g007
Figure 8. Expression of HSV color characteristics in the sports area.
Buildings 15 04290 g008
Figure 9. Topographical distributions and developments of α wave power spectral density.
Buildings 15 04290 g009
Figure 10. Alpha waves and subjective evaluation scores.
Buildings 15 04290 g010
Table 1. The differences in the correlation between the α wave power of the color spaces of the three campuses and the subjective evaluation scores.
CampusFunctional ZoningNα WaveSubjective Evaluation Scores
Mean + SDp-valueMean + SDp-value
SDAU-ITeaching area306.89 ± 0.230.013 *3.61 ± 0.19<0.0001 **
Living area307.47 ± 0.25<0.0001 **4.10 ± 0.170.002 *
Learning area306.49 ± 0.28<0.0001 **3.56 ± 0.170.021 *
Sports area309.39 ± 0.22<0.0001 **4.49 ± 0.22<0.0001 **
SDAU-IITeaching area305.56 ± 0.25<0.0001 **3.43 ± 0.16<0.0001 **
Living area308.67 ± 0.03<0.0001 **4.20 ± 0.210.004 *
Learning area305.38 ± 0.250.016 *3.39 ± 0.150.024 *
Sports area308.62 ± 0.260.024 *4.23 ± 0.17<0.0001 **
SDAU-IIITeaching area306.56 ± 0.15<0.0001 **3.81 ± 0.14<0.0001 **
Living area306.87 ± 0.18<0.0001 **3.82 ± 0.090.012 *
Learning area305.00 ± 0.260.009 *3.02 ± 0.270.037 *
Sports area308.47 ± 0.360.011 *3.99 ± 0.15<0.0001 **
** indicates that the correlation reached a very significant level (p < 0.01), and * indicates that the correlation reached a significant level (p < 0.05).
Disclaimer/Publisher’s Note: The statements, opinions and data contained in all publications are solely those of the individual author(s) and contributor(s) and not of MDPI and/or the editor(s). MDPI and/or the editor(s) disclaim responsibility for any injury to people or property resulting from any ideas, methods, instructions or products referred to in the content.