1. Introduction
1.1. Background and Purpose of the Study
3D printing, also referred to as additive manufacturing (AM), is a manufacturing technique that completes a product by continuously stacking materials. 3D printing techniques have various applications depending on the properties of the stacked material [
1]. For biodegradable plastics, such as polylactic acid (PLA), fused deposition modeling (FDM) can be applied using the inherent thermoplasticity of the material, whereas the adhesive-spraying binder jetting (BJ) method can be applied for ceramics, sand, and metal in a powder form [
2,
3,
4].
In cementitious composite, a typical construction material, the fluidity changes with the mix ratio of cement, aggregate, and bound water and the time immediately after adding the bound water. The material loses its fluidity and solidifies within a few hours to several days [
5,
6,
7]. These characteristics make it suitable to apply material extrusion (ME), a 3D extrusion method that extrudes the material [
8,
9]. Here, “fluidity” is used as a collective term encompassing rheological parameters such as static and dynamic yield stress, viscosity, and extrudability.
ME continuously prints from the same layer while moving the coordinate axes according to the designed model, such that layers such as contour lines are generated in the printing direction of the printout. As the phase change in the polymer used as the printing material in FDM 3D printers can be controlled from fluid to solid via temperature, the unit thickness can be controlled in micrometer units during printing. However, in cementitious composite, the composition materials (e.g., aggregate) are relatively large, and the hydration reaction that cures the cement is time-dependent. Therefore, a unit thickness of several millimeters to centimeters is necessary to uniformly print within the time that fluidity is maintained when using ME 3D printers [
10]. These printing characteristics of cementitious composite increase the layer thickness.
Construction-use 3D printouts with a large unit thickness are finely stacked like the existing polymer-based 3D printouts, thereby making it possible to evaluate the characteristics of the unit thickness. The unit thickness characteristics can be evaluated during printing, and the uniformity of each layer thickness is the basis for predicting geometric errors when stacking is completed. These factors can help reduce the time and effort required to complete the printout and control dimensional errors of the printout before completing the 3D-printed structure for medium and large-scale construction purposes. The designed model may also be compared with the printout using this information. Accordingly, the thickness characteristics of ME-printed structures using cementitious composite are suitable for evaluating 3D printing techniques for construction.
To clearly detect the layered boundaries that enable the evaluation of layer thickness from construction 3D printer output images, image analysis using deep learning is advantageous over conventional computer vision techniques such as edge detection, as it can minimize the influence of surface roughness inherent to cementitious materials.
1.2. Research Scope and Method
As a method to evaluate the unit thickness characteristics of outputs from 3D printers, previous studies have proposed a uniformity evaluation equation based on the dispersibility of the layer thickness values measured in different areas [
11,
12]. This evaluation method involves taking photos of the printout, manually tracing the layer boundaries in a black-and-white image, and then converting this image into binarized data to measure the thickness and calculate the uniformity. Using this method, measurement errors due to fatigue may occur when the measurer visually detects the interlayer boundary lines in the photos of the printout; in addition, the same photo may lead to different results. To prevent these possibilities, averaging the results over as many trials as possible is ideal, but this requires extensive effort.
Artificial intelligence (AI) algorithms have recently seen rapid developments thanks to advances in computing power, and they are especially prominent in the image processing field (e.g., pattern analysis and detection). In the construction field, research is underway on techniques to detect patterns difficult to visually detect due to various environmental conditions (e.g., crack detection); these techniques involve capturing images of the patterns, using them to train a deep learning model, and then detecting the target. Researchers are also applying 3D printing to techniques that autonomously correct the printing parameters by verifying the exterior of the printout in real-time through computer vision techniques [
13,
14,
15,
16,
17]. Image detection using these deep learning models can also be applied to automatically detect and measure the layer thickness boundary lines of the printout. In 3D concrete printing (3DCP), the most directly observable quality characteristic—serving as a comprehensive indicator of both printing parameters and material properties—is uniform layer thickness, and various approaches have been proposed to assess this trait. Recent literature explicitly identifies print speed and layer thickness as principal metrics reflecting 3DCP’s geometric features, which are ultimately linked to material performance. These studies note that, if computer vision can be leveraged to monitor layer thickness variation, ensuring uniformity becomes critical for maintaining quality in 3DCP output [
18,
19].
This study uses a digital image processing algorithm and machine learning to improve the accuracy and reproducibility of the evaluation method for unit thickness uniformity of 3D printouts and simplifies the evaluation procedure. The digital image processing algorithm is used to reprocess photos of the printout to apply during training, and the deep learning model uses these photos in training to detect the interlayer boundary lines more accurately. Additionally, to validate the results, we compare the layer thickness uniformity values obtained using the interlayer boundary lines traced by the measuring system and those detected by the algorithm.
2. Printing Cementitious Composites for 3D Printers
2.1. Equipment and Materials Used for 3D Printing
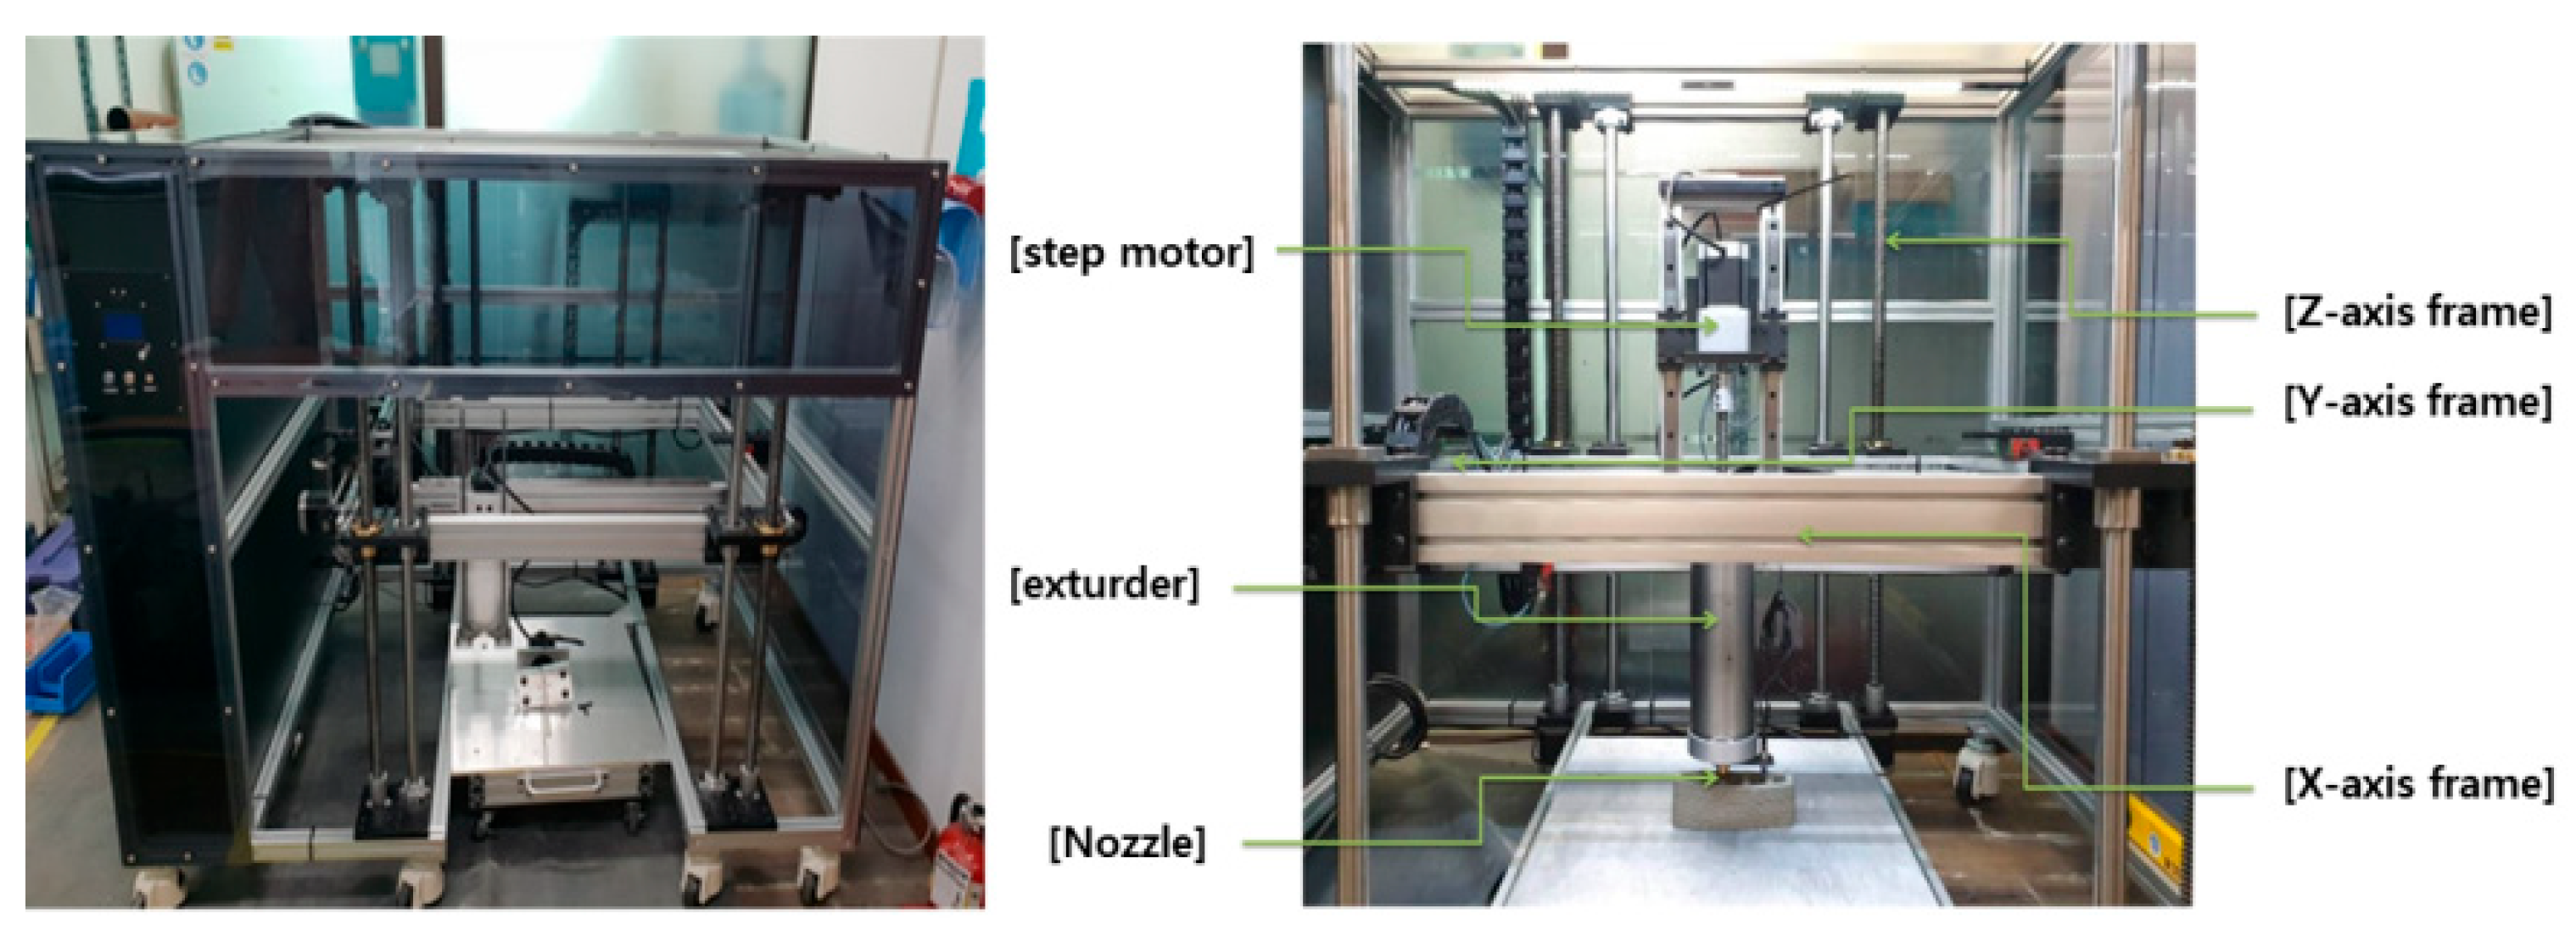
This study used a gantry-type ME 3D printer that allows movement on the X, Y, and Z axes around the printing nozzle. Considering the printing performance of the mortar printing material, the nozzle diameter was set to 3.0 mm, the printing speed to 20 to 25 mm/sec, and the extrusion speed was 125 to 165 e-steps/mm. The extrusion speed, a parameter indicating the rotations of the stepper motor upon printing 1 mm of mortar, can be adjusted during printing according to the mortar’s fluidity. The layer height was set to 2.50 mm, which is lower than the diameter of the cementitious composite filament to promote adequate interlayer bonding, and the extrusion multiplier was fixed at 1.00. Retraction was not applied due to the material properties. The infill density was set to 0, as the primary objective was to evaluate the external stratification boundaries of the printed specimen.
Figure 1 shows the configuration of the 3D printer.
Ordinary Portland cement (OPC) and fly ash (FA) were used for the binder to create the cementitious composite for 3D printing. When using a mixture of OPC and FA, the concrete’s fluidity increases and the heat of hydration is suppressed by the pozzolanic reaction, which is advantageous for long-term strength development. Therefore, the long-term strength of the cementitious composite for 3D printing can be improved [
20]. In the pozzolanic reaction of FA, strength is not developed via reactions with alumina and silicon dioxide, which are eluted from the pozzolanic materials, and calcium hydroxide, which is the hydration product of OPC, in the absence of curing. As such, an appropriate amount of FA should be mixed with OPC.
Fine aggregate silica sand (SS) was used as the aggregate for mixing the cementitious composite for 3D printing. SS is extensively used in high-ductility cementitious composites containing fibers because, as the maximum size of the aggregate increases, the fracture path of the cement matrix lengthens and the fracture toughness increases, adversely impacting the induction of steady-state cracks [
21]. The relationship between the fracture paths and the cement matrix and aggregate size is also applied to cementitious composites during 3D printing. Considering 3D printers produce output by stacking filaments, aggregates larger than necessary may reduce the adhesion force when present between the layer interfaces during the printing of cementitious composites. Therefore, we excluded the use of a coarse aggregate and used SS, which is a fine aggregate judged to have relatively little impact. By using SS, the roughness of the 3D printout’s surface can be controlled to properly print the desired exterior. However, using more SS than necessary can degrade the performance of this process via the viscosity and fluidity of the system, which are rheological properties required for 3D printing, and therefore an appropriate amount should be used.
Ethylene vinyl chloride (EVCL), a polymer-based material, was used as an additive to improve the mechanical properties of the cementitious composite 3D printout. When mixing EVCL with OPC, the workability and material separation resistance are improved in an unconsolidated state via the hydrocolloid properties, and cement hydrate and polymer film mutually form, thereby improving the tensile strength and brittleness and enhancing performance metrics such as adhesion, airtightness, and chemical resistance. Therefore, this material is used for waterproofing and repairs [
22]. A methylcellulose-based thickener was used as an admixture to maintain the cement stacking properties after 3D printing. Using a thickener can increase the viscosity in an unconsolidated state and prevent the printout from breaking down during 3D printing. Though the additive and admixture do not comprise a large proportion of the materials used, these materials have a mix ratio threshold at which performance can be improved. Therefore, an appropriate amount must be applied as excessive amounts can lower system performance.
Table 1 shows the basic properties of the cementitious composite printout used for 3D printing.
2.2. Mix Design and Specimens
The most important performance factor in cementitious composites for 3D printing is fluidity, which must be controlled within a specific range to enable printing and stacking using a 3D printer. Moreover, the desired mechanical properties must be satisfied using a mix ratio that ensures the required fluidity range. In the mix design of cementitious composites for 3D printing, the ratio between materials, type of binder and admixture, and type of aggregate vary in each R&D case, and therefore, the indicators reflected in the mix design also differ. This study employed a mix design using the void ratio
as a single performance indicator that can reflect each mix factor via the relationship between the void ratio
and fluidity in an unconsolidated cementitious composite; this method was confirmed in a previous study [
23]. This mix design method is based on the water film thickness theory, which assumes that this relationship is due to lubrication that occurs as excess water moves between the fluid micropores of the unconsolidated cementitious composite, and is effective when designing composites of granular materials such as mortar and concrete [
24].
The void ratio
considering the mix design indicators can be obtained using Equations (1)–(3), as specified below. Using OPC, FA, EVCL, and the thickener as described above, the void ratio range for 3D printing was calculated to be 0.5 to 0.8 in this study.
is calculated as the interparticle gap within the mortar, based on wet packing density and derived from the water-to-solid particle ratio, effective density, and total mixture quantity. This metric reflects both the particle arrangement and pore structure present within fresh mortar.
Here,
is the volumetric ratio of water to solid granular material (-);
is the volume of the mixing water (cm3);
is the volume of the solid granular materials (cm3);
is the wet packing density of cementitious composite (-);
is the mass of fresh cementitious composite (g);
is the volume of fresh cementitious composite (cm3);
is the density of the mixing water (g/cm3);
is the density of solid constituents other than water (g/cm3);
is the volume fraction of those constituents (-);
is the void ratio (-).
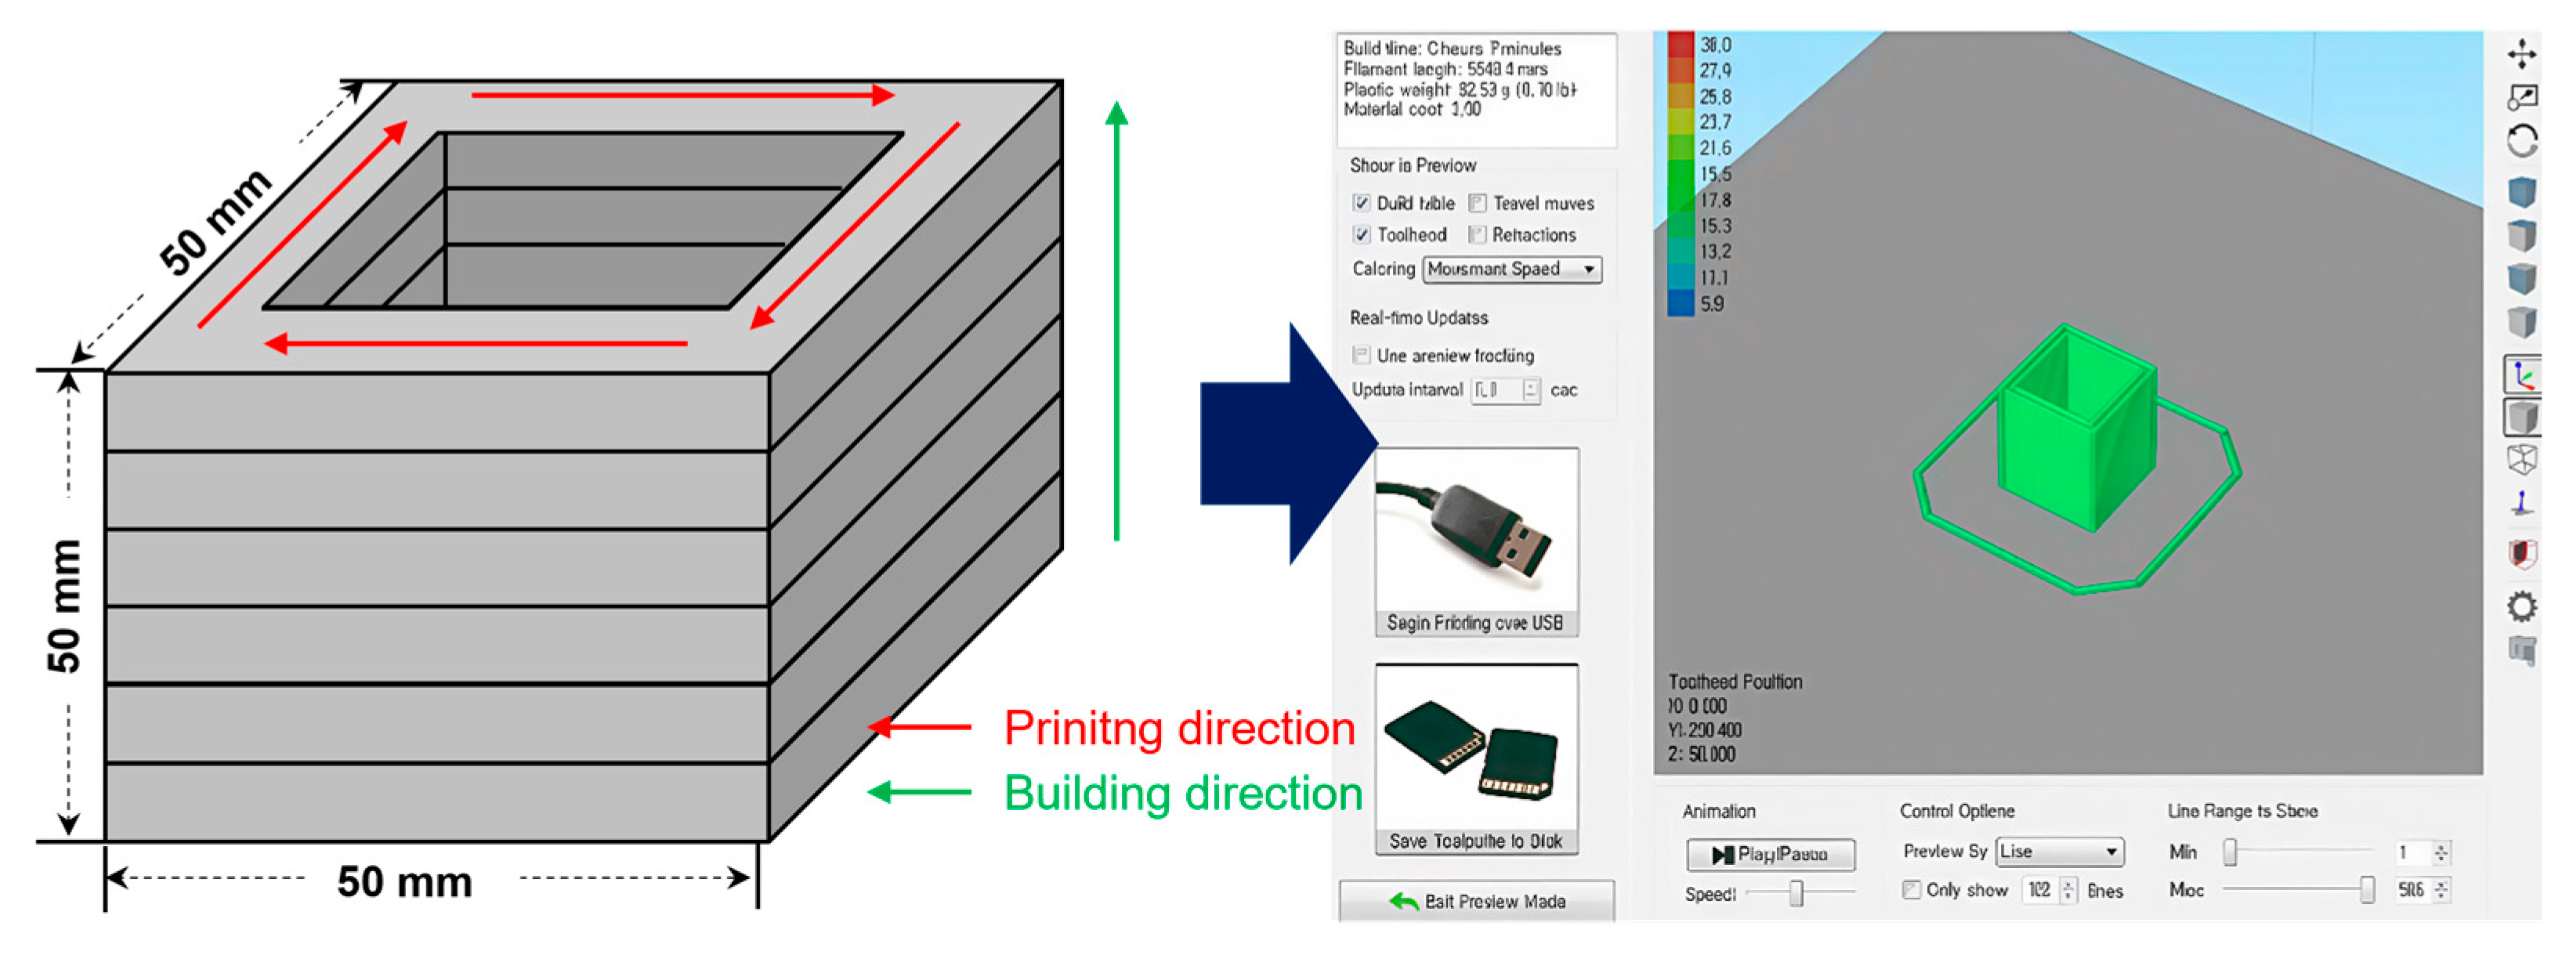
To evaluate the stacking performances of the printouts based on images, we designed a cementitious composite mix ratio with a void ratio range of 0.6 to 0.7 and then modeled and 3D-printed a hollow 50 × 50 × 50 mm square structure.
Figure 2 shows a schematic of the specimen and the model input to the system.
3. Evaluation Method of the 3D Printouts
3.1. Evaluation Method of the Layer Thickness Uniformity
In specimens printed with ME 3D printers, unique interlayer boundary lines occur due to the manufacturing method of printing and stacking unit filaments. The unit thickness is related to the dimensional error and precision of the 3D printout and is an important factor that impacts strength. For FDM 3D printers that melt the polymer for printing, when printing a polymer material using an average nozzle size within 0.5 mm and controlling the layer thickness to 0.1 to 0.5 mm, the tensile strength and flexural strength of the polymer printout decrease as the layer thickness increases [
25,
26]. However, the tensile adhesive strength increases and then decreases once a certain thickness is exceeded.
When printing cementitious composites with a 3D printer, the layer thickness can serve as a key quality parameter. In printed elements, the lower layers may undergo thickness variations due to the self-weight of the upper layers before hardening, which reduces the dimensional accuracy of the printed structure. Moreover, since the control of layer thickness depends on both the material properties and printing parameters, maintaining uniform layer thickness can be regarded as an indicator of well-controlled process parameters [
27,
28,
29].
This finding demonstrates that the layer thickness impacts the mechanical properties [
30]. Therefore, the layer thickness is a critical factor influencing the geometric and mechanical properties of the 3D printout, which can be indirectly evaluated by the degree to which uniform thickness in each layer is maintained. 3D printers for construction using a cementitious composite typically have a larger nozzle diameter than the above-described FDM and exhibit comparatively large printouts. This makes the interlayer boundary lines clearly visible, facilitating the evaluation of the layer thickness.
Considering the evaluation method of the printout layer thickness, the coefficient of variation (CV) was calculated to compare the standard deviation characteristics of the thickness values measured at each measurement point. A smaller CV means there is less dispersion from the mean; that is, the measured thickness values are more similar to one another. For convenience of comparison and to quantitatively express uniformity, the uniformity index was defined by a natural exponential function, where the negative of the CV is used as the exponent of e. Since CV is always a non-negative value, this notation ensures that as layer thickness becomes more uniform (lower CV), the uniformity index approaches 1. Typically, a CV less than 0.1 indicates very stable dispersion, 0.1 to less than 0.3 indicates generally stable dispersion, and above 0.3 indicates unstable dispersion. Based on this exponential function, a uniformity index of 0.95 or greater is considered very stable, 0.74 to less than 0.95 is generally stable, and less than 0.74 is unstable.
Here,
is the layer uniformity (-);
is the layer thickness (number of pixels);
is the average layer thickness according to the direction (number of pixels);
is the number of measured layer thickness data points.
As the layer thickness uniformity was evaluated based on a statistical formula, the accuracy of this result improves with more layer thickness samples, and it is therefore advantageous to utilize as many data values as possible.
When using a measuring tool such as a vernier caliper, because many measuring points must be utilized, extensive effort is required and measurement errors can easily accumulate. A computer vision technique was used to overcome these problems, through which we measured the layer thickness of the 3D printouts with images taken with a constant angle of view and distance.
3.2. Evaluation Process of the Layer Thickness Uniformity Through Traced Images
The evaluation process for the layer thickness uniformity is as follows:
Take images of the printout for evaluation.
Binarize black and white images in which the interlayer boundary lines are traced.
Use the binarized data to measure the layer thickness in pixels.
Use the measured layer thickness data to derive the dispersion characteristics.
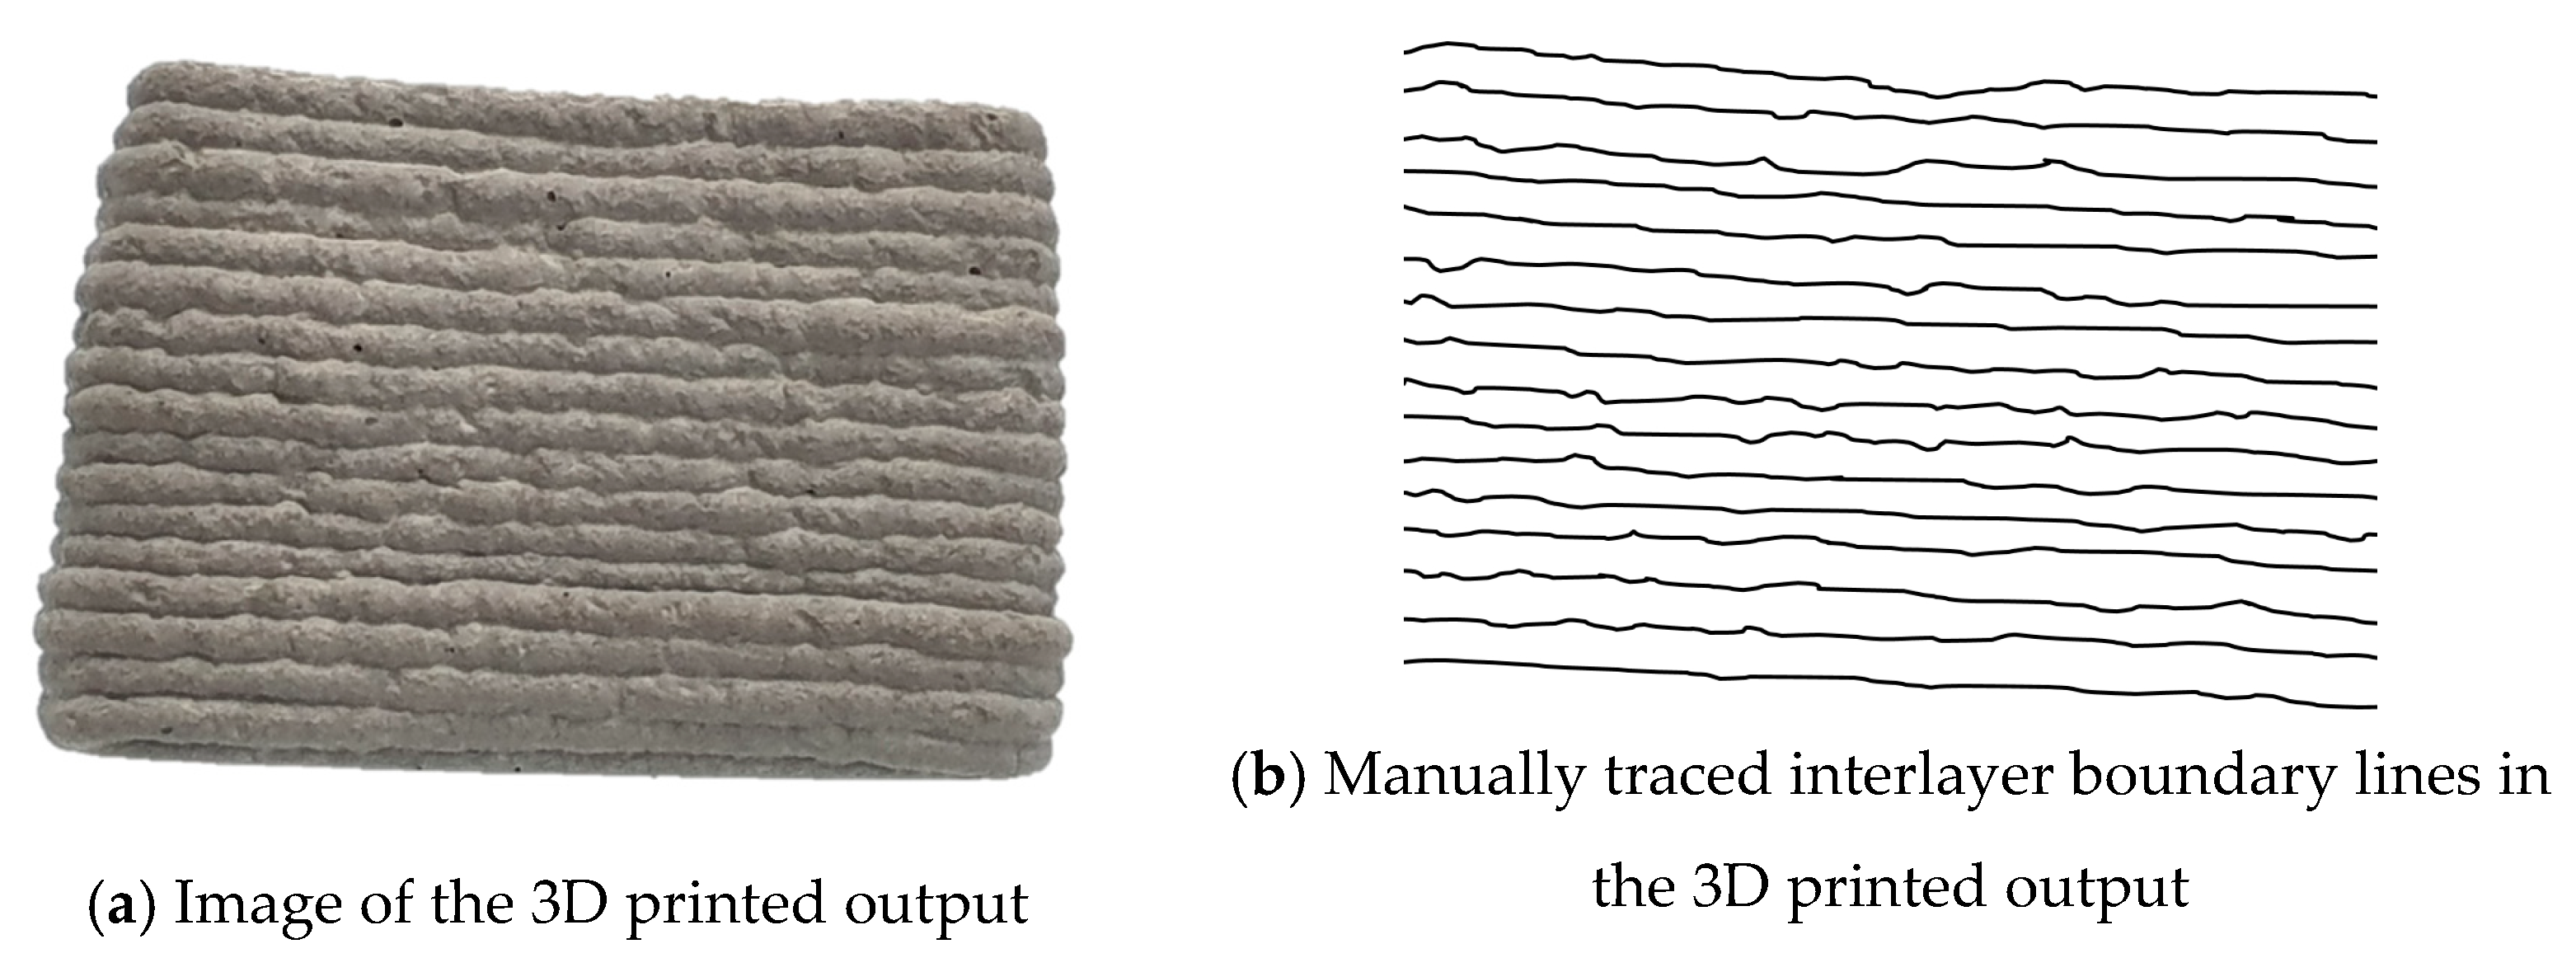
After taking images of the specimens with identical distance (300 mm), angle of view (77 degrees), and brightness conditions (500 lx) to detect the interlayer boundary lines under the same conditions, a suitable image editing program is used to manually trace the interlayer boundary lines of the photographed images. The specified imaging conditions were established to prevent excessive boundary depiction caused by shadows resulting from the surface morphology of the 3D-printed specimens and to optimize the learning efficiency even when a limited image dataset is used. As the proposed method is sensitive to variations such as illuminance, maintaining equivalent environmental conditions and consistent camera specifications is recommended to ensure reliable application.
3D printing is typically defined as having been completed only when each layer maintains continuity. Therefore, when manually tracing the interlayer boundary lines, continuous lines are created to avoid any interruption. Conversion to a black and white image is used to clearly distinguish the interlayer boundary lines from the drawn background. Under these image conditions, when the image is converted to binarized data, the layer thickness measurement algorithm can easily distinguish the interlayer boundary lines as 0 and 1. The algorithm calculates the layer thickness by counting the number of pixels between the interlayer boundary lines. If an interlayer boundary line is discontinuous, then when the image is binarized, the range up to another boundary line that does not share continuity is recognized as the layer thickness. In this case, the algorithm will make an excessive layer thickness measurement, and therefore care is required to maintain continuity. Once the above process has been conducted and a cluster of thickness values has been formed, the system can be evaluated using Equation (1), which derives the uniformity of the printed material.
3.3. Evaluation Process of the Layer Thickness Uniformity Using Deep Learning
As mentioned above, when a measurer visually detects the interlayer boundary lines in photos of the printout, measurement errors occur due to the fatigue of the measurer, and repeated detections of the same printout cannot produce identical results. Therefore, an automated process with consistent criteria is required to ensure objectivity. Through a literature review, we identified that various image processing techniques are being utilized to detect cracks in concrete similar to the shape of the interlayer boundary lines [
31,
32,
33]. Of these methods, the contour detection technique detects a continuous set of pixels in which the brightness values around the specific pixels in an image suddenly change. This is a useful technique for detecting characteristics that markedly differ from the normal concrete surface, such as cracks. Therefore, we attempted to detect the interlayer boundary lines in a pre-test using the contour detection algorithms of Sobel, Prewitt, Robert, and Laplacian. However, it was difficult to detect the ideal interlayer boundary lines by detecting the contrast properties of not only the boundary lines between printout layers, but also of the filament surface.
To overcome this problem, prior to detection, we attempted to first train the characteristic values of the interlayer boundary lines in the image for detection via AI learning. The following presents the improved evaluation process for layer thickness uniformity compared to the manual tracing method:
Take images of the printout for evaluation.
To detect the interlayer boundary lines in the image, label and learn the characteristics of the photographed image.
Inspect the interlayer boundary lines detected through learning and interpolate parts where continuity is not maintained.
Measure the layer thickness in the binarized image in pixels.
Use the measured layer thickness pixel groups to derive the dispersion characteristics.
Here, the manual tracing method refers to a process in which an operator visually identifies and directly draws the interlayer boundary lines of the 3D printed specimen to generate an image.
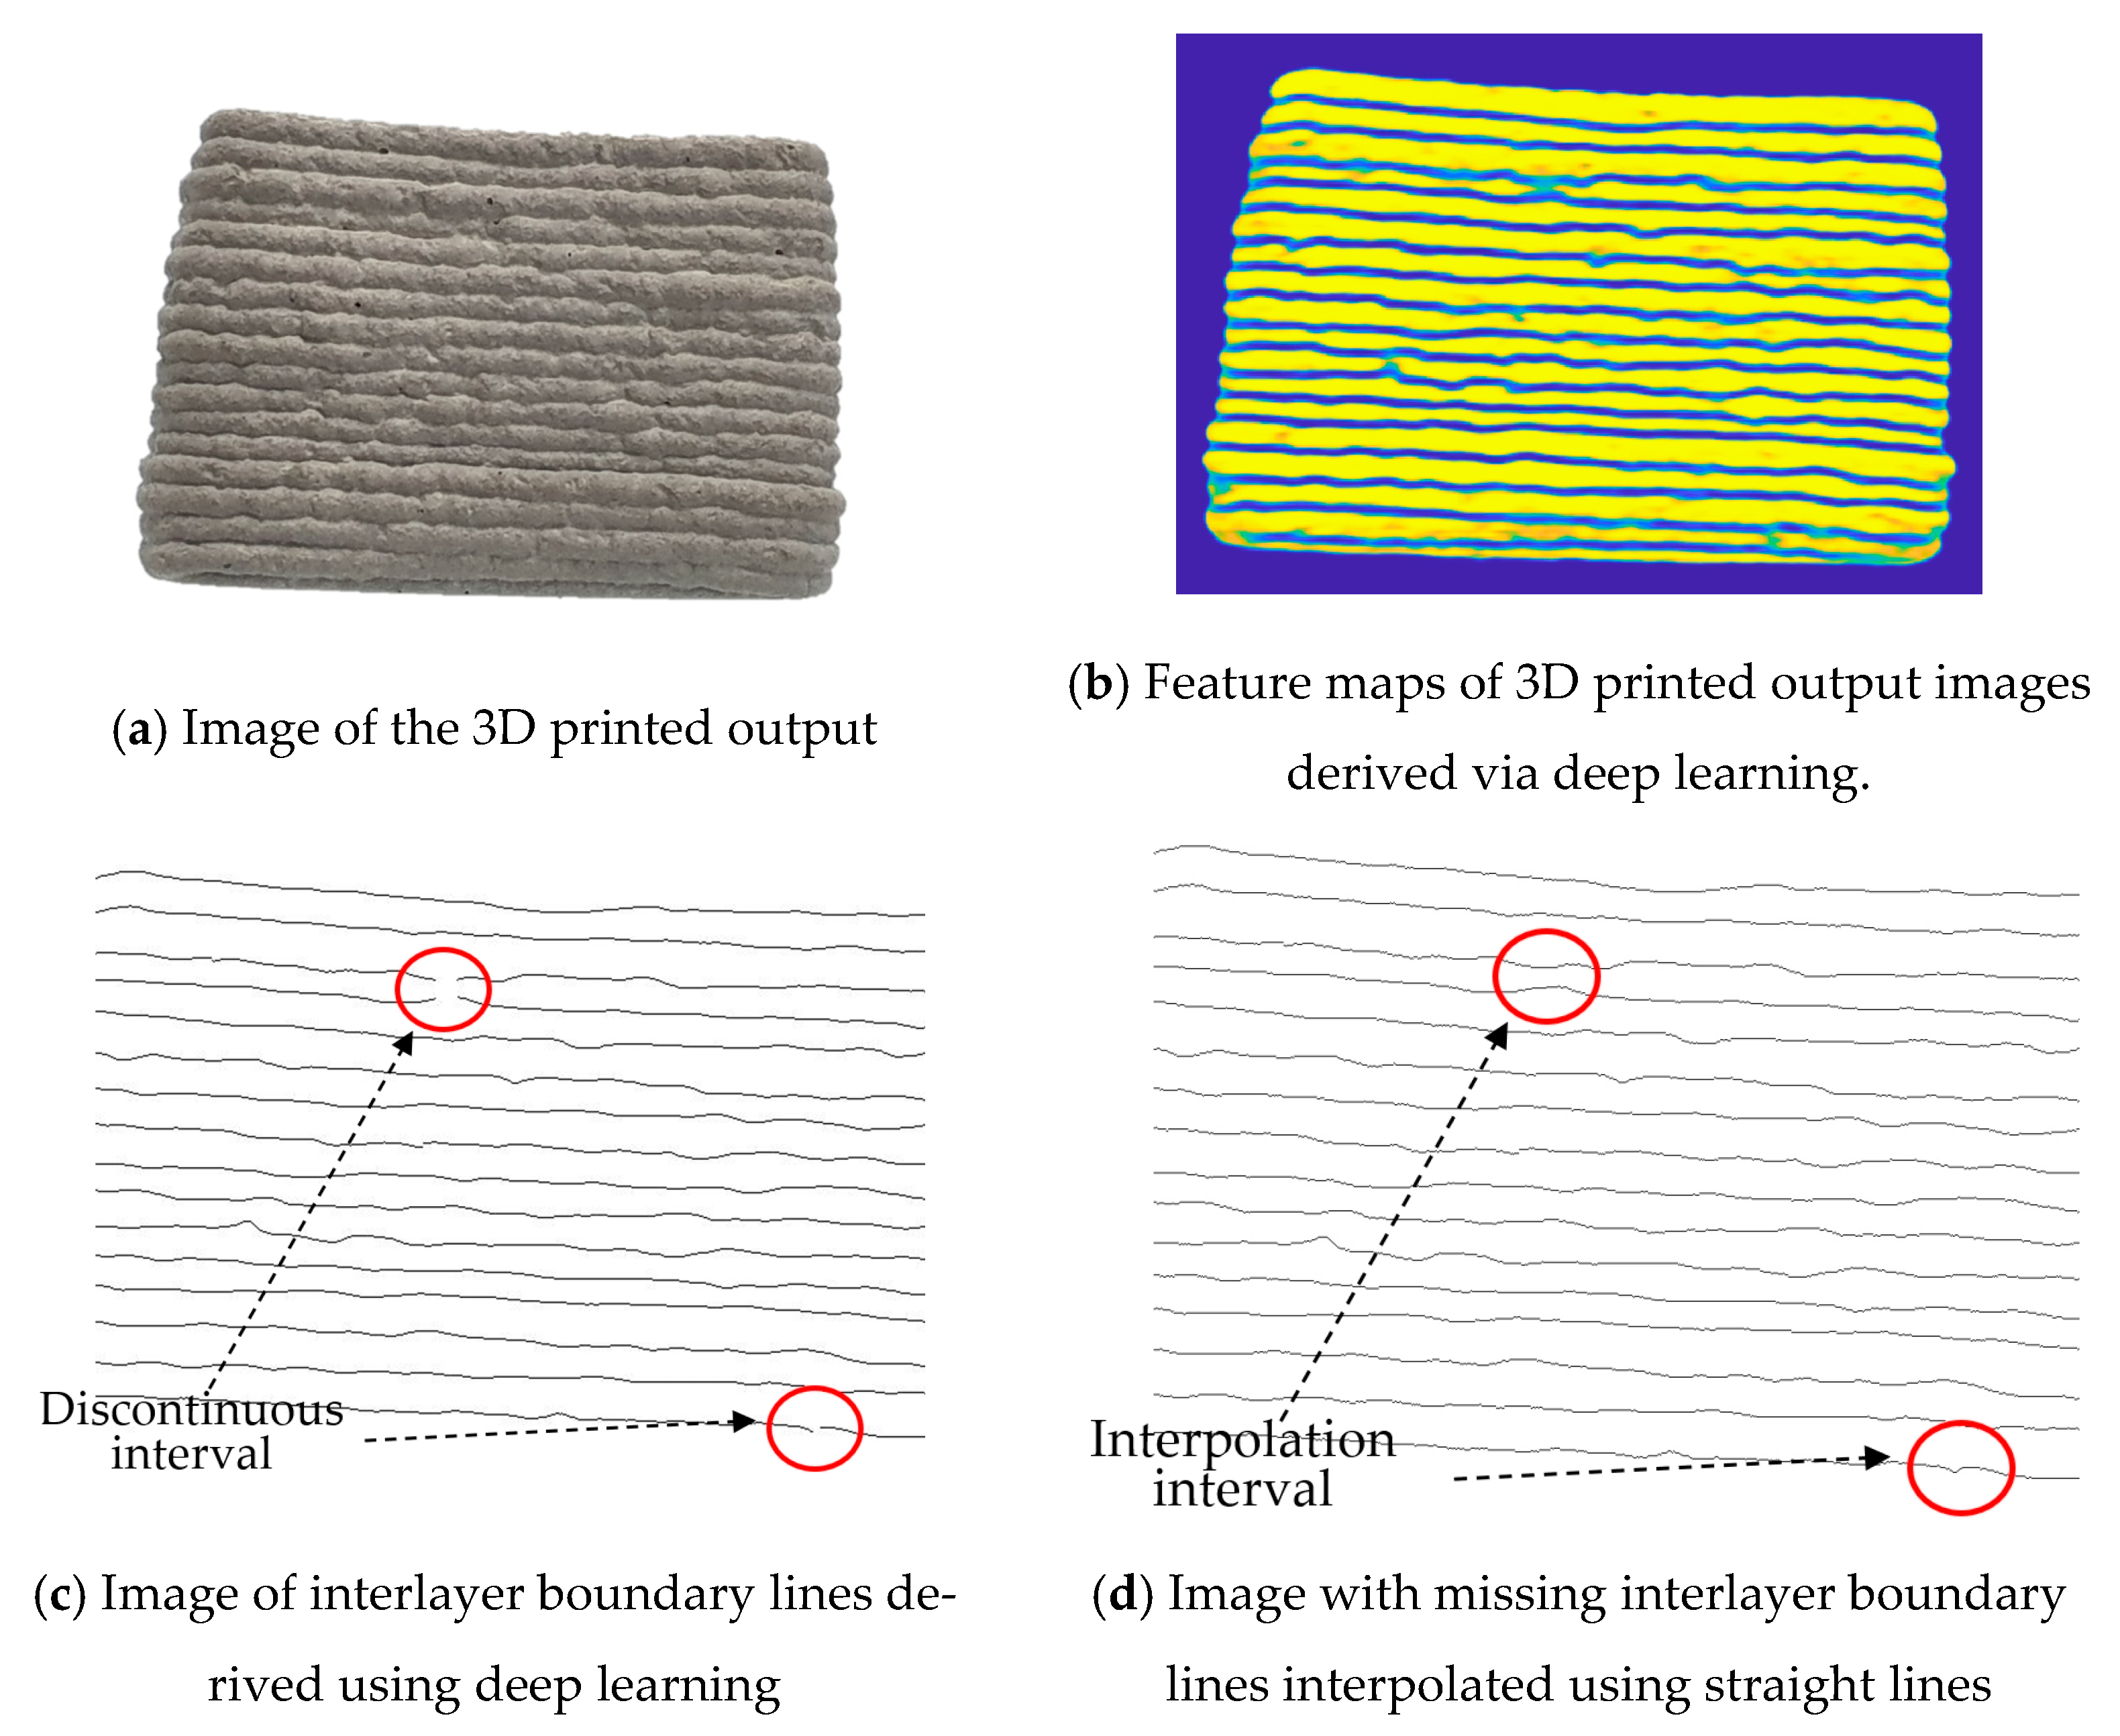
While this process is similar to the existing method for evaluating the layer thickness uniformity, to ensure objective measurements, the method of tracing the interlayer boundary lines was replaced with a method of detecting the interlayer boundary lines after learning the image characteristics via the AI system. For cases where perfect detection is difficult, we added a procedure for linearly interpolating interrupted interlayer boundary lines. These two additional procedures are automated processes that use a series of algorithms.
To use the algorithms that detect and linearly interpolate the interrupted parts of the interlayer boundary lines in the 3D printout, we assumed that the completely interpolated interlayer boundary lines had perfect continuity and did not interfere with each other. Moreover, the interlayer boundary lines detected through learning are inspected, and, in principle, if the length of a defective interlayer boundary line is very long and is one single object, then the image is retaken without interpolating the interrupted part. The linear interpolation algorithm for interlayer boundary line defects in the 3D printout image is applied after converting the image into a binarized matrix. The algorithm detects discontinuities in the interlayer boundary lines by analyzing the pixel information within the binarized image matrix, and then interpolates these defects. Specifically, interpolation points are defined by the start and end pixels of the detected discontinuous boundary segments, and the missing region is filled using a straight-line path with minimal distance connecting these points. The algorithm searches column by column, assigning as interpolation points any pixels where continuity is not maintained. This is achieved by checking whether a boundary pixel exists in the immediate next column; if not, and the process encounters consecutive zero values in the binarized image (with boundary pixels represented as 255 and background as 0), the region is identified as a boundary defect and interpolation is applied. Additional details on the interpolation algorithm are provided in
Figure S1 (Supplementary Materials).
4. Detection Model for Interlayer Boundary Lines Using Deep Learning
4.1. Overview of Convolutional Neural Networks
Computer vision techniques recognize an image as a 3D tensor of height, width, and channel data. Here, the height is the number of pixels in the vertical direction of the image, the width is the number of pixels in the horizontal direction of the image, and the channel is the color component. The color components are red, green, and blue such that there are three channels, and one pixel combines the three primary colors of each channel to represent the color. The pixel value of each channel can be expressed as a value between 0 to 255, where values closer to 255 indicate a stronger color of that channel and values closer to 0 indicate a weaker color. Based on the combination of light from the three primary colors, if all channel values are 255, then the pixel is white, and if they are all 0, then it is black. This tensor can digitize the image through various matrix operations. A convolutional neural network (CNN) is a type of deep learning model created by mimicking human optic nerves. It was first proposed by LeCun et al. as a neural network with excellent performance in image tensor processing, as mentioned above [
34]. Unlike general neural networks, CNNs do not process images as a single tensor; instead, they process them as a tensor divided into multiple parts to extract partial features. These extracted features can reflect the spatial structure of features according to the distance between pixels, thus enabling more efficient object detection than achieved by general neural networks, even if the pixel data around the target object in the image substantially changes.
CNNs consist of convolution, pooling, and fully connected layers. The convolution layer compresses the multiple pixel values in the image tensor into a single value and uses a two-dimensional tensor called a kernel. The core principle of this layer is to perform partial convolution operations of the kernel for each channel of the 3D image tensor. Sizes of 3 × 3 and 5 × 5 are generally used for the kernel. The kernel is sequentially applied from the top left to the bottom right of the image tensor to derive a feature map, which is a 3D image tensor smaller than the original size. For an image tensor with two or more channels, this may be expressed by summing the feature maps extracted from each channel. The pooling layer reduces the size by downsampling the feature map, which has two techniques: max pooling, which extracts the largest feature map value, and average pooling, which averages all values in the feature map. The max pooling technique is mainly used. Because the pooling layer simplifies the feature map to the size required for learning, it can improve learning efficiency and prevent overfitting caused by excess input data. The fully connected layer matches the features reduced in the feature map to the classes that must be classified through one-dimensional flattening.
Depending on their purpose, CNNs can be categorized into image classification, object detection, semantic segmentation, and instance segmentation. Because the purpose of this study is to learn the interlayer boundary lines by classifying uneven parts of a 3D-printed specimen, we used an image classification technique. Typical models for this include AlexNet [
35], VGG-16 [
36], and ResNet [
37]. The ResNet model is simple to build, and its training data is easy to generate, so we selected this as the CNN model for training
4.2. Deep Learning Model: ResNet
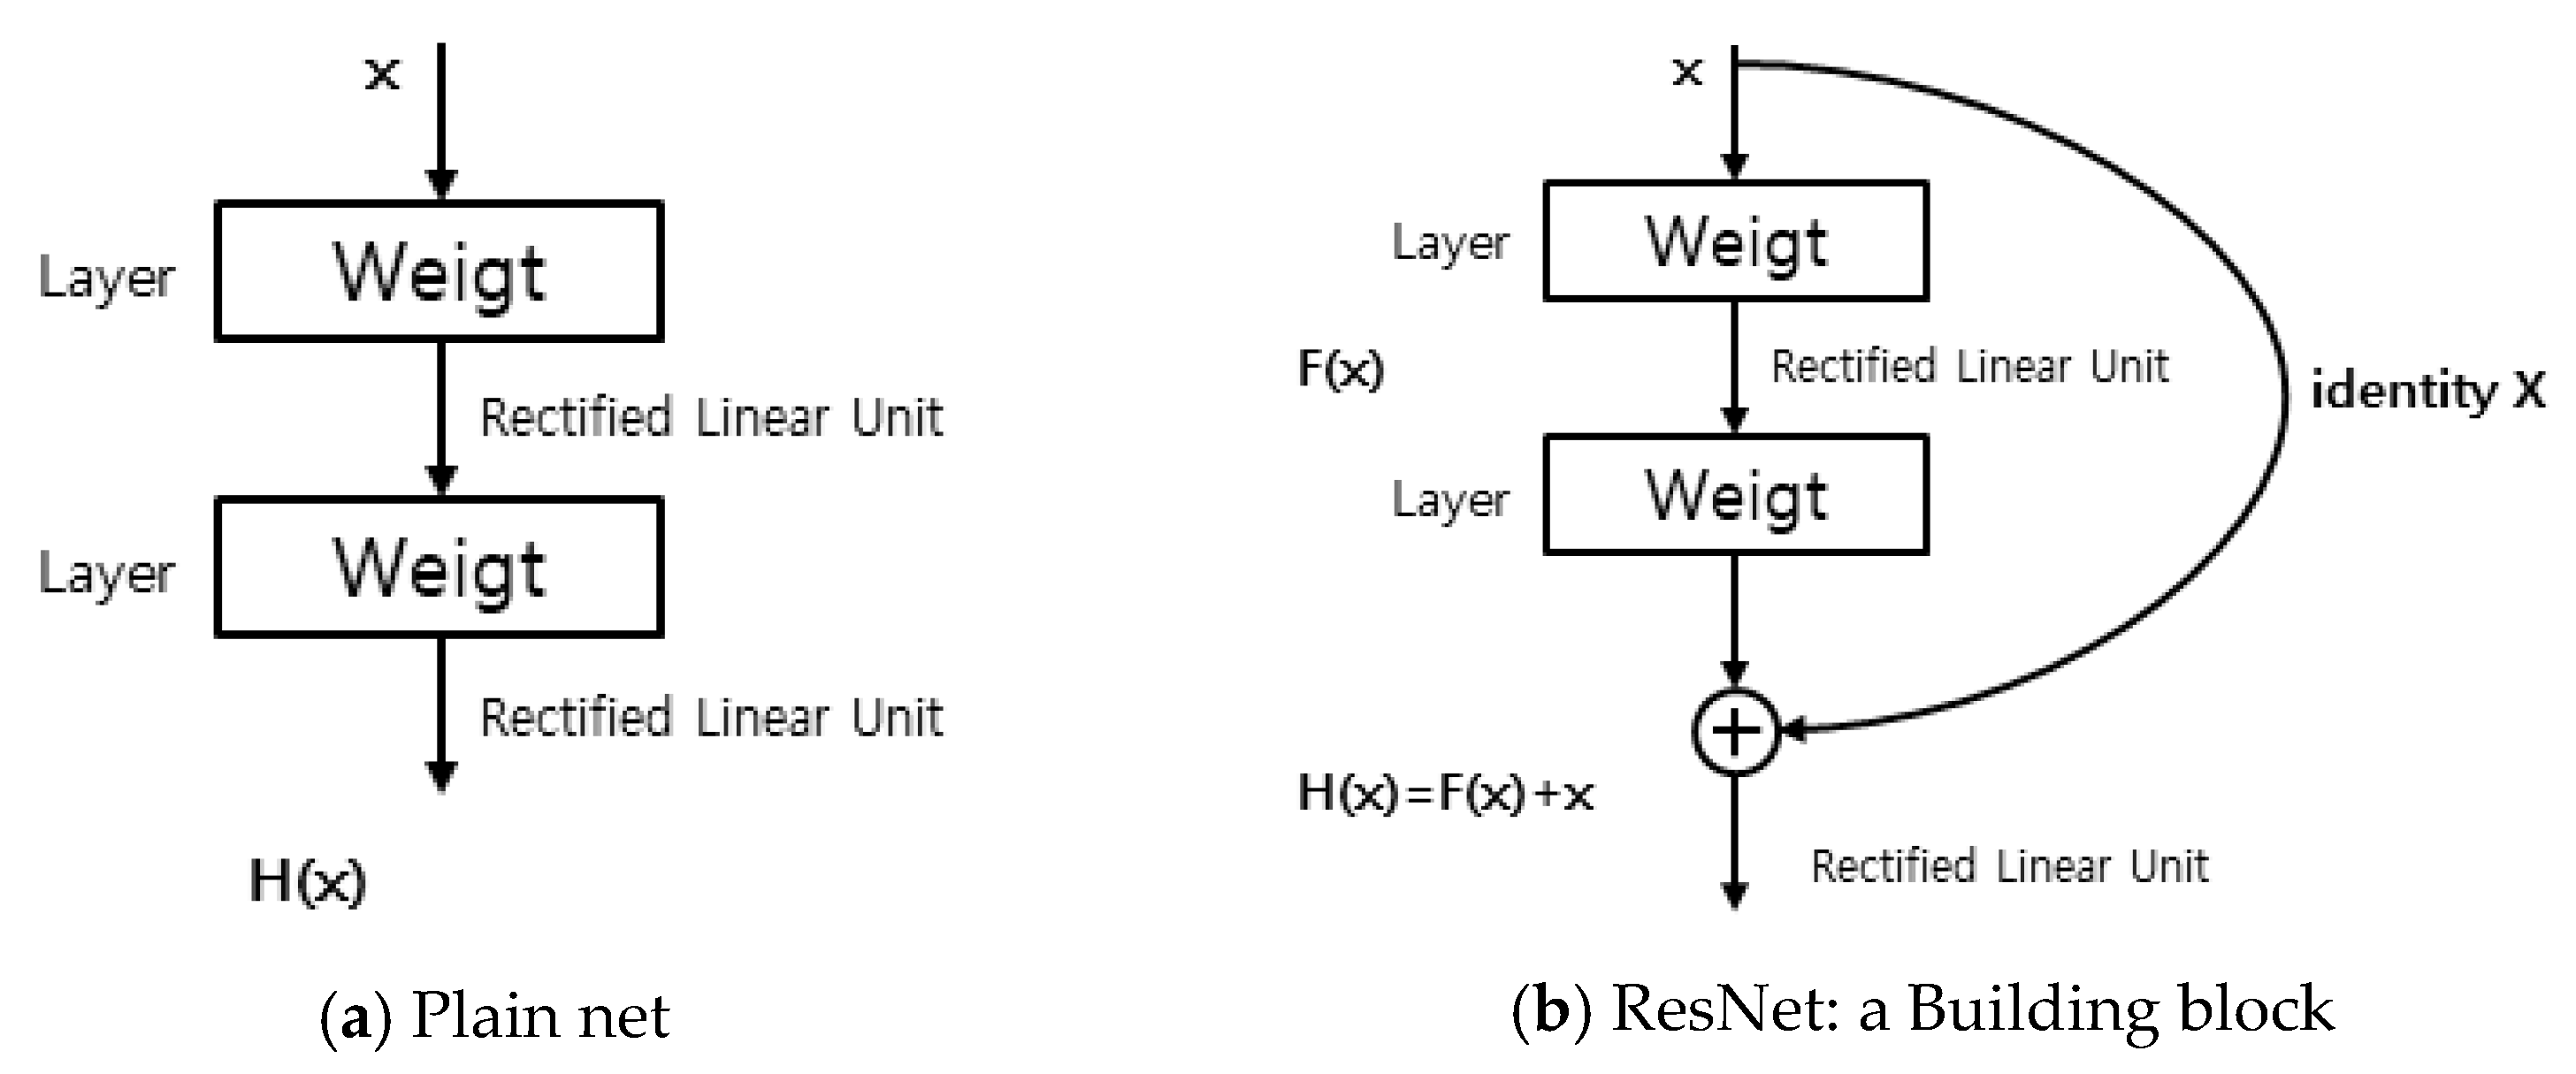
ResNet is a CNN model that achieved an error of 3.5% in the 2015 ImageNet Large-Scale Visual Recognition Challenge, demonstrating an excellent performance. To improve the performance of existing CNN recognition techniques, ResNet was proposed to solve the problems of the proportional increase in parameters and computational complexity for learning required to increase the network layer depth, as well as the rapid performance degradation observed after the system converges to the highest level. The learning performance deteriorates because as the network deepens, even though differentiation is repeated and backpropagation is performed, gradient vanishing occurs, in which the influence of weights affecting the results becomes insignificant. To overcome this problem, an easily implementable shortcut connection was added to the network structure, wherein the target H(x) is determined by adding the input value x to F(x) that has passed through the layer, and training was performed to minimize the residual between the model and input. Because this structure contains x input values, even if the layer is deep, gradient vanishing can be overcome by utilizing a minimum gradient for each layer.
Figure 3 shows the structures of the ResNet model and a general network. This study conducted training using the ResNet-50 model, which is a CNN consisting of 50 layers.
In this study, based on the aforementioned characteristics, ResNet-50—known for its high performance with a relatively small number of parameters and its pretraining on large-scale datasets, making it suitable for tasks such as detecting standardized boundary patterns—was employed to detect the layered boundaries of 3D-printed specimens.
4.3. Training Data Generation and Training
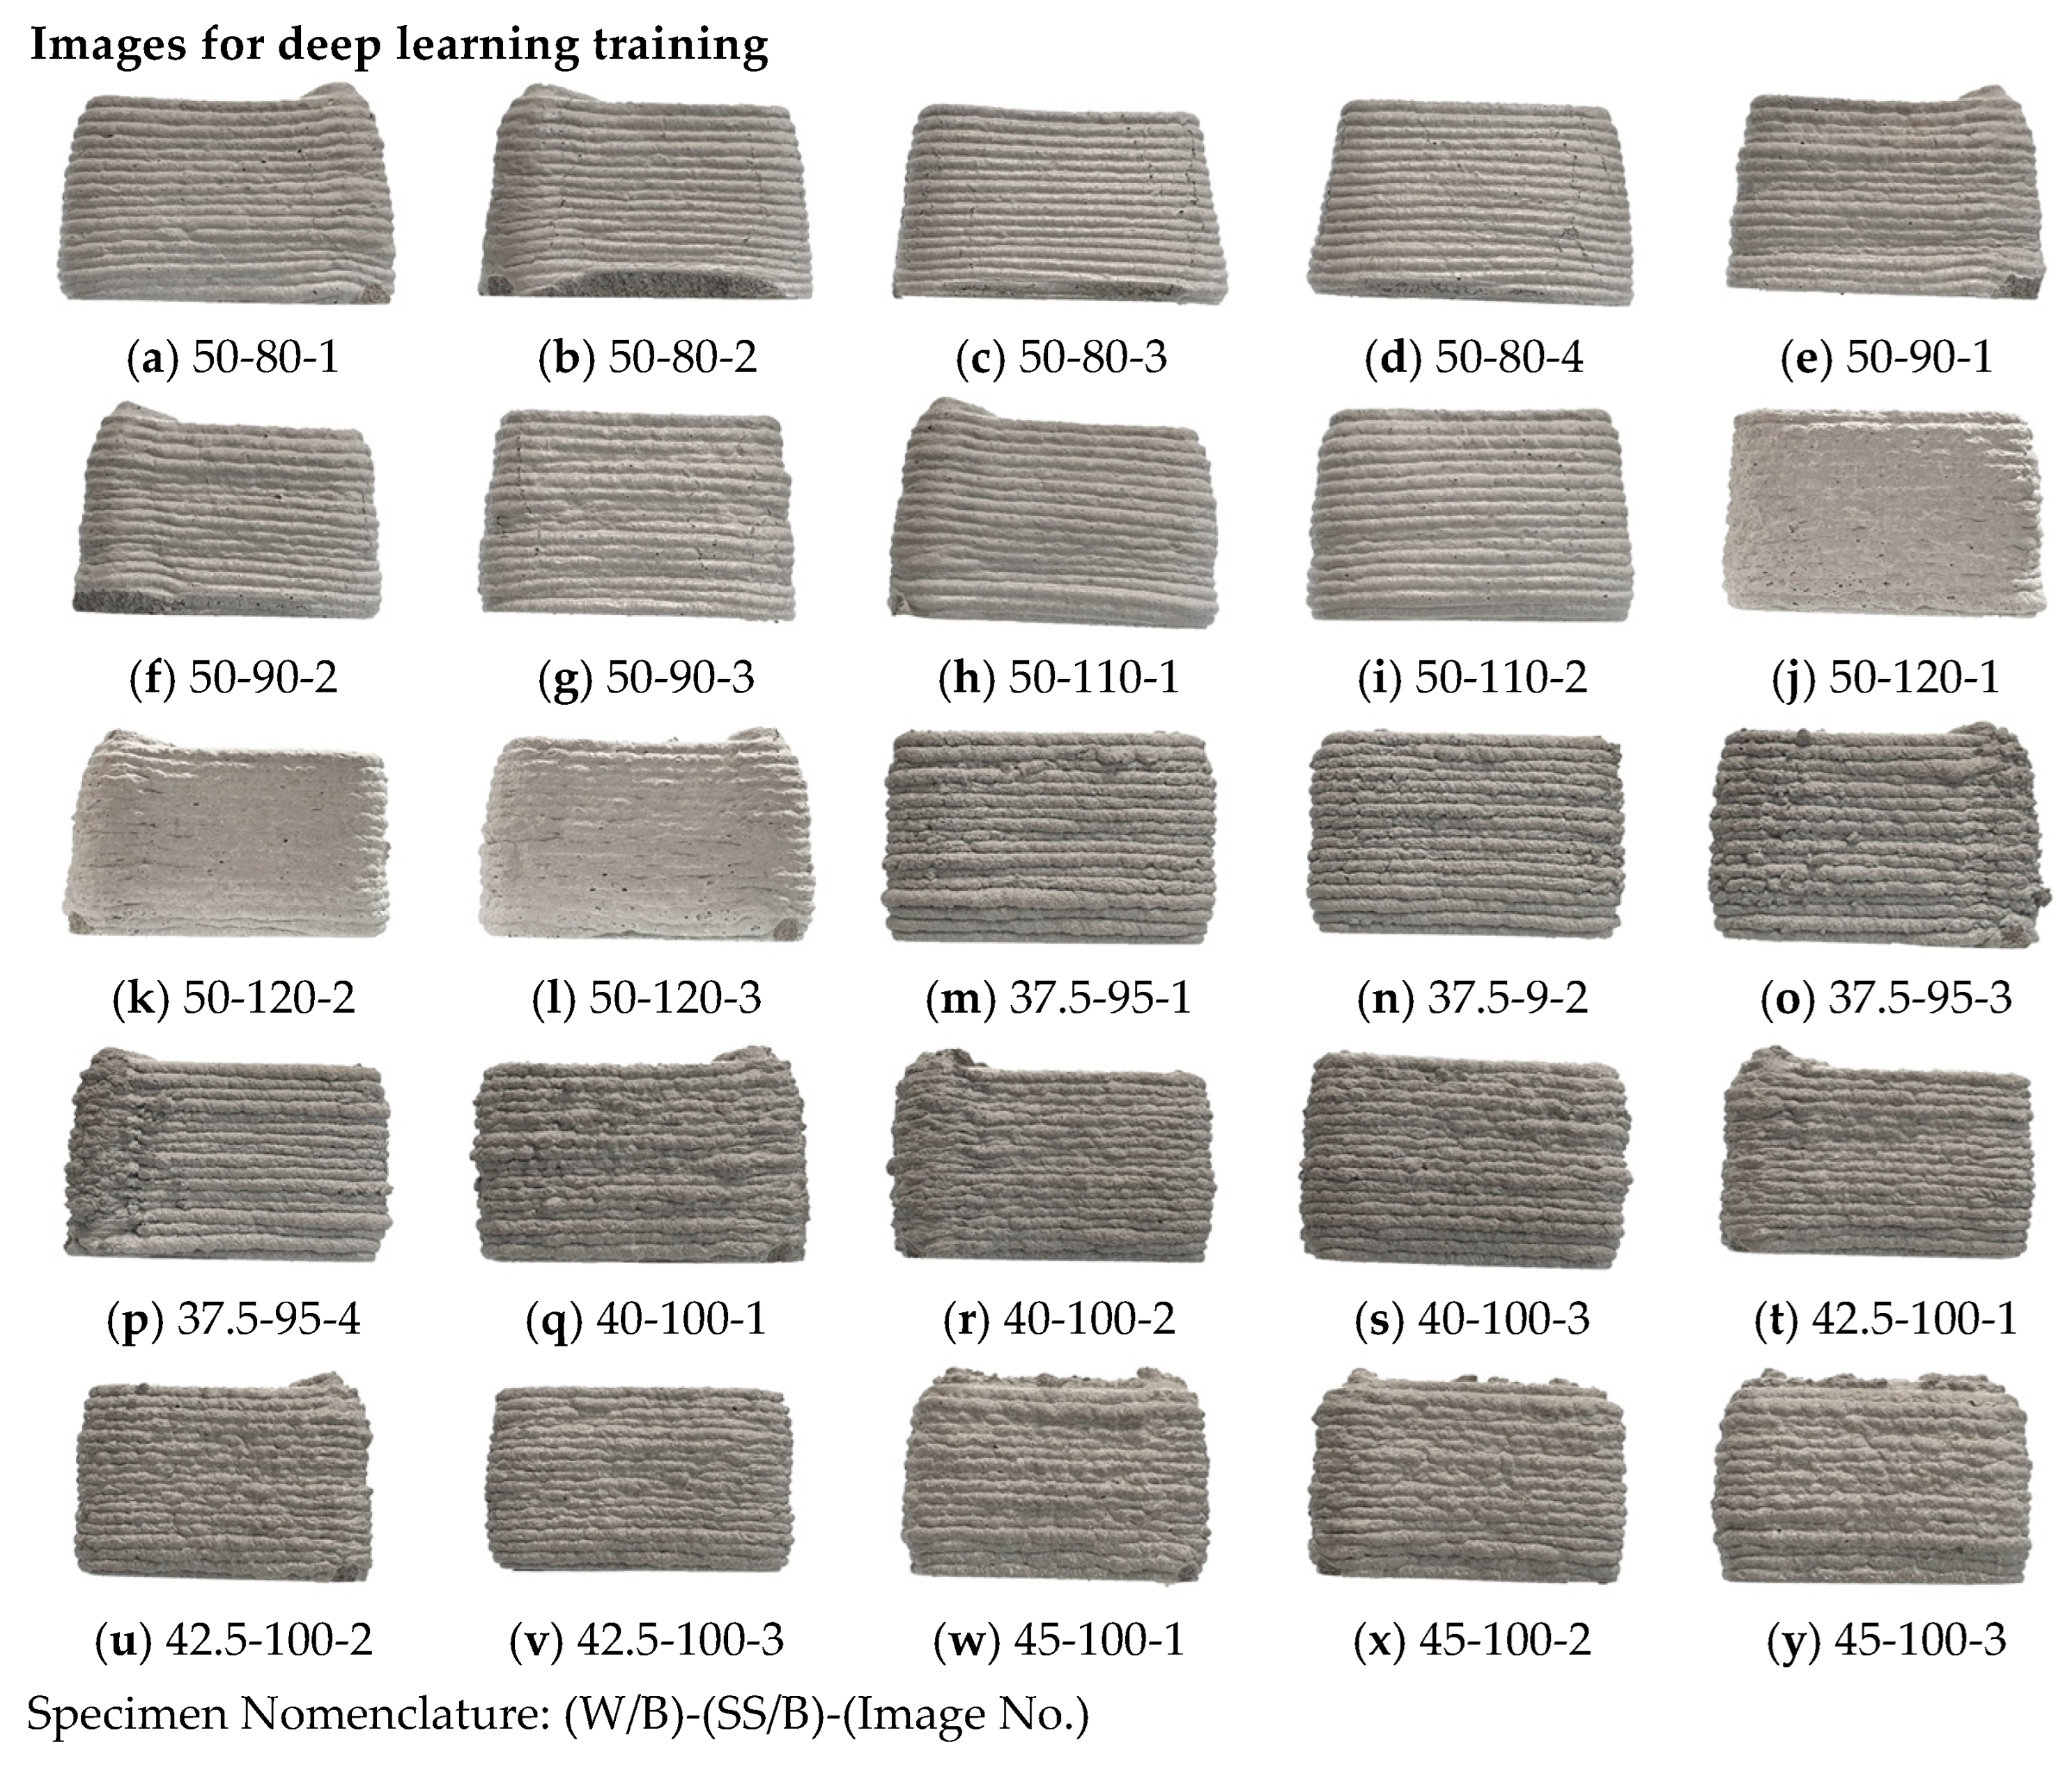
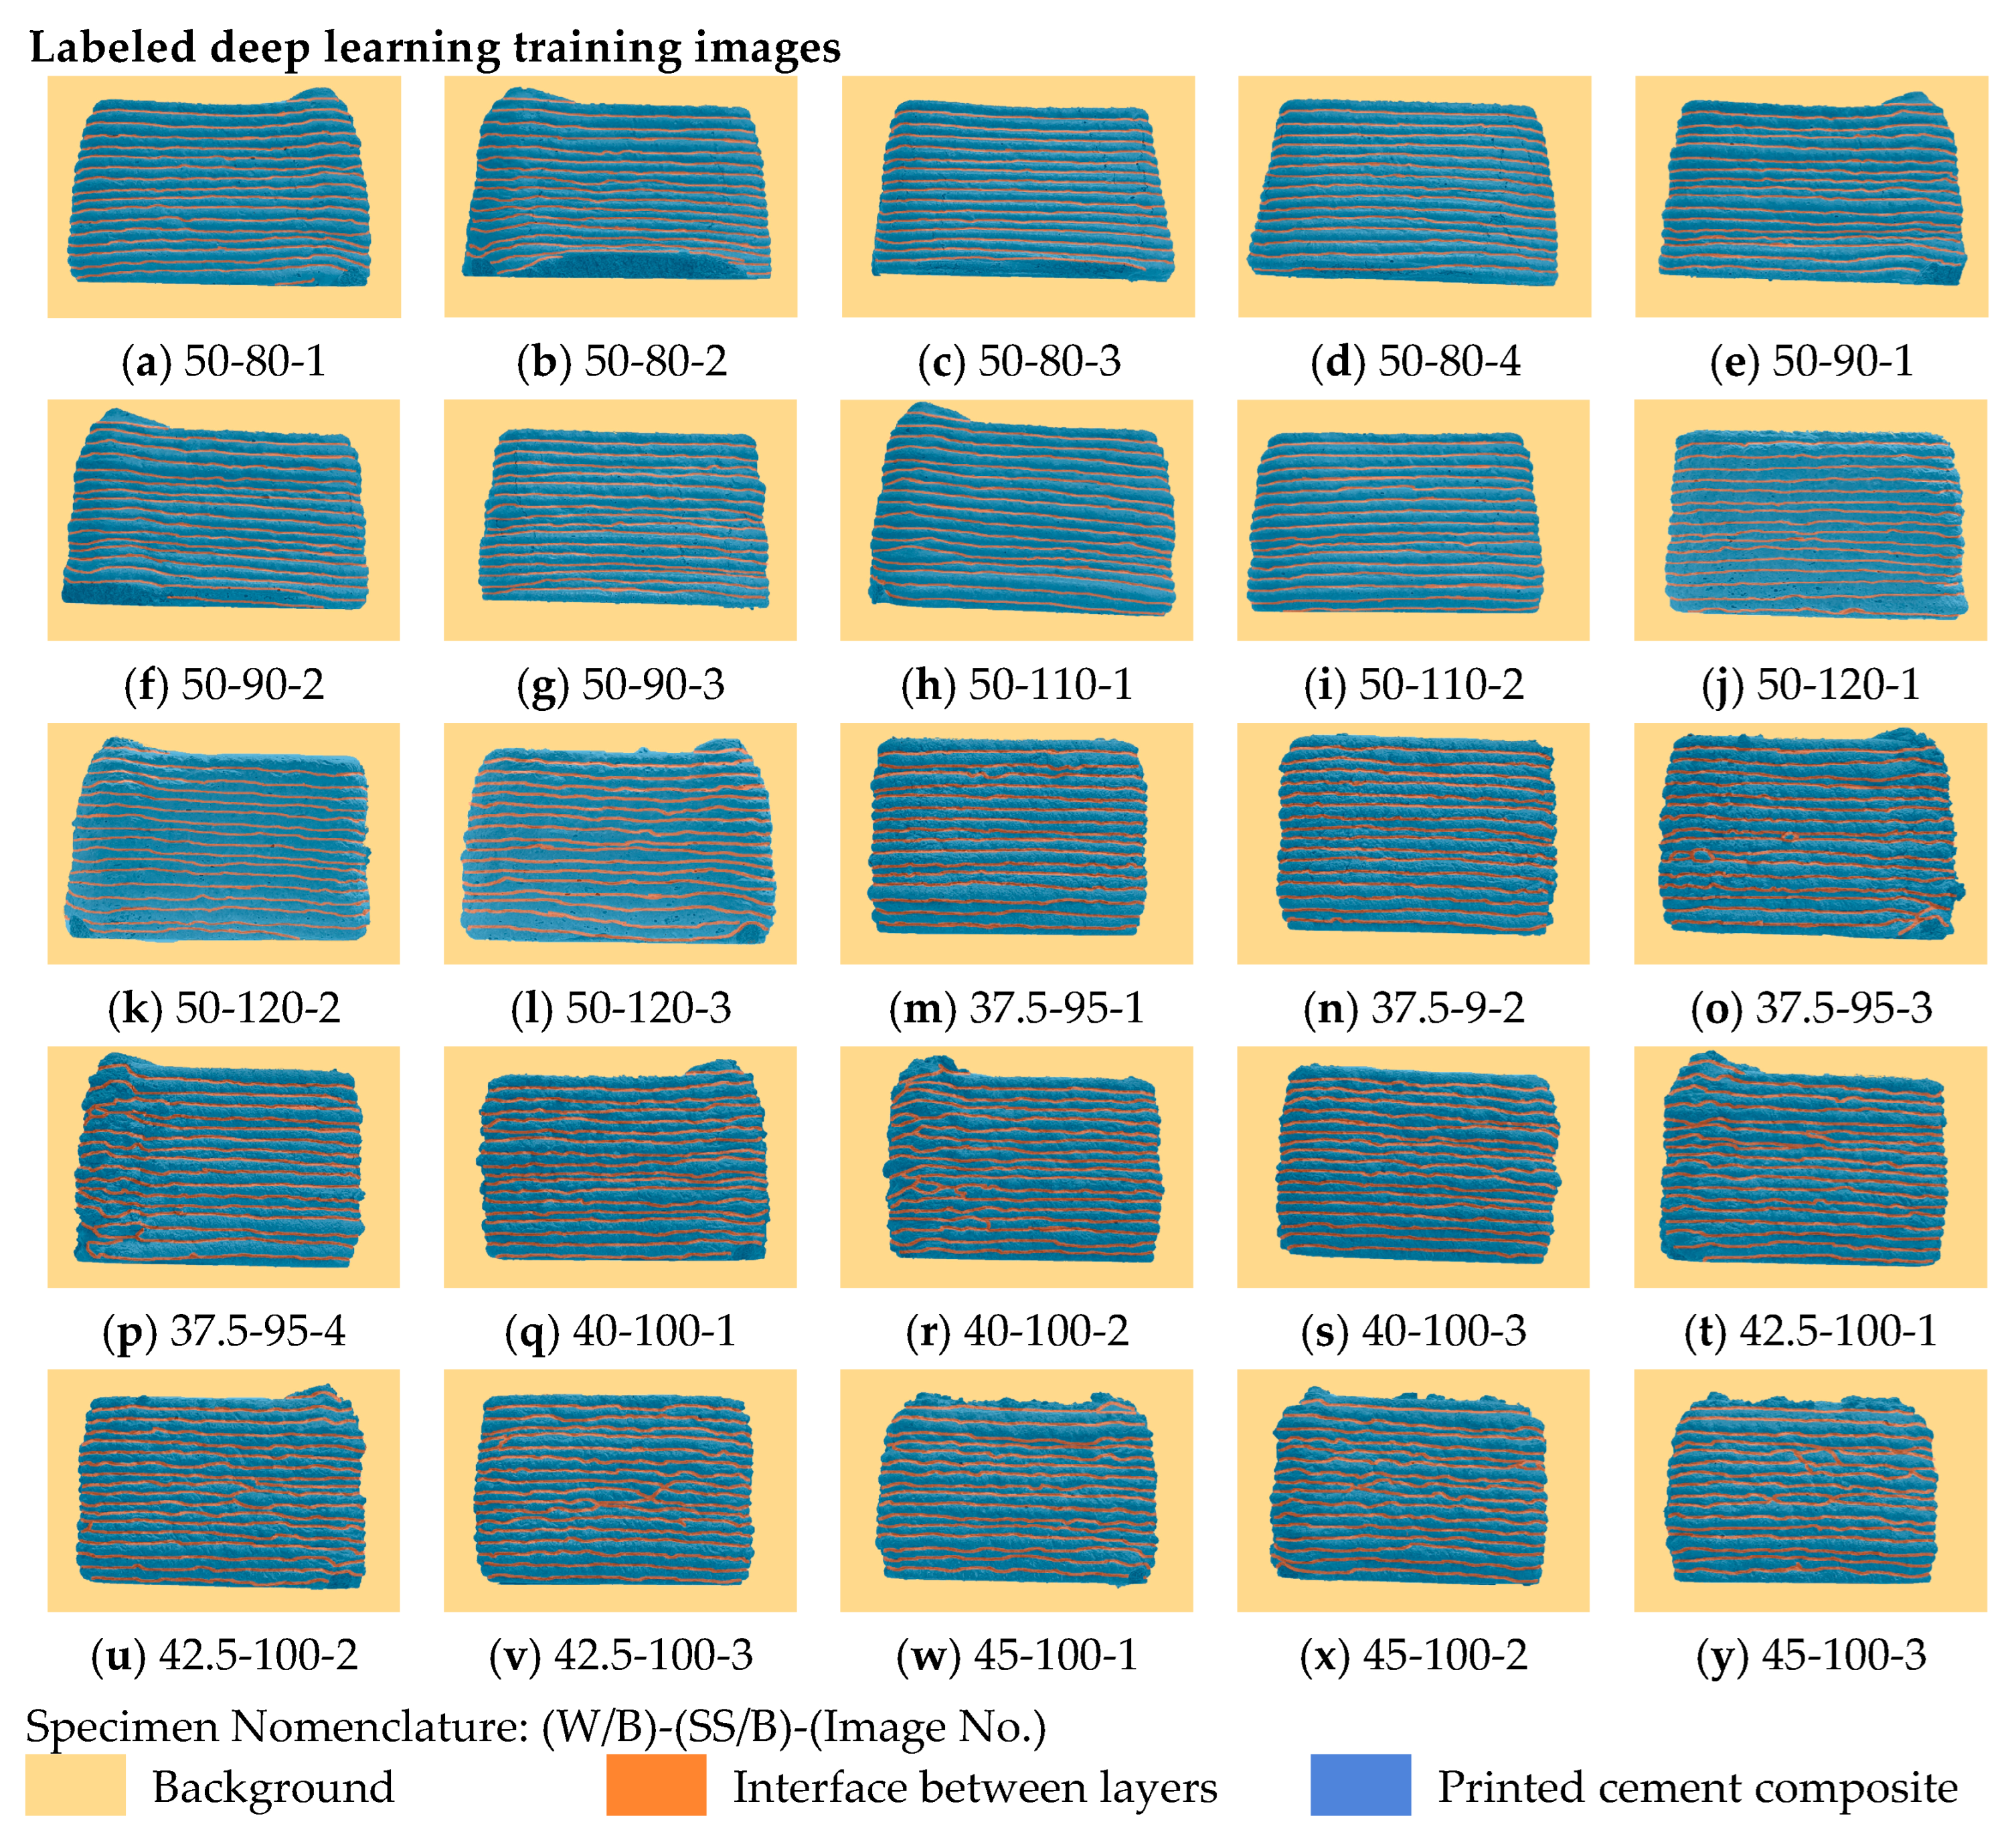
To learn and validate the interlayer boundary lines of the 3D printout, 25 color images of the specimens printed using Mix Designs 1 to 8 in
Table 2 were photographed with dimensions of 1280 × 720.
Figure 4 shows the photographed images. The quantity of data needed to successfully train the model depends on the required results and complexity of the learning algorithm. Learning accuracy is generally known to improve as the quantity of data increases. However, the purpose of this study is not to detect objects with differing attributes in various backgrounds, but rather to determine interlayer boundary lines in the images of standardized specimens. Therefore, we determined that learning is possible even with a comparatively small dataset of 25 images, and three of these images were used as validation data in the learning process.
To learn the interlayer boundary lines in the 3D printout images and derive results, each part constituting the images must be labeled. The 3D printout images were classified into three parts: background, interlayer boundary lines, and specimen. The rectangle of interest method, which boxes the areas to classify into rectangles, is the main method used to label images for deep learning. However, the geometry of the interlayer boundary line to be derived is not a specific object, but a feature included in the object, and the images were labeled in pixel units to reflect the unique uneven features of the 3D-printed specimens. The labels were divided into three classes of background, interlayer boundary line, and specimen, and
Figure 5 shows the labeling results of the 3D printout images by class.
5. Comparison of Evaluation Methods of Layer Thickness Uniformity
5.1. Overview of Layer Thickness Evaluations
The specimens for evaluating the layer thickness were 3D-printed using the hollow hexahedron model shown in
Figure 2, and the mix designs presented in
Table 2 were applied. The images of specimens printed using Mix Designs 1 to 8 were used for deep learning, and identical angle of view and illuminance conditions were applied to each image. At least two images were acquired for each mix ratio and used as training images, and when acquiring multiple images for the same mix ratio, images taken from different directions were used.
Two methods were applied to evaluate layer thickness as described above. The first method involves calculating the layer thickness uniformity by manually tracing the interlayer boundary lines of the photographed 3D printout images. In the second method, various 3D printout images are learned, and the generated algorithm detects the interlayer boundary lines and uses the images obtained via the linear interpolation of parts where the interlayer boundary lines are interrupted or unclear to calculate the layer thickness uniformity. While the algorithms for calculating the layer thickness uniformity in each method are identically automated, the approaches differ in terms of whether there is an automated image preprocessing step for detecting interlayer boundary lines.
The 3D printout images used to compare the evaluation results of the interlayer boundary line thickness uniformity between the two methods are photographs of the specimen printed using Mix Design 9. This was selected such that the used images, separate from the deep learning images, were applied for automatic interlayer boundary line detection.
5.2. Calculation Results of Layer Thickness and Uniformity (Traced Images)
To minimize factors that interfere with the detection of interlayer boundary lines in the 3D printout images with the traced interlayer boundary lines, the background of the 3D printout was excluded, a range in which the interlayer boundary line is clearly visible was selected and used for evaluation, and the same conditions were applied to the images derived by deep learning. Additionally, while the 3D printouts have a total of 17 layers, 15 layers in the image were used to calculate the layer thickness and uniformity, excluding the first and last layers. This was performed to eliminate the trial and error reflected in the first and last printings and take samples of the middle interlayer boundary lines, which are expected to exhibit the most stable layer thickness outputs from the 3D printer. To use the deep learning-derived images to compare the calculation results of the layer thickness and uniformity, images with traced interlayer boundary lines were created with extensive effort.
Figure 6 shows the images in which the interlayer boundary lines of the 3D printout are traced.
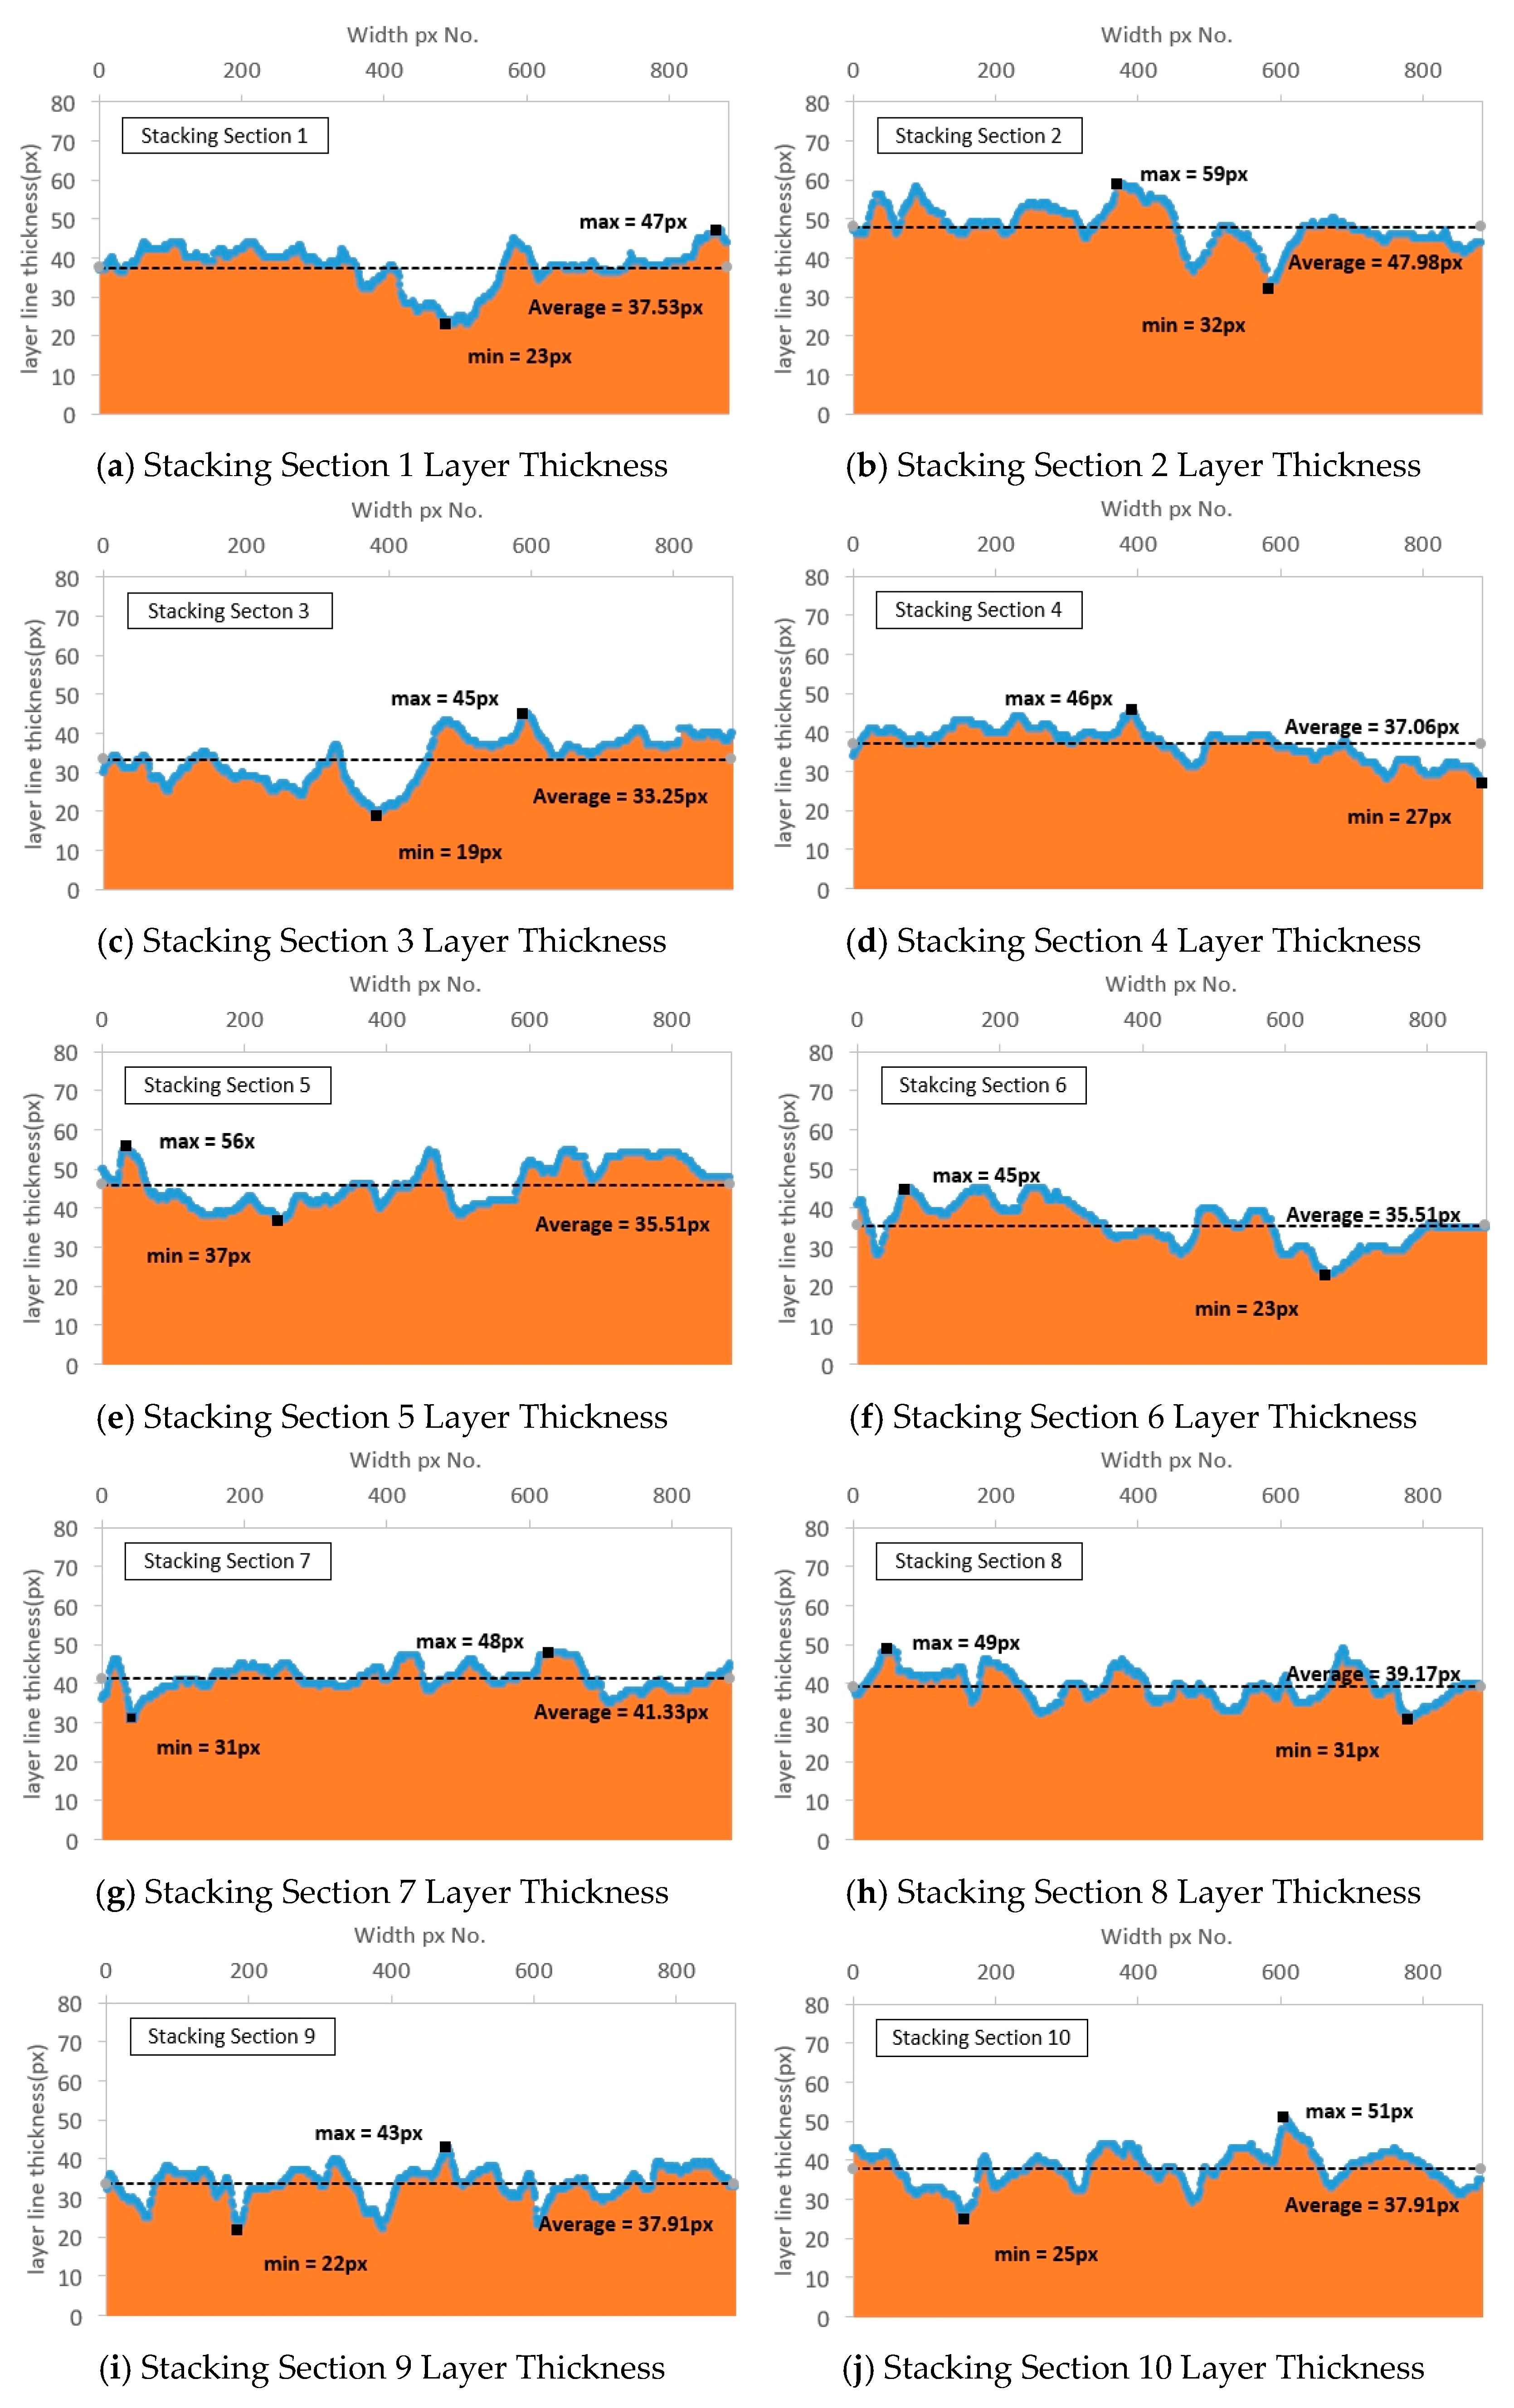
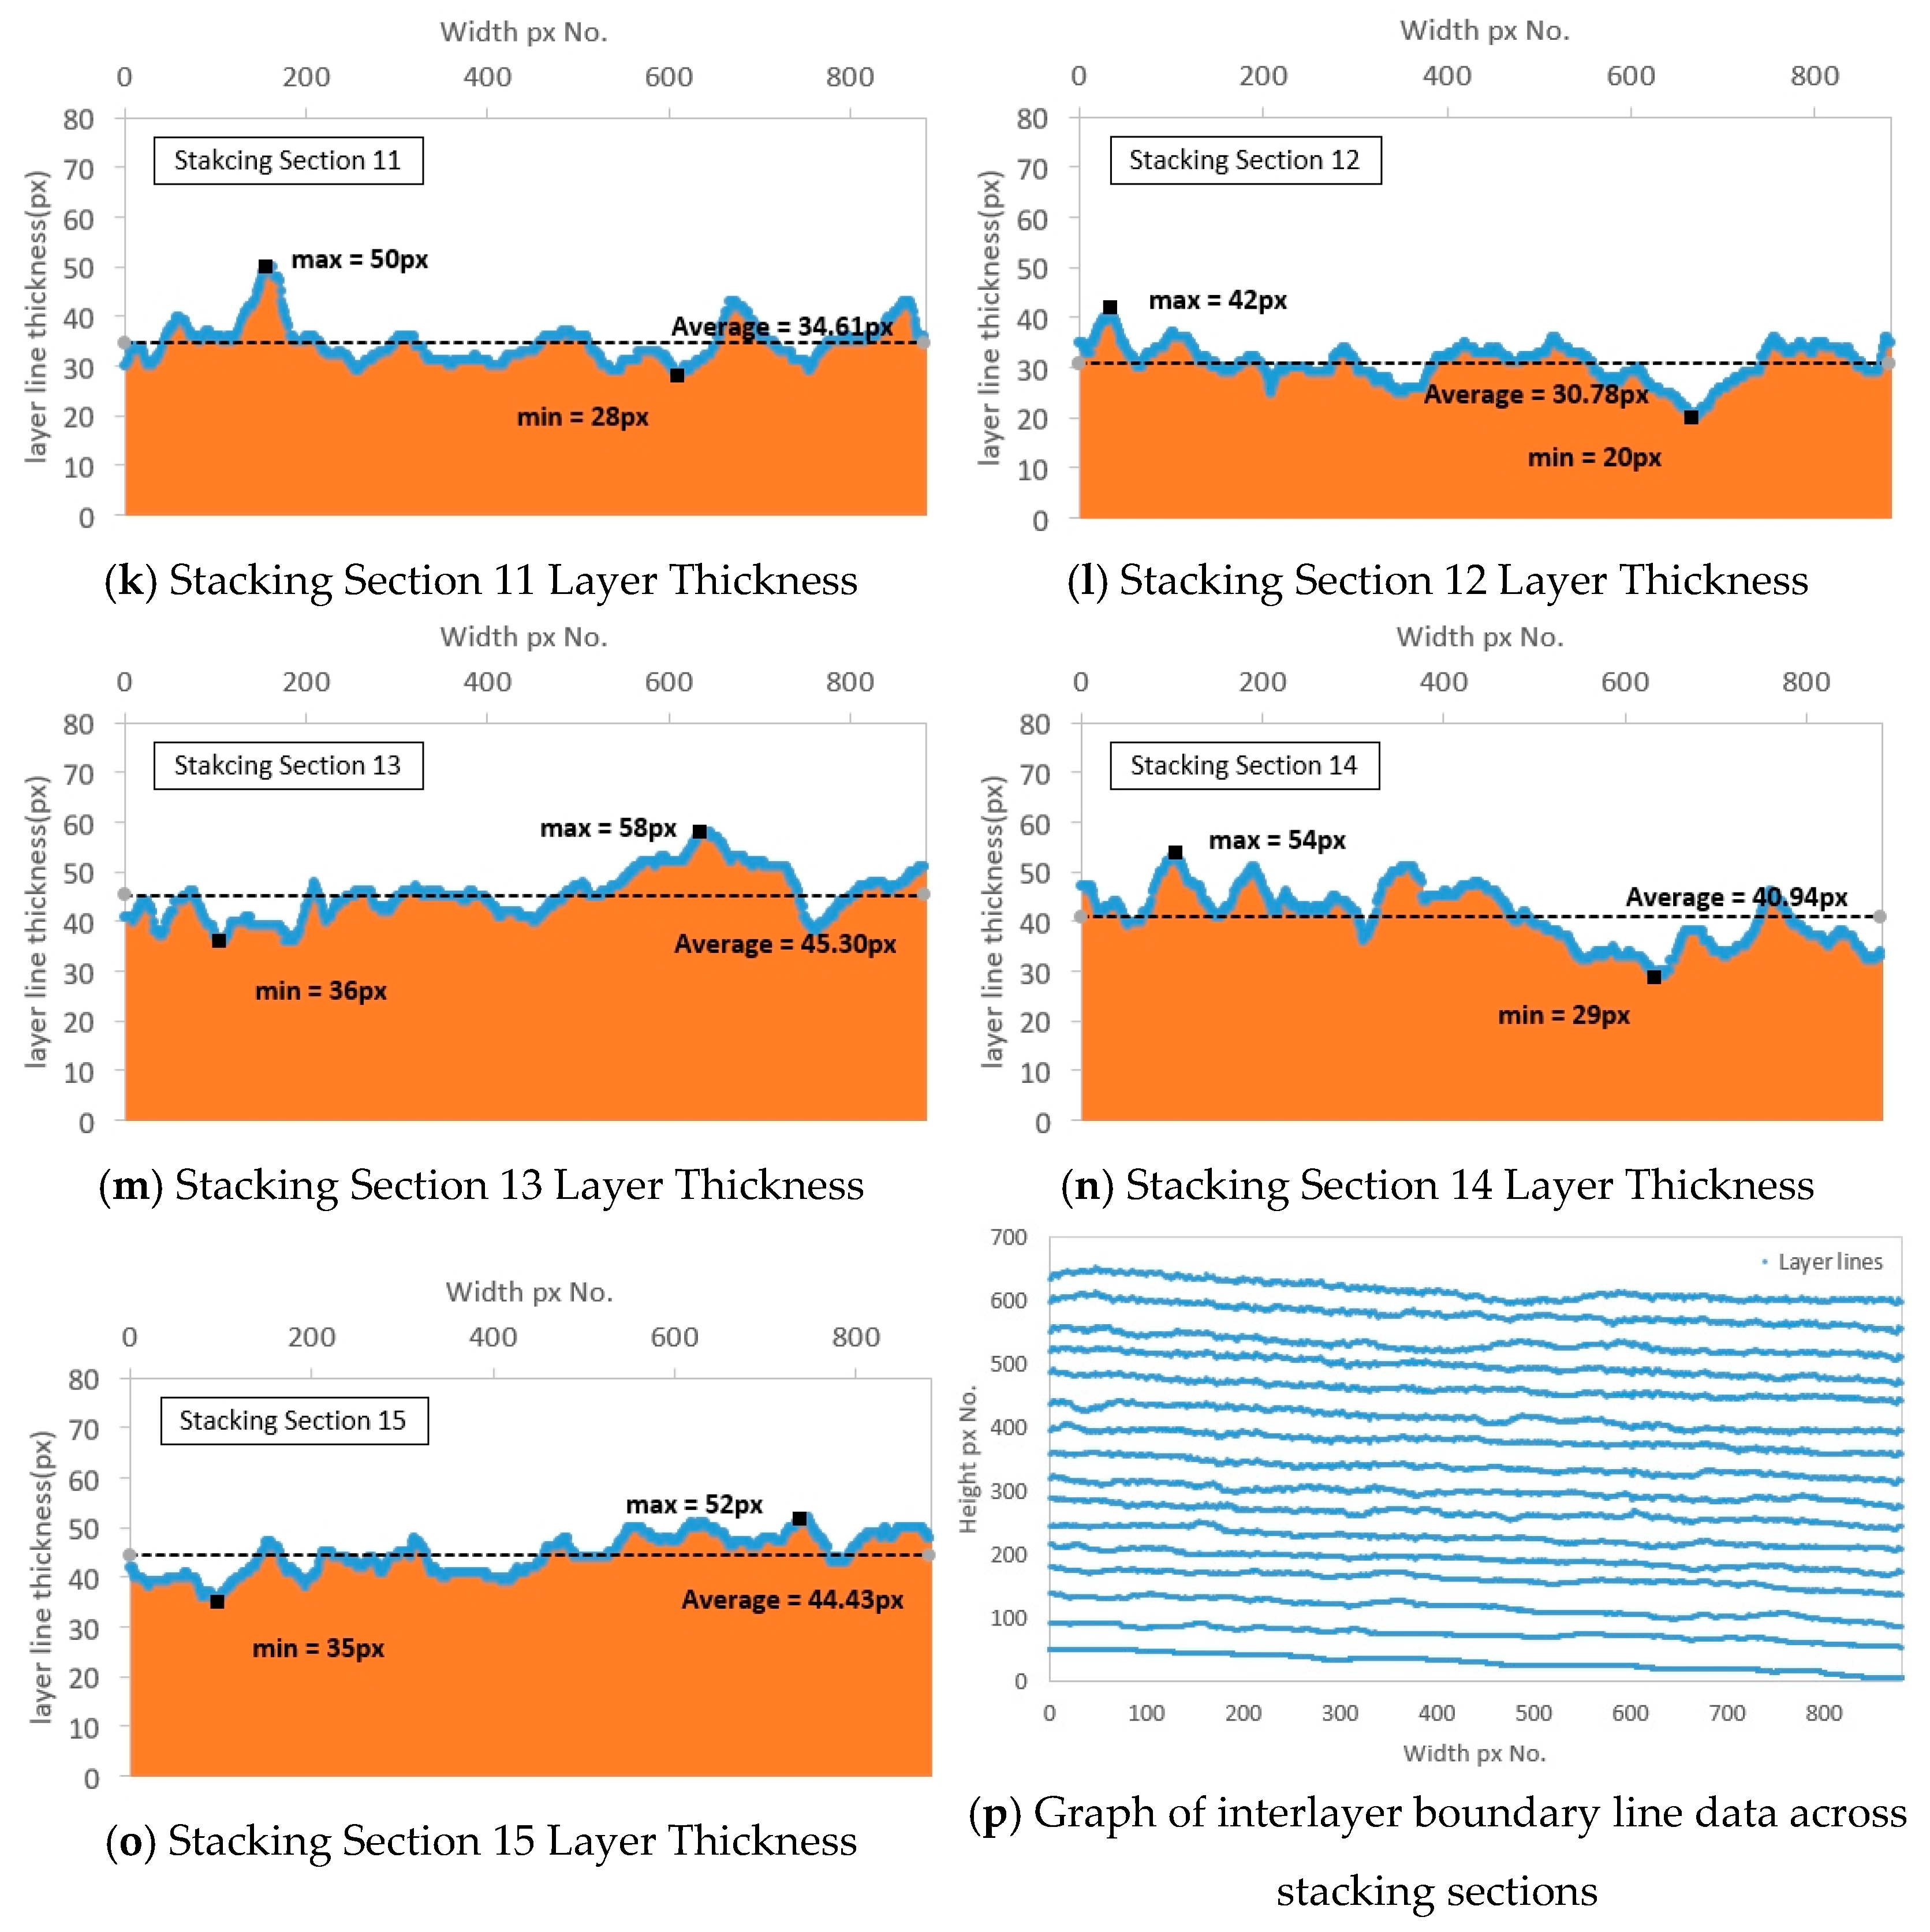
The images in which the interlayer boundary lines of the 3D printout are traced comprise 15 layers, and the layer thickness per horizontal pixel was measured for each layer. Stacking Section 1 is the top layer in the images with traced interlayer boundary lines of the 3D printout, and Stacking Section 15 is the bottom layer. The thickness unit was calculated by counting the number of pixels in the image between the interlayer boundary lines, and the calculation results are shown in
Figure 7 and
Table 3.
The maximum, minimum, and mean thickness values were measured in each layer section using the images with traced interlayer boundary lines. The maximum was 42 to 59 pixels, the minimum 19 to 37 pixels, and the mean 30.78 to 47.98 pixels. Generally, 3D printers output in the Z-axis direction against gravity from the printing bed. Given this trait, we expected that as printing progressed, the mass of the printout would accumulate, and the layer thickness at the upper region would be prominently larger than at the lower region. However, this trend was not confirmed based on the layer thickness measurements. This is judged to be because the printouts were not large enough to impact the rheological properties of the printing material, and therefore the influence of their own weight was small. The thickness uniformity was calculated to be 0.819 to 0.919, satisfying the CV criterion of 0.74 or more and less than 0.95, thus indicating that stable output uniformity was maintained.
5.3. Improved Calculation Results of the Layer Thickness and Uniformity (Using Deep Learning)
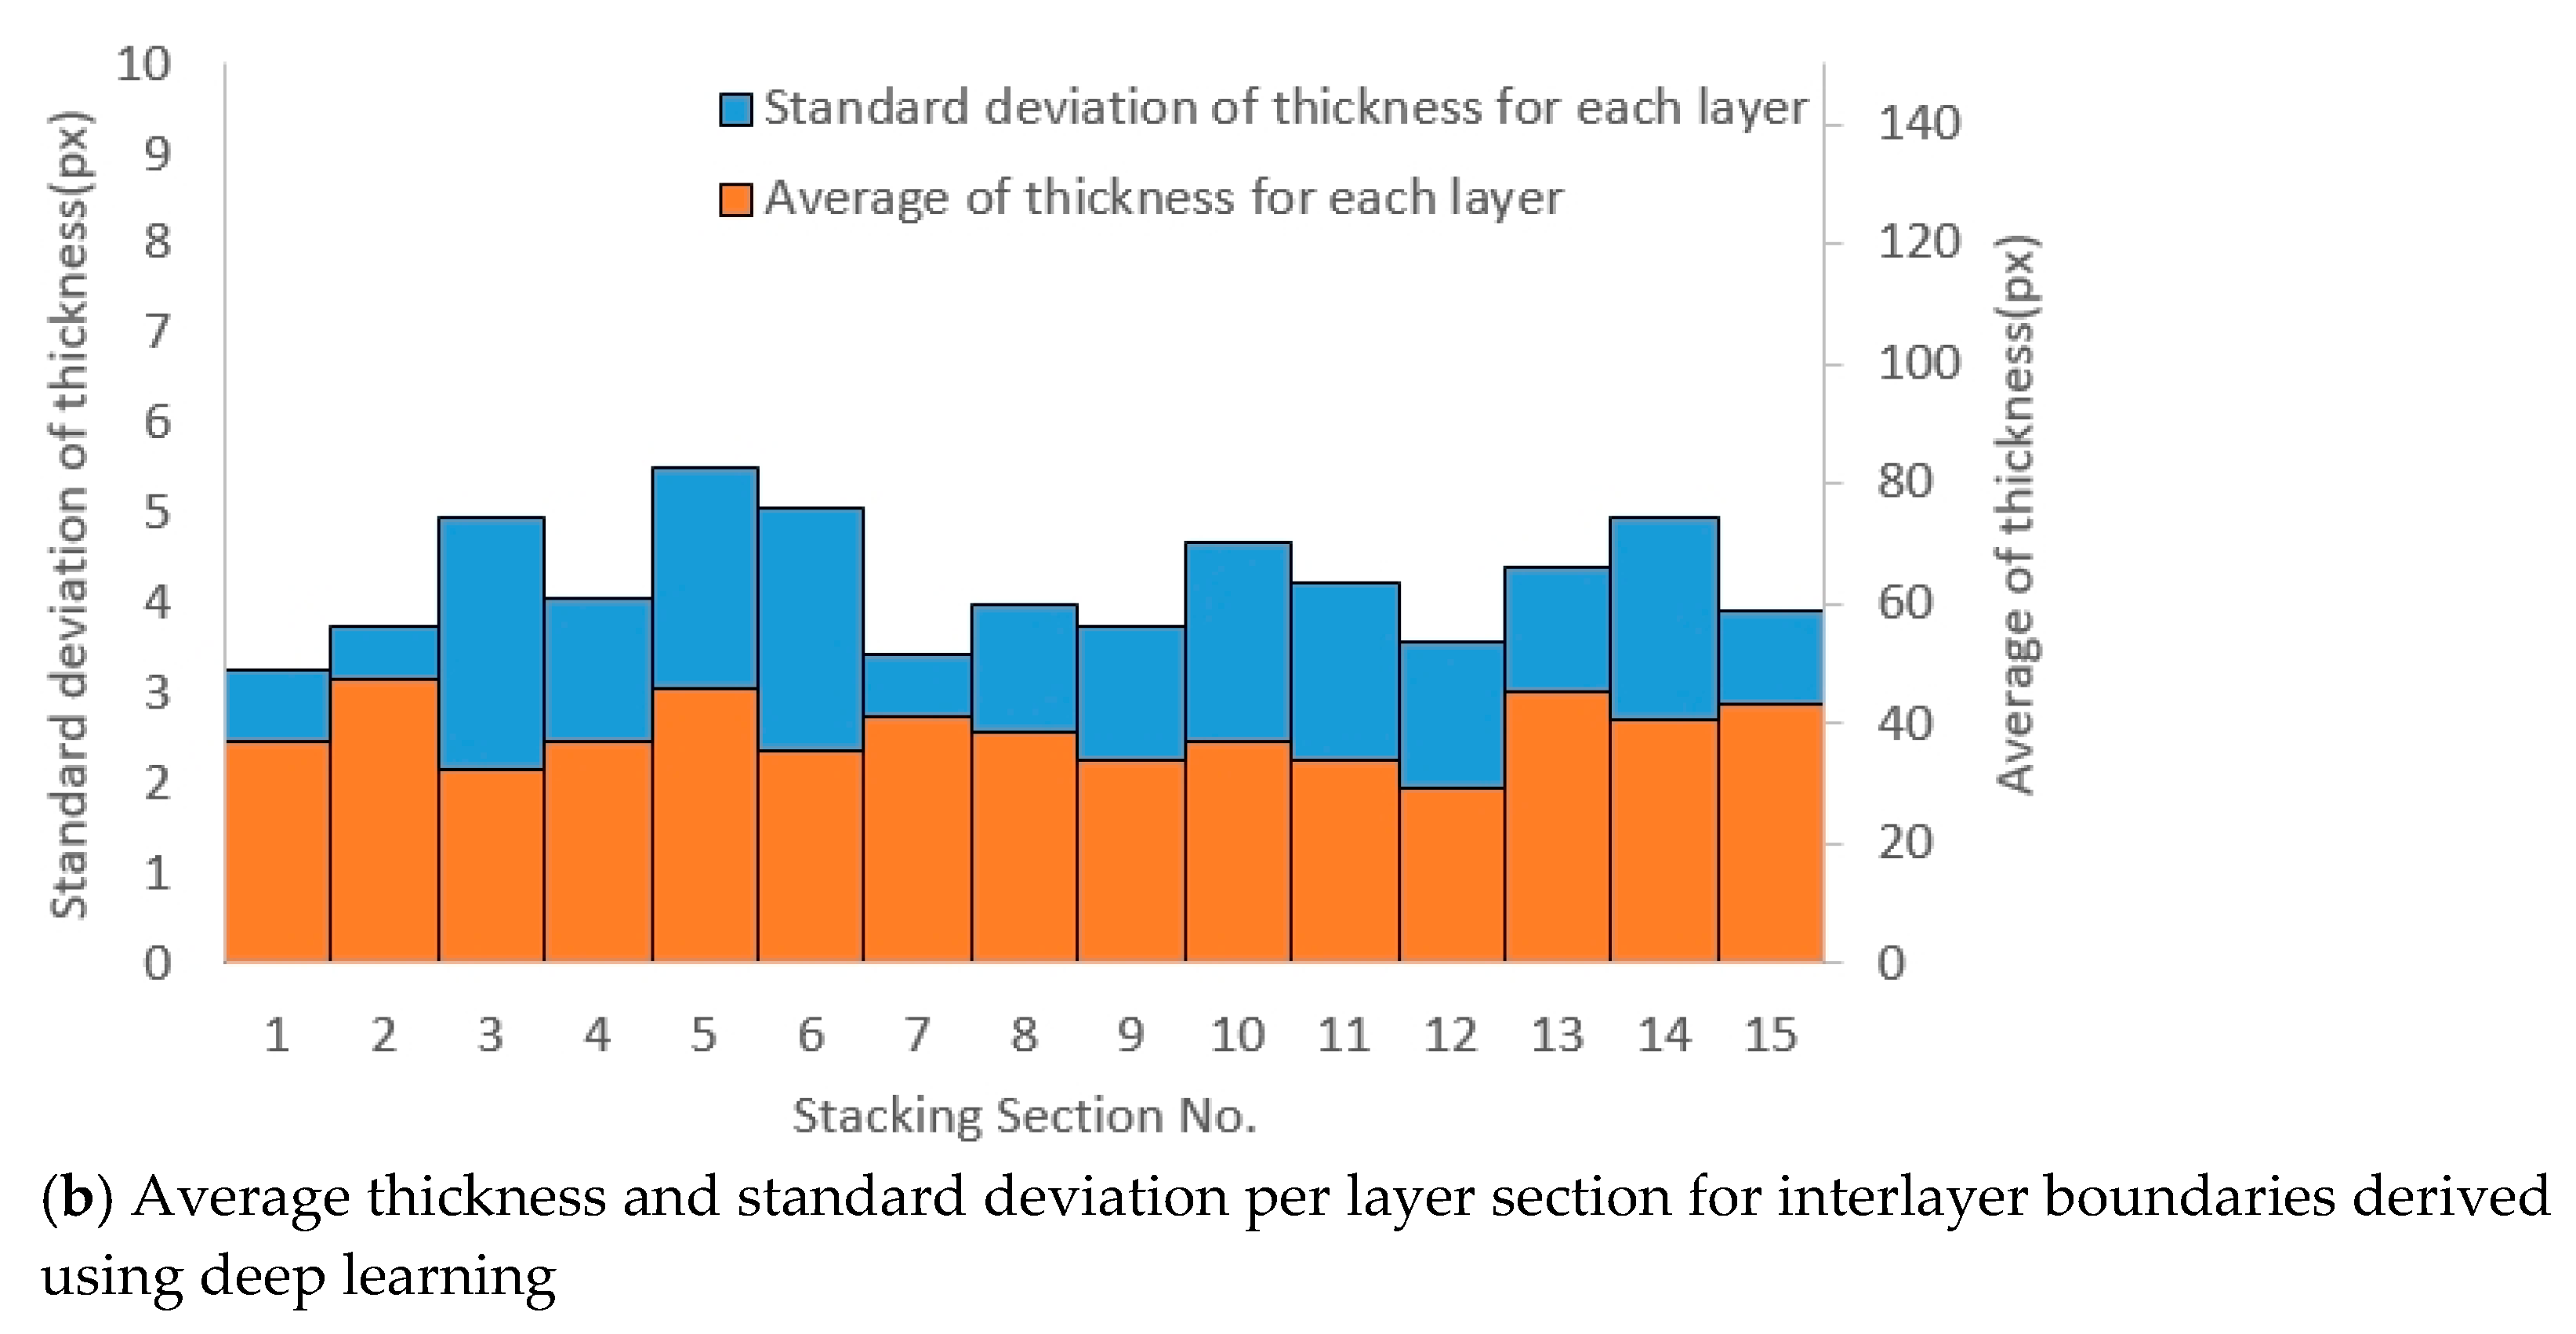
The same images as the traced images were used to detect the interlayer boundary lines of the 3D printouts through deep learning. The interlayer boundary lines derived using deep learning tended to be somewhat thicker than those of the traced images. Because this may cause the layer thickness evaluation results to be somewhat small, the median value for each pixel was calculated and applied from the boundary line area where the interlayer boundary line was extracted to improve the accuracy of this process. For the images whose interlayer boundary lines were detected using deep learning, detection may be imperfect depending on the number of trained images, their conditions, and the photo quality of the target images. Therefore, the above-described linear interpolation process was added.
Figure 8 shows the images in which the interlayer boundary lines of the 3D printout are traced.
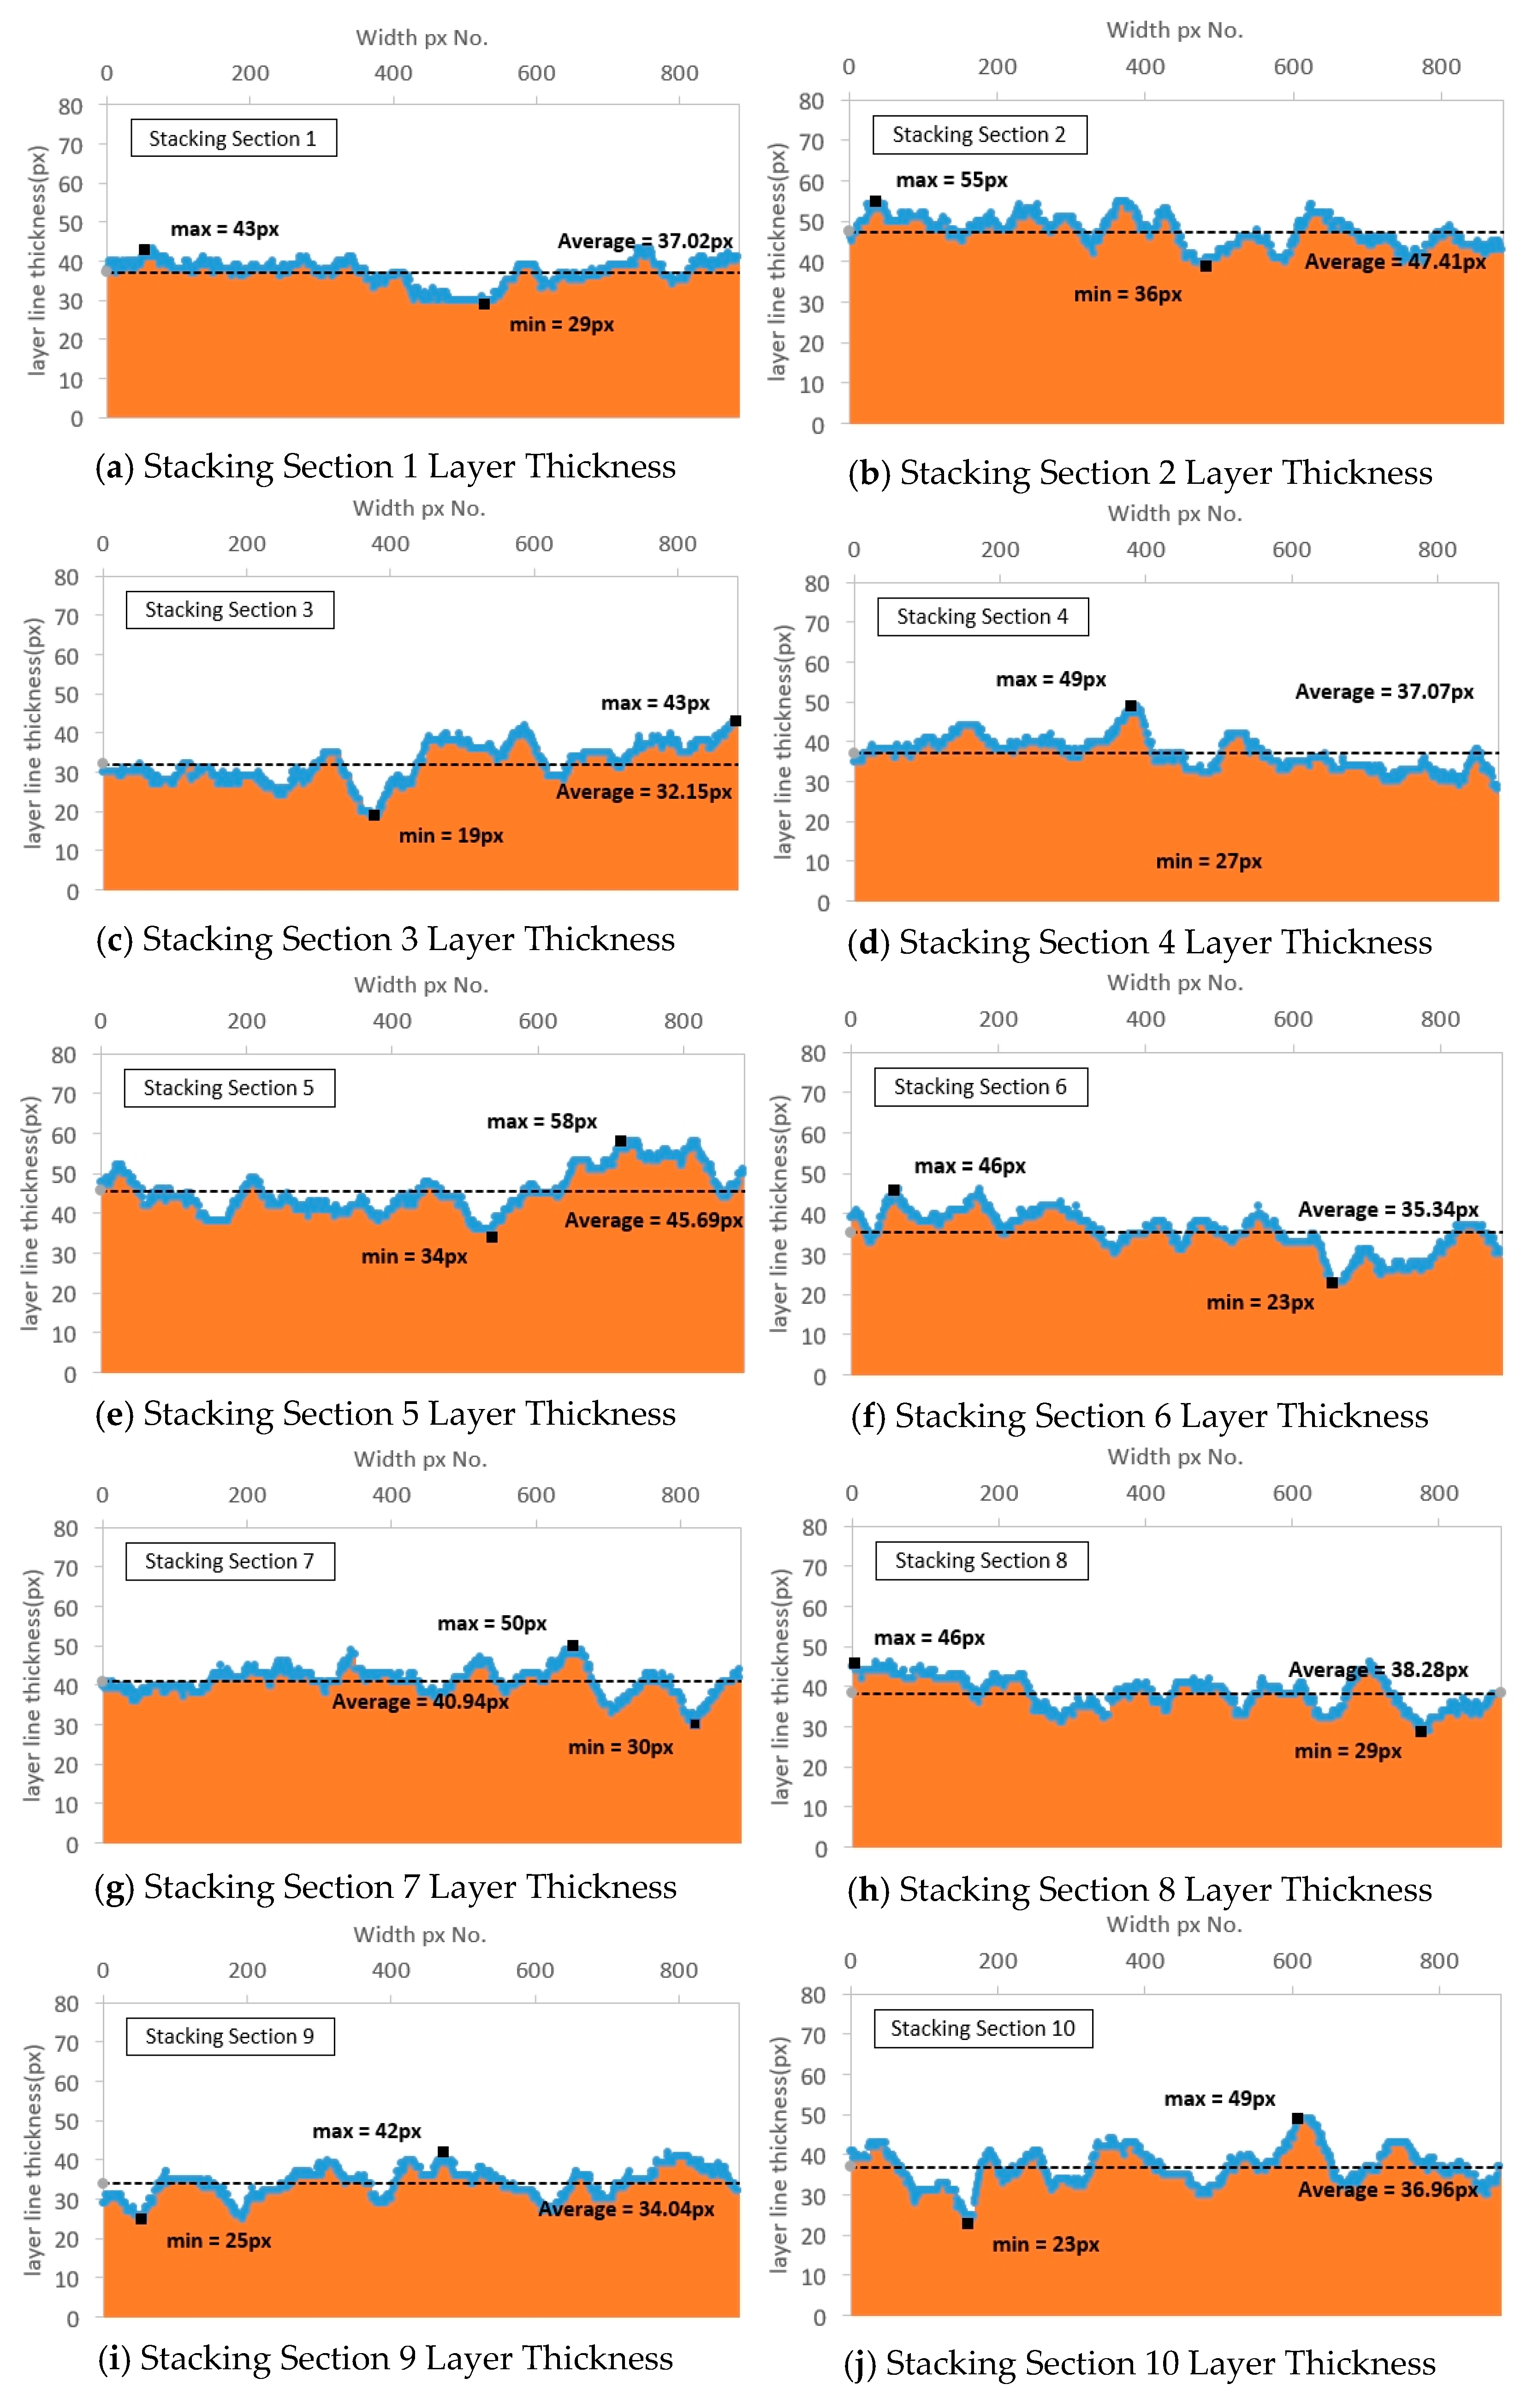
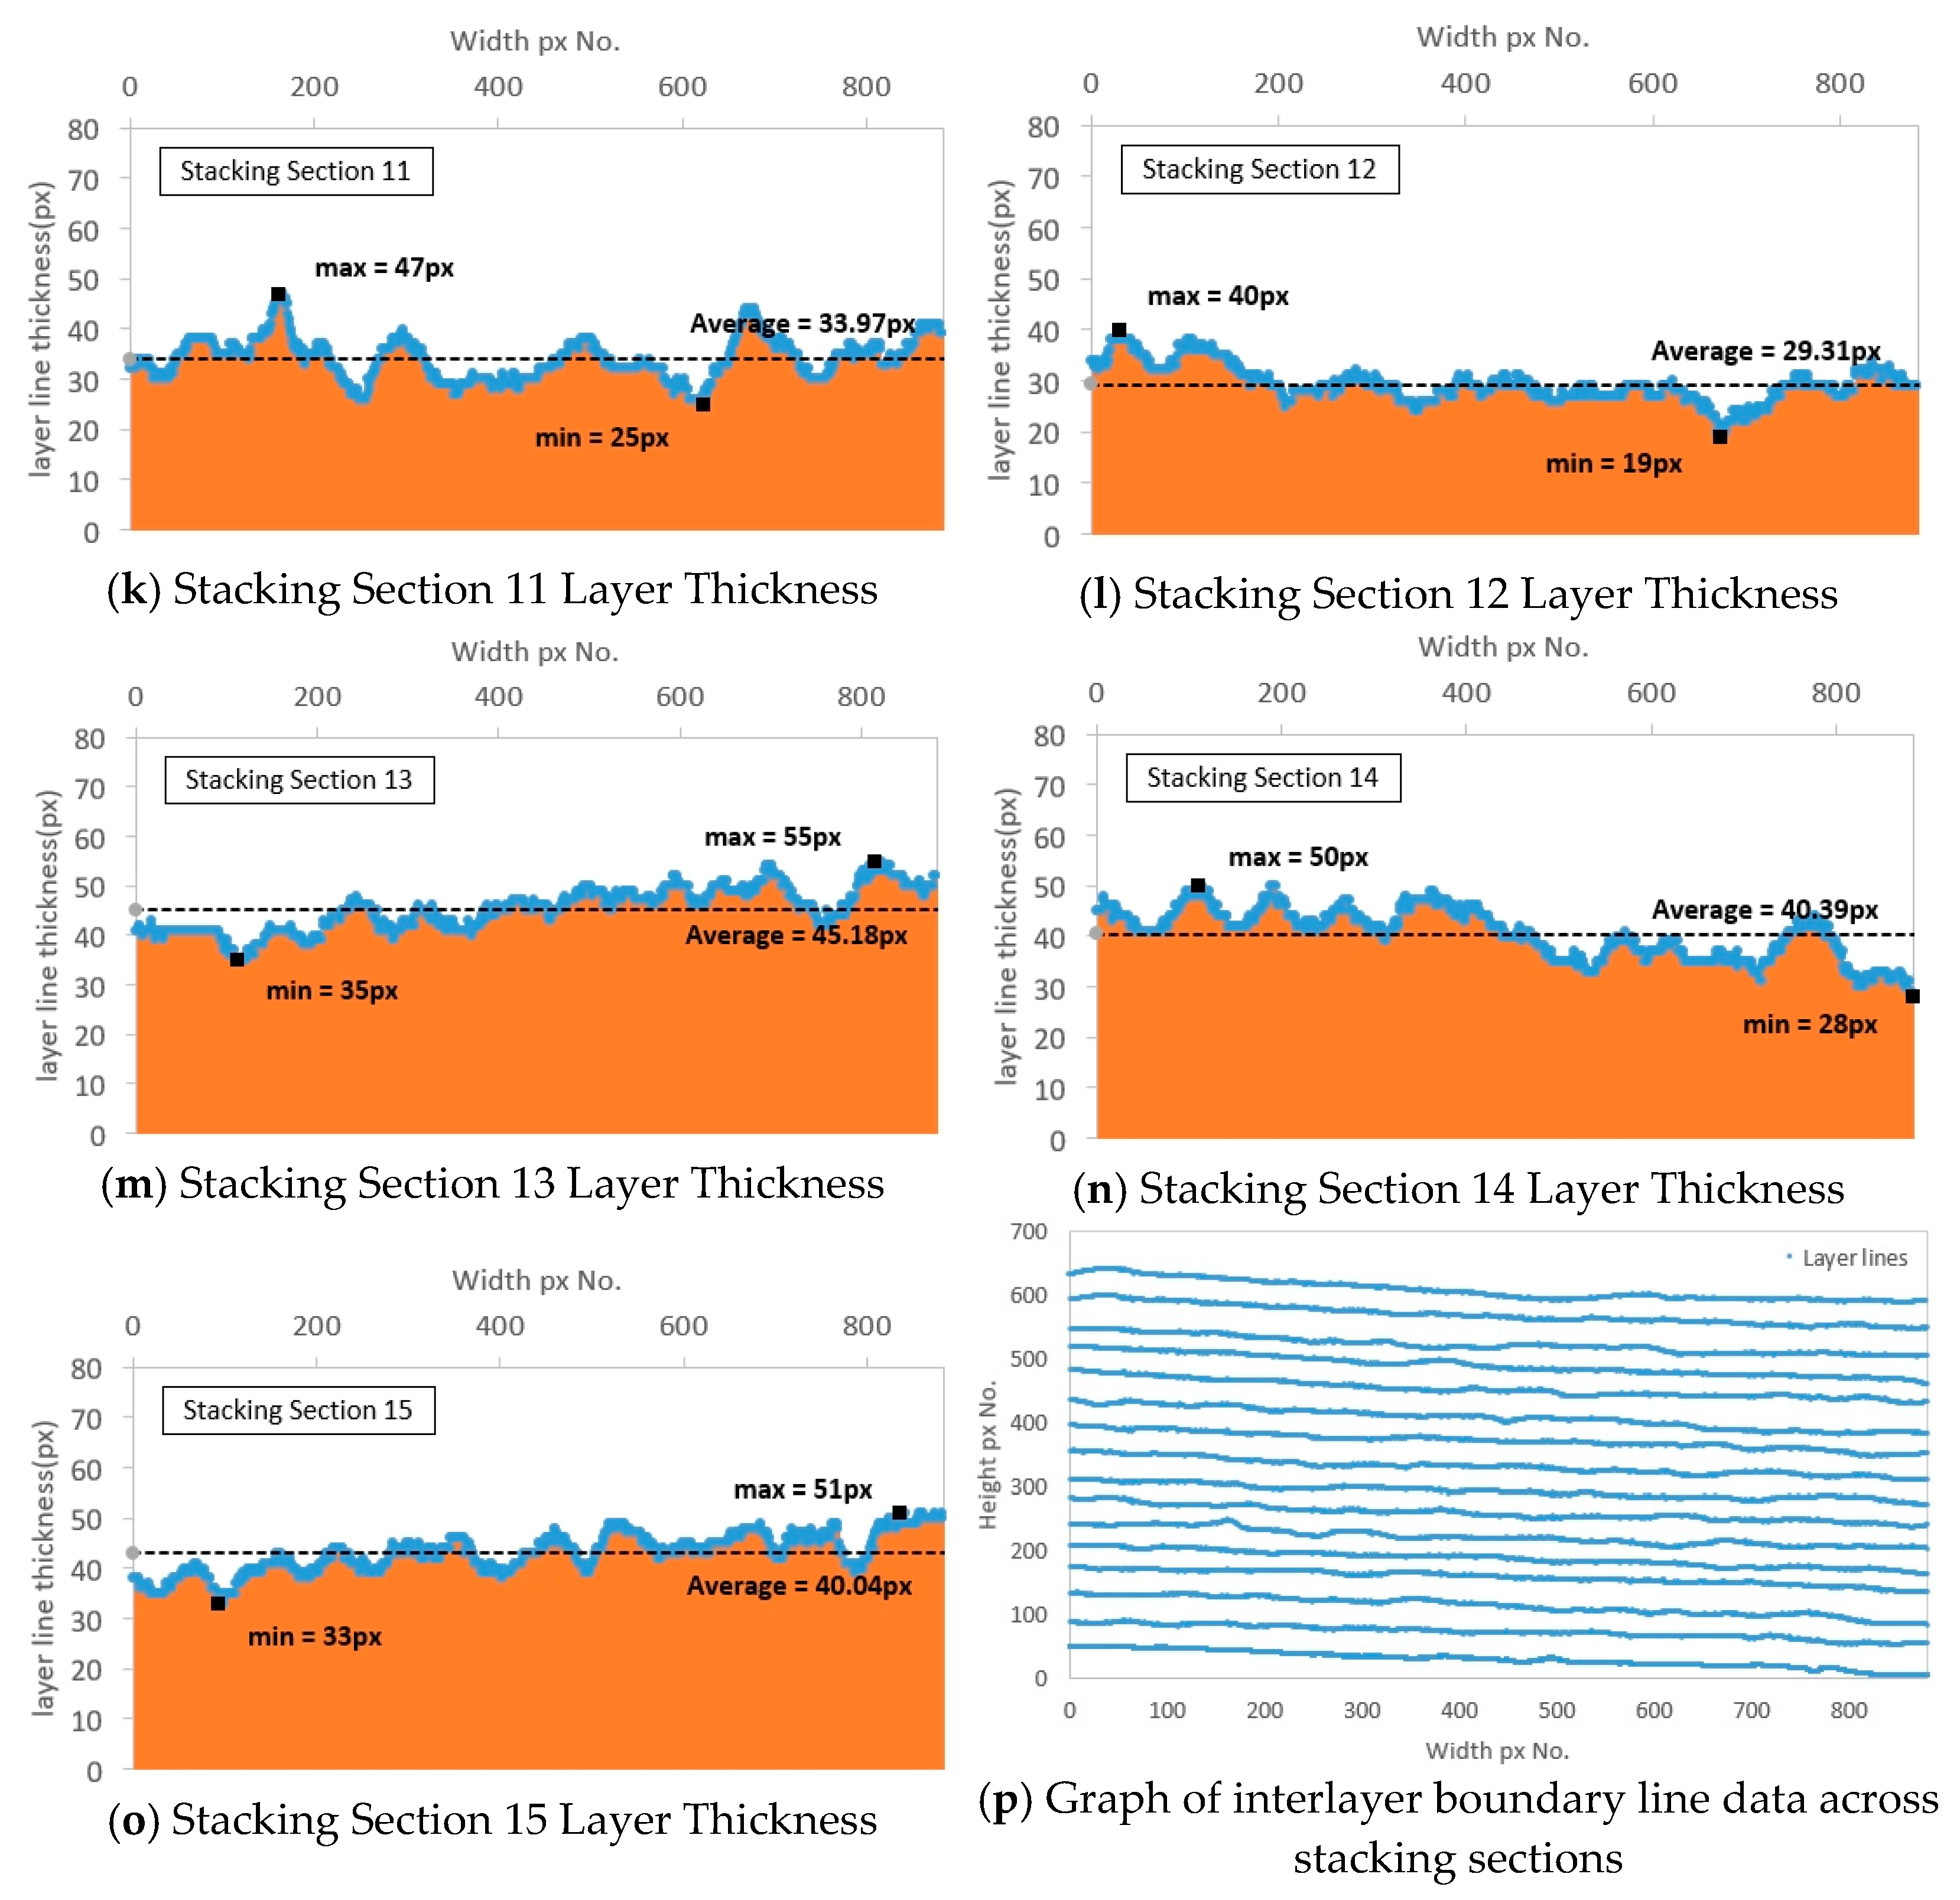
The details of the images with the 3D printout interlayer boundary lines detected through deep learning are the same as the traced images, and the calculation results are shown in
Figure 9 and
Table 4.
The maximum thickness in each layer section was determined using images with traced interlayer boundary lines. The maximum, minimum, and mean thickness values were measured and determined to be 40 to 58, 19 to 34, and 29.31 to 47.41 pixels, respectively. These results were consistent with the trend of layer thickness obtained from the traced images, and the calculated differences between the minimum, maximum, and mean thickness values of each layer were not large. The thickness uniformity was calculated to be 0.857 to 0.924, satisfying the CV criterion of 0.74 or more and less than 0.95, thus indicating that stable output uniformity was maintained, as in the calculation results using the traced images.
5.4. Comparative Verification
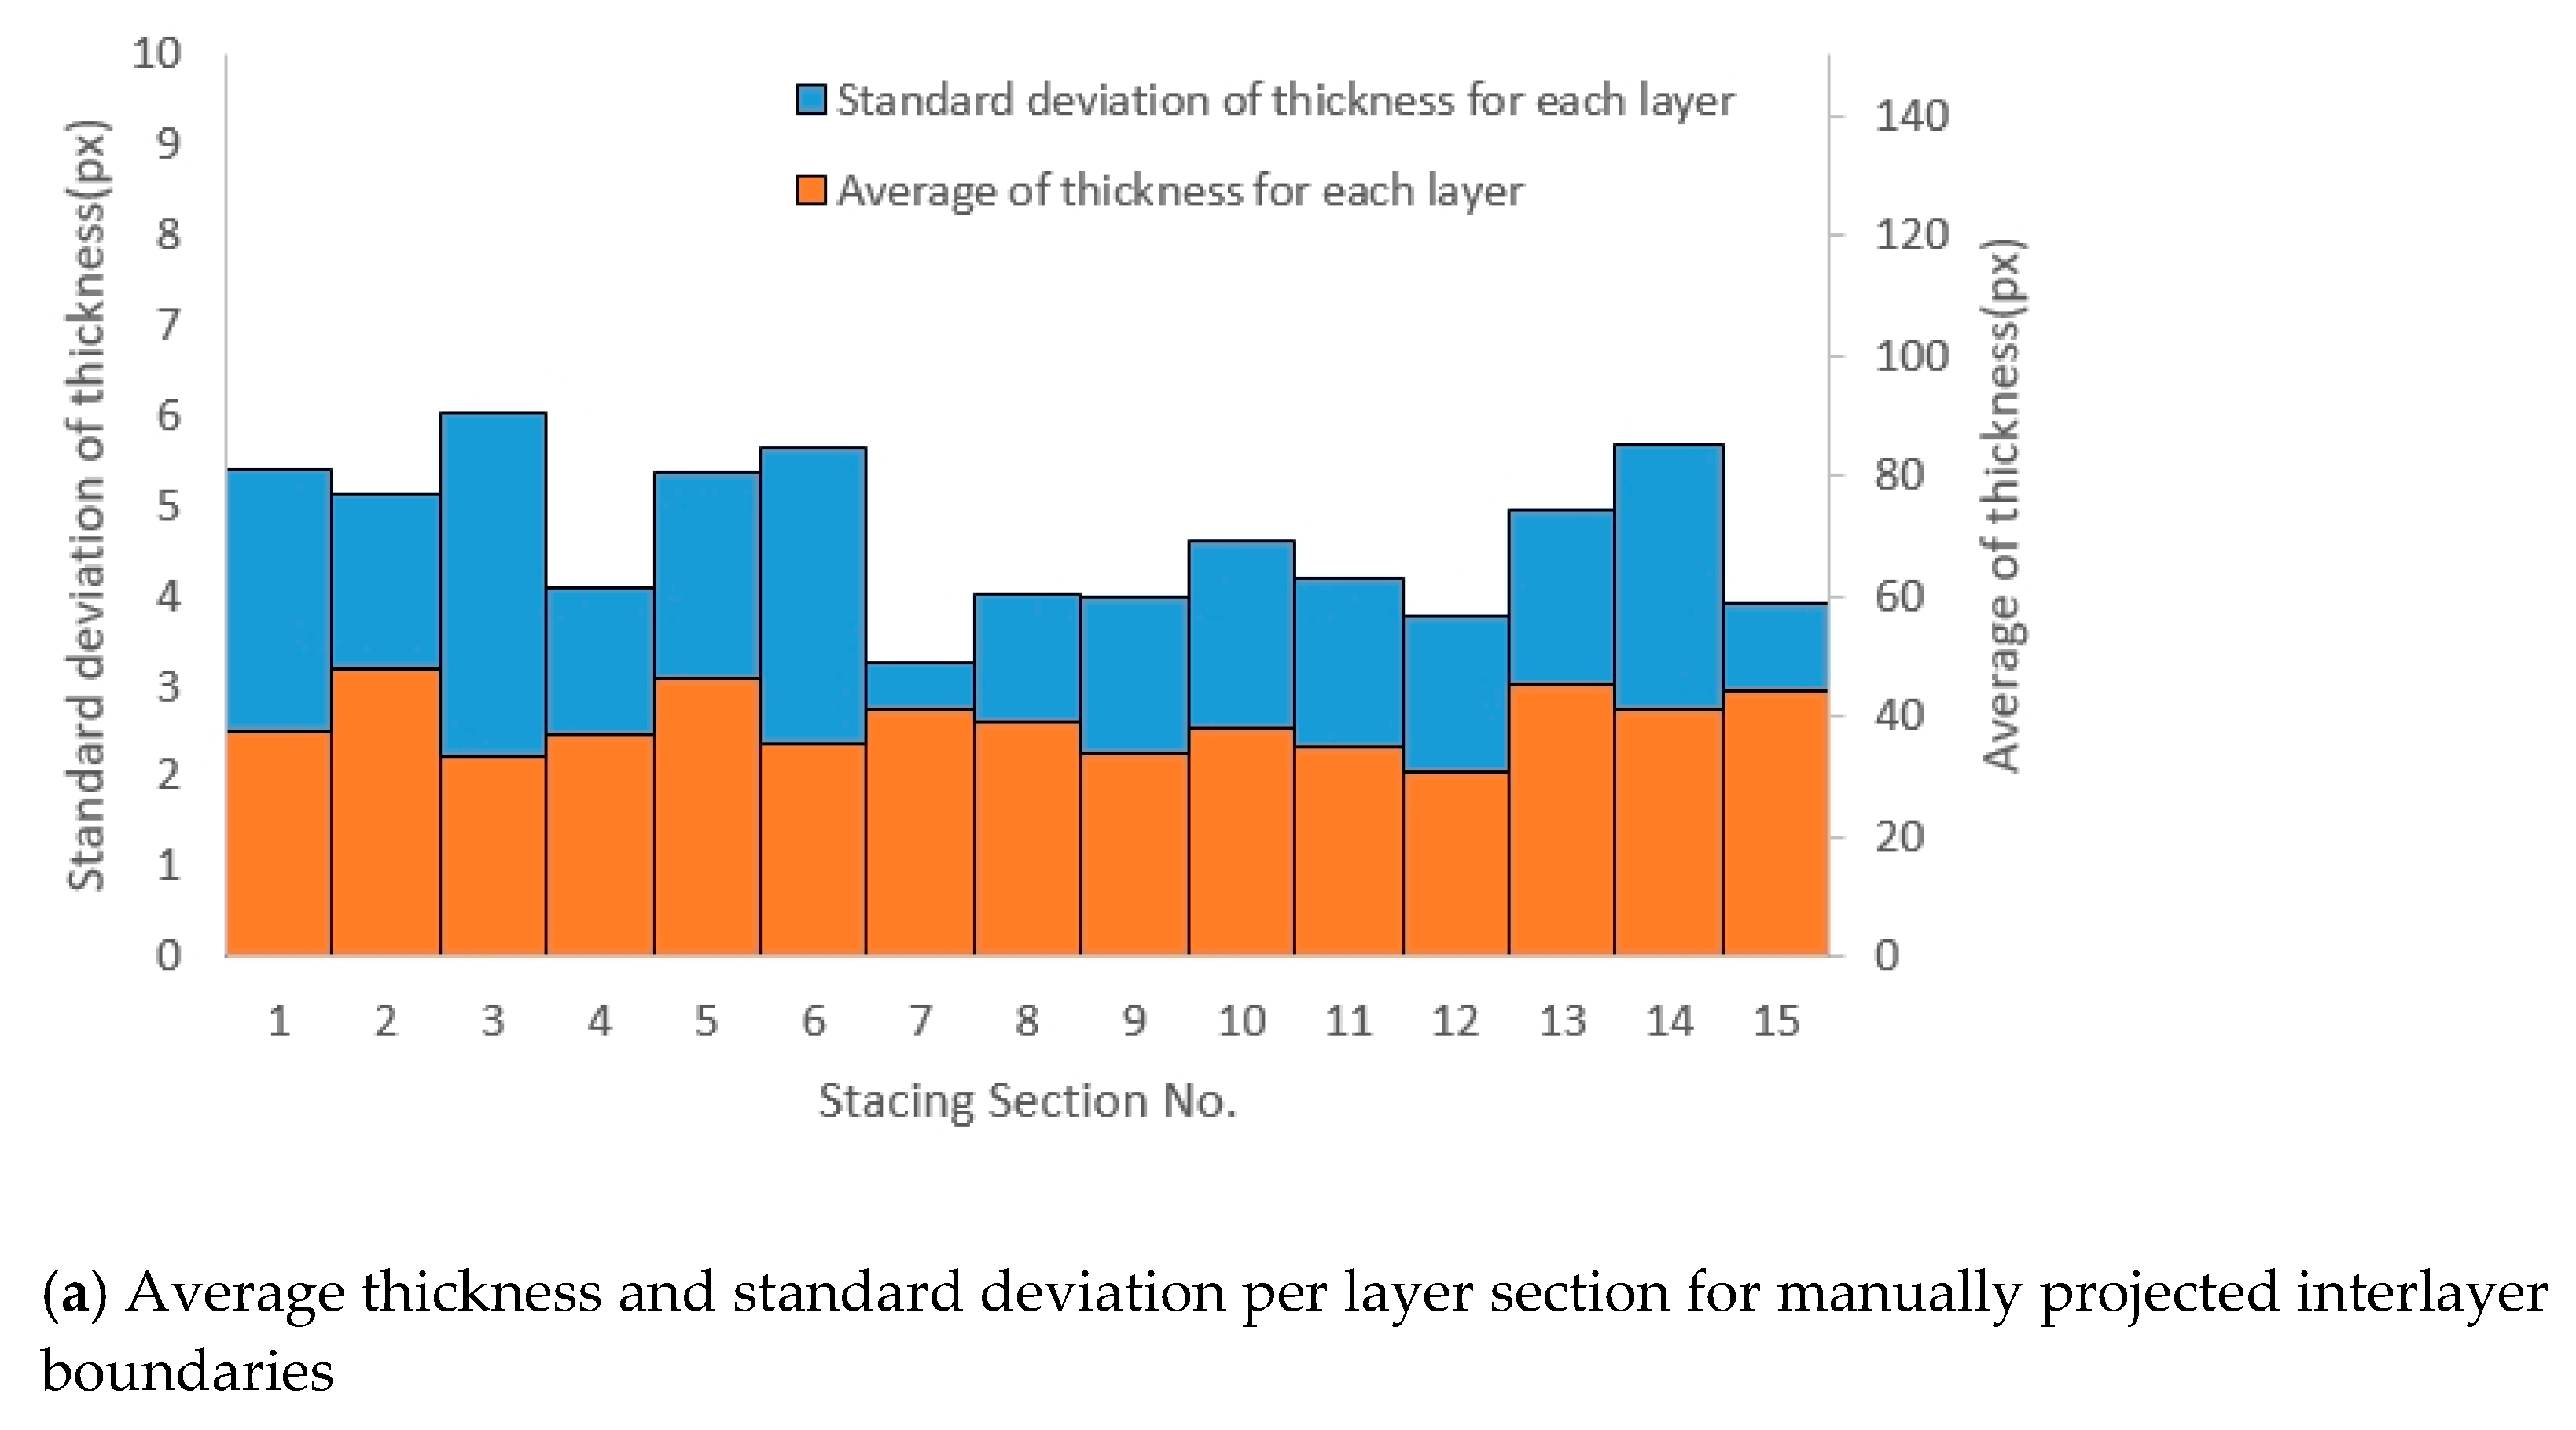
Figure 10 shows a comparison of the layer thickness uniformity results in pixels obtained using the interlayer boundary lines of the manually traced images and deep learning-processed images. The layer thickness obtained from the deep learning-processed images exhibited a small standard deviation compared to the manually traced images, whereas the mean layer thickness measurements were similar between the methods. This may have resulted from the following process. When detecting the interlayer boundary lines via manual tracing, minute errors accumulate due to hand movements in the forward and backward directions of the boundary lines caused by the tracing errors of the measurer. As the manual tracing of the boundary lines progresses, the deviation of the layer thickness increases. In contrast, these errors do not occur in the deep learning-processed images, and therefore the calculated layer thickness has a comparatively small deviation.
Table 5 shows the uniformity and ratio results according to these two methods. Considering the uniformity results, the deep learning method showed somewhat higher values than the manual tracing method. The ratio ranged from 1.004 to 1.071, and the differences in uniformity results were large, mainly located at the upper part of the specimens. This is considered to have occurred because when photographing the specimens to evaluate the layer thickness uniformity, the upper part is directly illuminated by light, causing differences in the interlayer boundary lines determined by deep learning and the measurer.
6. Conclusions
In this study, a deep learning-based automatic detection method was proposed to evaluate the layer thickness uniformity of 3D printed cementitious composite outputs, and it was compared with the manual tracing method. Cementitious composites optimized for fluidity and layerability were used by incorporating void ratio in the mix design, and the deep learning training results applying the ResNet-50 model confirmed high performance with a training accuracy of 96.07% and a validation accuracy of 94.99%.ejournal-stem
The deep learning method automatically detected interlayer boundaries and produced objective and highly reproducible results through linear interpolation, enabling more stable uniformity evaluation with a smaller standard deviation compared to manual tracing. The uniformity values from both methods were similar in the range of 0.819 to 0.924, but the deep learning method was found to be less sensitive to external factors such as lighting effects on the upper part. This is expected to be useful for real-time prediction and control of dimensional errors in the printing process for construction 3D printing. This observation is attributed to the robustness of CNN models such as ResNet-50, which leverage a combination of spatial information—including surface patterns, textures, and structural features within layers—in addition to contrast effects caused by lighting. As a result, their learning characteristics remain stable despite optical variations.
While the standardized geometry and environmental conditions used in this study enabled robust model training and repeatability, it is acknowledged that the manual tracing approach—though widely used—is inherently labor-intensive and subject to measurer fatigue and operator-dependent variability. This study currently lacks a formal inter-operator variability analysis for manual tracing, which could provide further context to the AI’s comparative performance.
For future research, additional validation is needed to ensure generalizability. In particular, cross-validation and testing should be conducted with a more diverse set of images—including various geometries, lighting conditions, viewing angles, and surface textures—to comprehensively assess the performance and reliability of the deep learning approach in broader practical scenarios. Furthermore, experiments involving multiple human tracers will be carried out to analyze inter-operator variability and further highlight the objectivity and reproducibility advantages of the deep learning method.
Expanding the method to more diverse printing conditions and large-scale structures, together with the development of real-time monitoring systems, represents a key direction for future work. Ultimately, such approaches can contribute to improving the precision of 3D printing technology and enhancing its industrial applicability.
7. Future Perspectives
This study is limited by the use of image datasets obtained from standardized environments and specimens, which may constrain the general applicability of the proposed method. Nonetheless, the meaningful results derived from a relatively small image set indicate the potential direction of future research. The present findings support further developments such as the integration of real-time monitoring systems and the construction of adaptable models based on large-scale dataset acquisition that can address diverse geometries and environmental conditions. Given that 3D printing offers the advantage of fabricating non-linear and free-form structures, future studies should aim to extend the applicability of this approach to curved or topologically complex printed forms. To achieve this, enhancements in imaging techniques capable of tracking curved printing paths, coordinate-based analysis algorithms for binarized images that facilitate geometric transformation, and integration with 3D scanning data may be required. In addition, it is necessary to establish a connection between the printed outputs and their corresponding mechanical properties to ensure that the 3D-printed structures fulfill their intended functions. Further discussion is also required on developing testing methodologies capable of reflecting the inherent mechanical characteristics of the 3D-printed materials themselves.
Author Contributions
Conceptualization—J.S.; Formal analysis—J.S.; Methodology—J.S., J.L. and B.L.; Investigation—J.L. and B.L.; Resources—J.L. and B.L.; Writing and original draft—J.S. All authors have read and agreed to the published version of the manuscript.
Funding
This research was supported by the Korea Institute of Marine Science and Technology Promotion (KIMST) and funded by the Ministry of Oceans and Fisheries, Korea [grant numbers 20220537, Development of Ceramic Marine Artificial Structures to Increase Blue Carbon].
Data Availability Statement
The raw data supporting the conclusions of this article will be made available by the corresponding authors on request.
Conflicts of Interest
The authors report no conflicts of interest in relation to the publication of this article.
References
- Ramos, A.; Angel, V.G.; Siqueiros, M.; Sahagun, T.; Gonzalez, L.; Ballesteros, R. Reviewing Additive Manufacturing Techniques: Material Trends and Weight Optimization Possibilities through Innovative Printing Patterns. Materials 2025, 18, 1377. [Google Scholar] [CrossRef] [PubMed]
- Apicella, A.; Aversa, R.; Paraggio, M.F.; Puopolo, V.; Ascione, L.; Sorrentino, L. Study on 3D Printability of PLA/PBAT/PHBV Biodegradable Blends for Fused Deposition Modeling. Polym. Test. 2025, 130, 108456. [Google Scholar]
- Mazur, J.; Jansa, J.; Cicha, K.; Starý, J.; Dosoudil, M.; Havlík, J. Mechanical Properties and Biodegradability of Samples Obtained by 3D Printing in FDM Technology Made of PLA. Sci. Rep. 2025, 15, 89984. [Google Scholar] [CrossRef]
- Du, W.; Ren, X.; Pei, Z.; Liu, B.; Pei, C. Ceramic Binder Jetting Additive Manufacturing: A Literature Review on Density. J. Manuf. Sci. Eng. 2020, 142, 040801. [Google Scholar] [CrossRef]
- Peng, Y.; Wang, J.; Wang, Y.; Zhao, Y.; Li, Z. Advances in Rheological Measurement and Characterization of Fresh Cement Pastes. Powder Technol. 2023, 428, 118256. [Google Scholar] [CrossRef]
- Si, W.; Ming, X.; Cao, M. Time-dependent rheological behavior of hydrating cement paste containing calcium carbonate whiskers. Cem. Concr. Compos. 2024, 154, 105775. [Google Scholar] [CrossRef]
- Zhang, C.; Yang, Y.; Ma, H.; Liu, Y.; Zhang, Q.; Wang, C. Rheology and Early Microstructure Evolution of Fresh Ultra-High Performance Concrete. Constr. Build. Mater. 2022, 320, 126234. [Google Scholar]
- Varela, H.; Nerella, V.P.; Mechtcherine, V. Extrusion and Structural Build-Up of 3D Printing Cement Pastes. Cem. Concr. Compos. 2023, 142, 105188. [Google Scholar]
- Sotorrío, G.; Espinosa, S.; Núñez, I.; Domínguez, F.; Llano-Torre, A.; Sádaba, S.; Muñoz, A.; Cabeza, L.F. Printability of Materials for Extrusion 3D Printing Technologies. Mater. Constr. 2021, 71, e234. [Google Scholar] [CrossRef]
- Xu, J.; Ding, L.; Cai, L.; Zhang, L.; Luo, H.; Qin, W. Volume-Forming 3D Concrete Printing Using a Variable-Size Square Nozzle. Autom. Constr. 2019, 104, 95–106. [Google Scholar] [CrossRef]
- Mesnil, R.; Aissaoui, A.; Pierre, A. Thickness Optimisation in 3D Printed Concrete Structures: Evaluation of Layer Uniformity Through Dispersion Metrics. Build. Environ. 2025, 250, 111116. [Google Scholar]
- Rehman, A.U.; Alghamdi, K.S.; Ibrahim, Y. Buildability Analysis on Squared Profile Structure in 3D Concrete Printing: Layer Thickness Variability and Uniformity Assessment. Cogent Eng. 2023, 10, 2276443. [Google Scholar]
- Brion, D.A.J.; Roberts, S.; Slama, E.C.; Sebastian, R.; Martin, J.H.; Cunningham, J.P.; Boyce, B.L.; Gross, A.D.; Keiser, M.R. Generalisable 3D Printing Error Detection and Correction Using Images. Nat. Commun. 2022, 13, 4786. [Google Scholar] [CrossRef]
- Brion, D.A.; Pattinson, S.W. Quantitative and real-time control of 3D printing material flow through deep learning. Adv. Intell. Syst. 2022, 4, 2200153. [Google Scholar] [CrossRef]
- Yu, B.; Zhang, H.; Tang, J.; Zhao, Z.; Zhng, X.; He, W.; Chen, X. Multi-view deep information fusion framework for online quality monitoring and autonomous correction in material extrusion additive manufacturing. Virtual Phys. Prototyp. 2025, 20, e2500672. [Google Scholar] [CrossRef]
- Hu, W.; Chen, C.; Su, S.; Zhang, J.; Zhu, A. Real-time defect detection for FFF 3D printing using lightweight model deployment. Int. J. Adv. Manuf. Technol. 2024, 134, 4871–4885. [Google Scholar] [CrossRef]
- de la Rosa, A.; Del Castillo, J.M.; Liébana, F.; Ruiz-Moreno, J.; Burgos, N. Defect Detection and Closed-Loop Feedback Using Computer Vision in Fused Filament Fabrication: A Case Study on Real-Time Parameter Adjustment. Procedia Manuf. 2024, 85, 102–109. [Google Scholar]
- Senthilnathan, S.; Raphael, B. Quality monitoring of concrete 3D printed elements using computer vision-based texture extraction technique. In Proceedings of the International Symposium on Automation and Robotics in Construction (ISARC), Chennai, India, 5–7 July 2023; Volume 40, pp. 474–481. [Google Scholar]
- Mawas, K.; Maboudi, M.; Gerke, M. A review on geometry and surface inspection in 3D concrete printing. Cem. Concr. Res. 2026, 199, 108030. [Google Scholar] [CrossRef]
- Colyn, M.; van Zijl, G.; Babafemi, A.J. Fresh and strength properties of 3D printable concrete mixtures utilising a high volume of sustainable alternative binders. Constr. Build. Mater. 2024, 419, 135474. [Google Scholar] [CrossRef]
- Kandasamy, Y.; Thangavel, B.; Sukumar, K.K.; Ravi, B. Strength properties of engineered cementitious composites containing pond ash and steel fiber. Matéria 2024, 29, e20230277. [Google Scholar] [CrossRef]
- Balagopal, V.; Raju, P.; Kumar, A. Effect of Ethylene Vinyl Acetate on Cement Mortar—A Review. Mater. Today Proc. 2023, 81, 125–132. [Google Scholar] [CrossRef]
- Ghasemi, Y.; Emborg, M.; Cwirzen, A. Effect of Water Film Thickness on the Flow in Conventional Mortars and Concrete. Mater. Struct. 2019, 52, 62. [Google Scholar] [CrossRef]
- Liu, H.; Tian, Z.; Fan, H. A Study on the Relationships between Water Film Thickness, Fresh Properties, and Mechanical Properties of Cement Paste Containing Superfine Basalt Powder (SB). Materials 2021, 14, 7592. [Google Scholar] [CrossRef] [PubMed]
- Liu, Y.; Bai, W.; Cheng, X.; Tian, J.; Wei, D.; Sun, Y.; Di, P. Effects of printing layer thickness on mechanical properties of 3D-printed custom trays. J. Prosthet. Dent. 2021, 126, 671.e1–671.e7. [Google Scholar] [CrossRef] [PubMed]
- Shergill, K.; Chen, Y.; Bull, S. What Controls Layer Thickness Effects on the Mechanical Properties of Additive Manufactured Polymers. Surf. Coat. Technol. 2023, 475, 130131. [Google Scholar] [CrossRef]
- Carneau, P.; Mesnil, R.; Baverel, O.; Roussel, N. Layer Pressing in Concrete Extrusion-Based 3D-Printing: Experiments and Analysis. Cem. Concr. Res. 2022, 155, 106741. [Google Scholar] [CrossRef]
- Cui, H.; Li, Y.; Cao, X.; Huang, M.; Tang, W.; Li, Z. Experimental Study of 3D Concrete Printing Configurations Based on the Buildability Evaluation. Appl. Sci. 2022, 12, 2939. [Google Scholar] [CrossRef]
- Lyu, F.; Zhao, D.; Hou, X.; Sun, L.; Zhang, Q. Overview of the Development of 3D-Printing Concrete: A Review. Appl. Sci. 2021, 11, 9822. [Google Scholar] [CrossRef]
- Khalili, A.; Kami, A.; Abedini, V. Tensile and Flexural Properties of 3D-Printed Polylactic Acid/Continuous Carbon Fiber Composite. Mech. Adv. Compos. Struct. 2023, 10, 407–418. [Google Scholar] [CrossRef]
- Zhao, H.; Wang, X.; Chen, Z.; Liu, X.; Wang, Y.; Wang, J.; Sun, J. Microcrack investigations of 3D printing concrete using multiple transformer networks. Autom. Constr. 2025, 172, 106017. [Google Scholar] [CrossRef]
- Fan, C.; Ding, Y.; Liu, X.; Yang, K. A review of crack research in concrete structures based on data-driven and intelligent algorithms. Structures 2025, 75, 108800. [Google Scholar] [CrossRef]
- Chen, W.; Li, H.; Zhang, J. Visualization Analysis of Concrete Crack Detection in Civil Engineering: Literature Review on Image Processing Techniques for Layer-Like Cracks. Autom. Constr. 2024, 162, 105398. [Google Scholar]
- LeCun, Y.; Bottou, L.; Bengio, Y.; Haffner, P. Gradient-Based Learning Applied to Document Recognition. Proc. IEEE 1998, 86, 2278–2324. [Google Scholar] [CrossRef]
- Krizhevsky, A.; Sutskever, I.; Hinton, G.E. ImageNet Classification with Deep Convolutional Neural Networks. Adv. Neural Inf. Process. Syst. 2012, 25, 1097–1105. [Google Scholar] [CrossRef]
- Simonyan, K.; Zisserman, A. Very Deep Convolutional Networks for Large-Scale Image Recognition. arXiv 2015, arXiv:1409.1556. [Google Scholar] [CrossRef]
- He, K.; Zhang, X.; Ren, S.; Sun, J. Deep Residual Learning for Image Recognition. In Proceedings of the IEEE Conference on Computer Vision and Pattern Recognition, Las Vegas, NV, USA, 27–30 June 2016; pp. 770–778. [Google Scholar]
| Disclaimer/Publisher’s Note: The statements, opinions and data contained in all publications are solely those of the individual author(s) and contributor(s) and not of MDPI and/or the editor(s). MDPI and/or the editor(s) disclaim responsibility for any injury to people or property resulting from any ideas, methods, instructions or products referred to in the content. |
© 2025 by the authors. Licensee MDPI, Basel, Switzerland. This article is an open access article distributed under the terms and conditions of the Creative Commons Attribution (CC BY) license (https://creativecommons.org/licenses/by/4.0/).
