Abstract
This study investigates how future climate change will influence urban microclimates in Athens, Greece, focusing on two representative districts classified as Local Climate Zones (LCZ2 and LCZ3). Using the ENVI-met model, microclimate simulations were conducted to assess projected air temperature variations under moderate (Representative Concentration Pathways RCP4.5) and high (RCP8.5) emission scenarios for mid- and late-century conditions. The analysis reveals a consistent warming trend across both districts, with average air temperature increases of approximately 2–3 °C by mid-century and up to 4.5 °C by the end of the century. Morphological characteristics were found to significantly affect thermal behavior: areas with wider street canyons exhibited higher temperatures due to increased solar exposure, whereas shaded inner courtyards remained relatively cooler. The study’s novelty lies in its integration of high-resolution urban microclimate modeling with climate scenario analysis for a Mediterranean metropolis, a combination seldom explored in previous research. The findings underline the importance of incorporating urban morphology into climate adaptation planning, supporting the design of low-carbon and thermally resilient urban forms in densely built environments.
1. Introduction
According to the United Nations, we are at a crucial moment in global urbanization, with over 50% of the world population already residing in cities, a number expected to rise to 70% by 2050, accommodating an additional 3 billion people [1]. While cities offer opportunities for sustainable transformation, they are also major contributors to greenhouse gas emissions and are highly vulnerable to climate change impacts. Among the most pressing urban challenges is the Urban Heat Island (UHI) effect, which amplifies local temperatures, threatens public health, and undermines climate resilience.
UHI arises from the replacement of natural surfaces with impervious materials and the dense configuration of urban canyons that trap heat and limit natural cooling [2,3]. Its intensity (UHII) peaks during clear, calm nights and exhibits pronounced variability across both seasonal and diurnal cycles [4,5].
As climate change intensifies extreme heat events, the interaction between global warming and UHI is expected to further exacerbate thermal stress in cities, particularly in dense urban environments. Therefore, assessing how UHI may evolve under future climate scenarios is critical for effective mitigation and adaptation planning.
In the Mediterranean context, urbanization patterns are characterized by high density, limited open space, and compact building forms, which collectively intensify microclimatic stress. In Greece, in particular, post-war urban development has been shaped by centralized and fragmented planning processes that produced continuous, densely built environments and irregular urban morphologies [6,7]. In addition, Greek cities are among the most densely built environments in Europe, with 61.2% of the national population residing in urban areas. The metropolitan regions of Athens and Thessaloniki alone host over one-third of the national population, with densities exceeding 19,000 inhabitants/km2—among the highest in Europe [8,9,10]. Such morphological characteristics intensify heat storage and restrict airflow, making Greek cities particularly susceptible to UHI impacts.
While numerous studies have examined present-day UHI dynamics in Mediterranean cities, few have evaluated how future climate change will interact with urban morphology at the neighborhood scale. Relevant literature reviews show a substantial body of neighborhood-scale microclimate simulations (CFD/ENVI-met) that assess present-day conditions and test mitigation options (e.g., vegetation, high-albedo materials, canyon geometry) [11,12,13]. However, only a smaller subset explicitly couples microclimate models with future climate projections [14] (RCP/SSP), suggesting a gap in morphology-resolved projections under future climates. In this context, the present study aims to combine high-resolution ENVI-met simulations with dynamically downscaled regional projections (RegCM4) to evaluate form-dependent vulnerabilities in a Mediterranean metropolis.
In addition, the interaction between climate change and the Urban Heat Island (UHI) effect is expected to further aggravate thermal stress in cities, intensifying both the frequency and severity of extreme heat events [15]. Given the growing environmental, economic and social impacts, the systematic assessment and evaluation of UHI under future climate scenarios is both urgent and necessary. Such efforts are critical not only for understanding the magnitude of the problem but also for informing the design of effective mitigation and adaptation strategies tailored to the specific morphological and climatic contexts of cities.
The analysis here considers two future time periods and two emission scenarios in order to capture the range of possible climatic trajectories and their implications for urban thermal environments. To achieve this, the ENVI-met model is employed as a simulation tool, enabling the detailed examination of microclimatic parameters under varying urban forms and climate scenarios. By linking urban form, climate change, and local thermal conditions, this study aims to enhance the understanding of morphology-dependent vulnerabilities and adaptation needs in densely populated Mediterranean cities.
2. Materials and Methods
To achieve the objectives of this study, a multi-step methodological framework was developed, combining climate projections with high-resolution microclimate modeling. First, two representative case study areas within the metropolitan region of Athens were selected based on the Local Climate Zone (LCZ) classification, ensuring a clear contrast in urban form. Second, typical summer and winter days were identified for microclimate simulations, corresponding to two future time periods and two emission scenarios, in order to account for different climatic trajectories. Finally, ENVI-met simulations were performed to assess the Tair values inside the selected LCZ, allowing for a comparative evaluation of the projected microclimate conditions across both areas. The following sections describe in detail the different methodological steps.
2.1. Selection of the Case Study Areas
The study focuses on the Mediterranean city of Athens. The climate of the city is Mediterranean (Köppen climate classification: Csa), generally characterized by hot, dry summers, mild, wet winters and evenly distributed rainfall throughout the year. During the winter months, the average daily temperature reaches close to 9.03 °C, with the coldest month being January. In summer, the mean high and low Tair values are between 31.83 °C and 21.27 °C, respectively, with the recorded maximum air temperatures of the last decades rarely exceeding 40 °C. July is the warmest month of the year, with Tair averages of 27.7 °C [16].
The selection of the case study areas was performed so as to capture the influence of contrasting urban morphologies on future microclimate conditions in Athens, with particular emphasis on their vulnerability to elevated air temperatures during summer. To this aim, the selection was based on a previous study of Agathaggelidis et al. [17], in which the broader area of Athens was classified following Local Climate Zone (LCZ) classification method [18]. The results of this study [17] indicate that the LCZ2 (i.e., compact mid-rise) and LCZ3 (compact low-rise) typologies dominate the metropolitan region of Athens and reflect its most common urban forms, involving dense, continuous building blocks, narrow street canyons, and limited open space. Considering the higher building densities and low vegetation presence, areas that belong within these classes are expected to be more susceptible to extreme thermal heat stress. For this reason, the present study will focus on the LCZ2 and LCZ3 categories.
Starting with the category LCZ2, the selected area is located in Athens and, more particularly, surrounded by Ekateou, Theonos, Ipparchou and Deinostratou (Figure 1). The area reflects typical characteristics of LCZ2 in terms of the building height, building density, street Height/Width ratio, vegetation coverage, etc. It covers a surface of approximately 250 × 180 m and offers a flat terrain with both NS and EW orientations of its streets’ axes.
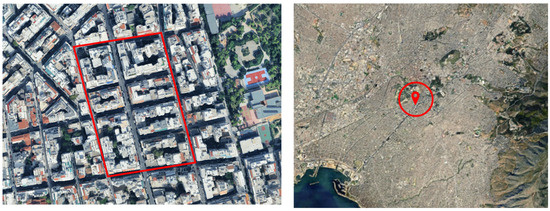
Figure 1.
LCZ2 study area and its location in the greater city center of Athens.
Moreover, the selected study area of LCZ3 type is located in Nikaia, a neighborhood in the southwest of the Attica area, close to Piraeus. The area is surrounded by the streets Ikoniou, Grevenon, Kaisarias and Laodikias. It reflects typical characteristics of LCZ3 and covers a surface of approximately 240 × 180 m and offers a flat terrain with both NE–SW and E–W orientations of its streets’ axes (Figure 2).
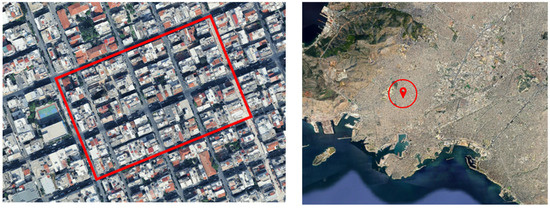
Figure 2.
LCZ3 study area and its location in the greater city center of Athens.
The study areas were normalized to an equal size (200 × 150 m; 30,000 m2) but differ in their geometric and morphological characteristics, such as building surface density and the height-to-width (H/W) ratio of street canyons. For the sake of clarity, the sites are hereafter referred to by their respective classifications, LCZ2 and LCZ3 and their key attributes are summarized in Table 1.

Table 1.
Summary of the study areas based on their LCZ categorization and main features.
The selection of the representative areas ensures that the subsequent simulations capture not only general urban warming trends but also morphology-dependent variations in microclimate response. Thus, the distinctive morphological characteristics of the studied LCZ areas were important for the risk analysis regarding their susceptibility to intensified thermal stress.
2.2. Selection of the Simulation Days
Due to the high temporal resolution of microclimate analysis, simulations are generally conducted on a daily basis [11]; this study will focus on typical summer and winter days so as to have a global overview of the climate change effect on the local microclimate during hot and cold conditions. The simulation days and the corresponding climatological boundary conditions for the microclimate modeling are derived from high-resolution climatic outputs that generated by the regional climate model RegCM4 for a historical reference period (1980–2000) and two future periods (2041–2060 and 2081–2100) [19]. The raw data that were used along with statistical methodology to define the representative summer and winter days are given in [20].
RegCM4 (version 4.4.5.1) is a hydrostatic, compressible model with sigma-p vertical coordinates [21], originally developed by the National Center for Atmospheric Research (NCAR). Its dynamical core is adapted from the hydrostatic version of the NCAR–PSU Mesoscale Model (MM5) [22]. The model operates at an initial spatial resolution of 25 × 25 km and is driven by the HadGEM2 general circulation model (GCM). Future projections are based on the Representative Concentration Pathways (RCPs) 4.5 and 8.5. RCP4.5 represents an intermediate stabilization pathway, with radiative forcing stabilizing at approximately 4.5 W/m2 by 2100, while RCP8.5 describes a high-emission baseline scenario, reaching a radiative forcing of 8.5 W/m2 by the end of the century [19]. To generate the weather files in a finer spatial resolution, the dynamical downscaling of the RegCM4 model is performed after nesting the 25 × 25 km simulations for the model’s initial and boundary conditions. The spatial resolution of the final simulations is 10x10km and focus on Greece. The simulations cover the reference periods 1981–2000, and two future periods 2041–2060 and 2081–2100 for both RCP4.5 and RCP8.5 emission scenarios.
In this study, three key meteorological parameters were extracted for the model’s grid points located nearest to the selected case study areas. The data, obtained from 10 × 10 km resolution simulations, include air temperature (°C), relative humidity (%), and wind speed (m/s), provided at a temporal resolution of three hours. From the RegCM4 outputs, 3-hourly mean values were calculated for each 20-year period, serving as the basis for identifying representative typical and extreme simulation days according to the methodology presented in [20,23]. These parameters were subsequently used as boundary conditions for the ENVI-met microclimate simulations. The hourly air temperature and relative humidity evolution, for the typical days of the winter and summer period for 1981–2000, 2041–2060 and 2080–2099, defined both for the RCP4.5 and the RCP8.5 emission scenarios along with the average daily values of wind speed are given in [20].
2.3. Simulation Scenarios ENVI-Met Simulation Set-Up
The assessment of the microclimatic conditions of the selected areas is conducted through ENVI-met V.5, a three-dimensional, non-hydrostatic, prognostic model that simulates surface–plant–air interactions based on fundamental laws of fluid dynamics and thermodynamics with a typical resolution of 0.5 m in space and 1–5 s in time [24]. ENVI-met has been validated against field measurements in numerous studies [12,25,26]. Nonetheless, discrepancies between observed and simulated results are often reported. These can arise from model-inherent simplifications, such as the use of static parameters for cloud cover and wind speed, as well as from user-related assumptions, including the representation of vegetation by a single tree type, potential overestimation of surface reflectance (SR), or the use of meteorological data from nearby stations instead of site-specific records [12]. Specifically, the model has been shown to underestimate cooling effects in shaded areas and overestimate reductions in sunlit areas, due to its limited representation of vegetation–radiation interactions.
As previously mentioned, the two selected areas represent typical samples of LCZ2 (Compact mid-rise) and LCZ3 (Compact low-rise) classes, characterized by limited vegetated areas, narrow streets adjacent to a crowded highway and densely built environment with adjacent multifamily buildings. In this study, each area is analyzed for representative winter and summer days (January and July) across three time periods. The first is the reference period (1980–2000), while the other two are future periods (2040–2060 and 2080–2099), under two emission scenarios, the more moderate RCP4.5 and the more pessimistic RCP8.5, accounting for a range of possible climatic outcomes. The combined scenarios, concerning both areas, are listed in Table 2, where each simulation has a unique ID identifying the day type (month), time period (reference, 2040–2060, or 2080–2099), and the climate scenario (RCP4.5 or RCP8.5).
Table 2.
Simulation scenarios for the different periods, concentration pathways and LCZ types.
To construct the study areas within the three-dimensional ENVI-met environment, the fundamental morphological parameters were defined, including building heights, environmental materials and their thermophysical properties, area dimensions, and grid resolution. Both sites were standardized to an area of 200 × 150 m (30,000 m2). Using building footprints retrieved from Google Earth, the layouts were projected onto an orthonormal grid, with road widths (including sidewalks) ranging from 7.5 to 10 m. The ground floor height was set to 4 m, while typical upper floors were assigned a height of 3 m. Architectural features such as floor setbacks at higher levels and stairwell extensions on rooftops were also incorporated. For the horizontal axes (x and y), a grid resolution of 2.5 m was applied, resulting in 60 × 80 cells. Along the vertical axis (z), 20 cells with a resolution of 3 m were defined. To minimize boundary effects and ensure model stability, six nesting grids were applied around the main study domain, with asphalt roads assigned as the representative boundary material, reflecting the predominant surface type of the area. Figure 3 illustrates the building structures, tree locations, and the numbering of street canyons in the 2 examined areas. Table 3 presents the physical properties of the assigned materials, ground surfaces, and soil and construction profiles. Material properties were selected to reflect the prevailing construction practices of the period 1970–1980. The initialization parameters of the simulation scenarios are included in Table 4. The geometry and foliage characteristics of the modeled vegetation were generated using ENVI-met’s “Albero” tool. In both study areas, the evergreen species Citrus aurantium (bitter orange) was selected, as it represents the main tree type actually present in the sites. Its selection is further justified by its widespread use in Mediterranean urban environments, its year-round foliage that provides consistent shading, and its role as a characteristic feature of the local streetscape. A leaf area density (LAD) of 2 m2/m3 was assigned to represent the species’ dense crown structure. Tree height was set to 4.5 m, with a crown diameter of 3 m, values corresponding to mature specimens based on field surveys [27].
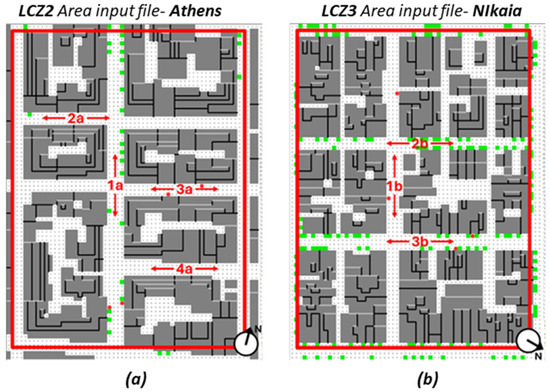
Figure 3.
Area input file in the ENVI-met model (a) for the LCZ2 case study area, located in Athens and (b) for the LCZ3 case study area, located in Nikaia.
Table 3.
Thermal and optical properties of building envelope materials, as introduced in the ENVI-met model.
Table 4.
Initialization parameters for the various simulation scenarios.
Although ENVI-met model here has not been validated with on-site measurements, the focus of the research is on relative changes in major microclimatic parameters such as air temperature (Tair) between different future scenarios rather than on reproducing absolute values. Previous studies have demonstrated that while ENVI-met may show deviations in absolute magnitudes compared to field measurements, the model is generally consistent and robust in capturing spatial and temporal trends, as well as in assessing the comparative effects of urban design or climate scenarios. Therefore, the comparative analysis of Tair increase across future periods is still scientifically meaningful, as it relies on the internally consistent framework of the model. Nevertheless, the absence of site-specific validation is acknowledged as a limitation, and results should be interpreted as indicative of relative differences rather than precise predictions of absolute temperature levels.
3. Results and Discussion
This section presents the detailed examination of the microclimate characteristics within the two specific urban districts. The use of representative days, combined with simulation outputs across different future climate pathways, allows for a comprehensive comparison between present reference conditions and potential future outcomes. Emphasis is paid on the air temperature (Tair) parameter, given its essential role for assessing the intensification of the Urban Heat Island (UHI) effect and its implications for thermal discomfort and health risks [28,29]. More precisely, the following sections examines changes in air temperature at 12:00 PM at 1.5 m height from the ground for the periods 2040–2060 and 2080–2099, compared to the reference period 1980–2000 (baseline scenario), using both RCP 4.5 and RCP 8.5 climate scenarios. Results are summarized for the typical January and July days. ENVI-met results are obtained for all 24 h of the simulated days. Yet, given the amount of data obtained, in this study, only simulation output for specific timesteps is presented.
3.1. Microclimatic Conditions in Case Study Area LCZ2-Athens
3.1.1. Analysis on Tair Values During the Typical Winter Day in January
In a typical January day of the reference period, the case study area presents an average Tair of 10.54 °C, with a minimum of 9.92 °C and a maximum of 11.41 °C, resulting in a range of 1.49 °C within the case study area. Under the RCP 4.5, Tair rises slightly to an average of 12.16 °C for 2040–2060, and to 12.58 °C for 2080–2099, with a fairly stable range of approximately 1.2 °C in both periods. Regarding the RCP 8.5 case study, the average Tair rise is more intense towards the end of the century. By mid-century (2040–2060), average Tair remains at the same level as RCP 4.5 (12.16 °C) with a steady range of 1.28 °C. During 2080–2099, however, the mean temperature will reach 13.91 °C with the range decreasing to 1.18 °C (Table 5).
Table 5.
Summary of the average, minimum and maximum values of Tair in the LCZ2 area during the typical winter days of the three examined periods and the two emission scenarios.
Overall, in winter, the average Tair in the LCZ2 area increases by 1.6 °C under both RCP scenarios for the mid-century period (2040–2060). Towards the end of the century, RCP8.5 scenario shows the highest rise (+3.4 °C above reference), whereas RCP4.5 stabilizes at +2.0 °C above reference period. The Tair range remains low in all cases with a slight decreasing trend, reflecting the uniform thermal state of the area. This is attributed to the lower and more evenly distributed solar radiation during winter that limits fluctuations between sunlit and shaded surfaces.
On the warming magnitude across the area, the most pronounced temperature peaks are observed in study area’s main street axis, with a north–south orientation. This is primarily due to higher penetration of direct solar radiation throughout the day, given the larger width of the streets, compared to the secondary ones. On the other hand, the areas located at the backyards of the building blocks present lower temperatures compared to the rest of the area. These areas are surrounded by high buildings across all directions and remain mostly shaded throughout the day. The reduced solar radiation results in decreased heat gains and cooler temperatures (Figure 4 and Figure 5).
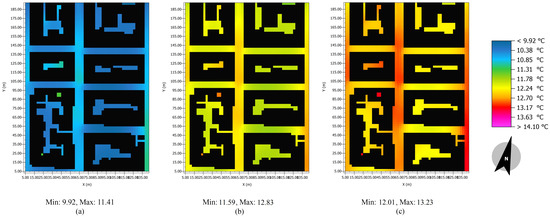
Figure 4.
LCZ2, RCP4.5, air temperature at 12:00 in a typical January day, for time periods (a) 1980–2000, (b) 2040–2060, (c) 2080–2099.
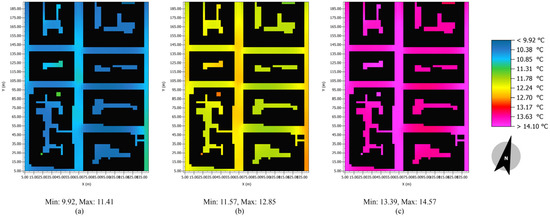
Figure 5.
LCZ2, RCP8.5, air temperature at 12:00 in a typical January day, for time periods (a) 1980–2000, (b) 2040–2060, (c) 2080–2099.
3.1.2. Analysis of Tair Values During the Typical Summer Day in July
Figure 6 and Figure 7 present the Tair distribution inside the LCZ2 case study area at noon, in a typical July day for the three periods, and the RCP4.5 and RCP8.5 scenarios, respectively.
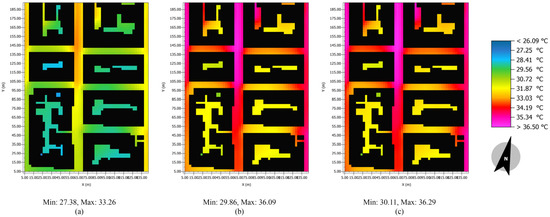
Figure 6.
LCZ2, RCP4.5, air temperature at 12:00 in the typical July day, for time periods (a) 1980–2000, (b) 2040–2060, (c) 2080–2099.
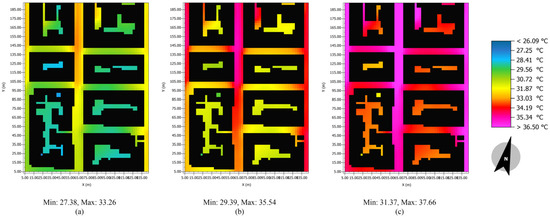
Figure 7.
LCZ2, RCP8.5, air temperature at 12:00 in a typical July day, for time periods (a) 1980–2000, (b) 2040–2060, (c) 2080–2099.
The average Tair of the study area, in a typical July day of the reference period, was 30.67 °C, with a minimum of 27.38 °C and a maximum of 33.26 °C, suggesting a range of 5.88 °C inside the case study area. Concerning the RCP 4.5 scenario, the average Tair is expected to increase to 33.46 °C by 2040–2060, with a further rise to 33.70 °C by 2080–2099. The range of Tair variation remains stable between 6.23 °C and 6.18 °C during these future periods. For the RCP 8.5 scenario, the average Tair is 32.93 °C in 2040–2060, with an increase to 35.08 °C by 2080–2099. The Tair range remains consistent, with values of 6.14 °C in 2040–2060 and 6.29 °C in 2080–2099. Notably, the temperature peaks at a higher value in the later part of the century under RCP 8.5 (Table 6).
Table 6.
Summary of the average, minimum and maximum values of Tair in the LCZ2 area during the typical summer days of the three examined periods and the two emission scenarios.
The obtained simulation results indicate that the Tair rise under the RCP 4.5 is +2.79 °C (mid-century) to +3.0 °C (end of century), whereas for the RCP 8.5, the respective values are +2.3 °C (mid-century) and +4.4 °C (end of century). This confirms the expected stronger warming potential of RCP 8.5 by 2080–2099. Within the Tair range, summer has higher values (5.88 °C to 6.29 °C) compared to those of winter, indicating more critical changes in temperature during the hot periods. That may be due to the stronger solar radiation resulting in bigger differences between the shaded and sunlit areas and the effects of phenomena such as heat storage of urban materials and evapotranspiration, which are more intense during summer.
3.2. Microclimatic Conditions in Case Study Area LCZ3-Nikaia
3.2.1. Analysis on Tair Values During the Typical Winter Day in January
The spatial distribution of Tair at noon, inside the LCZ3 area for the three different periods and for the two emission scenarios in the selected winter days are shown in Figure 8 and Figure 9. As it can be seen, the reference period (1980–2000) is characterized by an average air temperature (Tair) of 11.80 °C. Under the RCP 4.5 scenario, Tair is projected to increase to 13.52 °C in a typical January day of 2040–2060 and 13.95 °C in a typical January day of 2080–2099, corresponding to a total warming of approximately +2.2 °C by the end of the century. On the other hand, under the RCP 8.5 scenario, mid-century warming is comparable to RCP 4.5 (+1.73 °C above the baseline), but by 2080–2099, the magnitude intensifies, with average Tair reaching 15.26 °C (+3.5 °C relative to the baseline). These results highlight the divergence between the two scenarios after mid-century, consistent with the stronger radiative forcing of RCP 8.5 (Table 7).
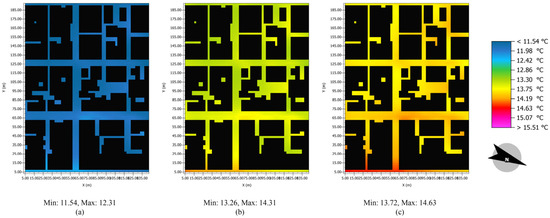
Figure 8.
LCZ3, RCP4.5, air temperature at 12:00 in a typical January day, for time periods (a) 1980–2000, (b) 2040–2060, (c) 2080–2099.
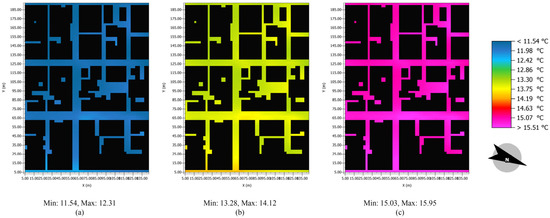
Figure 9.
LCZ3, RCP8.5, air temperature at 12:00 in a typical January day, for time periods (a) 1980–2000, (b) 2040–2060, (c) 2080–2099.
Table 7.
Summary of the average, minimum and maximum values of Tair in the LCZ3 area during the typical winter days of the three examined periods and the two emission scenarios.
The spatial distribution of Tair within the two case study areas is also similar; thermal distribution in LCZ3 is uniform with minimum spatial fluctuations, reflecting the low Tair range (0.7–1.0 °C). Higher Tair values are noticed in the northern part of the district, particularly along the wider north–south street axis, where greater solar penetration occurs due to the canyon geometry. In contrast, cooler conditions are consistently found within the inner courtyards of building blocks, which remain largely shaded by surrounding structures.
Interestingly, LCZ3 area presents slightly higher average Tair (11.8 °C) at noon than LCZ2 during winter (10.54 °C). Although LCZ2 is typically considered more compact and is often associated with higher heat retention, the present analysis of 12:00 Tair shows slightly warmer conditions in LCZ3 during winter. This outcome is likely due to the geometry of the selected LCZ3 area, where lower building heights and wider street canyons permit greater solar penetration around midday in January. By contrast, LCZ2, with taller mid-rise buildings and narrower sky view, remains more shaded at noon, which suppresses Tair despite its higher overall compactness. This finding underlines that, when examining single timesteps such as midday, solar access, and canyon orientation, this may exert a stronger influence on local air temperature than general LCZ classification alone.
3.2.2. Analysis of Tair Values During the Typical Summer Day in July
The following Figure 10 and Figure 11 present the Tair values in the examined LCZ3 area for the selected summer days, under different periods and emission scenarios. The mean air temperature (Tair) for the reference period (1980–2000) inside the case study area is 28.39 °C, ranging from a minimum of 26.10 °C to a maximum of 30.87 °C. Especially for the RCP 4.5 scenario, a higher average value of Tair is expected for the typical July day of 2040–2060, reaching 30.94 °C. In addition, an even higher value of 31.30 °C is estimated for the typical summer day of the period 2080–2099. In the case of RCP8.5, during 2040–2060 the increase in average Tair is similar to RCP 4.5 whereas by 2080–2099 Tair intensifies with the average value reaching 32.90 °C (+4.5 °C) (Table 8). On the spatial distribution of thermal masses, higher values are observed within the area’s north part, in wider north-south oriented street axes, in particular.
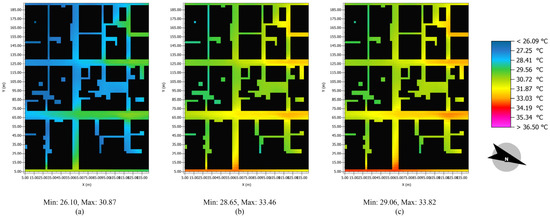
Figure 10.
LCZ3, RCP4.5, air temperature at 12:00 in a typical July day, for time periods (a) 1980–2000, (b) 2040–2060, (c) 2080–2099.
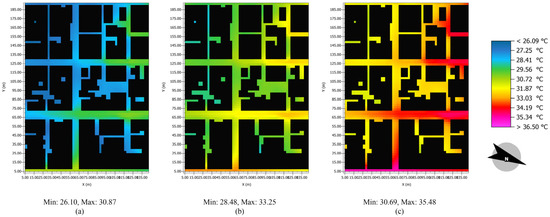
Figure 11.
LCZ3, RCP8.5, air temperature at 12:00 in a typical July day, for time periods (a) 1980–2000, (b) 2040–2060, (c) 2080–2099.
Table 8.
Summary of the average, minimum and maximum values of Tair in the LCZ3 area during the typical summer days of the three examined periods and the two emission scenarios.
Overall, the obtained microclimate simulations results confirm a clear rise in Tair across both LCZ2 and LCZ3, with the increase being rather evident in both winter and summer conditions, under all scenarios. In January, for example, average Tair in LCZ2 rises from 10.5 °C in the reference period to 12.6 °C under RCP 4.5 and 13.9 °C under RCP 8.5 by the end of the century. Similarly, in July, the average Tair increased from 30.67 °C to 33.7 °C (RCP 4.5) and 35.08 °C (RCP 8.5). These changes correspond to a moderate rise of ~+2.0–3.0 °C under RCP 4.5 and a stronger increase of up to +4.4 °C under RCP 8.5, findings that are in line with the existing scientific literature and the broader regional climate projections for the Mediterranean, which show pronounced late-century warming under high-emission pathways [19,30] and strong seasonal differences, with summer warming exceeding that of winter [31]. These projections are also consistent with other microclimatic modeling studies in cities of southern Europe with Mediterranean-type climates, in which comparable temperature increases of 2–4 °C are identified under late-century high-emission scenarios. For instance, similar ENVI-met applications in Lisbon report parallel warming magnitudes and confirm the amplifying role of compact morphology and limited vegetation on local thermal loads [5].
More specifically, the study area of type LCZ2, characterized by denser morphology and deeper street canyons, consistently exhibits higher Tair values than LCZ3 during summer, across all scenarios and time periods. Indicatively, in July, average Tair in LCZ2 reaches 35 °C under RCP 8.5 by 2080–2099, whereas LCZ3 remains slightly cooler at 32.9 °C. This difference might lie in LCZ2’s limited benefit from natural ventilation due to its compact fabric, unable to reduce the heat storage of urban materials. Limited vegetation, also, compared to LCZ3, and higher merit of hardscape material, lowers the effect of evapotranspiration, resulting in overall higher temperatures. On the other hand, in winter, LCZ3 exhibits slightly higher Tair values in all cases. In January, the average Tair under RCP 8.5, during 2080-2099 for LCZ3 is 15.26 °C whereas in LCZ2 13.91 °C. Due to the lower height of the buildings and decreased aspect ratio of street axes, LCZ3 area allows higher solar radiation penetration, compared to LCZ2, benefiting most from passive heating. These thermal contrasts, driven by the morphological parameters of each area, are in line with the conclusions of Zhou and Chen (2018) [32] and Liao et al., (2021) [33], who found that spatial heterogeneity in building height and canyon orientation significantly influences surface UHI intensity. Yet, the present results extend this evidence by quantifying such morphology-dependent differences under future climate scenarios, offering one of the few high-resolution assessments for Mediterranean metropolitan contexts.
In addition, in both LCZs, the highest temperatures consistently occurred along wide north–south street canyons, where maximum January values exceeded 14 °C under RCP 8.5. By contrast, inner courtyards remained cooler, often 1–2 °C below canyon values, due to persistent shading from surrounding buildings. These differences illustrate how orientation and canyon geometry may amplify or mitigate solar gains, aligning with previous studies, where canyon geometry and orientation have been shown to amplify solar exposure and increase the ambient Tair values [32,33,34].
Beyond their physical interpretation, the observed, orientation-dependent variability reinforces the need to establish adaptation strategies that are based on the distinct morphological characteristics of Mediterranean cities, including targeted greening of wide north–south corridors, optimization of building alignments to reduce direct solar exposure, and the strategic use of reflective materials to limit heat retention [17]. In addition, design-oriented interventions are increasingly recognized in European urban resilience frameworks, such as the Covenant of Mayors, as essential tools for mitigating localized heat stress under future climate conditions [35].
Although the analysis focused primarily on Tair, the inclusion of mean radiant temperature and surface temperature in future work would undoubtedly strengthen the evaluation of outdoor thermal environment, since previous studies have demonstrated their key role on human heat stress and thermal comfort, especially during summer [36].
At this point, the following remark should be conveyed: While numerous studies have evaluated the microclimatic conditions and the Urban Heat Island in Mediterranean cities [37,38,39,40,41], the vast majority of them focused on present-day climatic conditions; very few have applied detailed microclimate simulations, such as ENVI-met, to explore future climate scenarios in Mediterranean contexts [15]. As a result, direct comparison with existing literature is constrained. This gap highlights the novelty of the present work, which integrates detailed ENVI-met modeling with dynamically downscaled climate projections (RegCM4) to assess morphology-specific vulnerabilities at the neighborhood scale. By coupling local microclimate processes with regional climate trajectories, this study provides an evidence-based bridge between urban design research and climate adaptation policy for Mediterranean cities.
In addition, the authors acknowledge that the absence of reliable data on future urban development is a limitation that should be considered; the analysis here assumes similar terrain, land uses and building morphology across all simulated periods, thus, neglecting potential changes such as new construction, renovations, or urban redevelopment, all of which could significantly influence microclimatic conditions. Moreover, the simulations do not account for anthropogenic heat sources, mainly as issued by the traffic and air conditioning devices, which are very commonly used in Greek cities for cooling purposes. Given their significant contribution to urban warming [42], the exclusion of these factors may lead to an underestimation of total heat loads during summer days.
Finally, the use of representative days and selected timesteps, while necessary for data management, constrains the temporal resolution of the analysis. A broader set of simulated days across different years and climate conditions would allow a more robust assessment of intra- and interannual variability.
4. Conclusions
This study examined via ENVI-met microclimate simulations the projected evolution of air temperature in two representative Local Climate Zones of Athens, under the RCP 4.5 and RCP 8.5 emission scenarios. Using the ENVI-met model, the analysis revealed a consistent and spatially heterogeneous warming trend, with stronger increases during summer months and distinct morphology-dependent variations between the two LCZ types. Denser mid-rise areas (LCZ2) tended to experience slightly higher air temperatures than compact low-rise districts (LCZ3), primarily due to greater solar exposure and higher heat storage capacity.
More specifically, the simulations suggested that in winter (January), the average Tair at noon was 10.54 °C in LCZ2 and 11.8 °C in LCZ3 during the reference period. By 2080–2099, the respective average Tair at noon is expected to increase by 2.04 °C in LCZ2 and by 2.15 °C in LCZ3 under RCP 4.5. Yet, the predicted Tair increase at noon was almost 3.50 °C for both case study areas under RCP8.5. In summer (July), the average Tair at noon during the reference period was estimated at 30.67 °C for LCZ2 and 28.39 °C for LCZ3. By late-century (2080–2099), these rose to 33.70 °C (+3.03 °C) in LCZ2 and 31.30 °C (+2.91 °C) in LCZ3 under RCP 4.5, and to 35.08 °C (+4.41 °C) and 32.90 °C (+4.51 °C) under RCP 8.5. Overall, LCZ2 tends to be warmer than LCZ3 by approximately 2.2–2.5 °C during summer, mainly due to the denser mid-rise morphology that enhances heat entrapment during summer.
Despite the previously mentioned limitations, the novelty of this study lies in combining high-resolution ENVI-met microclimate simulations with dynamically downscaled regional climate projections (RegCM4), enabling one of the first scenario-based assessments of morphology-specific vulnerabilities in a Mediterranean city. From a policy and planning perspective, the obtained results are expected, on one hand, to provide further insight into the interactions between urban areas and future climate conditions, and to contribute to the establishment of morphology-sensitive adaptation strategies in cities facing escalating climate pressures. Measures such as enhancing urban greenery, increasing shaded areas along wide north–south corridors, incorporating high-albedo and permeable materials, and optimizing street orientation could help mitigate localized heat accumulation, thus suggesting perspectives for future studies.
In addition, future work should integrate human thermal comfort metrics such as the Universal Thermal Comfort Index, while coupling microclimate models with urban development and energy-use scenarios. Including anthropogenic heat and evaluating mitigation measures (e.g., reflective pavements, urban greening patterns) would also provide more realistic assessments. Such efforts will advance the capacity of microclimate modeling to inform evidence-based urban adaptation policies across Mediterranean and other climate-sensitive regions.
Although the introduction of deep-learning methods is not within the methodological scope of this paper, future research could also focus on developing a surrogate deep-learning model trained on ENVI-met outputs, enabling the rapid evaluation of morphology–climate interactions at the city scale. Such a model would substantially reduce computational demands, while maintaining physical interpretability and facilitating large-scale scenario testing for urban heat mitigation and adaptation planning.
Author Contributions
Conceptualization, S.T.; methodology, S.T., Z.Z., I.T. and K.V.; software, Z.Z. and K.V.; formal analysis, S.T., Z.Z., I.T. and K.V.; investigation, S.T., Z.Z., I.T. and K.V.; data curation, S.T., Z.Z., I.T. and K.V.; writing—original draft preparation, S.T. and Z.Z.; writing—review and editing, S.T., Z.Z., I.T. and K.V.; supervision, S.T.; project administration, S.T.; funding acquisition, S.T. All authors have read and agreed to the published version of the manuscript.
Funding
This research was funded by Re.Nature Cities research project, implemented in the framework of H.F.R.I called “Basic research Financing (Horizontal support of all Sciences)” under the National Recovery and Resilience Plan “Greece 2.0” funded by the European Union–Next Generation EU (H.F.R.I. Project Number:15566). https://renaturecities.gr/.
Data Availability Statement
The original data for the selection of the simulation days presented in the study are openly available at https://doi.org/10.5281/zenodo.14513140.
Conflicts of Interest
The authors declare no conflicts of interest.
References
- Clos, J. A New Urban Agenda for the 21st century: The role of urbanisation in sustainable development. OECD Reg. Outlook 2016, 239–249. [Google Scholar]
- Oke, T.R. Boundary Layer Climates; Routledge: London, UK, 2002. [Google Scholar]
- Rizwan, A.M.; Dennis, L.Y.C.; Liu, C. A review on the generation, determination and mitigation of Urban Heat Island. J. Environ. Sci. 2008, 20, 120–128. [Google Scholar] [CrossRef] [PubMed]
- Zhan, D.; Sezer, N.; Hou, D.; Wang, L.; Hassan, I.G. Integrating urban heat island impact into building energy assessment in a hot-arid city. Buildings 2023, 13, 1818. [Google Scholar] [CrossRef]
- Andrade, C.; Fonseca, A.; Santos, J.A. Climate change trends for the Urban Heat Island intensities in two major Portuguese cities. Sustainability 2023, 15, 3970. [Google Scholar] [CrossRef]
- Papamanolis, N. The main characteristics of the urban climate and the air quality in Greek cities. Urban. Clim. 2015, 12, 49–64. [Google Scholar] [CrossRef]
- Maloutas, T.; Arapoglou, V.; Kandylis, G.; Sayas, J. Social polarization and de-segregation in Athens. In Residential Segregation in Comparative Perspective; Routledge: London, UK, 2012; pp. 257–283. [Google Scholar]
- Tsirigoti, D.; Bikas, D. A cross scale analysis of the relationship between energy efficiency and urban morphology in the Greek city context. Procedia Environ. Sci. 2017, 38, 682–687. [Google Scholar] [CrossRef]
- Theodoridou, I.; Papadopoulos, A.M.; Hegger, M. A feasibility evaluation tool for sustainable cities–A case study for Greece. Energy Policy 2012, 44, 207–216. [Google Scholar] [CrossRef]
- Beriatos, E.; Gospodini, A. “Glocalising” urban landscapes: Athens and the 2004 Olympics. Cities 2004, 21, 187–202. [Google Scholar] [CrossRef]
- Toparlar, Y.; Blocken, B.; Maiheu, B.; van Heijst, G.J.F. A review on the CFD analysis of urban microclimate. Renew. Sustain. Energy Rev. 2017, 80, 1613–1640. [Google Scholar] [CrossRef]
- Tsoka, S.; Tsikaloudaki, A.; Theodosiou, T. Analyzing the ENVI-met microclimate model’s performance and assessing cool materials and urban vegetation applications–A review. Sustain. Cities Soc. 2018, 43, 55–76. [Google Scholar] [CrossRef]
- Jänicke, B. Review of Models and Tools for Climate-sensitive Urban Design. In Proceedings of the 10th International Conference on Urban Climate/14th Symposium on the Urban Environment, New York, NY, USA, 6–10 August 2018. [Google Scholar]
- Zou, J.; Lu, H.; Shu, C.; Ji, L.; Gaur, A.; Wang, L.L. Multiscale numerical assessment of urban overheating under climate projections: A review. Urban. Clim. 2023, 49, 101551. [Google Scholar] [CrossRef]
- Tsoka, S.; Velikou, K.; Tolika, K.; Tsikaloudaki, A. Evaluating the combined effect of climate change and urban microclimate on buildings’ heating and cooling energy demand in a mediterranean city. Energies 2021, 14, 5799. [Google Scholar] [CrossRef]
- Błażejczyk, K.; Baranowski, J.; Jendritzky, G.; Błażejczyk, A.; Bröde, P.; Fiala, D. Regional features of the bioclimate of Central and Southern Europe against the background of the Köppen-Geiger climate classification. Geogr. Pol. 2015, 88, 439–453. [Google Scholar] [CrossRef]
- Agathangelidis, I.; Cartalis, C.; Santamouris, M. Urban morphological controls on surface thermal dynamics: A comparative assessment of major European cities with a focus on Athens, Greece. Climate 2020, 8, 131. [Google Scholar] [CrossRef]
- Stewart, I.D.; Oke, T.R. Local climate zones and urban climatic mapping. In The Urban Climatic Map; Routledge: London, UK, 2015; pp. 449–453. [Google Scholar]
- Velikou, K.; Tolika, K.; Anagnostopoulou, C.; Zanis, P. Sensitivity analysis of RegCM4 model: Present time simulations over the Mediterranean. Theor. Appl. Climatol. 2019, 136, 1185–1208. [Google Scholar] [CrossRef]
- Zaraveli, Z.; Theodoridou, I.; Tsoka, S.; Velikou, K. Re.Nature Cities. Deliverable 1.1: Case Study Areas and Simulation Days; Zenodo: Geneva, Switzerland, 2024. [Google Scholar] [CrossRef]
- Elguindi, N.; Bi, X.; Giorgi, F.; Nagarajan, B.; Pal, J.; Solmon, F.; Giuliani, G. Regional Climate Model RegCM Reference Manual; Version 4.7; The Abdus Salam International Centre for Theoretical Physics (ICTP): Trieste, Italy, 2017; 49p. [Google Scholar]
- Grell, G.A.; Dudhia, J.; Stauffer, D.R. A Description of the Fifth-Generation Penn State/NCAR Mesoscale Model (MM5); NCAR Technical Note NCAR/TN-398+STR; National Center for Atmospheric Research: Boulder, CO, USA, 1994. [Google Scholar]
- Tsoka, S.; Tolika, K.; Theodosiou, T.; Tsikaloudaki, K.; Bikas, D. A method to account for the urban microclimate on the creation of ‘typical weather year’datasets for building energy simulation, using stochastically generated data. Energy Build. 2018, 165, 270–283. [Google Scholar] [CrossRef]
- Bruce, M.; Fleer, H. Simulating surface–plant–air interactions inside urban environments with a three dimensional numerical model. Environ. Model. Softw. 1998, 13, 373–384. [Google Scholar] [CrossRef]
- Rong, Y.; Song, J.; Xu, Z.; Lin, H.; Liu, J.; Yang, B.; Guo, S. Performance Evaluation and Simulation Optimization of Outdoor Environmental Space in Communities Based on Subjective Comfort: A Case Study of Minhe Community in Qian’an City. Buildings 2025, 15, 2078. [Google Scholar] [CrossRef]
- Liu, Y.; Bi, L.; Hu, R.; Ye, L.; Zheng, W.; Lan, Y. Microclimate of Outdoor Tree-Lined Boulevards in University Campuses in Hot Summer and Cold Winter Regions: A Case Study of a University in Guilin. Buildings 2025, 15, 1476. [Google Scholar] [CrossRef]
- Tsoka, S.; Pappa, V.; Markos, N.; Bouris, D. Assessing the effect of citrus plant on the improvement of the outdoor thermal environment using wind tunnel and ground-based Leaf Area Index measurements. In Proceedings of the EGU General Assembly Conference Abstracts, Vienna, Austria, 14–19 April 2024; p. 20879. [Google Scholar]
- Krüger, E.; Minella, F.; Matzarakis, A. Comparison of different methods of estimating the mean radiant temperature in outdoor thermal comfort studies. Int. J. Biometeorol. 2014, 58, 1727–1737. [Google Scholar] [CrossRef]
- Faragallah, R.N.; Ragheb, R.A. Evaluation of thermal comfort and urban heat island through cool paving materials using ENVI-Met. Ain Shams Eng. J. 2022, 13, 101609. [Google Scholar] [CrossRef]
- Zittis, G.; Hadjinicolaou, P.; Klangidou, M.; Proestos, Y.; Lelieveld, J. A multi-model, multi-scenario, and multi-domain analysis of regional climate projections for the Mediterranean. Reg. Environ. Change 2019, 19, 2621–2635. [Google Scholar] [CrossRef]
- Founda, D.; Giannakopoulos, C. The exceptionally hot summer of 2007 in Athens, Greece—A typical summer in the future climate? Glob. Planet. Change 2009, 67, 227–236. [Google Scholar] [CrossRef]
- Zhou, X.; Chen, H. Impact of urbanization-related land use land cover changes and urban morphology changes on the urban heat island phenomenon. Sci. Total Environ. 2018, 635, 1467–1476. [Google Scholar] [CrossRef] [PubMed]
- Liao, W.; Hong, T.; Heo, Y. The effect of spatial heterogeneity in urban morphology on surface urban heat islands. Energy Build. 2021, 244, 111027. [Google Scholar] [CrossRef]
- Acero, J.A.; González-Asensio, B. Influence of vegetation on the morning land surface temperature in a tropical humid urban area. Urban. Clim. 2018, 26, 231–243. [Google Scholar] [CrossRef]
- De Botselier, B. How the EU Covenant of Mayors and Climate-Adapt Strengthen Local Climate Policy-Making. A Case Study of the City of Bruges; IED: Brussels, Belgium, 2019. [Google Scholar]
- Alfano, F.R.d.A.; Pepe, D.; Riccio, G.; Vio, M.; Palella, B.I. On the effects of the mean radiant temperature evaluation in the assessment of thermal comfort by dynamic energy simulation tools. Build. Environ. 2023, 236, 110254. [Google Scholar] [CrossRef]
- Tousi, E.; Tseliou, A.; Mela, A.; Sinou, M.; Kanetaki, Z.; Jacques, S. Exploring thermal discomfort during Mediterranean heatwaves through softscape and hardscape ENVI-Met simulation scenarios. Sustainability 2024, 16, 6240. [Google Scholar] [CrossRef]
- Tsoka, S.; Tsikaloudaki, K.; Theodosiou, T. Urban space’s morphology and microclimatic analysis: A study for a typical urban district in the Mediterranean city of Thessaloniki, Greece. Energy Build. 2017, 156, 96–108. [Google Scholar] [CrossRef]
- Antoniou, N.; Montazeri, H.; Neophytou, M.; Blocken, B. CFD simulation of urban microclimate: Validation using high-resolution field measurements. Sci. Total Environ. 2019, 695, 133743. [Google Scholar] [CrossRef]
- Aleksandrowicz, O.; Saroglou, T.; Pearlmutter, D. Evaluation of summer mean radiant temperature simulation in ENVI-met in a hot Mediterranean climate. Build. Environ. 2023, 245, 110881. [Google Scholar] [CrossRef]
- El Bat, A.M.S.; Romani, Z.; Bozonnet, E.; Draoui, A. Thermal impact of street canyon microclimate on building energy needs using TRNSYS: A case study of the city of Tangier in Morocco. Case Stud. Therm. Eng. 2021, 24, 100834. [Google Scholar] [CrossRef]
- Salamanca, F.; Georgescu, M.; Mahalov, A.; Moustaoui, M.; Wang, M. Anthropogenic heating of the urban environment due to air conditioning. J. Geophys. Res. Atmos. 2014, 119, 5949–5965. [Google Scholar] [CrossRef]


Disclaimer/Publisher’s Note: The statements, opinions and data contained in all publications are solely those of the individual author(s) and contributor(s) and not of MDPI and/or the editor(s). MDPI and/or the editor(s) disclaim responsibility for any injury to people or property resulting from any ideas, methods, instructions or products referred to in the content. |
© 2025 by the authors. Licensee MDPI, Basel, Switzerland. This article is an open access article distributed under the terms and conditions of the Creative Commons Attribution (CC BY) license (https://creativecommons.org/licenses/by/4.0/).