Article

Quantifying the Cooling Nexus of Green-Blue Infrastructure in Hyper-Arid Cities: A Spatial Ecosystem Services Approach

by
Jahanbakhsh Balist
1,*,
Hassan Darabi
2,* and
Abdolhossein Hoveyzavi
2
1
Environment Planning, Management, and HSE Department, Faculty of Environment, University of Tehran, Tehran 1417853111, Iran
2
Environmental Design Department, Graduated Faculty of Environment, University of Tehran, Tehran 1417853111, Iran
*
Authors to whom correspondence should be addressed.
Buildings 2025, 15(21), 3975; https://doi.org/10.3390/buildings15213975
Submission received: 21 September 2025 / Revised: 22 October 2025 / Accepted: 25 October 2025 / Published: 3 November 2025

Abstract

While many studies have investigated ecosystem services, the cooling potential of green and blue infrastructures (GBIs) for alleviating extreme heat in arid regions has been studied less frequently. The aim of this study is to measure GBI cooling potential for mitigating extreme heat in arid and semi-arid regions, using Ahvaz City (south-west Iran) as a case study. Multiple data sources were used with the InVEST urban cooling model to estimate cooling ecosystem services (CESs) by evaluating the cumulative effects of shade, evapotranspiration, and albedo. Results show: (a) spatial heterogeneity in GBI cooling effects; (b) the highest cooling capacity (Cooling Capacity Index = 0.75) is achieved along the Karun River corridor and adjacent irrigated agriculture, where land surface temperature is reduced by 2–6 °C relative to built-up areas; and (c) interconnected GBIs and high vegetation density enhance cooling. High cooling capacity (>0.6) covers only 8.3% of the city (14.2 km2), predominantly the Karun River (4.2 km2) and adjacent agriculture (10.0 km2). In contrast, built-up areas (76% of the city) exhibit low cooling capacity (<0.3). Therefore, improving GBI connectivity and integrating passive cooling strategies are essential to enhance thermal resilience and should be prioritized in urban planning to maximize CES effectiveness and reduce heat-related risks.

1. Introduction

Natural systems provide ecological services that support all life on earth [1]. Ecosystem services (ES) include a variety of productive, regulatory, support, and cultural functions. Cooling service is one ES that deals with temperature regulation systems and is most commonly discussed in urban areas. The presence of vegetative cover, such as trees and urban green spaces, provides shading, increases evapotranspiration, and moderates albedo. This can help to reduce heat island effects in urban areas [2,3]. The cooling service can be viewed as part of the “oasis effect” provided by green infrastructures [4]. The cooling service’s impact on surface temperature reduction and urban heat island mitigation has been extensively researched and explained [5,6].
The scope of investigations into cooling ecosystem services has been expanded. In this context, some studies investigate vegetation’s role in urban cooling and its ability to reduce surface temperature [5,6]. Furthermore, research on landscape features (e.g., water bodies) to mitigate urban heat fluxes, cooling, and energy savings for cooling is investigated [3,7]. At the same time, some researchers are trying to combine the cooling effect of ESs into urban planning and the making of policy decisions. This research is usually focused on the development of green infrastructure strategies [2,3,8]. Similarly, this body of work investigates the role of vegetation and landscape features (e.g., water bodies) in mitigating heat flux exchanges and providing additional cooling benefits, resulting in less energy and demand for mechanical cooling in the urban environment and improved thermal comfort [3,7].
These investigations will highlight the significance of cooling ecosystem services (CESs), so the emphasis will be on incorporating CESs into actionable urban planning and policymaking. In this regard, the development of green infrastructure (GI) has emerged as a significant strategy to promote sustainability and resilience, as it plays an important role in providing CESs in the face of climate change [2,9]. As a result, conserving and creating urban green space is identified as a strategy for preventing rising temperatures and extreme heat events [8,10]. The InVEST model, for example, has been used as a support tool in urban planning and policymaking, producing spatially explicit results that better inform decision-makers [2,11]. Furthermore, CESs can be viewed as an adaptation strategy to climate change [12,13]. This is due to urban green spaces’ inherent ability to respond to climate change with a cooling effect [14,15].
FLUS and PLUS are still conducting research into dynamic modeling for urban cooling effects. The modeling attempts to simulate assumptions about CES provision and predict future changes [16,17]. Empirical studies of the CES impact in cities such as Paris and Minneapolis-St. Paul show that green infrastructure has physical benefits [2].
Concurrently, studies are looking into the effects of CESs on thermal comfort, including the critical influencing factors of tree canopy density, ground cover, water features, surface albedo, and shade scale on CESs [18,19]. Now, the performance of these factors will vary according to the local context. Detommaso et al. [18] investigate the cooling effects of vegetation [18]. Zuo et al. [19] attempt to quantify outdoor climate comfort using the landscape features described above. Zhou et al. [9] report a cooling effect based on landscape patterns. Overall, the findings of these studies show that cooling effects reduce energy demand and urban thermal comfort [17,20,21].
The combination of remote sensing and numerical models, such as the Cooling Capacity Index used in InVEST, improved our ability to comprehensively quantify urban cooling potential. The integral methodology for assessing cooling efficiency takes into account key components such as evapotranspiration, shading, and albedo [22,23]. Devices like ENVI-met contribute to additional high-resolution measurements of local microclimate [22]. Remote sensing was used to conduct similar measurements using satellite-derived data to investigate cooling effects and measure cooling potential in relation to cities [24,25].
A review of the literature reveals a significant amount of work in subtropical [4,26] and temperate/warm-temperate [27,28] climates, while work in arid areas is less prominent. As a result, there appears to be a gap in more comprehensive empirical evidence that specifically investigates the performance and benefits of green infrastructure in arid areas and under extreme heat conditions. Furthermore, research findings from temperate or more humid regions are not entirely replicable in arid areas [29]. Furthermore, arid areas are subject to long-term droughts, which emphasize water availability. This context creates a significant barrier to understanding the utility of CESs [30]. As a result, there is a distinct gap in the consideration of arid environments and extreme temperature exposure, which is understood in the literature to be temporal.
However, the majority of CES studies using the InVEST model focus on subtropical areas [4,26] or temperate and warm-temperate climates [27,28]. As a result, arid regions receive less consideration. Critically, the results of these studies cannot be generalized to arid areas due to fundamental differences in their environments, such as hydrology, vegetation physiology, and energy balance [29]. Furthermore, arid cities experience prolonged drought and severe water scarcity, posing critical constraints on green infrastructure performance. These raise concerns about the validity of standard InVEST parameterizations. Evapotranspiration and vegetation cooling efficiency are extremely important [30]. Although Zardo et al. [31], Kadaverugu et al. [17], and Hamel et al. [2] used InVEST in dry or semi-arid environments, they paid less attention to recalibrating the model using local microclimate data and the explicit trade-offs between water and cooling benefits. This study attempts to build on previous work by locally calibrating InVEST’s biophysical parameters using species-specific traits of common desert vegetation in Ahvaz. It also attempts to validate model results using satellite-derived land surface temperature.
This study focuses on a significant gap identified during the literature review. The main focus of the research is on the ability of CESs to provide green spaces and mitigate extreme heat in arid urban areas. To this end, the city of Ahwaz in Iran was chosen as the case study. Ahwaz, in south-west Iran, has one of the hottest urban temperatures ever recorded [32], but there are also environmental stressors and serious air quality challenges to urban thermal comfort. Thus, this study tries to answer two main concerns: (1) How do different types of green infrastructure affect land surface temperature in Ahvaz, which includes various vegetation types? (2) How does local calibration of Invest improve the accuracy of predicting cooling effects in extreme arid environments? This study addresses this gap by focusing on the city of Ahvaz, Iran; while there have been studies of both subtropical and temperate climates (e.g., Guangzhou, Würzburg, London, Chicago), the findings from humid climates may not apply to arid systems. This study aims to contribute to climate-adaptive urban planning with a focus on the arid environment in Ahvaz, Iran. It may demonstrate appropriate green infrastructure, species selection, and management techniques. Furthermore, the information presented may help to support a focus on the transferability of cooling measures to other dry and semi-dry cities.

2. Materials and Methods

2.1. The Area of Study

Ahvaz, the capital of Khuzestan Province, is located in southwestern Iran at 31°30′ N and 48°40′ E, and at an average elevation of 12 m on an alluvial plain (Figure 1). Ahvaz is divided into two halves by the Karun River, the largest and most water-rich river in Iran, and the city is classified as BWh (hot desert climate) in the Köppen-Geiger system. Maximum temperatures frequently exceed 45 °C in the hot mountains, with recorded highs near 53 °C [32]. The average annual rainfall is less than 250 mm. The most precipitation occurs in winter, while summers are generally rain-free. These unfavorable climate conditions, coupled with quickly expanding urbanization, widespread impervious surfaces, and very limited green infrastructure, have made the urban heat island (UHI) effect and thermal discomfort even worse. Besides the urban heat island effects, Ahvaz also has phenomenally unfavorable air quality as a result of dust and sandstorms that almost always come from southern Iraq and the Arabian Peninsula.
Over the course of the year and most days, particulate matter (PM) concentrations continuously exceed World Health Organization standards, marking Ahvaz one of the most polluted cities in the world. Two primary reasons establish Ahvaz as a pertinent case study for evaluating urban cooling services: first, various environmental stressors, including extreme heat, low humidity, and chronic air pollution; and second, an arid and hyper-arid environment.

2.2. Method

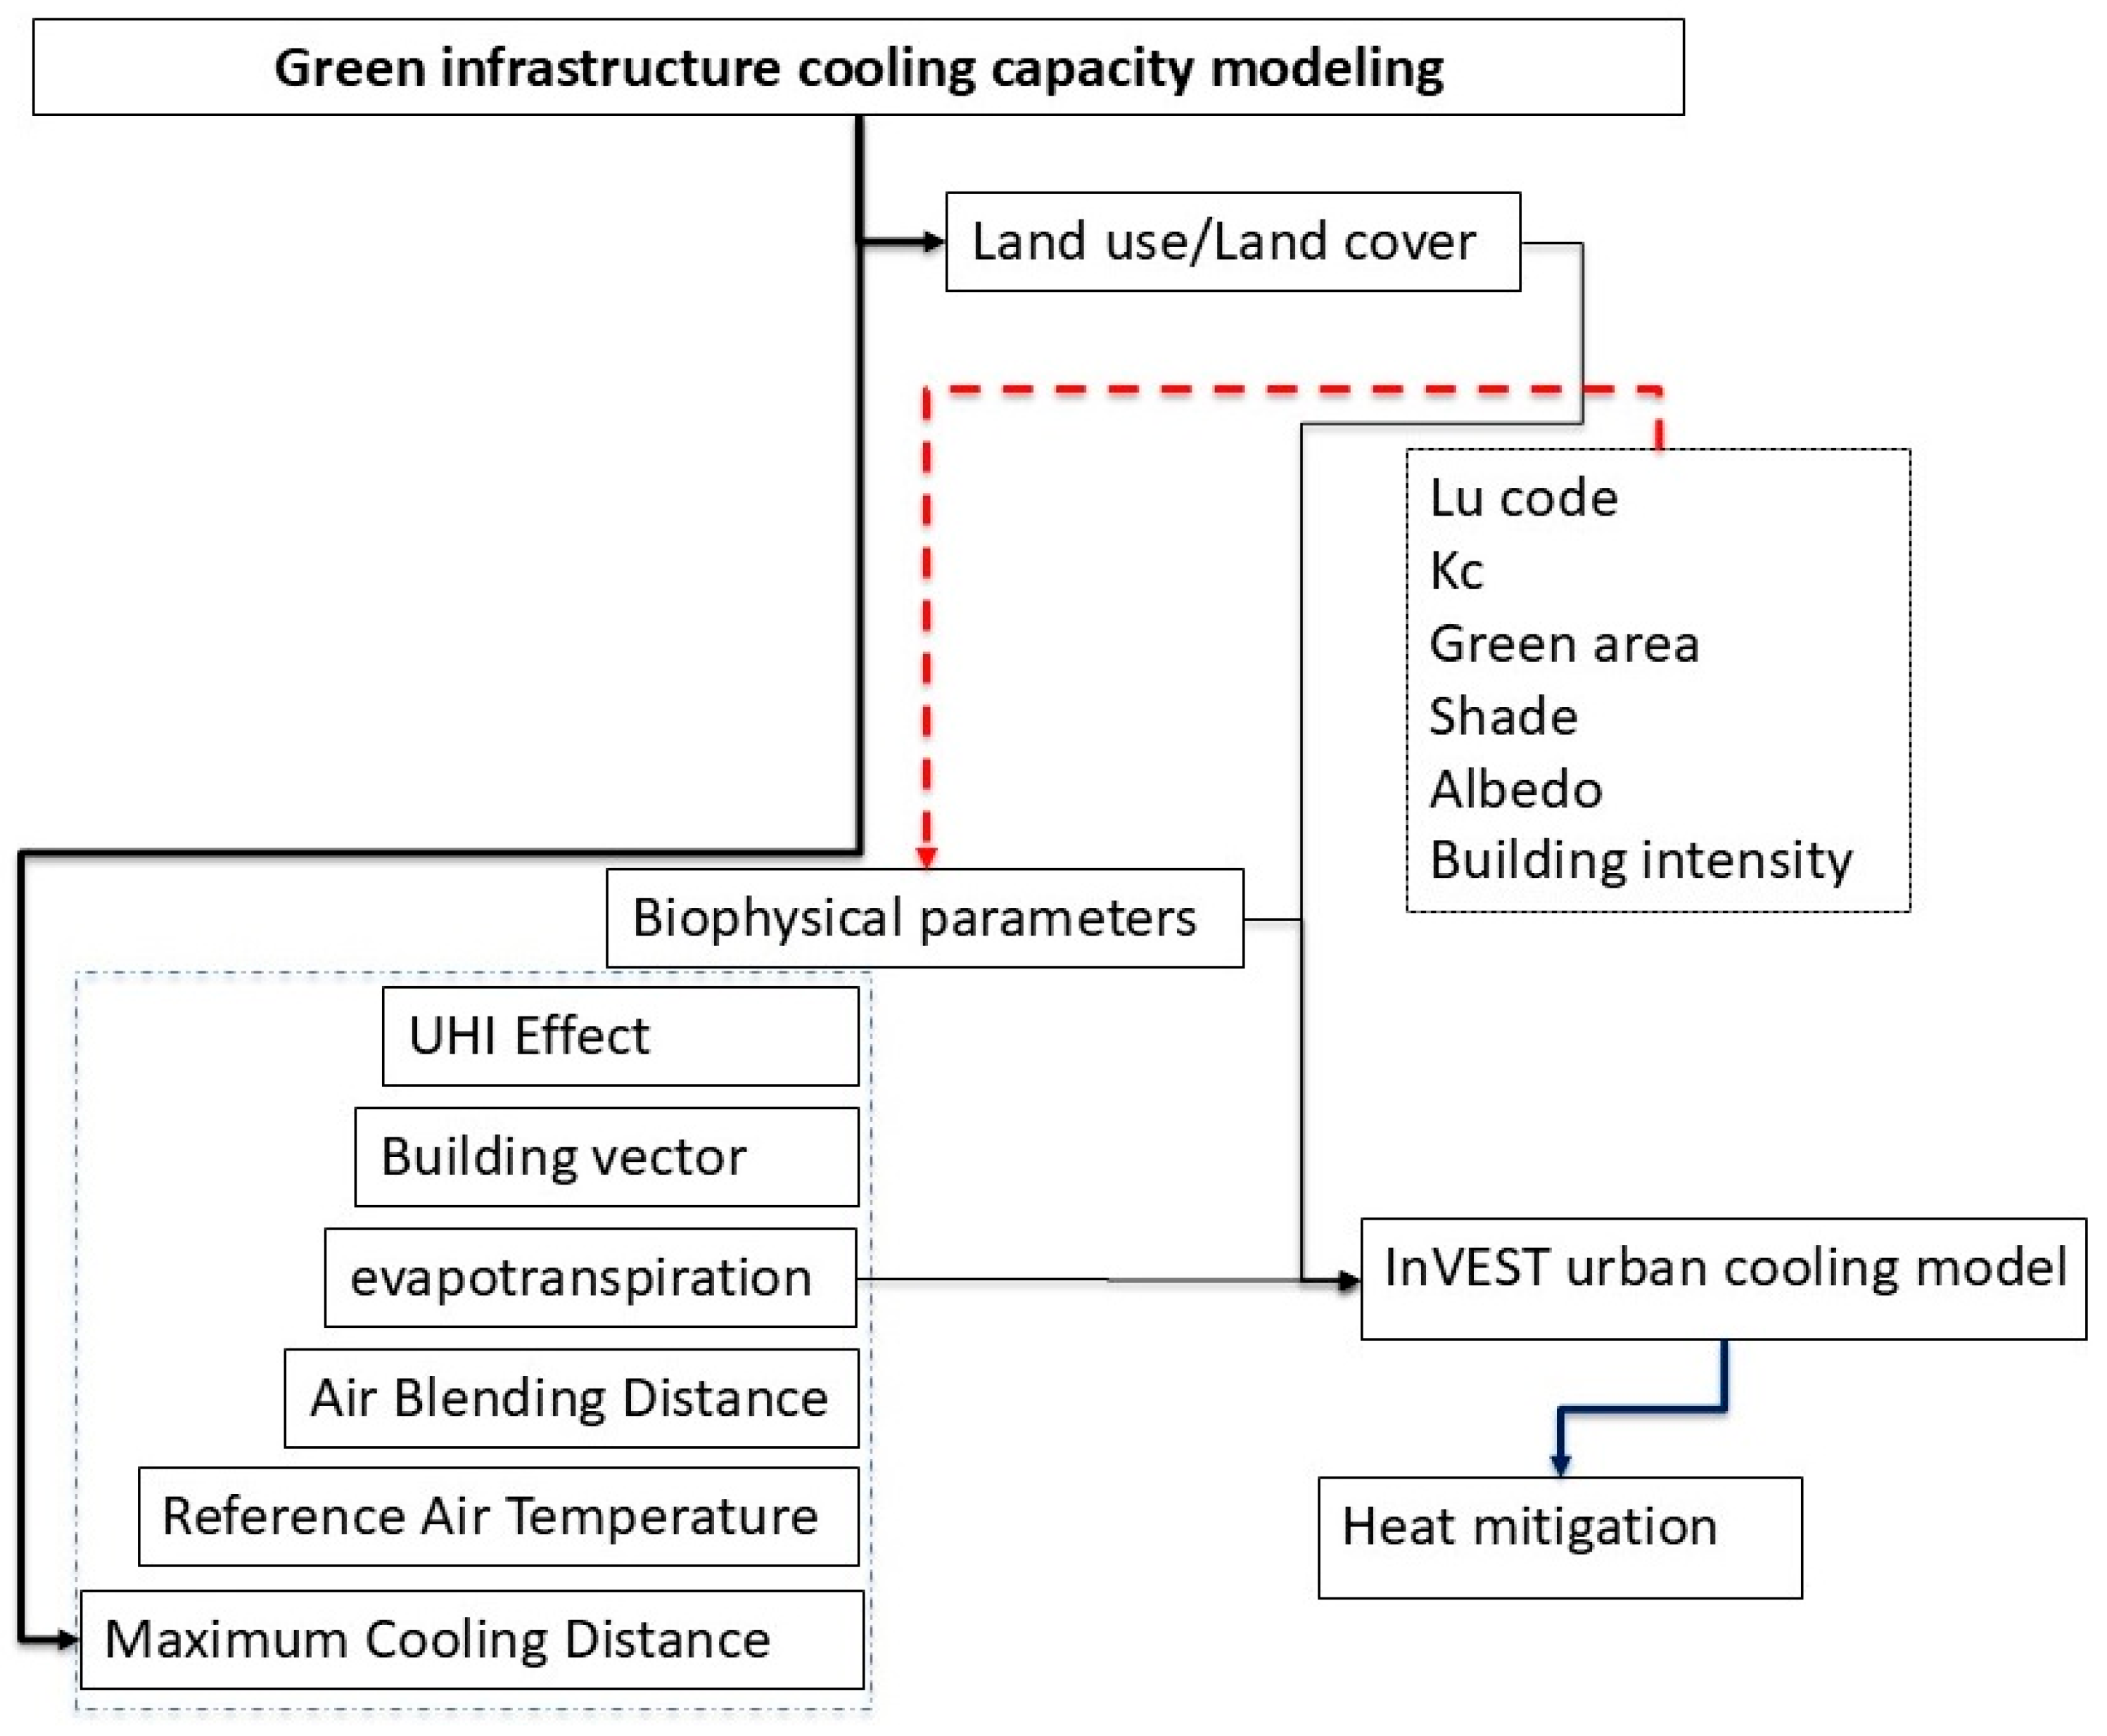
The purpose of this study is to examine the cooling effect and GI effectiveness in an arid area. The multi-stages and phases will be discussed based on Figure 2, and the detailed models and methods utilized are detailed in the sections below.

2.3. Data Collection and Preparation

The three types of input data required to run the InVEST urban cooling model (v3.12.0) are: (1) land use/land cover (LULC), (2) biophysical parameters, and (3) climatic data. The datasets are prepared to ensure spatial and temporal consistency (see Table 1). The data acquisition and processing were carried out based on the InVEST urban cooling model criteria to maintain the accuracy and reproducibility of the modeling outputs.

2.4. Land Use Map Preparation

The land use/land cover (LULC) map was generated and processed based on Ahvaz Municipality shapefiles [33] and validated through visual inspection of Sentinel-2 imagery (10 m resolution) and short field visits. The six categories of LULC classification are provided based on the requirements of the InVEST urban cooling model, including bare land, built-up areas, farming lands, palm gardens, urban green spaces, and water. Unique land use codes (Lucode) will be assigned to each class of the biophysical table. The final LULC layer was projected to the UTM Zone 39N system projection. The LULC became a raster, with a uniform cell size, and then clipped to the boundaries of the study area so that it would be spatially compatible with the other model inputs.

2.5. InVEST Urban Cooling Model

The cooling capacity is estimated through three biophysical mechanisms: shade, evapotranspiration, and albedo.

2.5.1. Cooling Capacity Index (CCI)

The initial cooling capacity index for each pixel is calculated in the InVEST model using an assessment of local shading, evapotranspiration, and albedo [31,36]. The shading factor (shade) describes the amount of tree canopy (for trees over 2 m tall) associated with each LU/LC class and has a value between 0 and 1. Furthermore, albedo is an essential factor for reducing heat (Table 2).
The Evapotranspiration Index (ETI) represents the potential normal evapotranspiration. It refers to the evaporation and transpiration from plants (or evaporation from the soil for areas without vegetation). Then, it is divided by the maximum value of raster ET0 in the specified area, referred to as ETmax, as Equation (1):
E T I = k c E T 0 E T m a x
The albedo factor is the representative of the solar radiation fraction that is reflected by a given LU/LC type [37]. The albedo factor ranges from 0 to 1. This model combines the three factors (shade, albedo factor, and ETI) in the cooling capacity (CC) index as Equation (2):
CCi   =   0.6 shade   +   0.2 albedo   +   0.2 ETI
In Equation (2), the default weighting values are 0.6, 0.2, 0.2. The values were obtained empirically and exhibited more influence of shading than evapotranspiration. In the case of Zardo et al. [31], a weight of 0.2 was assigned to the evapotranspiration of areas smaller than two hectares, while shading received a weight of 0.8.
Building intensity influences the nighttime temperature. As a result, building intensity coefficient for each land use type should be provided in the biophysical table by the user in order to predict nighttime temperatures accurately [24]. Hence, the model modifies Equation (2) to Equation (3):
CCi   =   1     building   intensity

2.5.2. The Urban Cooling Index (Impact of Large Green Spaces)

The cooling model calculates the urban mitigation index (UMI) that explains the cooling potential of large green areas (>2 ha) on their surrounding environment [32]. Whenever a large green space does not impact a particular pixel, the UMI is equivalent to the cooling capacity (CC) of that pixel. To realize this process, the model first computes the green area values within the cooling search distance (dcool) around each pixel (GAi) and the cooling capacity provided by each park (CCparki) as Equations (4) and (5):
G A i = cell area Σ j d   radius from   i g j
C C P a r k i = Σ j d   r a d i u s   f r o m   i g j C C j e d i , j d c o o l
In this equation, if the cell area is in hectares per cell, then:
For each pixel (j), (gj = 1) if it is green space, otherwise (gj = 0).
(d(i, j)) is the distance between pixels (i) and (j).
(dcool) is the distance over which a green space provides cooling.
(CCpark,i) is the weighted average of CC values from nearby green spaces.
The user should determine green areas in the LU/LC classification. It is defined as the “green_area” parameter in the biophysical table (Table 1). Then, the HM index will be calculated as Equation (6):
H M i = C C i C C p a r k i Otherwise i f   C C i C C p a r k i   o r   G A i < 2   h a

2.5.3. Estimation of Air Temperature

At the scale of the city, the model employs the UHI index to estimate the reduction in heat. The air temperature without air mixing (Tairnomix) for each pixel is calculated through Equation (7):
T a i r n o m i x . i = T a i r . r e f + ( 1 H M i ) U H I m a x
in which Tair.ref is the reference rural air temperature. UHImax is the maximum urban heat island (UHI) effect for the city. Finally, the actual air temperature (Tair) is obtained by applying a Gaussian kernel (Table 3). It will be defined by the core radius (r) in order to unmixed temperature (Tair_nomix).

2.6. Urban Cooling Capacity

Ultimately, the urban cooling capacity is defined by the capability of green spaces within urban areas to mitigate and reduce the local urban heat island effect. It overall influences the thermal comfort in urban environments.

2.6.1. Model Validation and Sensitivity Analysis

To validate the model results, the estimated LSTs were compared to actual temperature data collected at the Ahvaz meteorological station. The result was <1.2 °C, which is an acceptable range for this scale of modeling [35].
Furthermore, a sensitivity analysis was carried out on the three main factors: shadow, albedo, and ETI. The weights of these parameters were adjusted based on the InVEST model assumptions and arid climate characteristics, so that the shadow factor received the highest weight and albedo received the lowest weight; in arid climates, evapotranspiration and shading play a much more important role in the ecosystem cooling process than surface reflectance. Based on the findings that shading dominates cooling in arid cities [7,31], the default weights (0.6/0.2/0.2) are retained.

2.6.2. Model Limitations

The access to the biophysical parameters through the local measurement was a major limitation. Therefore, the desired data are obtained from literature and expert judgment. The data scarcity in arid cities limited this work, but we tried to choose parameters transparently documented and well-documented (Table 2) to be consistent with peer-reviewed and valid research in similar climates.

3. Results

3.1. Land Use/Land Cover (LULC)

The land use/land cover (LULC) map for Ahvaz City is shown in Figure 3 and Table 4. The classification includes six general classes: bare land (17.26%), built-up areas (39.04%), agricultural land (35.29%), palm gardens (1.05%), urban green space (2.58%), and water bodies (4.75%). The built-up areas are dominant in the urban core. The agricultural land and palm gardens are concentrated in peri-urban and urban edges, while the main water bodies for the city include the Karun River, which runs through the city. The river buffer includes surrounding agricultural land and green space located within the built-up areas. Bare land is primarily located at the urban edges, especially in the northwest and southeast areas. The reclassified LULC data is the fundamental and spatial basis needed for modeling urban cooling in the cities and for analyzing the distribution of cooling services.

Evapotranspiration (ET0) and Vegetation Coefficient (Kc)

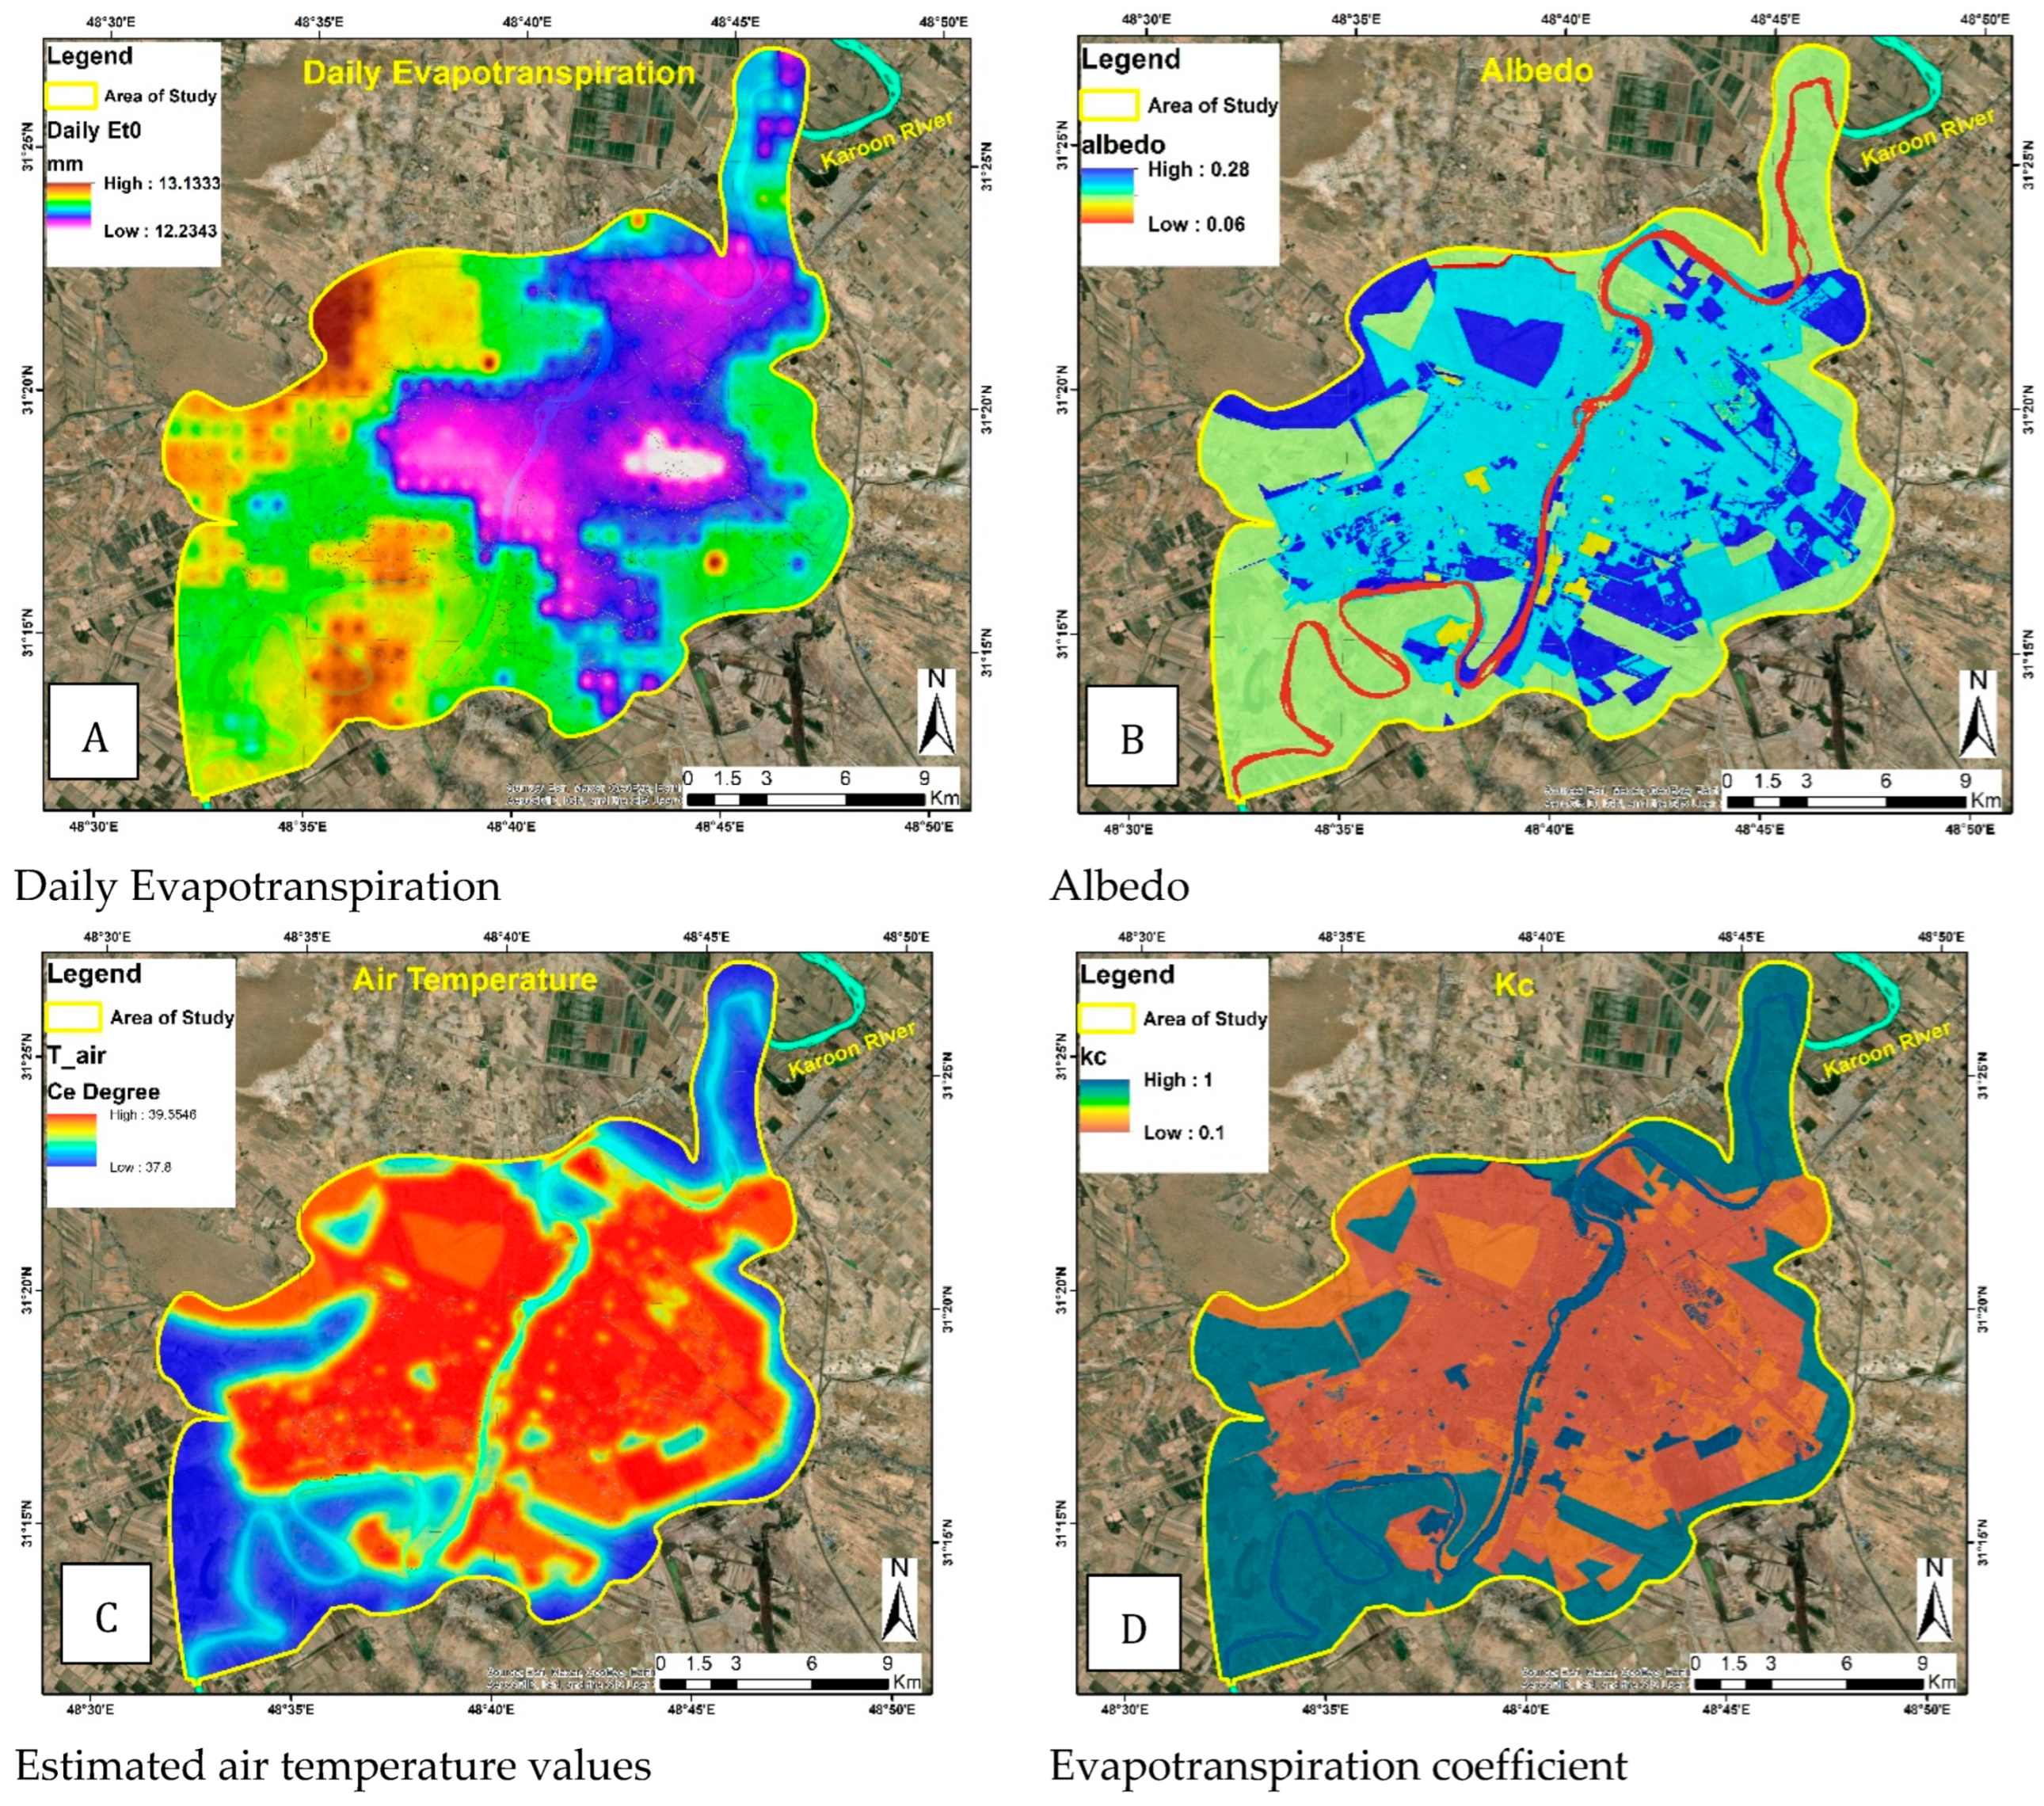
Daily reference of Evapotranspiration (ET0) ranges from 12.23 to 13.13 mm/day (Figure 4A), with a mean = 12.68 mm/day. Lower ET0 values (<12.4 mm/day) cover 62% of the built-up core, correlating with low vegetation cover (r = 0.78, p < 0.01). Higher ET0 (>12.9 mm/day) occurs in irrigated crops and palm gardens, which are located in western/southwestern agricultural zones. The crop coefficient (Kc) varies from 0.1 (built-up) to 1.0 (water bodies) (Figure 4D). The high Kc (0.90–0.95) belong to the Urban green spaces and palm gardens. In contrast, the lowest (Kc = 0.10) is related to the built-up areas. A strong positive correlation exists between Kc > and LST reduction (r = −0.82, p < 0.001). The correlation confirms the high-evapotranspiration of land covers that drive cooling. The spatial morphology is fully reflective of land cover type and surface temperature interactions and adventitious humidity.
The albedo ranges from 0.06 (low/Karun River) to 0.28 (high/bare soils) (Figure 4B). Low-albedo areas coincide with the Karun River. The residential areas with high potential for absorbing solar energy show higher temperatures at the surface. Furthermore, the high-albedo categories are concentrated in open fields, light surfaces, and some specialized agricultural areas. If those areas reflect sunlight, they produce comparatively less thermal energy, potentially reducing spatial heat accumulation. About 18% of the city (mainly bare land) formed the high-albedo surfaces (>0.25) cover but contribute minimally to active cooling, as confirmed by their weak correlation with LST reduction (r = −0.12, p = 0.15). Overall, the core of the urban zone showed a moderate value of albedo, while peripheral areas and some vegetated or bare land showed more reflectance.
The air temperature over Ahvaz on a midsummer day ranges from 37.8 °C to 39.55 °C (Figure 4C). Generally, the hot spots are within intense urban core areas and also built-up areas. These areas are covered with highly impermeable surfaces such as asphalt and concrete. So they absorb heat; therefore, they retain heat, adding to the urban heat island effect. The hottest 10% of the city (39.3–39.55 °C) covers about 28 km2 of high-density built-up areas that include >85% impervious surface cover. Logically enough, the vegetation or water does little to cool within these regions. Cooler temperatures are characteristic of the Karun River and the adjacent green and agricultural lands.
The vegetation coefficient (Kc) specifies the evapotranspiration rate of vegetation types and different land cover components relative to a reference crop under similar water and atmospheric conditions (Figure 4D). Kc values varied from moderately low values of 0.1 to high values of 1.0, with all values concentrated along the Karun River and nearby green or agricultural land cover types. Low Kc distributes over impervious surfaces and little vegetation with low evapotranspiration rates. This spatial pattern of Kc values is influenced by land use and vegetation type, and is an important contribution to water use efficiency and cooling potential. For these reasons, these spatial results form an important input into the InVEST urban cooling model, as well as climate adaptation planning more broadly in cities like Ahvaz that have hot and dry climates.
The cooling capacity (CC) in Ahvaz ranged from 0.12 to 0.75 (Figure 5A) (Table 5), with a mean of 0.31. The average CC of 0.31 indicates the entire city was mapped with low cooling potential. Only 8.3% of the city (14.2 km2) experiences the high CC (>0.6). This area is concentrated along the Karun River corridor (4.2 km2) and adjacent agricultural zones (10.0 km2). In contrast, 76% of built-up areas have low CC (<0.3), suffer severe cooling deficit.
The low CC values in the city center are due to intensified urban heat island (UHI) effects, which are composed of high building density, impervious surfaces, and limited green cover. The moderate CC values were located in the peri-urban areas, which transitioned neighborhoods with some cooling capacity but very little benefit of cooling by vegetation.
The Green Space Cooling Capacity (GSCC) ranges from 0 to 1. This value indicates the green spaces’ potential to reduce local air temperature and decrease heat absorption (Figure 5B). The area with high GSCC (>0.7) covers 12.1 km2. This area primarily includes palm gardens (1.8 km2) and irrigated agriculture (10.3 km2). The moderate GSCC (0.4–0.6)is related to the urban parks (2.58% of the city area), which contribute only 4.5 km2. It indicates the limited spatial impact of urban parks. The spatial pattern indicates natural coastal corridors and peripheral green areas that function as the primary cooling sources, while inner-city areas maintain a significant cooling deficit; the findings of this study indicate prioritization of urban greening potential.

3.2. Heat Mitigation Index

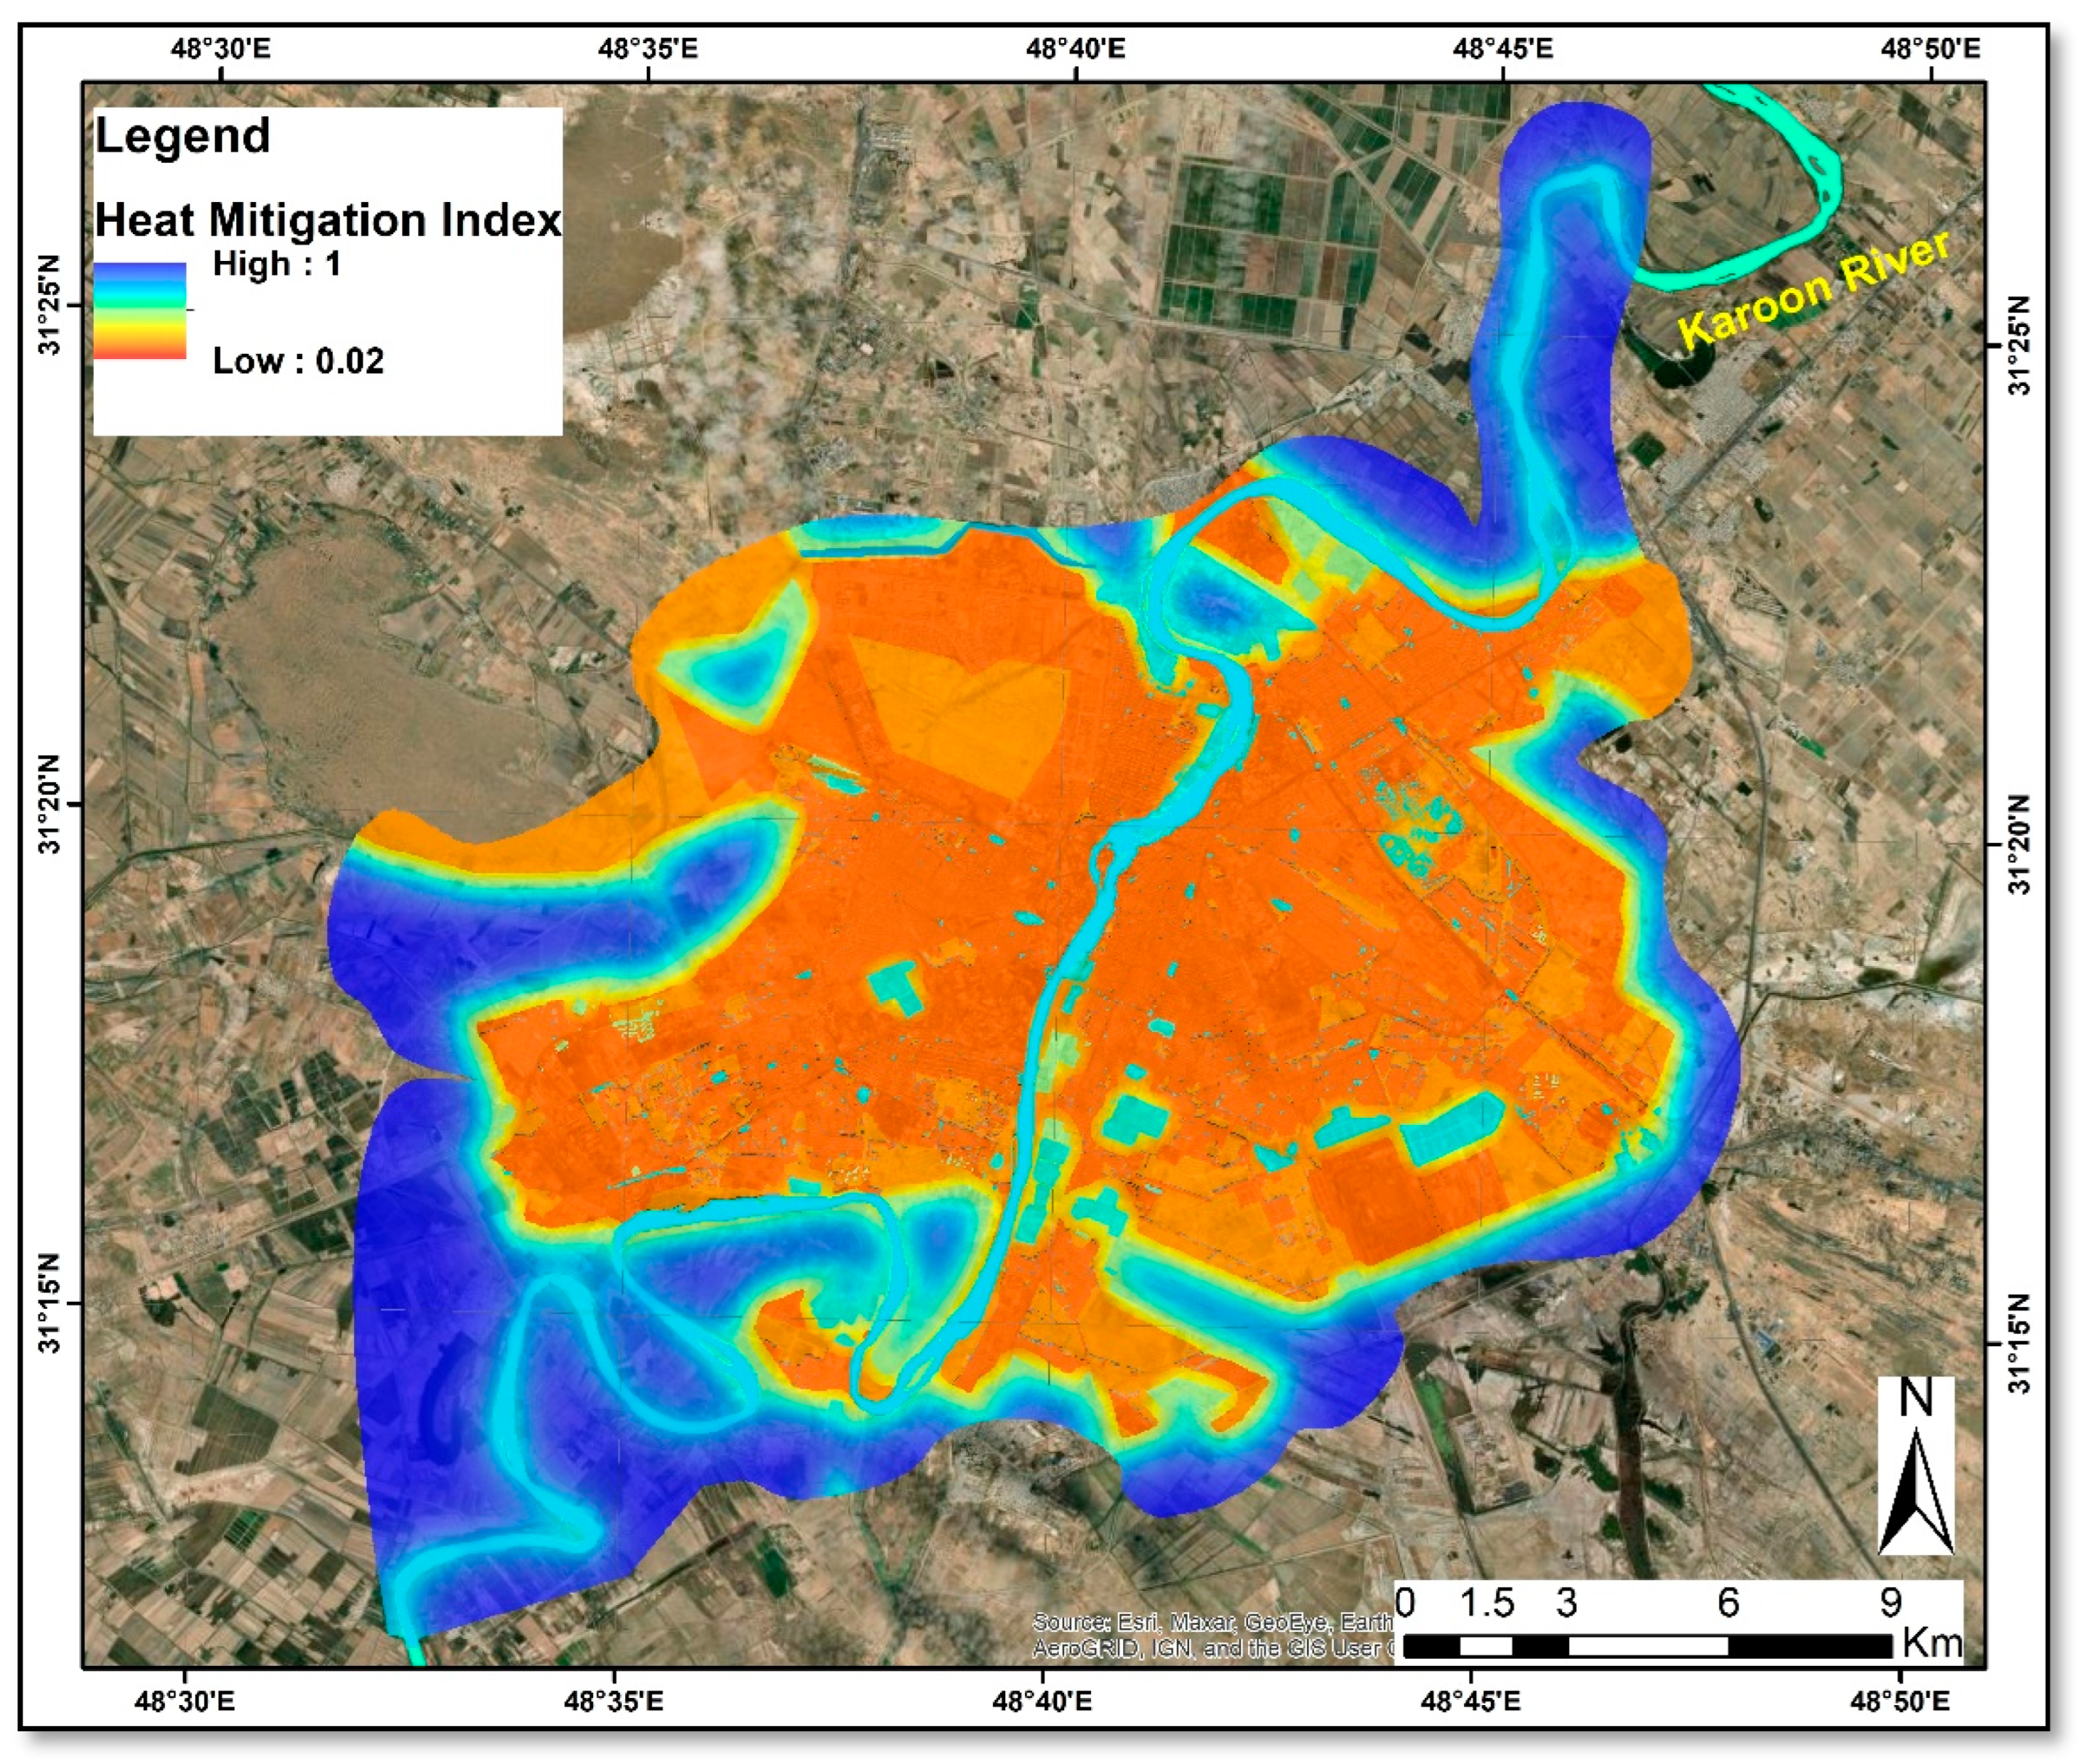
The Heat Mitigation Index (HMI) ranges from 0.02 to 0.99 (mean = 0.45, SD = 0.34) (Figure 6, Table 6). The HMI map summarizes urban heat mitigation potential throughout Ahvaz for a midsummer day. The HMI of Karun River and immediate vegetated buffers is >0.8 (strong mitigation). This area covers just 6.7 km2. Conversely, minimal heat mitigation cover 41% of the city (70.3 km2) with HMI < 0.3. This means HMI strongly correlates with proximity to green-blue infrastructure (r = −0.76, p < 0.001), with cooling effects decaying beyond 300 m from green patches. For the entire city, heat mitigation demonstrated a significant heterogeneity and a high standard deviation (~0.34).

4. Discussion

The primary aim of this research is to conduct an extensive review of cooling ecosystem services in urban areas. In this respect, the current study targets two main goals: (a) understanding the cooling capacity of urban areas; and (b) understanding the role of green spaces in mitigating heat intensity in Ahvaz City. In order to achieve these goals, the urban cooling model of the InVEST 3.13.0 software suite was employed, and a variety of biophysical characteristics, including shade, evapotranspiration, and albedo coefficient, were assessed and analyzed in an integrated manner.
The results indicated a clear spatial heterogeneity in cooling capacity in the region. The Karun River and green and blue infrastructure demonstrated considerable potential. In these areas, dense vegetation cover, proximity to water bodies, and permeable surfaces contribute to cooling through shading and evapotranspiration. Built-up areas and impervious surfaces exhibited low cooling potential, thereby intensifying the uhi phenomenon.
Shading, evapotranspiration, and albedo are three key biophysical drivers of spatial patterns of cooling capacity in Ahvaz. It makes sense that the highest observed cooling capacity (reaching a cooling capacity index (CCI) of 0.75) caused by green infrastructure of the city (up to 0.75) was found in irrigated agricultural productions, palm tree gardens, and urban green space areas. Each land cover type is characterized by high crop coefficients (Kc = 0.9–0.95), high tree canopy cover (shade = 0.75–0.70), and moderate albedo (0.15–0.18).
Thus, green infrastructure patches act locally as “cool oasis” (which raises air temperature) to latent heat (evaporation and transpiration). The combination of these mechanisms in green infrastructure can reduce land surface temperature (LST) by 2–6 °C. The findings of Alavipanah et al. [5] and Wang et al. [25] in similar arid cities confirm the aforementioned results. The magnitude of cooling means the shift of thermal comfort indices from “very hot” (>46 °C) to “hot” (35–40 °C). It will potentially reduce heat stress and related health risks during summer months [2,10].
According to Jim et al. [4], this phenomenon is commonly referred to as “oasis effect”, and it is particularly pronounced within arid environments where the thermal contrast between vegetated and non-vegetated surfaces is extreme. The oasis effect in Ahvaz is illuminated by reference air temperatures in built-up zones that reached 39.5 °C. In contrast, vegetated areas near the Karun River experienced 37.8 °C, which remained cooler. This phenomenon extends beyond just a microclimatic condition, which is functional to assume a critical function in promoting life.
The Evapotranspiration Index (ETI) values fell in the range of 12.23 to 13.13 mm/day. The observed potential evapotranspiration rates in intensively irrigated urban landscapes are comparable to hyper-arid cities like Riyadh, Saudi Arabia [38]. If reliable water sources such as the Karun River were available, the strong evaporative cooling potential could be sustained even in extreme aridity. This means that, while water scarcity is a critical concern in urban greening. Irrigated green infrastructure plays a strategic role in desert cities, providing significant cooling benefits.
The ETI demonstrates that irrigated vegetation continues to provide a high evaporative cooling value, although the area experiences an arid climate. Similarly, the ETI illustrates an elevated evaporative demand even under arid conditions. While water is a limiting factor for actual evapotranspiration, this still demonstrates that irrigated green spaces provide a substantial cooling effect. This should be taken into consideration in developing urban green space plans and for maximizing cooling benefits in urban areas. The ETI graph serves as an important contextualized mapping indicator of vegetation performance and demonstrates the correlation between high transpiration rates and low temperatures. This relationship indicates that vegetation with higher transpiration activity produces a cooling effect, which is evident in the spatial relation of high ETI values corresponding to lower air temperatures (Figure 6). This data corroborates the studies reported by Alavipanah et al. [5] and Wang et al. [25], both of which report that urban vegetation can reduce surface temperatures by 2–6 °C depending on cover density and species composition.
Albedo, as the third component of the cooling index, has a double function. For instance, areas with high albedo surfaces, such as barren lands with an albedo of 0.28, reflect a larger proportion of solar radiation, giving them less heat gain, but they do not play a large role in active cooling compared to areas with vegetation. In comparison, the Karun River has a low albedo of 0.06, but shows a high cooling capacity, which is due to evaporative cooling and advection, not reflectivity. Naturally, in arid climates, evaporative cooling wins out over radiative cooling. Likewise, while the water bodies may be dark, they can change phase and consume energy and act as a thermal buffer, something consistent with Jandaghian and Colombo [7], who feel that the cooling effect of water bodies is not due to albedo, but to latent heat exchange and the modulation of microclimatic currents. A mechanism confirmed by Jandaghian and Colombo [7] that indicates water bodies cool via latent heat change and microclimatic modulation, not albedo.
An analysis of the HMI and UMI indices shows that both the structure of the landscape and the size of green spaces are influential in terms of cooling efficacy. In this study, green spaces greater than 2 hectares demonstrated they could create cooling effects up to 300 m in distance. This result aligns with the studies presented by Jaganmahan et al. [7] and Chibuike et al. [39]. This 300-m radius should be considered as a practical planning buffer. Normally, the residential areas within the cooling radius experience measurable thermal relief and the beyond it remain exposed. The distance indicates that the effective cooling distance exceeds the range of measurable microclimate effects. In Ahvaz City, the share of green space is limited at 3.63% of the total city area (2.58% urban green space and 1.05% palm groves). In addition, the spatial configuration of most of the built-up areas is outside the cooling effect. Thus, they have little benefit from green spaces, and the green patches are acting as isolated heat islands. Together, these results show the important role of large connected green spaces and riparian areas in mitigating urban heat stress. This is especially significant in dry climates where natural cooling capacity is limited.
The combination of the Karun River corridor and the integrated agricultural areas had the largest decrease in temperature (HMI = 1), therefore verifying the importance of connectivity and the continuity of green-blue infrastructure in obtaining the cooling benefits (Figure 4). This aligns with a fundamental principle of landscape ecology: ecosystem services are not just about patch area; structure and function are also critical in the value of ecosystem services [8]. By comparison, connectivity, rather than physical distance, had inefficient cooling benefits for the scattered green spaces in the central part of Ahvaz. As such, these results indicate that we need to plan green networks [2,37], as well as support the concept that designing green spaces as linked complex systems is better than treating individually owned or developed green spaces as single product facilities like isolated parks.
Urban construction density contributes as an underlying influencer of nighttime heat, which is often omitted from urban cooling analysis. The built-up area characteristics of Ahvaz involve high building density (coefficient 0.7) increases thermal mass, delaying heat dissipation after sunset Malekzadeh et al. [24]. This pattern indicates that daytime LST maps alone are insufficient for heat risk assessment. Therefore, nighttime thermal monitoring is essential for public health planning in hot-arid cities.

4.1. Policy and Practice Implications

Although the evidence presented in this study was obtained from a specific case study of an urban area within an arid and extreme heat context, it is applicable to other hot, water-scarce regions across the globe. Three actionable, evidence-based planning strategies could be proposed based on these research findings as follows:
1. The Karun River should be designated as a “Cooling Corridor” through spatial planning. The city’s formal and strategic development plan should include a 30–50 m green-blue buffer along the urban stretch of the Karun River. It could be incorporated into the future Ahvaz development master plan. It must be protected as a climate resilience corridor. Vacant or underutilized lots in this zone should be planted with drought-resistant urban vegetation such as date palm (Phoenix dactylifera) and tamarisk (Tamarix spp.). These changes will combine high evaporative cooling with drought tolerance [40], making green spaces more resilient. The river’s perennial flow could be used to maintain cooling without interfering with potable water supplies [29,30].
2. The thermal equity could be embedded into development regulations. Two mandatory standards, including: (a) ≥30% permeable surface cover, and (b) ≥15% tree canopy coverage at maturity is required to be mandatory in 300 m (the empirically observed cooling radius) of existing green spaces in persistent nighttime or mixed-use projects. This is essential to ensure that thermal benefits extend beyond park boundaries into adjacent neighborhoods. These measures could reduce the current inequity where 92% of residents live outside effective cooling zones.
3. Cool Surfaces Retrofit Program is recommended to launch in high-risk districts to face with nighttime UHI. This includes the areas identified as nighttime UHI (e.g., Districts 2, 4, and 6), such as densely built areas. The municipality should incentivize or mandate the use of high-albedo materials (≥0.4) for roofs and pavements [3,19]. Impose the plot coverage limits (≤60%) to enhance airflow. As a result, surface temperatures will reduce about 3–5 °C, and it will accelerate nighttime cooling.
Critically, all greening initiatives must be developed based on non-potable water strategies. This makes it evident that treated wastewater for irrigation in Ahvaz’s extreme water stress, receives the utmost priority, such as models run in Riyadh and Dubai to dissociate urban cooling from freshwater extraction [29,30].
These strategies could be applied in similar hot and dry climate cities. Each implication is based on local biophysical conditions and aligned with municipal governance structures. Furthermore, by integrating these measures with good governance, Ahvaz could position itself as a pioneer of a water-conscious, heat-resilient model. This model is applicable to other arid cities throughout the Middle East and North Africa.
Ultimately, outcomes of CES modelling provide practitioners with important empirical evidence that could inform urban planning and ultimately guide interventions in a wise urban planning system.

4.2. Limitations

The CESs model proposed by the InVEST model has some shortcomings. First, the InVEST model assumes static or steady-state conditions, and therefore applies static inputs for the Et0 and air temperature. Consequently, it is not capable of addressing diurnal or seasonal variability. Second, the model’s predictive precision is limited by the lack of this type of in situ microclimate validation, for instance, in terms of air temperature, humidity, and wind speed. In the InVEST model results, empirical calibration is required [41,42]. This calibration method produces a more reliable model. Third, and by default, land use is considered homogeneous. Thus, variation within each land use type regarding vegetation structure, species composition, and management is ignored. Finally, the socioeconomic status of heat-exposed individuals was less considered.
To better understand distributive equity in cooling access, future research could also consider population density, vulnerability indicators, and equity in land use. Research could also include merging high-resolution remote sensing with in-situ microclimate monitoring (simply put, putting thermometers in a number of urban locations) to improve the reliability and refine model outputs. Time series thermal dynamic modeling would also allow for increased variation in climate scenarios. Socio-economic data could be used to assess equity of distribution in cooling services, and species-specific evapotranspiration studies could identify the best urban green space species for maximum cooling potential. These could be developed as future research topics.

5. Conclusions

This study evaluated the cooling effectiveness of GBI components in urban environments, specifically examining them in the arid city of Ahvaz (Iran). The summer temperatures often exceed 45 °C, combined with high pollution levels, was the rationale for choosing the Ahvaz case study. The InVEST urban cooling model incorporated high-resolution land use and biophysical parameters along with the associated shading, evapotranspiration, and albedo data. The most significant finding from the investigation is spatial heterogeneity for providing CESs. Specifically, components of GBIs, including river corridor, irrigated agriculture, palm gardens, and urban green spaces, have cooling rates up to 0.75, with high evapotranspiration (12.23–13.13 mm/day). Additionally, integrated and connected GBIs (such as the Karun River) provided the most cooling effect in terms of urban heat mitigation.
The research demonstrated that green spaces have a significant impact on cooling ecosystem services. Green spaces can refer to irrigated and rain-fed agricultural areas, gardens (palms, etc.), and urban green spaces, which provide a cooling potential of up to 0.75 with high evapotranspiration rates (12.23–13.13 mm/day). Continuous green spaces, like the corridor of the Karun River and inter-connected vegetation areas, offer the highest cooling potential. In comparison, dense urban residential areas, characterized by dense impervious surfaces and high building density, not only have limited cooling, but also increase urban heat island effects. Green spaces account for only 3.63% of the area. Major built-up areas, situated outside of green spaces, have a significant cooling effect. The study presents three overarching themes: (a) the need for increasing large-scale green infrastructure, (b) continuity, and (c) coastal corridors as an important factor in moderating temperature in dry regions. Some useful recommendations for dry cities were prioritized to increase the effectiveness of cooling ecosystem services. The central tenets of the recommendations were using climate-adapted vegetation and increasing continuity of green space. Also, the use of passive strategies (i.e., reflective materials and improved design) may also be useful. The findings also revealed potential avenues for future research in dry cities around the world. Main areas of consideration included dynamic temporal modeling, empirical validation of microclimate, and socio-economic factors to improve cooling service assessments and considerations of equitable urban climate resilience, and areas to pursue in future research.

Author Contributions

Conceptualization, J.B. and H.D.; methodology, J.B. and H.D.; software, J.B. and A.H.; validation, J.B. and H.D.; formal analysis, J.B. and H.D.; investigation, A.H.; data curation, J.B. and A.H.; writing—original draft preparation, J.B., H.D. and A.H.; writing—review and editing, J.B. and H.D.; visualization, J.B.; supervision, H.D. All authors have read and agreed to the published version of the manuscript.

Funding

This research received no external funding.

Data Availability Statement

Data supporting the findings of this study are available from the corresponding author upon reasonable request.

Acknowledgments

The authors would like to thank the Iran Meteorological Organization, which has supplied the climatic data that has been relied on in this study. We also extend our warmest regards to the cooperation as well as the great insights of the local community, whose feedback was very valuable in this research.

Conflicts of Interest

The authors declare no conflicts of interest.

Abbreviations

The following abbreviations are used in this manuscript:
CESsCooling Ecosystem Services
GBIGreen and Blue Infrastructures
CCCooling Capacity
ETIEvapotranspiration Index
HMIHeat Mitigation Index
GSCCThe Green Space Cooling Capacity
LCTLand Surface Temperature
LULand Use
LULCLand Use/Land Cover
UHIUrban Heat Island

References

  1. Costanza, R.; D’Arge, R.; De Groot, R.; Farber, S.; Grasso, M.; Hannon, B.; Limburg, K.; Naeem, S.; O’Neill, R.V.; Paruelo, J.; et al. The value of the world’s ecosystem services and natural capital. Nature 1997, 387, 253–260. [Google Scholar] [CrossRef]
  2. Hamel, P.; Bosch, M.; Tardieu, L.; Lemonsu, A.; De Munck, C.; Nootenboom, C.; Viguié, V.; Lonsdorf, E.; Douglass, J.A.; Sharp, R.P. Calibrating and validating the Integrated Valuation of Ecosystem Services and Tradeoffs (InVEST) urban cooling model: Case studies in France and the United States. Geosci. Model Dev. 2024, 17, 4755–4771. [Google Scholar] [CrossRef]
  3. Park, C.Y.; Park, Y.S.; Kim, H.G.; Yun, S.H.; Kim, C.K. Quantifying and mapping cooling services of multiple ecosystems. Sustain. Cities Soc. 2021, 73, 103123. [Google Scholar] [CrossRef]
  4. Jim, C.Y.; Chen, W.Y. Ecosystem services and valuation of urban forests in China. Cities 2009, 26, 187–194. [Google Scholar] [CrossRef]
  5. Alavipanah, S.; Wegmann, M.; Qureshi, S.; Weng, Q.; Koellner, T. The role of vegetation in mitigating urban land surface temperatures: A case study of Munich, Germany during the warm season. Sustainability 2015, 7, 4689–4706. [Google Scholar] [CrossRef]
  6. Duncan, J.; Boruff, B.; Saunders, A.; Sun, Q.; Hurley, J.; Amati, M. Turning down the heat: An enhanced understanding of the relationship between urban vegetation and surface temperature at the city scale. Sci. Total Environ. 2019, 656, 118–128. [Google Scholar] [CrossRef] [PubMed]
  7. Jandaghian, Z.; Colombo, A. The Role of Water Bodies in Climate Regulation: Insights from Recent Studies on Urban Heat Island Mitigation. Buildings 2024, 14, 2945. [Google Scholar] [CrossRef]
  8. Liu, Q. Interlinking climate change with water-energy-food nexus and related ecosystem processes in California case studies. Ecol. Process. 2016, 5, 14. [Google Scholar] [CrossRef]
  9. Zhou, Y.; Feng, Z.; Xu, K.; Wu, K.; Gao, H.; Liu, P. Ecosystem Service Flow Perspective of Urban Green Land: Spatial Simulation and Driving Factors of Cooling Service Flow. Land 2023, 12, 1527. [Google Scholar] [CrossRef]
  10. Mukhopadhyay, A.; Hati, J.P.; Acharyya, R.; Pal, I.; Tuladhar, N.; Habel, M. Global trends in using the InVEST model suite and related research: A systematic review. Ecohydrol. Hydrobiol. 2025, 25, 389–405. [Google Scholar] [CrossRef]
  11. Ramsay, E.E.; Wang, Y.; Masoudi, M.; Chai, M.W.; Yin, T.; Hamel, P. Assessing a decision-support tool to estimate the cooling potential and economic savings from urban vegetation in Singapore. Sustain. Cities Soc. 2025, 125, 106337. [Google Scholar] [CrossRef]
  12. Makvandi, M.; Li, W.; Ou, X.; Chai, H.; Khodabakhshi, Z.; Fu, J.; Yuan, P.F.; Horimbere, E.d.l.J. Urban heat mitigation towards climate change adaptation: An eco-sustainable design strategy to improve environmental performance under rapid urbanization. Atmosphere 2023, 14, 638. [Google Scholar] [CrossRef]
  13. Masson, V.; Marchadier, C.; Adolphe, L.; Aguejdad, R.; Avner, P.; Bonhomme, M.; Bretagne, G.; Briottet, X.; Bueno, B.; De Munck, C. Adapting cities to climate change: A systemic modelling approach. Urban Clim. 2014, 10, 407–429. [Google Scholar] [CrossRef]
  14. Cheshmehzangi, A.; He, B.-J.; Sharifi, A.; Matzarakis, A. Climate change, cities, and the importance of cooling strategies, practices, and policies. In Climate Change and Cooling Cities; Cheshmehzangi, A., Sharifi, A., Matzarakis, A., Eds.; Springer: Singapore, 2023; pp. 2–19. [Google Scholar]
  15. Reis, C.; Lopes, A. Evaluating the cooling potential of urban green spaces to tackle urban climate change in Lisbon. Sustainability 2019, 11, 2480. [Google Scholar] [CrossRef]
  16. Han, Y.; Lee, S.; Jun, C. Analysis of Carbon Storage by Land Cover Changes Based on FLUS Model. J. Korean Soc. Surv. Geod. Photogramm. Cartogr. 2025, 43, 233–243. [Google Scholar] [CrossRef]
  17. Kadaverugu, R.; Gurav, C.; Rai, A.; Sharma, A.; Matli, C.; Biniwale, R. Quantification of heat mitigation by urban green spaces using InVEST model—A scenario analysis of Nagpur City, India. Arab. J. Geosci. 2021, 14, 82. [Google Scholar] [CrossRef]
  18. Detommaso, M.; Gagliano, A.; Marletta, L.; Nocera, F. Sustainable urban greening and cooling strategies for thermal comfort at pedestrian level. Sustainability 2021, 13, 3138. [Google Scholar] [CrossRef]
  19. Zou, M.; Zhang, H. Cooling strategies for thermal comfort in cities: A review of key methods in landscape design. Environ. Sci. Pollut. Res. 2021, 28, 62640–62650. [Google Scholar] [CrossRef]
  20. Dobryakova, V.A.; Sulkarnaeva, L.D. Modelling of ecosystem services «cooling effect» supply in the City of Tyumen. InterCarto InterGIS 2021, 27, 196–209. [Google Scholar] [CrossRef]
  21. Ronchi, S.; Salata, S.; Arcidiacono, A. Which urban design parameters provide climate-proof cities? An application of the Urban Cooling InVEST Model in the city of Milan comparing historical planning morphologies. Sustain. Cities Soc. 2020, 63, 102459. [Google Scholar] [CrossRef]
  22. Battista, G.; de Lieto Vollaro, R.; Zinzi, M. Assessment of urban overheating mitigation strategies in a square in Rome, Italy. Sol. Energy 2019, 180, 608–621. [Google Scholar] [CrossRef]
  23. Pohanková, T.; Pechanec, V. Assessing the Cooling Potential of Vegetation in a Central European Rural Landscape: A Local Study. Land 2024, 13, 1685. [Google Scholar] [CrossRef]
  24. Malekzadeh, S.; Jafari, H.; Nazari, R.; Blaschke, T.; Hof, A.; Karimi, M. Modeling the cooling effect of urban green infrastructures with an ecosystem services approach (case study: Tehran metropolis). Int. J. Hum. Cap. Urban Manag. 2025, 10, 199–214. [Google Scholar]
  25. Wang, C.; Wang, Z.-H.; Wang, C.; Myint, S.W. Environmental cooling provided by urban trees under extreme heat and cold waves in US cities. Remote Sens. Environ. 2019, 227, 28–43. [Google Scholar] [CrossRef]
  26. Zheng, X.; Kong, F.; Yin, H.; Middel, A.; Yang, S.; Liu, H.; Huang, J. Green roof cooling and carbon mitigation benefits in a subtropical city. Urban For. Urban Greening. 2023, 86, 128018. [Google Scholar] [CrossRef]
  27. Brandt, L.; Lewis, A.D.; Fahey, R.; Scott, L.; Darling, L. Swanston, C. A framework for adapting urban forests to climate change. Environ. Sci. Policy 2016, 66, 393–402. [Google Scholar] [CrossRef]
  28. Moss, J.L.; Doick, K.J.; Smith, S.; Shahrestani, M. Influence of evaporative cooling by urban forests on cooling demand in cities. Urban For. Urban Green. 2019, 37, 65–73. [Google Scholar] [CrossRef]
  29. Helletsgruber, C.; Gillner, S.; Gulyás, Á.; Junker, R.R.; Tanács, E.; Hof, A. Identifying tree traits for cooling urban heat islands—A cross-city empirical analysis. Forests 2020, 11, 1064. [Google Scholar] [CrossRef]
  30. Rötzer, T.; Moser-Reischl, A.; Rahman, M.; Hartmann, C.; Paeth, H.; Pauleit, S.; Pretzsch, H. Urban tree growth and ecosystem services under extreme drought. Agric. For. Meteorol. 2021, 308, 108532. [Google Scholar] [CrossRef]
  31. Zardo, L.; Geneletti, D.; Pérez-Soba, M.; Van Eupen, M. Estimating the cooling capacity of green infrastructures to support urban planning. Ecosyst. Serv. 2017, 26, 225–235. [Google Scholar] [CrossRef]
  32. Zittis, G.; Almazroui, M.; Alpert, P.; Ciais, P.; Cramer, W.; Dahdal, Y.; Fnais, M.; Francis, D.; Hadjinicolaou, P.; Howari, F.; et al. Climate change and weather extremes in the Eastern Mediterranean and Middle East. Rev. Geophys. 2022, 60, e2021RG000762. [Google Scholar] [CrossRef]
  33. Ahvaz Municipality. Urban Land Use Data for Ahvaz City; Deputy of Urbanism & Architecture: Ahvaz, Iran, 2025. [Google Scholar]
  34. Khuzestan Meteorology Organization. Climatological Data of Ahvaz; Khuzestan Meteorology Organization: Ahvaz, Iran, 2025. [Google Scholar]
  35. Sharp, R.; Tallis, H.T.; Ricketts, T.; Guerry, A.D.; Wood, S.A.; Chaplin-Kramer, R.; Nelson, E.; Ennaanay, D.; Wolny, S.; Olwero, N.; et al. InVEST 3.8.0 User’s Guide. The Natural Capital Project, Stanford University, University of Minnesota, The Nature Conservancy, and World Wildlife Fund. 2020. Available online: https://storage.googleapis.com/releases.naturalcapitalproject.org/invest-userguide/latest/index.html (accessed on 2 July 2025).
  36. Kunapo, J.; Fletcher, T.D.; Ladson, A.R.; Cunningham, L.; Burns, M.J. A spatially explicit framework for climate adaptation. Urban Water J. 2018, 15, 159–166. [Google Scholar] [CrossRef]
  37. Phelan, P.E.; Kaloush, K.; Miner, M.; Golden, J.; Phelan, B.; Silva, H.; Taylor, R.A. Urban Heat Island: Mechanisms, Implications, and Possible Remedies. Annu. Rev. Environ. Resour. 2015, 40, 285–307. [Google Scholar] [CrossRef]
  38. Bahrawi, J.A. Spatial distribution maps of evapotranspiration rate over Saudi Arabia. J. King Abdulaziz Univ. 2014, 25, 69–82. [Google Scholar] [CrossRef]
  39. Chibuike, E.M.; Ibukun, A.O.; Abbas, A.; Kunda, J.J. Assessment of green parks cooling effect on Abuja urban microclimate using geospatial techniques. Remote Sens. Appl. Soc. Environ. 2018, 11, 11–21. [Google Scholar] [CrossRef]
  40. Darabi, H.; Moarrab, Y.; Balist, J.; Naroei, B. Resilient plant species selection for urban green infrastructure development in arid regions: A case of Qom, Iran. Urban Ecosyst. 2023, 26, 1753–1768. [Google Scholar] [CrossRef]
  41. Zawadzka, J.E.; Harris, J.A.; Corstanje, R. Assessment of heat mitigation capacity of urban greenspaces with the use of InVEST urban cooling model, verified with day-time land surface temperature data. Landsc. Urban Plan. 2021, 214, 104163. [Google Scholar] [CrossRef]
  42. Su, Y.; Wu, J.; Zhang, C.; Wu, X.; Li, Q.; Liu, L.; Bi, C.; Zhang, H.; Lafortezza, R.; Chen, X. Estimating the cooling effect magnitude of urban vegetation in different climate zones using multi-source remote sensing. Urban Clim. 2022, 43, 101155. [Google Scholar] [CrossRef]
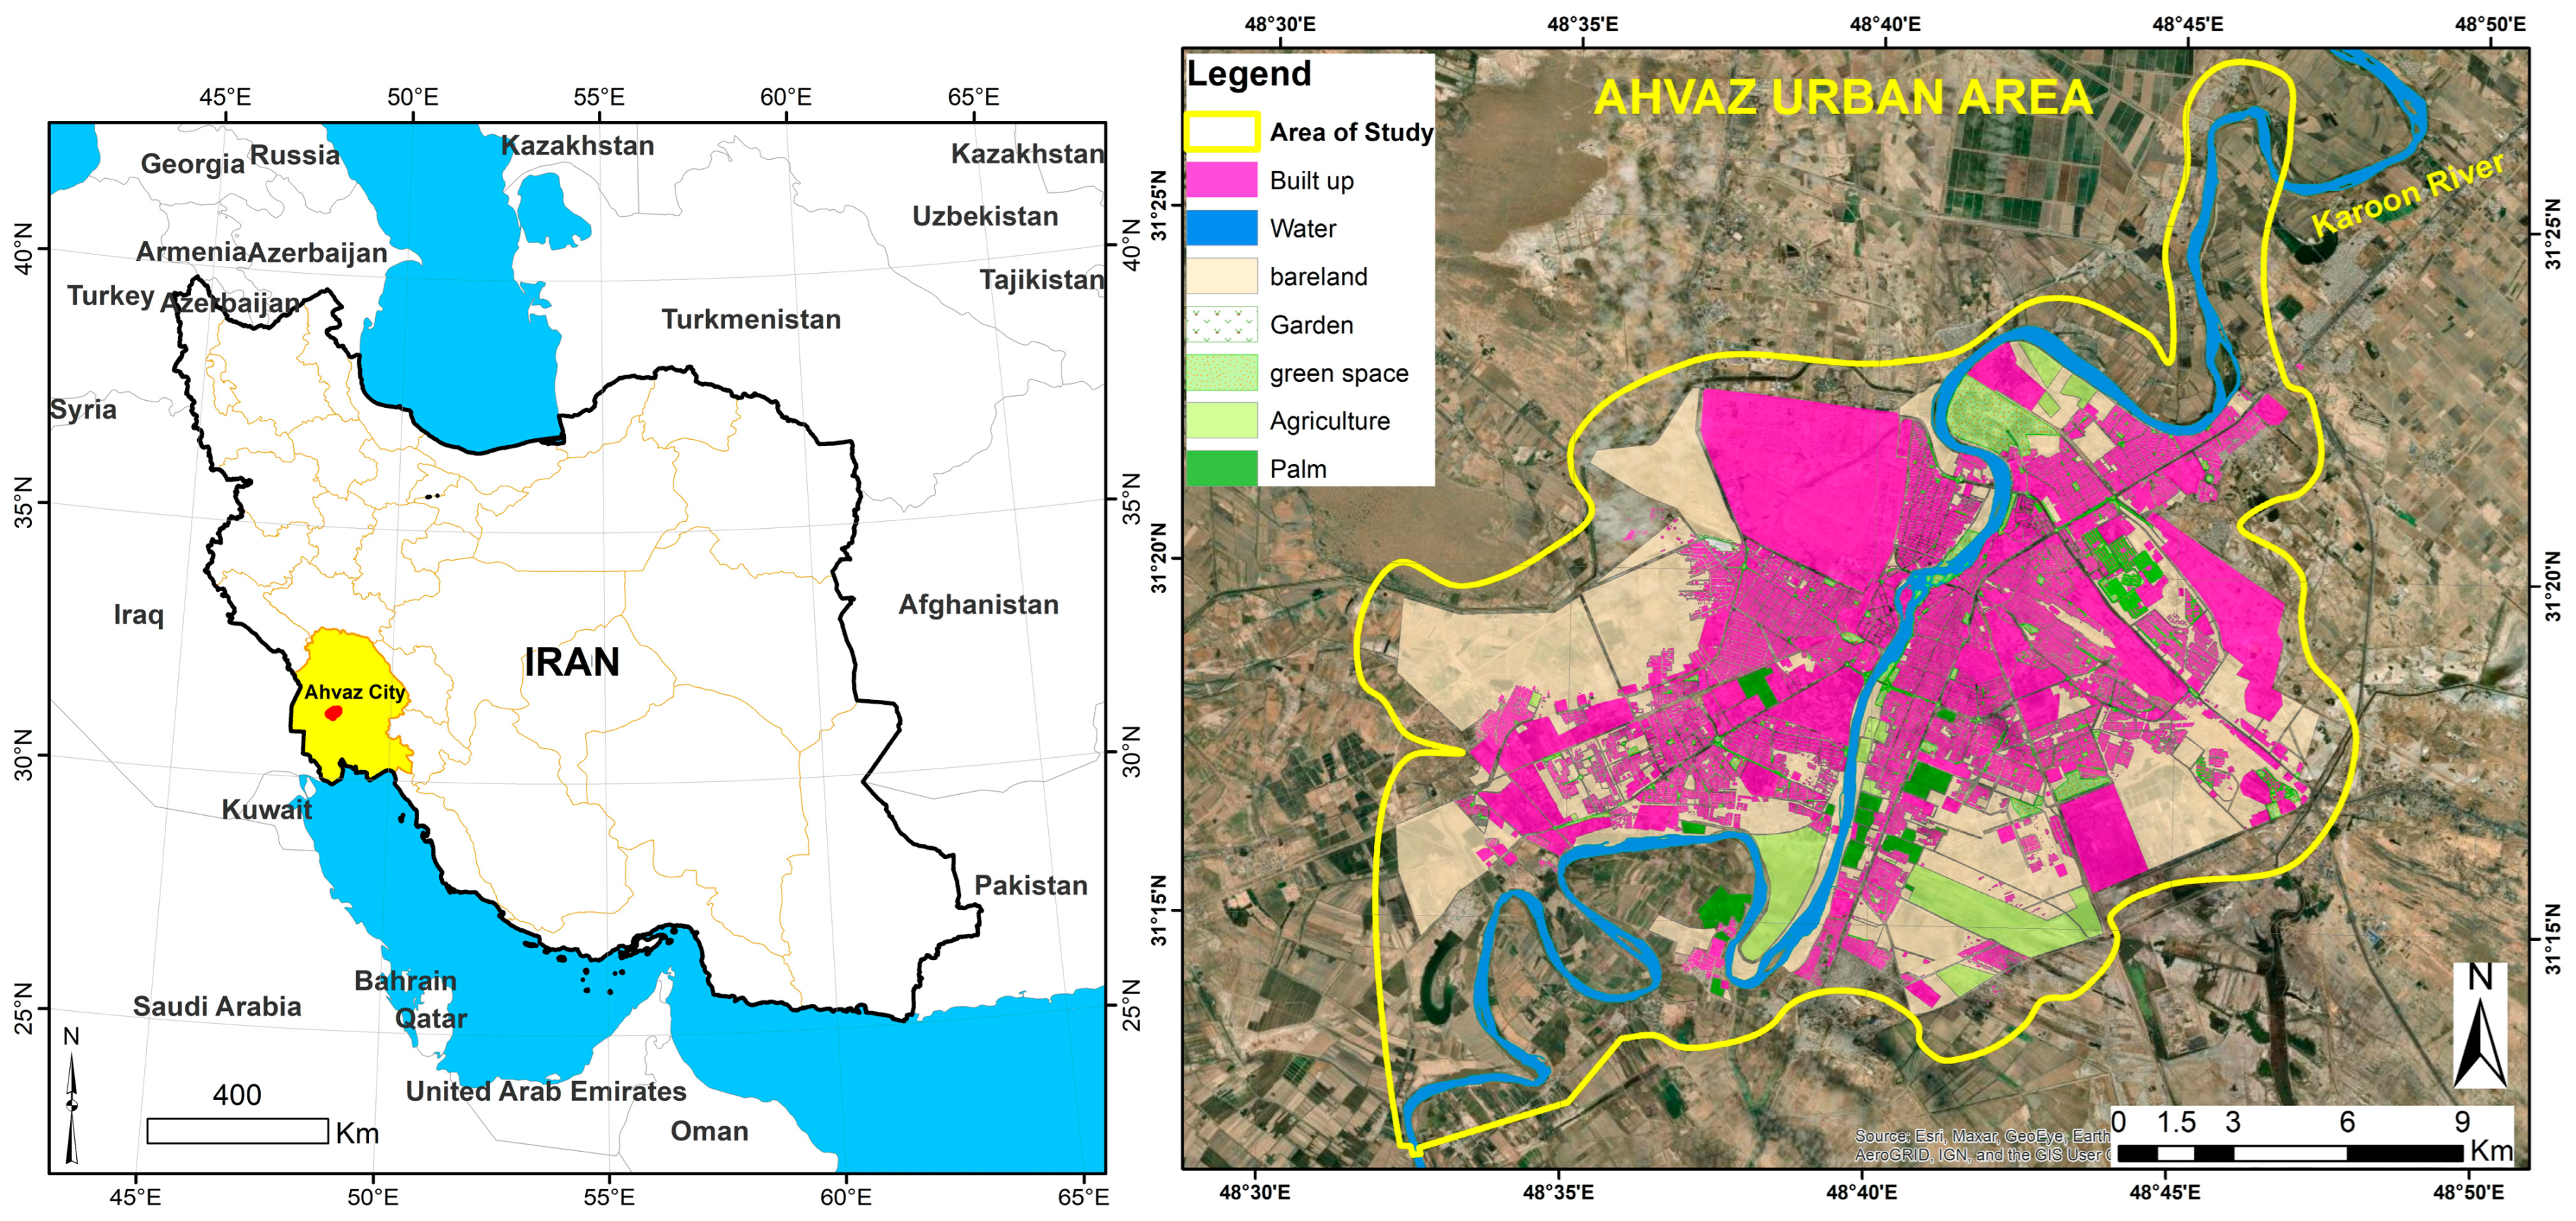
Figure 1. Area of study.
Buildings 15 03975 g001
Figure 2. Flowchart of the research methodology.
Buildings 15 03975 g002
Figure 3. Land use map of Ahvaz City and its countryside.
Buildings 15 03975 g003
Figure 4. (A) Daily evapotranspiration; (B) albedo; (C) estimated air temperature values; (D) evapotranspiration coefficient.
Buildings 15 03975 g004
Figure 5. (A) Cooling capacity of Ahvaz City; (B) cooling capacity of green spaces.
Buildings 15 03975 g005
Figure 6. Heat Mitigation Index (HMI) of Ahvaz.
Buildings 15 03975 g006
Table 1. Input data characteristics for the InVEST urban cooling model.
Input VariableFormatTypeUnit/RangeTemporal ScopeSpatial ResolutionSource/Notes
Land Use/Land CoverRaster (GeoTIFF)Spatial mapInteger LULC codesStatic30 mAhvaz Municipality [33]
Reference Evapotranspiration (ET0)mm/day DailyIran Meteorological Organization [34]
Area of Interest (AOI)Vector (Shapefile)PolygonN/AStaticUrban districtAhvaz Municipality shapefile [33]
Biophysical ParametersTable (CSV)TabularIncludes: LU code, kc, shade, etc.StaticN/AUser-defined based on LULC codes
Reference Air TemperatureNumeric (°C)Scalar value18–35 °CavgLocalIran Meteorology Organization [34]
UHI Effect1–6 °CDay/night Urban–rural differenceEmpirical studies
Air Blending DistanceNumeric (meters)50–600 mStaticN/ASharp et al. [35]
Maximum Cooling Distance250–450 mStaticN/ASharp et al. [35]
Table 2. Biophysical parameters for land use/land cover classes in Ahvaz.
LucodeLulc_DescShade (0–1)Albedo (0–1)Crop CoefficientBuilding Intensity (0–1)Green Area
(Binary)
1bare land00.280.200
2built-up0.10.220.10.70
3farming (irrigated)0.20.180.901
4palm garden0.70.150.9501
5urban green space0.750.180.9501
6water (Karun)00.06100
Table 3. Climatic parameters used in the InVEST urban cooling model for Ahvaz.
ParameterValueJustification
Reference Air Temperature37.8 °CRural baseline on a representative hot summer day [34]
Urban Heat Island Effect(UHI)2 °CBased on regional microclimate studies in Khuzestan [24]
Air Blending Distance100 mAppropriate for low-rise, dispersed urban form
Maximum Cooling Distance300 mEmpirically observed effective radius for sparse green patches in arid zones
Table 4. Land use/land cover composition in Ahvaz (2025).
Land Use ClassArea (%)
Built-up39.04
Farming (irrigated)35.29
Bare land17.26
Water4.75
Urban green space2.58
Palm garden1.05
Total100.00
Table 5. Cooling Capacity (CC) statistics for Ahvaz (dimensionless index, range: 0–1).
StatisticValue
Minimum0.12
Mean0.31
Maximum0.75
Standard Deviation0.21
Table 6. Heat Mitigation Index (HMI) statistics for Ahvaz (dimensionless, range: 0–1).
StatisticValue
Minimum0.0207
Mean0.4504
Maximum0.99
Standard Deviation0.3364
Disclaimer/Publisher’s Note: The statements, opinions and data contained in all publications are solely those of the individual author(s) and contributor(s) and not of MDPI and/or the editor(s). MDPI and/or the editor(s) disclaim responsibility for any injury to people or property resulting from any ideas, methods, instructions or products referred to in the content.