Article

Monitoring the Integrity and Vulnerability of Linear Urban Infrastructure in a Reclaimed Coastal City Using SAR Interferometry

1
Department of Architectural Engineering, Chungbuk National University, Cheongju 28644, Republic of Korea
2
Department of Civil Engineering, Gangneung-Wonju National University, Gangneung 25457, Republic of Korea
*
Authors to whom correspondence should be addressed.
These authors contributed equally to this work.
Buildings 2025, 15(21), 3865; https://doi.org/10.3390/buildings15213865
Submission received: 16 September 2025 / Revised: 19 October 2025 / Accepted: 22 October 2025 / Published: 26 October 2025

Abstract

Reclaimed coastal areas are highly susceptible to uneven subsidence caused by the consolidation of soft marine deposits, which can induce differential settlement, structural deterioration, and systemic risks to urban infrastructure. Further, engineering activities, such as construction and loadings, exacerbate subsidence, impacting infrastructure stability. Therefore, monitoring the integrity and vulnerability of linear urban infrastructure after construction on reclaimed land is critical for understanding settlement dynamics, ensuring safe and reliable operation and minimizing cascading hazards. Subsequently, in the present study, to monitor deformation of the linear infrastructure constructed over decades-old reclaimed land in Mokpo city, South Korea (where 70% of urban and port infrastructure is built on reclaimed land), we analyzed 79 Sentinel-1A SLC ascending-orbit datasets (2017–2023) using the Persistent Scatterer Interferometry (PSInSAR) technique to quantify vertical land motion (VLM). Results reveal settlement rates ranging from −12.36 to 4.44 mm/year, with an average of −1.50 mm/year across 1869 persistent scatterers located along major roads and railways. To interpret the underlying causes of this deformation, Casagrande plasticity analysis of subsurface materials revealed that deep marine clays beneath the reclaimed zones have low permeability and high compressibility, leading to slow pore-pressure dissipation and prolonged consolidation under sustained loading. This geotechnical behavior accounts for the persistent and spatially variable subsidence observed through PSInSAR. Spatial pattern analysis using Anselin Local Moran’s I further identified statistically significant clusters and outliers of VLM, delineating critical infrastructure segments where concentrated settlement poses heightened risks to transportation stability. A hyperbolic settlement model was also applied to anticipate nonlinear consolidation trends at vulnerable sites, predicting persistent subsidence through 2030. Proxy-based validation, integrating long-term groundwater variations, lithostratigraphy, effective shear-wave velocity (Vs30), and geomorphological conditions, exhibited the reliability of the InSAR-derived deformation fields. The findings highlight that Mokpo’s decades-old reclamation fills remain geotechnically unstable, highlighting the urgent need for proactive monitoring, targeted soil improvement, structural reinforcement, and integrated InSAR-GNSS monitoring frameworks to ensure the structural integrity of road and railway infrastructure and to support sustainable urban development in reclaimed coastal cities worldwide.

1. Introduction

Reclaimed coastal cities face unique geotechnical challenges due to their foundation on artificial land masses, often constructed over weak marine sediments and organic materials [1]. Urban infrastructure in these environments is particularly vulnerable to differential settlement, soil liquefaction, subsidence, and structural deformation [2]. This differential settlement occurs when different parts of the infrastructure settle at different rates due to variations in the thickness of the soft soil layer, the type of fill material, or inconsistencies in compaction during construction [3,4]. Engineering activities, such as construction and loadings, exacerbate subsidence, impacting infrastructure stability [5]. It can cause a building deformation, roadbed to crack, railway track to deform, pipeline rupture, or seawall deformation, leading to structural integrity issues and safety hazards [1,6]. Subsequently, rapidly sinking coastal cities, such as New Orleans, Jakarta, Ho Chi Minh, Bangkok, and Shenzhen, face challenges that necessitate immediate attention due to their potential impacts on infrastructure [6,7,8,9,10,11,12,13].
The geotechnical behavior of reclaimed soils is primarily controlled by the consolidation characteristics of soft marine clays underlying the fill [14,15,16,17]. Settlement is a time-dependent process, encompassing primary consolidation due to excess pore pressure dissipation under applied loads and secondary compression associated with long-term viscous deformation of the soil skeleton [18,19]. High-plasticity CH-type clays (LL > 50%, PI > 25%) exhibit low permeability and high compressibility, resulting in slow pore-pressure dissipation and prolonged settlement under the weight of reclamation fill and infrastructure [20,21,22,23]. In contrast, shallow reclamation fill or low- to medium-plasticity silty clays (ML-CL) are relatively stiffer and less compressible, contributing primarily to short-term settlement [16,24]. The interplay of these geotechnical processes governs the magnitude, rate, and spatial variability of VLM, emphasizing the need to integrate soil mechanics principles with remote sensing-based deformation monitoring.
South Korea, constrained by its limited landmass and rapidly growing urban population, has relied heavily on large-scale land reclamation to support national development. Reclaimed areas have been systematically developed for diverse purposes, including residential and commercial districts, economic free zones, transportation infrastructure, seaports, and industrial parks. Prominent projects include the Saemangeum Seawall, which at 33 km is one of the longest seawalls globally; large-scale reclamation in Incheon, where reclaimed land accommodates international business hubs, airports, and residential complexes; the Noksan Busan National Industrial Complex, which supports Korea’s manufacturing and logistics industries; and Mokpo, where nearly 70% of the city’s built-up area, including critical transport and port facilities, rests on reclaimed land [2,25,26]. While reclamation has been pivotal for economic growth, it has also introduced long-term geotechnical challenges. These factors contribute to differential settlement, a significant threat to critical infrastructure, including transportation networks such as roadbeds, bridges, and metro lines, disrupting transportation efficiency and posing safety risks. Subsequently, numerous studies have documented significant subsidence in reclaimed coastal areas in South Korea, such as Mokpo [26]; the Noksan National Industrial Complex in Busan [2,25,27], and Incheon [17,28,29,30]. For example, Kim et al. [31] reported continuous subsidence in Mokpo, particularly in Dongmyung, Hadang, and Wonsan, with rates exceeding 4 cm/year due to soft foundation compaction. Similarly, Sengupta et al. [30] applied Sentinel-1A SAR datasets to assess land subsidence in Incheon and identified severe deformation exceeding 20 cm annually in reclaimed zones surrounding the Incheon International Airport, underscoring the risks to aviation infrastructure built on unconsolidated fills. Nur et al. [27] observed subsidence velocities up to 20.98 mm/year at the Noksan National Industrial Complex in Busan, which was constructed over Korea’s deepest soft ground. These findings emphasize the vulnerability of reclaimed land to subsidence and the compounded risk from rising sea levels and extreme weather events [32]. Furthermore, several researchers reported that major metropolitan areas in South Korea have experienced more than 1127 ground subsidence events over the past decade, attributed to factors such as intense summer rainfall, groundwater table fluctuations, aging underground utilities, and insufficient post-construction backfilling [33,34,35]. The formation of sinkholes, subsurface cavities, and potholes near linear infrastructure has significantly increased settlement susceptibility, with risks magnified as cavity diameter grows and the roadbed-to-cavity distance decreases [36,37]. Consequently, accurate and continuous monitoring of linear infrastructure stability and associated vulnerability, specifically in reclaimed coastal environments, is crucial for effective infrastructure management and cascading hazard mitigation.
Conventional ground settlement monitoring techniques, such as leveling surveys and GNSS observations, are limited by their sparse spatial coverage, high operational costs, and labor-intensive implementation [38]. On the other hand, Interferometric Synthetic Aperture Radar (InSAR) provides a spatially extensive and cost-effective solution capable of detecting millimeter-scale ground displacement over large urban and coastal areas. By exploiting long time series of SAR acquisitions, PSInSAR and SBAS methods enable precise tracking of stable ground targets, thereby facilitating the mapping of subsidence patterns, identification of critical deformation zones, and assessment of infrastructure vulnerability [39]. Subsequently, over the past decade, MTInSAR approaches have been widely adopted for infrastructure stability assessments in diverse geological and urban settings. Numerous studies have demonstrated their efficacy in monitoring roads, highways, metro lines, railways (intercity and high-speed), tunnels, and subway corridors, particularly in subsidence-prone regions [38,40,41,42]. For example, Lyu et al. [43] utilized the PSInSAR technique with 55 TerraSAR-X images to monitor 25 highway overpasses in eastern Beijing (2010–2016), identifying a maximum annual deformation rate of −141.3 mm/year with pronounced seasonal variability linked to structural and environmental factors. Zhao et al. [38] analyzed 73 Sentinel-1A images (2018–2021) along the G15 Coastal Highway in Jiangsu Province, China, applying PSInSAR, SBAS, and DSInSAR methods, and reported deformation rates exceeding ±10 mm/year, with both settlement and uplift observed. Similarly, Bai et al. [40] applied Sentinel-1A data and MT-InSAR methods to develop an early warning classification framework to detect and categorize zones of roadbed instability. Zhang et al. [5] investigated metro line subsidence in the Guangdong–Hong Kong–Macao Greater Bay Area, detecting deformation rates from −39.4 to 14.2 mm/year primarily associated with metro construction activities. Orellana et al. [41] integrated long-term SAR interferometry with GIS analytics to evaluate road network deformation in the Rome metropolitan area, achieving millimeter-level precision. Extending to coastal urban environments, Aziz Zanjani et al. [3] used PSInSAR to analyze subsidence along Miami’s barrier islands (2016–2023), identifying localized settlement driven by construction activities and interbedded sand layers in the subsurface geology. Table 1 summarizes recent applications of InSAR to monitor urban infrastructure worldwide, highlighting the breadth of contexts and methodological advancements.
In South Korea, Ramirez et al. [54] applied the PSInSAR to Sentinel-1 data for tunneling-induced ground deformation monitoring, achieving high consistency with field-based displacement measurements. Kim et al. [63] used PSInSAR in the Seoul metropolitan area to evaluate long-term infrastructure stability and its relationship to subsurface geology. Further, several domestic studies (e.g., [2,25,26,30]) highlighted that the urbanization developed on reclaimed land is particularly vulnerable to long-term settlement and infrastructure instability due to anthropogenic drivers like groundwater extraction or rapid construction loading that persist. The comprehensive literature review highlights the effectiveness of InSAR-based methods for detecting differential settlement, characterizing spatio-temporal ground deformation, and quantifying subsidence-related risks to the stability of linear infrastructure. Despite this global recognition, investigations of infrastructure vulnerability in South Korea have primarily relied on in situ testing, borehole instrumentation, or GIS-based risk models [64,65,66,67], with comparatively fewer applications of advanced InSAR time-series techniques [49,54,68,69]. Moreover, earlier work in Mokpo (e.g., [26,31,70,71]) documented extensive subsidence across reclaimed districts such as Dongmyung, Hadang, and Wonsan since the early 1990s, raising concerns about the long-term stability of civil structures. However, it remains uncertain whether these decades-old reclamation fills have since stabilized or whether ongoing settlement continues to compromise infrastructure integrity, such as roadbeds, railways, and underground utilities. Therefore, a systematic PS-InSAR-based monitoring framework is urgently required to ensure the structural integrity and sustainability of urban development for the Mokpo region.
The present study aims to utilize the advanced PSInSAR technique and time-series Sentinel-1 SLC SAR data to analyze ground displacement and assess the integrity of linear infrastructure stability in Mokpo City, a prominent coastal city characterized by extensive land reclamation projects. We applied the PSInSAR technique to process 79 Sentinel-1A SLC images acquired between 2017 and 2023 and quantified high-resolution long-term VLM trends affecting critical urban linear infrastructure. The PSInSAR-derived deformation results were integrated with the geometry of the linear infrastructure (i.e., major roads and railways) and subsequently, clustering analysis was performed using Anselin Local Moran’s I approach to identify potential failure linear infrastructure segments. Additionally, a hyperbolic model was utilized to predict the nonlinear progression of subsidence and forecast future settlement behavior of linear infrastructure constructed on reclaimed land. To further validate and interpret the PSInSAR-derived VLM, the results were correlated with geotechnical and hydrogeological properties, including borehole lithology, geomorphology, groundwater trends, and effective shear-wave velocity (Vs30). This integrated framework provides critical insights into the vulnerability of major roadbeds and railways in reclaimed coastal environments and contributes to developing proactive monitoring strategies and risk-informed mitigation policies for sustainable urban development in South Korea.

2. Study Area

Mokpo, a historic port city situated at the mouth of the Yeongsan River in southwestern Jeollanam-do, South Korea, represents one of the largest reclaimed coastal regions in the country [26,72]. The city covers 51.67 km2 with a population of approximately 210,000, and nearly 70% of its landmass is derived from tidal flats and shallow marine areas through reclamation (Figure 1). This reclamation, initiated during the Japanese colonial period and expanded over the past century, has facilitated large-scale urbanization but also introduced persistent geotechnical challenges [26,70]. Before reclamation, Mokpo was predominantly mountainous; however, modern residential districts and infrastructure corridors have primarily been constructed on soft marine clays and highly compressible estuarine sediments, prone to consolidation-induced subsidence [71]. Figure 1b(i–iii) depicts the land reclamation and phased urban development. Numerous studies have reported frequent infrastructure damage due to rapid settlement, particularly during the 1990s and 2000s when building deformation and road subsidence were widespread in reclaimed areas [26,70]. Consequently, ground settlement in Mokpo directly affects the urban structures by progressively deforming roadbeds, utilities, and housing stock in reclaimed zones where unconsolidated soils continue to compact over time [70,71]. In addition, the city’s low elevation (<5 m MSL in most urbanized areas (Figure 1c)) amplifies vulnerability to inundation hazards during storm surges and high tides, especially under the combined influence of subsidence and sea-level rise [72,73].
Geologically, the city is underlain by unconsolidated marine sediments, rendering it highly susceptible to long-term settlement and differential subsidence [26]. The geomorphology of the region is characterized by extensive tidal flats, interspersed with valleys, upper slopes, open slopes, and ridges (Figure 1d). From a geotechnical perspective, the subsurface geotechnical properties, e.g., effective shear-wave velocity (Vs30) as reported by Kim and Hong [74], indicates that the most of Mapko region exhibits Vs30 < 760 m/sec (Figure 1b), corresponding to NEHRP site classes C, D and E, which characterize soft soil and weathered rock conditions highly susceptible to amplification of ground deformation. Additionally, groundwater fluctuations and tidal cycles impose cyclic loading, alter pore-water pressures, and weaken soil structure, thereby intensifying subsidence risks.
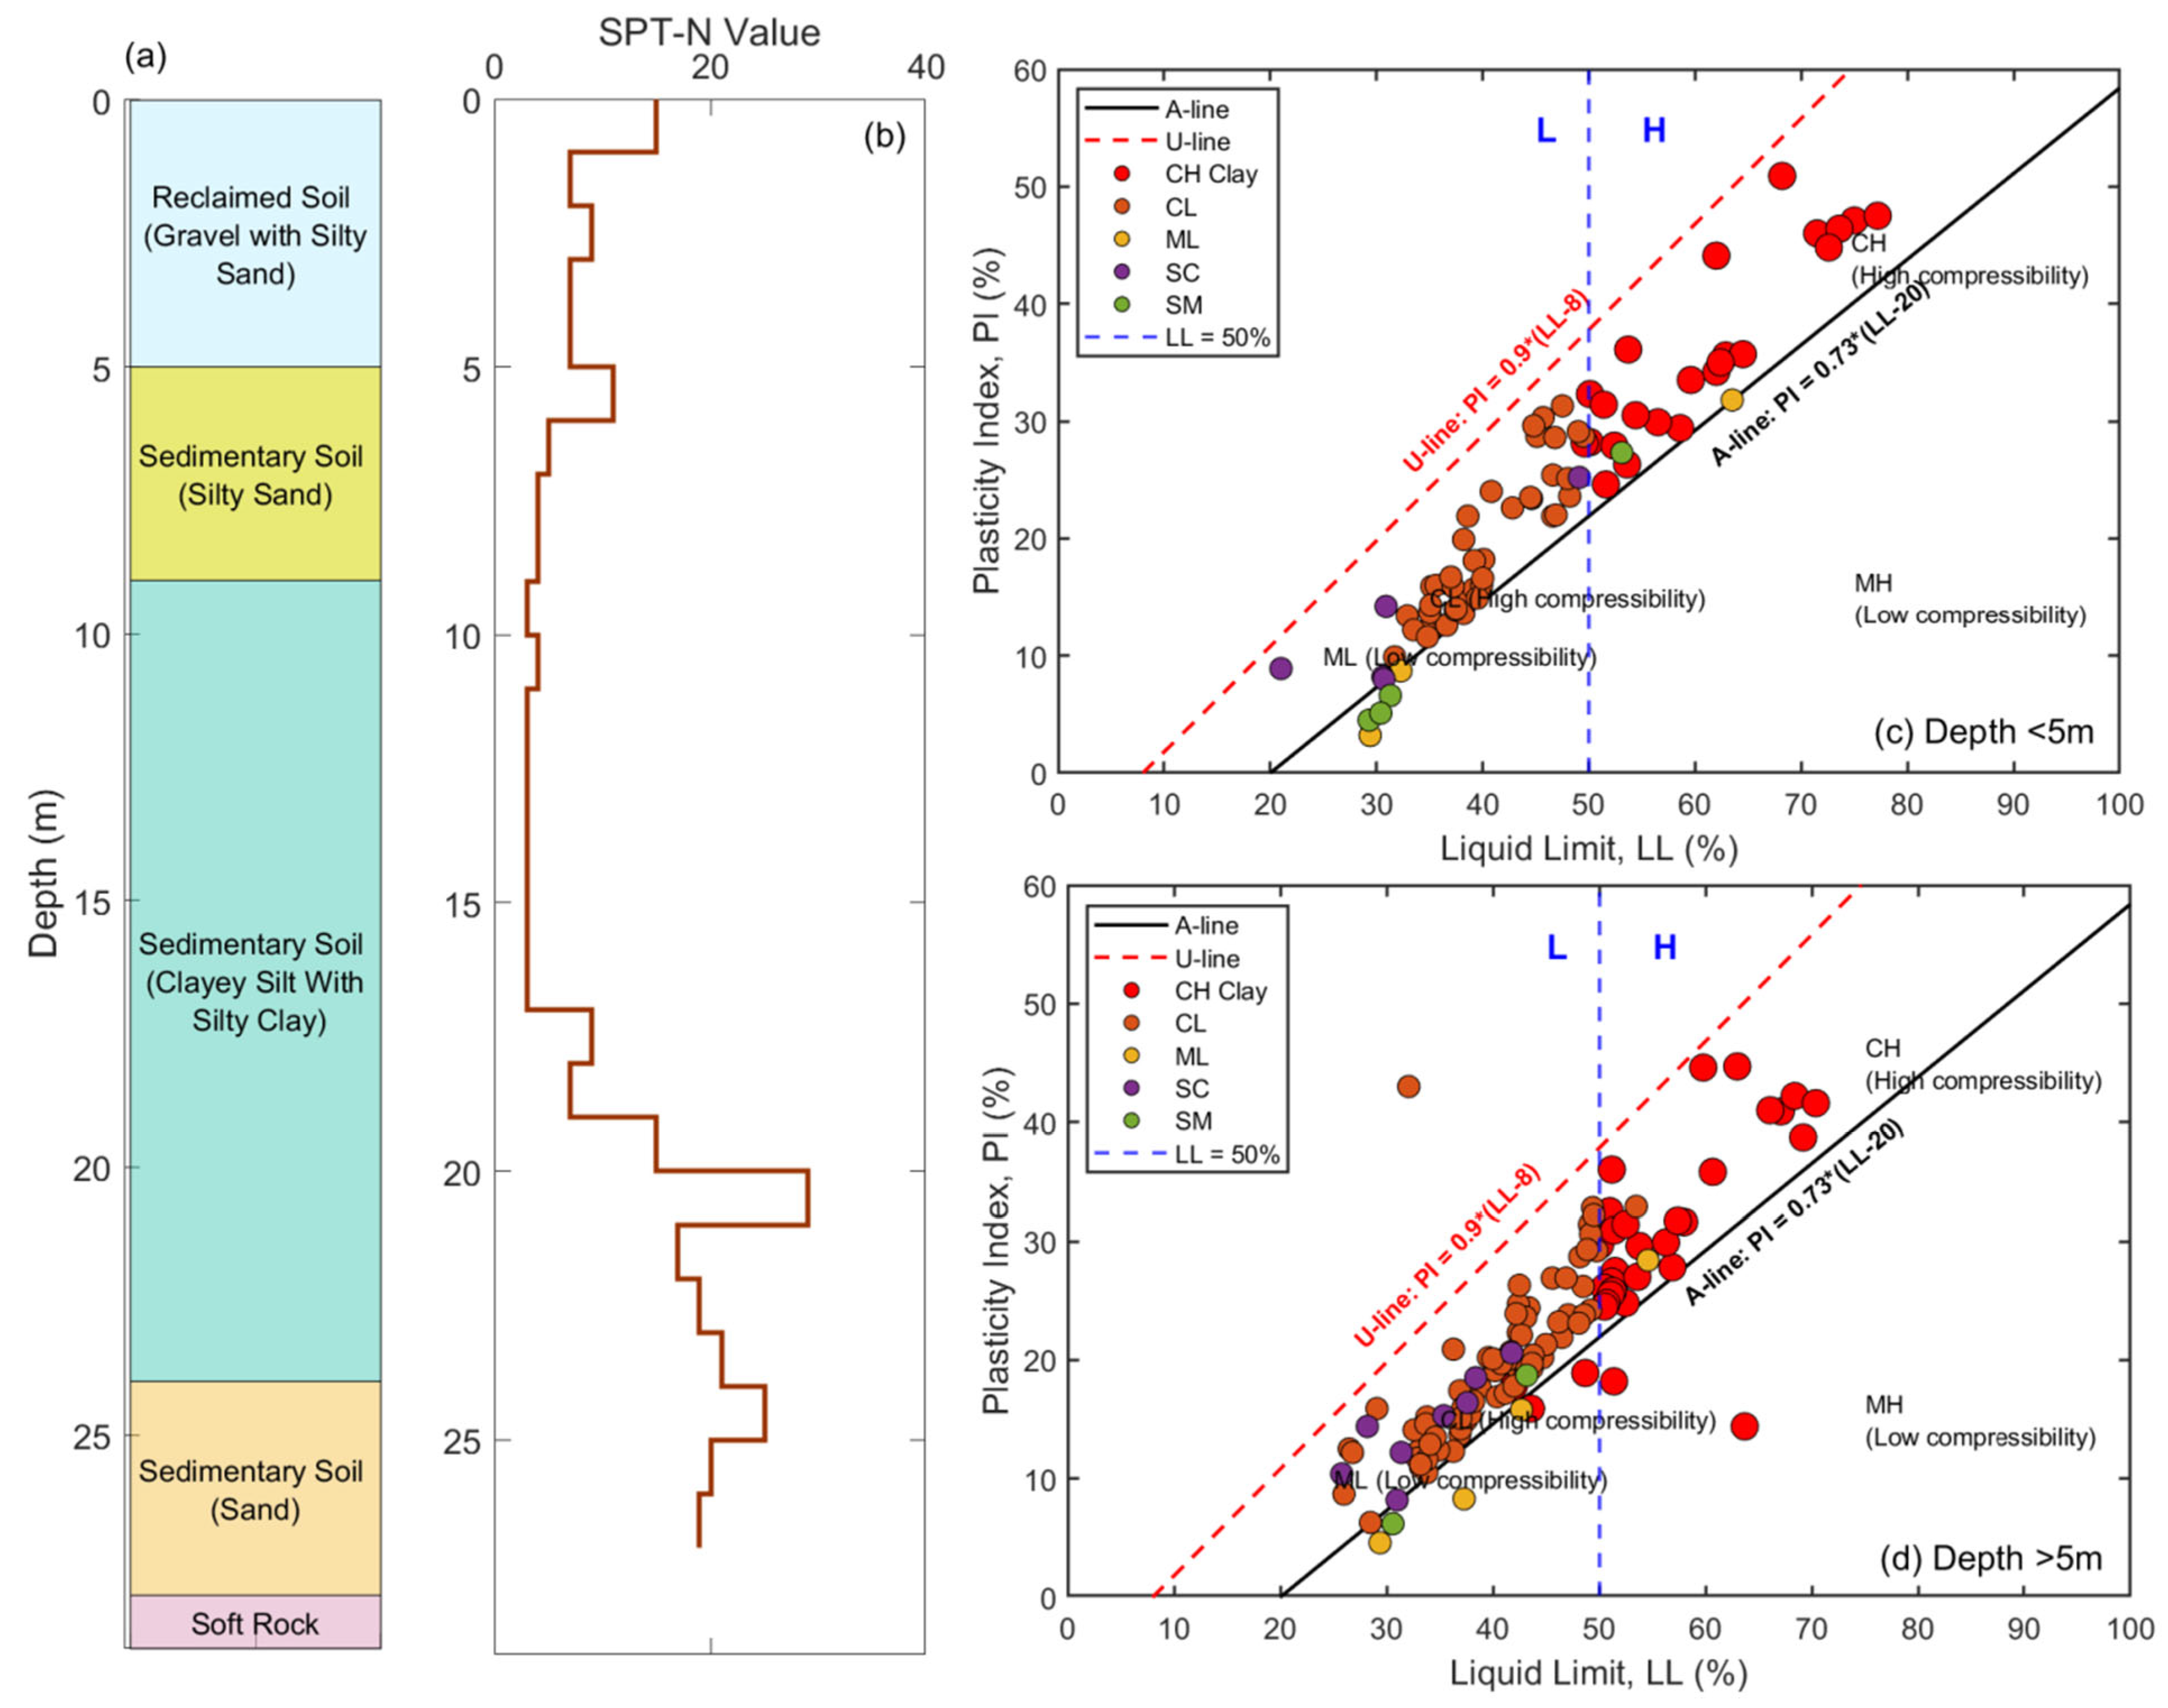
Further, we compiled 120 borehole geotechnical datasets from the reclaimed areas of Mokpo City to characterize subsurface lithology and mechanical behavior. Representative borehole lithology and SPT-N profiles reveal a stratigraphic sequence of reclaimed fill materials (0–5 m) overlying soft, fine-grained marine clays extending to depths of 9–17 m (Figure 2a,b). The lithology and SPT-N profiles illustrate the typical stratigraphy of soft marine clays overlain by reclamation fill, while the plasticity charts classify the soils according to the Unified Soil Classification System (USCS). To investigate depth-dependent variations in soil behavior (i.e., soil’s plasticity and compressibility characteristics), Casagrande plasticity charts were constructed for samples shallower and deeper than 5 m (Figure 2c,d). The liquid limit (LL) and plasticity index (PI) data were used to distinguish between low- and high-plasticity materials using the A-line (PI = 0.73 (LL-20)) and the vertical boundary at LL = 50%, which separates low-compressibility (L) from high-compressibility (H) soils. Deeper samples (>5 m) predominantly exhibit CH-type clays of high plasticity, indicating substantial potential for long-term consolidation and settlement. This geotechnical dataset provides a foundational understanding of the mechanical properties of the reclaimed soil and PSInSAR-derived ongoing VLM.
Numerous studies have documented persistent subsidence across Mokpo’s reclaimed districts, particularly Dongmyung, Hadang, and Wonsan region, since the early 1990s, indicating that soil consolidation continues decades after reclamation [26,70,71]. Table 2 presents documented sinkhole occurrences in Mokpo city compiled from the ScienceSay sinkhole database (https://sciencesay.shinyapps.io/sinkhole/, accessed on 28 September 2025), and various news reports, highlighting direct on-ground impacts of subsidence. The major sinkholes identified in the Mokpo region are also depicted in Figure 1b. Most of these sinkholes are associated with aging sewer infrastructure and inadequately compacted reclamation fill, highlighting the tangible consequences of ongoing ground deformation. Such ground deformation often results in differential settlement affecting linear urban infrastructure, leading to pavement cracking and distortion, and damage to buried utilities. This raises significant concerns regarding urban infrastructure stability, particularly in reclaimed areas where soil composition and foundation conditions deviate substantially from natural ground. Further, geologically and geotechnically, Mokpo represents a high-risk subsurface environment, underscoring the necessity of integrated monitoring frameworks to accurately characterize settlement patterns and safeguard transportation networks and utilities constructed on reclaimed coastal terrain.

3. Data and Methods

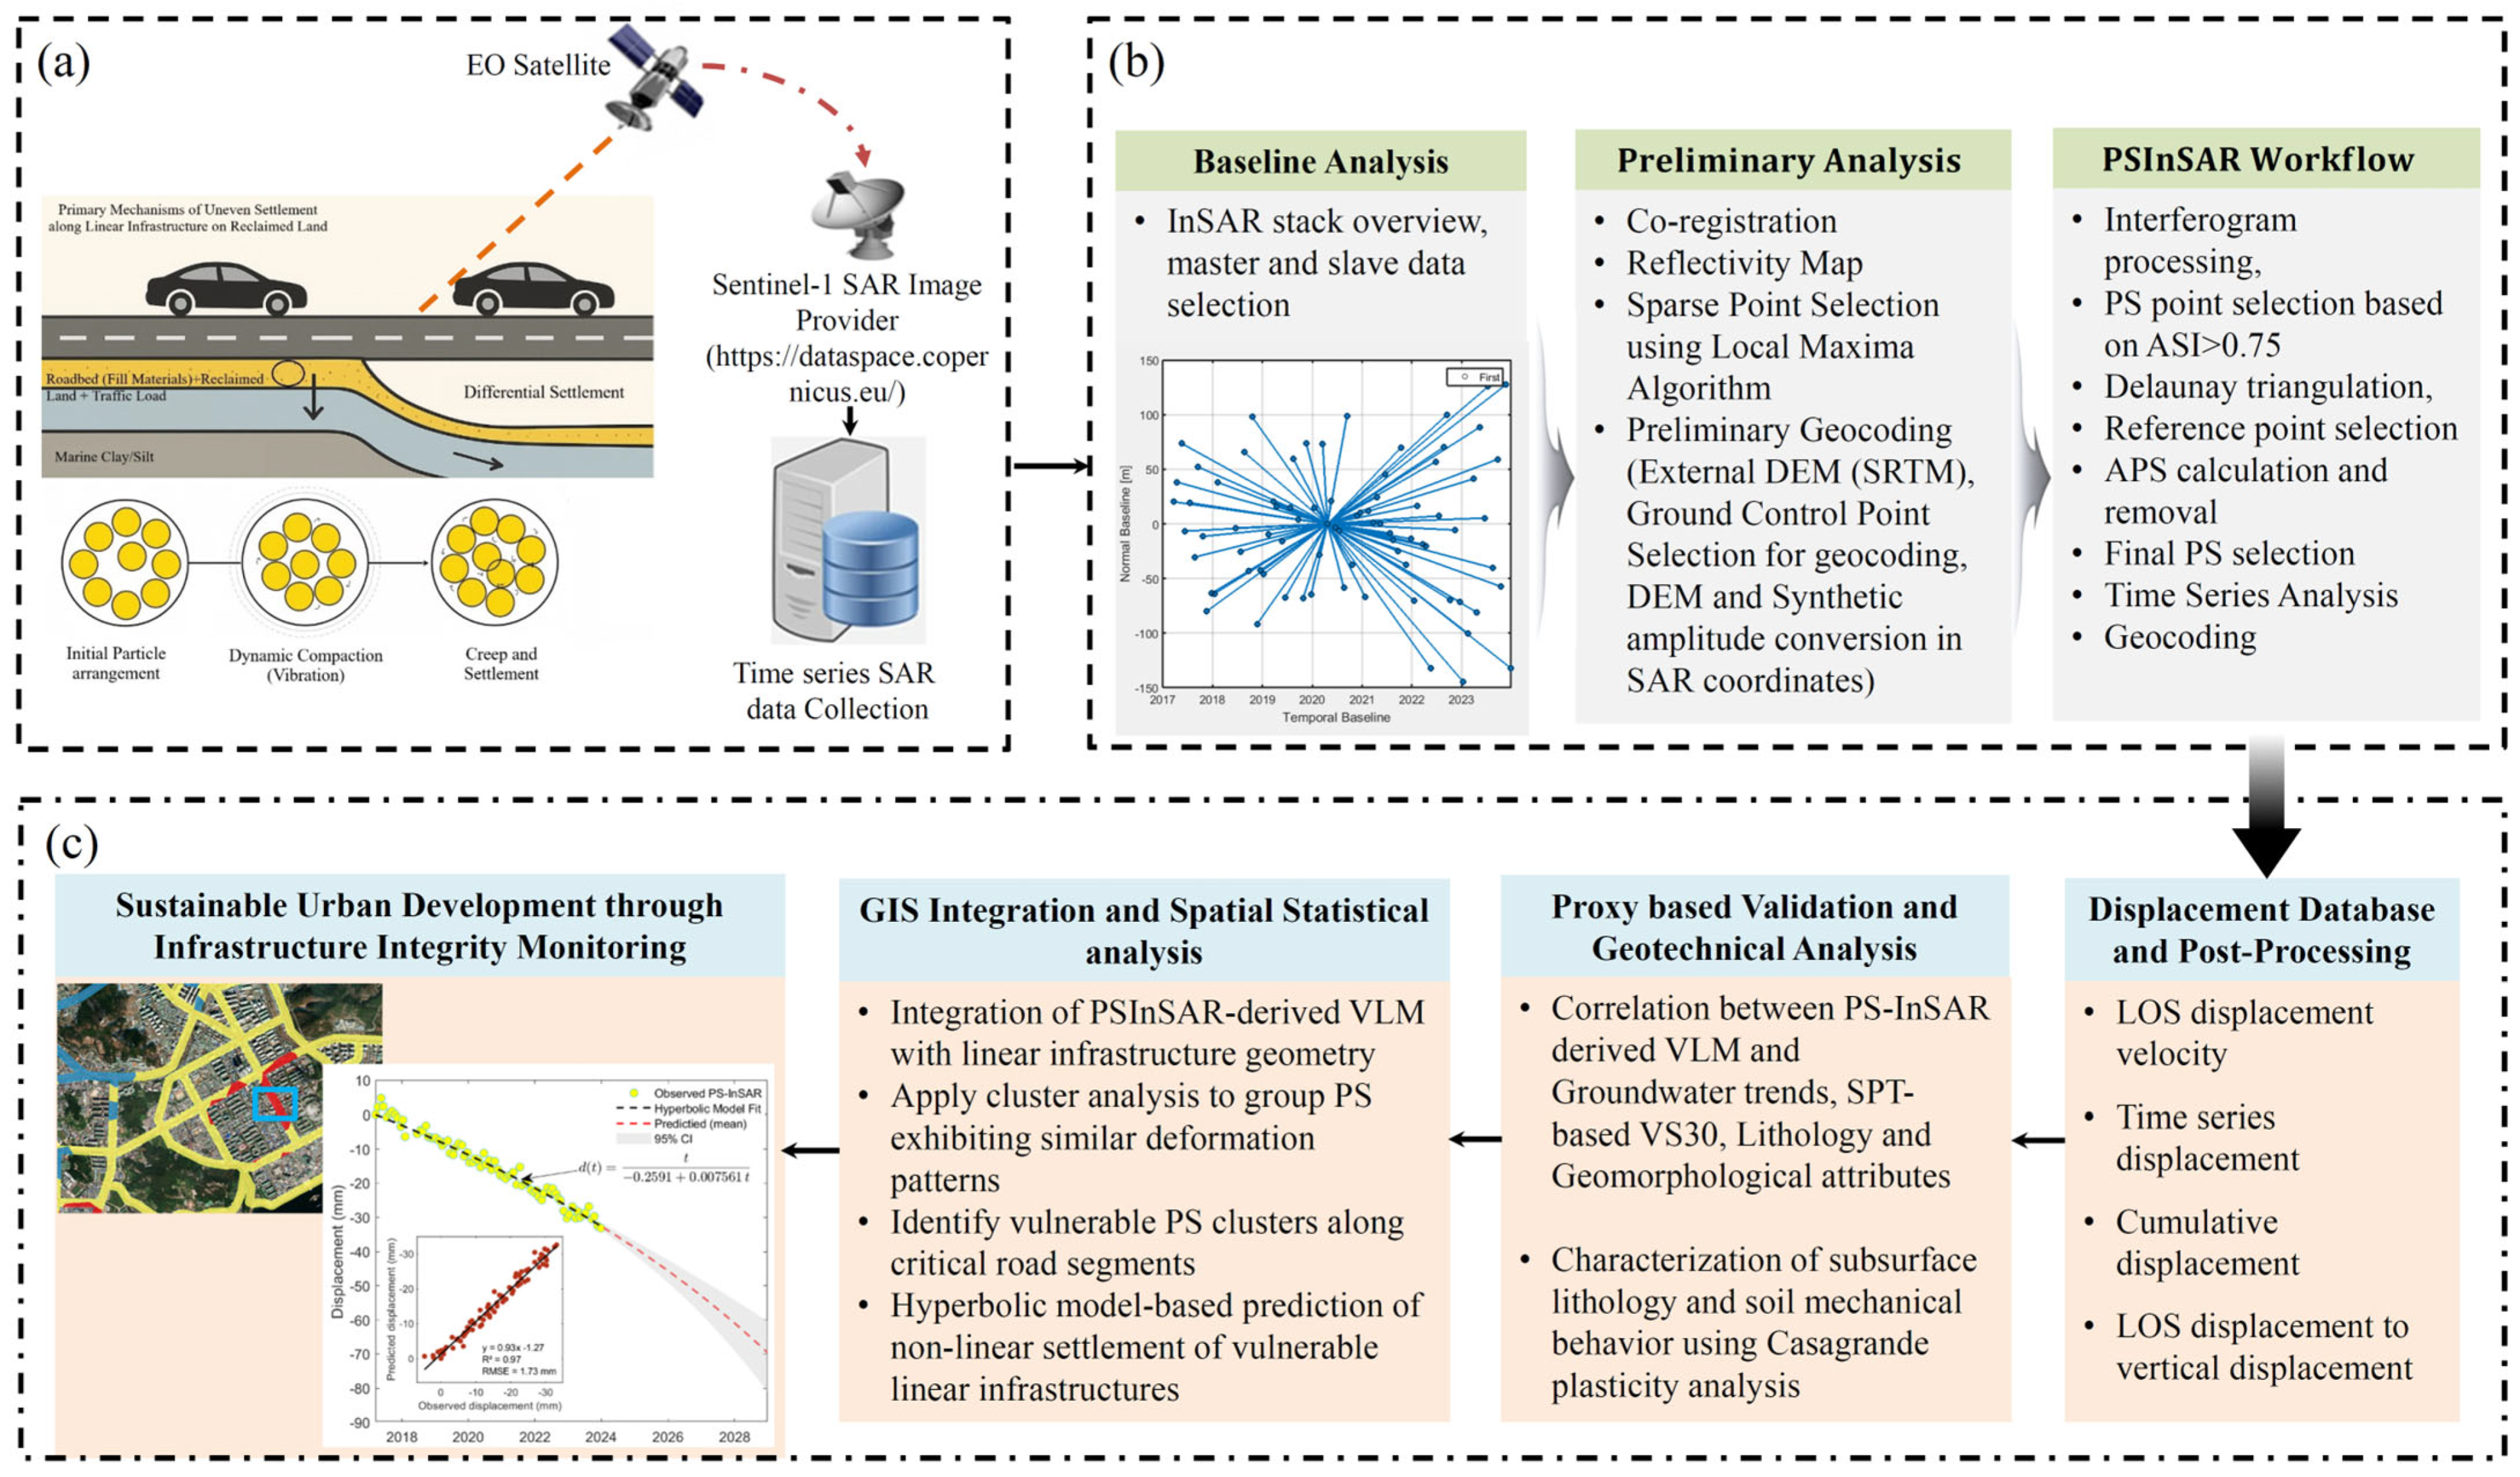
Reclaimed land is generally formed by infilling marine or estuarine environments with dredged materials such as sand, silt, or construction debris [17,25]. The underlying seabed soil, often soft, saturated marine clay or silt, is highly compressible. The weight of the new roadbed, railway, or building acts as a large surcharge that causes the underlying soil to consolidate and compress over time, gradually expelling pore water and resulting in long-term settlement [3]. This process occurs slowly and may persist for decades, leading to long-term deformation. Figure 3a illustrates the schematic representation of the primary mechanisms of uneven settlement along linear infrastructure on reclaimed land. Consequently, the rapid urban expansion of coastal cities through reclamation introduces significant geotechnical and structural challenges, including risks to buildings, bridges, and transportation networks, owing to the heightened susceptibility of reclaimed terrain to subsidence. Thus, the primary objectives of the present investigation are to integrate advanced geospatial analysis, SAR remote sensing, and statistical modeling to systematically assess uneven settlement and stability risks along linear urban infrastructure constructed on reclaimed coastal land. First, the PSInSAR technique is used to process time series Sentinel-1 SLC data and extract high-resolution, temporally continuous ground deformation patterns, enabling the identification of localized settlement hotspots. Second, we performed proxy-based validation through correlation analysis of PSInSAR-derived VLM patterns with hydrogeological and subsurface properties (Vs30, lithology, groundwater, elevation, and geomorphology) to better understand the underlying causes of ongoing land subsidence. Third, the derived VLM fields are spatially integrated with the road and railway network to delineate critical segments prone to instability. Fourth, cluster and outlier analysis, based on Anselin’s Local Moran’s I, is utilized to statistically assess spatial patterns of vulnerability. Finally, a hyperbolic settlement model is fitted to representative PS time series to predict the nonlinear progression of subsidence in vulnerable infrastructure segments. Figure 3 illustrates the comprehensive PSInSAR and GIS-based workflow for monitoring linear infrastructure settlement in the reclaimed coastal environments.

3.1. Data

In the present study, we utilized a multi-source dataset that integrates satellite-based SAR observations with ancillary topographic, hydrological, and geotechnical information to characterize ground deformation processes in Mokpo’s reclaimed coastal zones. A total of 79 Sentinel-1A SLC scenes acquired in ascending orbits between March 2017 and December 2023 were downloaded from the ESA Copernicus Open Access Data Hub (https://dataspace.copernicus.eu/, accessed on 21 September 2023). All scenes were collected in VV polarization under the Interferometric Wide (IW) swath mode, which provides a nominal ground resolution of ~2.3 m in the range direction and ~13.9 m in the azimuth direction [75]. The IW configuration utilizes the Terrain Observation with Progressive Scans (TOPS) acquisition strategy, which enhances azimuth phase stability and reduces scalloping artifacts relative to traditional ScanSAR imaging [76,77]. The high temporal resolution of Sentinel-1 reduces temporal decorrelation and enables the extraction of a large number of coherent scatterers across urbanized and semi-urban settings [78]. We selected interferometric pairs using thresholds of perpendicular baselines (<150 m) (Figure 3b, star graph).
Several auxiliary datasets were integrated to investigate potential correlations between deformation signals and hydrogeological and geotechnical factors. Linear infrastructure data, including major road and railway alignments, was obtained from OpenStreetMap (https://www.openstreetmap.org/, accessed on 25 July 2025) to assess the settlement susceptibility of transport networks. Hydrogeological datasets, comprising time series groundwater level and borehole lithological logs, were sourced from the Korean National Groundwater Information Center (https://www.gims.go.kr, accessed on 21 July 2025) and the Korean Geotechnical Information Database (https://www.geoinfo.or.kr/, accessed on 21 July 2025), respectively. High-resolution digital elevation data (5 × 5 m) collected from the National Geographic Information Institute (NGII) were used to derive terrain characteristics, including elevation and geomorphological features, to contextualize deformation patterns. Geotechnical laboratory test data (i.e., Atterberg limits) from 120 boreholes distributed across the reclaimed region, were utilized to investigate depth-dependent variations in soil mechanical behavior. Additionally, effective shear-wave velocity (Vs30), derived from in situ Standard Penetration Tests (SPTs) reported by Kim and Hong [74], were incorporated to quantify soil stiffness variations and evaluate their influence on deformation rates. A detailed summary of all datasets and their respective sources is provided in Table 3.

3.2. Methods

3.2.1. Time Series Sentinel-1 SLC Data Processing Using the PSInSAR Technique

The PSInSAR technique is a widely adopted approach for detecting and quantifying millimeter-scale ground deformation over time by exploiting the phase stability of coherent radar targets known as Persistent Scatterers (PSs) [79,80]. These scatterers, typically associated with man-made structures (e.g., buildings, road network, railways, bridges) or naturally stable features (e.g., exposed rocks), exhibit consistent backscattering properties, thereby allowing long-term displacement monitoring [79]. Although multiple variants of the PSInSAR methodology have been proposed in recent years, all share the fundamental principle of analyzing interferometric phase histories at each pixel across a stack of SAR acquisitions [43]. In PSInSAR, a reference (master) image is selected, and all auxiliary (slave) images are co-registered and paired with the master to generate a network of differential interferograms [40]. The interferometric phase φ ( x , y , t ) at a given PS location (x,y) and time t can be expressed as [81,82,83],
φ ( x , y , t ) = φ d e f o + φ t o p o + φ f l a t + φ a t m + φ d e c
where φdefo represents the phase component associated with surface displacement along the satellite Line of Sight (LOS), φtopo is the residual topographic phase, φflat corresponds to the flat-Earth phase induced by orbital geometry, φatm is the atmospheric delay phase, and φdec accounts for decorrelation and noise effects. The principal goal of PSInSAR analysis is to isolate φdefo, as it directly reflects ground displacement dynamics [83]. To accomplish this, external DEMs are incorporated to remove the topographic phase component, thereby enabling the construction of a time series of differential interferograms from which localized deformation patterns can be extracted with millimeter-level accuracy.
In the present study, 79 Sentinel-1A Single Look Complex (SLC) images were processed using the SARPROZ software (https://www.sarproz.com/, accessed on 20 September 2023) for ground deformation analysis based on the PSInSAR techniques [80]. The processing workflow followed the standard PSInSAR procedure (Figure 3b), consisting of baseline estimation, master image selection, co-registration of slave image, sparse point selection using the local maxima algorithm, interferogram processing, multi-image InSAR processing, atmospheric phase screen (APS) estimation and removal, sparse point processing, and time series displacement analysis [32,54,80,84,85]. The master image (21 April 2020) was selected based on the perpendicular and temporal baseline configurations to ensure optimal coherence and accurate co-registration of slave images. All auxiliary (slave) images were subsequently aligned to this master, creating a stack of co-registered SLCs. Differential interferograms were then generated using the Shuttle Radar Topography Mission (SRTM) DEM (90 m resolution) to remove orbital errors, flat-Earth, and topographic phase contributions [32]. Thereafter, potential PSs were initially identified based on the threshold of amplitude stability index (ASI > 0.75) [79]. Based on these PS candidates, a spatial network was constructed using Delaunay triangulation, and unknown parameters such as velocity and residual elevation were estimated using the periodogram technique, constrained within ±100 mm/year for displacement and ±100 m for elevation [54]. Absolute displacement values were then determined by integrating all estimations relative to a stable reference point located in a geodetically non-deforming area [54,79,86]. Subsequently, to reduce atmospheric effects, an APS correction was applied using spatial-temporal filtering (low-pass in space, high-pass in time), improving phase coherence through graph inversion [32,54]. A second iteration was then performed with a relaxed ASI threshold (>0.6) to increase PS density [87,88]. Subsequently, based on the same reference point and the same parameters that were used during APS estimation, the final procedure with APS removal was carried out [84], and a temporal coherence filter (>0.7) was applied to extract the most reliable deformation points. Subsequently, the DEM error, the LOS displacement velocity, and the time series displacement were estimated for the filtered PS points using a linear trend assumption. The processed PS data were geocoded and exported for subsequent analysis. Moreover, since vertical subsidence is the dominant deformation mechanism in reclaimed coastal settings due to sediment consolidation and anthropogenic factors, the LOS displacement measurements were converted to vertical displacement based on the local incidence angle [26,27,30,89,90]. This is also supported by the geological context of the Korean Peninsula, which is characterized by relatively low seismic activity and minimal horizontal deformation [32]. Subsequently, the LOS displacements were projected to vertical ground motion using Equation (2) [9,32],
V L M = d L O S cos θ
where VLM is the vertical displacement, dLOS represents the LOS displacement, and θ is the incidence angle. The derived VLM dataset was then used to assess the integrity and vulnerability of Mokpo’s linear infrastructure network, including major roadways and railways.

3.2.2. Proxy-Based Validation: Correlation Analysis

The absence of continuous GNSS, GPS, or leveling benchmarks in the study region posed limitations for the direct validation of PSInSAR-derived velocity and displacement estimates. Nevertheless, PSInSAR has been widely demonstrated as a robust and reliable remote sensing technique capable of delivering millimeter-scale deformation measurements in diverse geotechnical and geomorphic environments [9,26,89,90]. Numerous studies (e.g., [2,3,11,13,26,27,30,70]) have also shown that surface deformation in reclaimed coastal settings is strongly influenced by subsurface properties, including groundwater fluctuations, sediment thickness, soil permeability, and the consolidation of highly compressible marine and estuarine deposits. Subsequently, in the present study, we adopted a proxy-based validation framework, in which PSInSAR-derived VLM results were systematically compared against hydrogeological, geomorphological, and geotechnical parameters of the Mokpo region. These factors frequently result in spatially heterogeneous and temporally prolonged subsidence across reclaimed districts. A statistical correlation analysis was performed to investigate the underlying deformation mechanisms and assess the reliability of PSInSAR outputs. Consequently, the PSInSAR-derived VLM rates and displacement time series were compared against lithological profiles, groundwater level variations, geomorphic and topographic landforms, and reported SPT-based VS30 data.

3.2.3. Hotspot Analysis and Hyperbolic Model-Based Nonlinear Ground Subsidence Prediction

VLM data were integrated with the geometries of major linear infrastructure (roads, railways) in a GIS environment to delineate infrastructure segments exhibiting anomalous VLM, enabling dynamic stability assessment and hazard mitigation in reclaimed coastal land (Figure 3c). Numerous researchers have used clustering approaches to address the problem of VLM heterogeneity and to classify regions with similar VLM patterns [68,91,92,93]. Given that subsidence and uplift over reclaimed or heterogeneous fill can vary sharply over short distances, spatial clustering methods offer a robust tool to manage VLM heterogeneity by classifying infrastructure stretches according to similar deformation regimes. In the present study, we used Anselin Local Moran’s I ‘Cluster and Outlier Analysis’ approach to detect infrastructure segments that are statistical outliers or are part of clusters with high rates of deformation. This approach identifies four key spatial clustered types: High clusters, Low clusters, Low outliers, and High outliers. We adopted this clustering method, particularly due to linear infrastructure in reclaimed areas often traversing zones where compressible fill, variable groundwater extraction, and differential compaction produce abrupt deformation gradients. Therefore, by isolating both local clusters and outliers, the selected approach makes it possible to pinpoint vulnerable infrastructure sections that may act as nucleation points for cascading failure, particularly in cascading hazard scenarios (e.g., foundation settlement leading to track misalignment, road cracking, or differential tilting).
The prior subsidence reported in the Mokpo region (e.g., [70]) is primarily attributed to large-scale land reclamation activities and is governed by consolidation processes. Therefore, predicting consolidation settlement in practice is challenging due to the heterogeneity of soil properties, layered deposits, and variable loading histories. The hyperbolic method provides a simplified yet robust analytical framework by fitting settlement observations to a hyperbolic curve, thereby enabling estimation of both ongoing and future subsidence [94,95]. This approach has successfully been applied to infinitesimal and finite strain consolidation, producing reliable settlement estimates for diverse ground conditions. For reclamation sites in particular, the nonlinear subsidence driven by self-weight loading of compressible fill is effectively described using hyperbolic functions [25,70,96]. Numerous studies have validated the use of the hyperbolic model in reclamation environments and demonstrated its utility for linking multi-temporal InSAR time series to long-term settlement trends (e.g., [2,25,70,97]). Consequently, we applied the hyperbolic model for analyzing consolidation-induced subsidence to characterize the nonlinear behavior of settlement and forecast future displacements at vulnerable linear infrastructure sites. In soft and heterogeneous clay deposits, settlement behavior typically conforms to the hyperbolic rule [25]. The settlement at time t, denoted as d(t), is expressed as
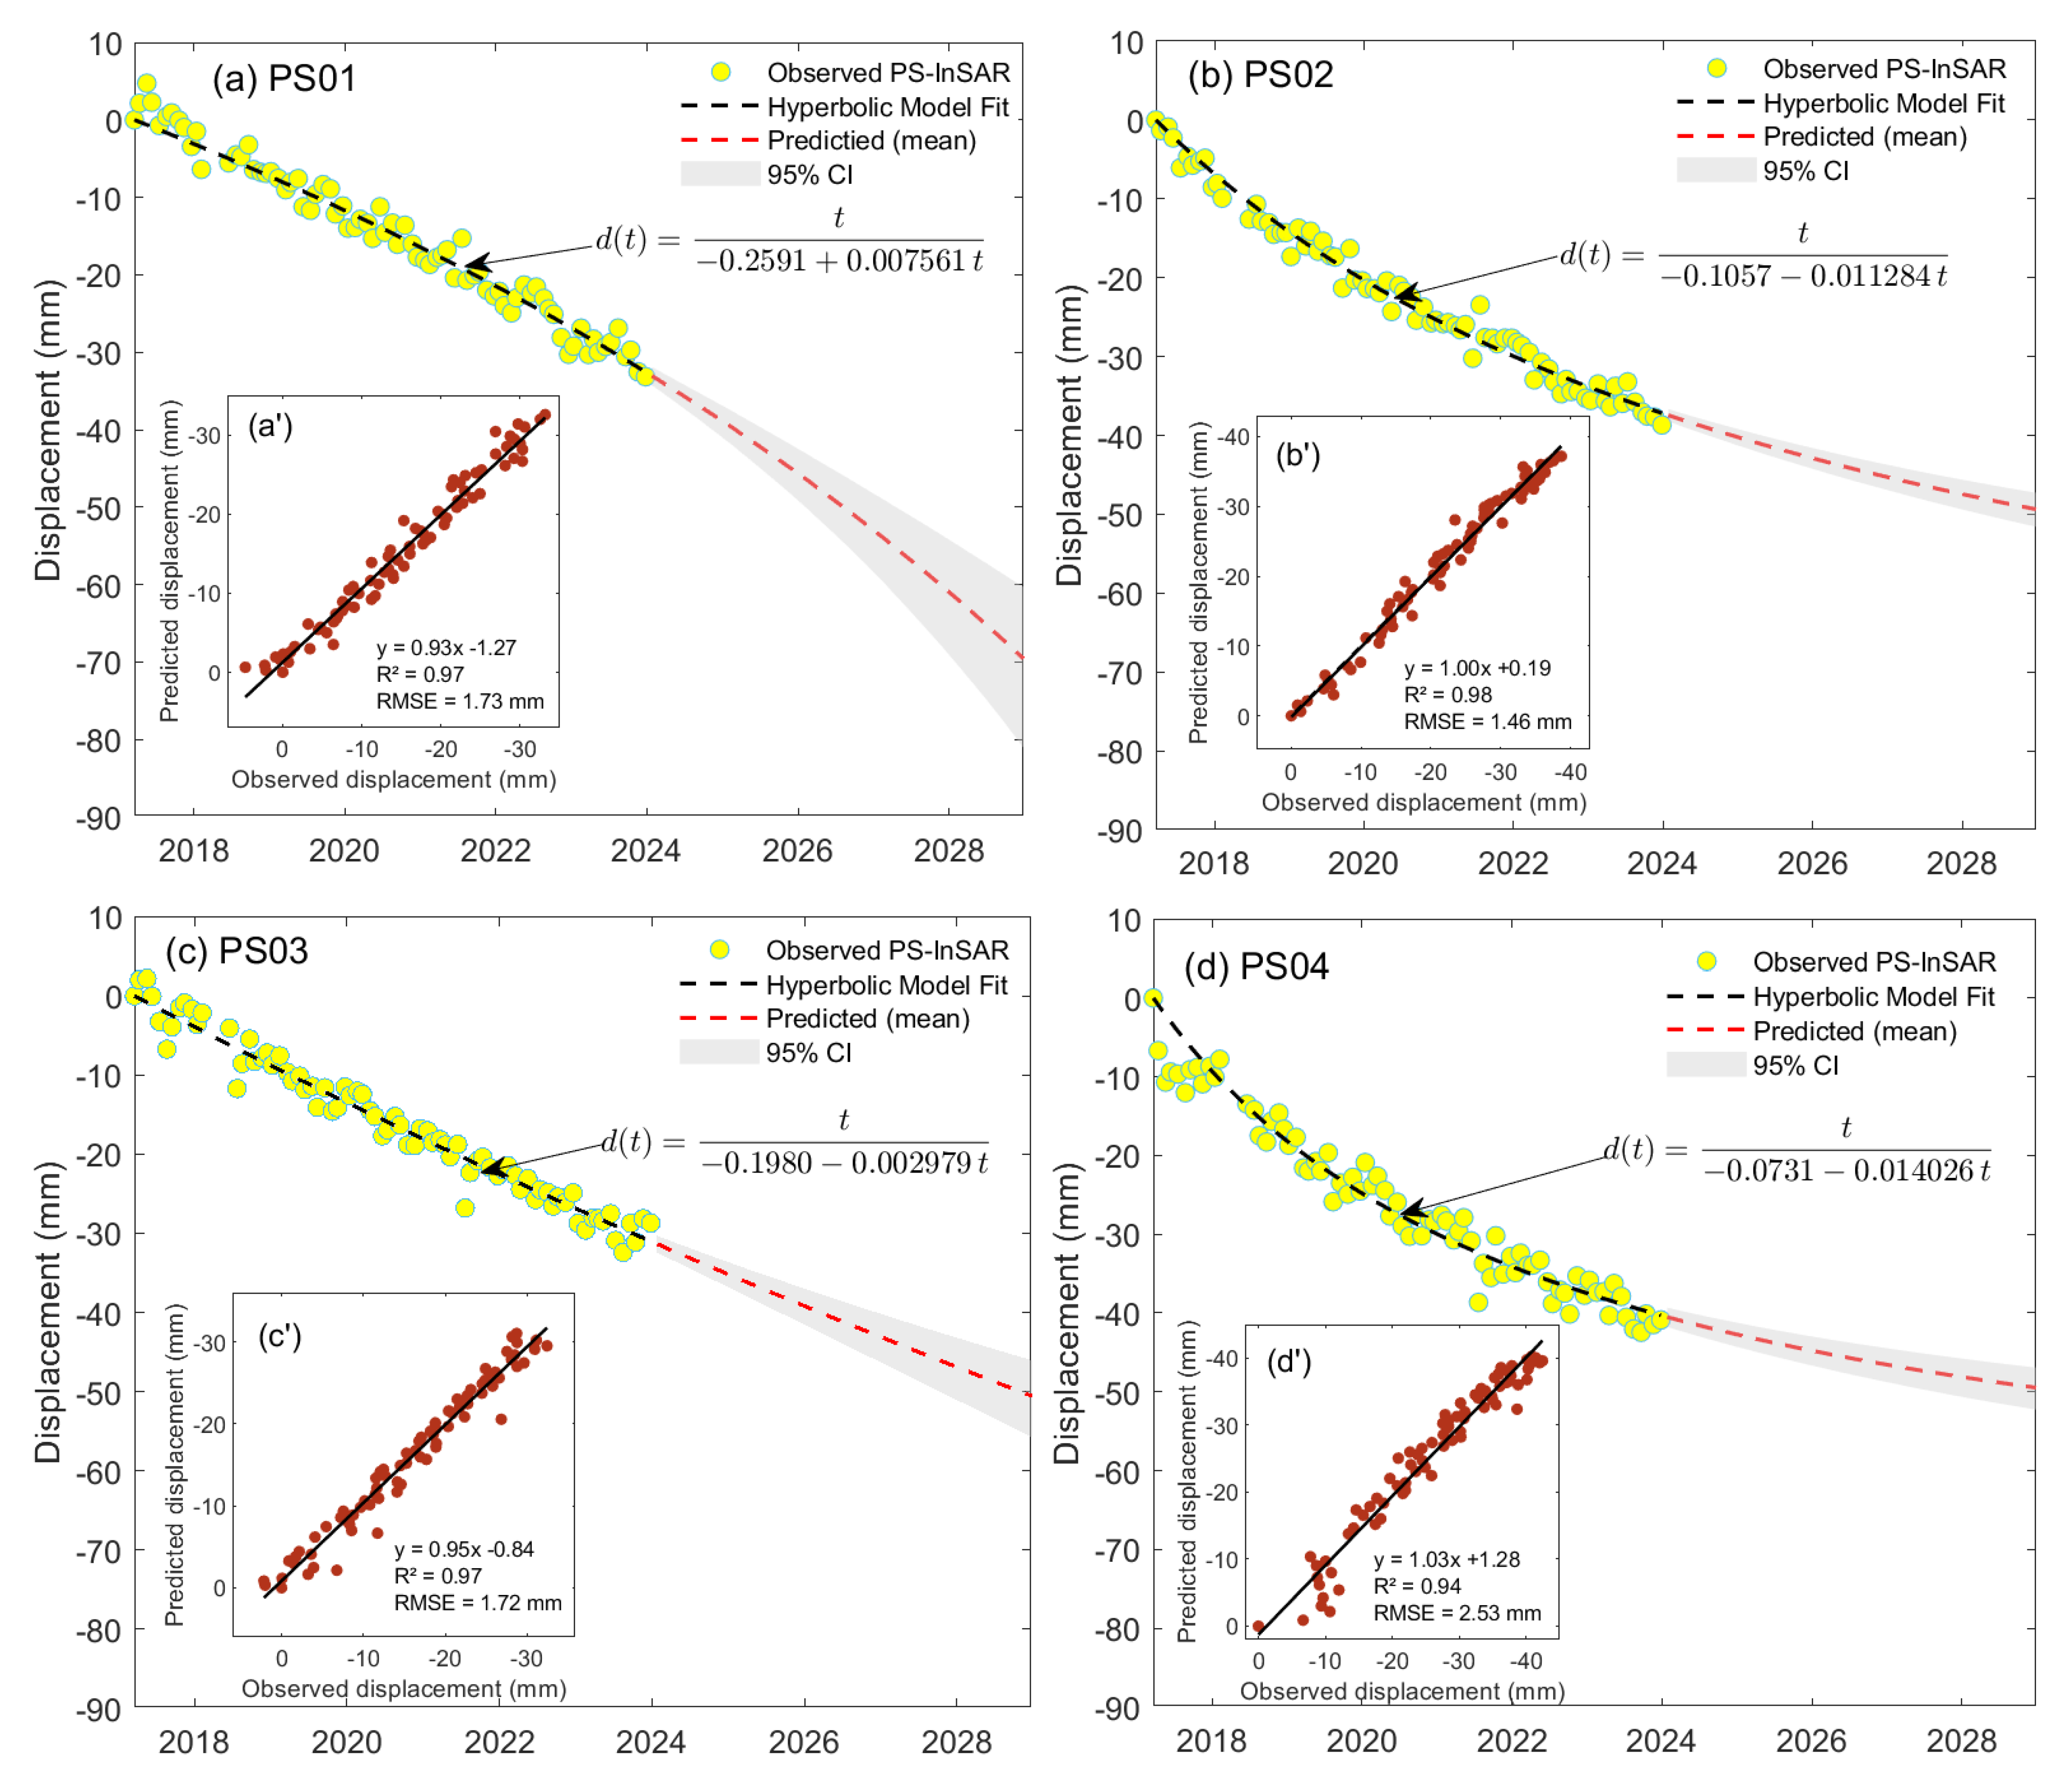
d ( t ) = t α + β t
where α and β are the PS-point specific empirical constants determined from linear regression of observed displacement data. Model performance was evaluated using the coefficient of determination (R2) and root mean square error (RMSE) to ensure the best fit for the chosen PS point.

4. Results

4.1. PSInSAR-Based Ground Displacement Monitoring in Mokpo City

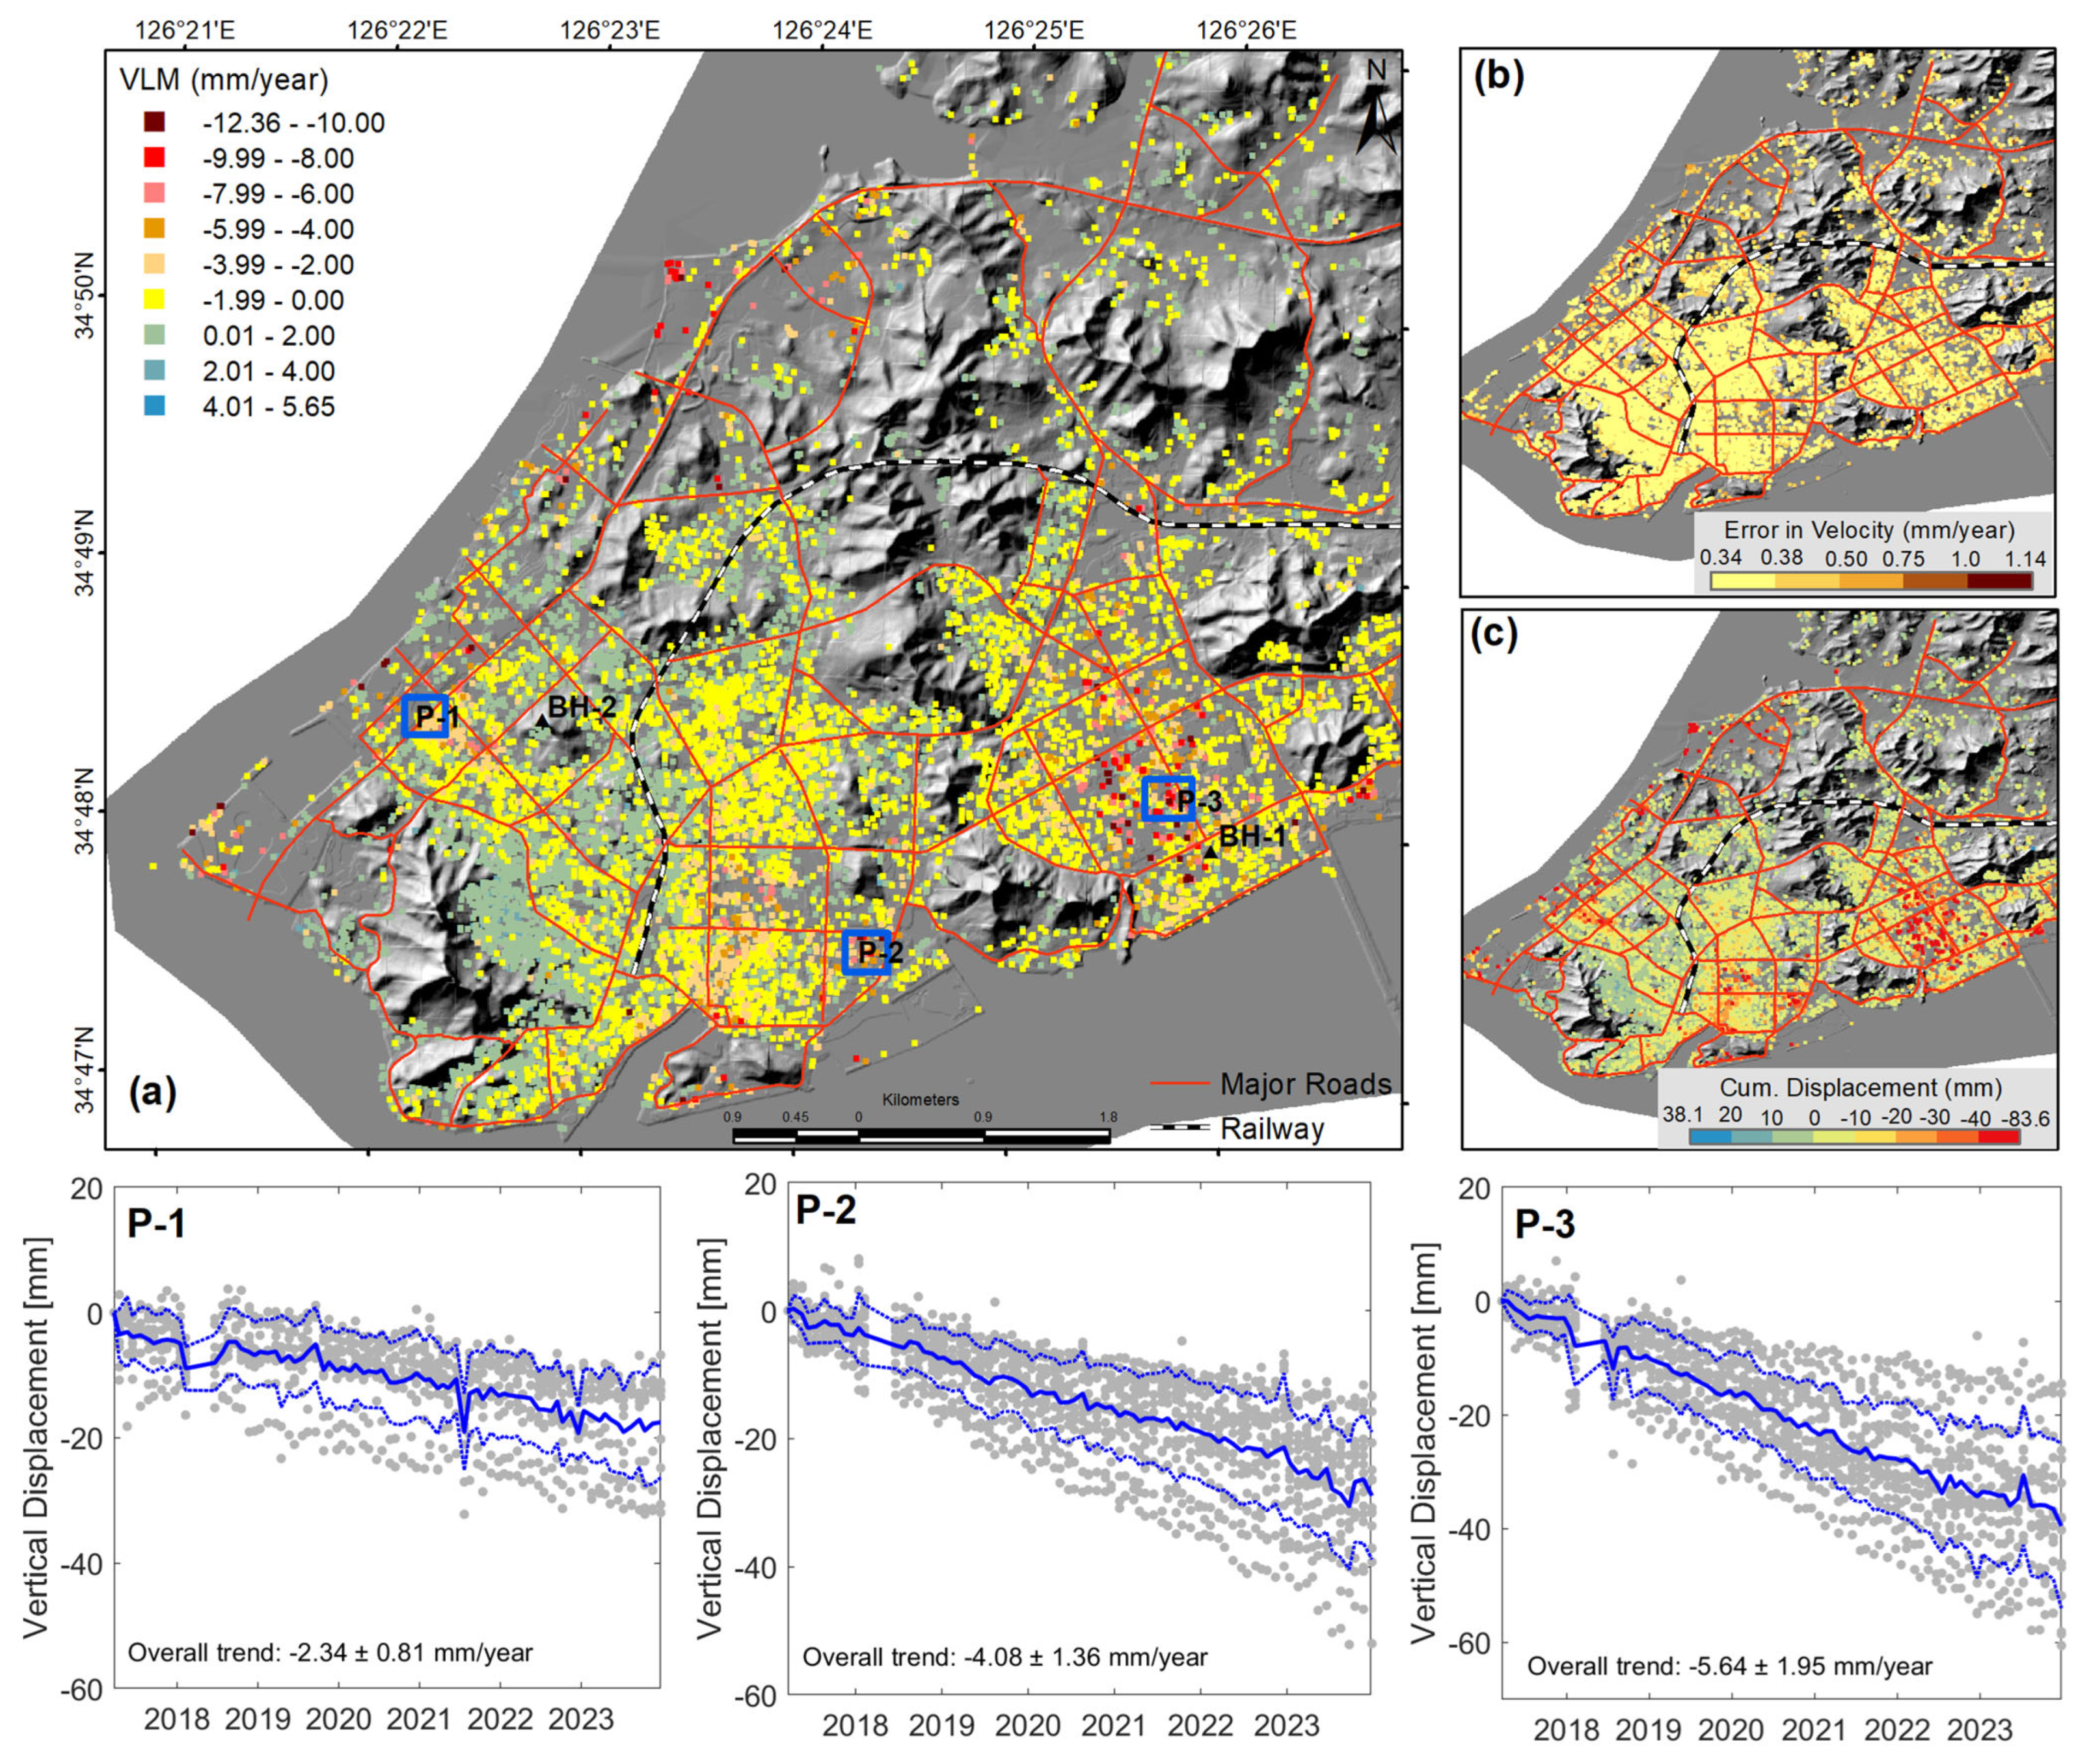
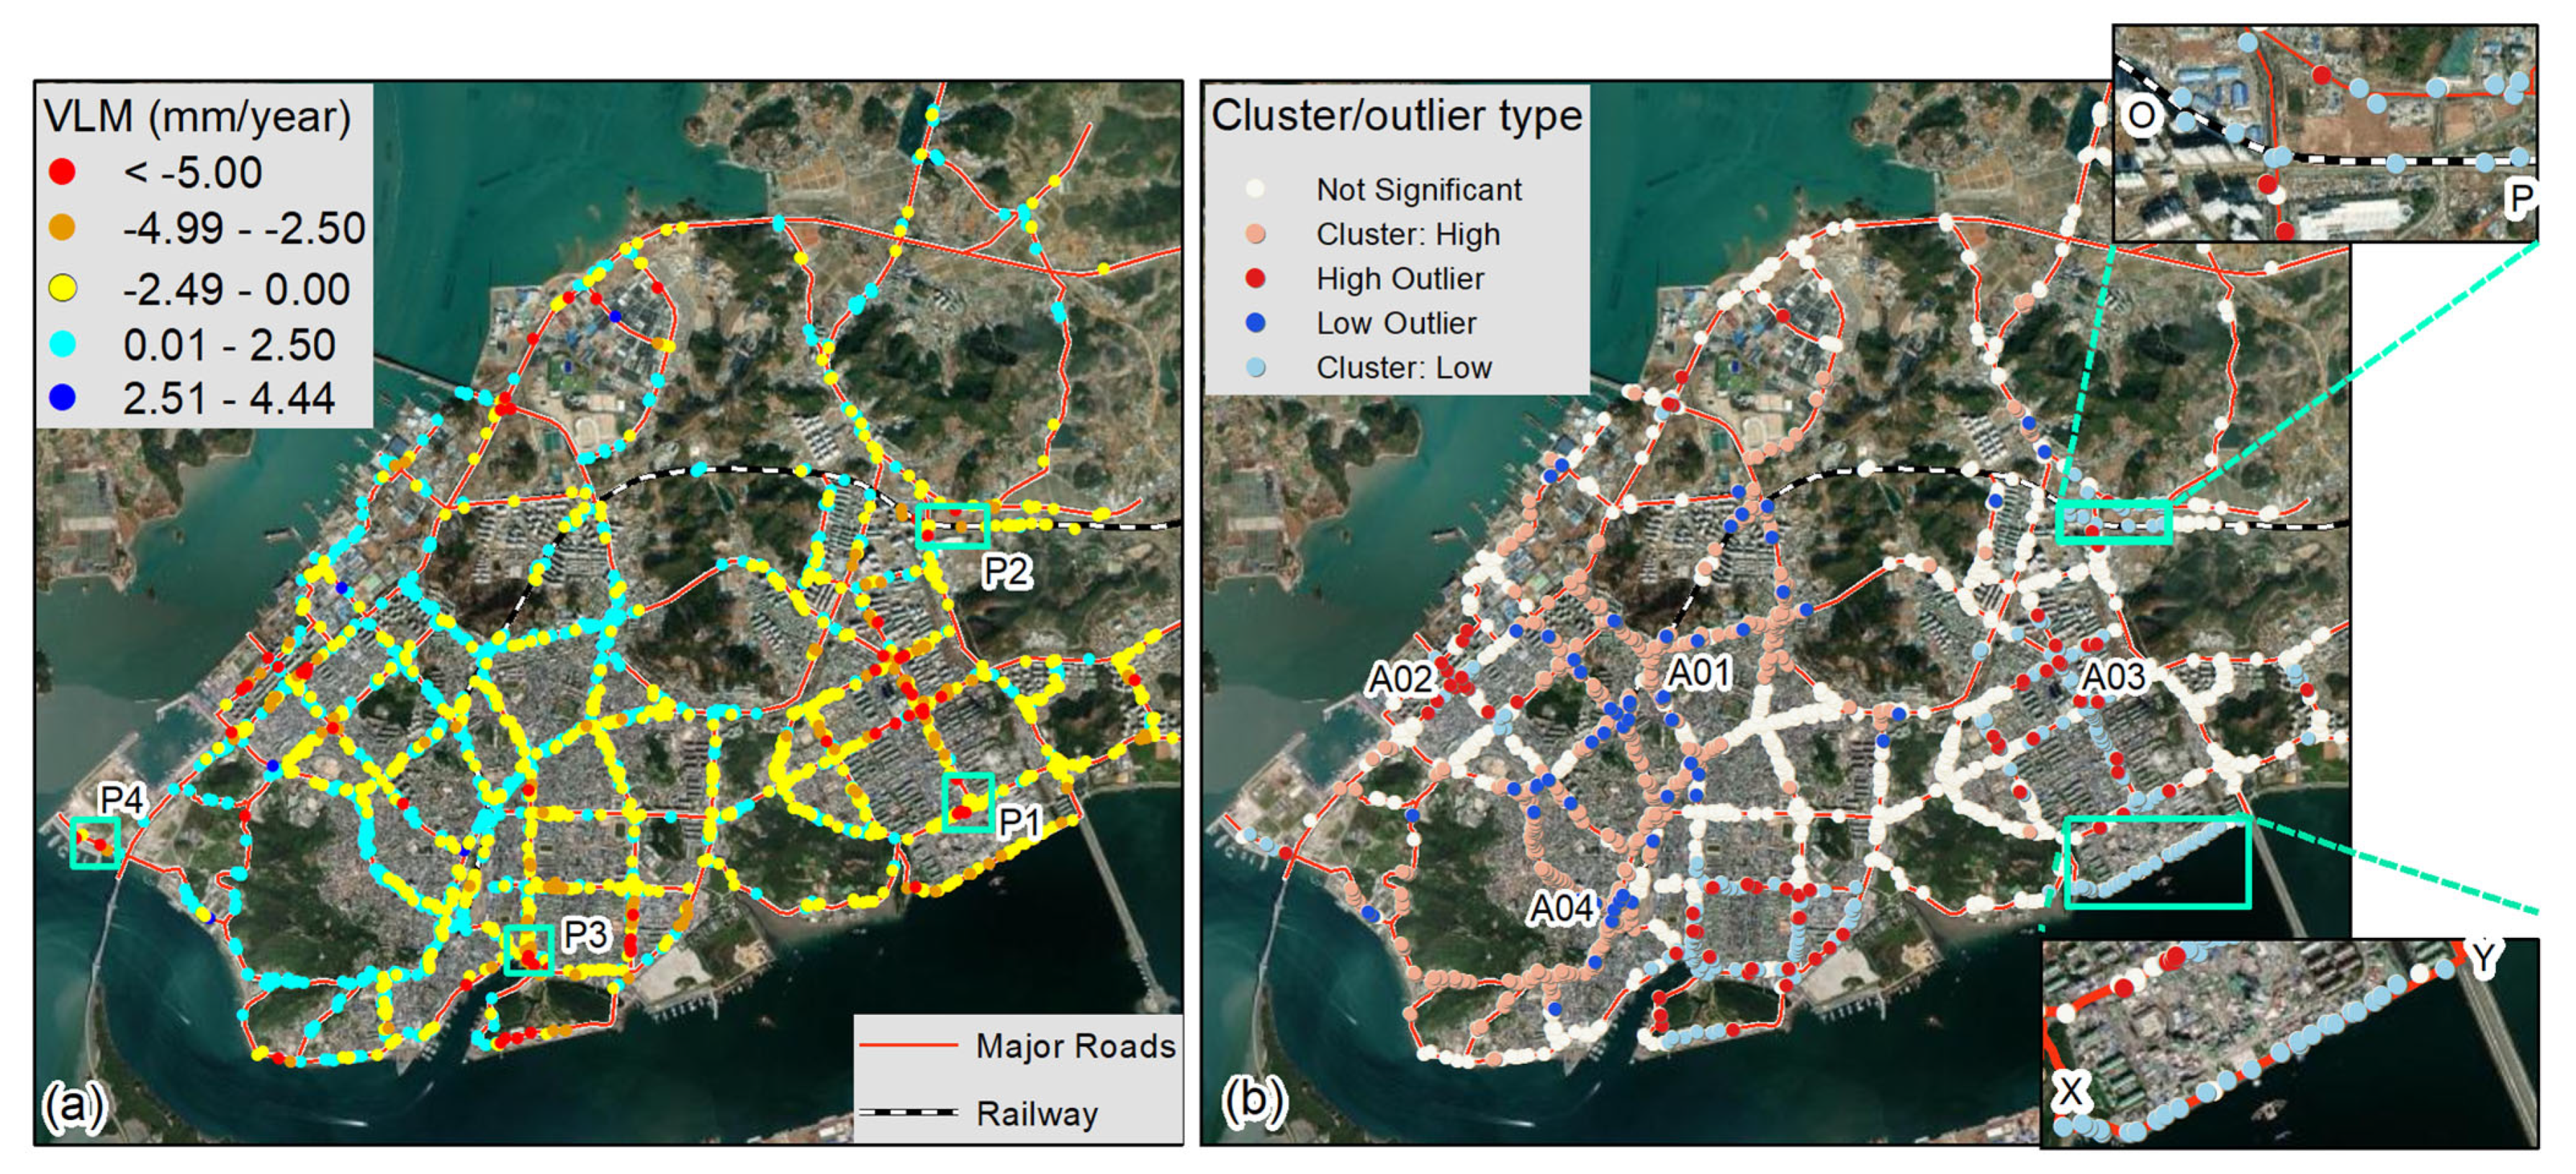
This study used 79 Sentinel-1 SLC images (2017–2023) and the PSInSAR technique to monitor ground settlement, delineate high-risk linear infrastructure segments, and provide recommendations for sustainable urban development. A total of 12,076 PSs were identified, all with temporal coherence > 0.70, confirming the high reliability of the measurements. The PSs are spatially distributed across the Mokpo region, with the highest densities located in highly urbanized zones where radar backscatter is enhanced by built infrastructure such as railways, highways, and dense building clusters. Figure 4a depicts the spatial distribution of settlement rates, ranging from −12.36 mm/year to 5.65 mm/year, with a regional mean of −0.39 mm/year. The distribution of cumulative vertical displacement is shown in Figure 4c, exhibiting subsidence reaching −83.6 mm. Approximately 50.72% of the PSs exhibited significant subsidence. The deformation patterns show strong spatial correspondence with historically reclaimed areas, such as Wonsan, Dongmyung and Hadang (Figure 1b), highlighting the direct influence of reclamation on ground instability. The observed subsidence is spatially heterogeneous and strongly influenced by subsurface lithological variability, particularly within reclaimed areas. A quantitative summary of PSInSAR-derived subsidence in the major reclaimed districts of Mokpo City (i.e., Dongmyung, Hadang, and Wonsan), including the maximum, mean, standard deviation, and cumulative displacement, is illustrated in Table S1 (Supplementary Materials). Average settlement rates range from −1.26 to −1.95 mm/year, with local maxima exceeding −12 mm/year and cumulative displacements reaching −83 mm, confirming the pronounced vulnerability of Dongmyung, Hadang, and Wonsan to differential settlement and highlighting zones of heightened infrastructure risk. Further, the displacement time-series analysis at selected sites, i.e., Wonsan (P-1), Dongmyung (P-2), and Hadang (P-3), reveals persistent consolidation-driven settlement across reclaimed land (Figure 4, subplots P-1 to P-3). The linear regression fits yield differential deformation rates: Hadang (−5.64 mm/year), Dongmyung (−4.08 mm/year), and Wonsan (−2.34 mm/year). These findings are consistent with prior studies (e.g., [26,31,70,71]), which documented extensive subsidence in Mokpo’s reclaimed zones between 1992 and 2012. Therefore, the updated InSAR time series (2017–2023) confirms that these decades-old reclaimed zones continue to exhibit consolidation-induced settlement, underscoring concerns for the long-term stability of linear infrastructure in Mokpo.
Furthermore, we have performed an extensive review of in situ records and news archives, which revealed a series of sinkhole incidents across the reclaimed region of Mokpo city, including roadway collapses and tilting of residential structures, as presented in Table 2 and marked in Figure 1b. These events are primarily associated with aging sewer networks, inadequate soil compaction, and the disturbance of unconsolidated reclamation fill conditions, consistent with the geotechnical patterns inferred from PSInSAR-derived VLM data. The convergence between satellite-derived deformation patterns and observed ground failures provides compelling evidence that continued PSInSAR monitoring and field inspections are critical for safeguarding urban infrastructure and early detection of hazardous void formation in Mokpo’s reclaimed coastal zones.

4.2. Correlation of PSInSAR-Derived VLM with Hydrogeological, Geotechnical and Geomorphic Attributions

The absence of in situ GNSS/GPS or leveling data limits direct validation of PSInSAR-derived displacements; however, error uncertainty estimations demonstrate robust reliability, with LOS velocity errors ranging from 0.34 to 1.14 mm/year and a regional mean of 0.38 mm/year (Figure 4b). These low uncertainties indicate a high level of confidence in the PSInSAR-derived settlement rates. To further interpret the drivers of VLM, we conducted proxy-based correlation analyses between PSInSAR-derived VLM rates and hydrogeological, geotechnical, and geomorphic attributes, including groundwater trends, lithological strata, landforms, elevation, and Vs30. For this purpose, we obtained borehole lithological strata at two sites, one located on reclaimed land and the other on natural terrain (marked in Figure 4a). It was observed that the borehole in reclaimed land (BH-1) reveals thick sequences of unconsolidated fill and clay, which correspond with significant subsidence signals (Figure 5a). This behavior reflects settlement induced by soil compaction and primary consolidation. In contrast, the borehole (BH-2) located in natural land, underlain by more competent lithified strata (soft rock, weathered soil, and medium rock), shows an uplift trend. These observations confirm that lithostratigraphy exerts a first-order control on settlement patterns in Mokpo. We further compared PSInSAR-derived VLM rates with corresponding Vs30 values, which serve as a proxy for near-surface stiffness (Figure 5b). It was observed that the subsiding PSs were predominantly associated with low Vs30 zones, reflecting the reduced shear strength and higher compressibility of unconsolidated sediments. This correlation underscores the dominant role of soil stiffness and stratigraphy in driving differential settlement across reclaimed areas.
Additionally, to evaluate hydrological effects, we analyzed the correlation between PSInSAR-derived time-series displacements and measured groundwater levels (Figure 5c). The mean groundwater fluctuation rate between 2017 and 2023 was 0.06 m/year, suggesting negligible long-term variations during the study period. This indicates that historical reclamation processes, rather than contemporary groundwater level changes, are the primary driver of ongoing settlement in Mokpo. These findings are consistent with previous reports highlighting the susceptibility of soft soils and reclaimed deposits to large-scale deformations in coastal settings [3,17,25,26,27,96].
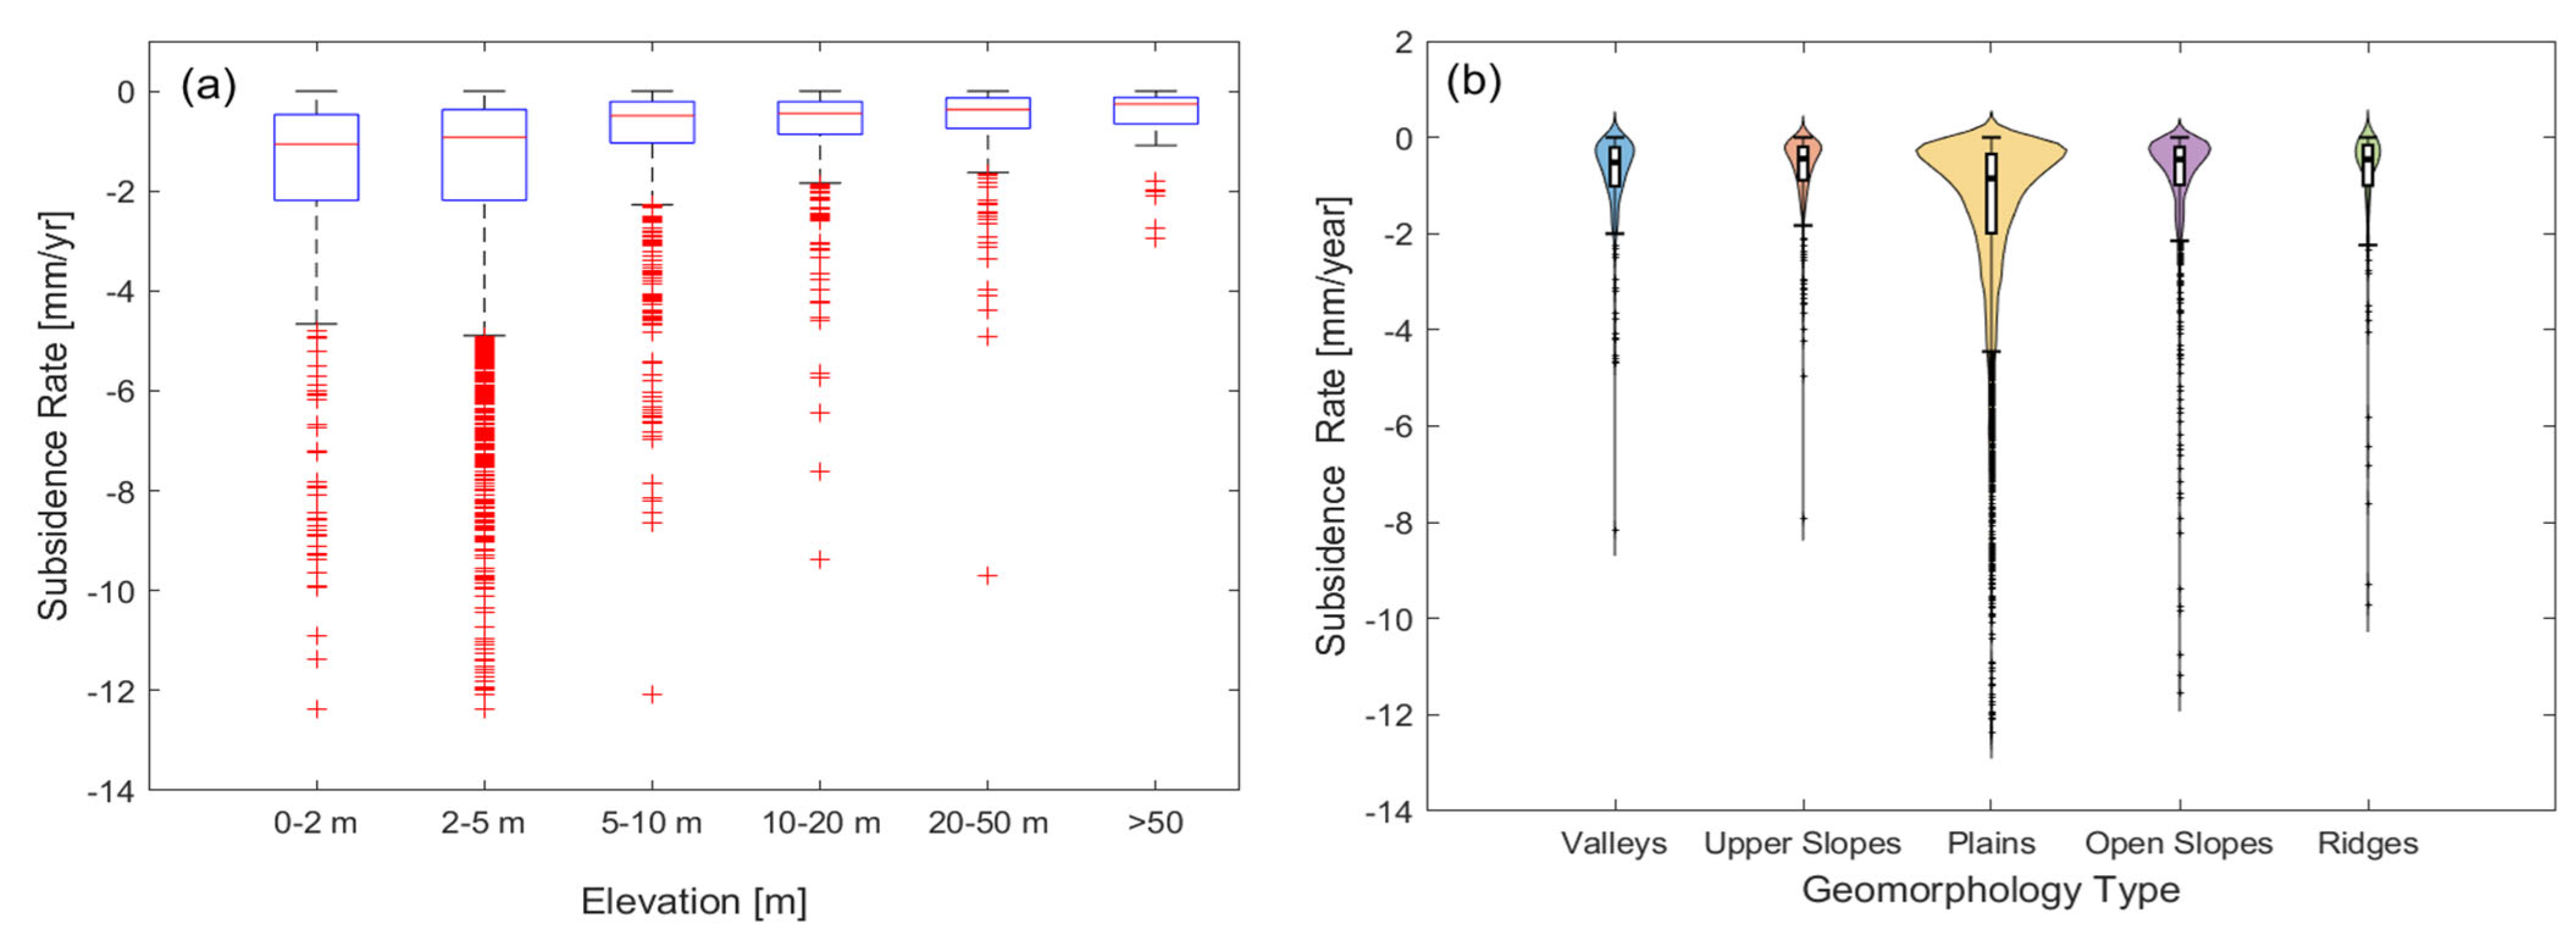
The influence of geomorphology and elevation was also assessed by integrating PSInSAR-derived VLM with topographic landform classes extracted from a high-resolution (5 m × 5 m) DEM using SAGA GIS. Boxplot analysis (Figure 6a) demonstrates that subsidence outliers are concentrated in low-lying coastal zones (MSL < 5 m), particularly over reclaimed land (Figure 1b,c). These areas are characterized by sediment accumulation, loose soil deposits, and potential water saturation, which collectively enhance settlement susceptibility. A violin plot analysis of geomorphic classes (Figure 6b) further reveals that plain and open-slope regions exhibit the highest settlement rates, reflecting the presence of thicker unconsolidated strata that amplify ground instability. These proxy-based correlation analyses indicate that reclamation-induced lithological and geotechnical conditions dominantly control differential settlement in Mokpo, while groundwater and geomorphic factors exert secondary but reinforcing influences.

4.3. Vulnerability Mapping of Linear Infrastructure

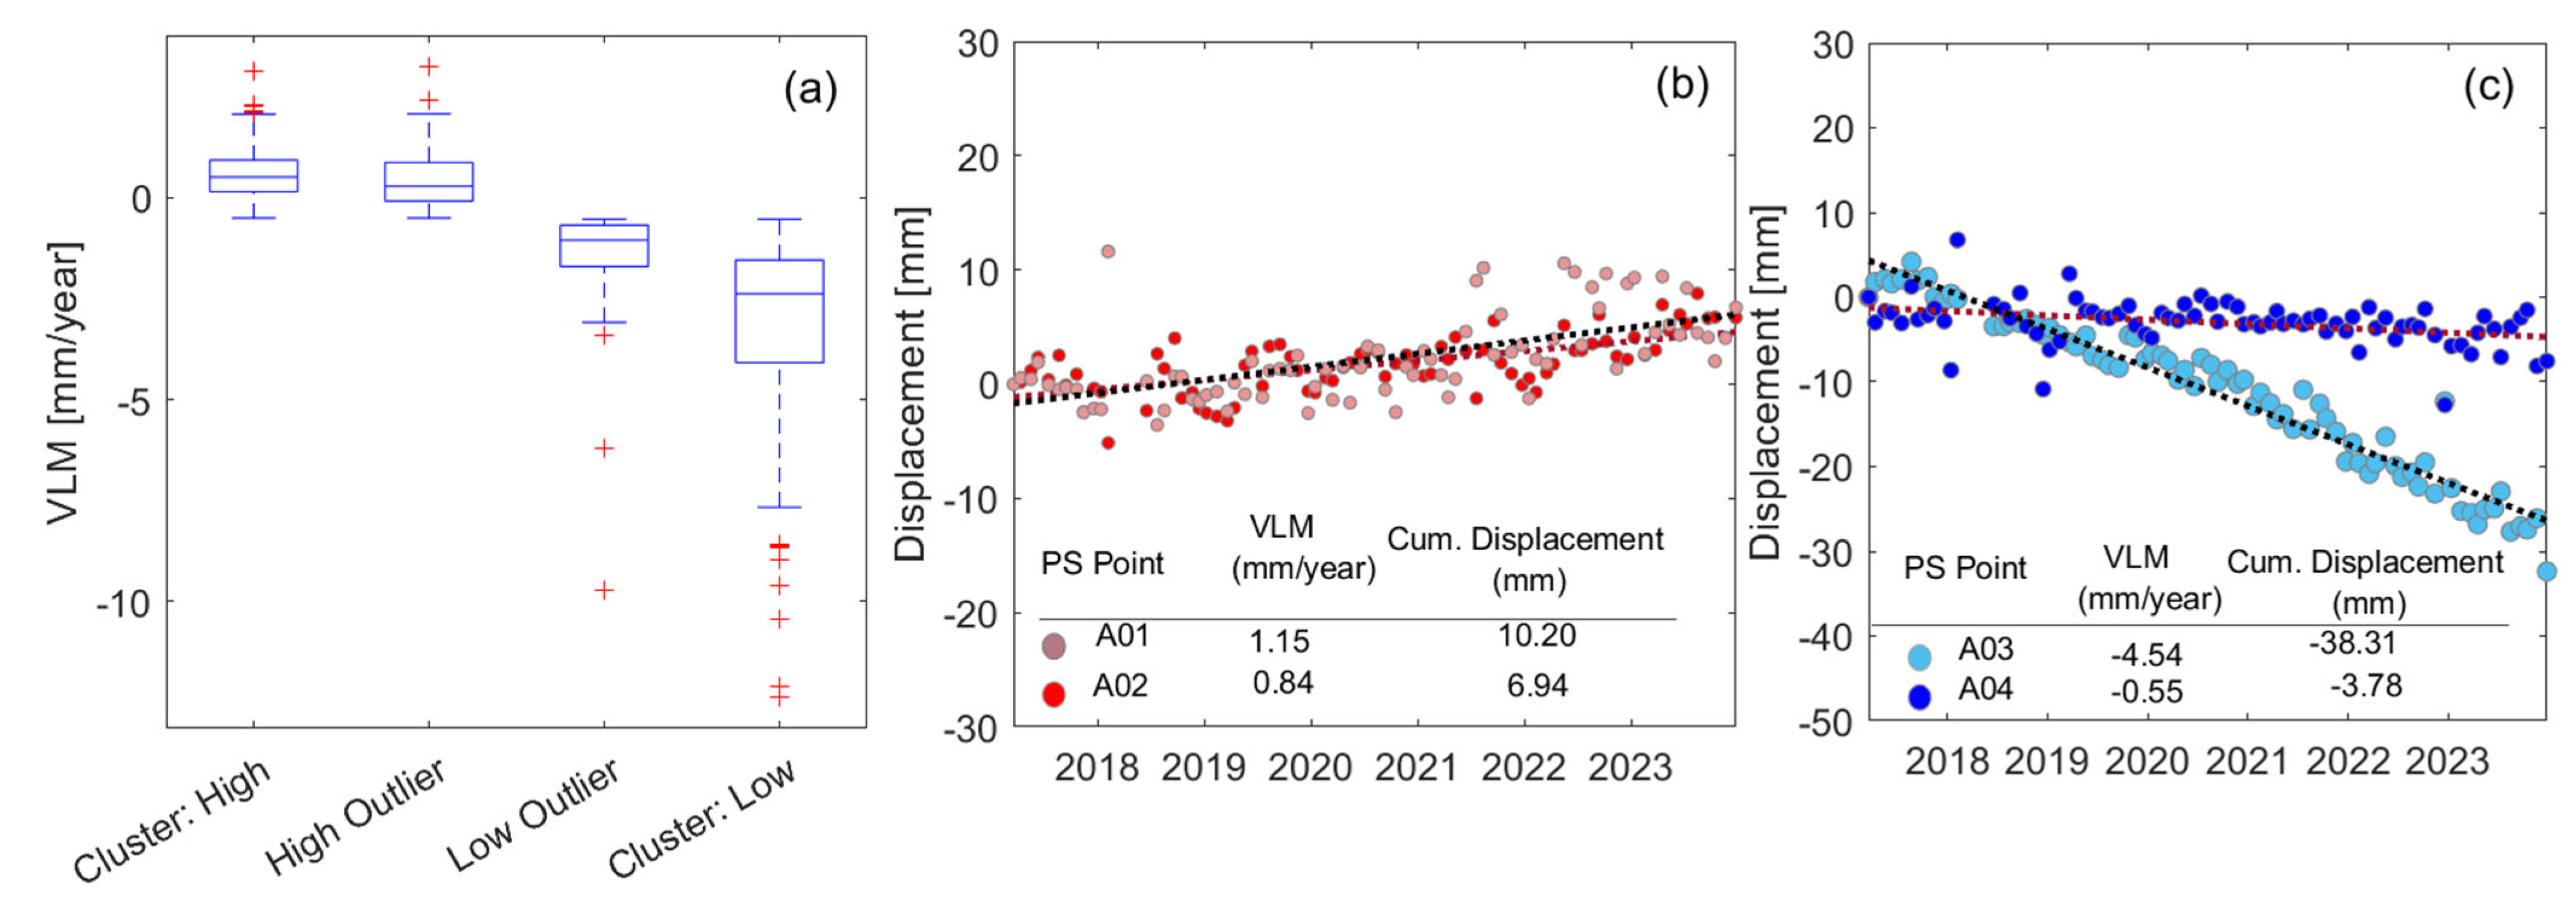
To assess the vulnerability of linear infrastructure (roads and railway tracks) to ground deformation, PSs located within a 50 m buffer around major transportation alignments were extracted using OpenStreetMap data in a GIS environment. A total of 1869 PSs were identified along road and railway corridors, with a mean deformation rate of −0.53 mm/year, of which 54.3% exhibited subsidence at an average rate of −1.50 mm/year, indicating significant settlement along transportation networks (Figure 7a and Figure S1). Spatial patterns of deformation were further analyzed using Anselin Local Moran’s I cluster and outlier analysis, which classified the PSs into five categories, such as, not significant, high clusters, low clusters, high outliers, and low outliers (Figure 7b). It was observed that non-significant (mean VLM −0.47 mm/year, p-value not statistically significant) zones represent areas where VLM appears spatially random, yet localized anomalies may still induce pavement distress, cracking, and drainage misalignment, warranting site-specific monitoring. Low clusters (mean VLM −3.11 mm/year, p-value < 0.05) denote spatially coherent subsidence zones, predominantly concentrated in reclaimed areas such as Wonsan, Dongmyung, and Hadang, where risks of long-term differential settlement, pavement rutting, and structural deterioration are high. High clusters (mean VLM 0.55 mm/year, p-value < 0.05), where uplift or minimal settlement dominates, can cause uneven pavement elevations, impaired drainage gradients, and localized heaving. High outliers (mean VLM 0.45 mm/year, p-value < 0.05) represent uplifted PSs within subsiding regions, creating abrupt elevation changes that compromise road safety, whereas low outliers (mean VLM −1.47 mm/year, p-value < 0.05) indicate localized subsidence within stable or uplifted areas, often manifesting as depressions, potholes, or weak spots prone to further deterioration. The low clusters and low outlier regions should be designated as high-priority zones requiring stabilization, targeted maintenance, and geotechnical reinforcement, whereas high clusters and high outliers demand localized adjustments to prevent abrupt settlement contrasts and ensure traffic safety.
Box plot analysis (Figure 8a) highlights distinct deformation patterns across vulnerability classes, while time-series displacement trends at representative sites within the vulnerability classes (A01–A04; Figure 8b,c) demonstrate continuous ground settlement within low-cluster zones. This clustered typology provides a diagnostic framework of vulnerability classes for prioritizing infrastructure monitoring and engineering interventions.

4.4. The Temporal Evolution of Road and Railway Settlement Along Highly Vulnerable Corridors

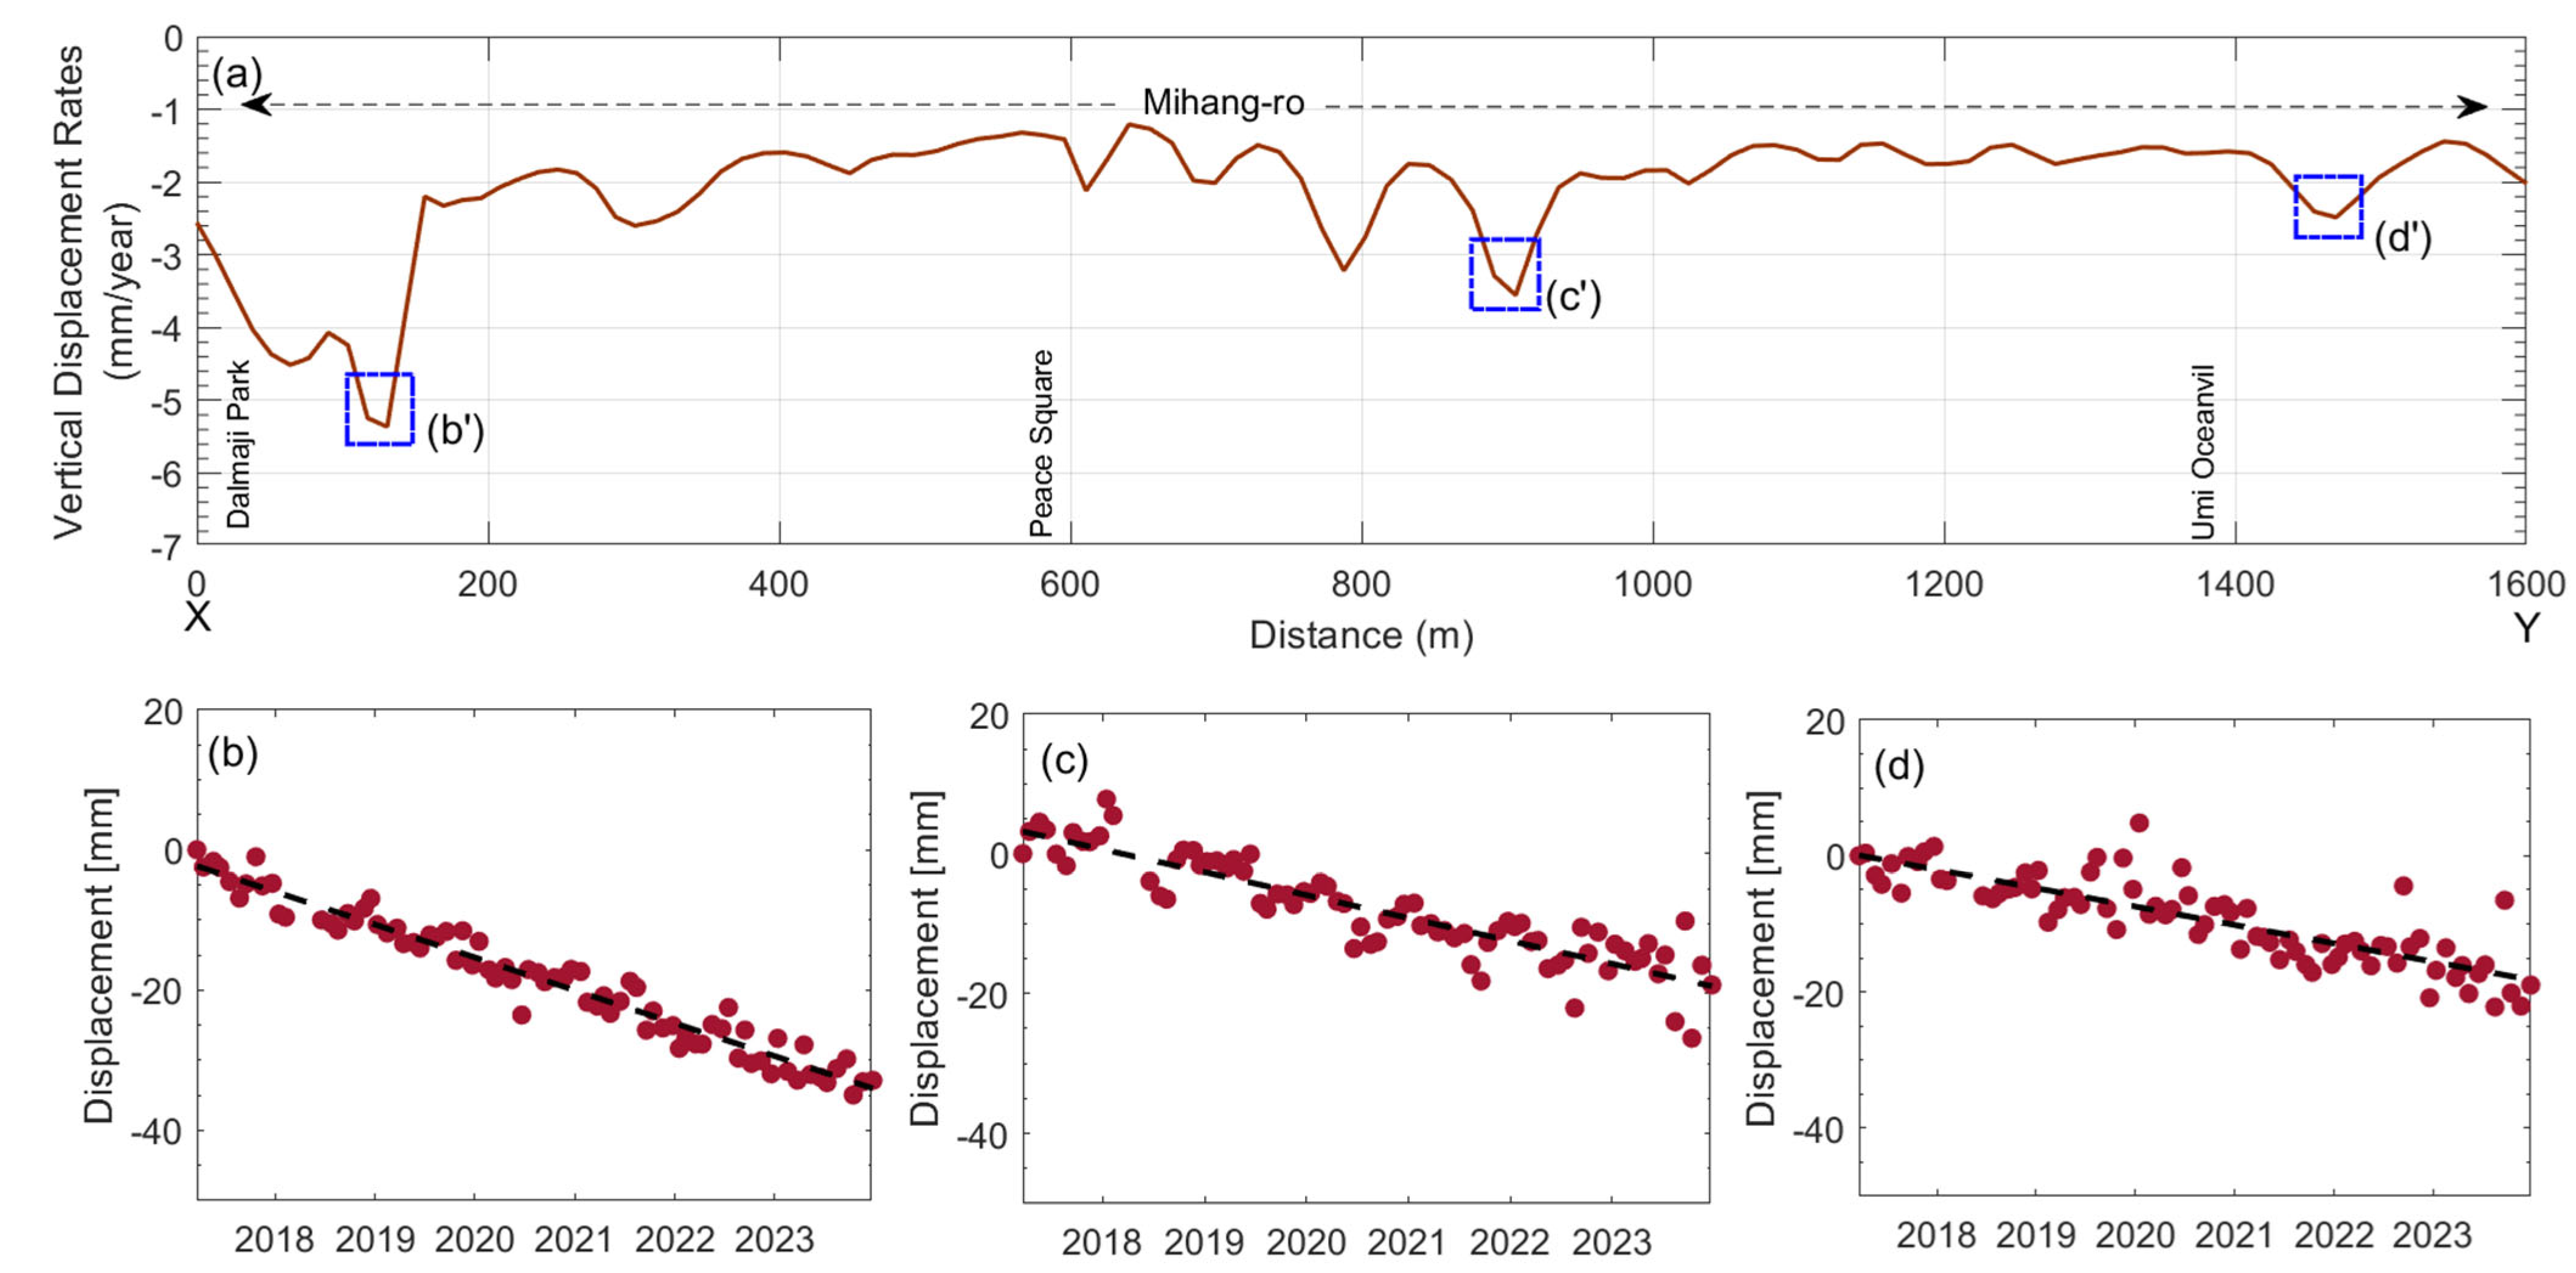
To investigate deformation dynamics along critical linear infrastructure within high-vulnerability corridors, we analyzed a 1600 m-long road section and a 1200 m-long railway segment in Hadang, where large-scale land reclamation was previously undertaken (locations shown in Figure 7b, zoomed profiles). The longitudinal profile of VLM rates along the selected road segment reveals spatially continuous settlement, ranging between −5.4 mm/year and −1.2 mm/year (Figure 9a). Time-series displacements at representative sites (bʹ,cʹ,dʹ) demonstrate strong linear subsidence trends between 2017 and 2023, consistent with secondary compression and consolidation of marine-reclaimed deposits (Figure 9b–d).
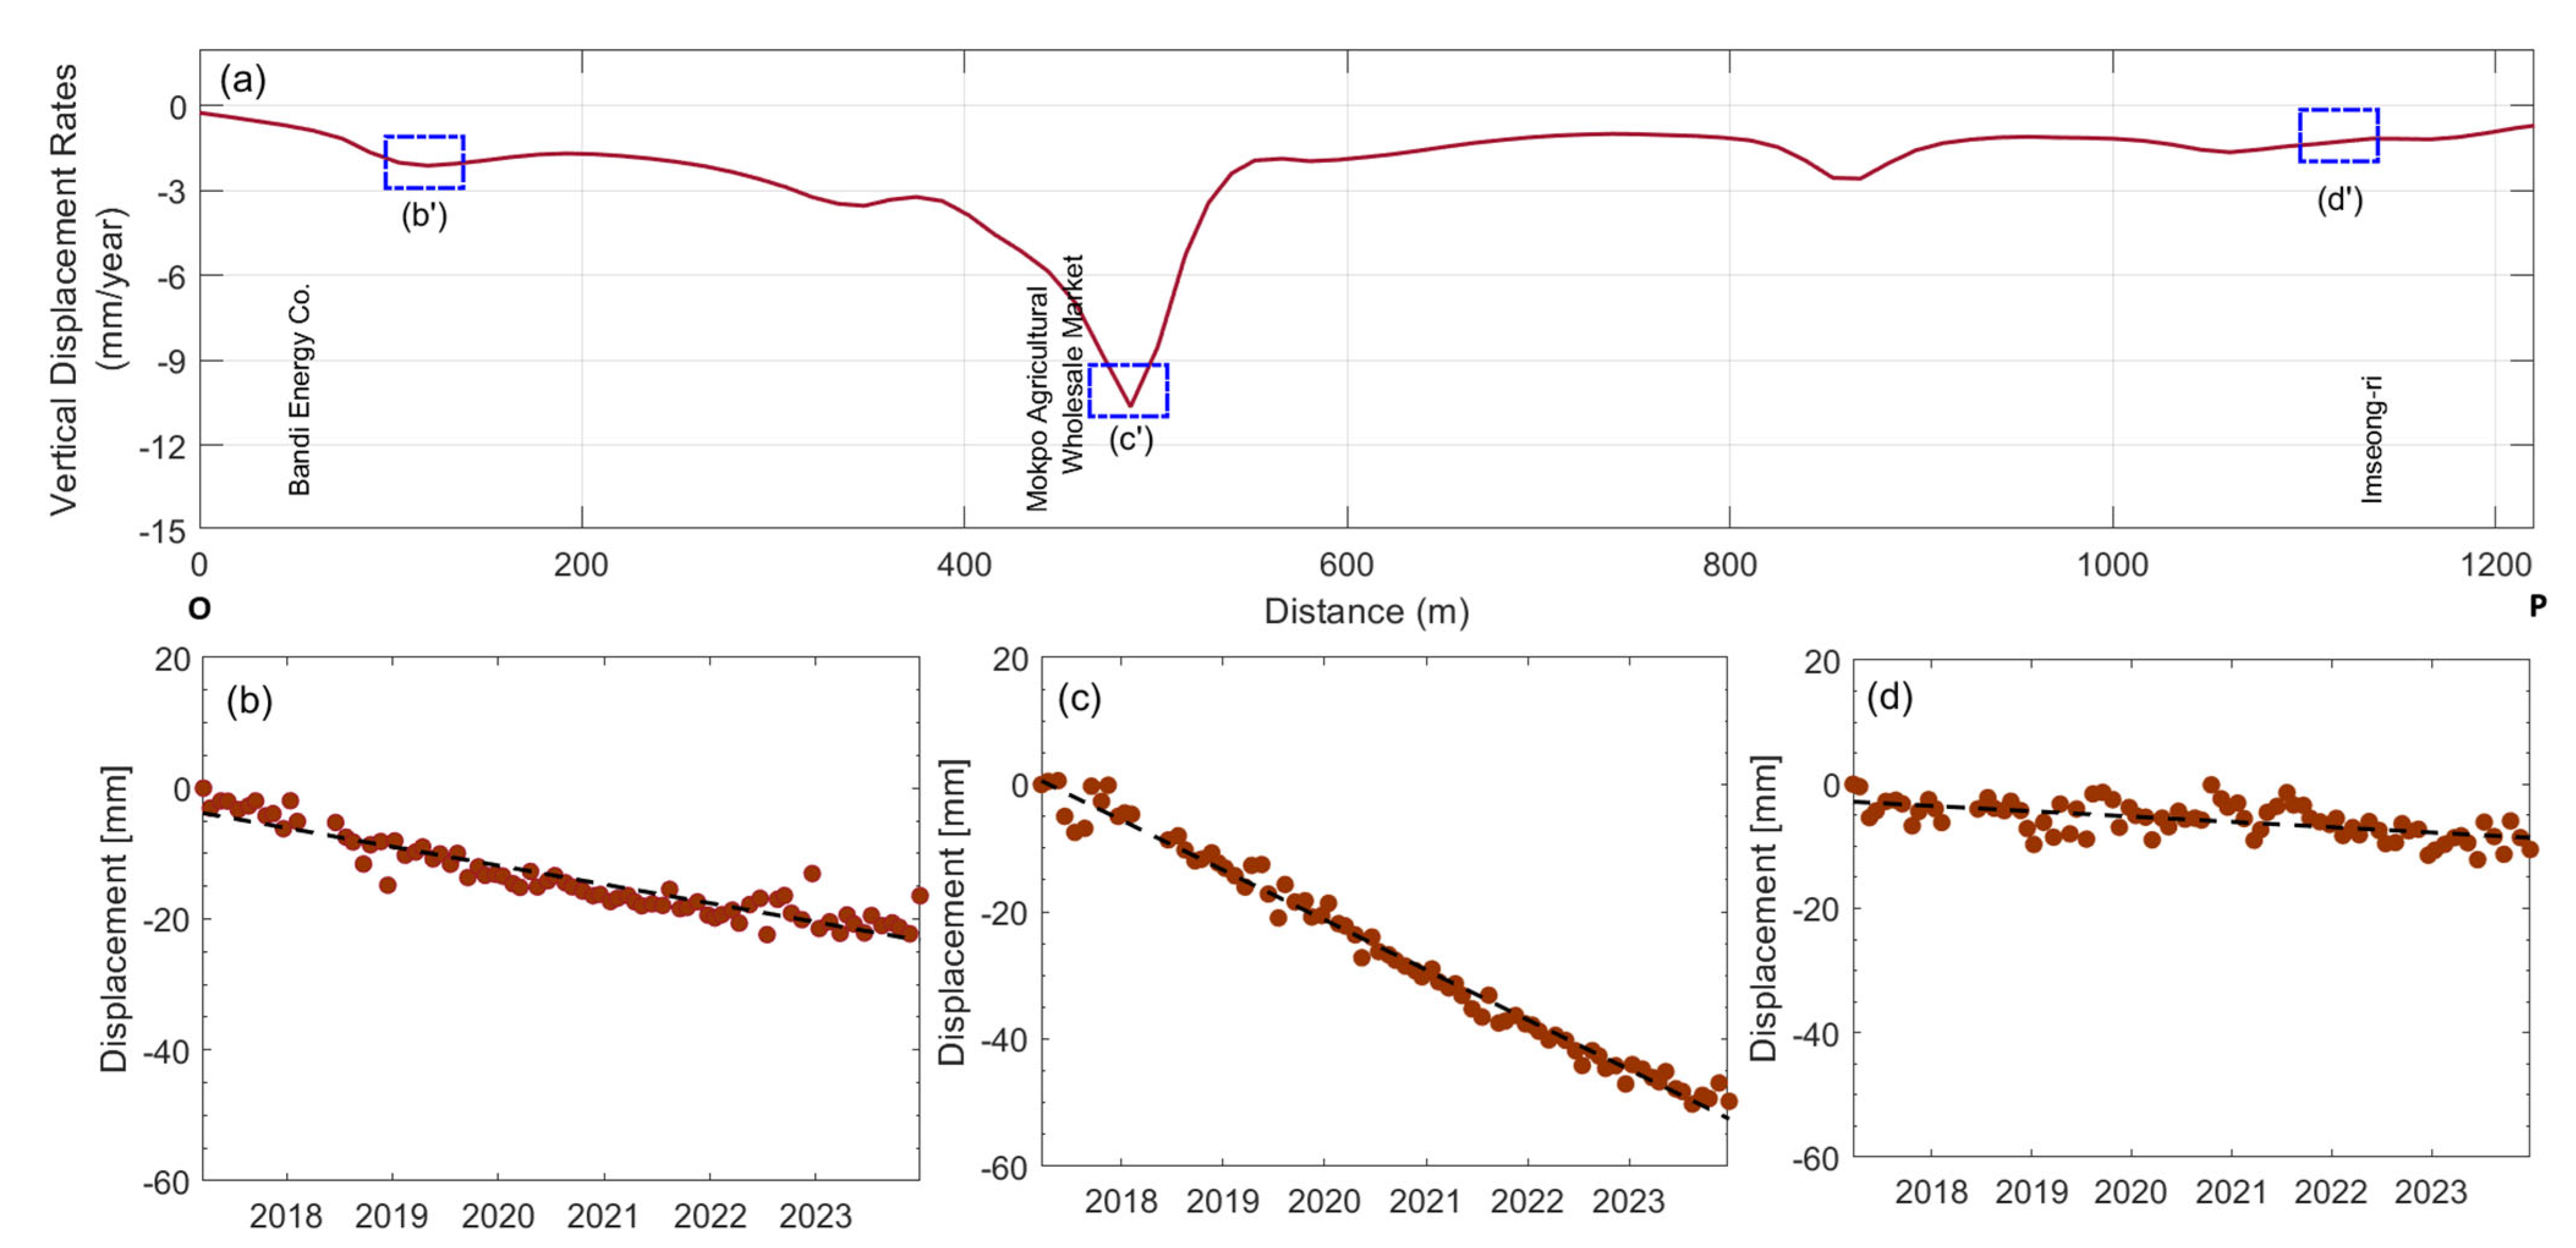
The longitudinal settlement velocity profile along the selected railway track segment (OP, marked in Figure 7b) reveals notable spatial variations in ground settlements. The middle part of the cross-section exhibits significant subsidence, with a maximum settlement rate of −10.64 mm/year, as depicted in Figure 10a. This deformation is likely linked to the presence of unconsolidated sediments from historical land reclamation (Figure 1b), which induces differential settlement. Temporal displacement records reveal consistent settlement trends in the eastern section, while the middle and western sections exhibit substantial subsidence (Figure 10b–d). Such differential deformation poses significant risks to track geometry and long-term serviceability.
These findings are consistent with earlier studies (e.g., [26,31,70,71]), which documented extensive subsidence in Mokpo’s reclaimed zones (Wonsan, Dongmyung, and Hadang) between 1992 and 2012. The extended InSAR time series (2017–2023) presented here confirms that decades-old reclamation sites continue to undergo consolidation-driven settlement, emphasizing the urgent need for continuous monitoring and proactive stabilization measures to safeguard the reliability of transportation infrastructure in Mokpo.

4.5. Hyperbolic Model-Based Nonlinear Settlement Forecasting

To capture the nonlinear settlement behavior associated with consolidation-driven subsidence, we applied a hyperbolic model to forecast ground displacement at four representative infrastructure monitoring sites (PS01–PS04; locations shown in Figure 7a). The hyperbolic model is widely recognized for characterizing primary and secondary consolidation processes in soft soils, offering improved long-term settlement predictions compared to linear extrapolation approaches [25,94,98]. Figure 11 presents the nonlinear settlement forecasting at four representative PS-InSAR monitoring sites (PS01–PS04) along vulnerable transportation corridors in Mokpo’s reclaimed zones. The observed displacement time series from 2017 to 2023 exhibits strong subsidence trends, which are well captured by the hyperbolic model fits. The regression analysis (Figure 11a–d) confirms high model reliability, with determination coefficients (R2) ranging from 0.94 to 0.98 and low RMSE values (1.46–2.53 mm), suggesting that the hyperbolic formulation reliably characterizes the consolidation-induced settlement process. It was observed that PS01 and PS03 exhibit relatively gradual, continuous settlement trends, reflecting ongoing secondary compression of underlying marine clays. In contrast, PS02 and PS04 show accelerated subsidence rates with stronger nonlinear terms, indicating zones of more rapid deformation and higher risk of localized failure. These spatial variations underscore the heterogeneity of consolidation behavior across reclaimed lands, influenced by differences in reclamation history, fill material, and drainage conditions. The forward projections to 2030 reveal continued subsidence across reclaimed land in Mokpo, with differential settlement persisting along critical road and railway corridors. These findings confirm that secondary compression of unconsolidated marine sediments remains active decades after reclamation, posing long-term risks for linear infrastructure integrity. Historical studies, such as Kim et al. [70], which employed hyperbolic modeling of JERS-1 (1992–1998, 22 interferometric pairs) and ENVISAT (2004–2005, 6 interferometric pairs) SAR datasets, similarly reported widespread subsidence in Mokpo’s reclaimed districts (Wonsan, Dongmyung, and Hadang). The extended PS-InSAR time series analysis (2017–2023) presented here corroborates those results, underscoring the persistent consolidation behavior of reclaimed zones and reinforcing the urgent need for sustained geotechnical monitoring, targeted ground improvement, and adaptive infrastructure management strategies to mitigate serviceability risks.

5. Discussion

The multi-temporal PSInSAR analysis of Sentinel-1 data from 2017 to 2023 provides new insights into the long-term consolidation-driven settlement in Mokpo’s reclaimed coastal zones, confirming both the persistence and spatial variability of VLM. The results revealed that approximately 50.7% of PSs in reclaimed zones exhibit significant subsidence with VLM rates ranging between −12.36 and 5.65 mm/year (Figure 4a), corroborating earlier observations (e.g., [26,31,70,71]) that these sediments remain prone to post-reclamation settlement even after multiple decades. This persistence is primarily attributed to ongoing secondary compression of soft marine clays and incomplete pore pressure dissipation, a mechanism well documented in coastal geotechnical literature [3]. These findings indicate that the observed deformation is not transient but represents the continuation of slow, time-dependent consolidation processes within the underlying soft deposits.
To better understand the geotechnical controls on these VLM patterns, PSInSAR-derived VLM results were integrated with subsurface geotechnical datasets, providing a mechanistic understanding of the observed settlement processes in Mokpo’s reclaimed areas. The representative borehole lithology and SPT-N profiles reveal a stratigraphic sequence of heterogeneous reclamation fill (0–5 m, typically N > 10) overlying thick, soft marine clay layers (N < 5) extending to depths of 9–17 m (Figure 2a,b). These deeper deposits exhibit very low strength and high compressibility, consistent with ongoing consolidation under sustained surcharge loading. Casagrande plasticity analyses further corroborate this interpretation: soils at depths greater than 5 m are dominated by CH-type clays (LL > 50%, PI > 25%), indicating high-plasticity, low-permeability materials with slow pore pressure dissipation, while shallower soils (<5 m) primarily consist of low- to medium-plasticity ML–CL materials (LL < 50%), corresponding to compacted fill or desiccated silty clays with relatively low compressibility (Figure 2c,d). The spatial correspondence between low SPT-N values, high LL-PI indices, and maximum PSInSAR-detected ground subsidence zones confirms that plasticity-controlled compressibility governs long-term settlement behavior. These CH-type clays undergo gradual primary and secondary consolidation due to low permeability and delayed pore pressure dissipation, resulting in persistent subsidence that continues decades after reclamation. Further, the correlation between low Vs30 values (<180–360 m/s) and higher subsidence rates (Figure 5b) supports the role of low-stiffness strata in controlling deformation. These observations indicate that the measured VLM reflects the soil mechanical response of high-plasticity marine clays undergoing progressive consolidation and creep under increased effective stress. These conditions imply that long-term settlement will persist for decades, particularly where surcharge loads from roads and railways continue to increase. Therefore, the integration of PSInSAR-derived ground settlement trends with classical soil mechanics parameters, lithology, Atterberg limits, SPT resistance, and stiffness demonstrates that persistent subsidence in Mokpo’s reclaimed zones is driven by time-dependent consolidation of thick, under-consolidated marine clays. The findings thus establish a physically consistent linkage between geotechnical behavior and remote-sensing observations, providing a robust, process-based framework for diagnosing infrastructure vulnerability in reclaimed coastal environments.
We further performed a comparative analysis of Mokpo’s settlement behavior with other reclaimed and coastal megacities globally to understand the broader international contexts. The observed PSInSAR-derived median subsidence rate in Mokpo’s reclaimed zone (−0.29 mm/year, 16th–84th percentile: −2.04 to +0.53 mm/year) is relatively low compared to major global hotspots such as Jakarta (−4.43 mm/year), Shanghai (−2.5 mm/year), and Ho Chi Minh City (−16.23 mm/year), where rapid subsidence is primarily attributed to excessive groundwater extraction, compression of thick Holocene clays, and intense urban loading [9]. In contrast, Mokpo’s moderate VLM rates reflect consolidation of soft marine clays following reclamation rather than active anthropogenic drawdown. Nonetheless, the persistence of low-magnitude but progressive settlement poses a long-term risk for infrastructure serviceability, similar to cases reported in other reclaimed coastal cities such as Singapore, Osaka, and Miami (Table S2, Supplementary Materials). Thus, Mokpo represents an intermediate case between rapid anthropogenic subsidence and slow natural consolidation, highlighting valuable insights into long-term post-reclamation settlement dynamics.
To quantify the practical implications of these findings, we conducted an infrastructure vulnerability assessment focused on transport corridors (i.e., major roads and railways), the lifelines most sensitive to differential settlement. The infrastructure vulnerability assessment confirms that subsidence disproportionately affects critical transport corridors. Within the 50 m buffer along major roads and railways, 54.3% of PSs showed settlement at an average of −1.50 mm/year (Figure 7a). The clustering of low values identified through Anselin Local Moran’s I indicates localized zones of structural fragility where differential settlement may compromise pavement integrity and track alignment (Figure 7b). Longitudinal deformation profiles revealed continuous settlement along road and railway alignments, with peak subsidence rates up to −10.64 mm/year, highlighting serviceability concerns in transport geotechnics (Figure 9 and Figure 10). Such deformation patterns suggest that the risk is not limited to isolated hot spots but rather extends across entire reclaimed corridors, requiring systematic rather than localized mitigation strategies.
To further understand the temporal evolution of these processes, a hyperbolic settlement forecasting model was applied to representative PS time series (PS01–PS04). The model achieved strong agreement with observed data (R2 = 0.94–0.98; RMSE = 1.46–2.53 mm) (Figure 11), highlighting its reliability in simulating nonlinear consolidation processes. Projections to 2030 indicate persistent, albeit decelerating, subsidence, with cumulative displacements expected to exceed −80 mm at vulnerable sites. This finding aligns with the theoretical expectation that secondary compression follows a hyperbolic decay rather than abrupt cessation, signifying that settlement hazards will remain relevant for decades. Comparable applications of hyperbolic modeling in coastal reclamation zones (e.g., [2,25,70,96]) confirm its predictive suitability. In the present study, we extend these insights by linking predictive settlement patterns directly to infrastructure risk.
However, a critical methodological challenge of PSInSAR is the lack of in situ benchmarks for absolute validation. While GNSS or leveling data were unavailable, proxy-based validation against lithostratigraphy, soil stiffness profiles, and groundwater conditions indicates strong agreement between expected geotechnical behavior and InSAR-derived VLM fields. This multi-proxy validation enhances confidence in the derived VLM fields, though future monitoring should integrate GNSS-InSAR observations for absolute cross-verification. Subsequently, we propose the installation of permanent GPS stations and/or periodic levelling surveys to obtain independent ground-truth data and further strengthen the robustness of the PSInSAR-derived VLM results. Additionally, integrating geophysical investigations such as seismic, resistivity, or GPR profiling would enable finer resolution of subsurface heterogeneity, strengthening the soil-mechanics interpretation of settlement. Uncertainties also arise from PS density variability in vegetated or newly developed areas, where decorrelation may obscure localized deformation. Additionally, the assumption of spatially homogeneous consolidation parameters in hyperbolic modeling may oversimplify site-specific variations in soil composition and loading history.
The integrated interpretation of geotechnical and InSAR data highlights the systemic vulnerability of linear infrastructure constructed on decades-old reclaimed land in the Mokpo region. Subsidence-related risks will likely manifest as differential settlement, causing pavement cracking, track misalignment, and drainage inefficiencies. Accordingly, mitigation should combine both pre- and post-construction strategies. Preventive measures such as prefabricated vertical drains, staged surcharge preloading, vibro-replacement, and deep soil mixing can accelerate pore pressure dissipation and enhance bearing capacity. For post-construction mitigation, lightweight embankment materials, ground anchors, and underpinning of foundations may help offset differential settlement in transport corridors and built-up areas. For existing linear infrastructure, remedial measures such as underpinning, installation of ground anchors, and periodic re-leveling may be employed to maintain structural performance. These actions should be prioritized along critical corridors identified through deformation hotspot mapping. Moreover, continuous monitoring through PSInSAR integrated with GNSS, leveling, and piezometric networks is essential for early detection of secondary consolidation and creep, forming the foundation of proactive infrastructure management. In the future study, we will enhance predictive capability and risk quantification by integrating multi-orbit InSAR data for 3D velocity decomposition, coupling deformation signals with in situ geotechnical data, and leveraging machine learning models. Embedding such forecasts into risk-based infrastructure management frameworks will be critical for safeguarding transportation resilience under both anthropogenic and climate-driven pressures, thereby advancing sustainable coastal urban development.
Furthermore, the PSInSAR-derived VLM database developed in this study has broader applications. In future work, we plan to utilized this dataset to support flood inundation projections under different IPCC SSP scenarios and to explore its integration with ecosystem-based resilience strategies (as recommended by studies such as [99,100]), thereby linking geotechnical monitoring with coastal ecosystem protection and sustainable urban planning. This will enable more comprehensive evaluations of water regulation, flood protection, shoreline stabilization, habitat preservation and climate-change resilience, alongside urban infrastructure vulnerability, supporting a dual strategy of infrastructure reinforcement and ecosystem-based adaptation. Therefore, integrating geotechnical monitoring with ecosystem-informed urban planning reconceptualizes land subsidence as both a geotechnical and sustainability challenge, enhancing the robustness and applicability of urban adaptation strategies in reclaimed coastal environments.

6. Conclusions

In the present study, we applied multi-temporal Sentinel-1 PSInSAR analysis (2017–2023) to quantify VLM and associated risks to transportation infrastructure in Mokpo’s reclaimed coastal zones. The results indicate cumulative subsidence up to −83.65 mm, with VLM rates ranging from −12.36 mm/year to 5.65 mm/year, affecting approximately 50.7% of PSs, particularly in Hadang, Dongmyung, and Wonsan regions. These findings are consistent with prior geodetic and geotechnical observations [26,70], confirming that even decades-old reclamation fills remain subject to secondary consolidation of soft marine clays. Integration with borehole lithology, SPT-N profiles, and Atterberg limits confirms that the ongoing settlement results from consolidation and creep of thick, soft marine clays (N < 5, LL > 50%, CH-type), overlain by compacted fill layers (N > 10). The correlation between low stiffness (Vs30 < 360 m/s) and high deformation rates demonstrates that plasticity-controlled compressibility and delayed pore-pressure dissipation govern the observed VLM. This integrated geotechnical-remote sensing framework therefore provides a mechanistic explanation linking observed VLM to the consolidation characteristics of the subsurface strata.
Vulnerability assessment of transportation infrastructure exhibited 54.3% of PSs undergone subsidence with an average settlement of −1.50 mm/year along roads and railways within a 50 m buffer. Spatial clustering patterns derived from Anselin Local Moran’s I highlight that the low clusters and low outliers correspond to the most critical long-term infrastructure-stability zones. Longitudinal settlement profiles along selected road and railway alignments confirmed spatially continuous deformation, with maximum settlement rates reaching −10.64 mm/year, highlighting the persistent consolidation of soft marine sediments even decades after reclamation. To forecast future settlement behavior, a hyperbolic model was fitted to representative PS time series (PS01–PS04), showing strong agreement with observed data, reinforcing its suitability for nonlinear consolidation processes. Projections to 2030 indicate persistent yet decelerating subsidence, with cumulative displacements exceeding −80 mm at critical locations, underscoring the systemic vulnerability of Mokpo’s transport networks. Despite the absence of direct GNSS or leveling benchmarks, proxy-based validation using lithostratigraphic records, soil stiffness data, and groundwater conditions supports the robustness of the InSAR-derived results. The findings underscore that Mokpo’s reclaimed zones remain geotechnically unstable, posing systemic risks to transportation infrastructure due to differential settlement.
To ensure the sustainable management of reclaimed urban areas, a multi-phased strategy is proposed: (a) in the short term, maintain continued PSInSAR monitoring and install permanent GNSS stations for high-precision ground-truth validation and safeguard long-term serviceability, (b) in the medium term, implement targeted geotechnical and structural mitigation, such as reinforcing critical transportation corridors, applying ground improvement techniques (e.g., soil stabilization, structural reinforcement of transport corridors, deep mixing, preloading, Piled-Raft Systems (PRSs)), and designing flexible pavements to accommodate residual settlement, and (c) in the long term, adopt ecosystem-based approaches, including the protection and restoration of coastal wetlands, to enhance natural resilience against sea-level rise and climate change. This synergistic approach leverages Hybrid Green–Grey Infrastructure [101] to move beyond temporary engineering fixes, establishing a sustainable, multidisciplinary framework that maximizes long-term viability against both geotechnical/geophysical and climate-driven hazards. This prioritization highlights a practical roadmap for urban planners and engineers, ensuring that the findings directly support sustainable infrastructure management in Mokpo and other vulnerable coastal cities.

Supplementary Materials

The following supporting information can be downloaded at: https://www.mdpi.com/article/10.3390/buildings15213865/s1, Figure S1: Histogram of VLM rate distribution along transportation corridors in Mokpo City; Table S1: Key statistics of PSInSAR-derived subsidence in major reclaimed districts of Mokpo; Table S2: Comparison of median VLM rates in Mokpo reclaimed regions with selected reclaimed coastal cities worldwide.

Author Contributions

Conceptualization, W.J., M.D.A., and S.-G.Y.; Methodology, M.-S.S., M.D.A., and S.-G.Y.; Software, M.D.A.; Validation, W.J. and M.D.A.; Formal analysis, M.D.A.; Investigation, W.J., M.D.A., and S.-G.Y.; Resources, W.J., M.-S.S., M.D.A., and S.-G.Y.; Writing—original draft, M.D.A.; Writing—review & editing, W.J., M.-S.S., M.D.A., and S.-G.Y.; Visualization, M.-S.S., M.D.A., and S.-G.Y.; Supervision, S.-G.Y.; Project administration, S.-G.Y.; Funding acquisition, S.-G.Y. All authors have read and agreed to the published version of the manuscript.

Funding

This research was supported by the Regional Innovation System & Education (RISE) program through the Gangwon RISE Center, funded by the Ministry of Education (MOE) and the Gangwon State (G.S.), Republic of Korea (2025-RISE-10-004).

Data Availability Statement

The original contributions presented in this study are included in the article/Supplementary Material. Further inquiries can be directed to the corresponding authors.

Acknowledgments

The authors gratefully acknowledge the SARPROZ team (https://www.sarproz.com/, accessed on 20 September 2023) for providing an evaluation license of the MT-InSAR processing program upon request. The authors are also deeply grateful to the anonymous reviewers and editors for their insightful comments and valuable suggestions, which have significantly enhanced the scientific rigor, coherence, and presentation of the initial draft.

Conflicts of Interest

The authors declare no conflict of interest.

References

  1. Li, M.G.; Chen, J.J.; Xu, Y.S.; Tong, D.G.; Cao, W.W.; Shi, Y.J. Effects of groundwater exploitation and recharge on land subsidence and infrastructure settlement patterns in Shanghai. Eng. Geol. 2021, 282, 105995. [Google Scholar] [CrossRef]
  2. Ramirez, R.A.; Kwon, T.H. Sentinel-1 persistent scatterer interferometric synthetic aperture radar (PS-InSAR) for long-term remote monitoring of ground subsidence: A case study of a port in Busan, South Korea. KSCE J. Civ. Eng. 2022, 26, 4317–4329. [Google Scholar] [CrossRef]
  3. Zanjani, F.A.; Amelung, F.; Piter, A.; Sobhan, K.; Tavakkoliestahbanati, A.; Eberli, G.P.; Haghighi, M.H.; Motagh, M.; Milillo, P.; Mirzaee, S.; et al. Insar observations of construction-induced coastal subsidence on Miami’s barrier islands, Florida. Earth Space Sci. 2024, 11, e2024EA003852. [Google Scholar] [CrossRef]
  4. Lee, H.; Kim, S.-J.; Kang, B.-H.; Lee, K.-S. Long-term settlement prediction of ground reinforcement foundation using a deep cement mixing method in reclaimed land. Buildings 2022, 12, 1279. [Google Scholar] [CrossRef]
  5. Zhang, B.; Liao, X.; Zhang, J.; Xiong, S.; Wang, C.; Wu, S.; Zhu, C.; Zhu, J.; Qin, X.; Li, Q. Megalopolitan-scale ground deformation along metro lines in the Guangdong-Hong Kong-Macao Greater Bay Area, China, revealed by MT-InSAR. Int. J. Appl. Earth Obs. Geoinf. 2023, 122, 103432. [Google Scholar] [CrossRef]
  6. Ohenhen, L.O.; Zhai, G.; Lucy, J.; Werth, S.; Carlson, G.; Khorrami, M.; Shirzaei, M. Land subsidence risk to infrastructure in US metropolises. Nat. Cities 2025, 2, 543–554. [Google Scholar] [CrossRef]
  7. Yang, X.; Wu, H.; Zhou, S.; Guo, D.; Chen, R. Land subsidence in coastal reclamation with impact on metro operation under rapid urbanization: A case study of Shenzhen. Sci. Total Environ. 2025, 970, 179020. [Google Scholar] [CrossRef] [PubMed]
  8. Wu, P.C.; Wei, M.; D’Hondt, S. Subsidence in coastal cities throughout the world observed by InSAR. Geophys. Res. Lett. 2022, 49, e2022GL098477. [Google Scholar] [CrossRef]
  9. Tay, C.; Lindsey, E.O.; Chin, S.T.; McCaughey, J.W.; Bekaert, D.; Nguyen, M.; Hill, E.M. Sea-level rise from land subsidence in major coastal cities. Nat. Sustain. 2022, 5, 1049–1057. [Google Scholar] [CrossRef]
  10. Shirzaei, M.; Freymueller, J.; Törnqvist, T.E.; Galloway, D.L.; Dura, T.; Minderhoud, P.S. Measuring, modelling and projecting coastal land subsidence. Nat. Rev. Earth Environ. 2021, 2, 40–58. [Google Scholar] [CrossRef]
  11. Herrera-García, G.; Ezquerro, P.; Tomás, R.; Béjar-Pizarro, M.; López-Vinielles, J.; Rossi, M.; Ye, S. Mapping the global threat of land subsidence. Science 2021, 371, 34–36. [Google Scholar] [CrossRef]
  12. Erkens, G.; Bucx, T.; Dam, R.; De Lange, G.; Lambert, J. Sinking coastal cities. Proc. Int. Assoc. Hydrol. Sci. 2015, 372, 189–198. [Google Scholar] [CrossRef]
  13. Chaussard, E.; Amelung, F.; Abidin, H.; Hong, S.H. Sinking cities in Indonesia: ALOS PALSAR detects rapid subsidence due to groundwater and gas extraction. Remote Sens. Environ. 2013, 128, 150–161. [Google Scholar] [CrossRef]
  14. Indraratna, B.; Rujikiatkamjorn, C.; Balasubramaniam, A.S. Consolidation of Estuarine Marine Clays for Coastal Reclamation Using Vacuum and Surcharge Loading. In From Soil Behavior Fundamentals to Innovations in Geotechnical Engineering: Honoring Roy E. Olson; ASCE: Reston, VA, USA, 2014; pp. 358–369. [Google Scholar] [CrossRef]
  15. Lam, Y.C.; Ganendra, D.; Prasad, K. Land reclamation & soil improvement works for a coal-fired power plant in Malaysia. Jpn. Geotech. Soc. Spec. Publ. 2016, 2, 1767–1772. [Google Scholar] [CrossRef]
  16. Leung, C.F.; Wong, J.C.; Manivanann, R.; Tan, S.A. Experimental evaluation of consolidation behavior of stiff clay lumps in reclamation fill. Geotech. Test. J. 2001, 24, 145–156. [Google Scholar] [CrossRef]
  17. Park, K.; Kim, Y.J.; Chen, J.; Nam, B.H. InSAR-based investigation of ground subsidence due to excavation: A case study of Incheon City, South Korea. Int. J. Geo-Eng. 2024, 15, 26. [Google Scholar] [CrossRef]
  18. Thilakarathne, T.; Vidurapriya, K.; Thilakasiri, H. Computational Approach for Determining the Variation of Coefficient of Secondary Compression in Secondary Settlement Prediction of Soft Soils. In Proceedings of the SLIIT International Conference on Engineering and Technology, Malabe, Sri Lanka, 25 March 2023; Available online: https://rda.sliit.lk/handle/123456789/3580 (accessed on 28 September 2025).
  19. Mesri, G.; Godlewski, P.M. Time-and stress-compressibility interrelationship. J. Geotech. Eng. Div. 1977, 103, 417–430. [Google Scholar] [CrossRef]
  20. Madhav, M.; Ramu, K. Modeling and analysis of reclamation process. Int. J. Geotech. Eng. 2009, 3, 535–551. [Google Scholar] [CrossRef]
  21. Bo, M.W.; Choa, V.; Hong, K.H. Material characterization of Singapore Marine Clayat Changi. Q. J. Eng. Geol. Hydrogeol. 2003, 36, 305–319. [Google Scholar] [CrossRef]
  22. Karademir, T.; Dışkaya, B. Composite Sand–Clay Infrastructural Soil Fills: Characteristic Consolidation and Hydraulic Properties. J. Adv. Res. Nat. Appl. Sci. 2024, 10, 640–658. [Google Scholar] [CrossRef]
  23. Mitchell, J.K.; Soga, K. Fundamentals of Soil Behavior, 3rd ed.; John Wiley & Sons: Hoboken, NJ, USA, 2005. [Google Scholar]
  24. Shi, C.; Wang, Y. Assessment of reclamation-induced consolidation settlement considering stratigraphic uncertainty and spatial variability of soil properties. Can. Geotech. J. 2022, 59, 1215–1230. [Google Scholar] [CrossRef]
  25. Park, S.W.; Hong, S.H. Nonlinear modeling of subsidence from a decade of InSAR time series. Geophys. Res. Lett. 2021, 48, e2020GL090970. [Google Scholar] [CrossRef]
  26. Kim, S.W.; Wdowinski, S.; Dixon, T.H.; Amelung, F.; Won, J.S.; Kim, J.W. InSAR-based mapping of surface subsidence in Mokpo City, Korea, using JERS-1 and ENVISAT SAR data. Earth Planets Space 2008, 60, 453–461. [Google Scholar] [CrossRef]
  27. Nur, A.S.; Achmad, A.R.; Lee, C.W. Land subsidence measurement in reclaimed coastal land: Noksan using C-band sentinel-1 radar interferometry. J. Coast. Res. 2020, 102, 218–223. [Google Scholar] [CrossRef]
  28. Kim, J.S.; Kim, D.J.; Kim, S.W.; Won, J.S.; Moon, W.M. Monitoring of urban land surface subsidence using PSInSAR. Geosci. J. 2007, 11, 59–73. [Google Scholar] [CrossRef]
  29. Hong, S.H. Monitoring Time-Series Subsidence Observation in Incheon Using X-Band COSMO-SkyMed Synthetic Aperture Radar. Korean J. Remote Sens. 2024, 40, 141–150. [Google Scholar] [CrossRef]
  30. Sengupta, D.; Chen, R.; Meadows, M.E.; Banerjee, A. Gaining or losing ground? Tracking Asia’s hunger for ‘new’coastal land in the era of sea level rise. Sci. Total Environ. 2020, 732, 139290. [Google Scholar] [CrossRef]
  31. Kim, S.W.; Kim, C.O.; Won, J.S.; Kim, J.W. Measurement of Ground Subsidence in Mokpo Area from Radar Intrerferometry. Econ. Environ. Geol. 2005, 38, 381–394. Available online: https://www.kseeg.org/journal/view.html?uid=459 (accessed on 28 September 2025).
  32. Adhikari, M.D.; Park, S.; Yum, S.G. Coastal vulnerability to extreme weather events: An integrated analysis of erosion, sediment movement, and land subsidence based on multi-temporal optical and SAR satellite data. J. Environ. Manag. 2025, 374, 124025. [Google Scholar] [CrossRef]
  33. Lee, K.; Nam, J.; Park, J.; Hong, G. Numerical Analysis of Factors Influencing the Ground Surface Settlement above a Cavity. Materials 2022, 15, 8301. [Google Scholar] [CrossRef]
  34. Oh, D.W.; Kong, S.M.; Lee, D.Y.; Yoo, Y.S.; Lee, Y.J. Effects of Reinforced Pseudo-Plastic Backfill on the Behavior of Ground around Cavity Developed due to Sewer Leakage. J. Korean Geoenvironmental Soc. 2015, 16, 13–22. [Google Scholar] [CrossRef]
  35. Jeon, S.S.; Park, Y.K.; Eum, K.Y. Stability assessment of roadbed affected by ground subsidence adjacent to urban railways. Nat. Hazards Earth Syst. Sci. 2018, 18, 2261–2271. [Google Scholar] [CrossRef]
  36. Chen, H.; Liang, D. Roadbed Subsidence Mechanisms under the Driven of Penetration-Soak Coupling. J. Geosci. Environ. Prot. 2017, 5, 97–106. [Google Scholar] [CrossRef]
  37. Zhang, Y.; Jiao, Y.Y.; He, L.L.; Tan, F.; Zhu, H.M.; Wei, H.L.; Zhang, Q.B. Susceptibility mapping and risk assessment of urban sinkholes based on grey system theory. Tunn. Undergr. Space Technol. 2024, 152, 105893. [Google Scholar] [CrossRef]
  38. Zhao, D.; Yao, H.; Gu, X. Highway deformation monitoring by multiple InSAR technology. Sensors 2024, 24, 2988. [Google Scholar] [CrossRef] [PubMed]
  39. Lomibao, A.L.; Leal, G.A.; Mabaquiao, L.C.; Reyes, R.B. Ground deformation monitoring of reclaimed lands along manila bay freeport zone using PS-InSAR technique. Int. Arch. Photogramm. Remote Sens. Spat. Inf. Sci. 2024, 48, 335–342. [Google Scholar] [CrossRef]
  40. Bai, M.; Qi, Y.; Song, L.; Wang, Q.; Zhang, Z.; Tian, G. Research on real-time monitoring and early warning of Tangshan road surface subsidence based on InSAR. Adv. Space Res. 2025, 75, 4408–4430. [Google Scholar] [CrossRef]
  41. Orellana, F.; Delgado Blasco, J.M.; Foumelis, M.; D’aranno, P.J.; Marsella, M.A.; Di Mascio, P. Dinsar for road infrastructure monitoring: Case study highway network of Rome metropolitan (Italy). Remote Sens. 2020, 12, 3697. [Google Scholar] [CrossRef]
  42. Zhang, J.; Ke, C.; Shen, X.; Lin, J.; Wang, R. Monitoring land subsidence along the subways in Shanghai on the basis of time-series InSAR. Remote Sens. 2023, 15, 908. [Google Scholar] [CrossRef]
  43. Lyu, M.; Ke, Y.; Li, X.; Zhu, L.; Guo, L.; Gong, H. Detection of seasonal deformation of highway overpasses using the PS-InSAR technique: A case study in Beijing urban area. Remote Sens. 2020, 12, 3071. [Google Scholar] [CrossRef]
  44. Shi, X.; Niu, F.; Qu, T.; Zhang, H.; Jiang, M.; Jiang, H.; Wang, X. Stability analysis of Shiwei-Labudalin highway in inner mongolia, Northeastern China using sentinel-1 InSAR. Cold Reg. Sci. Technol. 2022, 202, 103647. [Google Scholar] [CrossRef]
  45. Liu, H.; Huang, S.; Xie, C.; Tian, B.; Chen, M.; Chang, Z. Monitoring Roadbed stability in permafrost area of Qinghai–Tibet railway by MT-InSAR technology. Land 2023, 12, 474. [Google Scholar] [CrossRef]
  46. Wang, R.; Yang, T.; Yang, M.; Liao, M.; Lin, J. A safety analysis of elevated highways in Shanghai linked to dynamic load using long-term time-series of InSAR stacks. Remote Sens. Lett. 2019, 10, 1133–1142. [Google Scholar] [CrossRef]
  47. Dai, K.; Liu, G.; Li, Z.; Ma, D.; Wang, X.; Zhang, B.; Li, G. Monitoring highway stability in permafrost regions with X-band temporary scatterers stacking InSAR. Sensors 2018, 18, 1876. [Google Scholar] [CrossRef] [PubMed]
  48. Azadnejad, S.; Hrysiewicz, A.; Trafford, A.; O’Loughlin, F.; Holohan, E.; Kelly, F.; Donohue, S. InSAR supported by geophysical and geotechnical information constrains two-dimensional motion of a railway embankment constructed on peat. Eng. Geol. 2024, 333, 107493. [Google Scholar] [CrossRef]
  49. Fadhillah, M.F.; Achmad, A.R.; Lee, C.W. Integration of InSAR time-series data and GIS to assess land subsidence along subway lines in the Seoul metropolitan area, South Korea. Remote Sens. 2020, 12, 3505. [Google Scholar] [CrossRef]
  50. Guo, F.; Lyu, M.; Li, X.; Jiang, J.; Wang, L.; Guo, L.; Wang, F. Deformation Monitoring Along Beijing Metro Line 22 Using PS-InSAR Technology. Land 2025, 14, 1098. [Google Scholar] [CrossRef]
  51. Tao, R.; Lau, A.; Mossefin, M.E.; Kong, G.; Nordal, S.; Pan, Y. Monitoring of ground displacement-induced railway anomalies using PS-InSAR techniques. Measurement 2025, 248, 116863. [Google Scholar] [CrossRef]
  52. Wang, R.; Yang, M.; Dong, J.; Liao, M. Investigating deformation along metro lines in coastal cities considering different structures with InSAR and SBM analyses. Int. J. Appl. Earth Obs. Geoinf. 2022, 115, 103099. [Google Scholar] [CrossRef]
  53. Xu, X.; Zhao, D.; Ma, C.; Lian, D. Monitoring subsidence deformation of Suzhou subway using InSAR timeseries analysis. IEEE Access 2020, 9, 3400–3416. [Google Scholar] [CrossRef]
  54. Ramirez, R.A.; Lee, G.J.; Choi, S.K.; Kwon, T.H.; Kim, Y.C.; Ryu, H.H.; Kim, S.; Bae, B.; Hyun, C. Monitoring of construction-induced urban ground deformations using Sentinel-1 PS-InSAR: The case study of tunneling in Dangjin, Korea. Int. J. Appl. Earth Obs. Geoinf. 2022, 108, 102721. [Google Scholar] [CrossRef]
  55. Perissin, D.; Wang, Z.; Lin, H. Shanghai subway tunnels and highways monitoring through Cosmo-SkyMed Persistent Scatterers. ISPRS J. Photogramm. Remote Sens. 2012, 73, 58–67. [Google Scholar] [CrossRef]
  56. Karunathilake, A.; Ohashi, M.; Kaneta, S.; Chiba, T. Tunnel-induced land subsidence assessment in a densely populated residential area using Sentinel-1 PS-InSAR. Discov. Geosci. 2024, 2, 81. [Google Scholar] [CrossRef]
  57. Giardina, G.; Milillo, P.; DeJong, M.J.; Perissin, D.; Milillo, G. Evaluation of InSAR monitoring data for post-tunnelling settlement damage assessment. Struct. Control Health Monit. 2019, 26, e2285. [Google Scholar] [CrossRef]
  58. Bianchini Ciampoli, L.; Gagliardi, V.; Ferrante, C.; Calvi, A.; D’Amico, F.; Tosti, F. Displacement monitoring in airport runways by persistent scatterers SAR interferometry. Remote Sens. 2020, 12, 3564. [Google Scholar] [CrossRef]
  59. Shi, X.; Zhong, J.; Yin, Y.; Chen, Y.; Zhou, H.; Wang, M.; Dai, K. Integrating SBAS-InSAR and LSTM for subsidence monitoring and prediction at Hong Kong international airport. Ore Energy Resour. Geol. 2023, 15, 100032. [Google Scholar] [CrossRef]
  60. Wu, S.; Yang, Z.; Ding, X.; Zhang, B.; Zhang, L.; Lu, Z. Two decades of settlement of Hong Kong International Airport measured with multi-temporal InSAR. Remote Sens. Environ. 2020, 248, 111976. [Google Scholar] [CrossRef]
  61. Zhang, R.; Zhang, W.; Huang, W.; Ma, T.; Wang, Q.; Fang, K.; Wang, K. High-precision monitoring method for airport deformation based on time-series InSAR technology. Constr. Build. Mater. 2023, 366, 130144. [Google Scholar] [CrossRef]
  62. Xiong, S.-H.; Wang, Z.-P.; Li, G.; Skibniewski, M.J.; Chen, Z.-S. Prediction of airport runway settlement using an integrated SBAS-InSAR and BP-EnKF approach. Inf. Sci. 2024, 665, 120376. [Google Scholar] [CrossRef]
  63. Kim, W.; Hwang, S.; Han, H.; Park, B.; Yoo, W. Identification of Risk Zones During Infrastructure Construction and Maintenance Using Satellite SAR Data for Sustainable Urban Areas in South Korea. Sustainability 2024, 16, 10627. [Google Scholar] [CrossRef]
  64. Soeung, S.; Lee, S.-H.; Lee, S.J.; Kim, B.-J.; Yune, C.-Y. Causing factors of additional settlement in high-speed railways in Korea. KSCE J. Civ. Eng. 2018, 22, 3843–3851. [Google Scholar] [CrossRef]
  65. Park, H. Study for Application of Artificial Neural Networks in Geotechnical Problems. In Artificial Neural Networks—Application; IntechOpen: London, UK, 2011; pp. 303–336. [Google Scholar] [CrossRef]
  66. Lee, H.; Oh, J. Establishing an ANN-based risk model for ground subsidence along railways. Appl. Sci. 2018, 8, 1936. [Google Scholar] [CrossRef]
  67. Choi, E.K.; Kim, S.W.; Cho, J.W.; Lee, J.H. GIS-based subsidence hazard map in urban area. J. Korean Geotech. Soc. 2017, 33, 5–14. [Google Scholar] [CrossRef]
  68. Adhikari, M.D.; Kim, S.W.; Kim, H.J.; Tuganishuri, J.; Yum, S.G.; Kim, J. Monitoring Roadbed Stability to Prevent Cascading Hazards in Daejeon City, South Korea, Using Sentinel-1 SAR Data. In Proceedings of the International Conference on Construction Engineering and Project Management (ICCEPM 2024), Sapporo, Japan, 29 July–1 August 2024; Korea Institute of Construction Engineering and Management: Seoul, Republic of Korea, 2024; pp. 102–111. [Google Scholar] [CrossRef]
  69. Kim, B.K.; Lee, C.; Kim, W.; Yoo, M.; Lee, I. A Study on the D-InSAR Method for Micro-deformation Monitoring in Railway Facilities. J. Korean Geotech. Soc. 2022, 38, 43–54. [Google Scholar] [CrossRef]
  70. Kim, S.W.; Wdowinski, S.; Dixon, T.H.; Amelung, F.; Kim, J.W.; Won, J.S. Measurements and predictions of subsidence induced by soil consolidation using persistent scatterer InSAR and a hyperbolic model. Geophys. Res. Lett. 2010, 37, 1–5. [Google Scholar] [CrossRef]
  71. Kim, S.Y.; Bae, T.S.; Kim, S.W. Time Series Analysis with ALOS PALSAR images and GPS data: Detection of Ground Subsidence in the Mokpo Area using the SBAS Algorithm. J. Korean Soc. Surv. Geod. Photogramm. Cartogr. 2013, 31, 375–384. [Google Scholar] [CrossRef]
  72. Lee, Y. Coastal planning strategies for adaptation to sea level rise: A case study of Mokpo, Korea. J. Build. Constr. Plan. Res. 2014, 2, 74–81. [Google Scholar] [CrossRef]
  73. Yum, S.G.; Song, M.S.; Adhikari, M.D. Assessing Typhoon Soulik-induced morphodynamics over the Mokpo coastal region in South Korea based on a geospatial approach. Nat. Hazards Earth Syst. Sci. 2023, 23, 2449–2474. [Google Scholar] [CrossRef]
  74. Kim, B.; Hong, T.K. A national Vs30 model for South Korea to combine nationwide dense borehole measurements with ambient seismic noise analysis. Earth Space Sci. 2022, 9, e2021EA002066. [Google Scholar] [CrossRef]
  75. He, H.; Zhou, L.; Lee, H. Ground displacement variation around power line corridors on the loess plateau estimated by persistent scatterer interferometry. IEEE Access 2021, 9, 87908–87917. [Google Scholar] [CrossRef]
  76. Kirui, P.; Oiro, S.; Waithaka, H.; Odera, P.; Riedel, B.; Gerke, M. Detection, characterization, and analysis of land subsidence in Nairobi using InSAR. Nat. Hazards 2022, 113, 213–236. [Google Scholar] [CrossRef]
  77. Qin, Y.; Perissin, D.; Bai, J. Investigations on the coregistration of Sentinel-1 TOPS with the conventional cross-correlation technique. Remote Sens. 2018, 10, 1405. [Google Scholar] [CrossRef]
  78. Hanssen, R.F. Radar Interferometry: Data Interpretation and Error Analysis; Springer Science & Business Media: Dordrecht, The Netherlands, 2001; Volume 2. [Google Scholar]
  79. Ferretti, A.; Prati, C.; Rocca, F. Permanent scatterers in SAR interferometry. IEEE Trans. Geosci. Remote Sens. 2001, 39, 8–20. [Google Scholar] [CrossRef]
  80. Perissin, D.; Wang, Z.; Wang, T. The SARPROZ InSAR Tool for Urban Subsidence/Manmade Structure Stability Monitoring in China. In Proceedings of the International Symposium on Remote Sensing of Environment (ISRSE), Sydney, Australia, 10–15 April 2011; Available online: https://www.isprs.org/PROCEEDINGS/2011/ISRSE-34/211104015Final00632.pdf (accessed on 28 September 2025).
  81. Foroughnia, F.; Nemati, S.; Maghsoudi, Y.; Perissin, D. An iterative PS-InSAR method for the analysis of large spatio-temporal baseline data stacks for land subsidence estimation. Int. J. Appl. Earth Obs. Geoinf. 2019, 74, 248–258. [Google Scholar] [CrossRef]
  82. Xu, H.; Chen, F.; Zhou, W. A comparative case study of MTInSAR approaches for deformation monitoring of the cultural landscape of the Shanhaiguan section of the Great Wall. Herit. Sci. 2021, 9, 71. [Google Scholar] [CrossRef]
  83. Yang, F.; Zhi, M.; An, Y. Revealing large-scale surface subsidence in Jincheng City’s mining clusters using MT-InSAR and VMD-SSA-LSTM time series prediction model. Sci. Rep. 2025, 15, 5726. [Google Scholar] [CrossRef]
  84. Hussain, S.; Pan, B.; Afzal, Z.; Ali, M.; Zhang, X.; Shi, X.; Ali, M. Landslide detection and inventory updating using the time-series InSAR approach along the Karakoram Highway, Northern Pakistan. Sci. Rep. 2023, 13, 7485. [Google Scholar] [CrossRef]
  85. Ramzan, U.; Fan, H.; Aeman, H.; Ali, M.; AAAl-qaness, M. Combined analysis of PS-InSAR and hypsometry integral (HI) for comparing seismic vulnerability and assessment of various regions of Pakistan. Sci. Rep. 2022, 12, 22423. [Google Scholar] [CrossRef]
  86. Khorrami, M.; Abrishami, S.; Maghsoudi, Y.; Alizadeh, B.; Perissin, D. Extreme subsidence in a populated city (Mashhad) detected by PSInSAR considering groundwater withdrawal and geotechnical properties. Sci. Rep. 2020, 10, 11357. [Google Scholar] [CrossRef]
  87. Hussain, M.A.; Chen, Z.; Shoaib, M.; Shah, S.U.; Khan, J.; Ying, Z. Sentinel-1A for monitoring land subsidence of coastal city of Pakistan using Persistent Scatterers In-SAR technique. Sci. Rep. 2022, 12, 5294. [Google Scholar] [CrossRef]
  88. Fárová, K.; Jelének, J.; Kopačková-Strnadová, V.; Kycl, P. Comparing DInSAR and PSI techniques employed to Sentinel-1 data to monitor highway stability: A case study of a massive Dobkovičky landslide, Czech Republic. Remote Sens. 2019, 11, 2670. [Google Scholar] [CrossRef]
  89. Nicholls, R.J.; Lincke, D.; Hinkel, J.; Brown, S.; Vafeidis, A.T.; Meyssignac, B.; Fang, J. A global analysis of subsidence, relative sea-level change and coastal flood exposure. Nat. Clim. Change 2021, 11, 338–342. [Google Scholar] [CrossRef]
  90. Wang, K.; Chen, J.; Valseth, E.; Wells, G.; Bettadpur, S.; Jones, C.E.; Dawson, C. Subtle land subsidence elevates future storm surge risks along the gulf coast of the United States. J. Geophys. Res. Earth Surf. 2024, 129, e2024JF007858. [Google Scholar] [CrossRef]
  91. Festa, D.; Novellino, A.; Hussain, E.; Bateson, L.; Casagli, N.; Confuorto, P.; Raspini, F. Unsupervised detection of InSAR time series patterns based on PCA and K-means clustering. Int. J. Appl. Earth Obs. Geoinf. 2023, 118, 103276. [Google Scholar] [CrossRef]
  92. Khalili, M.A.; Voosoghi, B.; Guerriero, L.; Haji-Aghajany, S.; Calcaterra, D.; Di Martire, D. Mapping of mean deformation rates based on APS-corrected InSAR data using unsupervised clustering algorithms. Remote Sens. 2023, 15, 529. [Google Scholar] [CrossRef]
  93. Rygus, M.; Novellino, A.; Hussain, E.; Syafiudin, F.; Andreas, H.; Meisina, C. A clustering approach for the analysis of InSAR Time Series: Application to the Bandung Basin (Indonesia). Remote Sens. 2023, 15, 3776. [Google Scholar] [CrossRef]
  94. Tan, T.S.; Inoue, T.; Lee, S.L. Hyperbolic method for consolidation analysis. J. Geotech. Eng. 1991, 117, 1723–1737. [Google Scholar] [CrossRef]
  95. Yastika, P.E.; Shimizu, N.; Abidin, H.Z. Monitoring of long-term land subsidence from 2003 to 2017 in coastal area of Semarang, Indonesia by SBAS DInSAR analyses using Envisat-ASAR, ALOS-PALSAR, and Sentinel-1A SAR data. Adv. Space Res. 2019, 63, 1719–1736. [Google Scholar] [CrossRef]
  96. Shi, G.; Lin, H.; Bürgmann, R.; Ma, P.; Wang, J.; Liu, Y. Early soil consolidation from magnetic extensometers and full resolution SAR interferometry over highly decorrelated reclaimed lands. Remote Sens. Environ. 2019, 231, 111231. [Google Scholar] [CrossRef]
  97. Choo, Y.S.; Kim, J.H.; Hwang, S.H.; Chung, C.K. The optimization of hyperbolic settlement prediction method with the field data for preloading on the soft ground. J. Korean Geotech. Soc. 2010, 26, 147–159. Available online: https://cdn.apub.kr/journalsite/archives/kgs/2010-26/07.pdf (accessed on 28 September 2025).
  98. Kim, S.; Lee, C.; Song, K.; Min, K.D.; Won, J. Application of L-band differential SAR interferometry to subsidence rate estimation in reclaimed coastal land. Int. J. Remote Sens. 2005, 26, 1363–1381. [Google Scholar] [CrossRef]
  99. Córdoba Hernández, R.; Camerin, F. The application of ecosystem assessments in land use planning: A case study for supporting decisions toward ecosystem protection. Futures 2024, 161, 103399. [Google Scholar] [CrossRef]
  100. Ferro-Azcona, H.; Espinoza-Tenorio, A.; Calderón-Contreras, R.; Ramenzoni, V.C.; País, M.d.L.M.G.; Mesa-Jurado, M.A. Adaptive capacity and social-ecological resilience of coastal areas: A systematic review. Ocean Coast. Manag. 2019, 173, 36–51. [Google Scholar] [CrossRef]
  101. Anderson, C.C.; Renaud, F.G.; Hanscomb, S.; Gonzalez-Ollauri, A. Green, hybrid, or grey disaster risk reduction measures: What shapes public preferences for nature-based solutions? J. Environ. Manag. 2022, 310, 114727. [Google Scholar] [CrossRef] [PubMed]
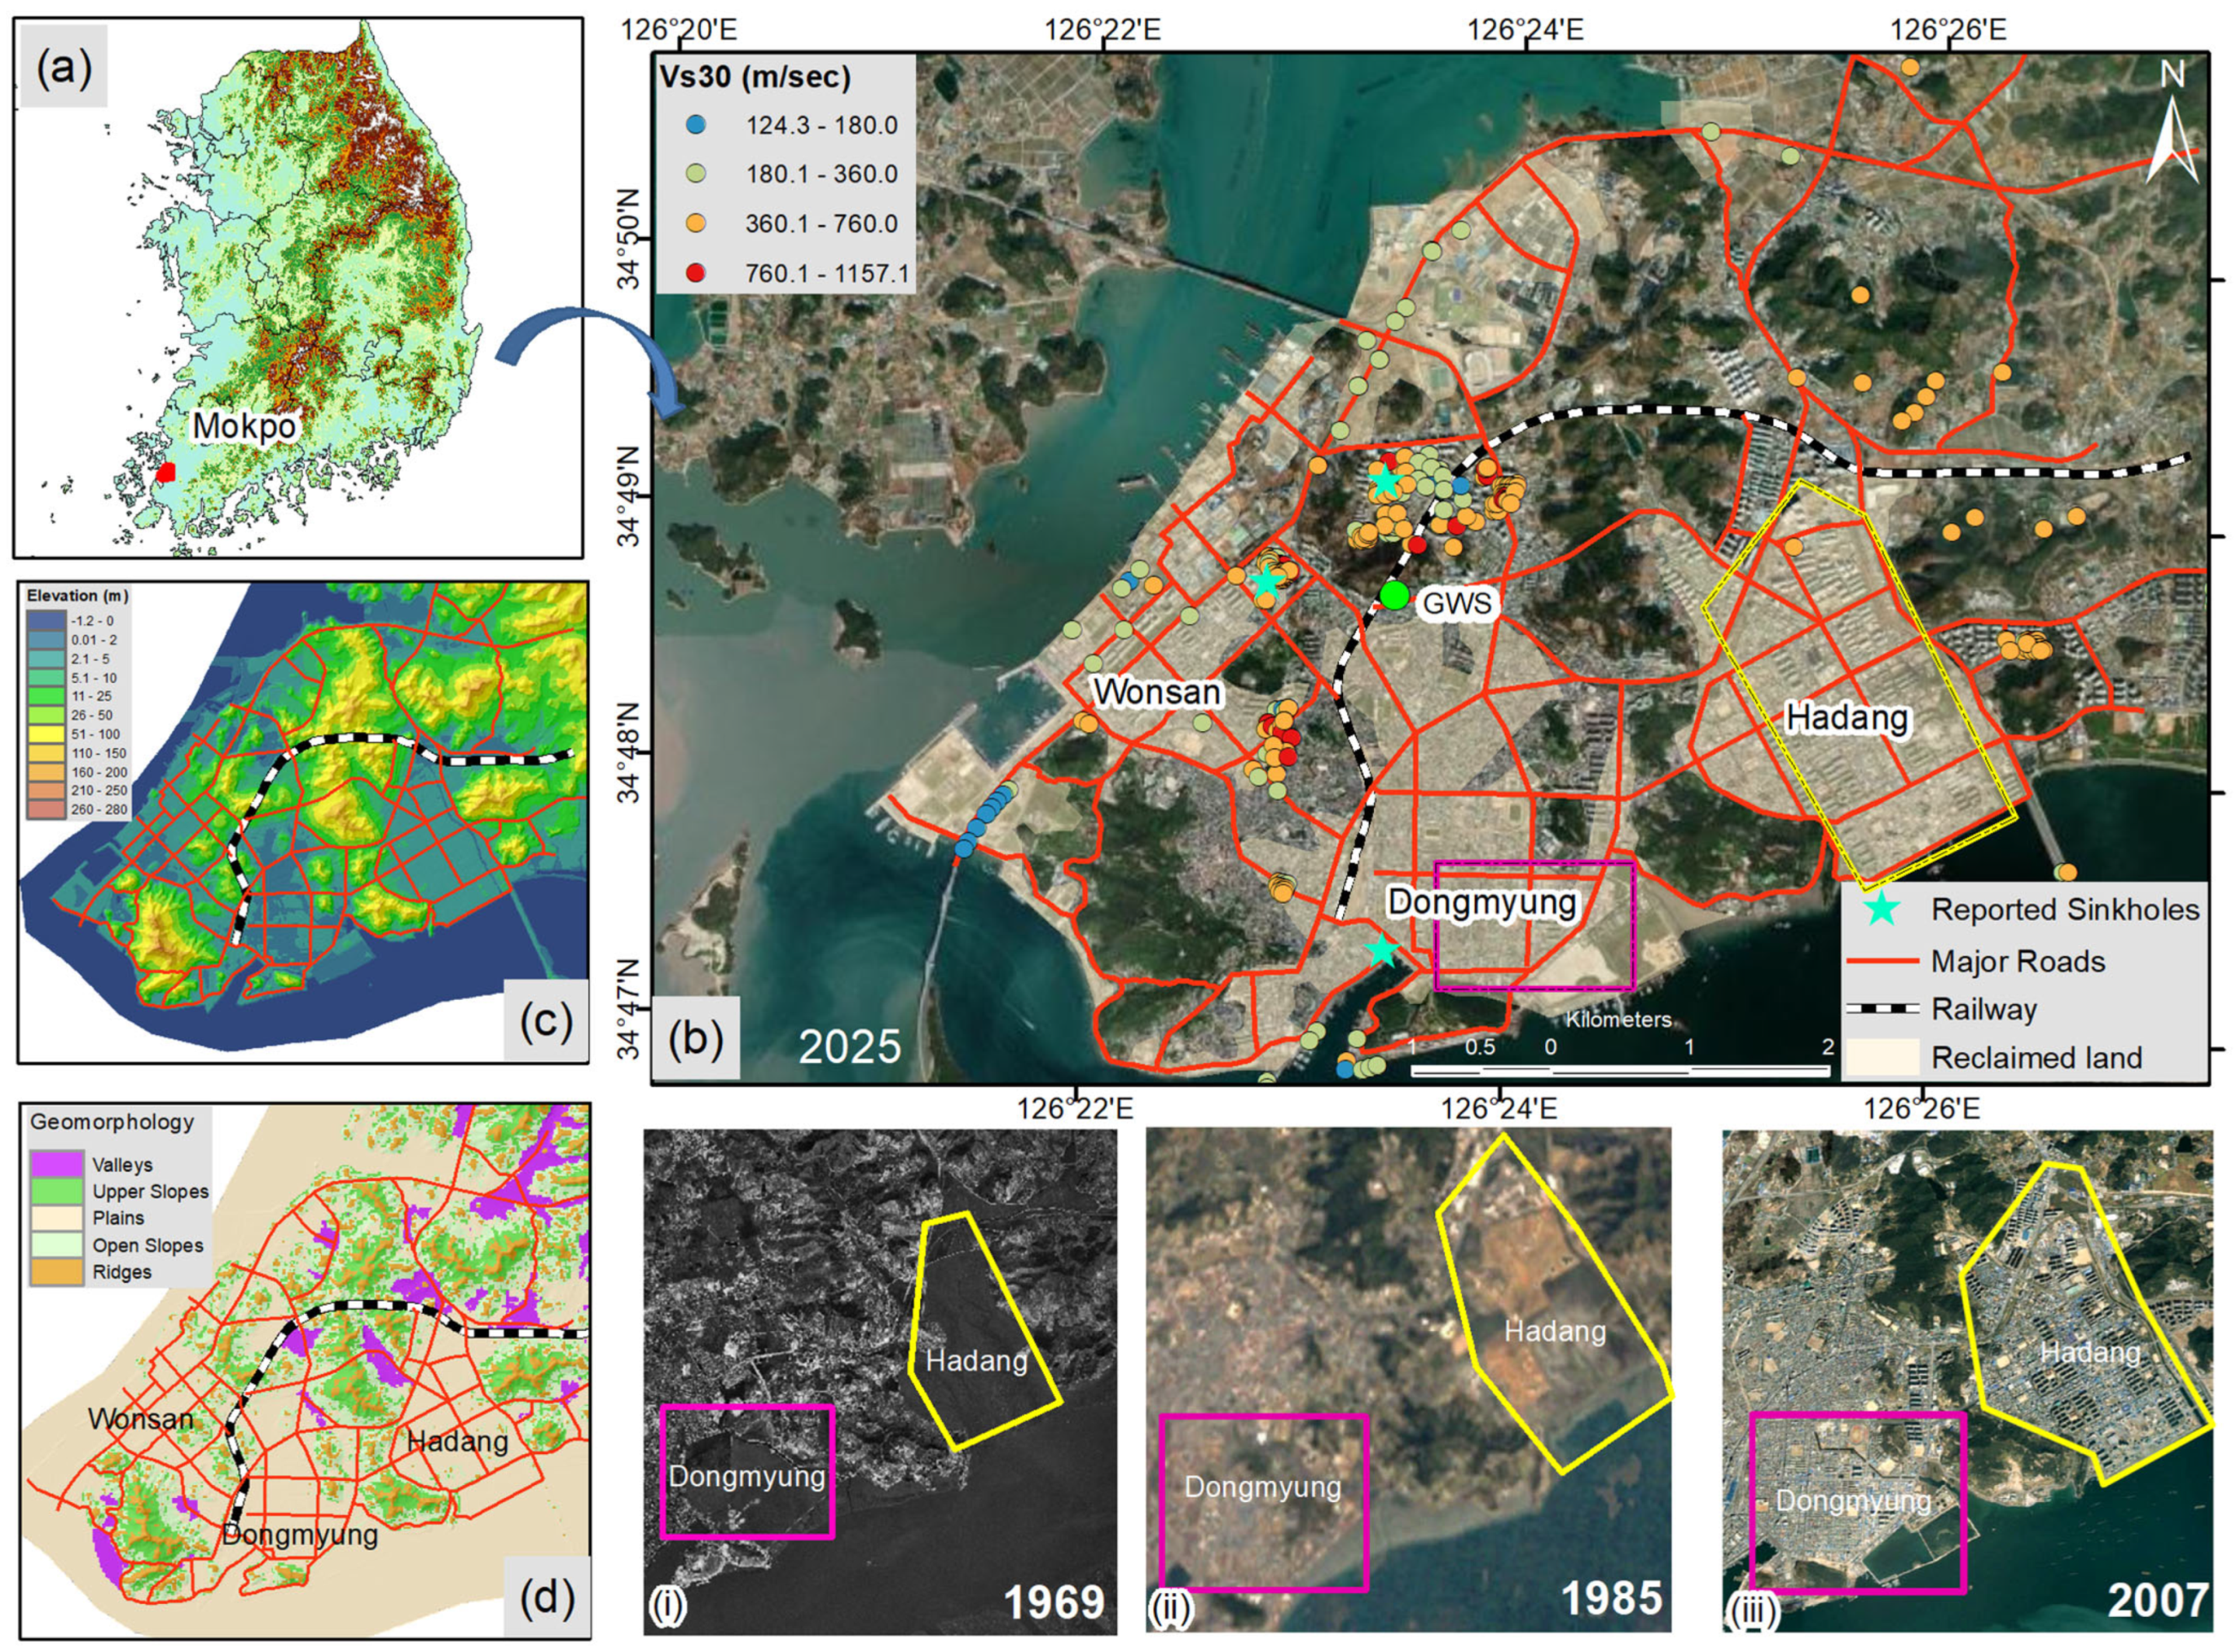
Figure 1. (a) Location of Mokpo city on the southwestern coast of South Korea, (b) the extensive port and urban infrastructure built on reclaimed land with spatial distribution of SPT-based effective shear wave velocity (Vs30) reported by Kim and Hong [74] (shadow zones represent land reclamation since 1920s (modified after [26,70,71]), and ‘stars’ represent reported sinkholes (https://sciencesay.shinyapps.io/sinkhole/, accessed on 28 September 2025)), (c) elevation from MSL of the city exhibiting most of the urbanized area spread over < 5 m, and (d) broad geomorphology of the region derived through TPI-based landform classes. The rectangle in images (iiii) highlights extensive urban infrastructure development on reclaimed coastal land from 1969 to 2025. The high-resolution image for 2025, 2007 and 1985 was obtained from Google Earth, while the aerial images for 1969 were sourced from NGII. [Note: the groundwater monitoring station is represented in a green circle in (b)].
Buildings 15 03865 g001
Figure 2. (a,b) Representative borehole lithology and Standard Penetration Test (SPT-N) profiles of the reclaimed land in Mokpo City, and (c,d) Casagrande plasticity charts derived from 120 boreholes for soils shallower (<5 m) and deeper (>5 m) than the reclamation fill interface [Note: The geotechnical laboratory test data were obtained from the Korea National Land and Geotechnical Information Portal (https://www.geoinfo.or.kr/, accessed on 21 July 2025)].
Buildings 15 03865 g002
Figure 3. An integrated methodological framework for uneven settlement monitoring along the linear infrastructure: (a) primary mechanisms of uneven settlement along linear infrastructure on reclaimed land and space-based monitoring, (b) PSInSAR processing workflow, and (c) geospatial-based linear infrastructure integrity monitoring and vulnerability assessment.
Buildings 15 03865 g003
Figure 4. (a) Spatial distribution of VLM rate of the Mokpo City derived from seven years (2017–2023) of Sentinel-1 SLC SAR data; (b) error in LOS velocity; (c) cumulative vertical displacement over the period of 2017 to 2023; (P-1P-3) represent the time series of concentrated ground settlement sites on the reclaimed land with overall trend, mean, and ±1 Std.
Buildings 15 03865 g004
Figure 5. (a) Correlation between time-series displacement and subsurface lithology at selected borehole sites (marked in Figure 4a); (b) relationship between VLM rates and Vs30 exhibits greater subsidence mostly occurring in low Vs30; (c) regional groundwater level fluctuations.
Buildings 15 03865 g005
Figure 6. Relationship between subsidence patterns with (a) elevation and (b) geomorphology classes.
Buildings 15 03865 g006
Figure 7. (a) Settlement rates of linear infrastructures within a 50 m buffer zone along major road and railway networks, and (b) vulnerability classification of linear infrastructures based on Anselin Local Moran’s I cluster and outlier analysis.
Buildings 15 03865 g007
Figure 8. (a) Box plot illustrating displacement rate variability across different vulnerability classes, and (b,c) displacement time-series of representative clustered sites (A01–A04, marked in Figure 7b).
Buildings 15 03865 g008
Figure 9. (a) Longitudinal profile of settlement velocity along the vulnerable roadbed segment XY (marked in Figure 7b), and (bd) time-series displacement at selected sites (b′–d′).
Buildings 15 03865 g009
Figure 10. (a) Longitudinal profile of settlement velocity along the vulnerable railway segment OP (marked in Figure 7b), and (bd) time-series displacement at representative locations (b′–d′).
Buildings 15 03865 g010
Figure 11. Hyperbolic model-based settlement predictions at vulnerable infrastructure segments (PS01–PS04, marked in Figure 7a). Subplots (a′d′) show comparisons between PSInSAR-derived and model-predicted displacements.
Buildings 15 03865 g011
Table 1. Recent past InSAR studies monitoring linear infrastructure integrity.
Linear InfrastructuresSAR DataMethodsReferences
Highway/RoadTime-series Sentinel-1 SLC, TerraSAR-XDInSAR, SBAS, PSInSAR, DSInSAR, TSS-InSAR[38,40,41,43,44,45,46,47]
Railway (intercity/high speed)/Metro LineTime-series Sentinel-1 SLC, TerraSAR-X, ENVISAT ASAR, Radarsat-2PSInSAR, SBAS[48,49,50,51,52]
Tunnel/Subway (urban underground corridors)Time-series Sentinel-1 SLC, TerraSAR-X, ENVISAT ASAR, Cosmo-SkyMedPSInSAR, SBAS[42,53,54,55,56,57]
AirportEnvisat ASAR, Sentinel-1A, COSMO-SkyMedPSInSAR, SBAS[58,59,60,61,62]
Table 2. Summary of documented sinkhole occurrences in Mokpo City.
DateLocationApprox. ScaleReported CauseSources
1 March 1997Sanjeong-dongFour-story residential complex tilted ~5Ground subsidence in mid-1980s landfill and poor foundation constructionhttps://imnews.imbc.com/replay/1997/nwdesk/article/1764218_30717.html, accessed on 28 September 2025
2 April 2014Sanjeong-dongRoad collapse 80 m long × 7 m widePoor safety management at nearby construction sites, sewer relocationhttps://www.anjunj.com/news/articleView.html?idxno=10127, accessed on 28 September 2025
26 April 2016Shinheung-dongSinkhole ~2 m wide × 4 m deep on the roadCorrosion and breakage of aging sewer pipeshttps://www.seoul.co.kr/news/society/2016/04/27/20160427500128, accessed on 28 September 2025
25 March 2018Yeonsan-dongSurface opening 1.2 m wide × 1.5 m deep JIS Underground Safety Information System (https://www.jis.go.kr/)
https://sciencesay.shinyapps.io/sinkhole/, accessed on 28 September 2025
16 June 2021Wonsan-dongSinkhole 1–2 m wide × 1.5 m deepDefective soil refill
13 April 2022Dongmyeong-dongSurface opening 1.5 m wide × 0.8 m deep (15 m lateral expansion)Soil runoff from underground excavation for new construction
6 August 2025Yeonsan-dongSinkhole ~1 m wide × 4 m deepDamage and leakage of >20-year-old sewershttps://www.mpmbc.co.kr/NewsArticle/1476923, accessed on 28 September 2025
22 September 2025Sanjeong-dongSinkhole ~0.5 m diameter × 0.7 m deepSoil loss due to the failure of old sewer pipeshttps://www.mpmbc.co.kr/NewsArticle/1484071, accessed on 28 September 2025
Table 3. Summary of the used Datasets.
DataSourceRemarks
Sentinel-1SLC ascending orbit datahttps://dataspace.copernicus.eu/, accessed on 21 September 2023Time Series Data, March 2017–December 2023; number of images = 79; Incident angle~33.80°, Heading Angle~ −169.295°
Linear Infrastructures Geometryhttps://www.openstreetmap.org/, accessed on 25 July 2025Major Road and Railway Network
Digital Elevation Model (DEM)National Geographic Information Institute (NGII) (ttps://www.ngii.go.kr/, accessed on 21 July 2023); SRTM (https://srtm.csi.cgiar.org/srtmdata/, accessed on 21 September 2023)5 × 5 m LiDAR DEM; 90 m SRTM DEM
Groundwater recordshttps://www.gims.go.kr, accessed on 21 July 2025Groundwater fluctuations (2017–2023)
Subsurface soil/rock propertiesKim and Hong [74]Effective shear wave velocity (Vs30) (n = 326)
Geotechnical laboratory test dataKorea National Land and Geotechnical Information Portal (https://www.geoinfo.or.kr/, accessed on 21 July 2025)Liquid Limit (LL), Plasticity Index (PI) (n = 120)
High-resolution ImageriesNational Geographic Information Institute (NGII); Google EarthHighlighted land reclamation and urbanization from 1969 to 2025
Disclaimer/Publisher’s Note: The statements, opinions and data contained in all publications are solely those of the individual author(s) and contributor(s) and not of MDPI and/or the editor(s). MDPI and/or the editor(s) disclaim responsibility for any injury to people or property resulting from any ideas, methods, instructions or products referred to in the content.