1. Introduction
The real estate sector is so important to the stability of the economy that it has a significant impact on sustainable development in China. The reform of the Chinese housing market, which began in 1998, has achieved some initial and fruitful results, not only opening the housing market but also driving China’s economy and the development of related industries. Housing itself is not only a durable consumer good but also an important investment asset for investors. The dual attributes of housing and the scarcity of land make it easy for housing to become a target for investment or even speculation. In fact, a considerable portion of the local government’s revenue has derived from real estate since 2003. Meanwhile, housing prices in Beijing have continued to increase since then.
Housing prices usually reflect the cumulative growth in the economy. However, the rapid rise can stimulate speculative behavior and have a passive influence on the economy. It is normal for housing prices to fluctuate around their fundamental value, which is used as a basis for discussion of overvaluation or undervaluation. If housing prices continue to rise rapidly, we need to consider whether they are deviating from their fundamental value, which could indicate a potential price bubble in the housing market. If the bubble bursts, it could cause serious problems for the economy or even lead to a financial crisis. The aim is to examine whether a housing price bubble exists in the Beijing housing market.
The term ‘bubble’ was first used to describe famous cases of speculative price movements such as the tulip bulb mania in the Netherlands, the South Sea Bubble in the UK, and the collapse of the Mississippi Company in France [
1]. Since then, it has been used to describe the dramatic process of an economy or sector booming rapidly and then suddenly declining. Beijing is not only the capital of China but also one of the country’s super cities. There is no doubt that the stability of the housing market in Beijing has a significant influence on the sustainable development of the Chinese economy.
This study focuses on examining the residential housing market in Beijing, with the intention of measuring the existence of a housing bubble. This study is structured as follows:
Section 1 is devoted to the introduction.
Section 2 details the related literature on housing price bubbles.
Section 3 provides the methodology for analyzing the housing price bubble in Beijing.
Section 4 describes the data and fundamentals of the Beijing housing market.
Section 5 presents an empirical analysis using the established model and methods.
Section 6 discusses the relationship of the results to previous studies. Finally,
Section 7 summarizes the analytical results and findings.
2. Facts About the Economy and Housing Market in Beijing
2.1. Housing Supply and Demand
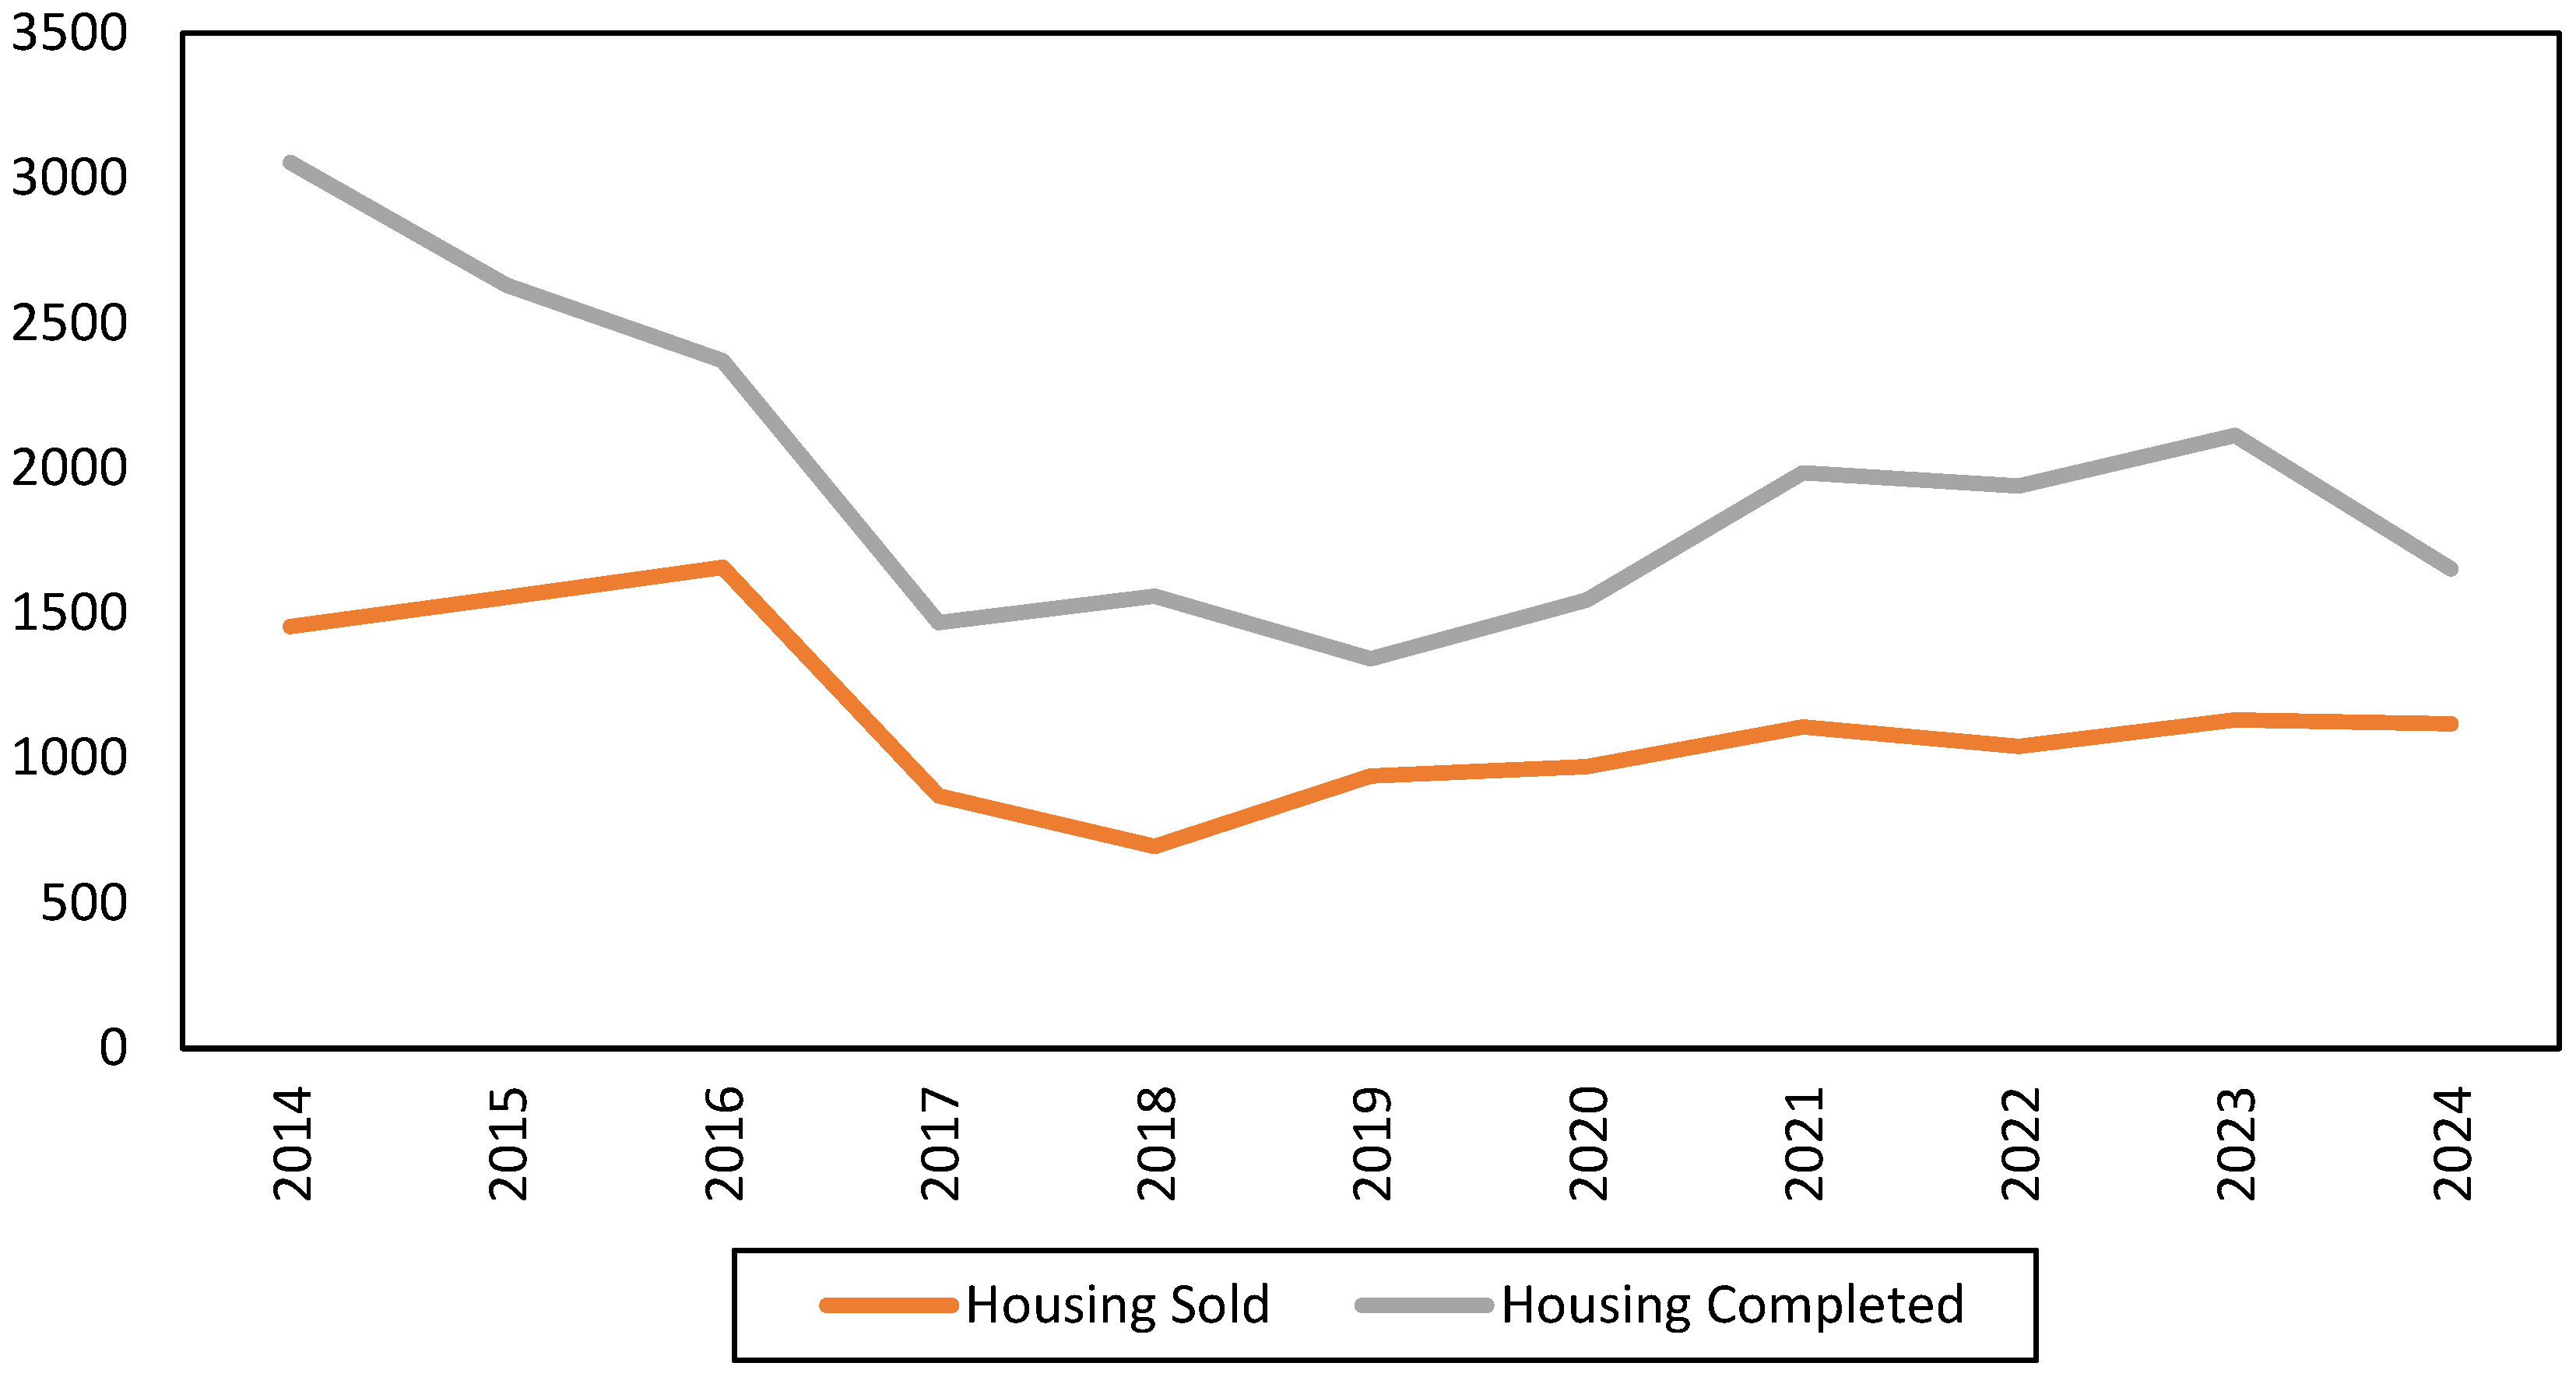
Through a comparative analysis of changes in housing completions and sales, we can gain a general view of the housing supply and demand in Beijing. The housing supply and demand in Beijing were dynamically balanced from 2014 to 2024, as shown in
Figure 1. It is worth noting that supply is significantly excessive in some years, while in other years, supply is close to demand.
2.2. Population
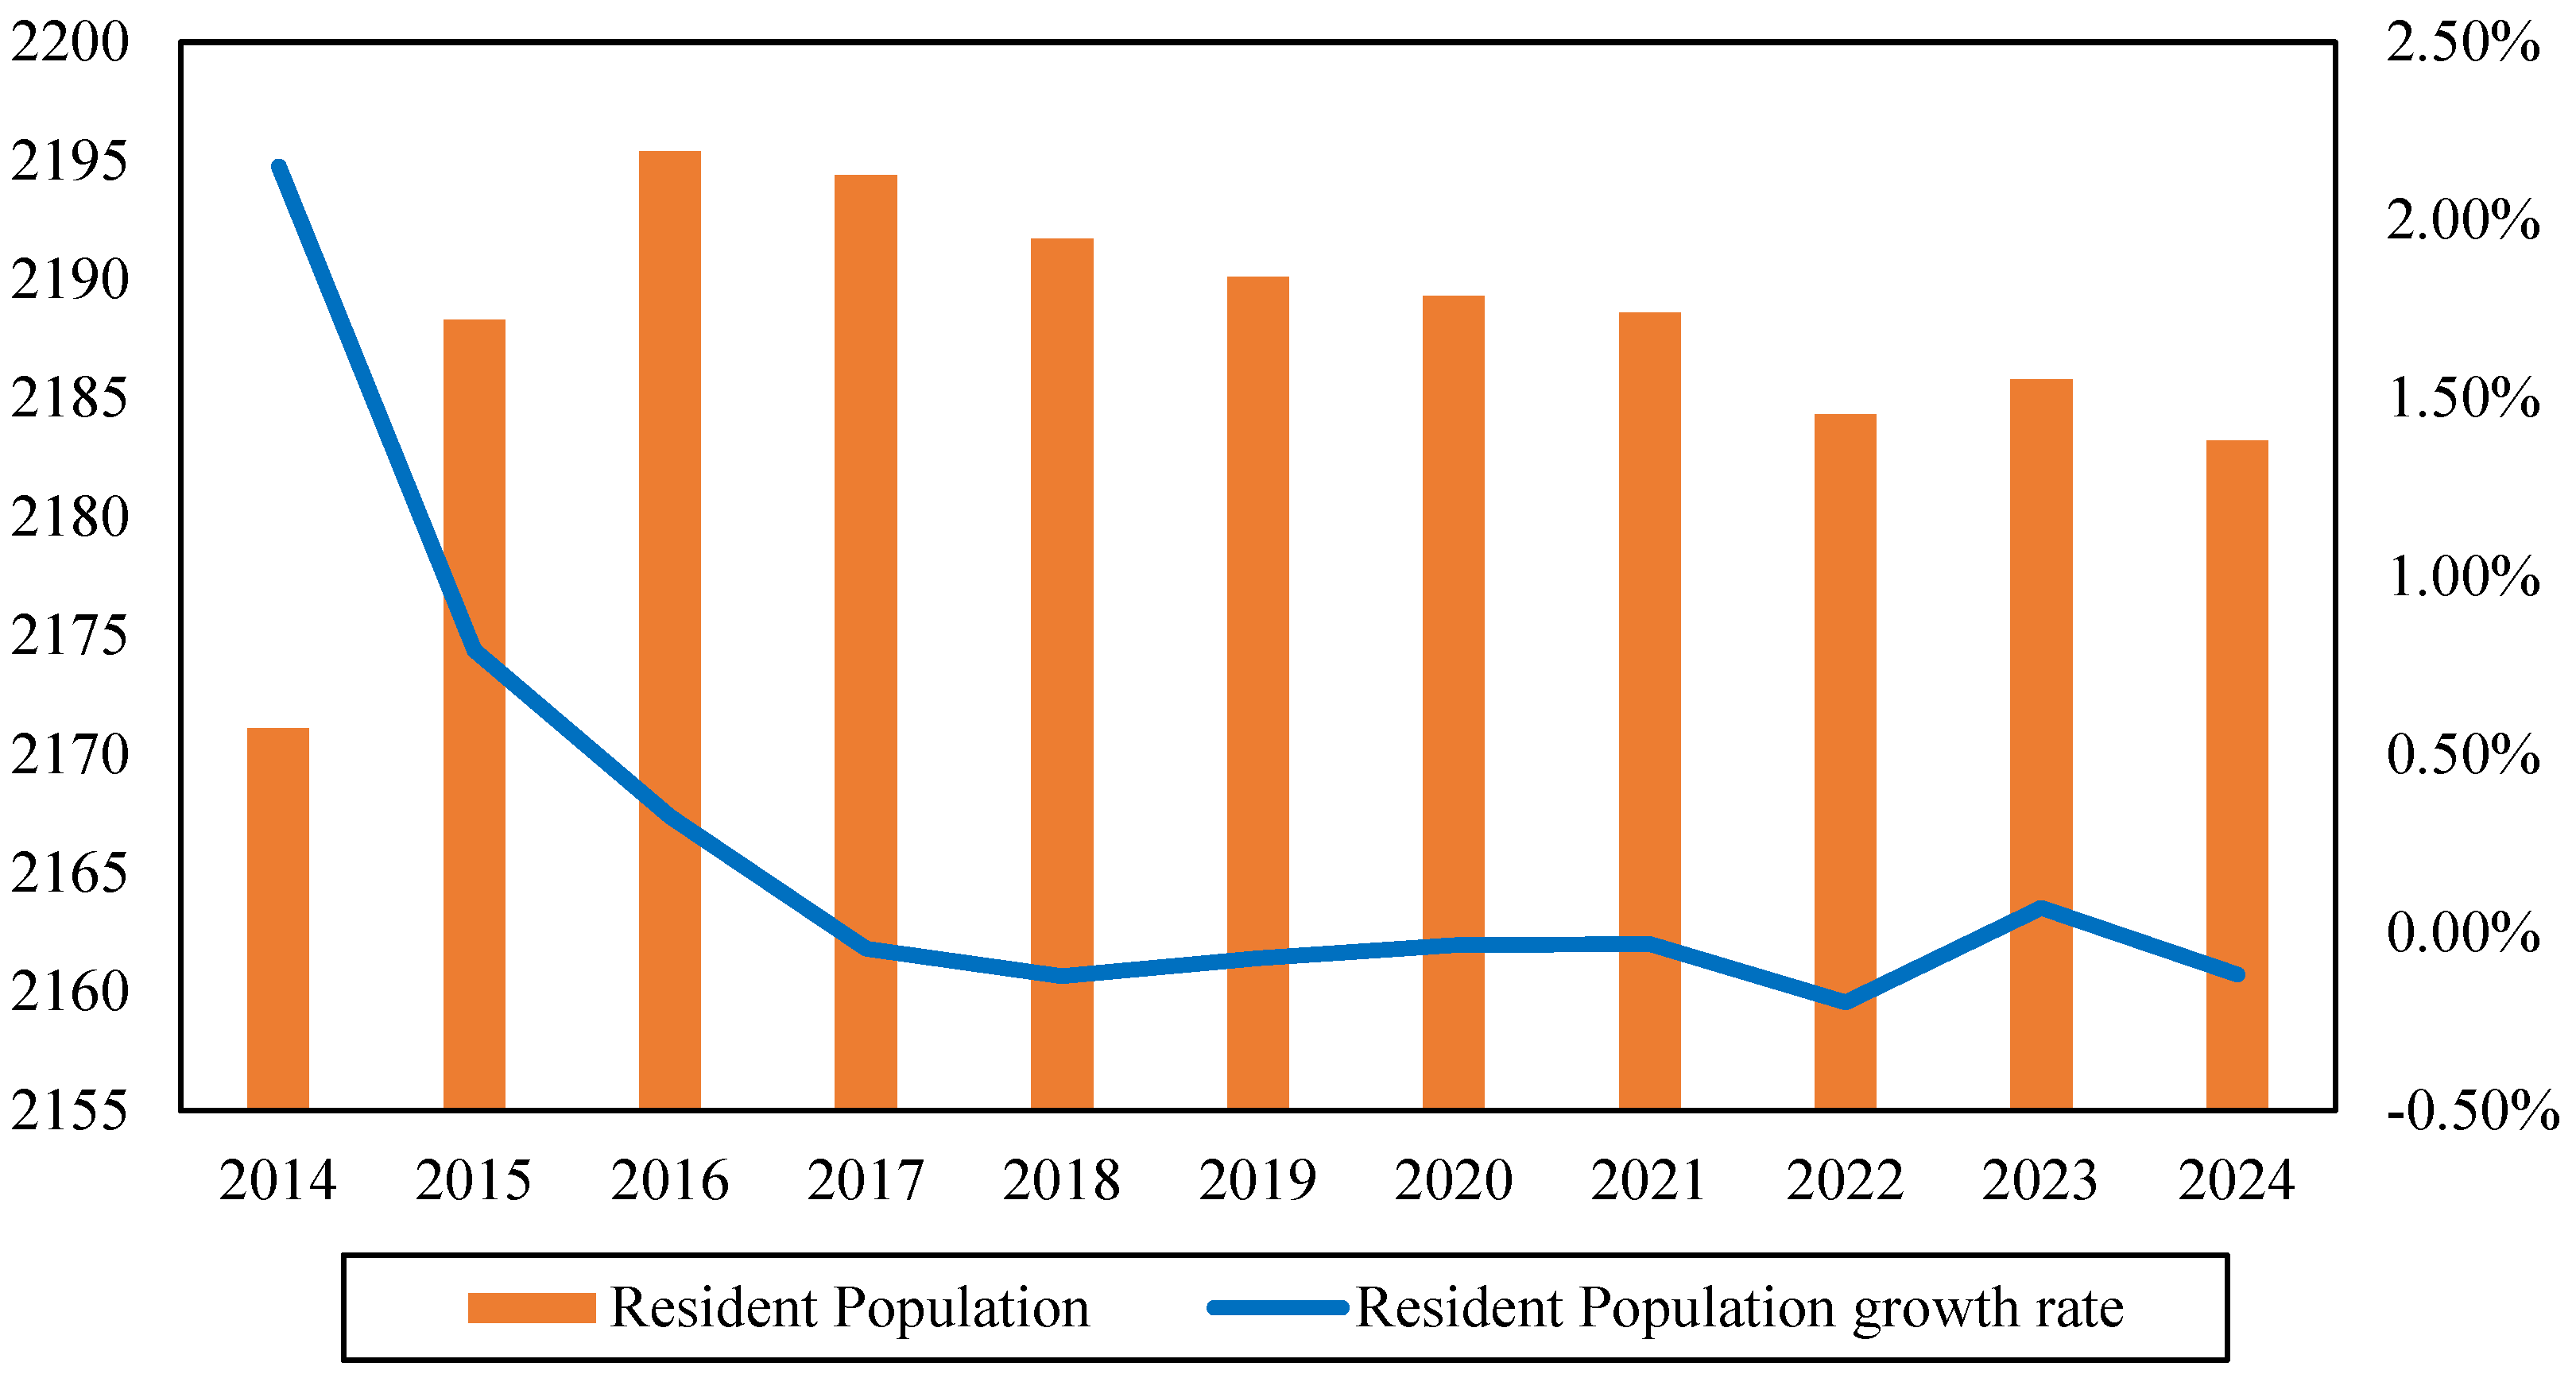
China has undergone a rapid urbanization process since the late 1970s, resulting in a substantial demand for housing. To some extent, urbanization is one of the most important factors contributing to the development of the real estate market. There is no doubt that the increase in urban population pushes up the demand for housing.
Figure 2 shows that the urbanization rate in Beijing increased until around 2016. Since then, the population has remained relatively unchanged.
2.3. Per Capita Disposable Income
Per capita disposable income (PCDI) reflects the purchasing power available to each individual in the population, particularly in relation to housing affordability. As shown in
Figure 3, the PCDI in Beijing experienced an increase and a growth rate of over 8% before 2019. Meanwhile, housing prices have continued rising. In recent years, the rapid rise in housing prices and the decline in PCDI growth rate suggest that housing affordability has been declining in Beijing.
2.4. Loan Rates and Housing Prices
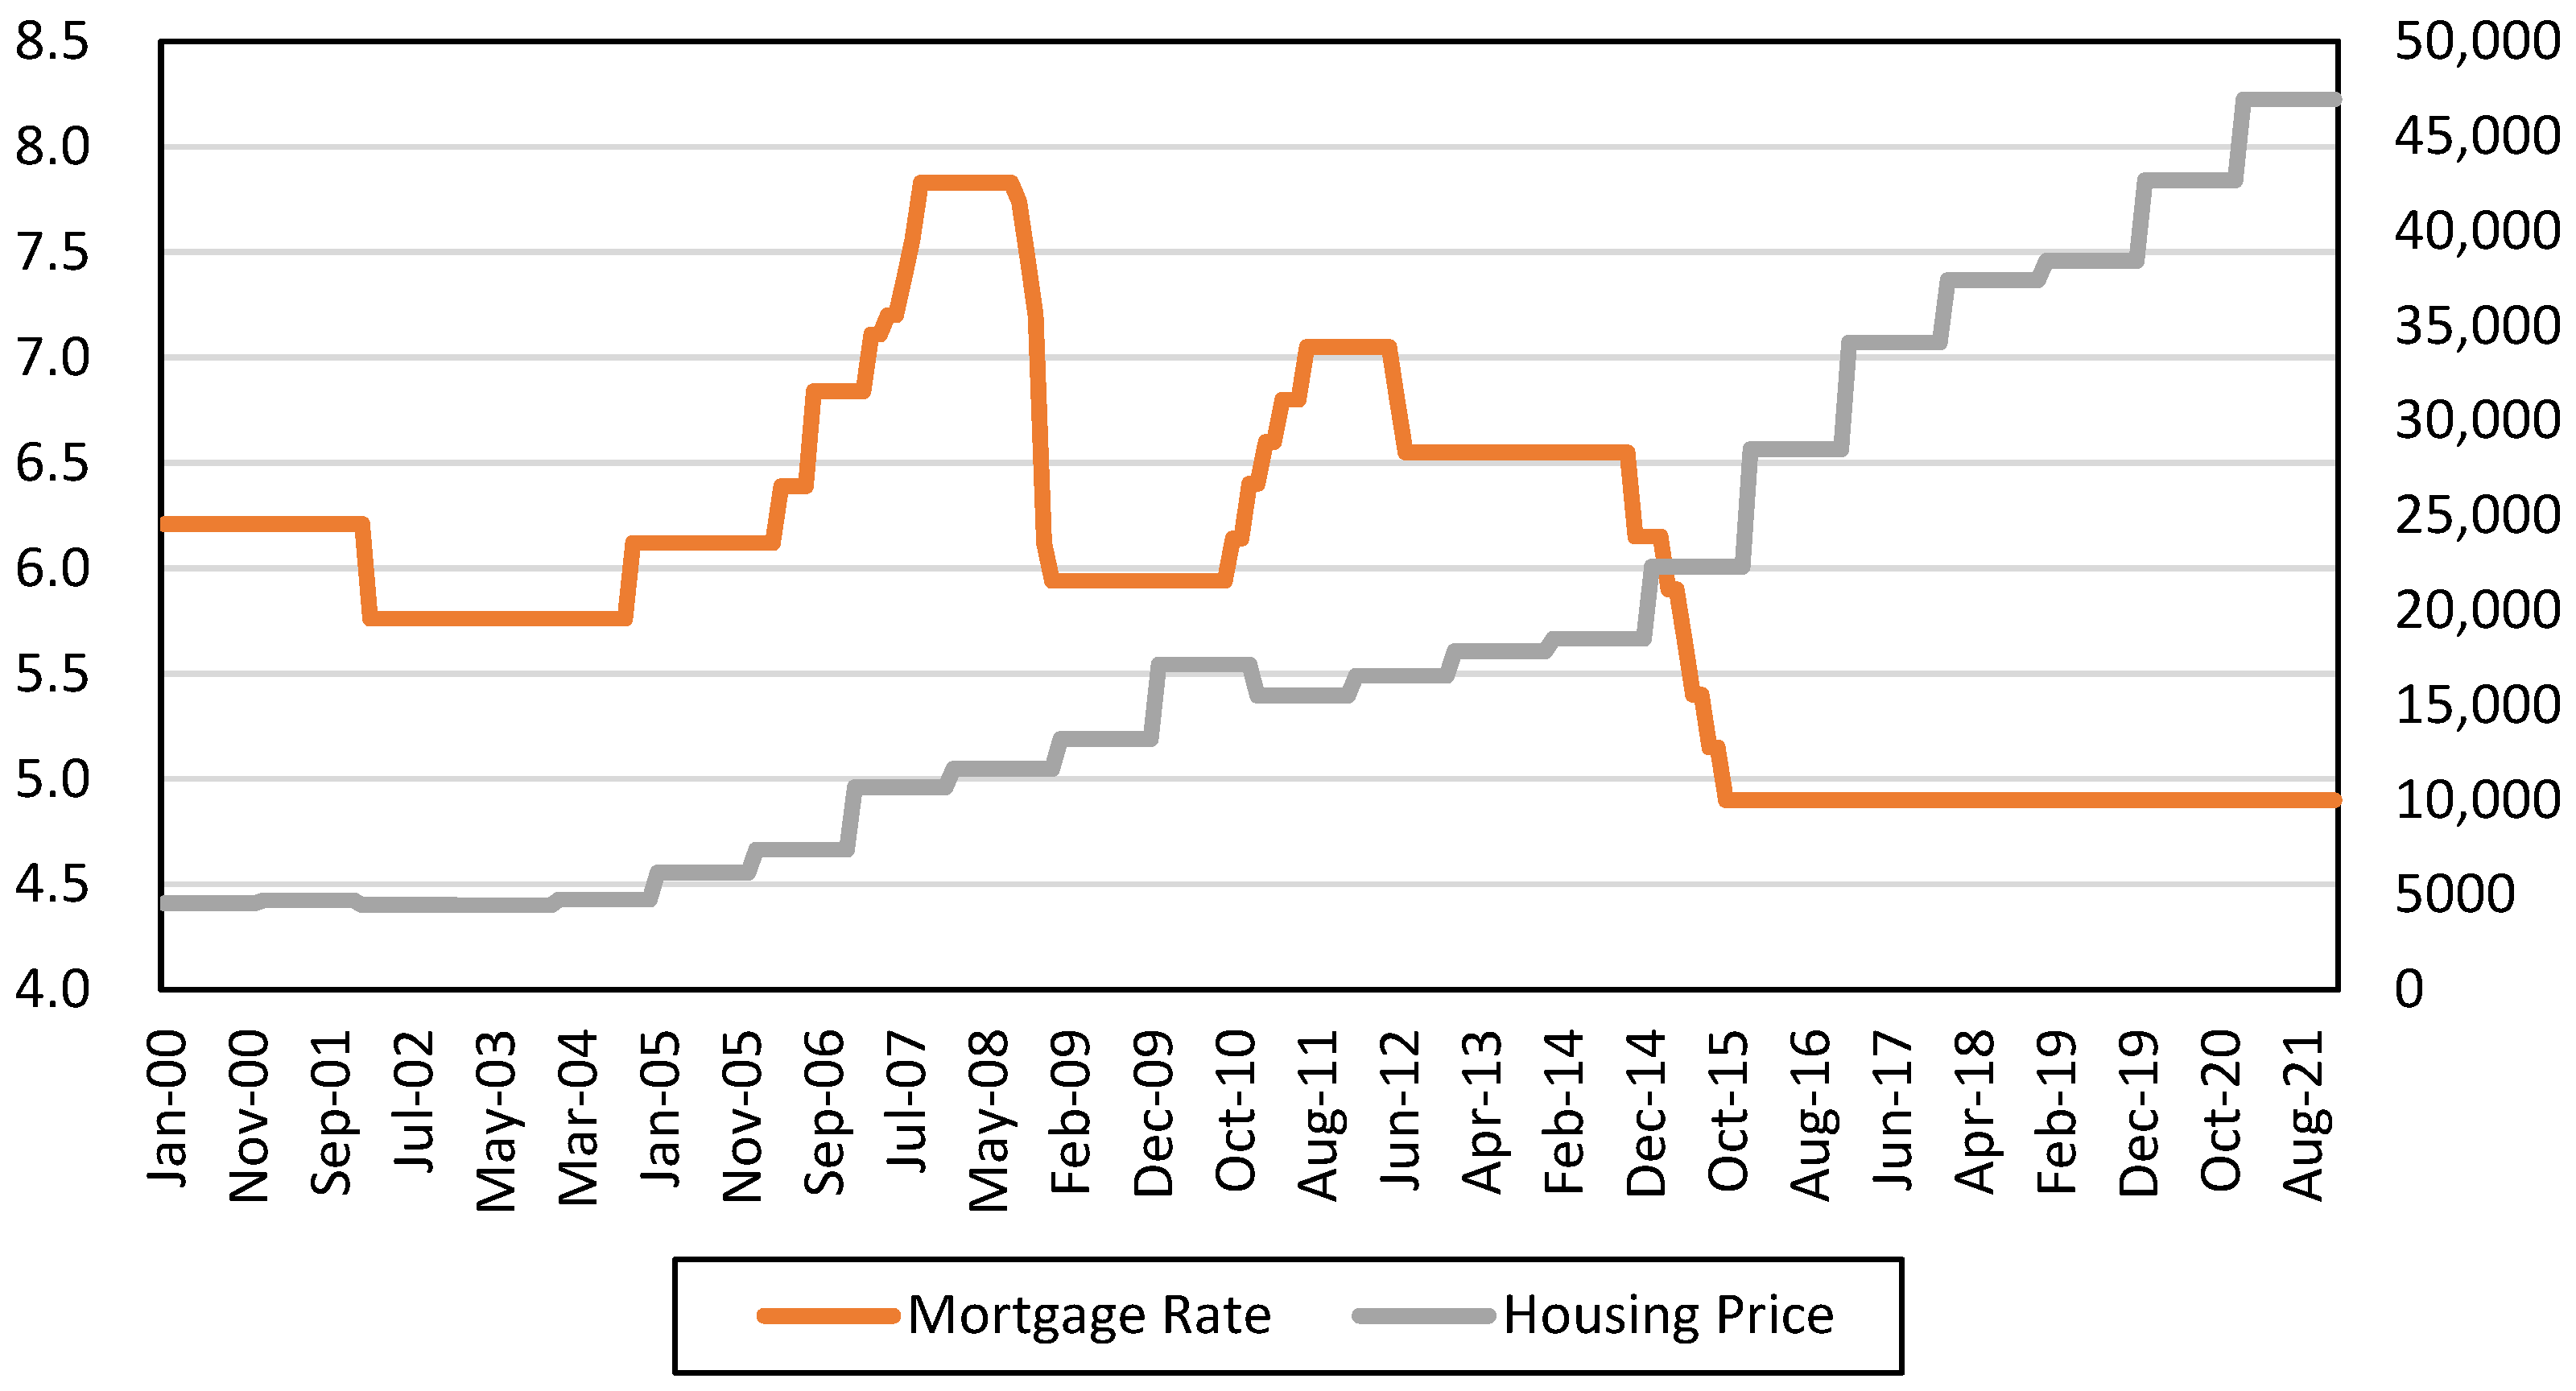
Apart from urbanization and PCDI, the mortgage rate is another driving factor for housing prices. As shown in
Figure 4, mortgage rates rose significantly between 2004 and 2007, driven by the robust economy following the appreciation of the RMB. However, the rate has remained in a declining trend since the 2008 subprime crisis in the U.S., which had a direct negative influence on China’s economy. The lower rates have stimulated more households to purchase property. Meanwhile, housing prices in Beijing have experienced a considerable increase.
3. Literature Review
Shiller (1981) proposes the use of a variance bound test to detect asset bubbles [
2]. West (1987) suggests using a two-step test [
3]. Campbell and Shiller (1988) introduce the right-tailed unit root test, the most commonly used method in the literature to detect asset price bubbles [
4]. Diba and Grossman (1988) show that cointegration tests can be used to measure real estate bubbles [
5].
Diego Escobari et al. (2015) introduce a new empirical test for time series analysis to estimate the start and burst of a bubble as a structural break in the differential appreciation rates among the Case–Shiller price tiers [
6]. Juan Huang and Geoffrey Qiping Shen (2017) use the GSADF test and a dynamic probit model to study the Hong Kong residential bubble [
7]. Xi Zhang et al. (2020) tested the existence of a house price bubble in the UK by using a co-explosive vector autoregression model (originally used for the stock market) [
8].
Yang Hu and Les Oxley (2016) use a study of house price-to-income ratios to find that housing price bubbles existed in several US states in the 1980s [
9]. The rent-to-price ratio is another measure of housing appreciation. Capozza and Seguin (1996) argue that rent-to-price ratios predict capital appreciation in the housing market [
10]. Gallin (2003) examines error correction models for house prices and incomes [
11]. Mikhed and Zemcik (2009) found that a bubble existed in the US housing market in the late 1980s and late 1990s using price-to-rent ratios [
12].
Lind (2009) states that, in identifying housing bubbles, it is essential to focus on a combination of indicators that cover macroeconomic factors, structural changes, credit conditions, and the expectations of housing market participants [
13]. Gerlach and Peng (2005) point out that bank lending in Hong Kong has no effect on housing prices and that the direction of this effect is from housing prices to bank lending [
14]. Oikarinen (2009) notes a significant interaction between housing prices and household borrowing [
15].
A number of studies suggest that price bubbles exist in the housing markets of Beijing and Shanghai [
16,
17,
18,
19]. Specifically, Shih et al. (2014) point out that the price bubbles in the Beijing and Shanghai housing markets have spillover effects on surrounding regions [
20]. Edward Glaeser et al. (2017) argue that China appears to be experiencing a classic housing bubble [
21]. However, a number of studies provide evidence that real estate bubbles do not exist [
22,
23,
24,
25,
26].
In recent years, the research on real estate price bubbles has made remarkable progress in methodology innovation and regional differentiation analysis. Price bubble detection technology shows a trend of multidisciplinary integration. Turkish scholar Coskun et al. (2022) confirmed that housing prices in Istanbul and other places have deviated significantly from income growth through fundamental analysis and a time series model, with speculative demand becoming the core driving force [
27]. The application of machine learning algorithms further optimizes prediction accuracy, as demonstrated by Mohamad et al. (2024) [
28], who used ensemble learning models to reveal the distorting effect of irrational expectations on housing prices. The breakthrough of the spatial analysis method is also remarkable. Navickas et al. (2022), combined with GIS technology, proved that price bubbles in Lithuania and other countries have significant regional heterogeneity [
29].
Although various methods have been used to measure housing price bubbles and more are on the way, there is controversy as to whether a price bubble exists in the housing market, particularly when a study relies on a single method. This study attempts to examine the housing price bubble from a different perspective. The combination of multiple indicators is perhaps an interesting approach to examining housing price bubbles, compared to existing studies.
4. Analytical Framework
This study examines housing bubbles with both the rational expectation model and a combination of key economic indicators. The first indicator is a simple present value model that compares the market price of housing with its reasonably expected price. The second indicator is the house price-to-income ratio (P-I ratio) and the house price-to-rent (P-R ratio), both of which are commonly used to measure whether housing prices are exorbitantly high. Finally, the statistical tool of control charts is introduced to assess abnormal fluctuation in housing prices.
All data related to prices are nominal prices. In selecting the risk-free interest rate indicator, this study considers the rapid development of China from 2003 to 2021. The yield to maturity of 1-year Chinese government bonds is used. The information originates from the CSIC Indexes announcement. The rent is the annual rent per unit (m2) of floor space, sourced from Wind Information. PCGDP is defined as gross domestic product per capita, and PCDI is the sum of final consumption expenditure and other nonobligatory expenditure and savings available per capita per year, i.e., the income available to households for discretionary use. These data are available from the Beijing Statistical Yearbook (2003~2021). Based on the data and the results of all the indicators described in the methodology, this study has some interesting findings about housing price bubbles in Beijing.
4.1. Rational Expectation Model
The rational expectations model measures the extent to which housing prices deviate from their value by calculating the deviation between the observed housing price and the rational expectations price. The rational expectations model assumes that the final value of the housing is zero and the rental term is perpetual, while the expected rent, derived from discounting the future cash flow, yields the expected price. The size of the deviation between the observed price and the expected price is used to measure the existence of a price bubble.
The identification of housing price bubbles has been extensively studied in the existing literature. Muth (1961) proposed the hypothesis of rational expectations, which has been widely used since Flood and Hodrick (1990) applied this model to test for housing bubbles [
30,
31]. Under rational conditions, price bubbles may also exist in a finite survival economy if there are information asymmetries and short-selling constraints [
32].
According to the theory of rational expectations, if the housing price of a property grows faster than its current value, then there is margin for arbitrage, and investors will trade by buying at a lower price and selling at a higher price. As arbitrage proceeds, the arbitrage space will diminish until price equilibrium is reached. At this point, the following equation is satisfied.
In Equation (1),
denotes the expected rate of return on buying housing at moment t,
denotes the price of housing at moment t, and
denotes the level of rent for housing at moment t.
denotes the expectation operator. Express Equation (1) as a function of
, as shown in Equation (2).
where “
” denotes the discount factor, i.e.,
and
. Bringing the expression for
into Equation (2) yields Equation (3).
Substituting the expression for
into Equation (3) recursively yields Equation (4).
When i tends to infinity, Equation (5) is obtained by assuming that the final price of housing is zero. The above equation can be defined as
where
denotes the expected price of housing. However, considering that rental data for an infinite period is not easily available, Wheaton (1999) [
33] uses Equation (6) to calculate the expected price.
The size of the deviation between the observed price and the expected price
can be used as a measure of the degree of bubbles. A bubble can be defined as in Equation (7).
Substituting Equation (6) into Equation (7) yields Equation (8).
The size of reflects the extent of the bubble, that is, the deviation between observed housing prices and expected prices. In other words, the larger the , the larger the bubble in the housing market.
4.2. Price-to-Income and Price-to-Rent Ratios
When a housing market bubble occurs, rapid increases in housing prices can make housing unaffordable for households. This is partly due to the fact that higher housing prices result in more monthly mortgage payments, while income does not increase at the same rate. Thus, the burden of homeownership makes it impossible for some residents to afford to buy a home. If the price of housing deviates much from the income or affordability of households, this indicates the existence of a housing price bubble. The larger the P-I ratio, the more likely it is that a housing market bubble exists.
From an investment perspective, if households purchase property for rental purposes, the present value of future rents should cover the primary cost. The housing price-to-rent ratio (P-R ratio) reflects the length of time that rent can cover the purchase price and sheds light on the extent of a bubble. It also implies that the investment will take longer to recover if it does not achieve an equivalent increase in rents. In short, a higher P-R ratio means that the longer it takes for an investment to return, the more likely it is that a bubble exists in the housing market.
4.3. Control Chart for Housing Prices
Dipasquale and Wheaton (1996) argue that the size and growth of a region’s economy are key determinants of how its housing market evolves and changes over time [
33]. In theory, the indicator that captures the country’s economic development and inflation is per capita GDP (PCGDP). The growth of PCGDP implies that households can buy more goods and services. Studenmund and Gwartney (1997) suggest that there is no doubt that the primary indicator of economic growth is GDP, especially PCGDP [
34].
Economic growth is, to some extent, the prerequisite for income growth. In other words, if there is no bubble in the housing market, then the movement in housing prices and the movement of GDP growth should remain consistent. To measure housing bubbles, this study introduces the control chart, a statistical technique that consists of three lines: the middle line (μ), the upper control line (UCL), and the lower control line (LCL). The upper control line is the midline plus three times the standard deviation, and the lower control line is the midline minus three times the standard deviation, with a confidence level of 99.7%.
Specifically, the control chart technology is supported by the long equilibrium relationship between income and housing prices [
15,
35,
36,
37,
38]. In this study, we need to examine how fluctuations in housing prices deviate from those in PCGDP. To observe the abnormal volatility of housing prices, we use the standardized PCGDP growth rate as the midline, the midline plus three times the standard deviation of the PCGDP growth rate as the upper control line, and the midline minus three times the standard deviation of the PCGDP growth rate as the lower control line. The abnormal changes in housing prices beyond the upper control line suggest that housing prices are growing much more rapidly than GDP per capita, indicating an abnormal increase in housing prices or the potential existence of a bubble.
5. Data and Empirical Evidence
5.1. Indicator I: Deviation of Housing Prices from the Rational Expectation Price
This study defines the discount rate in Equation (8) as the risk-free interest rate (
) plus the risk premium (
), and replaces the rent (D) with the net operating income (NOI), which is equal to the market rent minus the property maintenance fee and other expenses. The translated form is as follows:
The 1-year Chinese government bond maturity rate is used in Equation (9) as the risk-free rate,
, and a value of 3% serves as a benchmark for the risk premium,
. NOI is assumed to be rent. Based on the specifications above,
Table 1 shows the considerable fluctuation in housing prices in Beijing over the last decade. Notably, the deviation in housing prices reached its peak between 2016 and 2017, suggesting that a bubble may have existed during that period. The largest deviation occurred in 2007, followed by the burst of housing prices the next year. On the contrary, housing prices appear to have been relatively undervalued in 2024 (
Table 1).
According to the situation in each district, the actual house prices in most districts in 2016 and 2017 were higher than the expected house prices, and there may have been a housing price bubble. However, the actual housing prices in 2024 are significantly lower than the expected housing prices. It is worth noting that, following the high housing prices in 2017, the housing prices in the Mentougou District and Yanqing were lower than expected in 2018 (
Table 2).
The above findings suggest that Beijing had the most likely housing market bubble between 2016 and 2017. In contrast, in 2024, actual house prices in Beijing were lower than expected prices.
5.2. Indicator II: Ratios of Price to Income
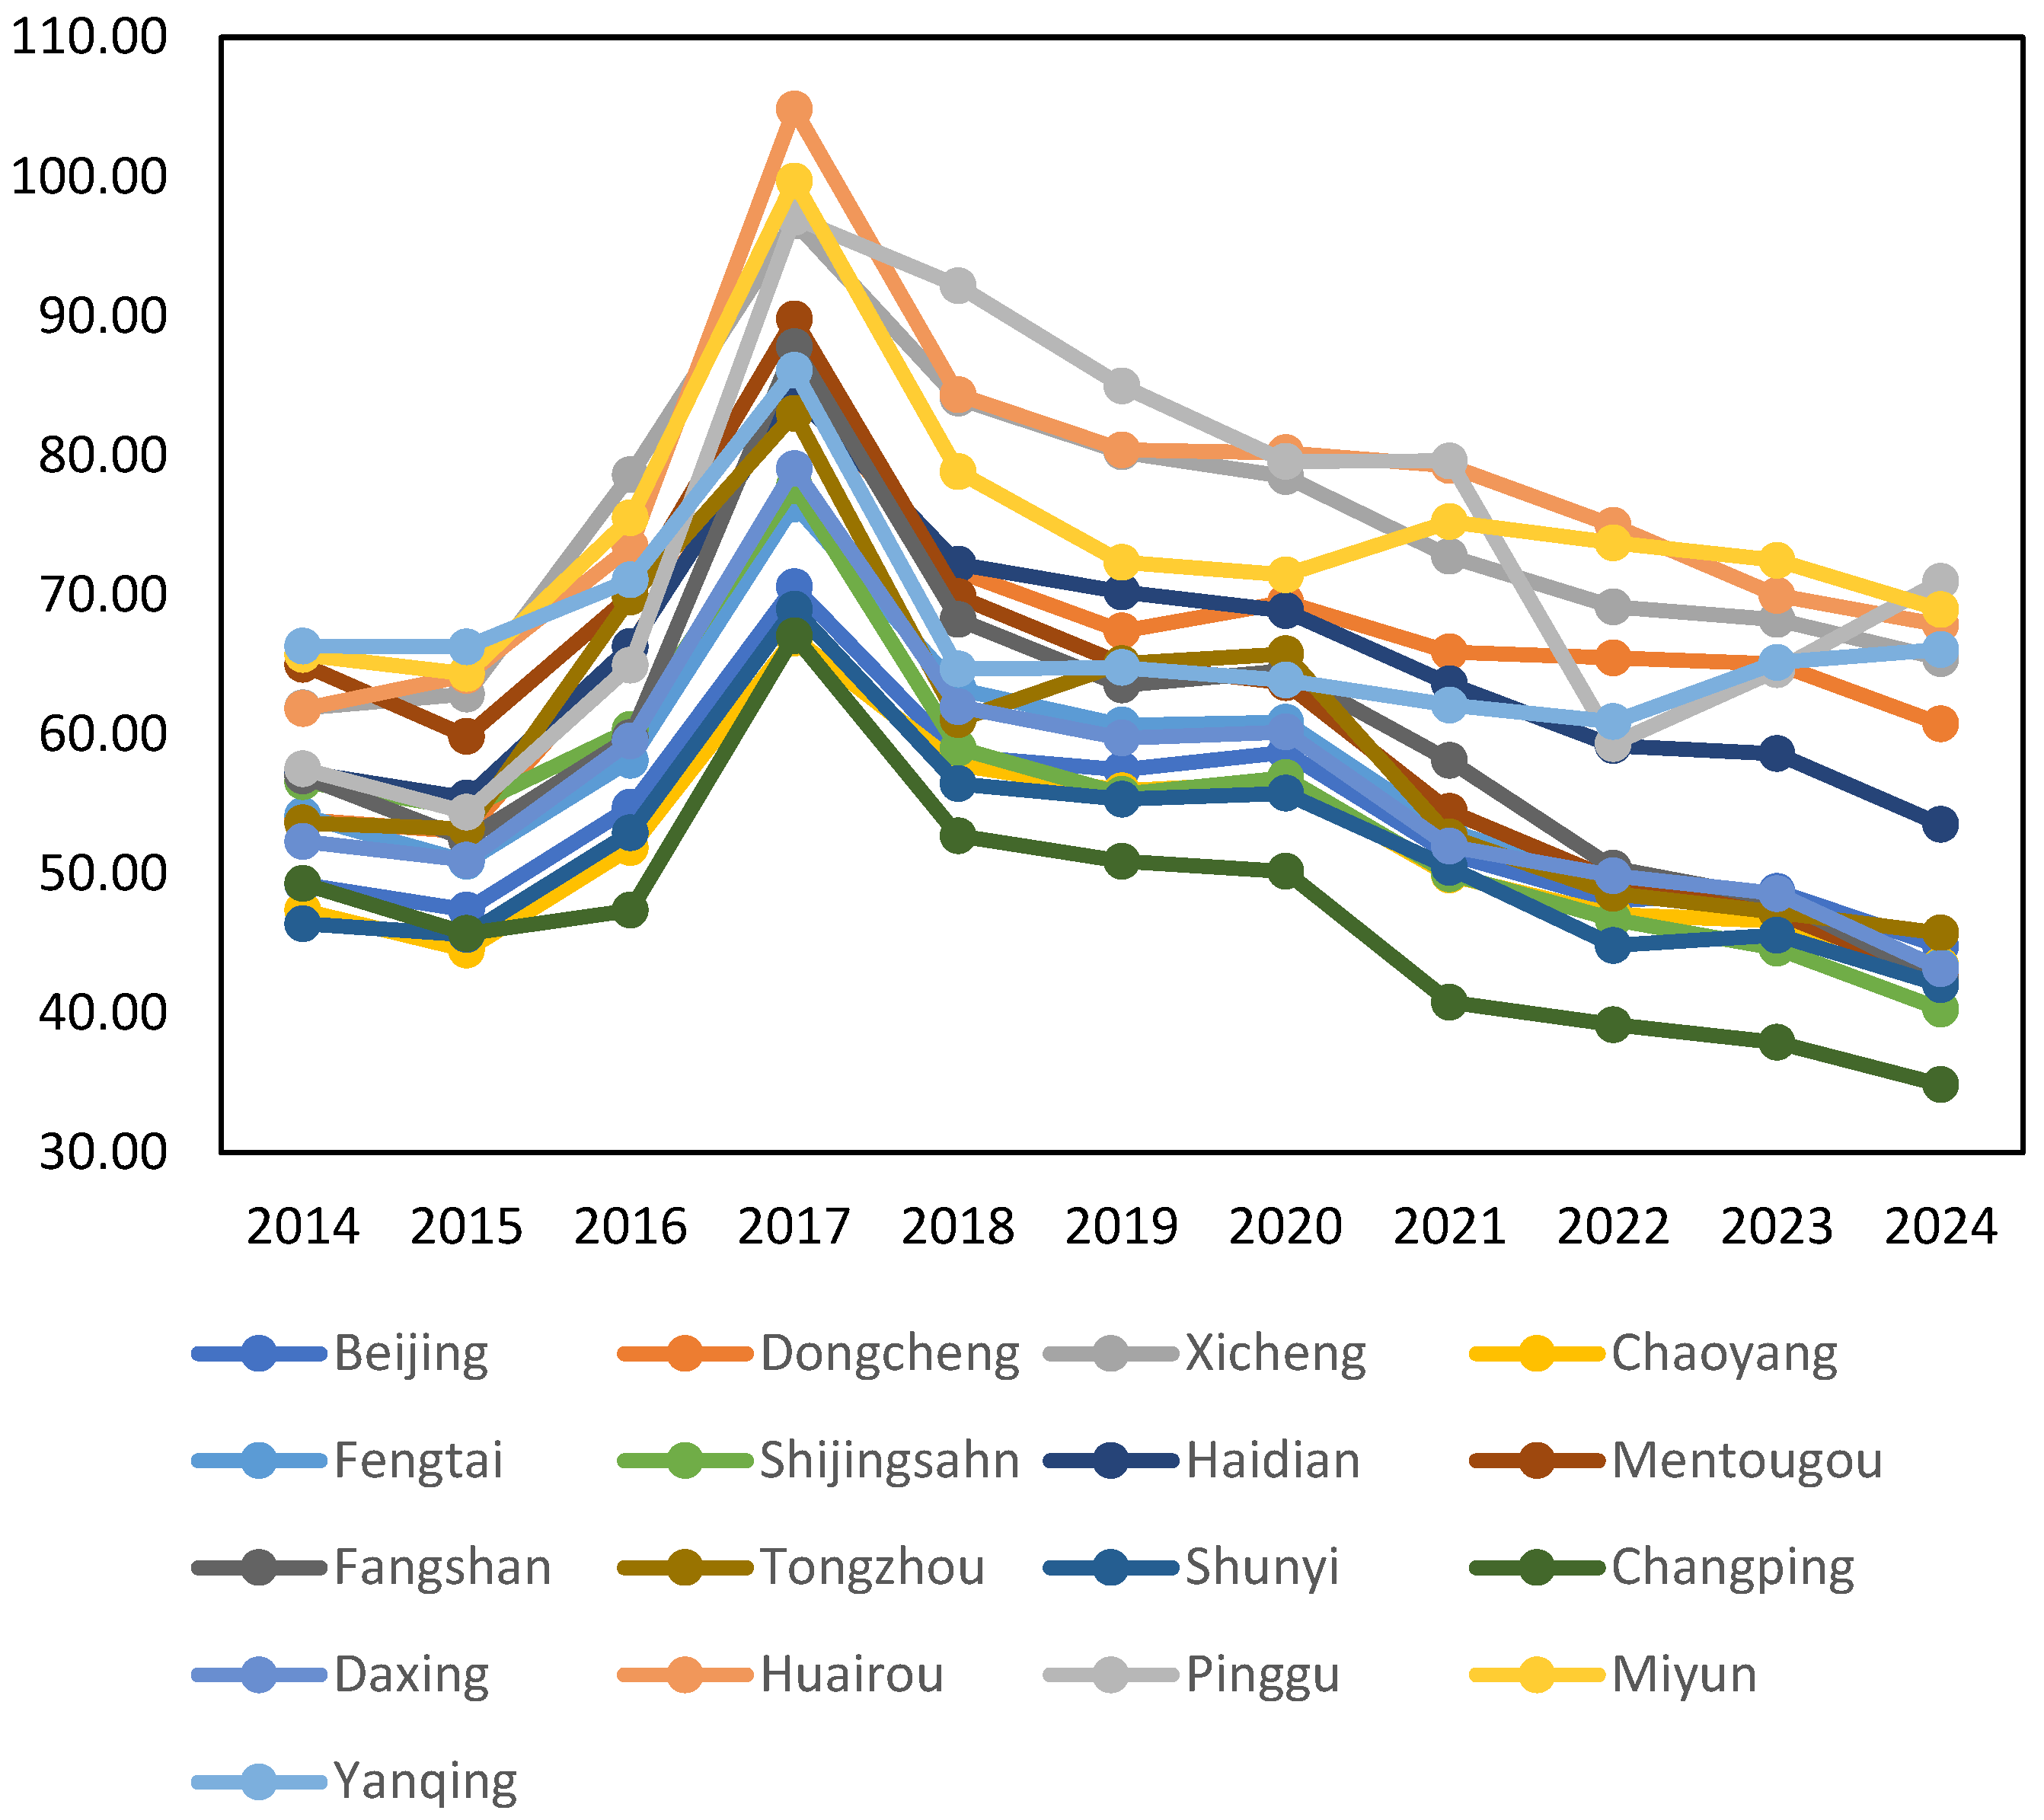
The housing price-to-income ratio (P-I ratio) is a primary indicator for describing the affordability of households. The ratio is calculated as the floor area per capita multiplied by the average price per square meter, and then divided by the household’s disposable income per capita for the year. A graphical representation of the P-I ratio is shown in
Figure 5. According to the graph, the P-I ratio was highest in 2017, indicating that housing prices increased much faster than income that year. Since 2017, the overall P-I ratio in Beijing has decreased, with most districts experiencing a reduction in the P-I ratio.
5.3. Indicator III: Ratios of Price to Rent
The housing price-to-rent ratio (P-R ratio) reflects the return on property investment. The ratio is calculated using the sales price per unit area of residential commercial housing as P and the annual rent per unit area as R.
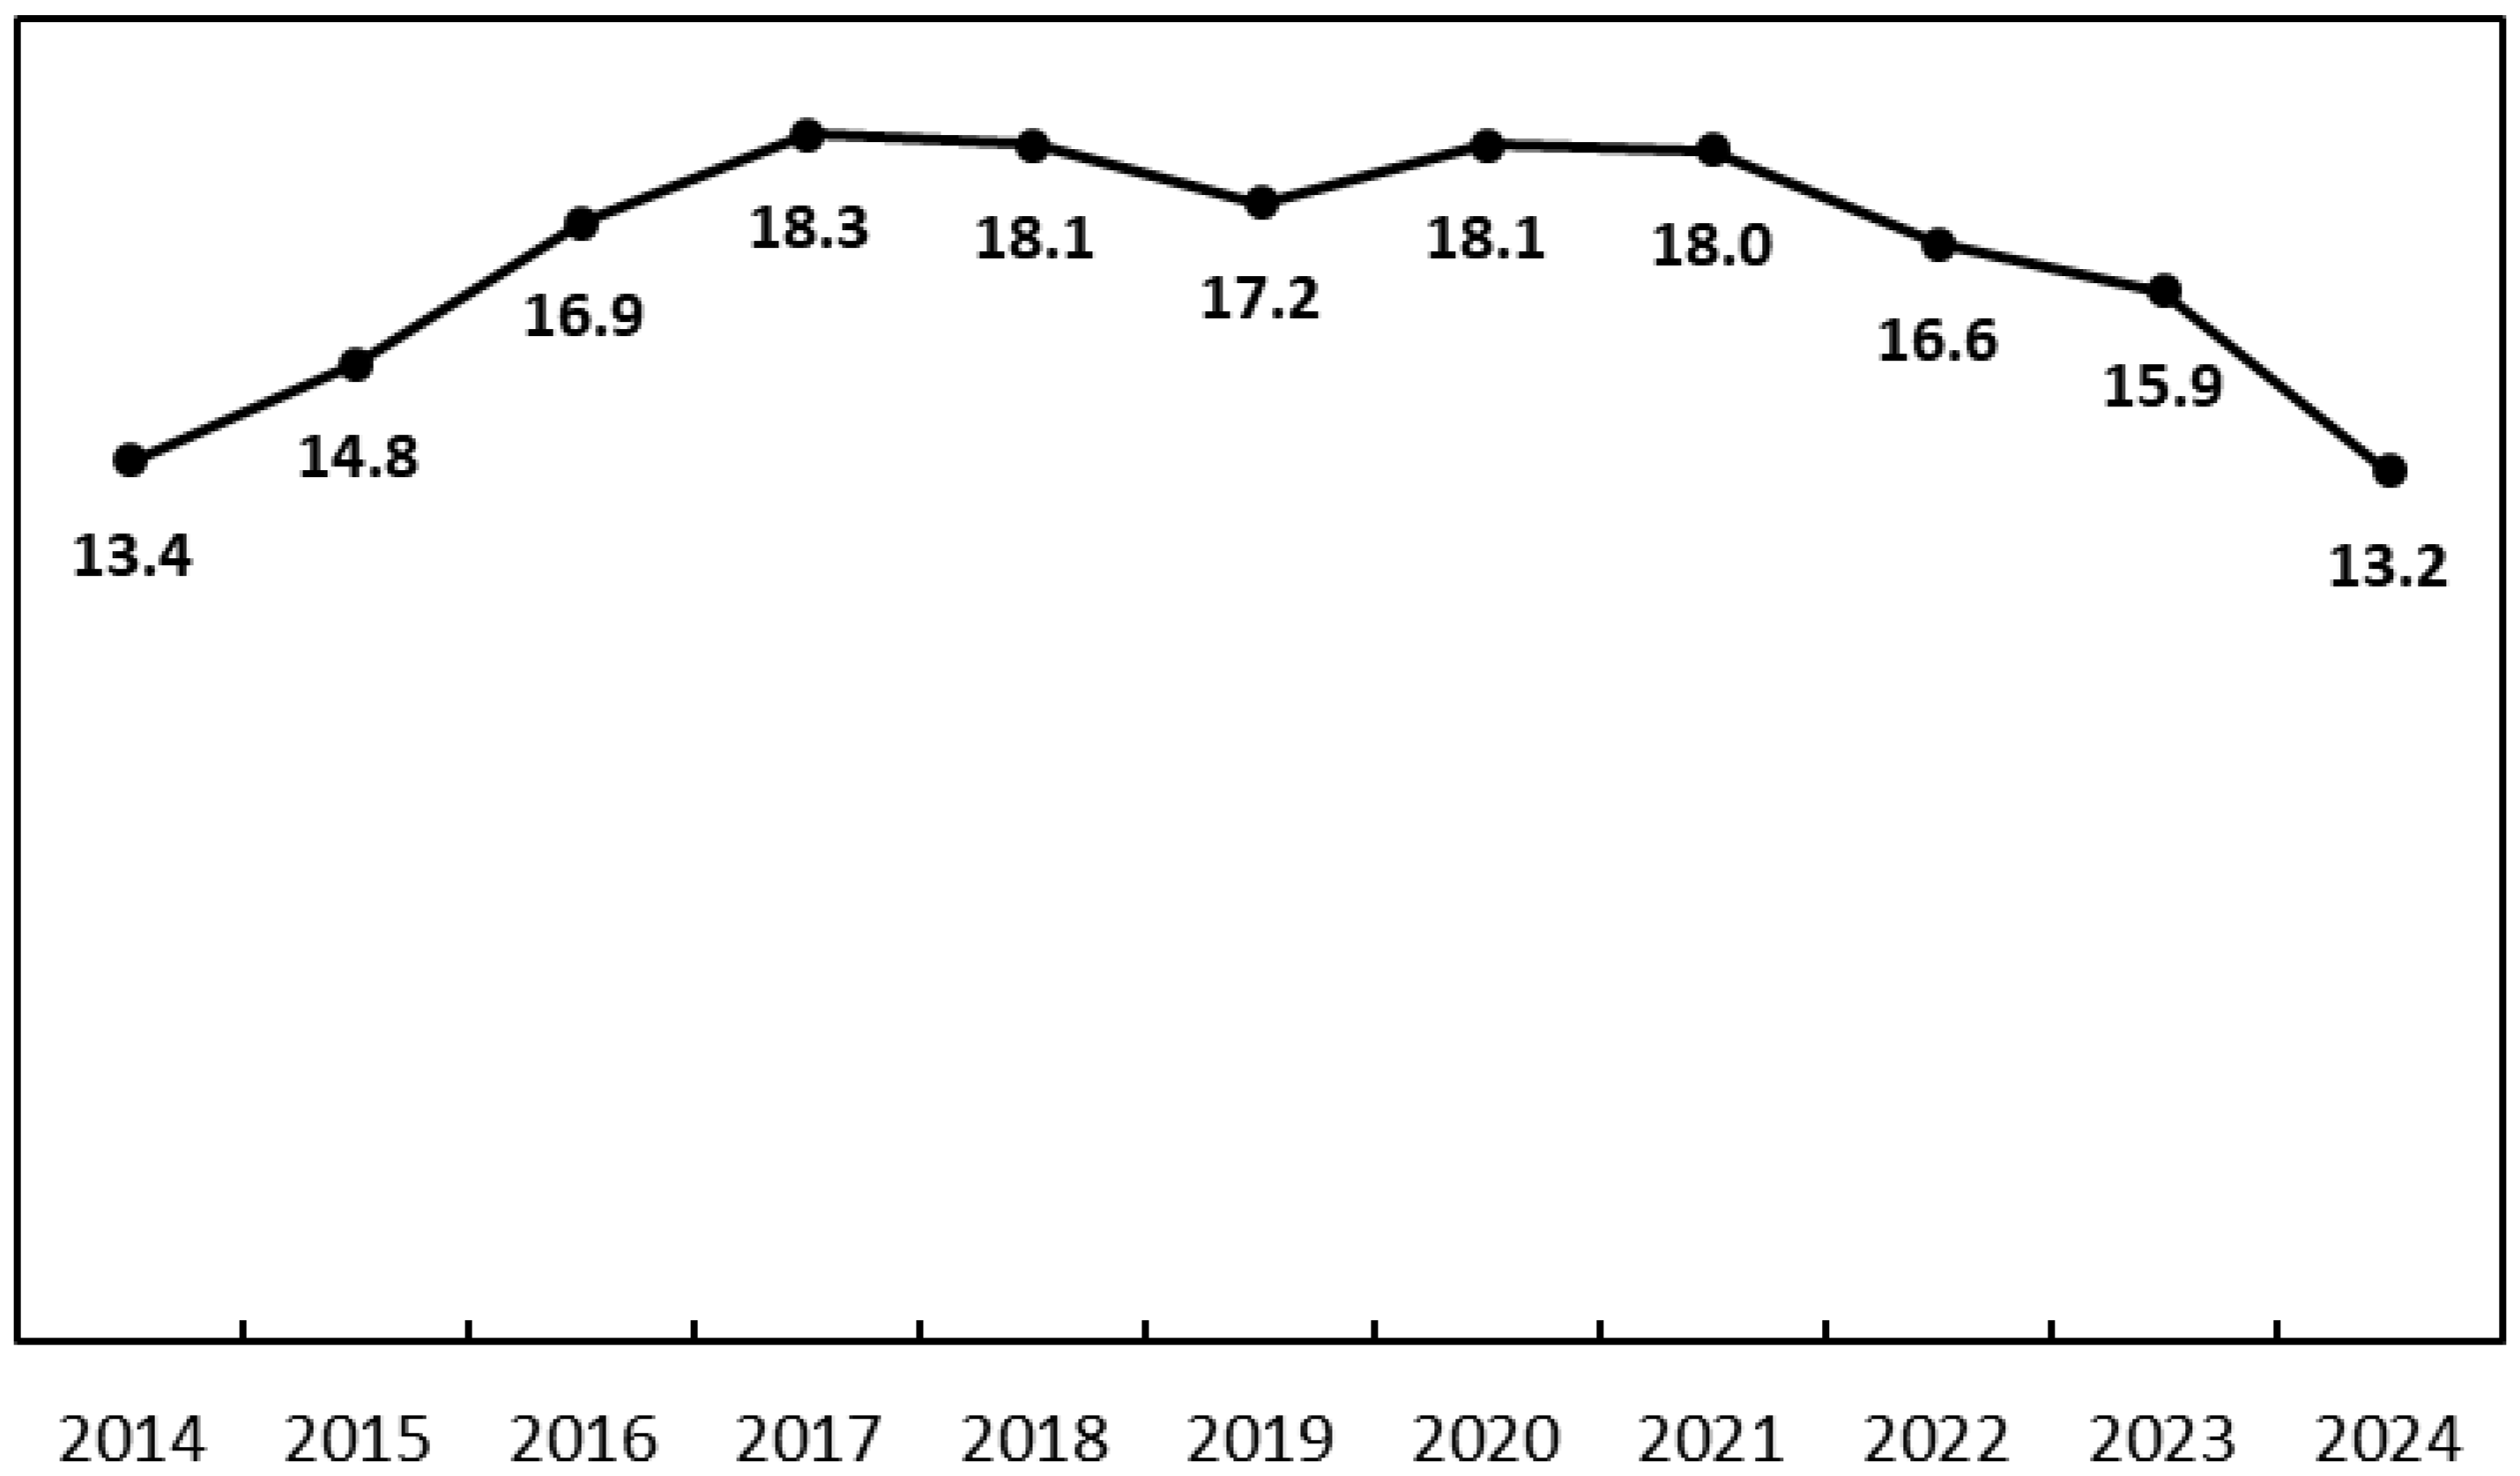
Figure 6 traces the average ratio calculated for Beijing from 2014 to 2024. It is generally believed that the ratios from 9 to 18 are considered to be within a normal range. However, the ratios exceeded 18 in 2017, 2018, 2020, and 2021, indicating that property investment in Beijing did not yield returns in these years. In other words, there may be a price bubble in the Beijing housing market in the coming years.
5.4. Indicator IV: Control Chart
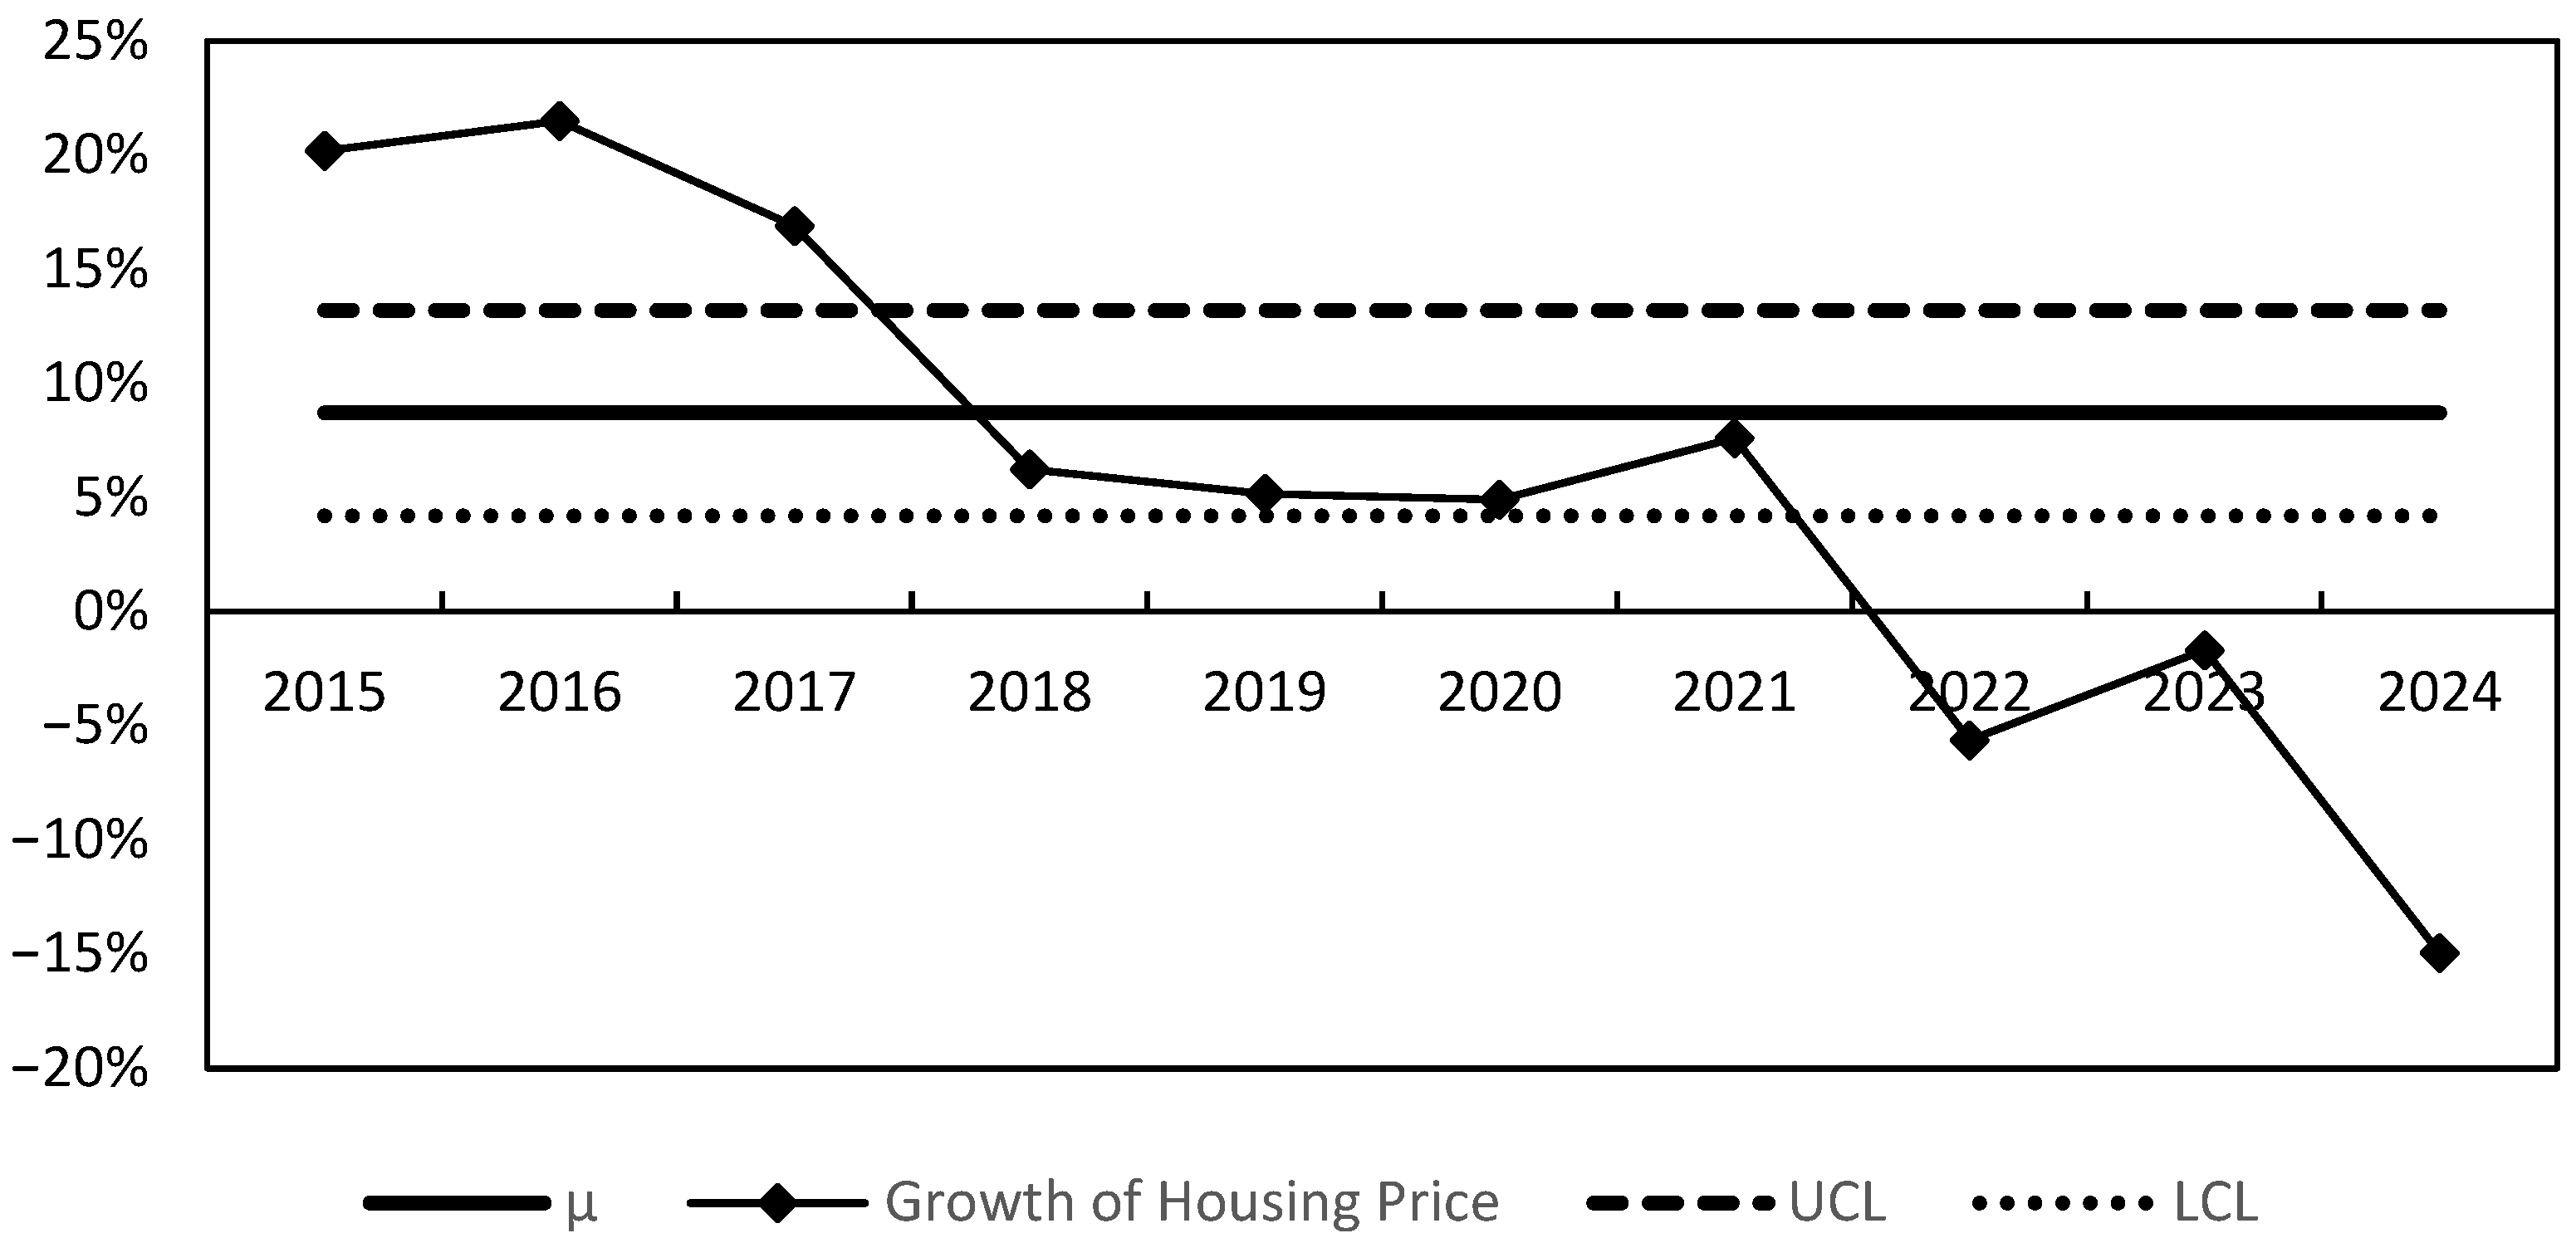
For the empirical control chart, it is essential to establish the three key control lines: the midline, the upper control line (UCL), and the lower control line (LCL). Using the available data, the average growth rate of PCGDP from 2015 to 2024 is set as the midline of the control chart. As for UCL and LCL, both lines are defined as the midline (μ) plus or minus 3δ, where μ denotes the average growth rate of PCGDP and δ refers to the standard deviation of the growth rate of PCGDP. The specifications of the control chart are described in
Table 3.
In this section, we use the control chart to measure the housing price bubble (Hou, 2010) [
39].
Figure 7 shows the housing price growth rates plotted against the three lines (μ, UCL, LCL). The growth rates of housing prices fluctuated abnormally beyond the upper control line (UCL) in 2015, 2016, and 2017, with growth rates of 20.18%, 21.49% and 16.89%, respectively. This suggests that housing prices perhaps deviated from the fundamental economy in these years and that a bubble may exist. It is worth noting that the growth rate of housing prices in 2022, 2023, and 2024 was significantly below the lower control line (LCL), indicating that housing was possibly undervalued in these years.
5.5. Summary Analysis
Based on a comparative analysis of the results from the four indicators above, this study has some interesting findings about the housing price bubble in Beijing. The results imply that housing prices seem to be motivated by strong expectations in Beijing. The change in housing prices increased rapidly. During this period, there were some significant years when the growth of housing prices appeared to be beyond the normal level, as shown in
Table 4. Coincidentally, all four indicators show that abnormal changes in housing prices happened in 2017. This implies that each indicator reinforces the finding that a bubble formed during these years.
6. Discussion
The study revealed signs of a price bubble between 2016 and 2017, as indicated by multiple indicators, including the rational expectations model, P-I and P-R ratios, and control chart analysis. The results are largely consistent with prior studies that have identified speculative behavior and price deviations in major Chinese cities (Arestis and Zhang, 2020 [
40]; Fan et al., 2019 [
41]; Glaeser et al., 2017 [
21]). However, our study contributes to the literature by utilizing district-level data over a decade, which enables a more detailed understanding of the formation and distribution of bubbles.
Significantly, the rational expectations model revealed positive deviations in 2016 and 2017, suggesting that housing prices in Beijing exceeded the level justified by economic fundamentals. This aligns with the findings of Shih et al. (2014), who highlighted the spillover effects of housing bubbles from core urban areas to surrounding regions [
20]. Our district-level analysis further supports this view, showing that suburban districts, such as Huairou, Pinggu, and Miyun, experienced considerably large deviations, possibly due to speculative inflows from central areas.
Alternatively, the P-I and P-R ratios also peaked during the same period, indicating declining affordability and diverging investment returns—a pattern similarly observed in studies of Chinese super cities (Chen et al., 2019 [
42]; Hui & Shen, 2006 [
16]). The fact that these ratios remained elevated in certain years beyond 2017 suggests that the market correction was neither immediate nor uniform across districts.
Moreover, the control chart analysis revealed that housing price growth rates exceeded the upper control limit between 2015 and 2017, signaling abnormal volatility. This finding is consistent with Lind’s (2009) view, who argued that housing bubbles often result from a confluence of macroeconomic, credit, and behavioral factors [
13]. The subsequent price decline below the lower control line between 2022 and 2024 may reflect the combined effects of tightening regulatory policies, slowing income growth, and the broader economic impact of the COVID-19 pandemic.
While our multi-indicator approach strengthens the validity of bubble detection, it also highlights the complexity of defining and measuring housing bubbles. As noted by Himmelberg et al. (2005), what appears as a bubble in one model may be explained by fundamentals in another [
22]. Our study shows that single indicator is insufficient; rather, a combination of methods offers a comparatively reliable diagnosis. This integrative approach is particularly relevant in the context of China’s unique institutional and market structures, where government and land supply policies play a critical role in housing price dynamics (Zhao, 2015 [
25]; Han, 2010 [
23]).
In light of these reflections, further research could explore the role of digital platforms and cross-regional capital flows in amplifying or mitigating housing price volatility. Additionally, longitudinal studies tracking post-bubble market adjustments would provide valuable insights into the resilience and maturity of Beijing’s real estate market.
7. Conclusions and Policy Implications
To investigate whether a housing price bubble exists in Beijing, this study employs four different measures, including the rational expectations model, P-I ratio, P-R ratio, and control chart, using data spanning from 2000 to 2021. This study suggests that a bubble may have existed or aggregated between 2016 and 2017. There is evidence of larger deviations between actual prices and expected prices, larger housing price-to-income ratios (P-I ratios), larger housing price-to-rent ratios (P-R ratios), and significantly higher housing price growth rates compared to per capita GDP (PCGDP) growth rates. From different perspectives, the results of all indices interestingly strengthen the findings that there have perhaps been several bubbles in past decades.
This study suggests that the number of households in Beijing has been increasing over the past few decades, and this has generated a huge demand for housing. However, the amount of newly completed housing has not kept pace with Beijing’s rapid urbanization, as there is a two-year lag in new construction. In fact, housing prices have increased rapidly as a result of the huge gap between housing demand and supply. On the other hand, the per capita disposable income has not grown at the same rate, but rather at an actually slower pace, in line with the housing prices in Beijing. This implies that housing payments have become more burdensome, and affordability is decreasing for most households in Beijing. Consequently, the combination of high property prices and lower affordability will likely contribute to the formation of a housing bubble in the market.
This study also found that Huairou, Pinggu, and Miyun experienced large price bubbles between 2016 and 2017, while Changping, Shunyi, and Chaoyang experienced relatively small bubbles. Preventing a real estate bubble is a complex issue that requires a comprehensive consideration of the actions and decisions of the government, financial institutions, developers, investors, and consumers. The following suggestions are put forward to further optimize and perfect the housing transaction and supply policies and measures.
Implement real estate market supervision measures: The government can limit speculation in the real estate market by making laws, strengthening supervision, raising taxes, and taking other measures, such as limiting the number of people who can buy homes, controlling the interest rate of housing loans, and strengthening the approval and supervision of real estate developers.
Strengthen housing security: The government can increase investment, expand the coverage of housing security, improve the quality and quantity of housing security, and reduce the tightness of housing demand to relieve the pressure on the real estate market.
Encourage the development of the leasing market: The government can formulate preferential policies to support the development of the leasing market, increase the supply of the leasing market, and reduce the cost of leasing to relieve the pressure on the demand for housing.
