A Computational BIM-Based Spatial Analysis Method for the Evaluation of Emergency Department Layouts
Abstract
1. Introduction
1.1. Aim and Scope of the Study
1.2. Research Gap and Contribution
1.3. Research Questions
- How can Building Information Modelling (BIM) be integrated with spatial analysis (space syntax) methods to evaluate the performance of hospital emergency department layouts, and which spatial metrics are most relevant for assessing critical design factors such as accessibility, visibility, and privacy from both patient and nurse perspectives?
- How can the proposed BIM-based workflow be validated, and what are its main advantages and limitations compared to conventional space syntax tools?
1.4. Paper Structure
2. Literature Review
2.1. Overview of Spatial Analysis and Space Syntax
2.2. Overview of BIM-Based Spatial Analysis Method
2.3. Overview of Spatial Analysis in Hospital Design and Evaluation
3. Research Design and Methods
3.1. Conceptual Framework for Accessibility and Visibility in Hospital Design
3.2. Challenges and Assessment Criteria in Spatial Analysis of Hospital Design
3.2.1. Patients: Accessibility and Visibility Challenges
Wayfinding and Spatial Measures
Emergency Accessibility and Spatial Measures
Privacy and Spatial Measures
3.2.2. Nurses: Accessibility and Visibility Challenges
Accessibility and Spatial Measures
Visibility and Spatial Measures
3.3. Tools and Computational Framework
- Limitations of Traditional Space Syntax Tools
- Proposed Computational BIM-Based Spatial Analysis Method
AVA Package for Spatial Analysis in BIM Workflows
- Accessibility analysis is performed at a low height (~0.03 m) to represent movement pathways.
- Visibility analysis is conducted at a specified ViewHeight, where geometry is considered an obstacle.
- Accessibility: Nodes are connected if they are on the same level and free of obstacles. Additional connections are defined for stairs and ramps.
- Visibility: Nodes are connected only when there are no obstacles between them.
- The AVA package supports 3D spatial analysis across multiple floors by representing stairs and ramps as weighted connection lines based on stair length and a single turn. Custom connections, including elevators, can also be defined using the Revit adaptive family and integrated into the analysis through tailored weight assignments.
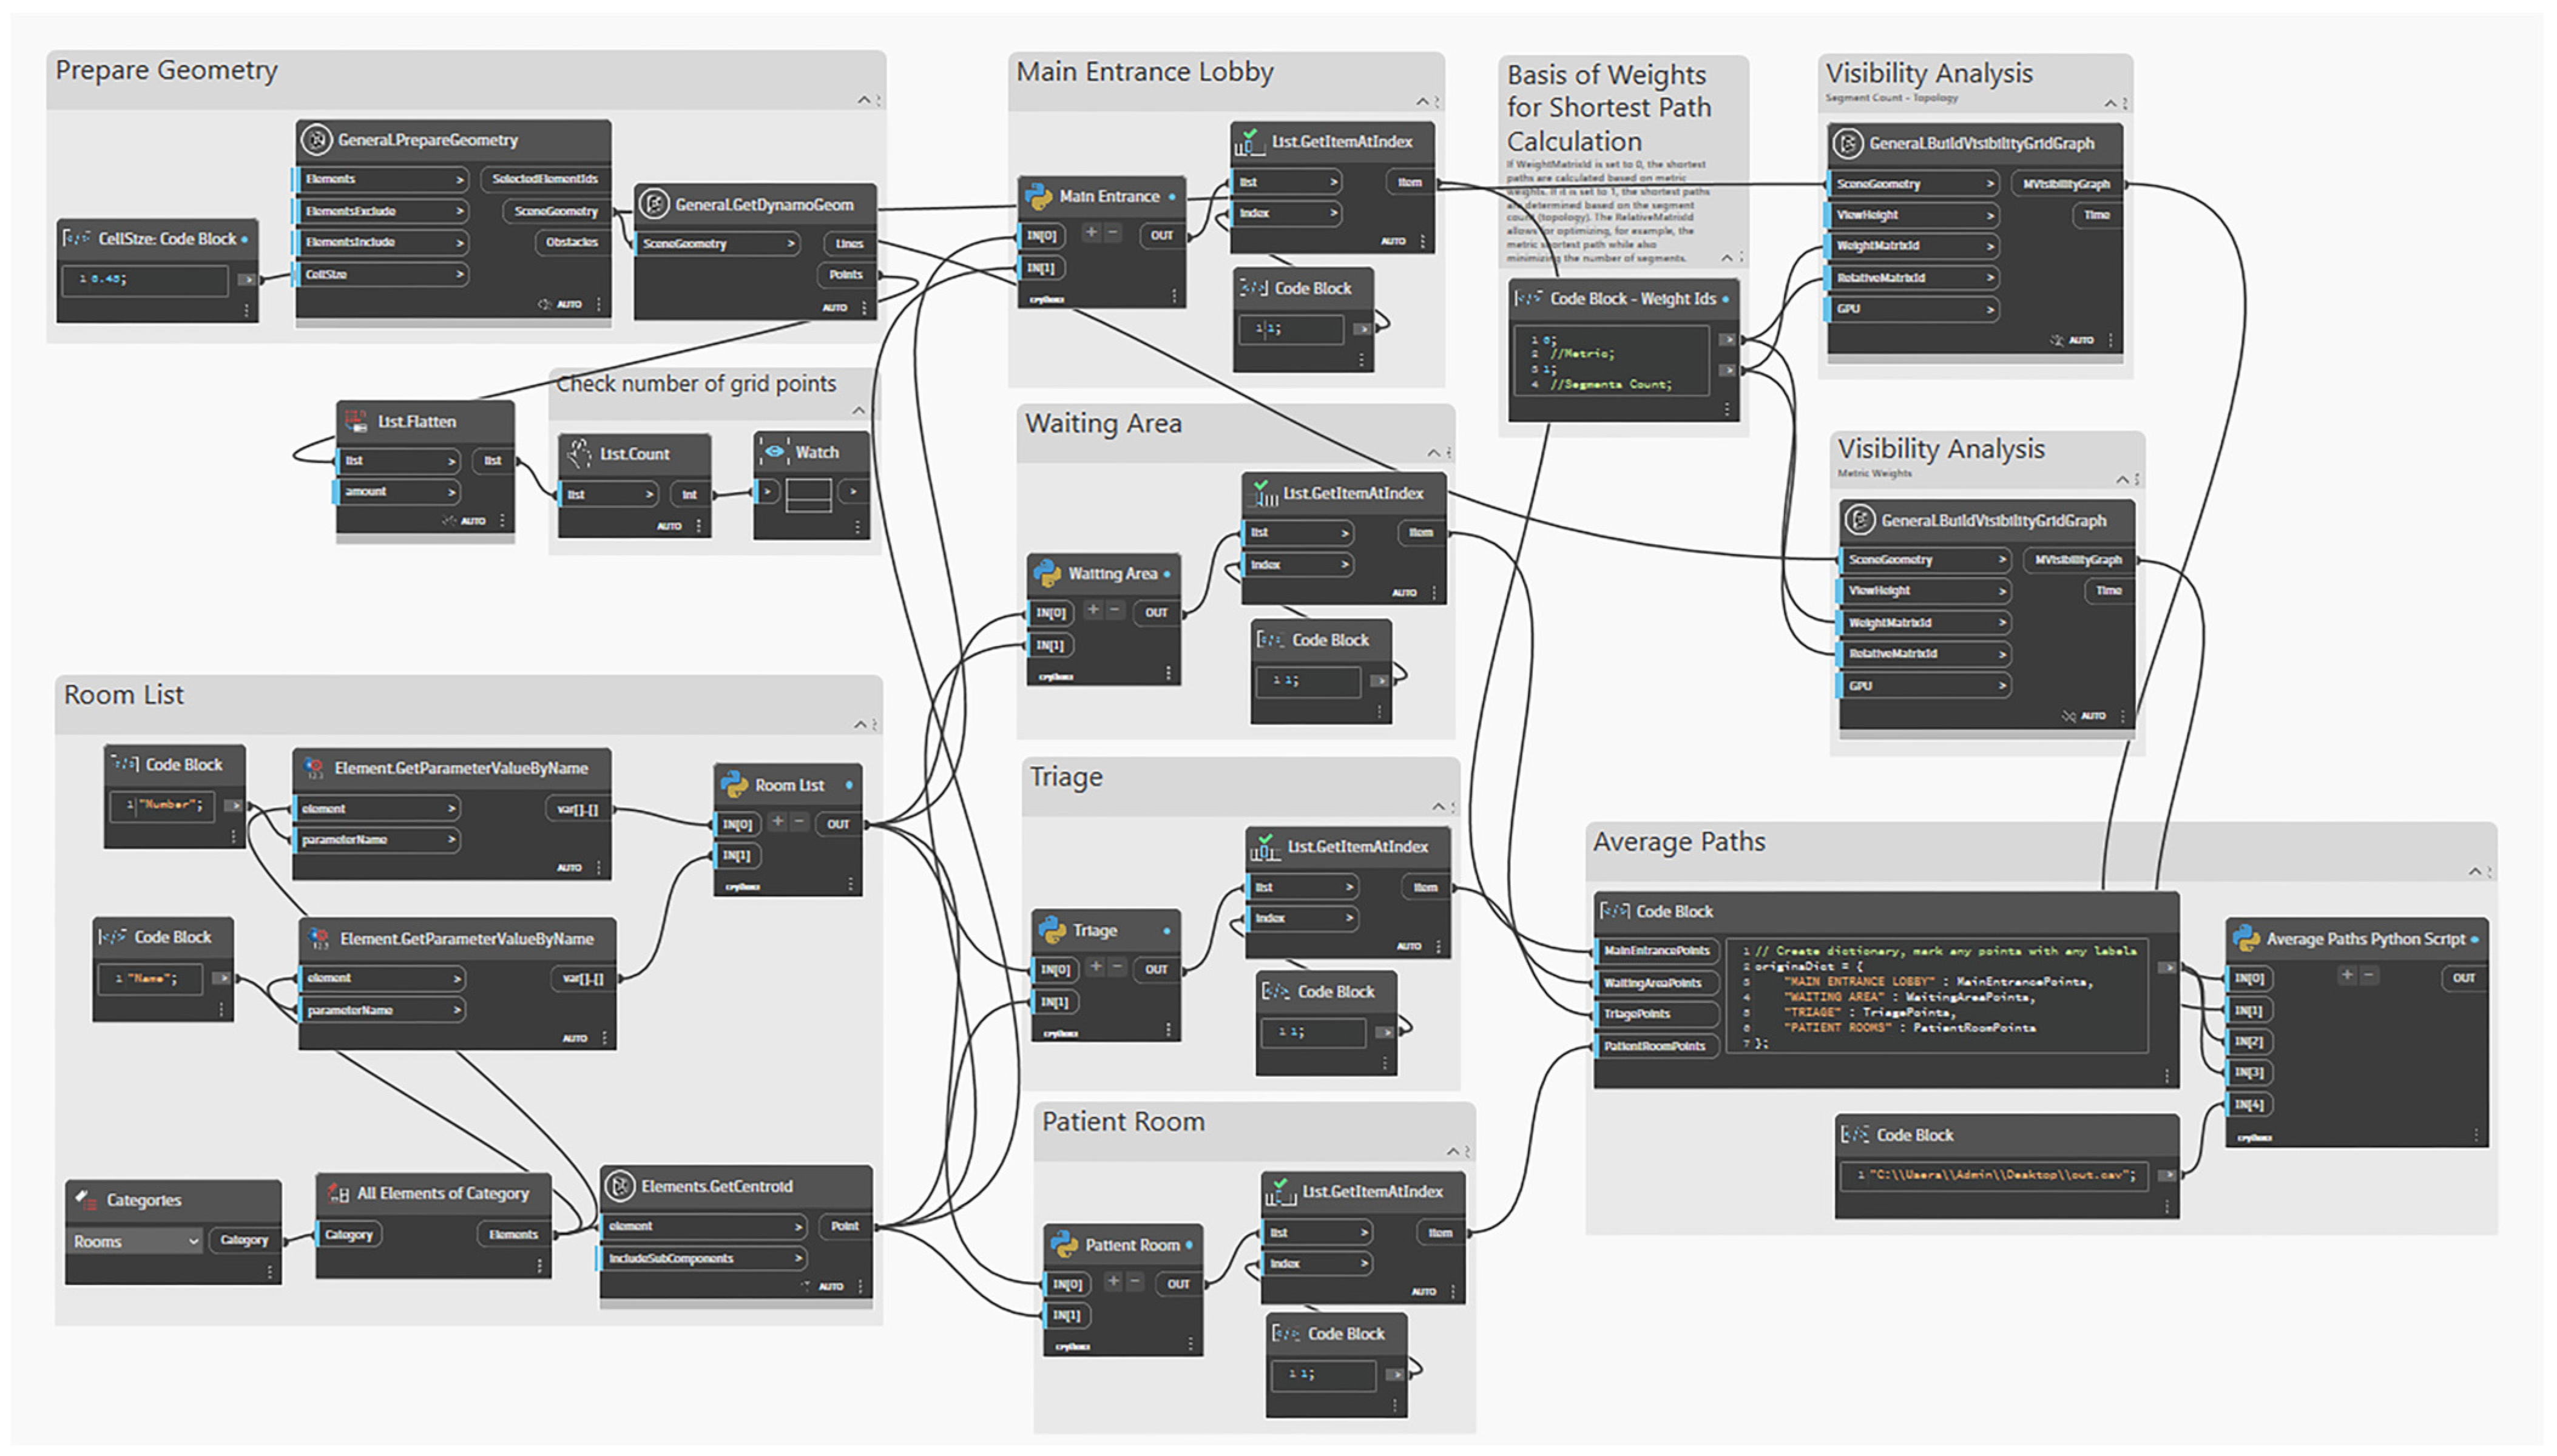
- If WeightMatrixId = 0 → shortest paths are calculated based on metric weights.
- If WeightMatrixId = 1 → shortest paths are determined by segment count (topology).
- The RelativeMatrixId allows for optimising one parameter (e.g., metric distance) while also minimising another (e.g., number of segments).
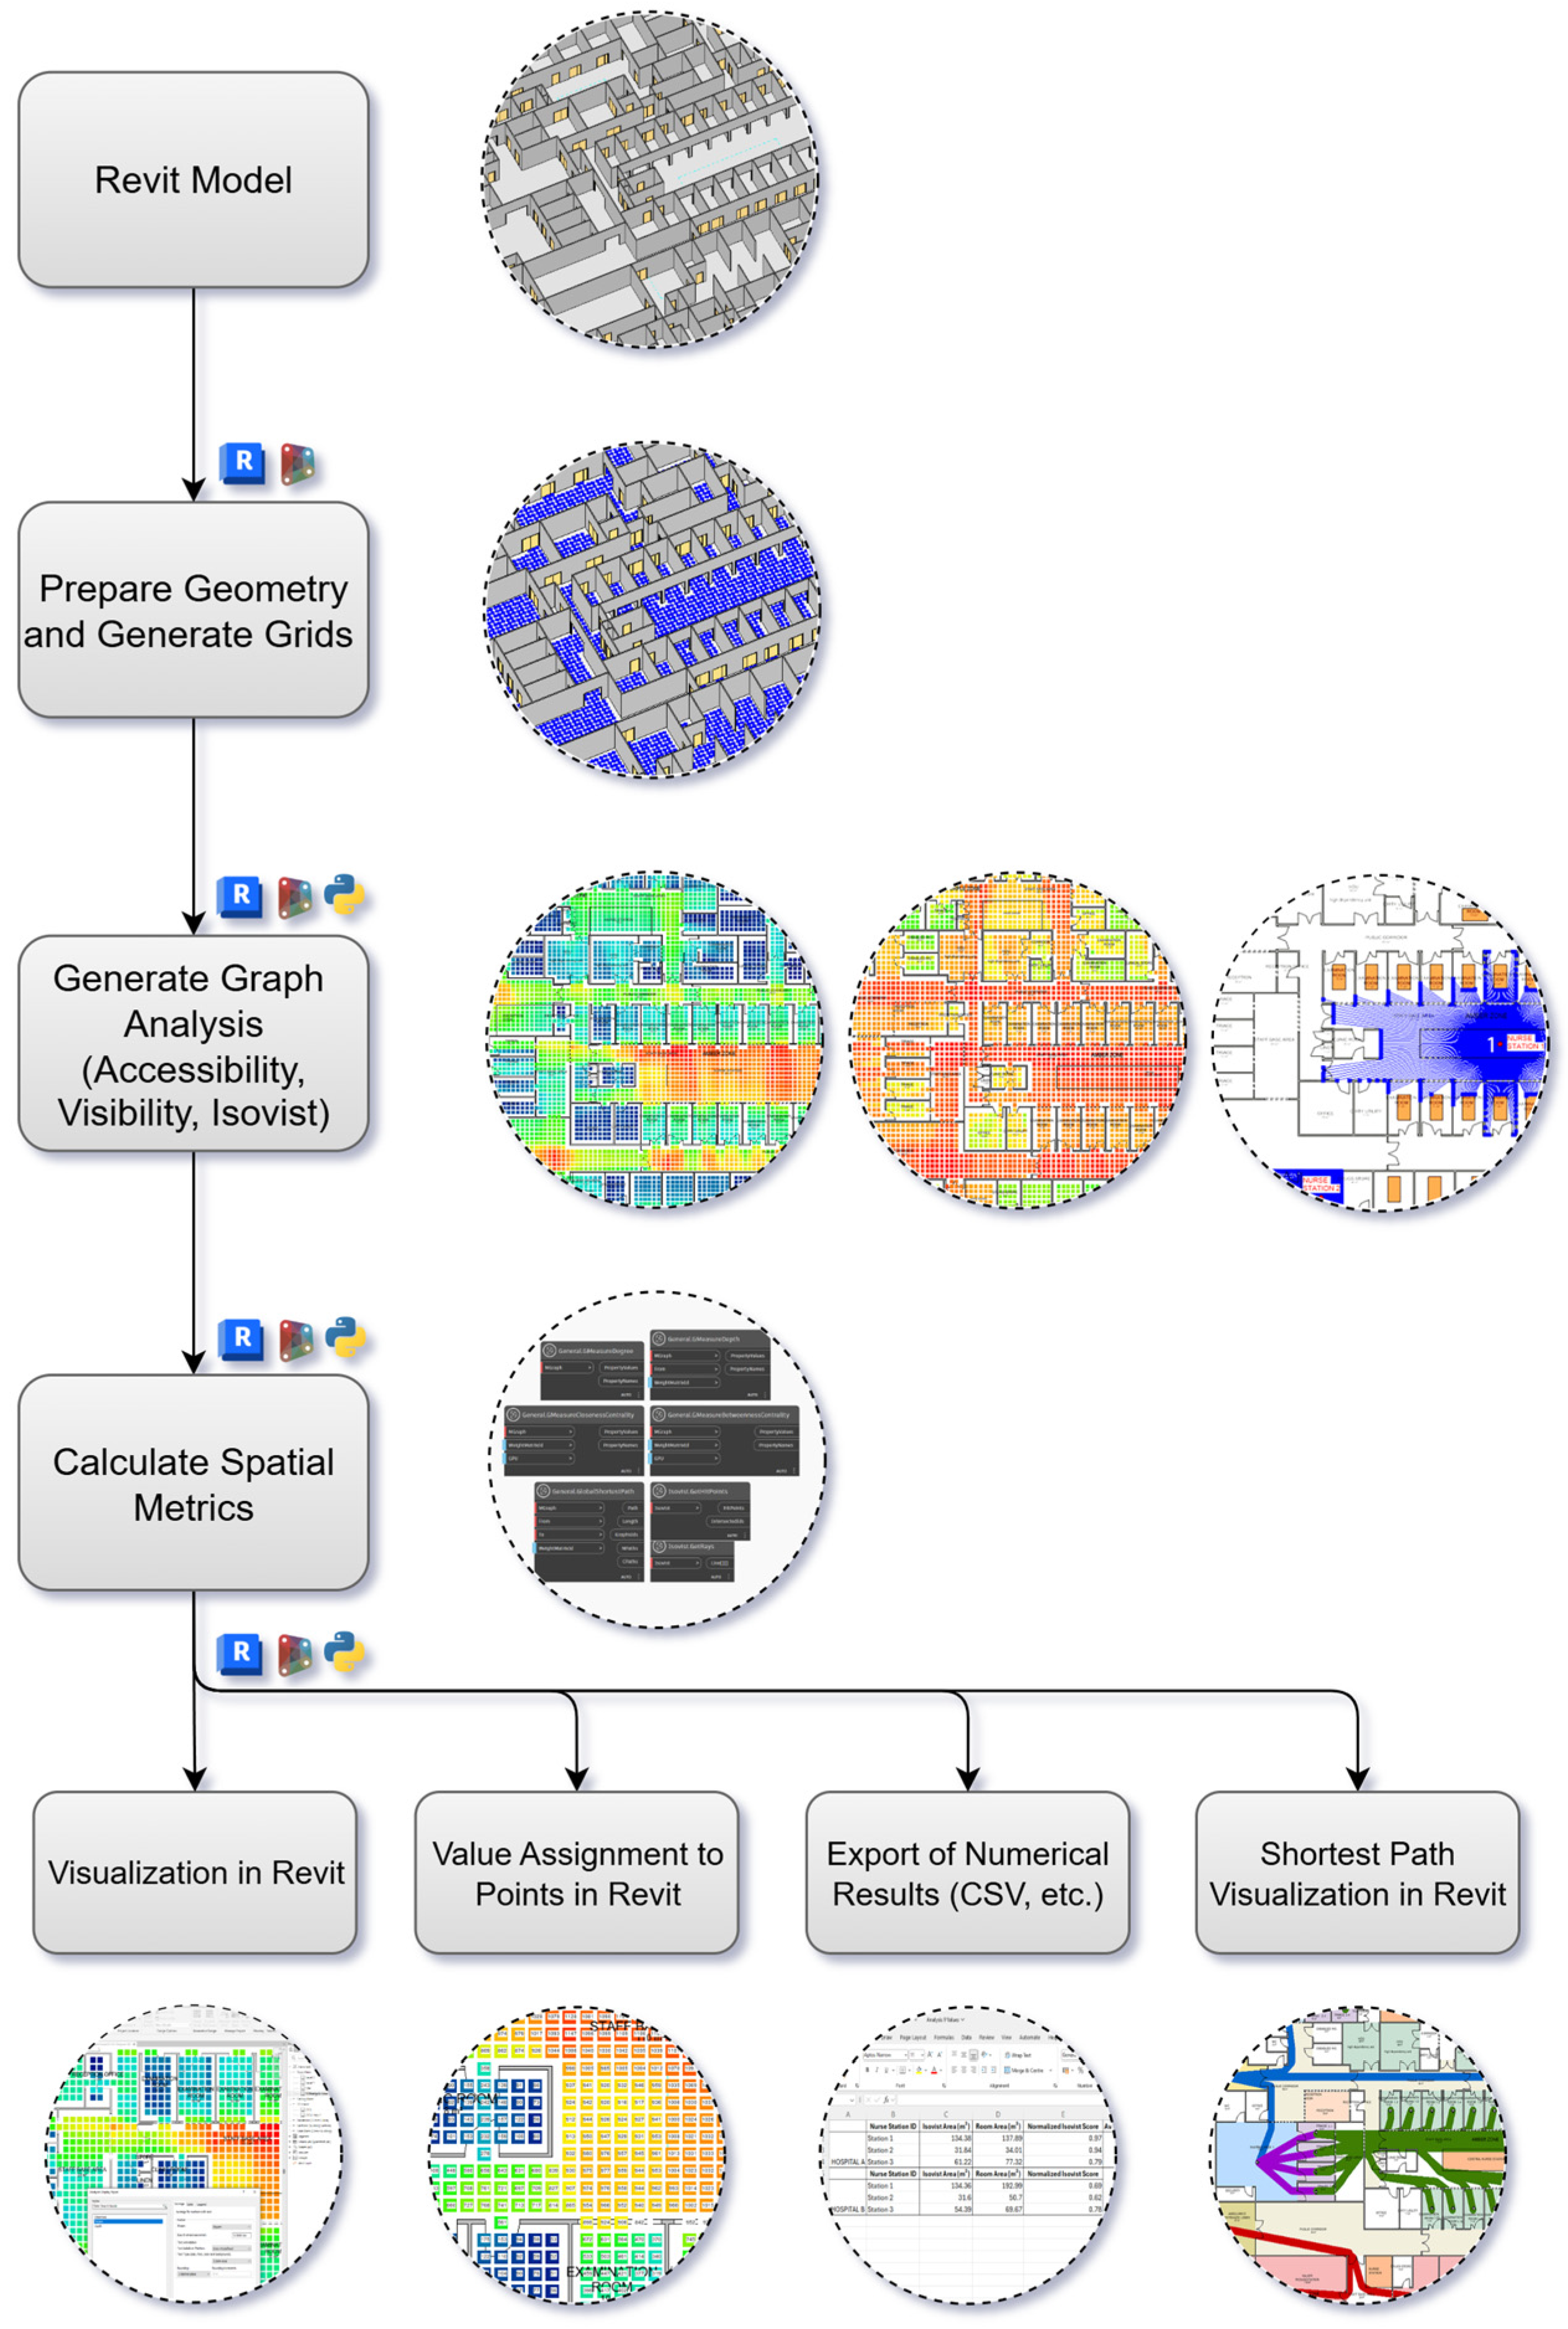
- 1.
- Prepare Geometry and Generate Grids: Within Dynamo, the Revit geometry is defined, and a computational grid is generated to discretise the spatial domain. Specific tags are applied to control which elements are included in the analysis. For instance, floors can be tagged as #NonGrid to exclude them from grid generation, while doors and windows are tagged as #IsObstacle to represent closed conditions that block visibility or accessibility. This step ensures that only relevant architectural components are included in the analytical model.
- 2.
- Generate Graph Analysis: Accessibility, visibility, and isovist graphs are generated to represent different aspects of spatial performance. The accessibility graph calculates the shortest paths between spaces, the visibility graph captures visual interconnections, and the isovist graph defines the visible area from a specific point or node. Together, these graph types form the structural basis for subsequent quantitative analysis.
- 3.
- Calculate Spatial Metrics: Once the graphs are generated, spatial metrics are computed using the AVA package. These include general graph-based measures such as General.GMeasureDegree, General.GMeasureDepth, General.GMeasureClosenessCentrality, and General.GMeasureBetweennessCentrality. Additionally, isovist-based metrics are calculated for each grid point to quantify visibility and spatial reach. The results are stored in Dynamo and linked to the Revit model for visualisation and evaluation.
- 4.
- Visualize and Export Results: The analysis results are visualised in Revit using the VisualizeResultsBasedOnView function, enabling real-time interpretation of accessibility and visibility patterns. Values are assigned to grid points for detailed inspection, and results can be exported via SaveViewAnalysisResults (e.g., CSV) for further analysis. The workflow also visualises the shortest paths between key areas, supporting the evaluation of travel efficiency and connectivity.
4. Case Study: Comparative Spatial Analysis of Emergency Departments
4.1. Spatial Analysis from the Patient Perspective
4.1.1. Analysis 1: Connectivity of Public Corridors
- Validation of Results with DepthmapX
4.1.2. Analysis 2: Integration of Public Corridors
4.1.3. Analysis 3: Visibility of Reception Area from Main Entrance
4.1.4. Analysis 4: Step Depth and Metric Distance Analysis of Walk-In Patient Flow (Main Entrance to Patient Rooms)
4.1.5. Analysis 5: Emergency Accessibility Analysis—Step Depth and Metric Distance of Ambulance Arrivals (Ambulance Entrance to Resuscitation Area)
4.1.6. Analysis 6: Privacy Analysis—Integration of Patient Rooms
4.2. Spatial Analysis from the Nurse Perspective
4.2.1. Analysis 7: Integration of Nurse Stations
4.2.2. Analysis 8: Visual Connectivity of Nurse Stations
4.2.3. Analysis 9: Visibility from Nurse Stations
4.2.4. Analysis 10: Visibility of Patient Areas from Nurse Stations
5. Discussion
5.1. Interpretation of Spatial Findings
5.2. Methodological Contribution and Novelty
5.3. Broader Implications for Evidence-Based Healthcare Design
6. Conclusions
Author Contributions
Funding
Data Availability Statement
Acknowledgments
Conflicts of Interest
Abbreviations
| AEC | Architecture, Engineering, and Construction |
| AVA | Accessibility and Visibility Analysis |
| BIM | Building Information Modelling |
| EBD | Evidence-Based Design |
| ED | Emergency Department |
| GIS | Geographic Information Systems |
| POE VGA | Post-Occupancy Evaluation Visibility Graph Analysis |
Appendix A
| # Load the Python Standard and DesignScript Libraries import sys import clr clr.AddReference(’ProtoGeometry’) clr.AddReference(’[DynamoPackages]/AVA/bin/Grafit’) clr.AddReference(’[DynamoPackages]/AVA/bin/GrafitRevit’) from Autodesk.DesignScript.Geometry import * from Grafit import * from GraFitRevit import * import csv # The inputs to this node will be stored as a list in the IN variables. dataEnteringNode = IN # Inputs visibilityGraphMetric = IN[0] # Graph object for metric distances visibilityGraphStep = IN[1] # Graph object for steps originsDictionary = IN[2] # Dictionary<string, List[Point]> destsDictionary = IN[3] # Dictionary<string, List[Point]> outputFilePath = IN[4] # Extract activity types originTypes = list(originsDictionary.keys()) destTypes = list(destsDictionary.keys()) activityTypes = list(set(originTypes + destTypes)) # Merge all unique types numActivities = len(activityTypes) # Initialize the result table resultTable = [[None for _ in range(numActivities)] for _ in range(numActivities)] # Function to convert Dynamo Point to APoint using CWPoint and CRUtils def convert_to_apoint(dynamoPoint): xInInches = dynamoPoint.X / 0.3048 yInInches = dynamoPoint.Y / 0.3048 zInInches = dynamoPoint.Z / 0.3048 return CWPoint(xInInches, yInInches, zInInches) # Helper function to find the closest node def get_closest_node(graph, point): cw_point = convert_to_apoint(point) result = graph.ClosestNodeToPointDyn(cw_point) return result.Item1, result.Item2 # Calculate average distances and steps for i, typeFrom in enumerate(activityTypes): origins = originsDictionary.get(typeFrom, []) for j, typeTo in enumerate(activityTypes): if j <= i: continue destinations = destsDictionary.get(typeTo, []) if not origins or not destinations or i == j: continue metricDistances = [] stepCounts = [] for origin in origins: graphFromIndex, nodeFromIndex = get_closest_node(visibilityGraphMetric, origin) for destination in destinations: graphToIndex, nodeToIndex = get_closest_node(visibilityGraphMetric, destination) metricDistance = visibilityGraphMetric.GetShortestPathDistance( nodeFromIndex, graphFromIndex, nodeToIndex, graphToIndex, 0 ) stepDistance = visibilityGraphStep.GetShortestPathDistance( nodeFromIndex, graphFromIndex, nodeToIndex, graphToIndex, 1 ) print(f"step distance from origin {typeFrom} to destination {typeTo} = {stepDistance}") metricDistances.append(metricDistance) stepCounts.append(stepDistance) avgMetric = sum(metricDistances) / len(metricDistances) if metricDistances else 0 avgSteps = sum(stepCounts) / len(stepCounts) if stepCounts else 0 resultTable[i][j] = avgMetric * 0.3048 resultTable[j][i] = avgSteps with open(outputFilePath, mode="w", newline="") as file: writer = csv.writer(file, delimiter=";") header = [""] + activityTypes writer.writerow(header) for i, row in enumerate(resultTable): writer.writerow([activityTypes[i]] + row) # Assign your output to the OUT variable. OUT = resultTable |
References
- Zamani, Z. Effects of Emergency Department Physical Design Elements on Security, Wayfinding, Visibility, Privacy, and Efficiency and Its Implications on Staff Satisfaction and Performance. HERD 2018, 12, 72–88. [Google Scholar] [CrossRef]
- Sadek, A.H. comprehensive approach to facilitate wayfinding in healthcare facilities. In Proceedings of the Design4Health Conference, Sheffield, UK, 13–16 July 2015; Volume 3. [Google Scholar] [CrossRef]
- Alalouch, C.; Aspinall, P. Spatial attributes of hospital multi-bed wards and preferences for privacy. Facilities 2007, 25, 345–362. [Google Scholar] [CrossRef]
- Gharaveis, A.; Hamilton, D.K.; Pati, D.; Shepley, M. The Impact of Visibility on Teamwork, Collaborative Communication, and Security in Emergency Departments: An Exploratory Study. HERD 2017, 11, 37–49. [Google Scholar] [CrossRef]
- Cai, H.; Jia, J. Using Discrete Event Simulation (DES) To Support Performance-Driven Healthcare Design. HERD 2018, 12, 89–106. [Google Scholar] [CrossRef] [PubMed]
- Anklesaria, F.; Mc Elhinney, S. Syntax as an Iterative Architectural Design Tool: A Teaching Experiment Using Spatial Syntactic and Isovist Analysis. In Proceedings of the 13th Space Syntax Symposium (SSS 2022), Bergen, Norway, 20–24 June 2022; pp. 393–407. [Google Scholar]
- Jia, Z.; Nourian, P.; Luscuere, P.; Wagenaar, C. Spatial decision support systems for hospital layout design: A review. J. Build. Eng. 2023, 67, 106042. [Google Scholar] [CrossRef]
- Li, Y.; Lertlakkhanakul, J.; Lee, S.; Choi, J. Design with space syntax analysis based on building information model: Towards an interactive application of building information model in early design process. In Joining Languages, Cultures and Visions: CAADFutures 2009; PUM: Montréal, QC, Canada, 2009; pp. 501–514. [Google Scholar]
- Dursun, P.; Kozikoglu, N.; Yazar, T.; Erden, M. Designerly Way of Investigating Space Syntax Software. In Proceedings of the 13th International Space Syntax Symposium, Bergen, Norway, 20–24 June 2022. [Google Scholar]
- Ugliotti, F.M.; Shahriari, F. Computational BIM Design Approach Supporting Spatial Analysis: The Case of Healthcare Facilities. In Proceedings of the 43rd International Conference of Representation Disciplines Teachers (UID 2022), Genoa, Italy, September 15–17, 2022; Dialogues. Visions and Visuality. Battini, C., Bistagnino, E., Eds.; FrancoAngeli: Milano, Italy, 2022; pp. 2925–2936. [Google Scholar]
- Ulrich, R.S.; Zimring, C.; Zhu, X.; DuBose, J.; Seo, H.-B.; Choi, Y.-S.; Quan, X.; Joseph, A. A Review of the Research Literature on Evidence-Based Healthcare Design. HERD 2008, 1, 61–125. [Google Scholar] [CrossRef] [PubMed]
- Bayraktar Sari, A.O.; Jabi, W. Architectural spatial layout design for hospitals: A review. J. Build. Eng. 2024, 97, 110835. [Google Scholar] [CrossRef]
- Haq, S.; Luo, Y. Space Syntax in Healthcare Facilities Research: A Review. HERD 2012, 5, 98–117. [Google Scholar] [CrossRef]
- Cai, H.; Spreckelmeyer, K. The Continuous Learning Cycle: A Multi-Phase Post-Occupancy Evaluation (POE) of Decentralized Nursing Unit Design. HERD 2022, 15, 134–148. [Google Scholar] [CrossRef]
- Pikas, E.; Koskela, L.; Sapountzis, S.; Dave, B.; Owen, R. Overview of Building Information Modelling in Healthcare Projects. In Proceedings of the HaCIRIC International Conference, Manchester, UK, 26–28 September 2011; pp. 286–298. [Google Scholar]
- Tan, T.; Mills, G.R.; Papadonikolaki, E.; Xu, Y.; Chen, K. Building Information Modelling in Healthcare Design and Construction: A Bibliometric Review and Systematic Review. In Advances in Information Technology in Civil and Building Engineering; Springer: Cham, Switzerland, 2024; pp. 401–415. [Google Scholar] [CrossRef]
- Hillier, B.; Hanson, J. The Social Logic of Space; Cambridge University Press: Cambridge, UK, 1984. [Google Scholar] [CrossRef]
- Penn, A. Space Syntax and Spatial Cognition: Or Why the Axial Line? Environ. Behav. 2003, 35, 30–65. [Google Scholar] [CrossRef]
- Turner, A. Depthmap: A Program to Perform Visibility Graph Analysis; University College London: London, UK, 2001. [Google Scholar]
- Haq, S. Investigating the Syntax Line: Configurational Properties and Cognitive Correlates. Environ. Plan. B Plan. Des. 2003, 30, 841–863. [Google Scholar] [CrossRef]
- Dawes, M.J.; Ostwald, M.J.; Lee, J.H. Examining Control, Centrality and Flexibility in Palladio’s Villa Plans Using Space Syntax Measurements. Front. Archit. Res. 2021, 10, 467–482. [Google Scholar] [CrossRef]
- Klarqvist, B. A Space Syntax Glossary. Nord. Arkit. 1993, 2, 11–12. [Google Scholar]
- Turner, A.; Doxa, M.; O’Sullivan, D.; Penn, A. From Isovists to Visibility Graphs: A Methodology for the Analysis of Architectural Space. Environ. Plan. B Plan. Des. 2001, 28, 103–121. [Google Scholar] [CrossRef]
- Benedikt, M.L. To Take Hold of Space: Isovists and Isovist Fields. Environ. Plan. B Plan. Des. 1979, 6, 47–65. [Google Scholar] [CrossRef]
- Turner, A.; Penn, A. Encoding Natural Movement as an Agent-Based System: An Investigation into Human Pedestrian Behaviour in the Built Environment. Environ. Plan. B Plan. Des. 2002, 29, 473–490. [Google Scholar] [CrossRef]
- Yamu, C.; van Nes, A.; Garau, C. Bill Hillier’s Legacy: Space Syntax—A Synopsis of Basic Concepts, Measures, and Empirical Application. Sustainability 2021, 13, 3394. [Google Scholar] [CrossRef]
- Jeong, S.K.; Ban, Y. Computational Algorithms to Evaluate Design Solutions Using Space Syntax. Comput.-Aided Des. 2011, 43, 664–676. [Google Scholar] [CrossRef]
- Al Sayed, K.; Bew, M.; Palmer, D.; Broyd, T. Modelling Dependency Networks to Inform Data Structures in BIM and Smart Cities. In Proceedings of the 10th Space Syntax Symposium (SSS10), London, UK, 13–17 July 2015. [Google Scholar]
- Lee, H.; Kim, J.-S.; Shin, M.; Kim, I.; Lee, J.K. A Demonstration of BIM-Enabled Quantitative Circulation Analysis Using BERA Language. In Proceedings of the 31st ISARC, Sydney, Australia, 9–11 July 2014; pp. 202–209. [Google Scholar] [CrossRef]
- Shin, J.; Lee, H.; Lee, S.; Park, S.; Kim, H.-J.; Lee, J.K. An Approach to the BIM-Enabled Assessment of Building Circulation Using Quantitative Data and Its Weight. J. Digit. Contents Soc. 2015, 16, 335–343. [Google Scholar] [CrossRef]
- Zhang, F.; Chan, A.P.C.; Darko, A.; Li, D. BIM-enabled multi-level assessment of age-friendliness of urban housing based on multiscale spatial framework: Enlightenments of housing support for “aging-in-place”. Sustain. Cities Soc. 2021, 72, 103039. [Google Scholar] [CrossRef]
- Nourian, P.; Rezvani, S.; Sariyildiz, S. Designing with Space Syntax A configurative approach to architectural layout, proposing a computational methodology. In Proceedings of the 31st eCAADe Conference, Delft, The Netherlands, 18–20 September 2013. [Google Scholar] [CrossRef]
- Yazar, T.; Dursun, P.; Kozikoglu, N.; Üneşi, O.; Erden, M. Space Chase: A Dynamic and Interactive Tool for Architectural Design Process, In Proceedings of the 13th International Space Syntax Symposium, Bergen, Norway, 20–24 June 2022.
- Sadek, A.H.; Shepley, M.M. Space Syntax Analysis: Tools for Augmenting the Precision of Healthcare Facility Spatial Analysis. HERD 2016, 10, 114–129. [Google Scholar] [CrossRef] [PubMed]
- URBED Ltd. Vital and Viable Town Centres: Meeting the Challenge; HM Stationery Office: Norwich, UK, 1994. [Google Scholar]
- Golledge, R.G. Human wayfinding and cognitive maps. In The Colonization of Unfamiliar Landscapes; Routledge: Oxfordshire, UK, 2023; pp. 49–54. [Google Scholar] [CrossRef]
- Raubal, M. Agent-Based Simulation of Human Wayfinding: A Perceptual Model for Unfamiliar Buildings. Ph.D. Thesis, Vienna University of Technology, Vienna, Austria, 2001. [Google Scholar]
- Zabihi, A.; Safizadeh, M.; Hedayati Marzbali, M. Wayfinding in hospital landscape: Syntactical analysis of planting design in hospitals in Kerman, Iran. J. Facil. Manag. 2021, 19, 393–411. [Google Scholar] [CrossRef]
- Emo, B. Seeing the Axial Line: Evidence from Wayfinding Experiments. Behav. Sci. 2014, 4, 167–180. [Google Scholar] [CrossRef] [PubMed]
- Haq, S.; Zimring, C. Just Down the Road A Piece the Development of Topological Knowledge of Building Layouts. Environ. Behav. 2003, 35, 132–160. [Google Scholar] [CrossRef]
- Choi, Y.K. The Morphology of Exploration and Encounter in Museum Layouts. Environ. Plan. B Plan. Des. 1999, 26, 241–250. [Google Scholar] [CrossRef]
- Haq, S. Complex Architectural Settings: An Investigation of Spatial and Cognitive Variables Through Wayfinding Behavior. Ph.D. Thesis, Georgia Institute of Technology, Atlanta, GA, USA, 2001. [Google Scholar]
- Aksoy, E.; Aydın, D.; İskifoğlu, G. Analysis of the Correlation Between Layout and Wayfinding Decisions in Hospitals. Megaron 2020, 15, 509–520. [Google Scholar] [CrossRef]
- Peponis, J.; Zimring, C.; Choi, Y.K. Finding the Building in Wayfinding. Environ. Behav. 1990, 22, 555–590. [Google Scholar] [CrossRef]
- Haq, S.; Girotto, S. Ability and Intelligibility: Wayfinding and Environmental Cognition in the Designed. In Proceedings of the 4th International Space Syntax Symposium, London, UK, 17–19 June 2003; pp. 68–88. [Google Scholar]
- Geng, S.; Chau, H.-W.; Yan, S.; Zhang, W.; Zhang, C. Comparative Analysis of Hospital Environments in Australia and China using the Space Syntax Approach. Int. J. Build. Pathol. Adapt. 2020, 39, 525–546. [Google Scholar] [CrossRef]
- Hölscher, C.; Brösamle, M. Capturing indoor wayfinding strategies and differences in spatial knowledge with space syntax. In Proceedings of the 6th International Space Syntax Symposium, Istanbul, Turkey, 12–15 June 2007; pp. 43.1–43.12. [Google Scholar]
- Vogels, J. Wayfinding in Complex Multilevel Buildings: A Case Study of University Utrecht Langeveld Building. Master’s Thesis, Utrecht University, Utrecht, The Netherlands, 2012. [Google Scholar]
- Altman, I. Privacy: A Conceptual Analysis. Environ. Behav. 1976, 8, 7–29. [Google Scholar] [CrossRef]
- Lim, L.; Zimring, C.M. A Conceptual Visibility Framework for Linking Spatial Metrics with Experience and Organizational Outcomes. HERD 2020, 13, 225–239. [Google Scholar] [CrossRef]
- Penn, A.; Desyllas, J.; Vaughan, L. The Space of Innovation: Interaction and Communication in the Work Environment. Environ. Plan. B Plan. Des. 1999, 26, 193–218. [Google Scholar] [CrossRef]
- Cai, H.; Zimring, C. Out of sight, out of reach: Correlating spatial metrics of nurse station typology with nurses’ communication and co-awareness in an intensive care unit. In Proceedings of the 8th International Space Syntax Symposium, Santiago, Chile, 3–6 January 2012. [Google Scholar]
- Penn, A.; Hillier, B. The social potential of buildings: Spatial structure and the innovative millieu in scientific research laboratories. In Proceedings of the Corporate Space and Architecture Conference, Paris, France, 1–3 July 1992; pp. 38–43. [Google Scholar]
- Rashid, M.; Wineman, J.; Zimring, C. Space, behavior, and environmental perception in open-plan offices: A prospective study. Environ. Plan. B Plan. Des. 2009, 36, 432–449. [Google Scholar] [CrossRef]
- Rashid, M.; Zimring, C.; Wineman, J.; Flaningam, T.; Nubani, L.; Hammash, R. The Effects of Spatial Behaviors and Layout Attributes on Individuals’ Perception of Psychosocial Constructs in Offices. In Proceedings of the 5th International Space Syntax Symposium, Delft University of Technology, Amsterdam, The Netherlands, 13–17 June 2005. [Google Scholar]
- Gharaveis, A.; Pati, D.; Hamilton, D.K.; Shepley, M.; Rodiek, S.; Najarian, M. The Correlation Between Visibility and Medical Staff Collaborative Communication in Emergency Departments. HERD 2020, 13, 81–97. [Google Scholar] [CrossRef]
- Heo, Y.; Choudhary, R.; Bafna, S.; Hendrich, A.L.; Chow, M. A Modeling Approach for Estimating the Impact of Spatial Configuration on Nurses’ Movement. In Proceedings of the 7th International Space Syntax Symposium, Stockholm, Sweden, 8–11 June 2009. [Google Scholar]
- Hadi, K.; Zimring, C. Design to Improve Visibility: Impact of Corridor Width and Unit Shape. HERD 2016, 9, 35–49. [Google Scholar] [CrossRef]
- Cai, H.; Zimring, C. Cultural impacts on nursing unit design: A comparative study on Chinese nursing unit typologies and their U.S. counterparts using space syntax. Environ. Plan. B Urban Anal. City Sci. 2019, 46, 573–594. [Google Scholar] [CrossRef]
- Pachilova, R. Exploring quality of care in hospital wards: The effect of spatial layout, staff work activities and communication patterns. Ph.D. Thesis, University College London, London, UK, 2020. [Google Scholar]
- Lu, Y.; Peponis, J.; Zimring, C. Targeted Visibility Analysis in Buildings Correlating Targeted Visibility Analysis with Distribution of People and Their Interactions within an Intensive Care Unit. In Proceedings of the 7th International Space Syntax Symposium, Stockholm, Sweden, 8–11 June 2009. [Google Scholar]
- Grafit: A Spatial Graph Analysis Library. Available online: https://github.com/fesmcr/Grafit (accessed on 10 September 2025).
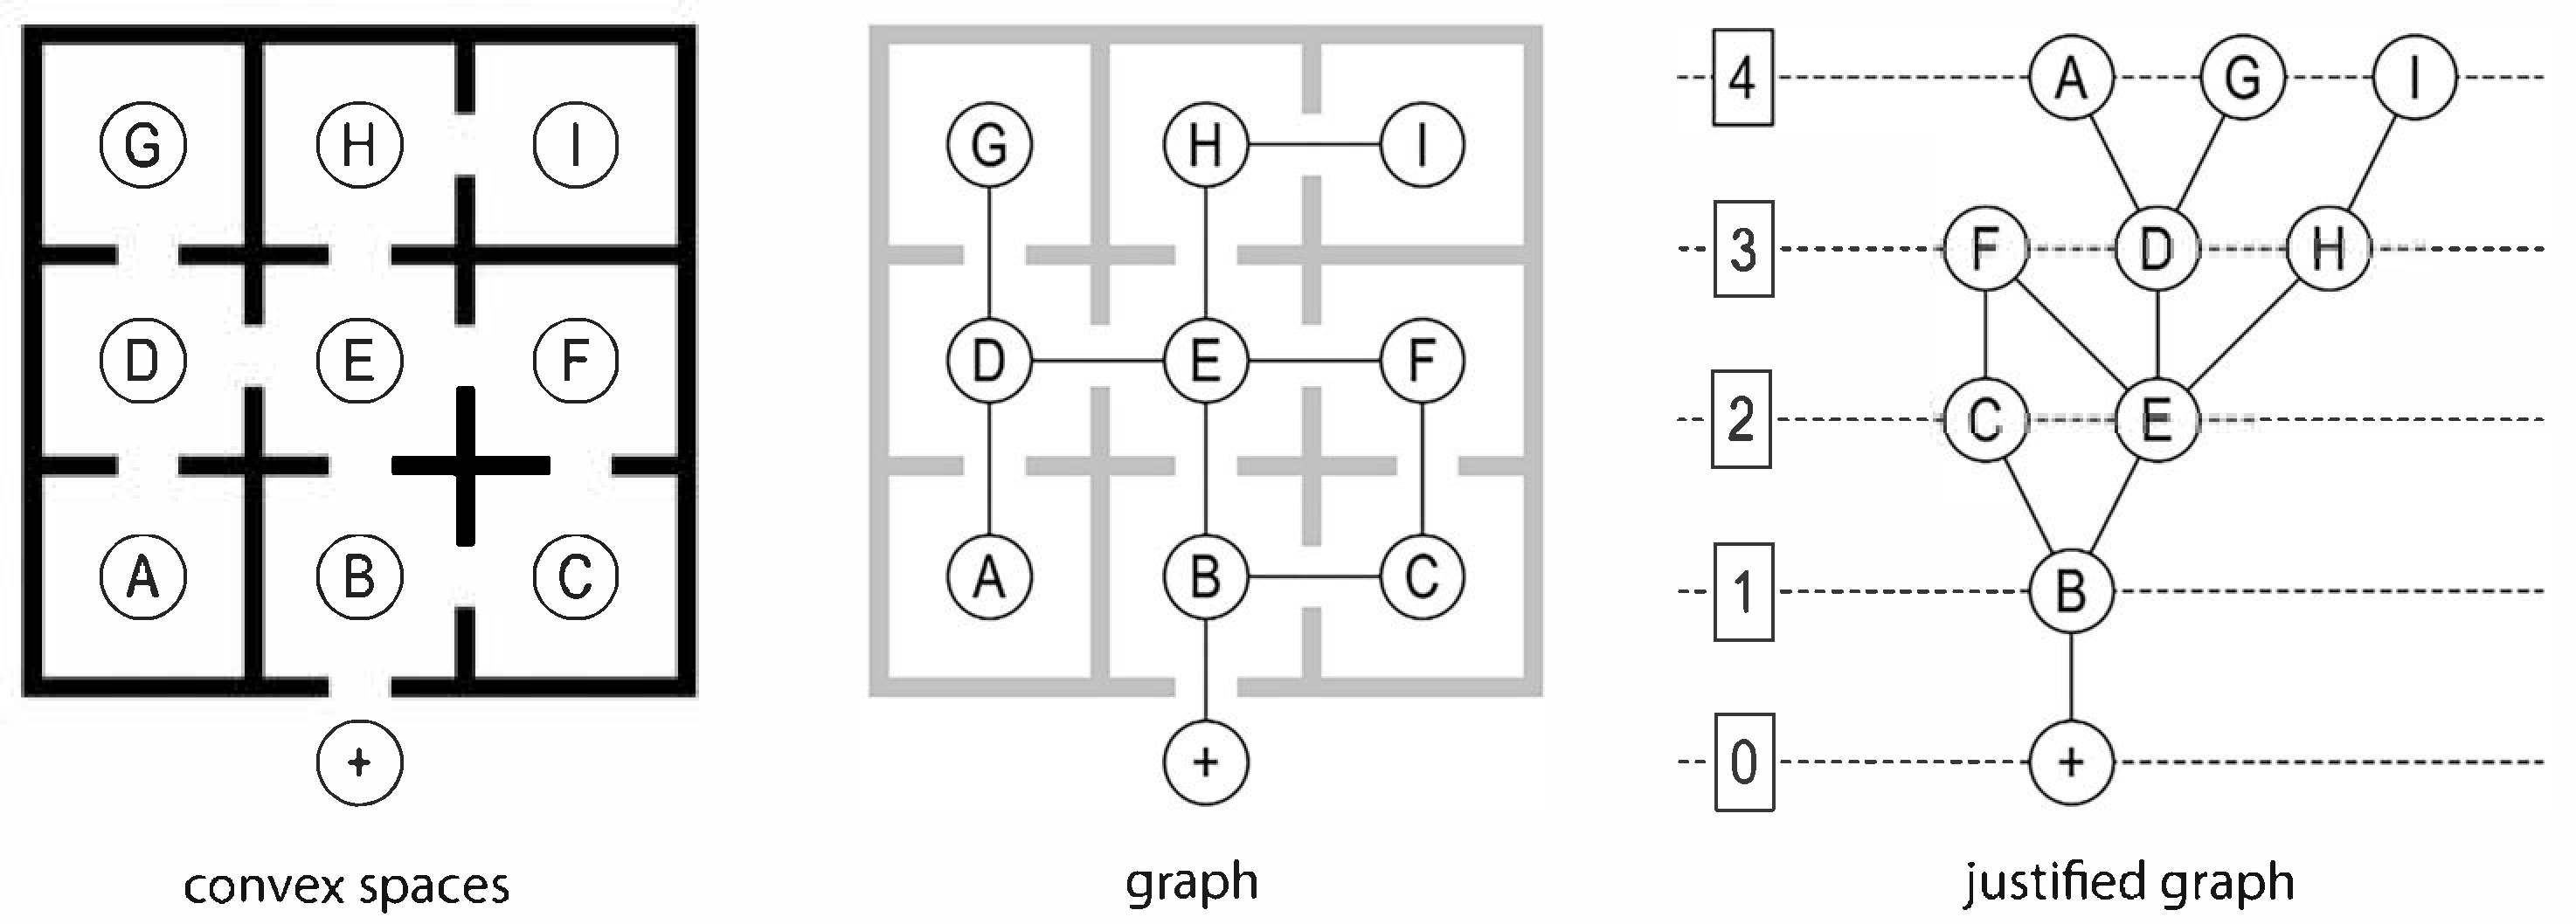

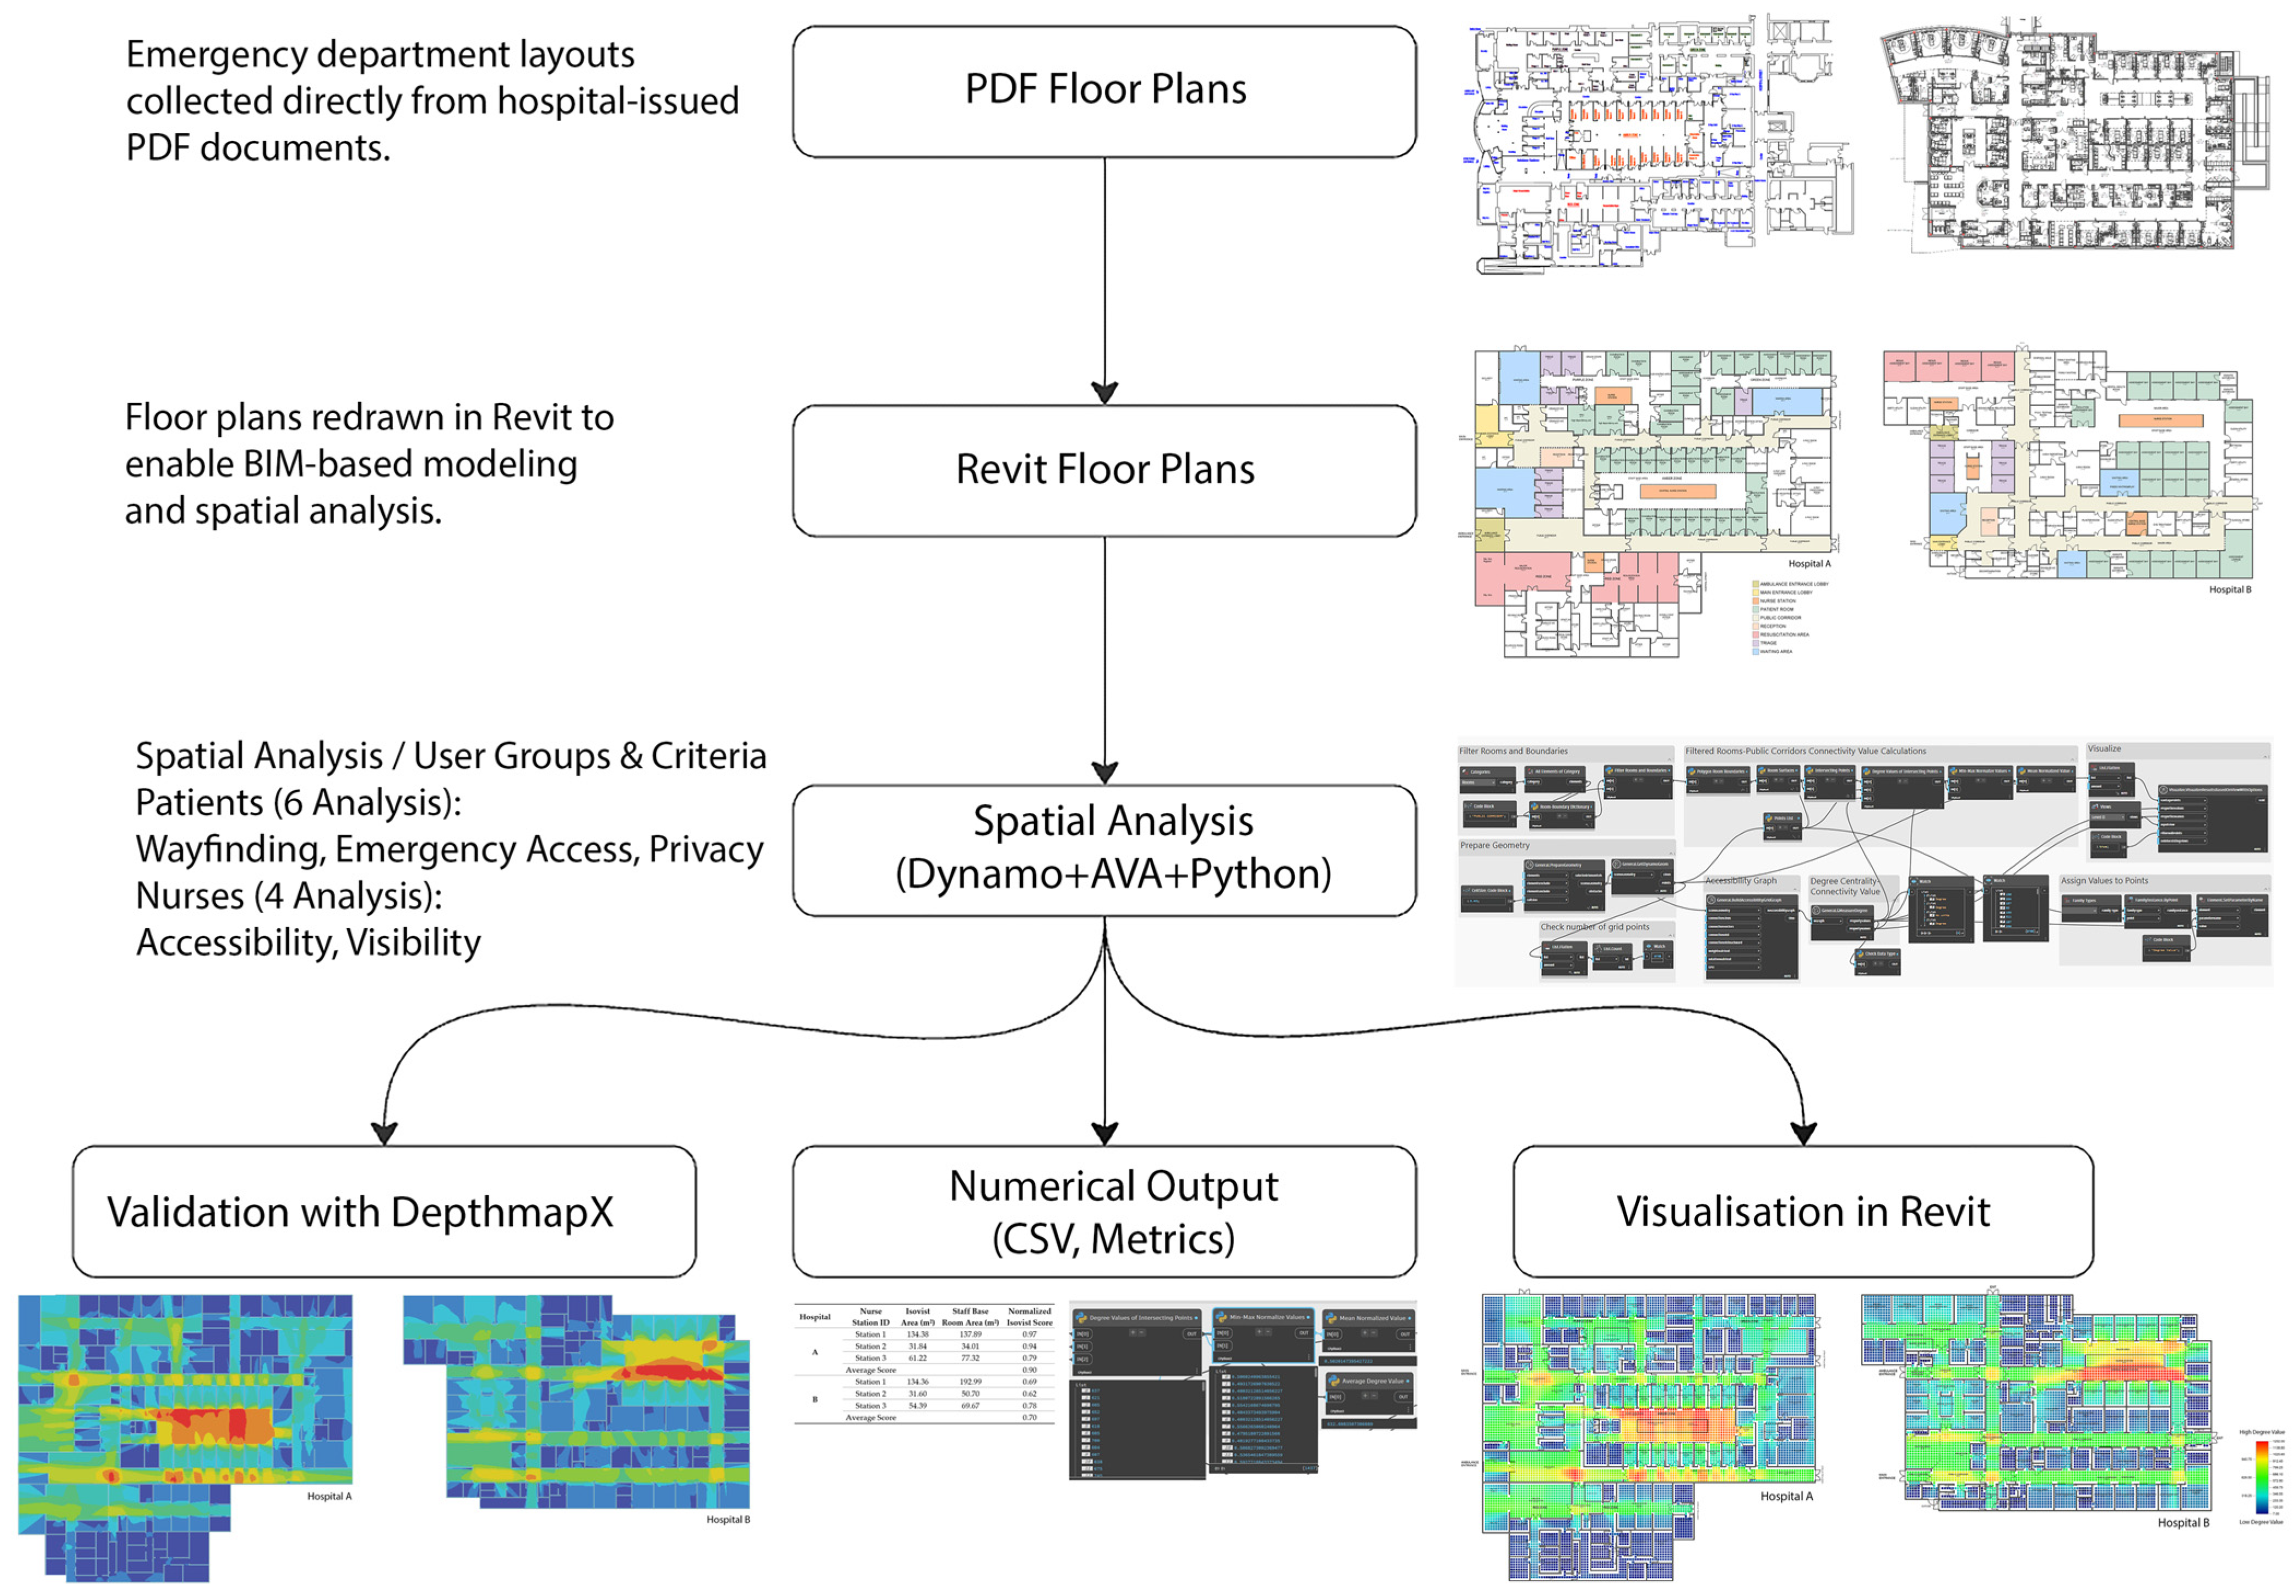
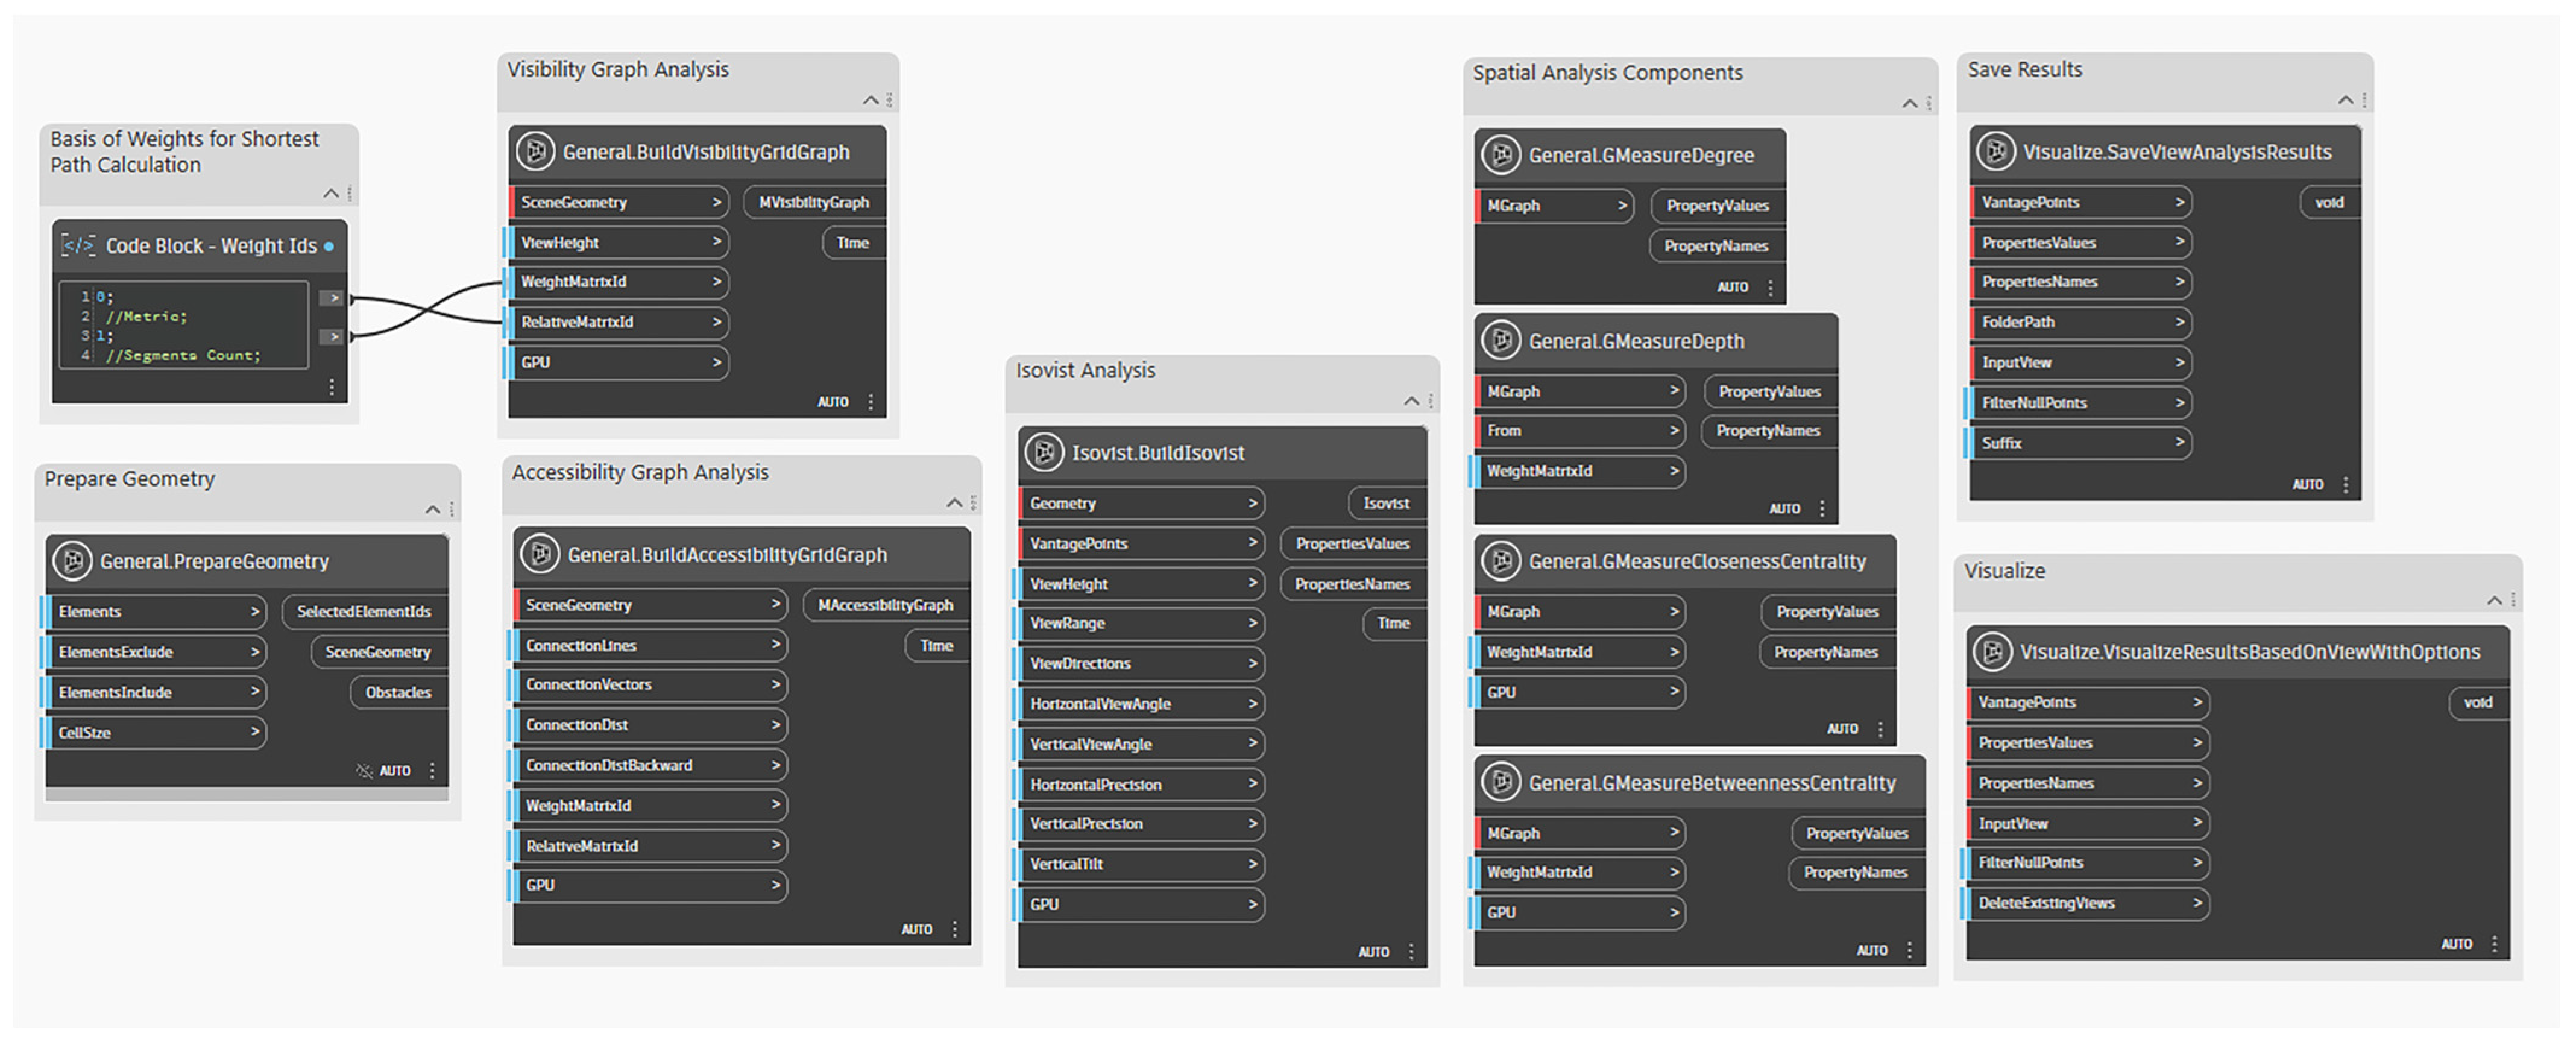
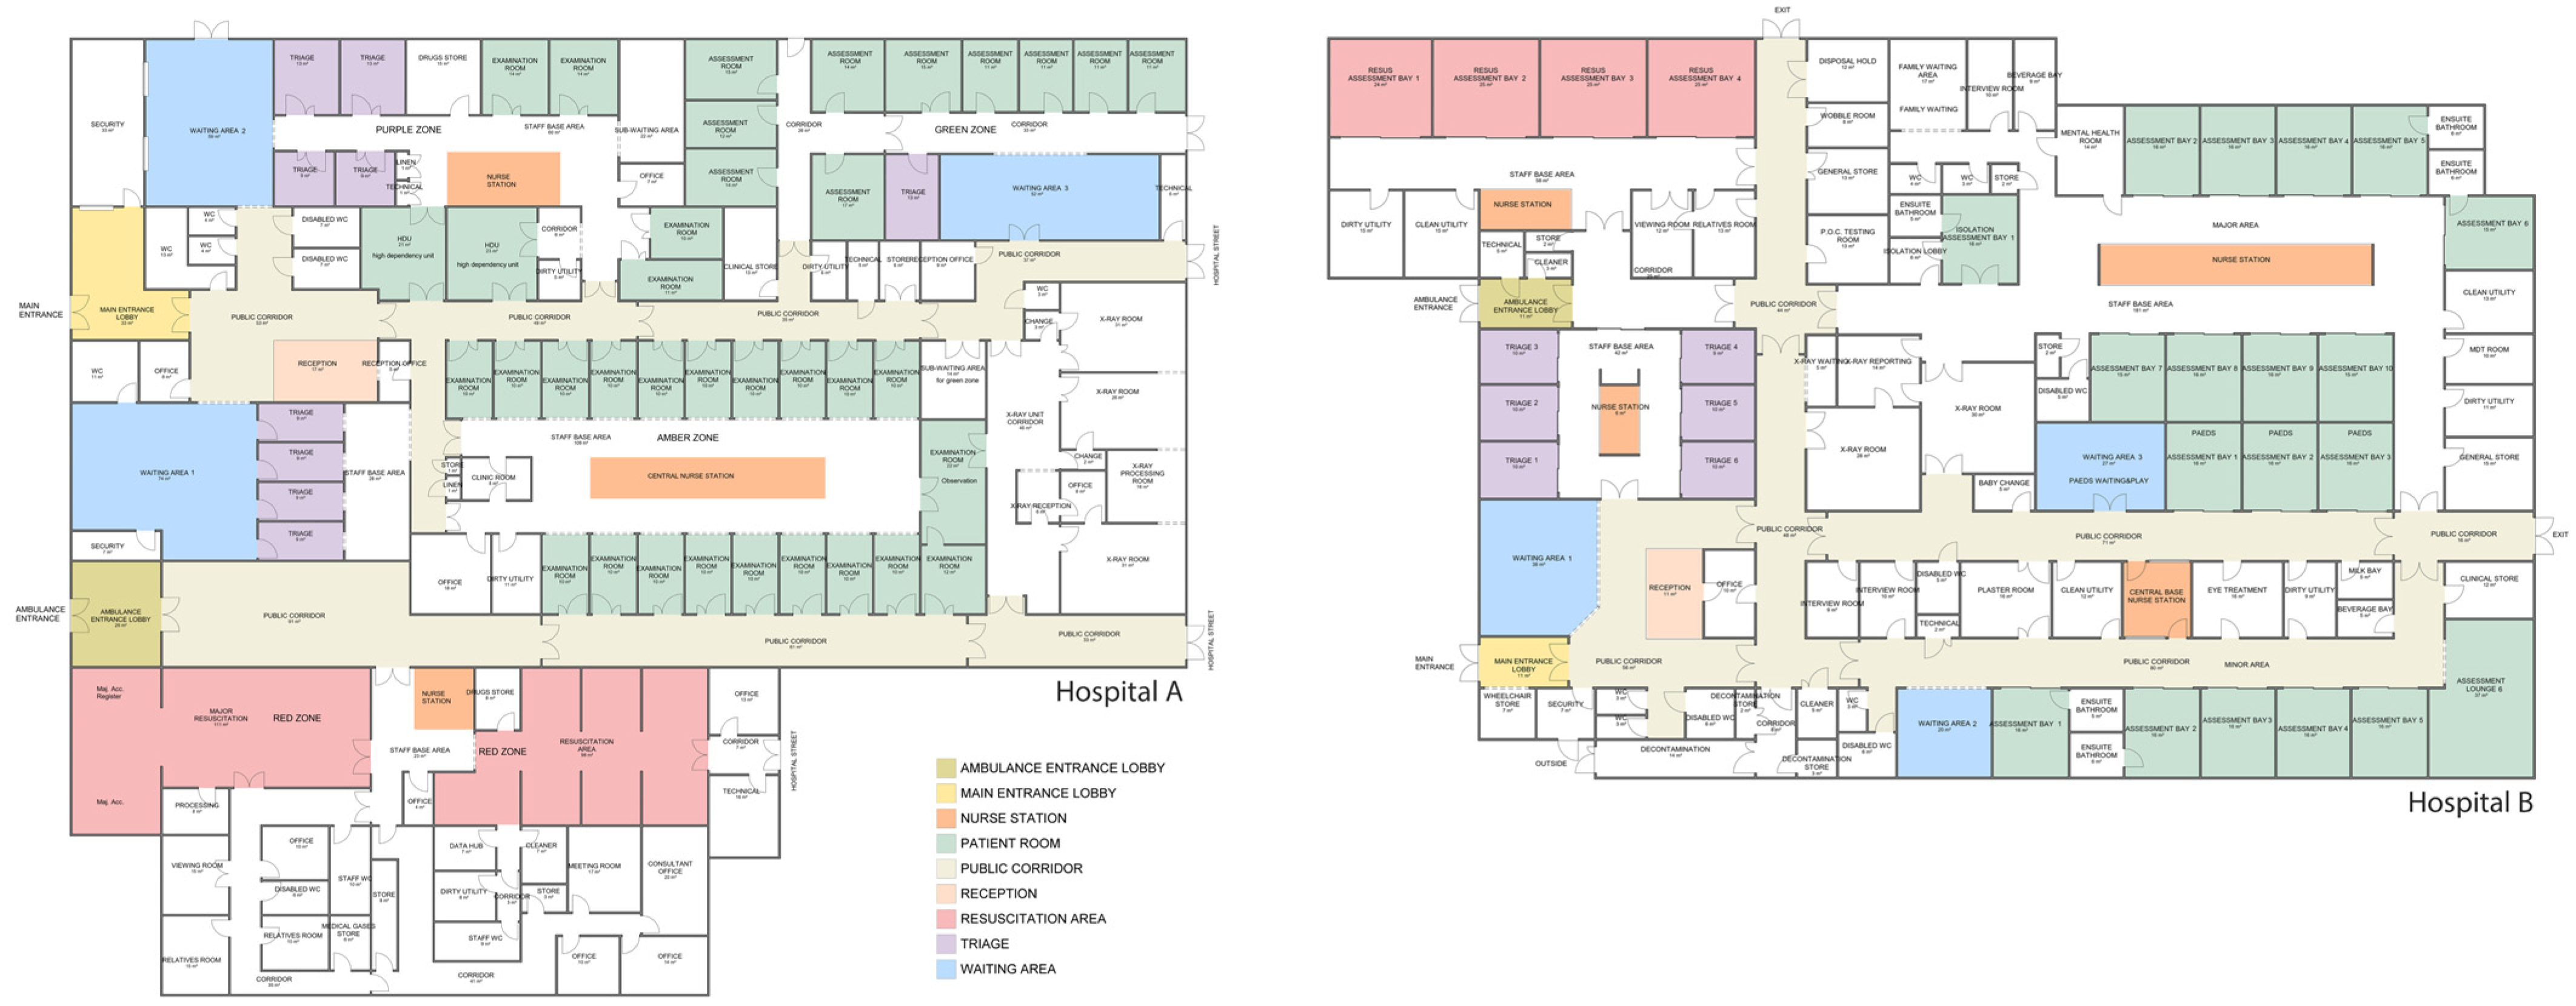

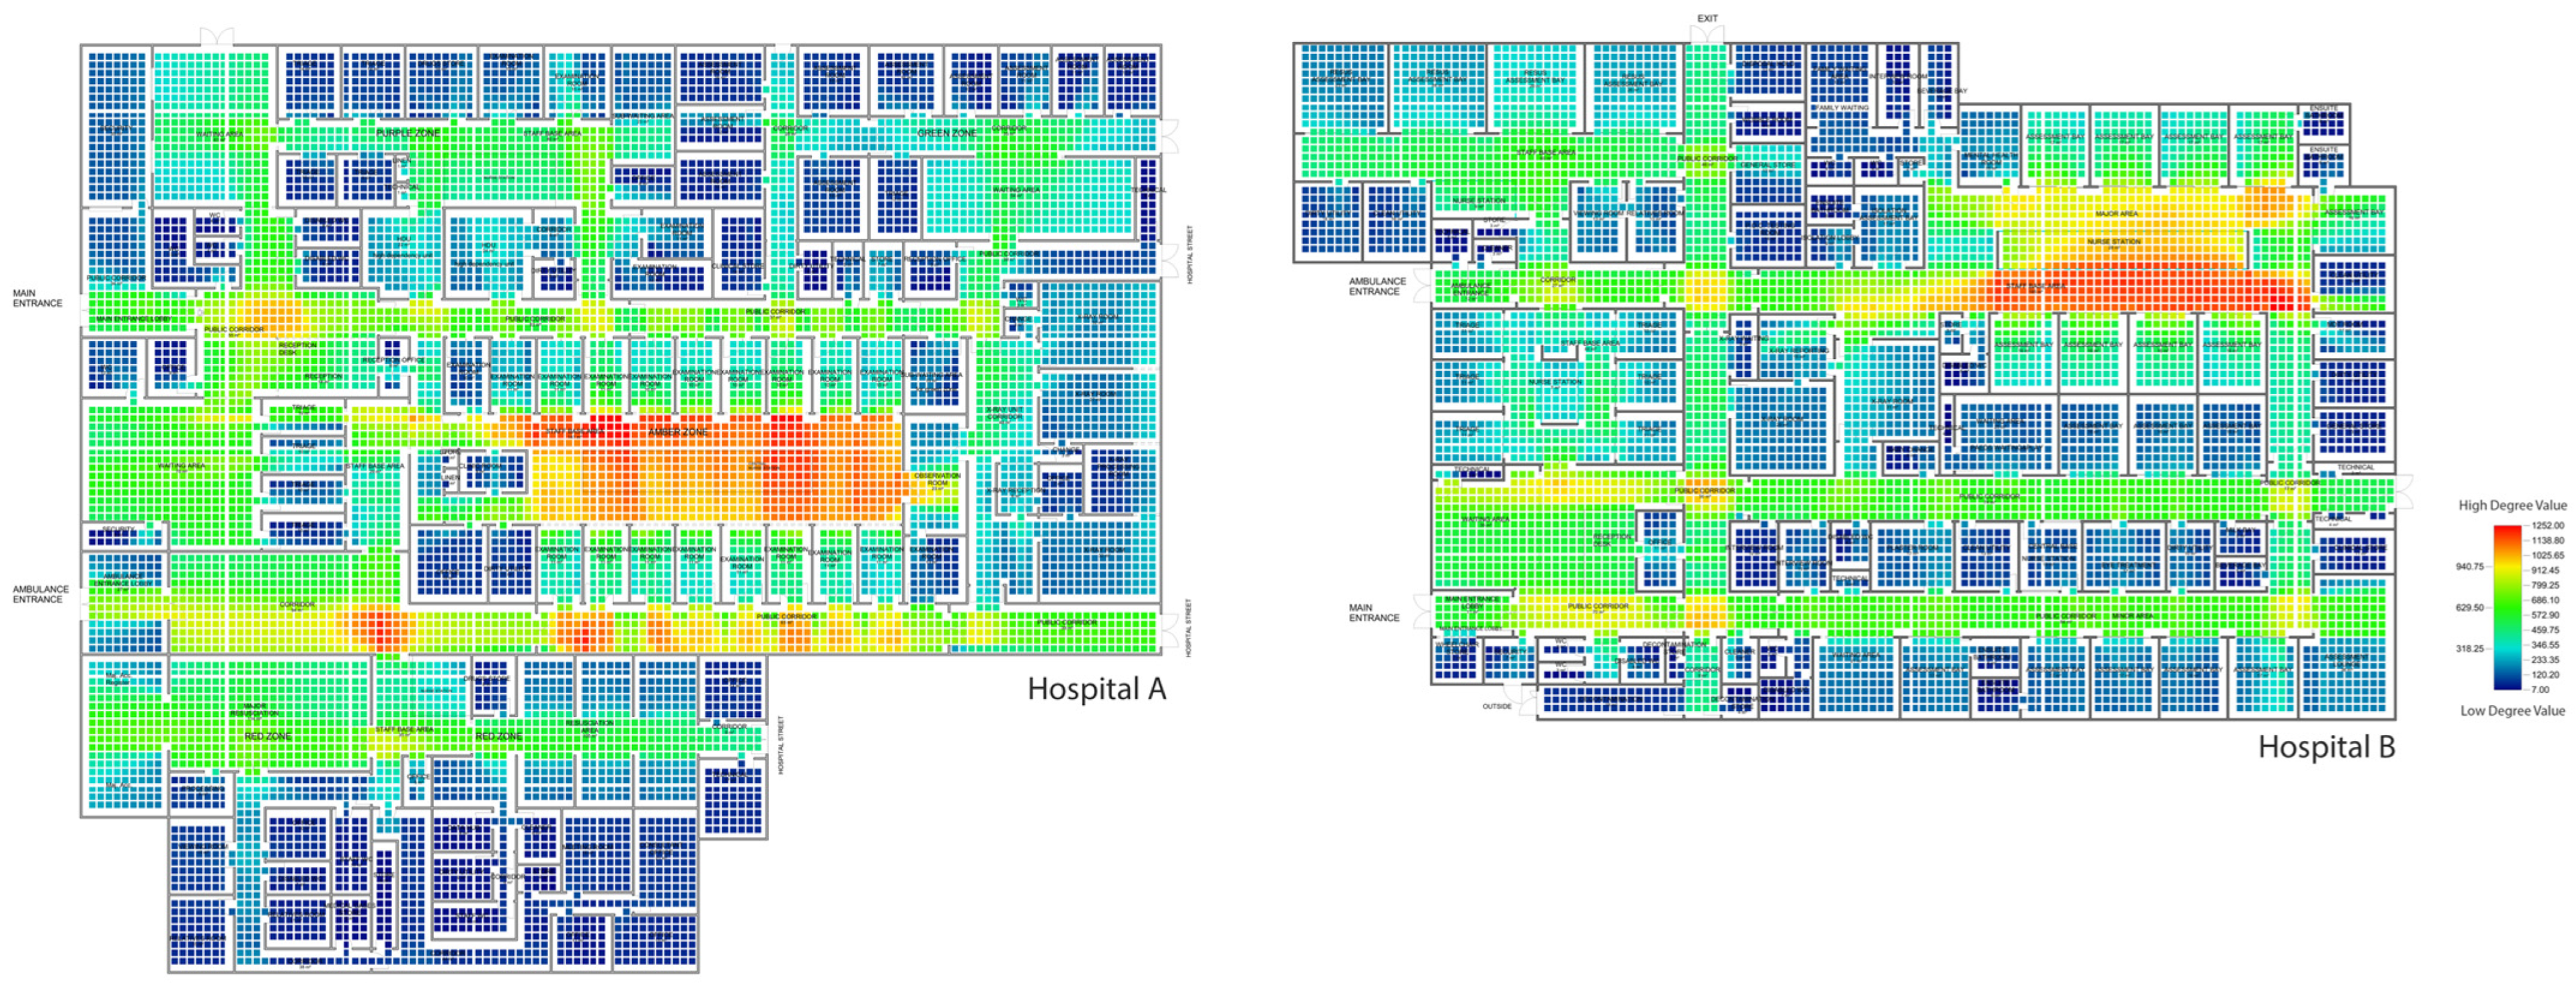
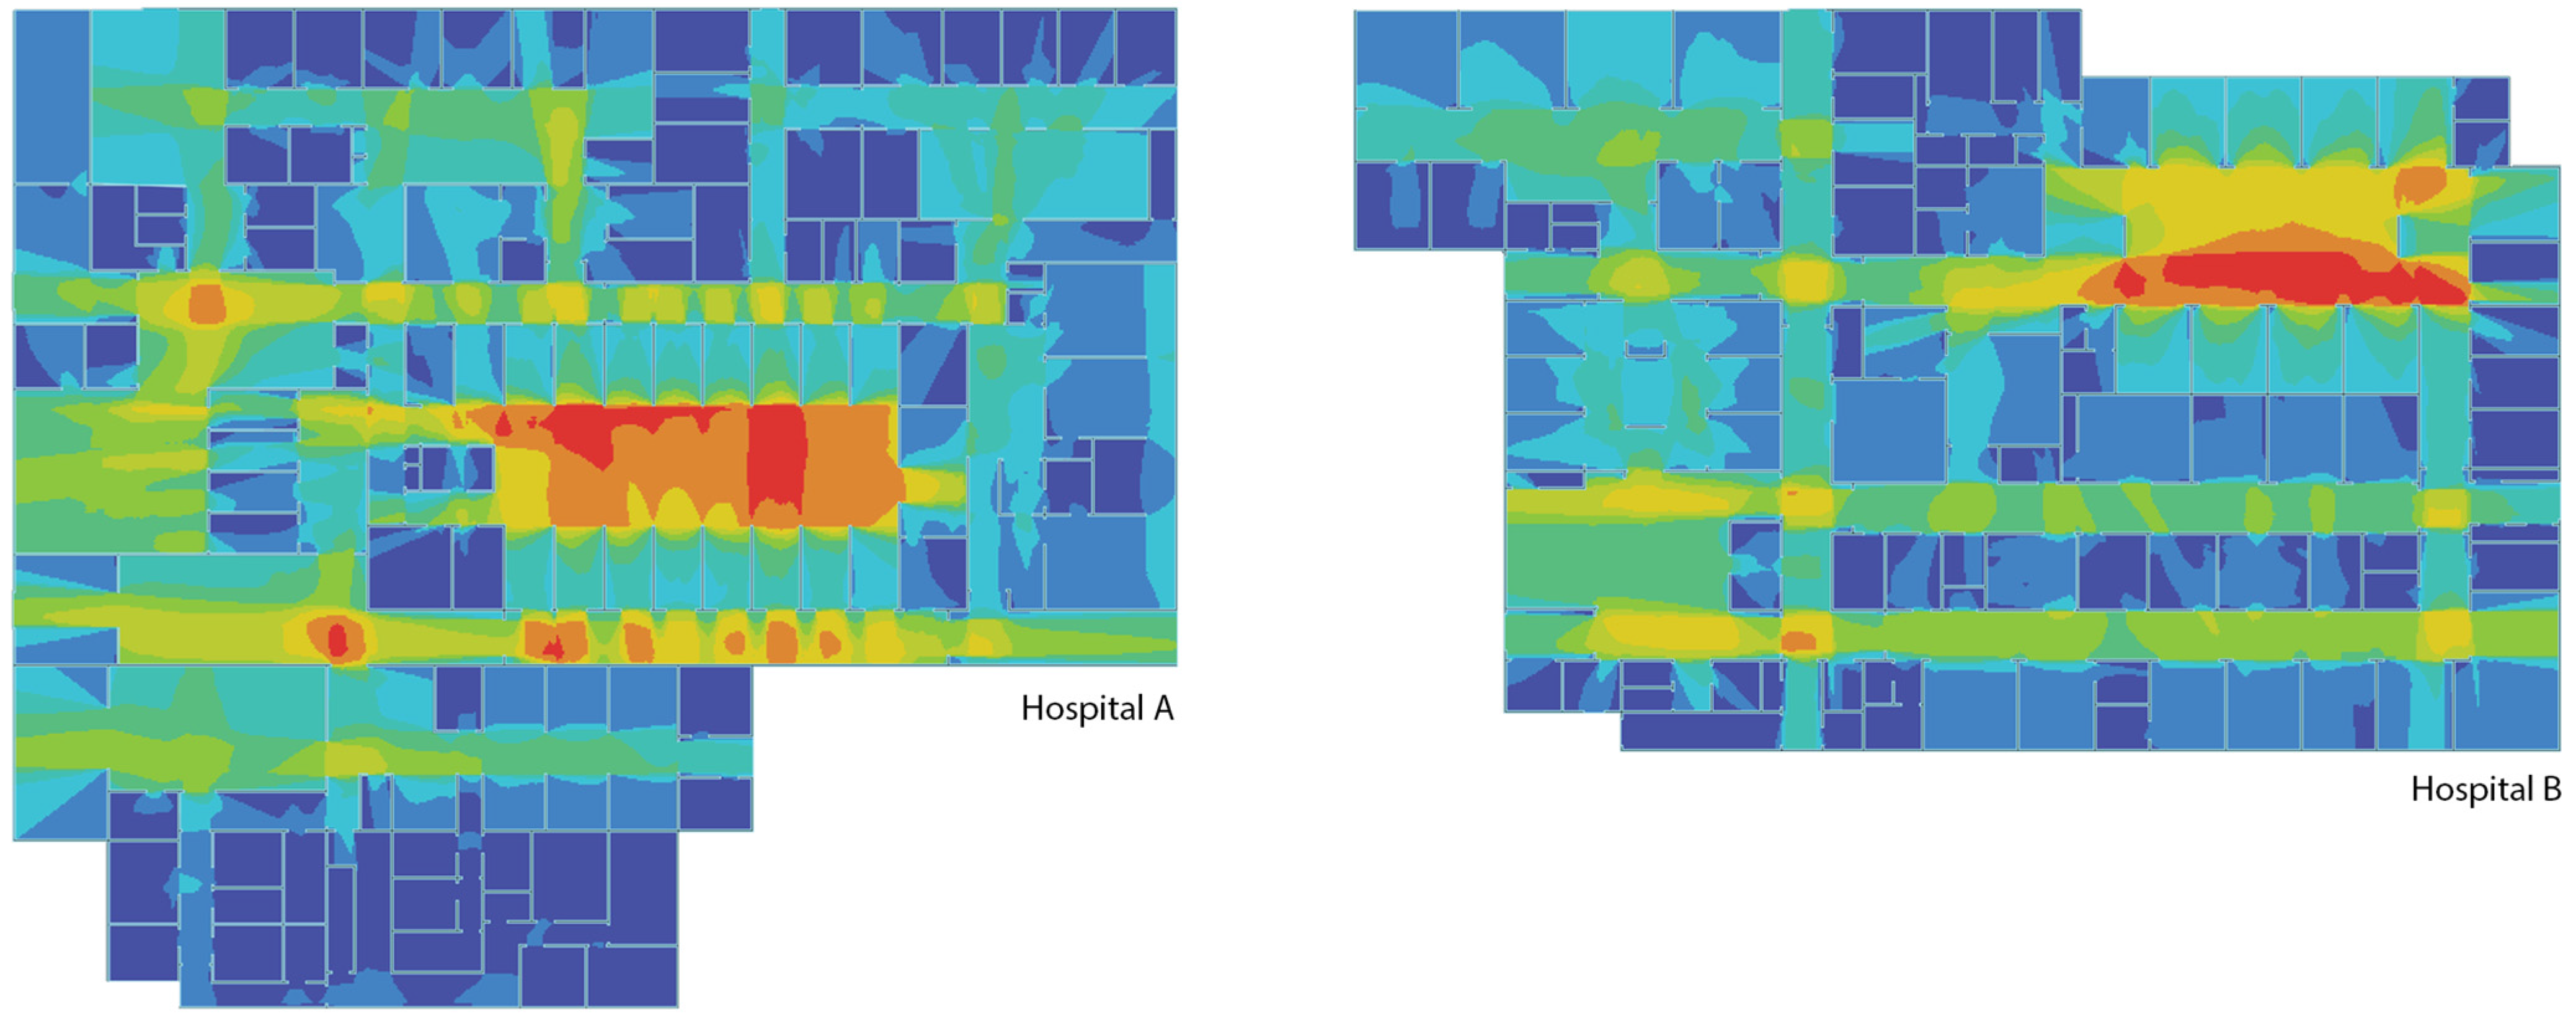
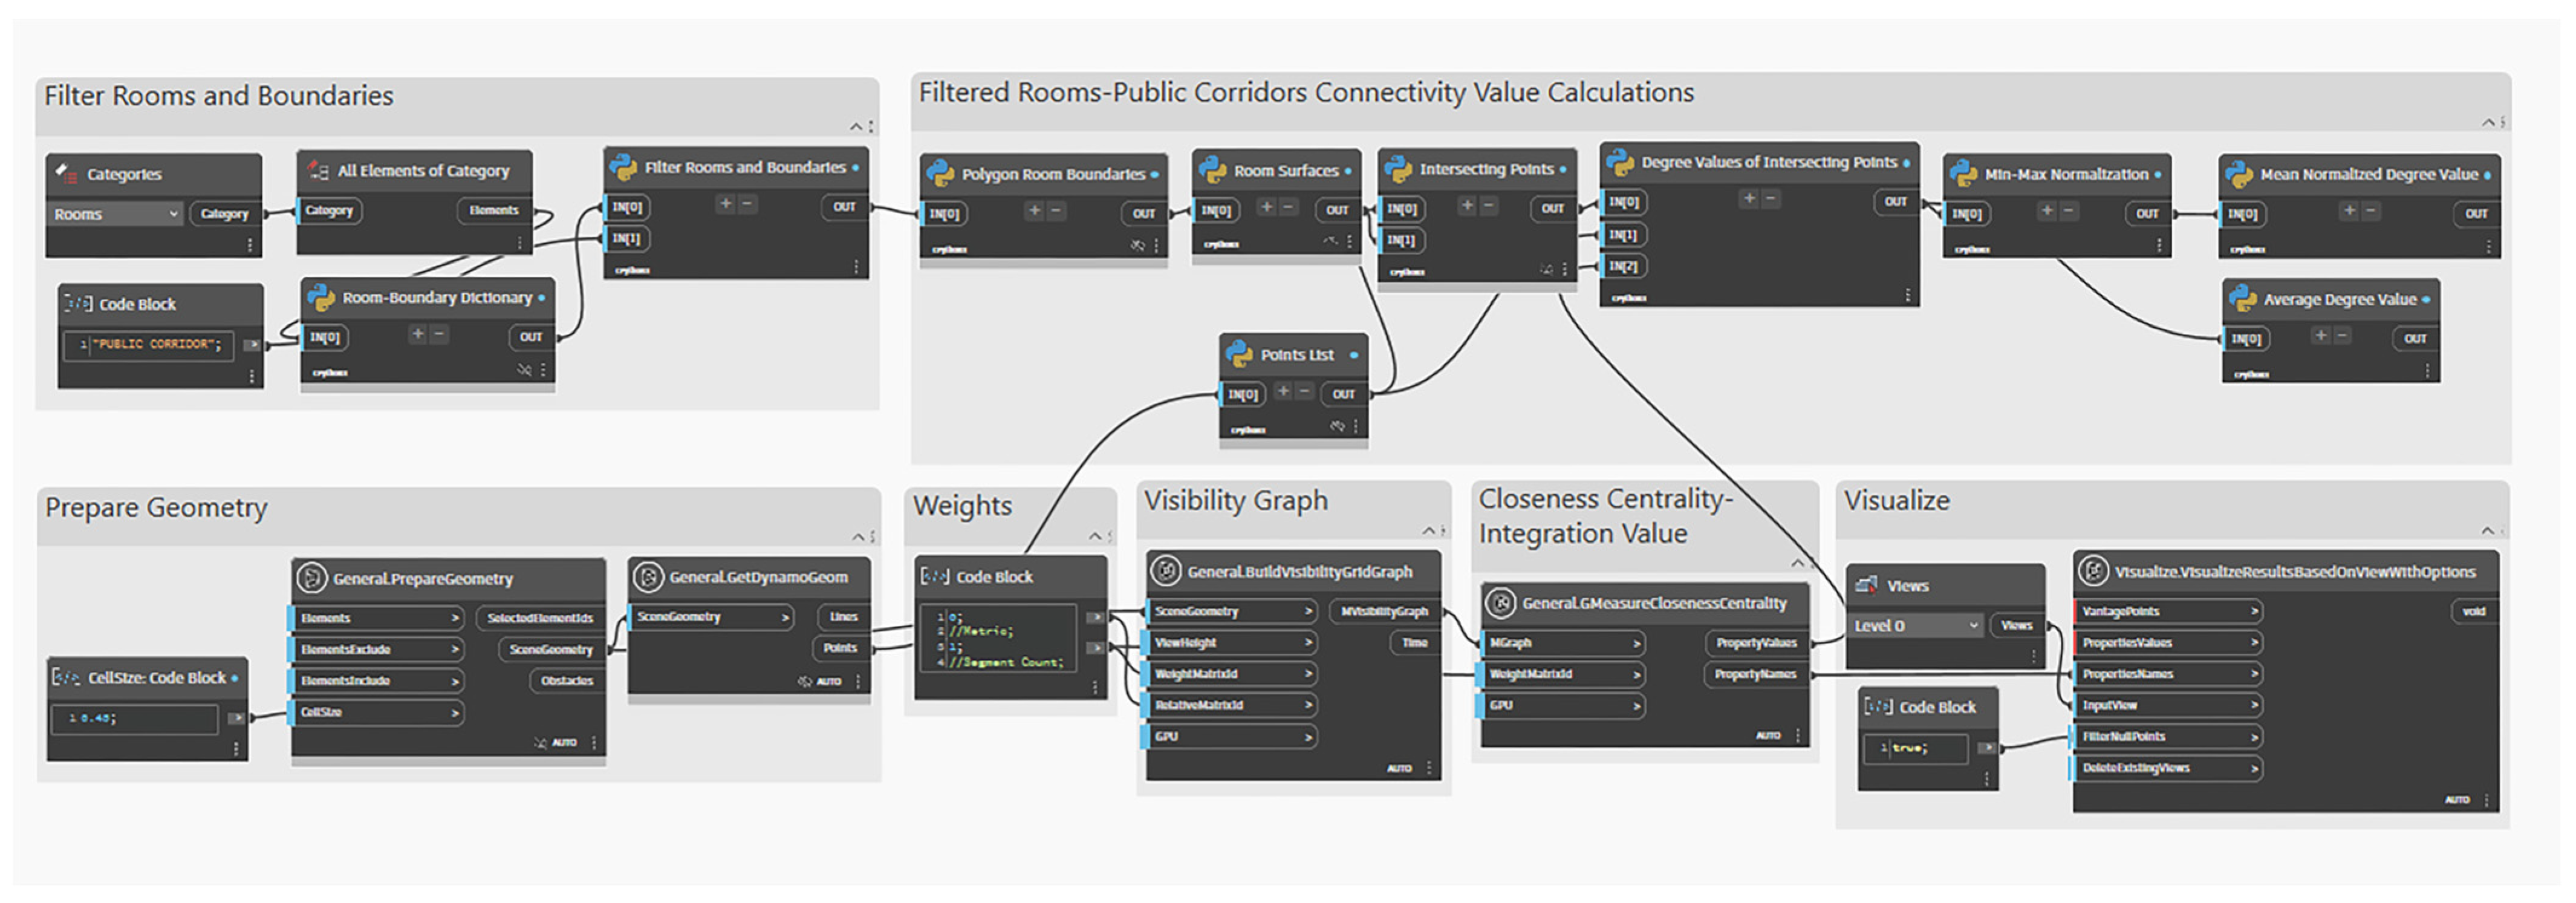


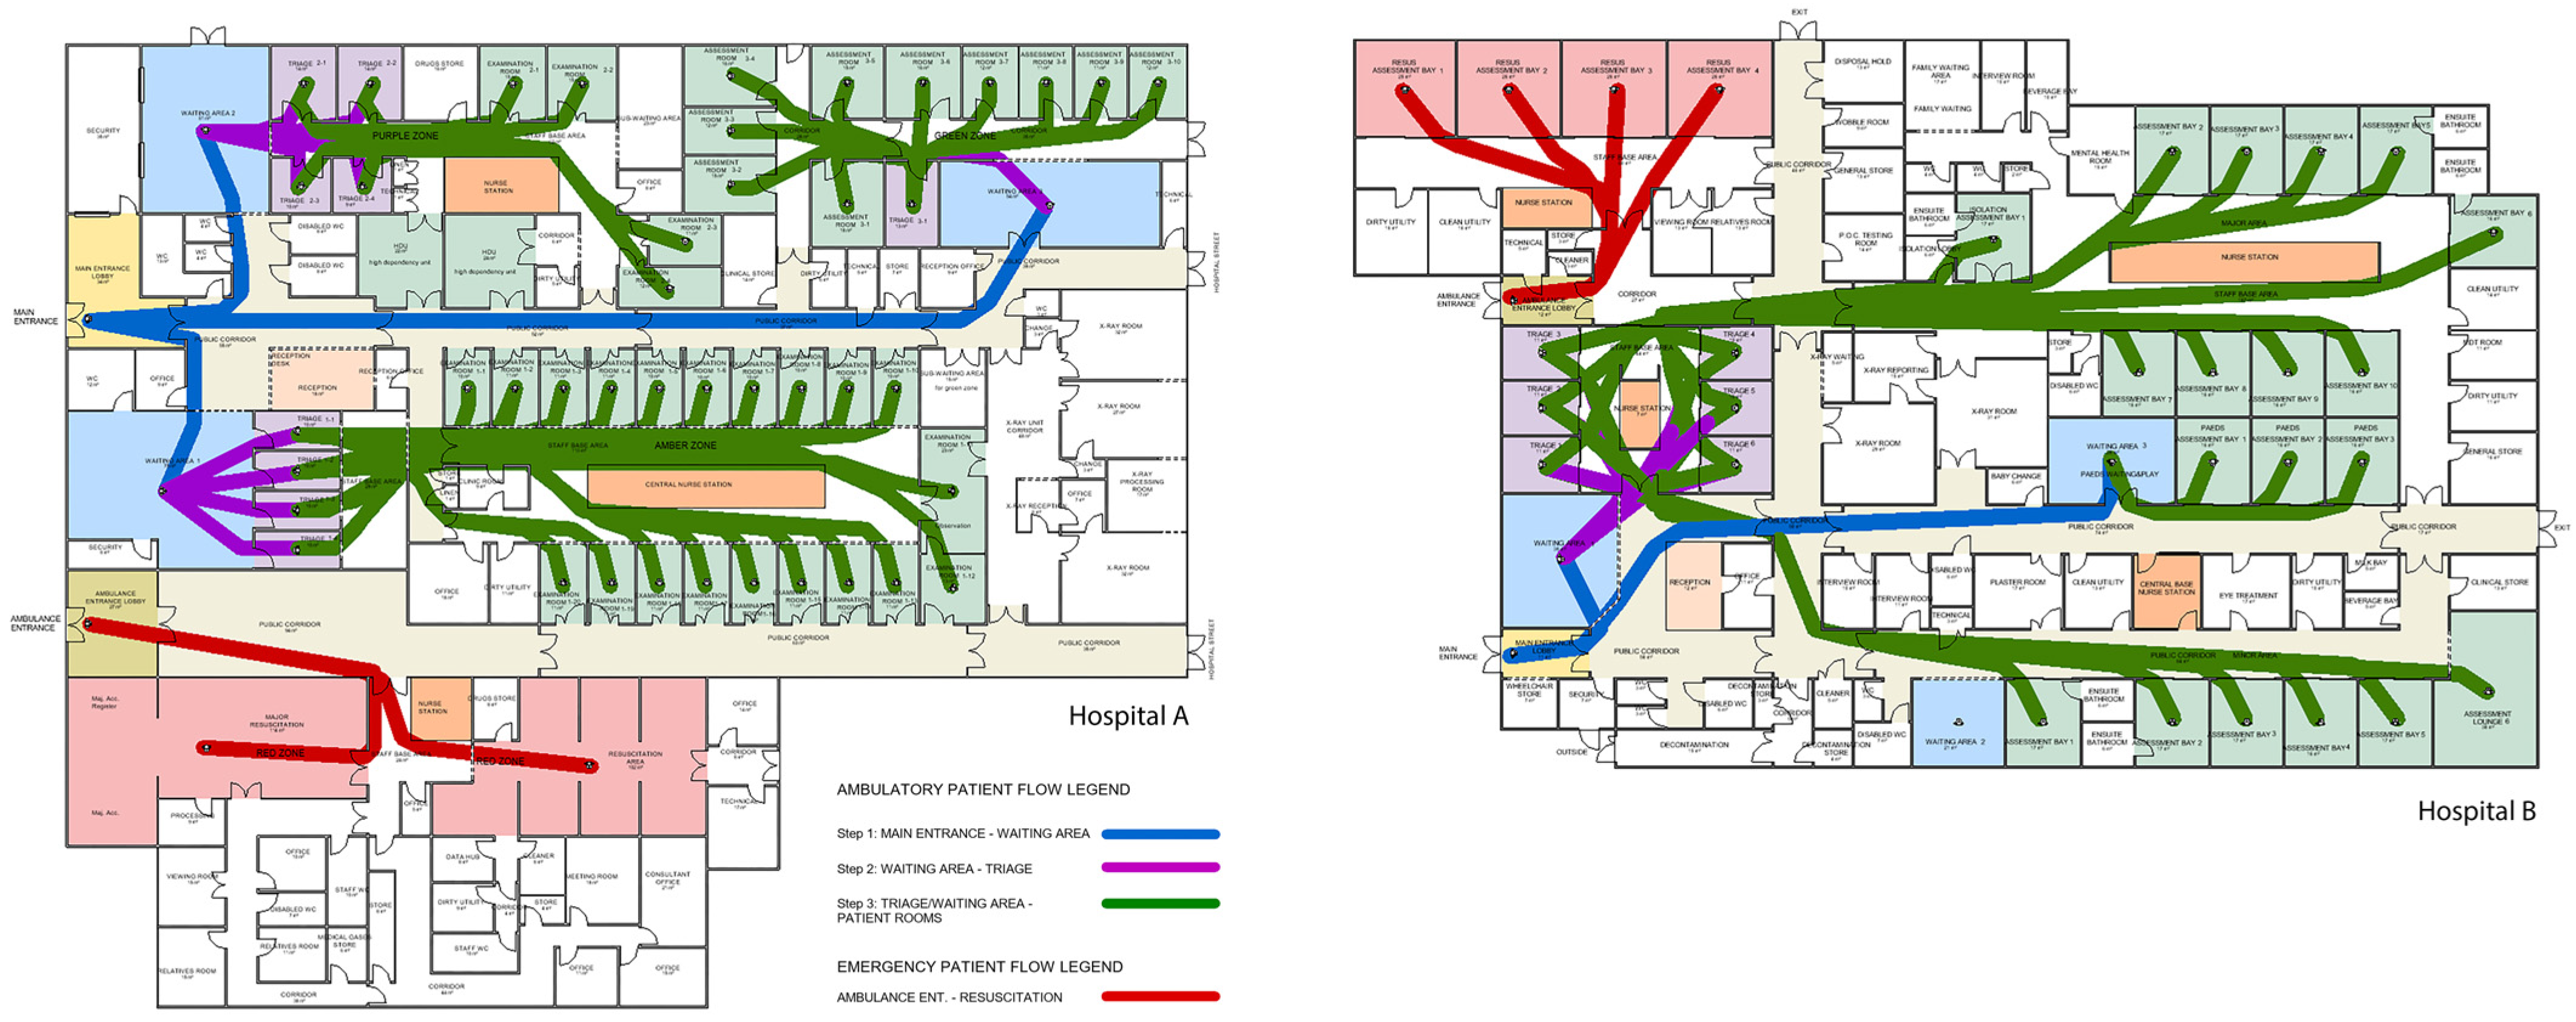


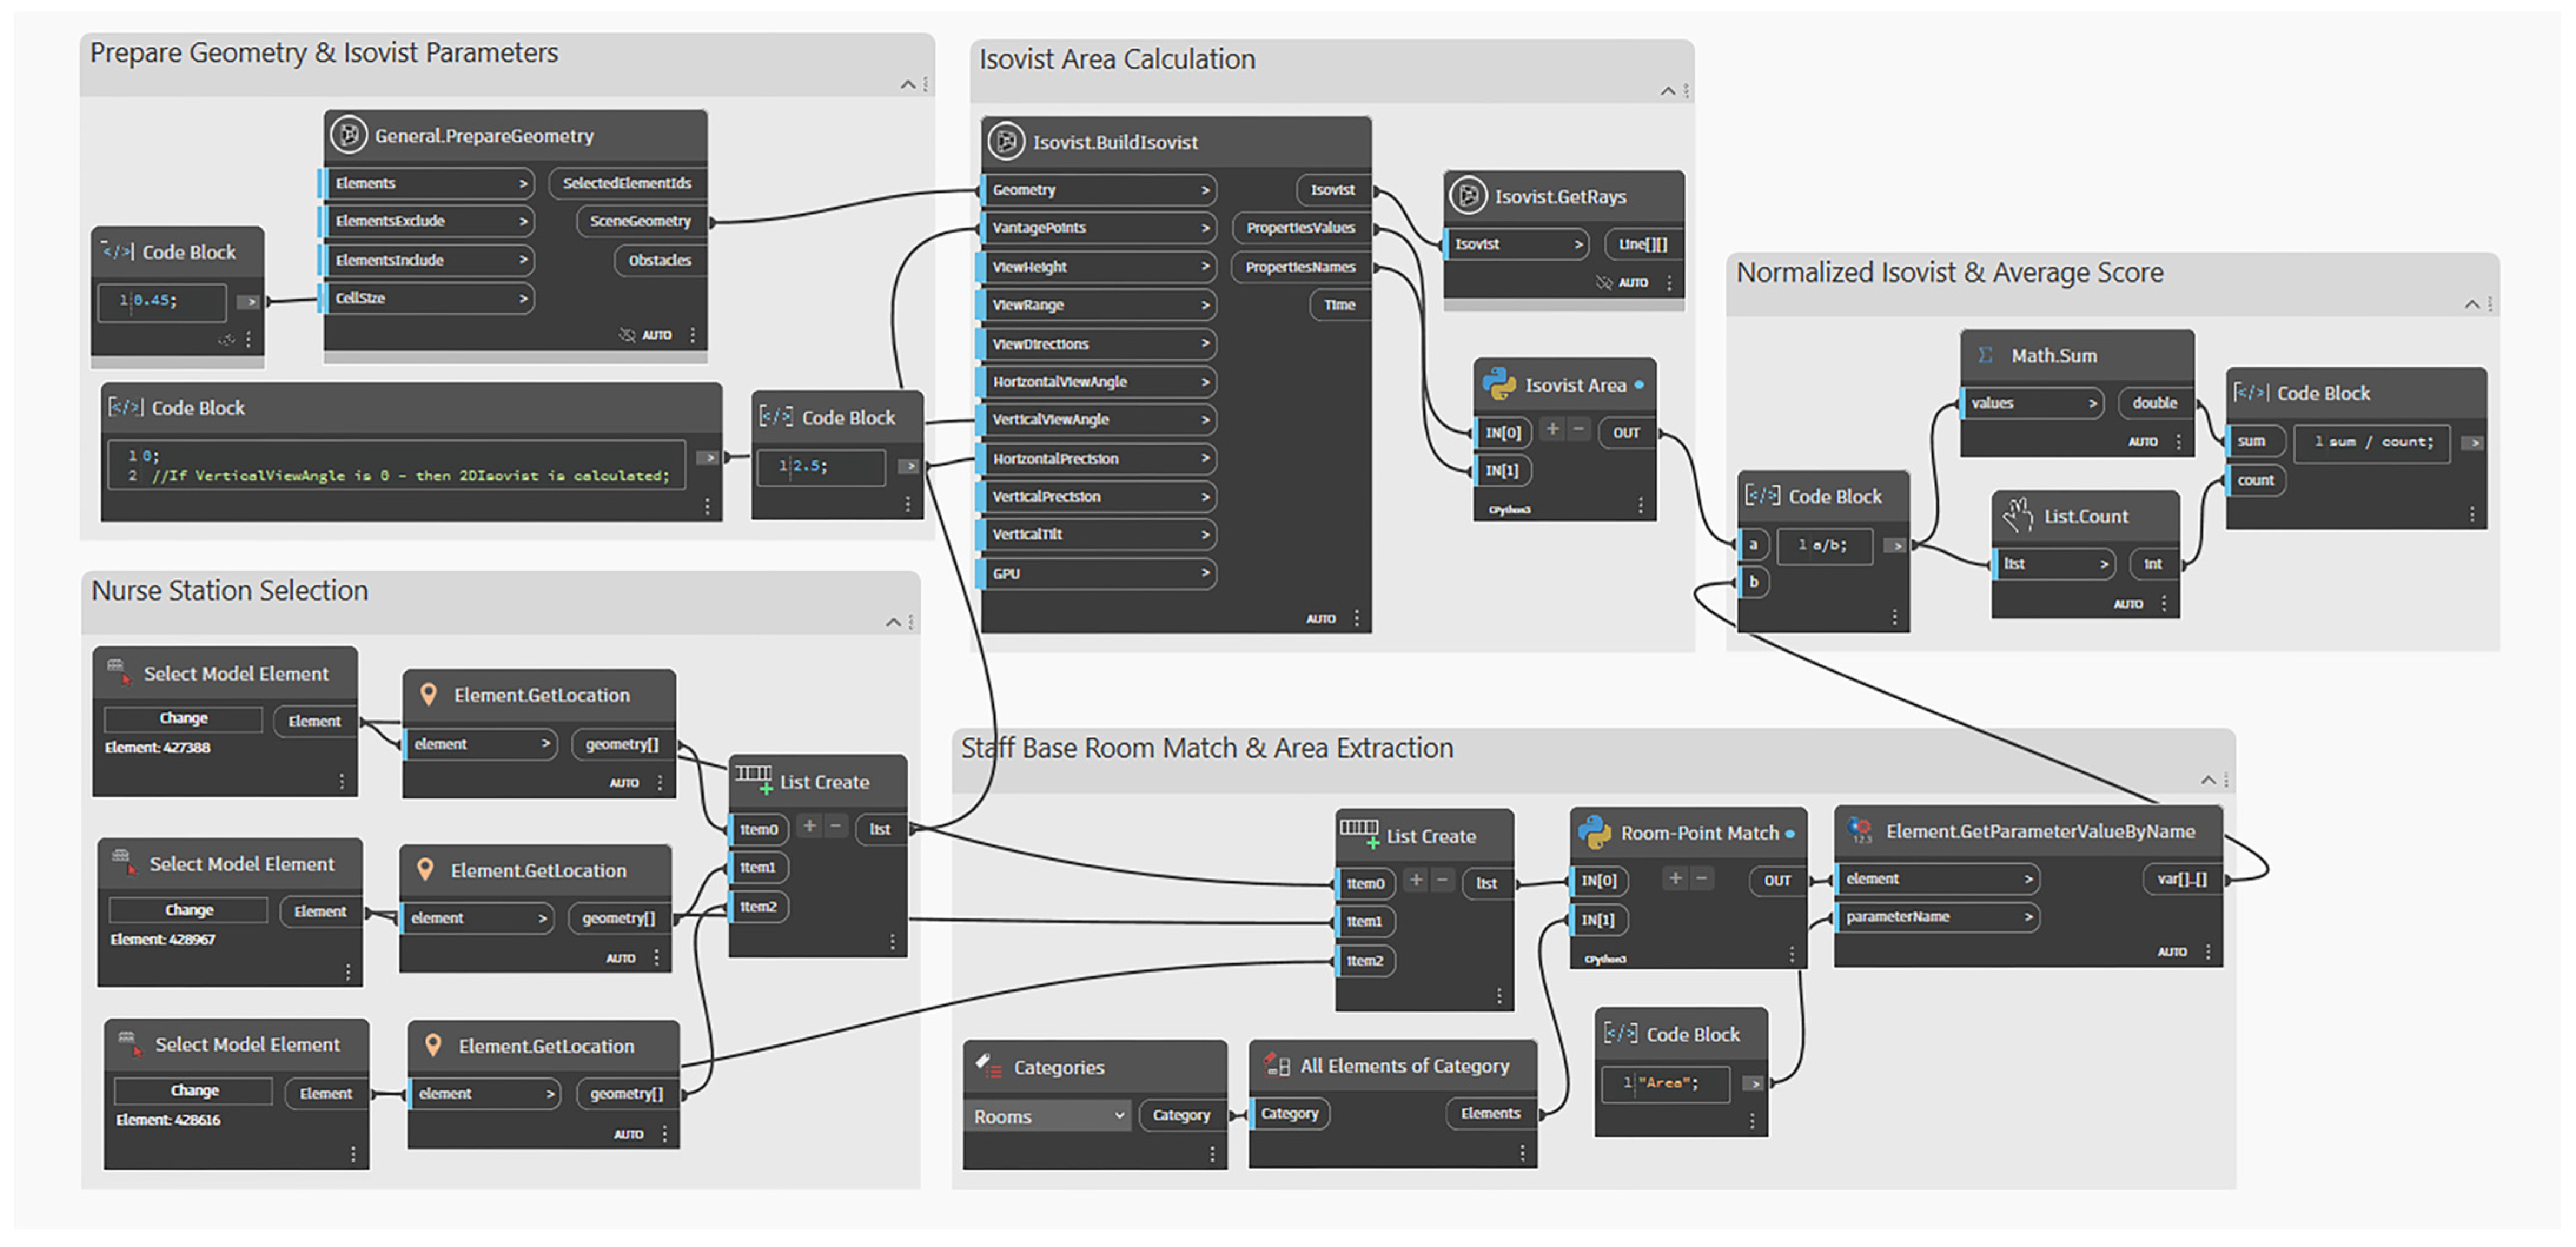
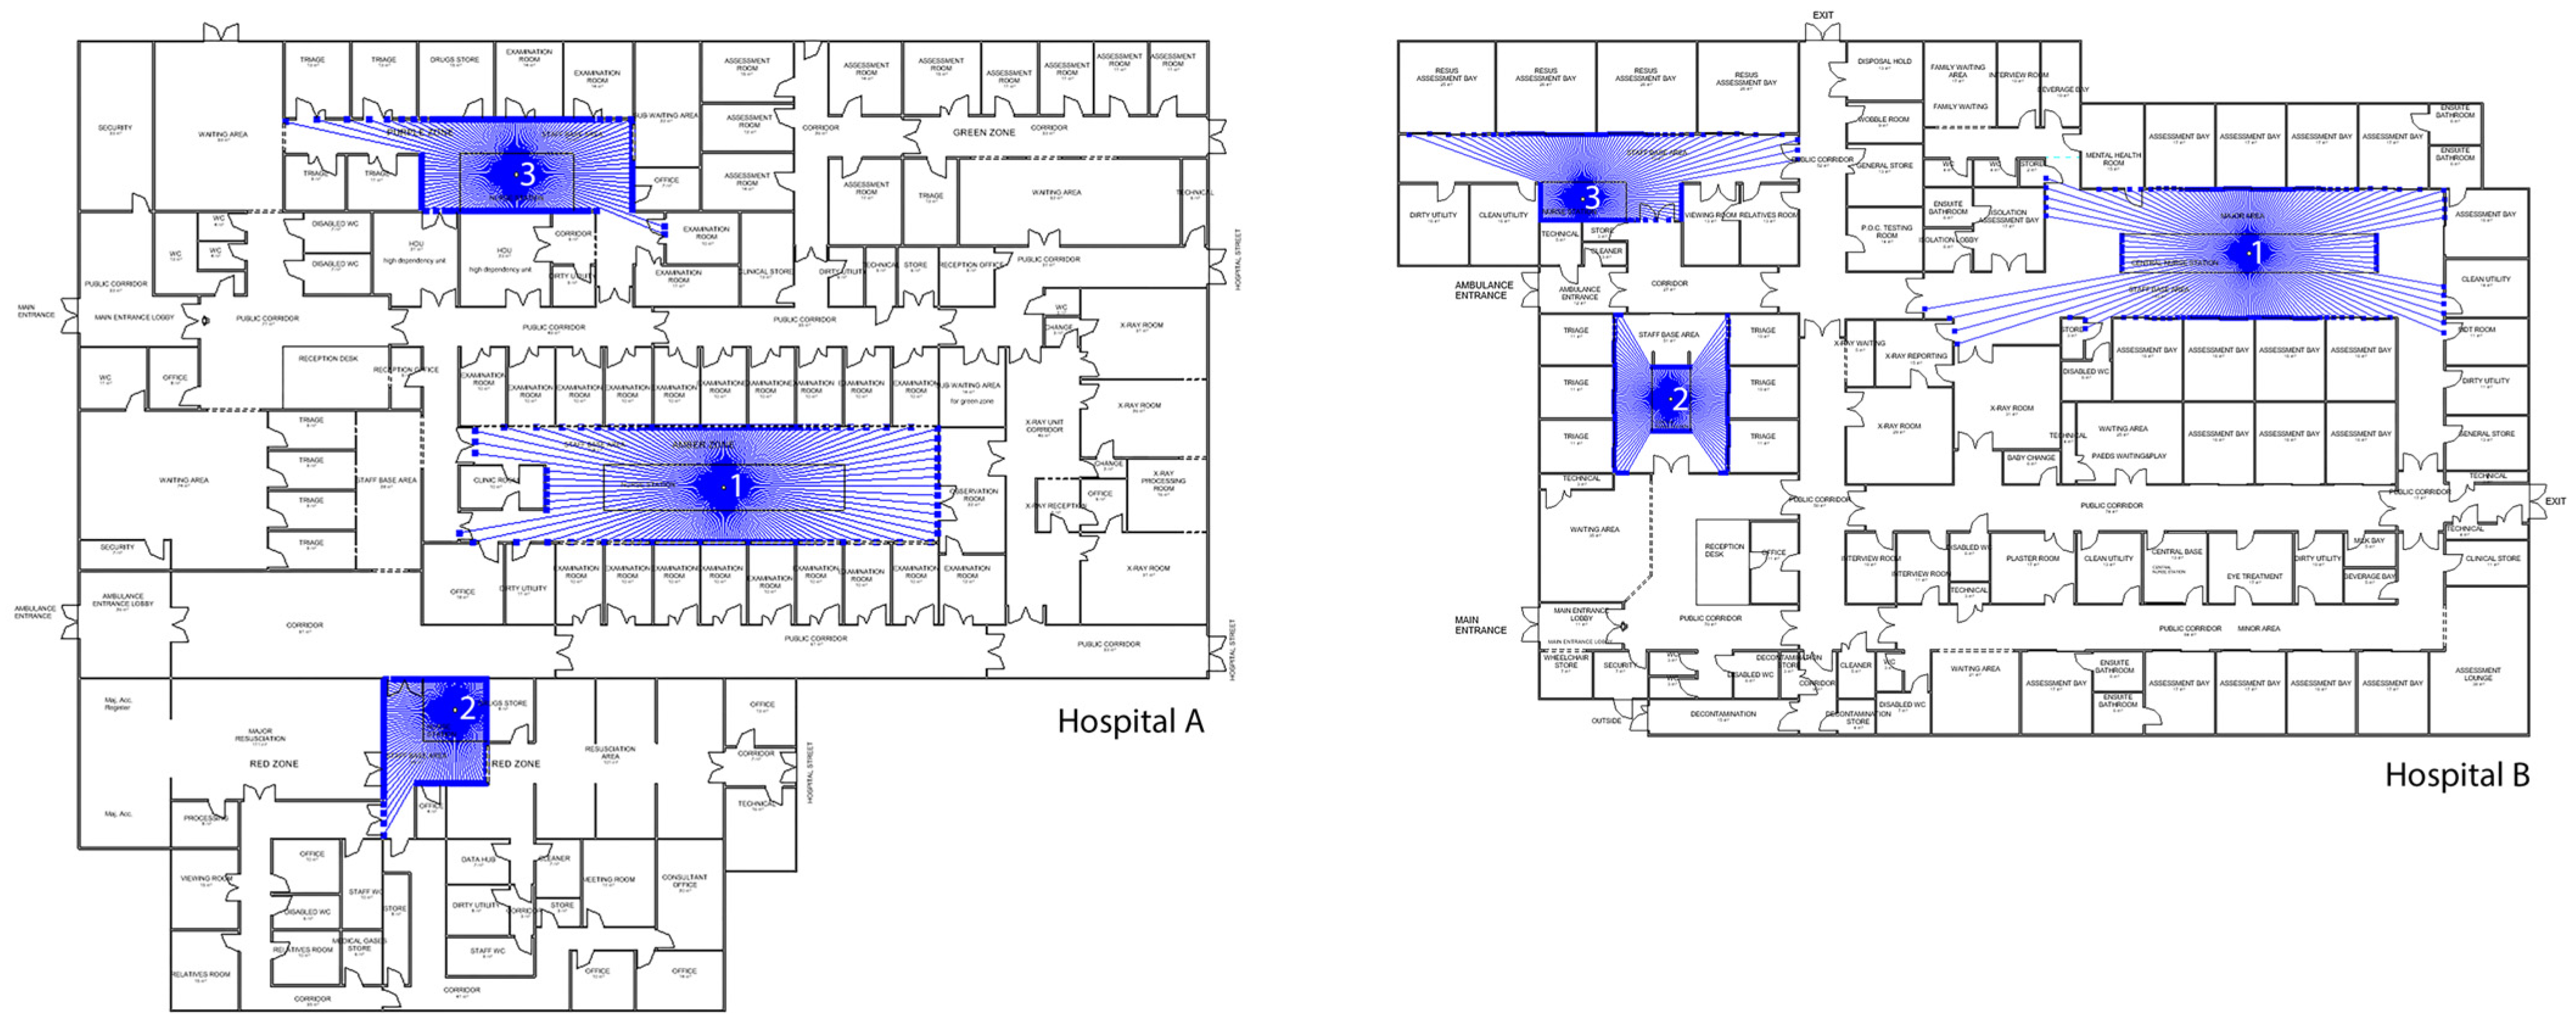
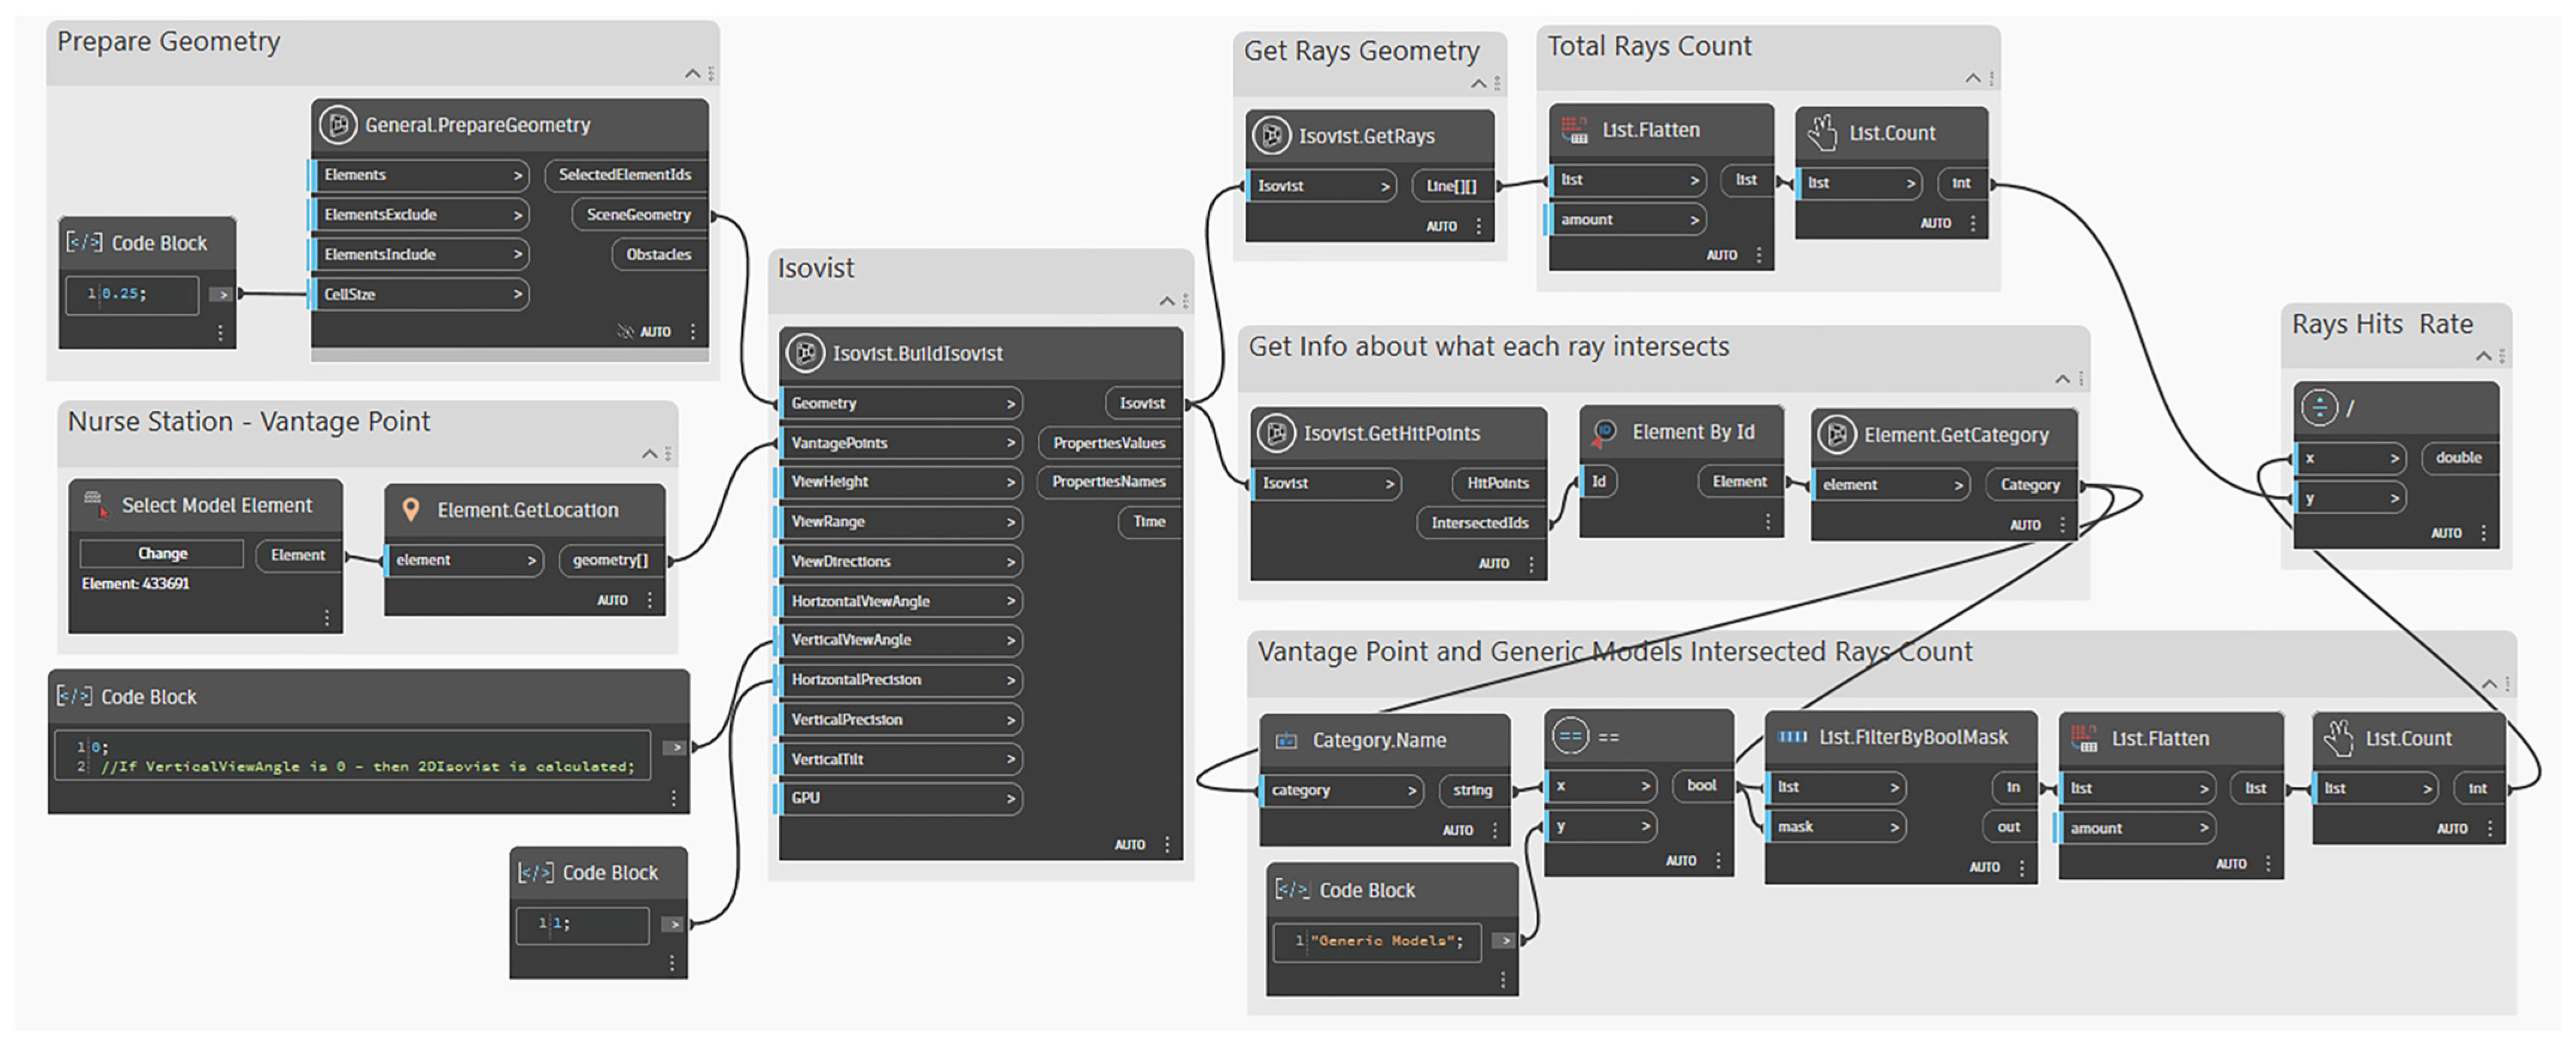
| User Groups: Patients | |||||
|---|---|---|---|---|---|
| No | Criteria | Measured Attribute | Spatial Analysis Method-AVA | Spatial Measures | Analysis Outcome |
| 1 | Wayfinding | Connectivity of public corridors | Accessibility Analysis | Connectivity Value (local) | Higher connectivity values indicate spatial understanding and support navigation. |
| 2 | Wayfinding | Integration of public corridors | Visibility Analysis | Integration Value (global) | Higher integration values indicate overall navigation efficiency. |
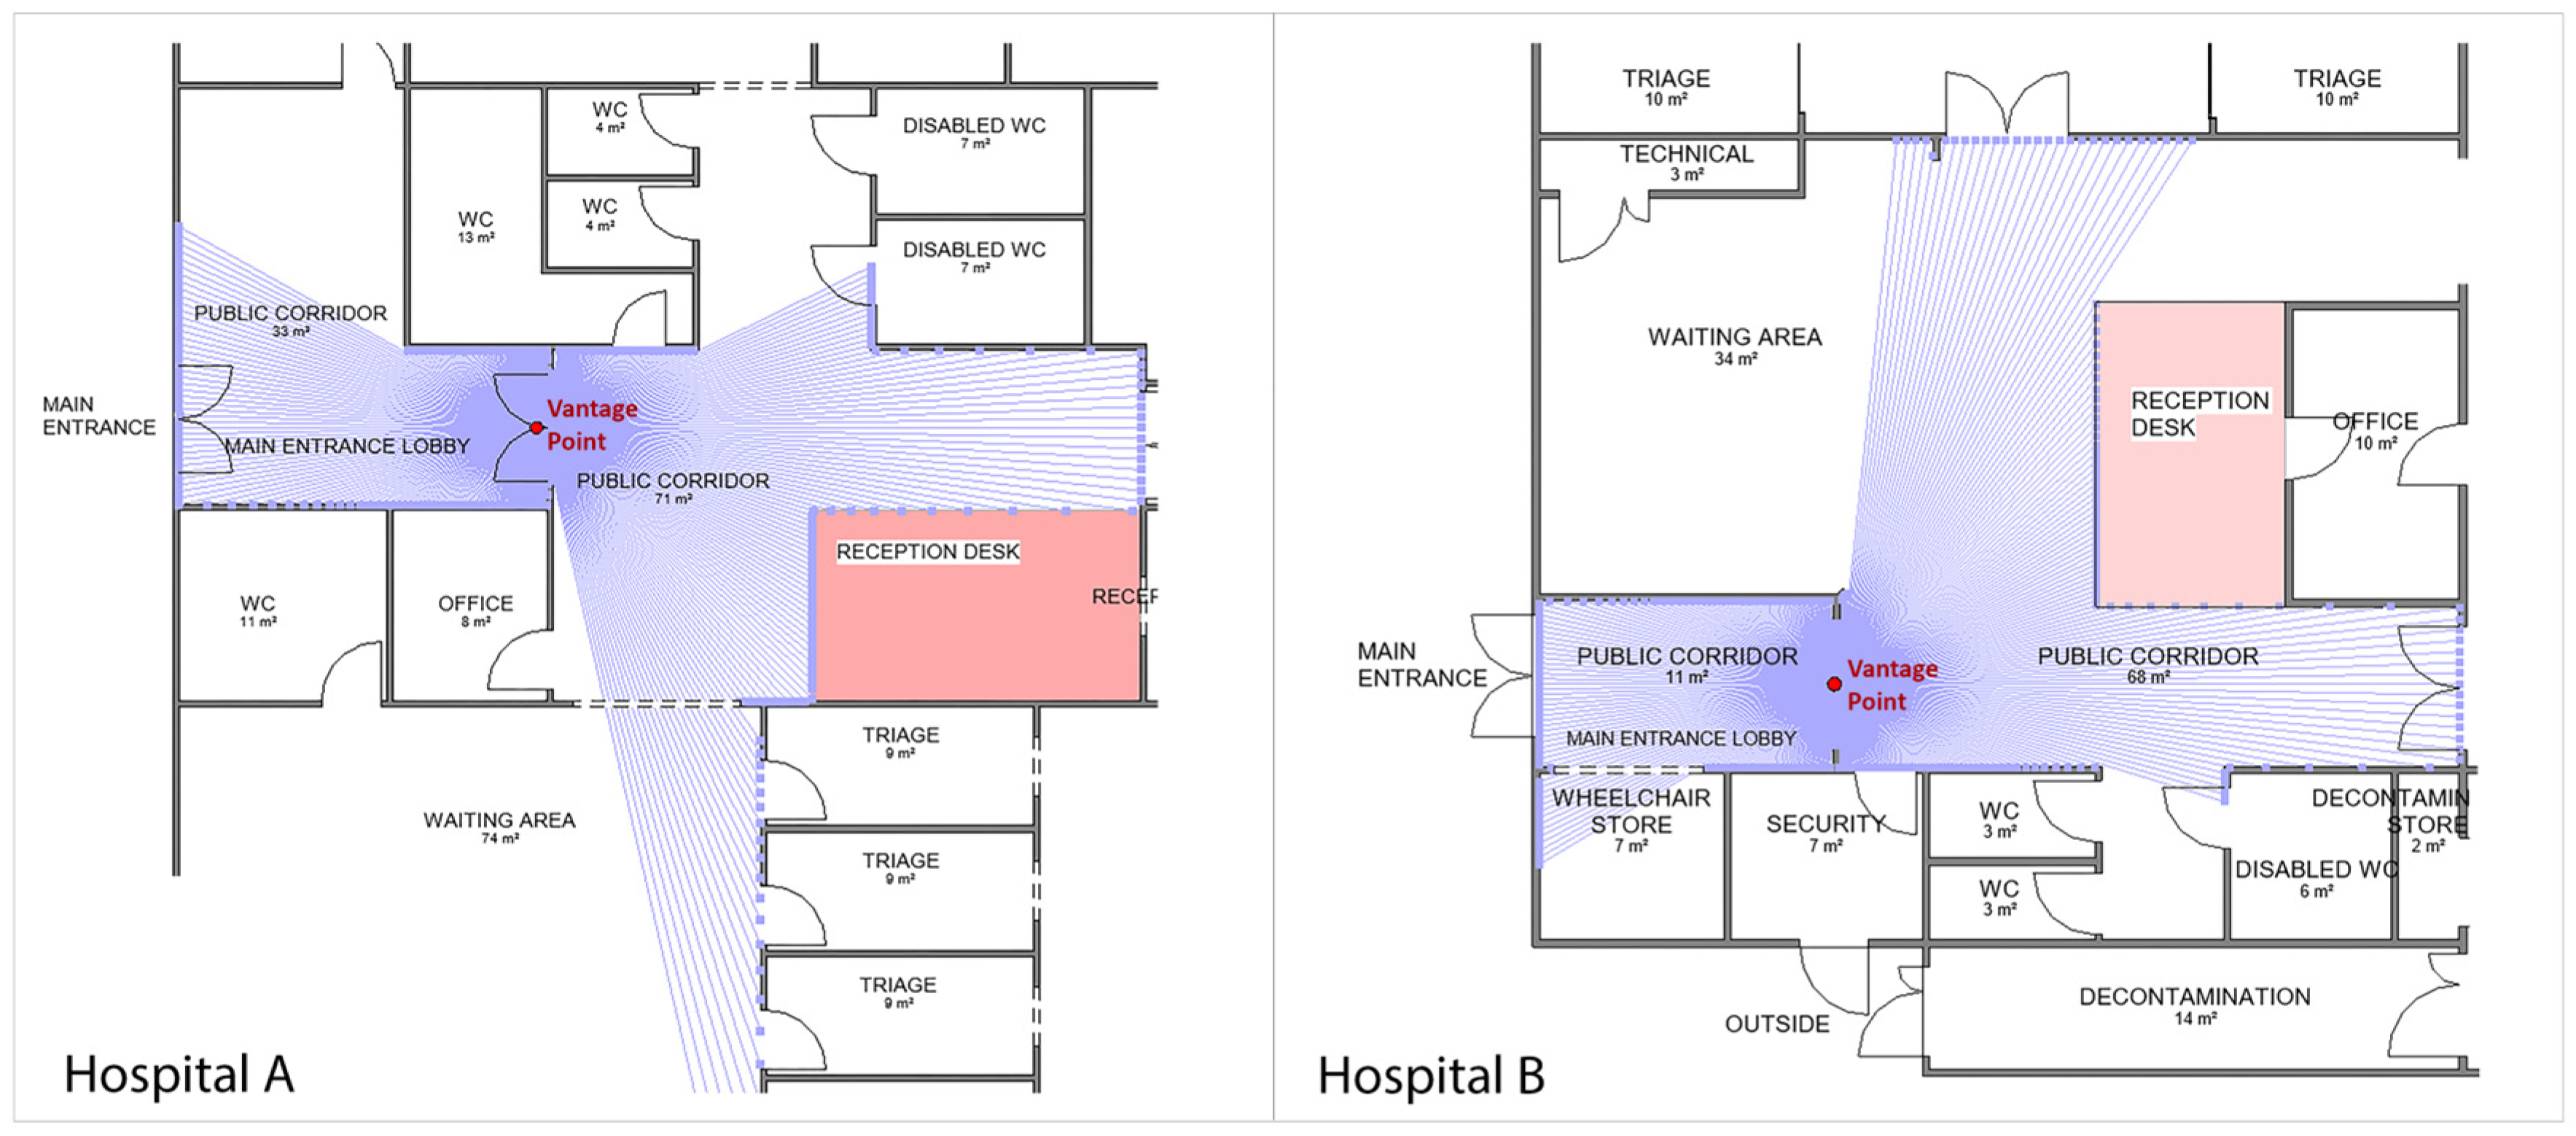
| 3 | Wayfinding | Visibility of reception area from the main entrance | Targeted Visibility Analysis | Targeted Isovist Area | Higher reception visibility values from the entrance indicate easier wayfinding. |
| 4 | Wayfinding | Step depth and metric distance from main entrance to patient rooms | Visibility & Accessibility Analysis | Visual Step Depth & Metric Distance | Lower step depth and shorter distances indicate easier access to patient rooms. |
| 5 | Emergency Accessibility | Step depth and metric distance from ambulance entrance to resuscitation area | Visibility & Accessibility Analysis | Visual Step Depth & Metric Distance | Lower step depth and shorter distances indicate shorter routes, and faster emergency response. |
| 6 | Privacy | Integration of patient rooms | Accessibility Analysis | Integration Value (global) | Lower integration values indicate better privacy. |
| User Group: Nurses | |||||
|---|---|---|---|---|---|
| No | Criteria | Measured Attribute | Spatial Analysis Method-AVA | Spatial Measures | Analysis Outcome |
| 7 | Accessibility | Integration of nurse stations | Accessibility Analysis | Integration Value (global) | Higher integration values indicate higher nurse accessibility. |
| 8 | Visibility | Visual Connectivity of nurse stations | Visibility Analysis | Visual Connectivity Value (local) | Higher visual connectivity values indicate greater visibility. |
| 9 | Visibility | Visibility from nurse stations | Visibility Analysis | Isovist Area | Higher isovist values indicate wider coverage of critical areas and better staff interaction. |
| 10 | Visibility | Visibility of patient areas from the nurse stations | Targeted Visibility Analysis | Targeted Isovist Area | Higher visibility of patient areas from nurse stations indicates better oversight. |
| AVA Spatial Measure | Graph Type | Corresponding Space Syntax Measure | Definition |
|---|---|---|---|
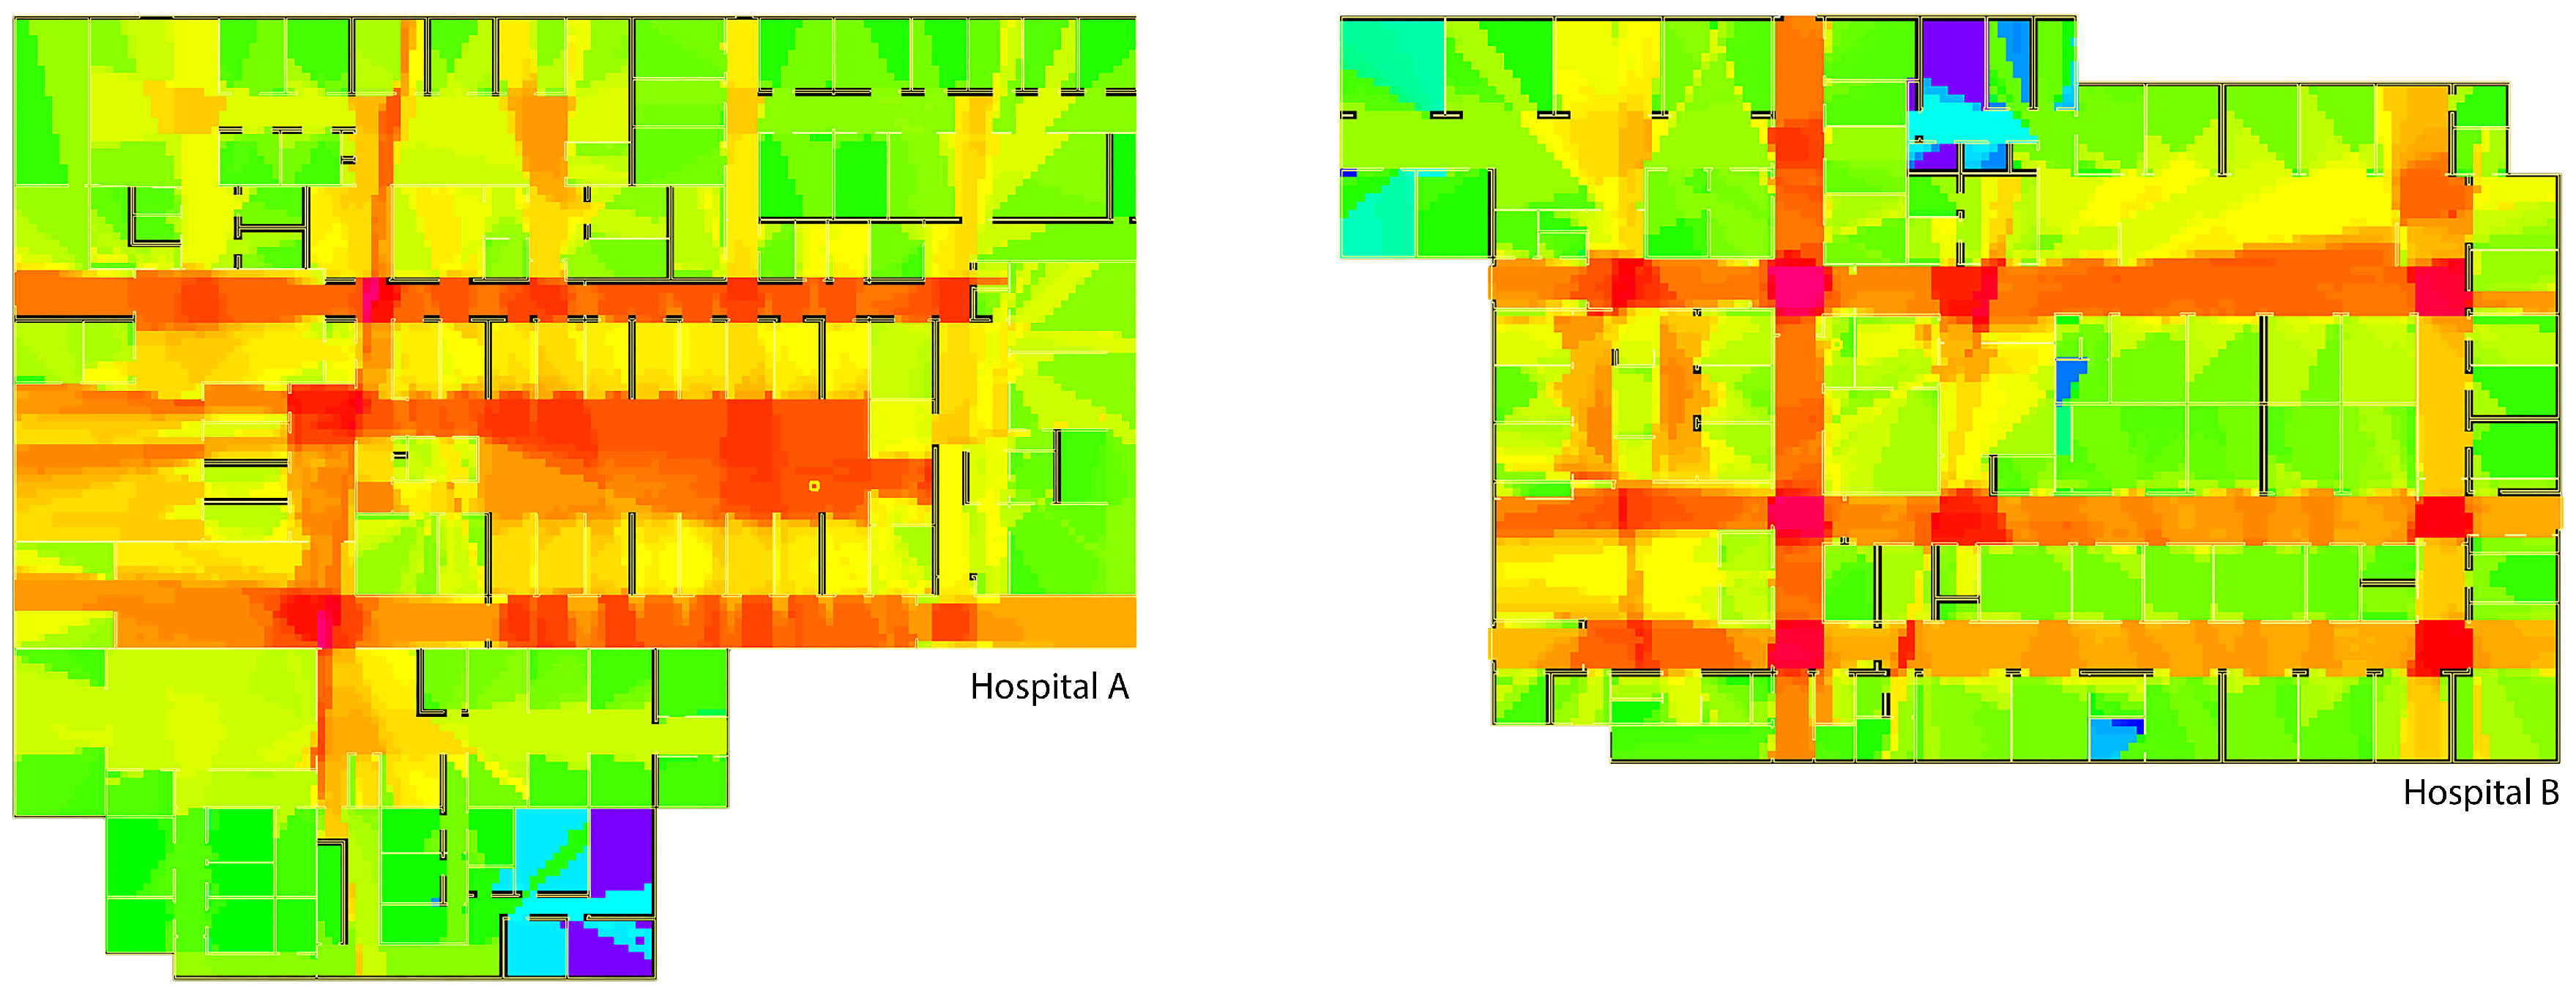
| Measure Degree (Degree Centrality) | Accessibility | Connectivity | The number of directly connected nodes. |
| Visibility | Visual Connectivity | The number of directly visible nodes. | |
| Measure Depth | Accessibility | Metric Mean Depth | The average shortest metric distance from a node to all other nodes. |
| Visibility | Visual Step Depth | The number of visibility steps from a node to all other nodes. | |
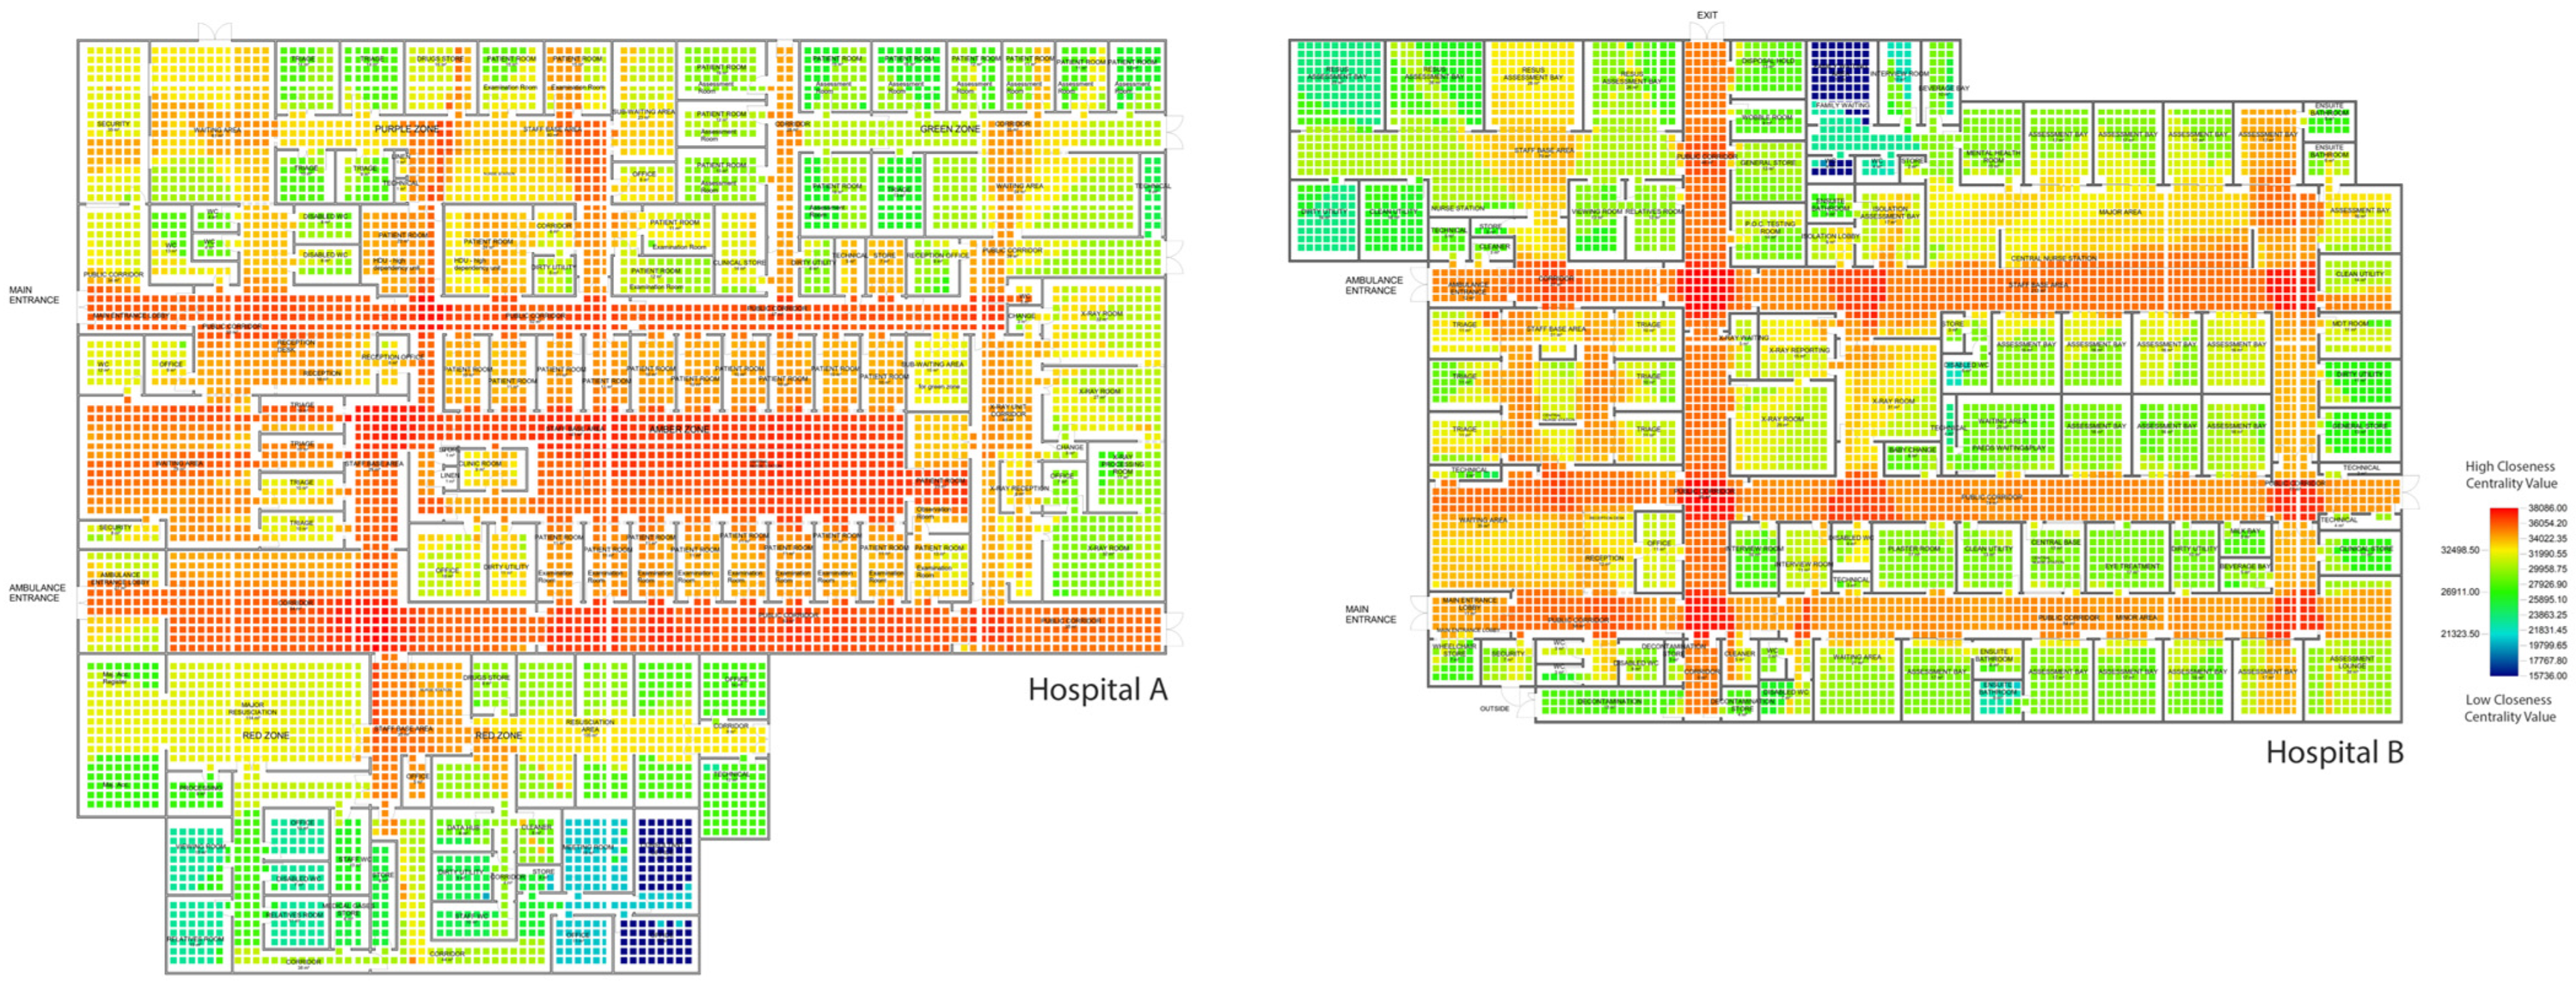
| Closeness Centrality | Accessibility | Integration | The sum of shortest paths from a node to all other nodes. |
| Visibility | Visual Integration | The sum of visibility steps from a node to all other nodes. | |
| Betweenness Centrality | Accessibility | Choice (Betweenness) | The number of shortest paths that pass through a node. |
| Visibility | Visual Choice | The number of shortest visual paths that pass through a node. |
| Metric | Hospital A | Hospital B |
|---|---|---|
| Average Degree—Connectivity Value for Public Corridors | 646.65 | 632.00 |
| Mean Normalized Degree—Connectivity Value (Final Score) | 0.51 | 0.57 |
| Metric | Hospital A | Hospital B |
|---|---|---|
| Average Degree—Integration Value for Public Corridors | 49,586.42 | 35,222.98 |
| Mean Normalized Degree—Integration Value (Final Score) | 0.69 | 0.62 |
| Metric | Hospital A | Hospital B |
|---|---|---|
| Visibility Ratio (Rays Hits Rate) | 0.13 | 0.11 |
| Metric | Hospital A | Hospital B |
|---|---|---|
| Overall Average Step Depth | 2.5 | 3.4 |
| Overall Average Metric Distance | 17.18 m | 21.75 m |
| Metric | Hospital A | Hospital B |
|---|---|---|
| Overall Average Step Depth | 3 | 3 |
| Overall Average Metric Distance | 28.8 m | 16.71 m |
| Metric | Hospital A | Hospital B |
|---|---|---|
| Average Degree—Integration Value for Patient Rooms | 45,034.67 | 30,868.72 |
| Mean Normalized Degree—Integration Value (Final Score) | 0.59 | 0.39 |
| Metric | Hospital A | Hospital B |
|---|---|---|
| Average Degree—Integration Value for Nurse Stations | 45,059.01 | 32,998.14 |
| Mean Normalized Degree—Integration Value (Final Score) | 0.52 | 0.64 |
| Metric | Hospital A | Hospital B |
|---|---|---|
| Average Visual Connectivity of Nurse Stations | 766.32 | 723.16 |
| Mean Normalized Degree—Visual Connectivity Value (Final Score) | 0.58 | 0.51 |
| Hospital | Nurse Station ID | Isovist Area (m2) | Staff Base Room Area (m2) | Normalized Isovist Score |
|---|---|---|---|---|
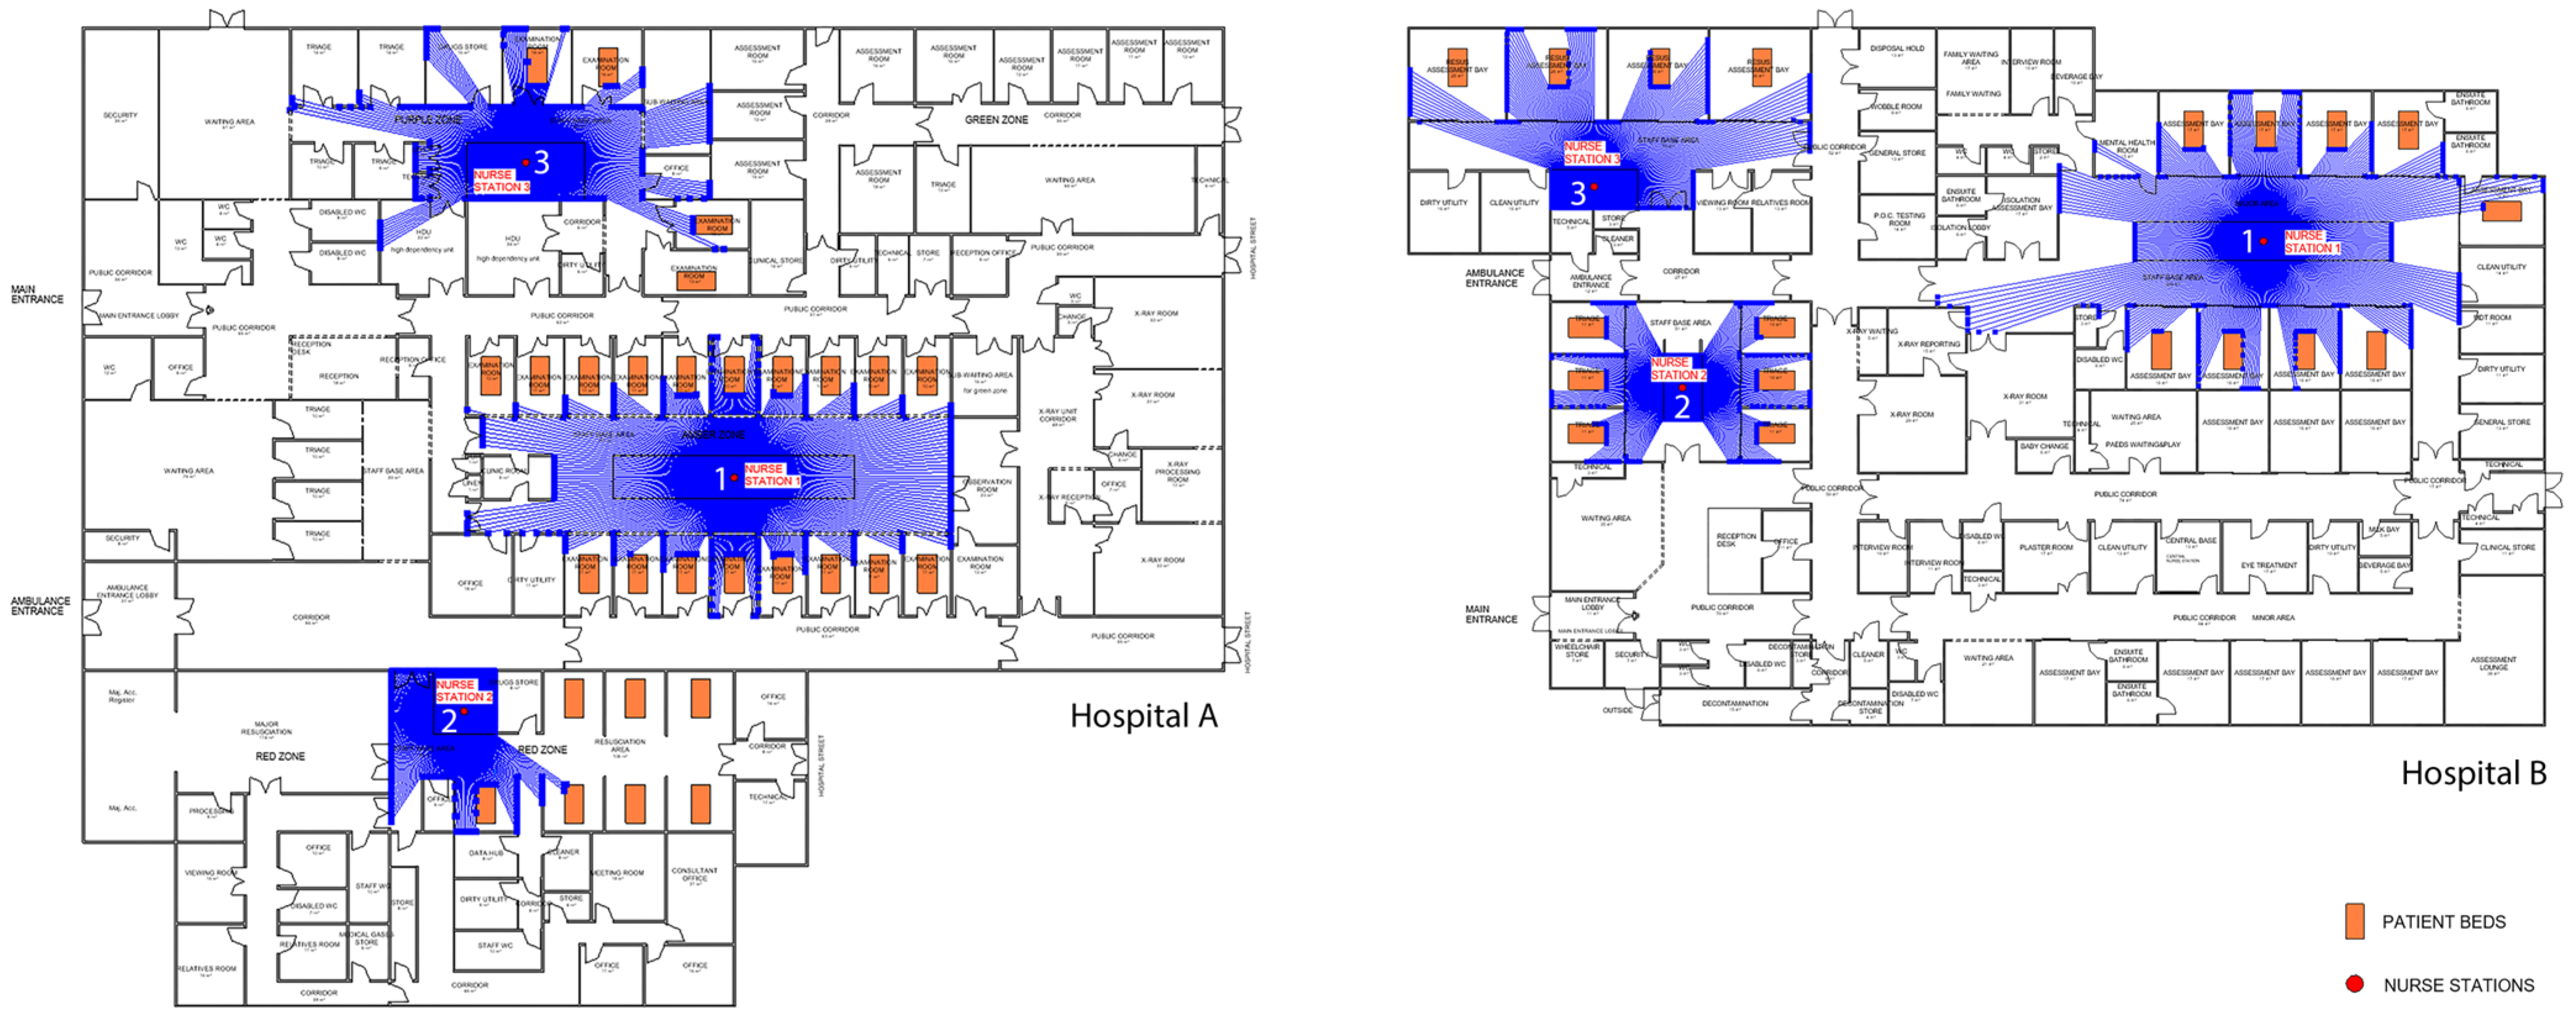
| A | Station 1 | 134.38 | 137.89 | 0.97 |
| Station 2 | 31.84 | 34.01 | 0.94 | |
| Station 3 | 61.22 | 77.32 | 0.79 | |
| Average Score | 0.90 | |||
| B | Station 1 | 134.36 | 192.99 | 0.69 |
| Station 2 | 31.60 | 50.70 | 0.62 | |
| Station 3 | 54.39 | 69.67 | 0.78 | |
| Average Score | 0.70 | |||
| Hospital | Nurse Station ID | Total Rays | Rays Hitting Patient Beds | Patient Beds Visibility Rate |
|---|---|---|---|---|
| A | Station 1 | 361 | 74 | 0.20 |
| Station 2 | 361 | 21 | 0.05 | |
| Station 3 | 361 | 25 | 0.06 | |
| Average Score | 0.10 | |||
| B | Station 1 | 361 | 65 | 0.18 |
| Station 2 | 361 | 78 | 0.21 | |
| Station 3 | 361 | 29 | 0.08 | |
| Average Score | 0.16 |
| User Group | Spatial Theme | Analysis | Hospital A | Hospital B | Correlation | Core Concept |
|---|---|---|---|---|---|---|
| Patient | Wayfinding | 1. Connectivity of Public Corridors | 0.51 | 0.57 | Positive | Spatial legibility & circulation clarity |
| 2. Integration of Public Corridors | 0.69 | 0.62 | Positive | Navigation efficiency | ||
| 3. Visibility of Reception from Entrance | 0.13 | 0.11 | Positive | Visual guidance & orientation | ||
| 4. Walk-in Flow (Step Depth/Metric Distance) | 2.5/17.18 | 3.4/21.75 | Negative | Movement efficiency & route length | ||
| Emergency Accessibility | 5. Ambulance to Resuscitation (Step Depth/Metric Distance) | 3/28.8 | 3/16.71 | Negative | Response efficiency & critical path length | |
| Privacy | 6. Integration of Patient Rooms | 0.59 | 0.39 | Negative | Spatial segregation & privacy | |
| Nurse | Accessibility | 7. Integration of Nurse Stations | 0.52 | 0.64 | Positive | Operational centrality & workflow efficiency |
| Visibility | 8. Visual Connectivity of Nurse Stations | 0.58 | 0.51 | Positive | Visual control & situational awareness | |
| 9. Visibility from Nurse Stations | 0.90 | 0.70 | Positive | Visual openness & interaction | ||
| 10. Visibility of Patient Beds from Nurse Stations | 0.10 | 0.16 | Positive | Targeted supervision & oversight |
Disclaimer/Publisher’s Note: The statements, opinions and data contained in all publications are solely those of the individual author(s) and contributor(s) and not of MDPI and/or the editor(s). MDPI and/or the editor(s) disclaim responsibility for any injury to people or property resulting from any ideas, methods, instructions or products referred to in the content. |
© 2025 by the authors. Licensee MDPI, Basel, Switzerland. This article is an open access article distributed under the terms and conditions of the Creative Commons Attribution (CC BY) license (https://creativecommons.org/licenses/by/4.0/).
Share and Cite
Bayraktar Sari, A.O.; Jabi, W. A Computational BIM-Based Spatial Analysis Method for the Evaluation of Emergency Department Layouts. Buildings 2025, 15, 3818. https://doi.org/10.3390/buildings15213818
Bayraktar Sari AO, Jabi W. A Computational BIM-Based Spatial Analysis Method for the Evaluation of Emergency Department Layouts. Buildings. 2025; 15(21):3818. https://doi.org/10.3390/buildings15213818
Chicago/Turabian StyleBayraktar Sari, Aysegul Ozlem, and Wassim Jabi. 2025. "A Computational BIM-Based Spatial Analysis Method for the Evaluation of Emergency Department Layouts" Buildings 15, no. 21: 3818. https://doi.org/10.3390/buildings15213818
APA StyleBayraktar Sari, A. O., & Jabi, W. (2025). A Computational BIM-Based Spatial Analysis Method for the Evaluation of Emergency Department Layouts. Buildings, 15(21), 3818. https://doi.org/10.3390/buildings15213818


