Article

Spatial Usage Rate Model and Foot Vote Method for Thermal Comfort and Crowd Behaviour Analysis in Severe Cold Climate City Design

1
School of Civil Engineering and Architecture, Zhejiang Sci-Tech University, Hangzhou 310018, China
2
School of Architecture and Design, Harbin Institute of Technology, Harbin 150001, China
3
Key Laboratory of Cold Region Urban and Rural Human Settlement Environment Science and Technology, Ministry of Industry and Information Technology, Harbin 150001, China
*
Authors to whom correspondence should be addressed.
Buildings 2025, 15(21), 3812; https://doi.org/10.3390/buildings15213812
Submission received: 7 September 2025 / Revised: 14 October 2025 / Accepted: 17 October 2025 / Published: 22 October 2025
(This article belongs to the Section Architectural Design, Urban Science, and Real Estate)

Abstract

Understanding the thermal environment of outdoor public spaces is critical for climate-responsive architectural design, evidence-based urban science, and data-driven smart city planning. Thermal comfort shapes both individual decision-making and collective behavioural patterns, offering valuable insights for designing spaces that support year-round vitality. This study investigates the relationship between thermal conditions and crowd behaviour in severe cold regions by combining behavioural mapping with on-site environmental measurements. Results show that in high-temperature conditions, spatial distribution is primarily influenced by sunlight and shade, whereas at low temperatures, sunlight has minimal effect on space use. Attendance, duration of stay, and activity intensity follow quadratic relationships with the Universal Thermal Climate Index (UTCI), with optimal values at 29 °C, 26 °C, and 27 °C, respectively. Walking speed is inversely correlated with UTCI, with the fastest speeds observed under cold discomfort, reflecting rapid departure from space. Sitting behaviour peaks at 21 °C UTCI and declines to nearly zero when UTCI is below 10 °C. A comparative analysis between Harbin and other regions reveals significant deviations from temperate zone patterns and greater similarity to subtropical behavioural responses. A key contribution of this study is the introduction of the spatial usage rate model and the foot vote method, two novel, observation-based tools that allow for the objective estimation of thermal comfort without relying solely on subjective surveys. These methods offer architects, planners, and smart city practitioners a powerful evidence-based framework to evaluate and optimise outdoor thermal performance, ultimately enhancing usability, adaptability, and public engagement in cold-climate cities.

1. Introduction

1.1. Literature Review

In the context of rapid urbanisation, the urban thermal environment is becoming increasingly critical to quality of life. Therefore, thermal comfort in urban public spaces has become a fundamental aspect that must be considered in urban construction. Since the 1990s, studies have been conducted in various cities to investigate the impact of the outdoor thermal environment on crowds [1]. These studies have been carried out in different climate zones, including subtropical (humid, arid, semi-arid), temperate (marine, continental, arid, semi-arid), Mediterranean, and severe cold regions, highlighting the global relevance of outdoor thermal comfort [2,3,4,5,6,7,8,9,10,11,12,13,14,15,16,17,18,19,20,21,22,23,24,25,26,27,28,29,30,31,32,33,34,35,36,37,38,39]. According to the Köppen climate classification, most existing studies have been concentrated in subtropical, temperate, and Mediterranean climates. These investigations generally focus on squares and parks, employing thermal environment measurements and behavioural observations as their primary research approaches.
Existing studies have shown that the spatial distribution of crowds in outdoor environments is strongly influenced by shade and sunlight in varying thermal conditions. This relationship in subtropical regions, Mediterranean climates, and temperate zones exhibits similar patterns, whereas it shows an inverse trend in colder regions [2,3,4,5,6,40]. In subtropical regions, the proportion of people seeking shade increases with rising temperatures [2,3,4,5,6]. For instance, in Guangzhou, China, over 80% of the population is outdoors when the temperature ranges from 14 °C to 22 °C [3]. In Taiwan, China, when the physiological equivalent temperature (PET) is below 30 °C and above 42 °C, the proportions of people in shaded areas are 30% and 90%, respectively [2]. In contrast, the Mediterranean regions of Greece and Spain also show similar behavioural patterns, where people seek shade more frequently with higher temperatures, yet these regions show different local patterns depending on factors such as humidity and local air circulation [41,42,43,44].
The temperate regions of Hungary, Poland, and Sweden show similar crowd behaviours. For instance, Kántor and Unger’s research shows that in Szeged, Hungary, the higher the PET, the more people prefer to be in shaded areas [12,45]. In Athens, Greece, a typical Mediterranean climate, the number of people choosing to stay in the sun decreases as the temperature increases [13,46].
In contrast, under low-temperature conditions, the influence of sunlight and shade on crowd distribution tends to diminish. For instance, in Curitiba, Brazil, which is in the subtropical region, people occupy semi-shaded areas during summer. However, a less distinct trend in the opposite direction is observed during winter [11]. In Shenyang, China, which is in the temperate zone, more people tend to seek shade during the hot season. However, the distribution of sunlight and shade during the cold season does not considerably affect the distribution of the crowd [18]. While people generally seek shaded areas during hot seasons, this preference becomes less pronounced in colder weather, where thermal comfort needs are less directly linked to sun exposure.
Thermal environment measurements are typically conducted by installing fixed meteorological stations at selected research sites or mobile meteorological stations on vehicles to collect data [8,9,10,11].
Thermal comfort indices derive from single-node, two-node, and multi-node models: single-node models use heat balance with six parameters (Ta, Rh, Va, T, Cl, metabolic rate); two-node models include skin and core temperature effects; multi-node models divide the body to account for skin/core temperatures and their changes [47,48]. Key indices include PET (based on the two-node Munich model, widely trusted as a primary index), Tmrt (suited for daytime, relies on globe thermometers per ISO 7726:1998, and sensitive to solar radiation), UTCI (from Fiala’s multi-node model, responsive to temperature, radiation, wind, and humidity, capturing temporal changes well), and WBGT (assesses outdoor heat stress for active groups but limited by activity/clothing) [49,50,51].
To investigate the behavioural responses to the thermal environment, data on crowd observations are commonly collected through questionnaires and structured interviews. However, such methods rely on human observation, which is limited by human abilities in processing visual information—potentially leading to recording errors [19]. To overcome this limitation, images recorded by electronic devices have been used in some studies to collect data on crowd behaviour, and then findings have been derived based on the collected data and subsequent analysis [7].
Among various aspects of outdoor thermal comfort studies, attendance has been one of the most extensively investigated, particularly in subtropical and Mediterranean climates [20,21,22,23,24,25,26,27,28]. Research in these regions reveals a non-linear relationship between temperature and attendance, where attendance increases up to a certain thermal threshold and then declines thereafter. For example, studies in Taiwan and Sichuan, China, indicate that attendance peaks at a WBGT of approximately 26 °C and a PET of 24.5 °C, respectively [22,25]. In Algeria, attendance is highest during winter, when air temperatures peak, and during summer, when air temperatures are at their lowest [27]. In contrast, studies in temperate climates suggest a more linear pattern, where attendance steadily increases with temperature [1,12,14]. For example, Kántor and Unger discovered that in Szeged, Hungary, attendance approaches zero when PET is below 12 °C and rises with higher PET values [12]. Thorsson et al. observed that in Gothenburg, Sweden, attendance increases with an increase in mean radiant temperature (Tmrt) [14].
In addition to attendance, several studies have investigated stay duration as a key behavioural indicator of crowd behaviour. In subtropical regions, longer stays are observed in shaded areas [21,29,30]. For instance, research in Chongqing, China, indicates that extensive shading is conducive to prolonging stay duration [29]. In São Paulo, Brazil, stay duration increases when solar radiation (SR) decreases [30]. In temperate regions, the stay duration of the crowd peaks within a thermally comfortable range and declines as temperatures increase or decrease. Thorsson et al. reported that individuals tend to stay longer when the thermal environment is within an acceptable range (slightly cool, comfortable and slightly warm) [1]. In Fuxin, China, the stay duration is the longest when the temperature is 27 °C. When the temperature reaches 30 °C, the stay duration is less than 5 min [31]. In contrast, findings in Mediterranean zones are less consistent-Zacharias et al. found no clear effect of temperature on stay duration in San Francisco [32].
Beyond attendance and stay duration, scholars also examined crowd activity states, including total pedestrian volume [33], posture during stays [52], activity intensity [34] and seating behaviour [35]. For instance, a study conducted in Chiayi, Taiwan, revealed that the less shaded the area, the lower the activity intensity of the crowd [34]. Research in Indonesia has shown that seating behaviour is influenced by shade, with people more likely to sit on shady ground rather than on sun-exposed benches [35]. These behavioural patterns are not only shaped by microclimatic conditions but also by broader factors such as life rhythm, spatial characteristics and gender and age.
The above review indicates that existing related research is relatively comprehensive, primarily focusing on the subtropical, temperate and Mediterranean climatic zones, highlighting the diverse dimensions of behavioural response to outdoor environments. However, limited attention is given to severe cold regions.

1.2. Objective and Motivation

In severe cold regions, studying outdoor thermal comfort is crucial. Prolonged cold exposure can lead to health issues like hypothermia and frostbite [53]. Moreover, understanding thermal comfort helps design inviting public spaces, as seen in research on urban park thermal comfort [54]. This benefits energy efficiency and quality of life. Additionally, research on the activity states of crowds is relatively scarce. In severe regions, attracting outdoor activities is vital: it boosts physical health via winter sports [40], fosters social bonds through shared spaces [54], and drives local economies via tourism.
Existing research on China’s severe cold regions remains limited, particularly with regard to integrated analyses of crowd behavior. Moreover, the influence of outdoor thermal comfort on crowd behavior in these regions—characterized by substantial annual temperature variations and extremely low winter temperatures—has been insufficiently examined. This gap highlights the need to clarify how cold-climate thermal conditions shape human behavior, as such knowledge is essential for enhancing outdoor environmental quality, guiding urban planning, and improving public well-being in severe cold regions. Accordingly, the research questions of this article are as follows:
  • What are the distinctive patterns of crowd behavior (in terms of spatial distribution, attendance, duration of stay, and activity intensity) in China’s severe cold regions, and how are these patterns related to outdoor thermal comfort?
  • Can objective observations of crowd behavior be applied to develop a reliable method for assessing subjective thermal comfort in severe cold climates?
  • How do the findings on thermal comfort and crowd behavior in severe cold regions differ from those in other climatic zones, and what unique insights do these differences provide?
This study makes a significant contribution to advancing research in this field by addressing a critical gap. While prior studies have primarily focused on subtropical and Mediterranean climates, research on severe cold regions remains comparatively scarce. By linking objective observations of crowd behavior with subjective thermal comfort assessments, this study proposes a methodological framework tailored to severe cold climates, thereby enriching global thermal comfort research. From a practical perspective, the findings provide evidence-based insights for urban planning in China’s severe cold regions, such as designing climate-adaptive public spaces and optimizing outdoor facilities to promote liveability and social interaction. In the context of escalating climate change, the study also informs climate resilience strategies by elucidating human behavioral adaptations to extreme cold, offering both theoretical and practical value for building people centered, climate-resilient cities.

2. Methodology

2.1. Study Area

This research was conducted in Harbin, China (125°42–130°10′ E, 44°04–46°40′ N), which has a mid-temperate continental monsoon climate, as shown in Figure 1a [41,42,43,44]. However, owing to its short hot summers and long cold winters, it is classified as a severe cold region in the ‘GB50352-2019 Unified Design Standard for Civil Buildings’ [55]. According to the China Meteorological Data Network, the monthly average air temperature in Harbin reaches its highest value in July (23.2 °C) and its lowest value in January (−17.5 °C). The Central Avenue was selected for the field experiment, as shown in Figure 1b, which is the most popular pedestrian street in Harbin. Known for its high foot traffic, the avenue can accommodate up to 500,000 people per day during peak periods, making it an ideal site for observing crowd behaviour in cold climate conditions.

2.2. Experimental Process

To investigate behavioural responses to the outdoor thermal environment in a severe cold region, two field experiments were conducted on Central Avenue in Harbin. All environmental and behavioral data were continuously collected between 09:00 and 16:00 on each observation day. This timeframe was selected firstly because pedestrian volume is low before 9:00, yielding fewer observable samples. Secondly, during the cold season, darkness begins to fall after 16:00, accompanied by a significant drop in temperature. In the absence of special events or attractions, people tend to reduce their outdoor activities in the evening. The darkness would also affect the accuracy of observing pedestrian numbers and judging their characteristics, as well as the analysis of how the thermal environment’s changes correlate with human responses. Environmental parameters were recorded at one-minute intervals, ensuring high temporal resolution for thermal condition monitoring. Experiment 1 aimed to observe the spatial distribution and activity patterns of pedestrians across different climatic seasons. Mobile video recording was used to capture crowd behaviours within the site. Crowd data were sampled once every hour, and each observation session lasted for a full day within the defined time window. Experiment 2 focused on quantifying pedestrian attendance, including stay duration and total pedestrian volume, using a fixed camera setup in a high-footfall location. In this case, pedestrian movement was continuously recorded throughout the observation period to capture uninterrupted crowd dynamics. Both experiments were carried out across seasons to capture seasonal behavioural variations.
To minimize interference from short-term weather variations and to isolate the effects of thermal comfort, only clear and sunny days were selected for field measurements. Days with precipitation or snowfall were excluded, as pedestrians under such conditions tend to seek shelter, which would confound the observation of thermal comfort-driven behavior. Wind conditions, however, were included, as wind speed is an important component of the thermal comfort evaluation and is accounted for in the UTCI calculation.

2.2.1. Observation of Spatial Distribution (Experiment 1)

To provide a comprehensive overview of the facility use and crowd behaviour along Central Avenue, two observation areas measuring 200 m × 200 m were selected in the northern (B-S) and southern (N-S) sections for crowd observation, as depicted in Figure 1c,d. For recording crowd behaviour along the linear street segments (depicted in yellow), a mobile video camera is the optimal approach for recording. In addition, to ensure visibility of individuals under trees while maintaining an appropriate height, a small camera mounted on a mobile stand was employed. The camera had a field of view of 145°, allowing for a comprehensive recording of the crowd when the device is moved in one direction [19].
Based on the experimental design proposed in prior studies, data recording was performed on an hourly basis [2,12,22,23,56]. First, the seasons in Harbin were classified according to QX/T 152-2012 division of climatic season—cold season, transitional season and hot season [57]. From July to December 2020, five observation sessions were conducted in each area, namely, one in the hot season, one in the transitional season and three in the cold season (to compensate for lower daily samples due to the extreme temperatures). All observations were carried out on weekends to capture periods of high pedestrian activity.
Preliminary observations revealed that pedestrian activity was most concentrated between 9:00 and 16:00. Hence, data were collected during this time period. Only individuals who remained in the camera frame for more than 10 s were included, as most pedestrians moved quickly through the area, mostly not exceeding 180 s. Thus, the attendance count included those who stayed for at least 10 s, reflecting behavioural patterns on the pedestrian street (as opposed to parks and squares where people stay longer). The recorded behaviour included the following: (1) location: their position and shadow conditions; (2) activity: viewing scenery, playing, etc.; and (3) posture: sitting and standing [1,21]. In total, approximately 4250 samples were collected.

2.2.2. Attendance Statistics (Experiment 2)

While Experiment 1 provided temporal and spatial data, its hourly sampling method was insufficient for capturing time-based cumulative metrics such as total attendance and pedestrian flow. To address this, Experiment 2 was designed to collect continuous, time-resolved pedestrian data. An area of 150 m2 was selected from the N-S area in Experiment 1 at a location with a high pedestrian volume on the main street, making it more representative. Then, a fixed camera was used for recording.
The experiment was conducted five times between July 2019 and January 2020, capturing two groups of people. The first group comprised individuals who stayed for more than 10 s. Their stay duration was recorded, and their gender and age were estimated based on their appearance [21]. Due to winter clothing, only the outermost layer was visible during the cold season; so detailed clothing analysis was excluded [20]. Approximately 7500 samples were collected in total. The second group comprised all individuals who appeared within the observation range, with their total number representing the total pedestrian volume. The total count was calculated every 10 min, resulting in a dataset of approximately 75,000 samples. Although this study did not separately analyze demographic variables such as age or gender, these observations were recorded for reference. A more detailed examination of demographic influences on outdoor thermal behavior is planned for future work.

2.2.3. Thermal Environment Measurement

To ensure consistent weather conditions, only clear and sunny days were selected for thermal environment measurements during the behavioral observation periods. As shown in Figure 1, in Experiment 1, the blue circles indicate the measurement points, and in Experiment 2, a measurement point is placed near the observation area. Tair (air temperature), RH (relative humidity) and Tg (black globe temperature) were recorded using a BES02 temperature and humidity data logger, which was suspended in a naturally ventilated high-reflectivity aluminium box (Tair measurement range: −30.0 °C to 50.0 °C; accuracy: ±0.5 °C; RH measurement range: 0.0–99.0%; and accuracy: ±3.0%). Tg was collected using a sub-gloss black-painted sphere with a diameter of 0.08 m (reflectance of 0.95). Weed speed (WS) was measured using a Kestrel 5500 meteorological station (measurement range: 0.4–40.0 m/s; accuracy: ±0.1 m/s). SR was collected using a Seaward Solar Survey 200R solar radiometer (measurement range: 100–1250 W/m2, accuracy: ±5% + 5 digits). All environmental data were recorded once every minute. The average daily temperatures during the experiment closely matched the long-term seasonal averages, ensuring representativeness. Measurements covered the full thermal range typical of Harbin’s hot, transitional, and cold seasons, providing a comprehensive environmental dataset for correlating with observed behavioral patterns.

2.3. Thermal Comfort Index

Over the past century, researchers have developed various thermal comfort indices to assess human responses to the outdoor environment [58]. Amongst them, we have chosen the Universal Thermal Climate Index (UTCI), which is suitable for thermal assessment under all climates, seasons and scales and is widely used for its universality and rationality [56]. The UTCI is based on a multi-node thermophysiological model that estimates the human body’s physiological responses to the meteorological environment [59]. It simulates the environment where individuals have the same physiological response as at an equivalent ambient temperature (°C) [60]. UTCI is calculated using UTCI-A002 software, which requires input variables including Tair, RH, WS and Tmrt to obtain the corresponding UTCI. UTCI also incorporates a dynamic clothing model, which adjusts to seasonal changes. The applicability of this clothing model to Harbin’s climatic context has been validated in the author’s previous research [57]. By incorporating environmental parameters, physiological responses, and adaptive clothing behavior, the UTCI provides a comprehensive and robust measure of outdoor thermal comfort, allowing us to link meteorological conditions with observed crowd behavior and pedestrian thermal perception.

2.4. Multicollinearity Assessment

To ensure the reliability of regression analyses and to detect potential multicollinearity among predictor variables, Variance Inflation Factor (VIF) was calculated for all independent variables. VIF quantifies how much the variance of an estimated regression coefficient increases due to collinearity with other predictors, and is computed as:
V I F i = 1 1 R i 2
where R i 2 is the coefficient of determination obtained by regressing the i-th predictor on all other predictors. Variables with high VIF values were either removed or carefully interpreted to avoid misleading regression results.

3. Results

3.1. Relationship Between Attendance and Thermal Comfort

3.1.1. Crowd Distribution in Sunlight and Shade

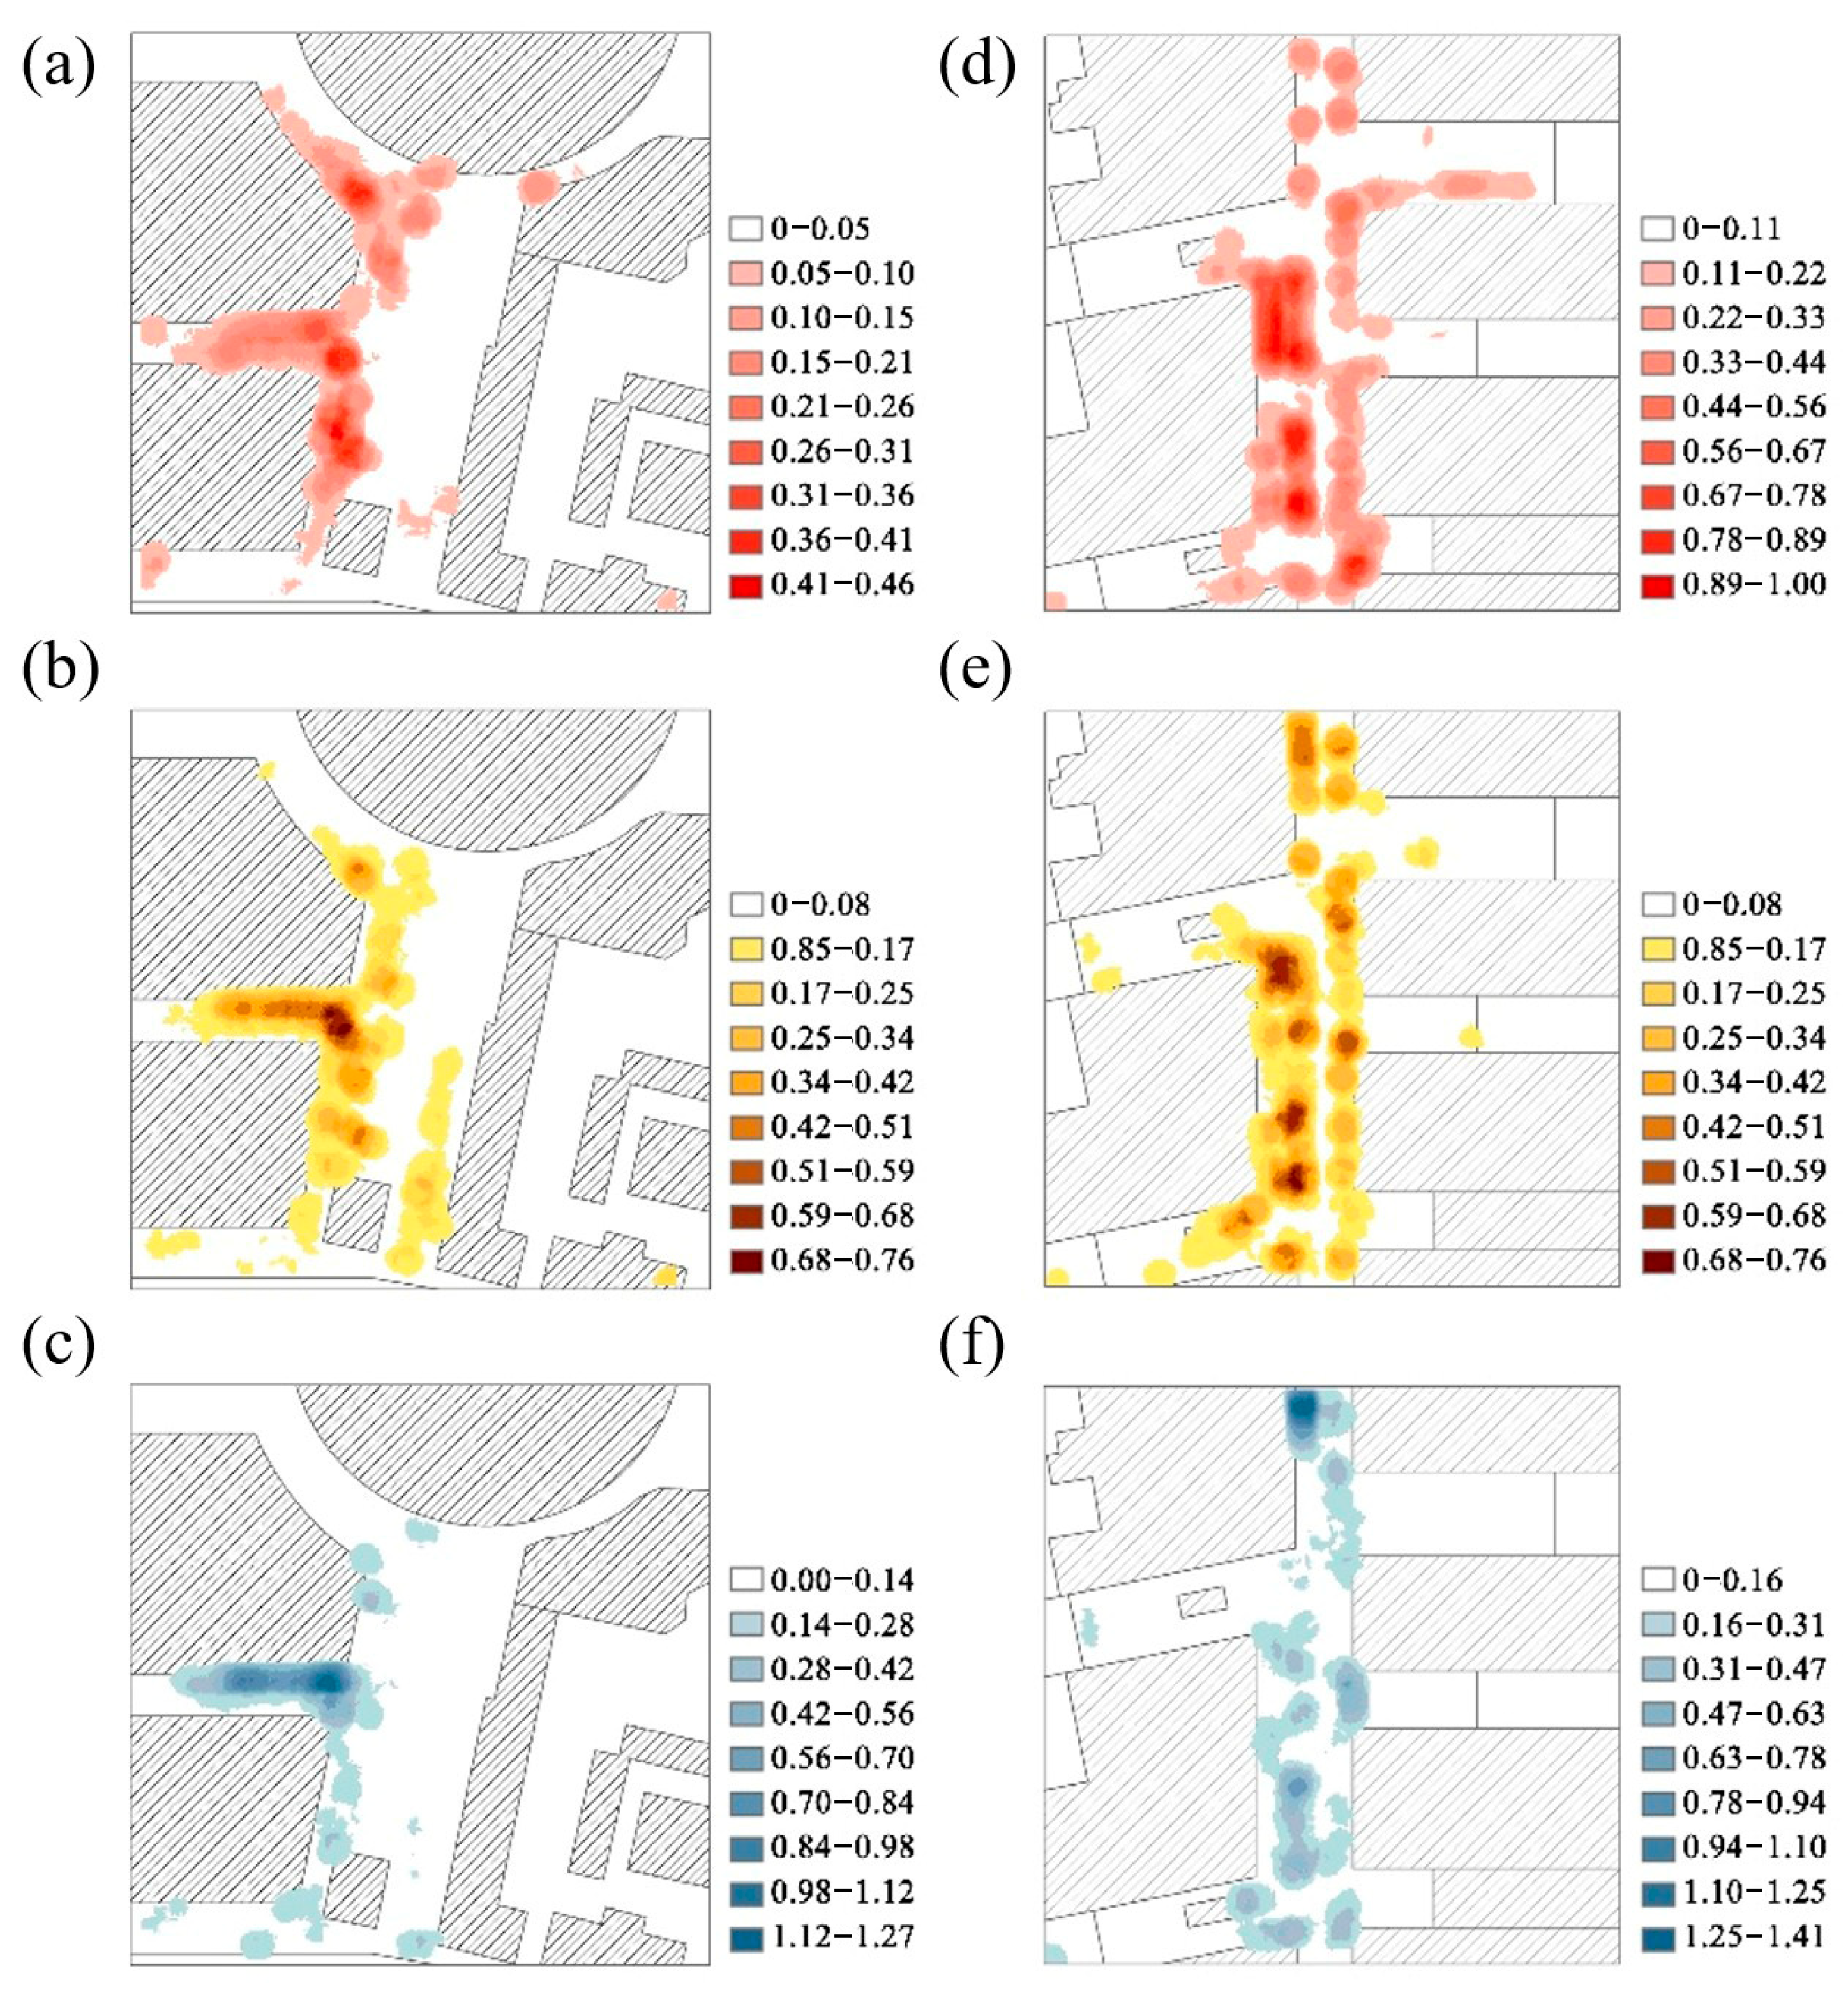
To analyse the spatial distribution of the crowd, ArcGIS 10.7 software was employed to mark the precise location of each individual within the study area. These georeferenced points were then processed to generate a point density map, which visually represents variations in crowd concentration across the site. As illustrated in Figure 2, the analysis revealed that the crowd did not disperse evenly throughout the area; instead, individuals tended to cluster in certain high-activity zones. These high-density areas were predominantly concentrated around key functional nodes, including sales booths, building entrances, the designated taxi boarding area, and dining booths. Such locations are likely to attract more people due to their provision of goods, services, or shelter, as well as their role as natural congregation points. The observed spatial patterns offer valuable insights for event layout design, crowd management strategies, and identifying potential bottlenecks or safety risks.
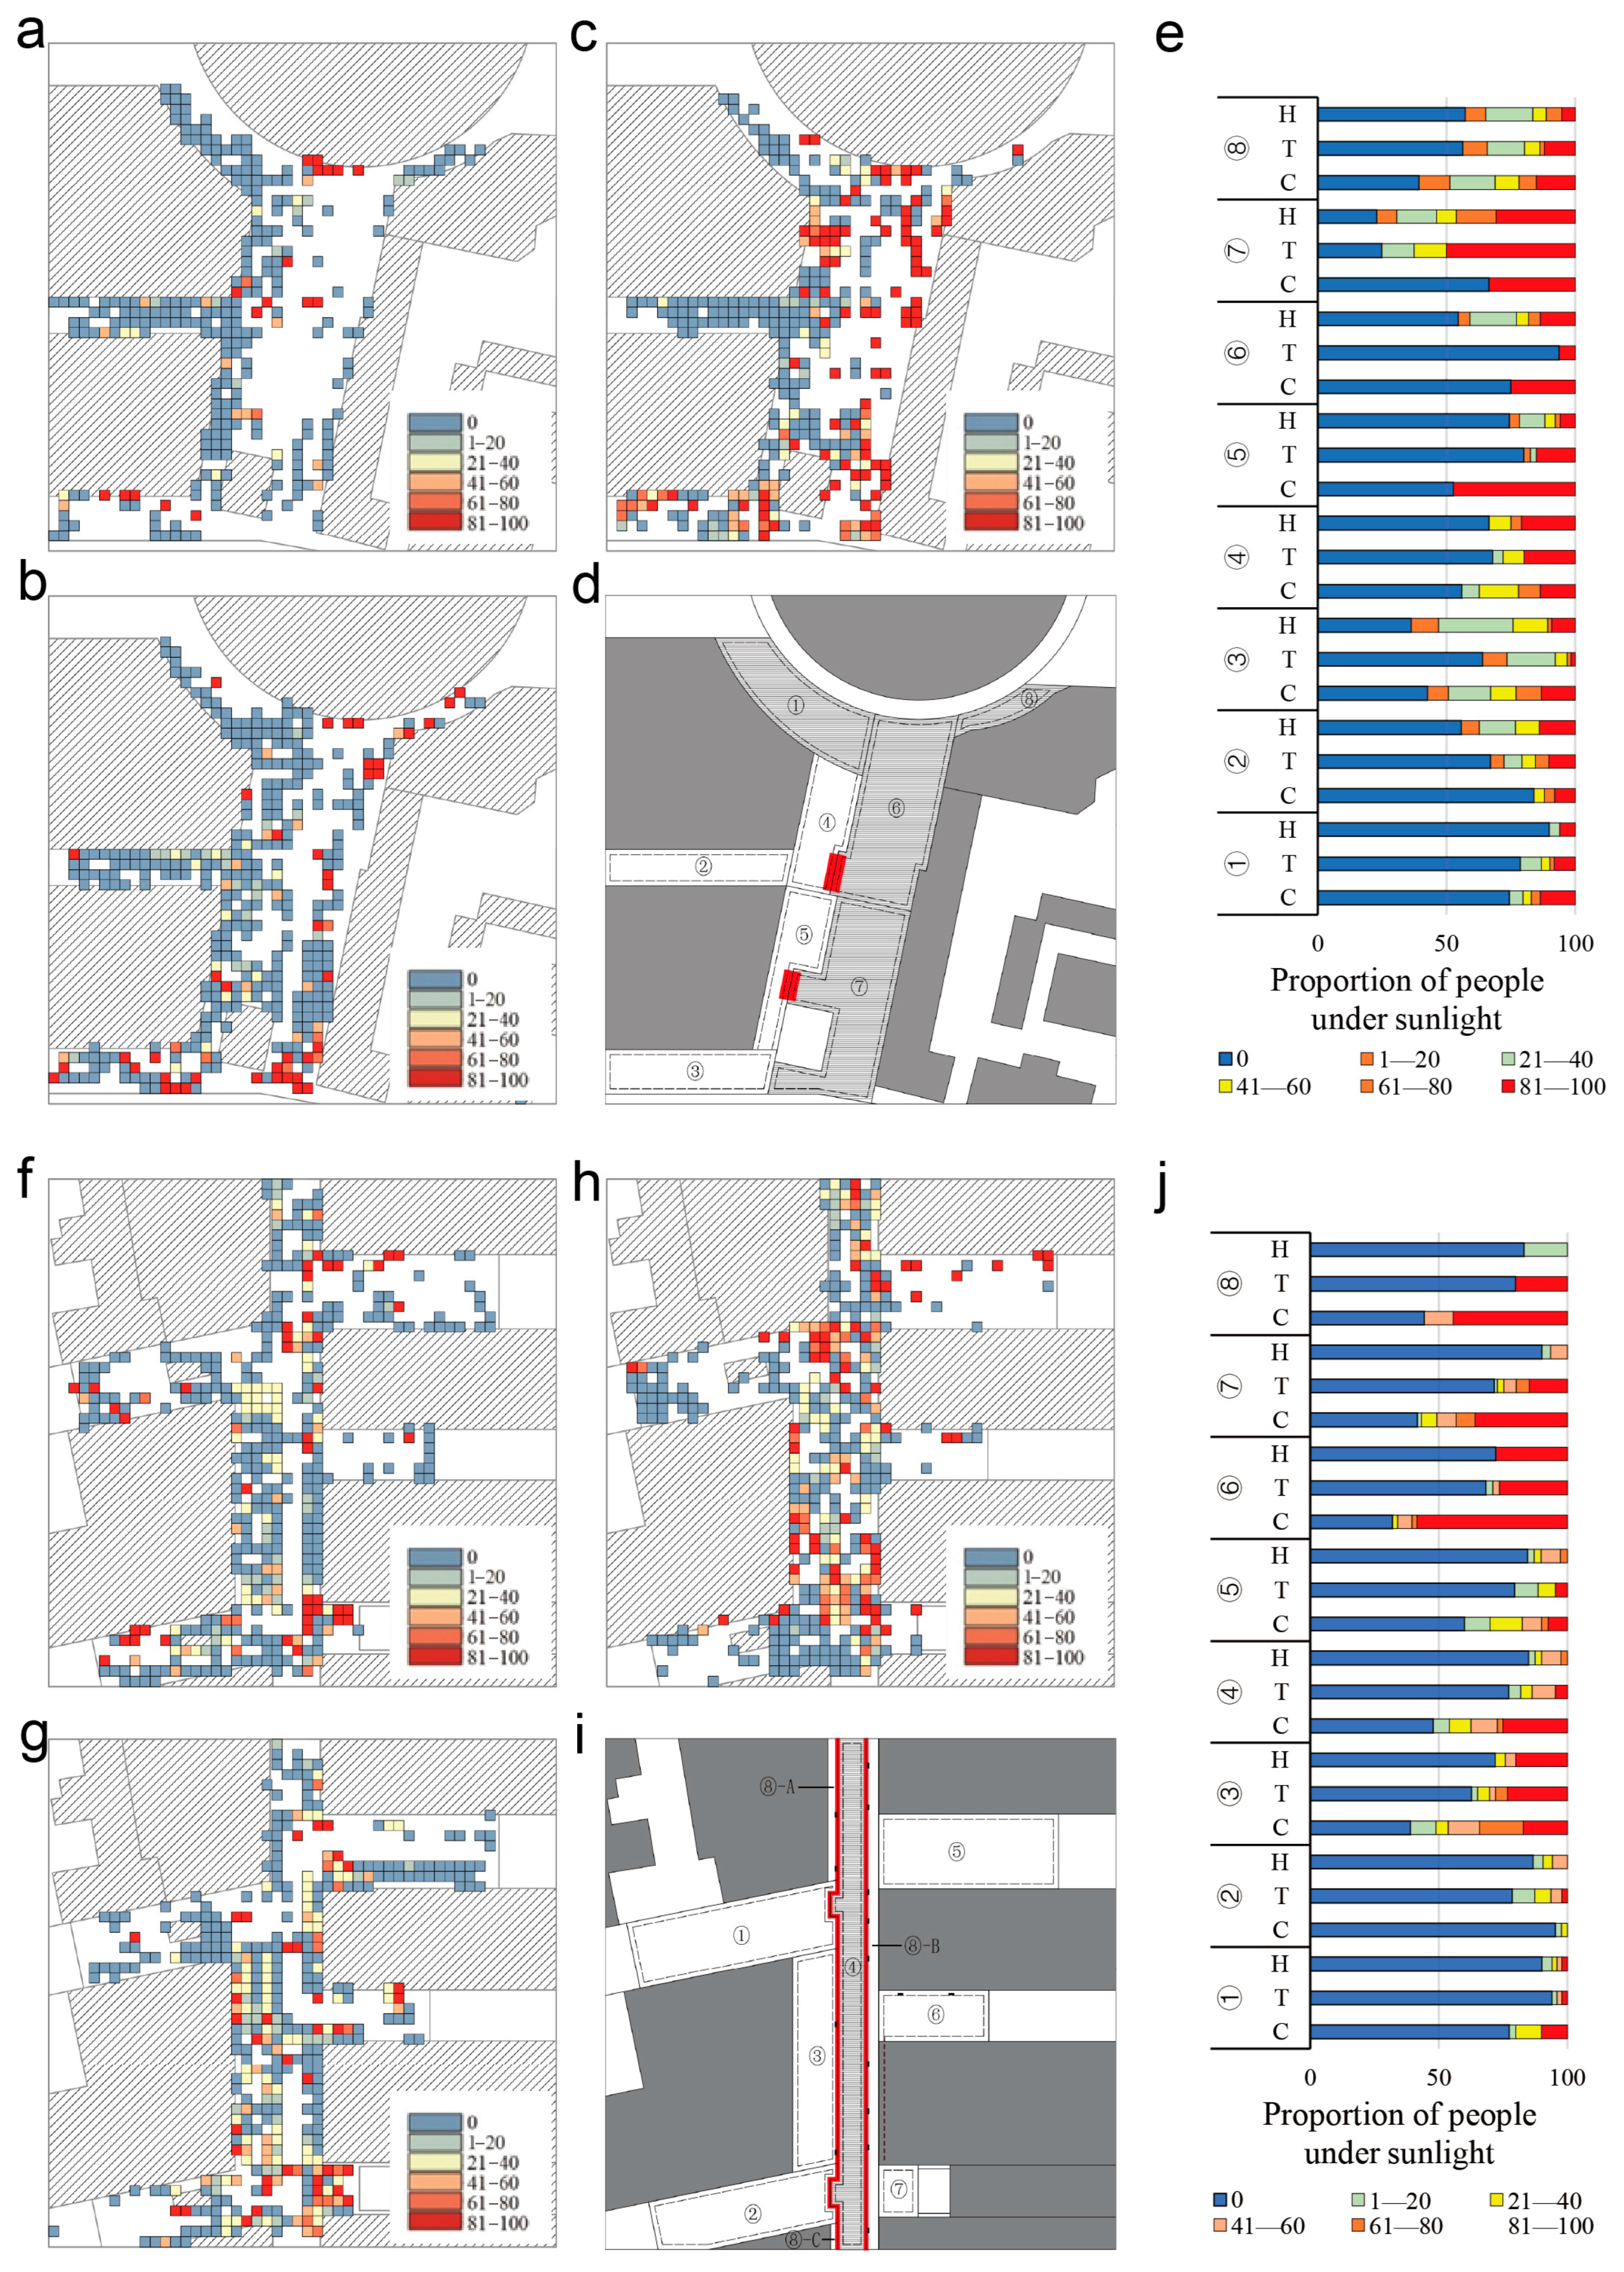
Crowds were observed to gather at similar locations across different seasons, suggesting that non-climatic factors play a significant role in influencing gathering behaviours. However, crowd distribution still showed a seasonal relationship with sunlight and shade. To investigate this, the area was divided into multiple 4 m × 4 m grids, followed by calculating the proportion of people under sunlight by the total number of people in each grid, which was calculated as the ratio N s u n / N , where N s u n is the number of people in sunlight and N is the total number of people in the grid. As shown in Figure 3a,b, the number of grids with a high N s u n / N value increased sharply from the hot season to the cold season, indicating that more people sought out sunny areas in colder weather. However, in some locations of the area, N s u n / N does not follow a consistent seasonal pattern. Preliminary observation and analysis suggest three possible reasons:
(1)
Sunlight exposure is insufficient—Certain locations in the area remain in shadow for most of the day. In the cold season, approximately 2/3 of the area experiences a shadow ratio of more than 80% for most of the day. In these areas, little seasonal difference is observed in Nsun/N.
(2)
Certain shaded areas are primarily provided by trees. In the areas where trees cast shadows, there are gaps in the shadows where sunlight shines through. As a result, the seasonal change in Nsun/N is less distinct. For example, in the N-S range, no significant difference is observed in Nsun/N amongst most grids across different seasons. In contrast, in the B-S range, which is shaded mainly by buildings the Nsun/N ratio of most areas gradually decreases from the cold season to the hot season because the N-S range mainly provides tree shade and the B-S range mainly provides architectural shadows.
(3)
The crowd is attracted by commercial activities. For example, some streets in certain directions or locations are almost always in the shade; however, due to the attraction of commercial activities, crowds will gather even in uncomfortable environments. In such cases, the influence of sunlight exposure on crowd distribution is overridden, making it difficult to establish a direct relationship.
In summary, the main reason for the lack of seasonal variation in N s u n / N in certain areas is the imbalanced ratio of sunlight and shaded coverage. Specifically, areas that receive either consistently insufficient sunlight or are constantly exposed, offering little variation across seasons. This imbalance limits the ability to observe meaningful behavioural shifts in response to microclimatic changes. Therefore, in the subsequent quantitative analysis, we will exclude areas and time slots with extreme or imbalanced sunlight-to-shading ratios to ensure a more accurate understanding of people’s responses to sunlight and shade.
The area was first divided based on the orientations and locations of the streets, followed by a secondary division based on the positions of the curbstones and steps. The division process and results are shown in Table 1 and Figure 3. In the centre of Figure 3d,i, the area filled with horizontal lines is the area below the steps and inside the curb, and the red colour represents the location of the steps and curbs.
After dividing the regions, as shown in Figure 3 (On the right side of the Figure, marked as III. C, T, and H represent cold season, transitional season and hot season, respectively), it becomes evident that most areas exhibit seasonal variations in the proportion of people under sunlight ( N s u n / N ). However, in some areas, N s u n / N does not follow a regular pattern with seasonal changes. According to the above analysis, the main reason is the uneven proportion of sunlight and shaded areas. Therefore, when analysing the relationship between UTCI and N s u n / N , we choose areas where the proportion of sunlight and shade is balanced throughout the day (between 20% and 80%) and exclude time slots where the proportion of shade in each area is above 95%.
Then, we analyse the relationship between N s u n / N and UTCI. As shown in Figure 4, N s u n / N decreases as UTCI increases. When the UTCI ranges from 0 °C to 9 °C, N s u n / N approaches 50%. According to the modified UTCI for Harbin, this range is categorised as “slight cold stress” [47]. This suggests that under mildly cold conditions, approximately half of the individuals prefer shaded areas rather than seeking sunlight. Such behaviour implies that people in severe cold regions may have a higher tolerance for relatively low temperatures, thereby showing reduced sensitivity to solar radiation under cold conditions.

3.1.2. Thermal Comfort and Attendance Patterns Across Seasons on Central Avenue

Using the Experiment 2 dataset, we conducted a study on attendance, analysing how attendance varies with the Universal Thermal Climate Index (UTCI). Attendance and UTCI were sampled at 10 min intervals, then grouped based on UTCI values every 1 °C or 2 °C. To eliminate the influence of early-morning circadian rhythm, we excluded the time slot (9:00–11:00) where the attendance considerably decreased.
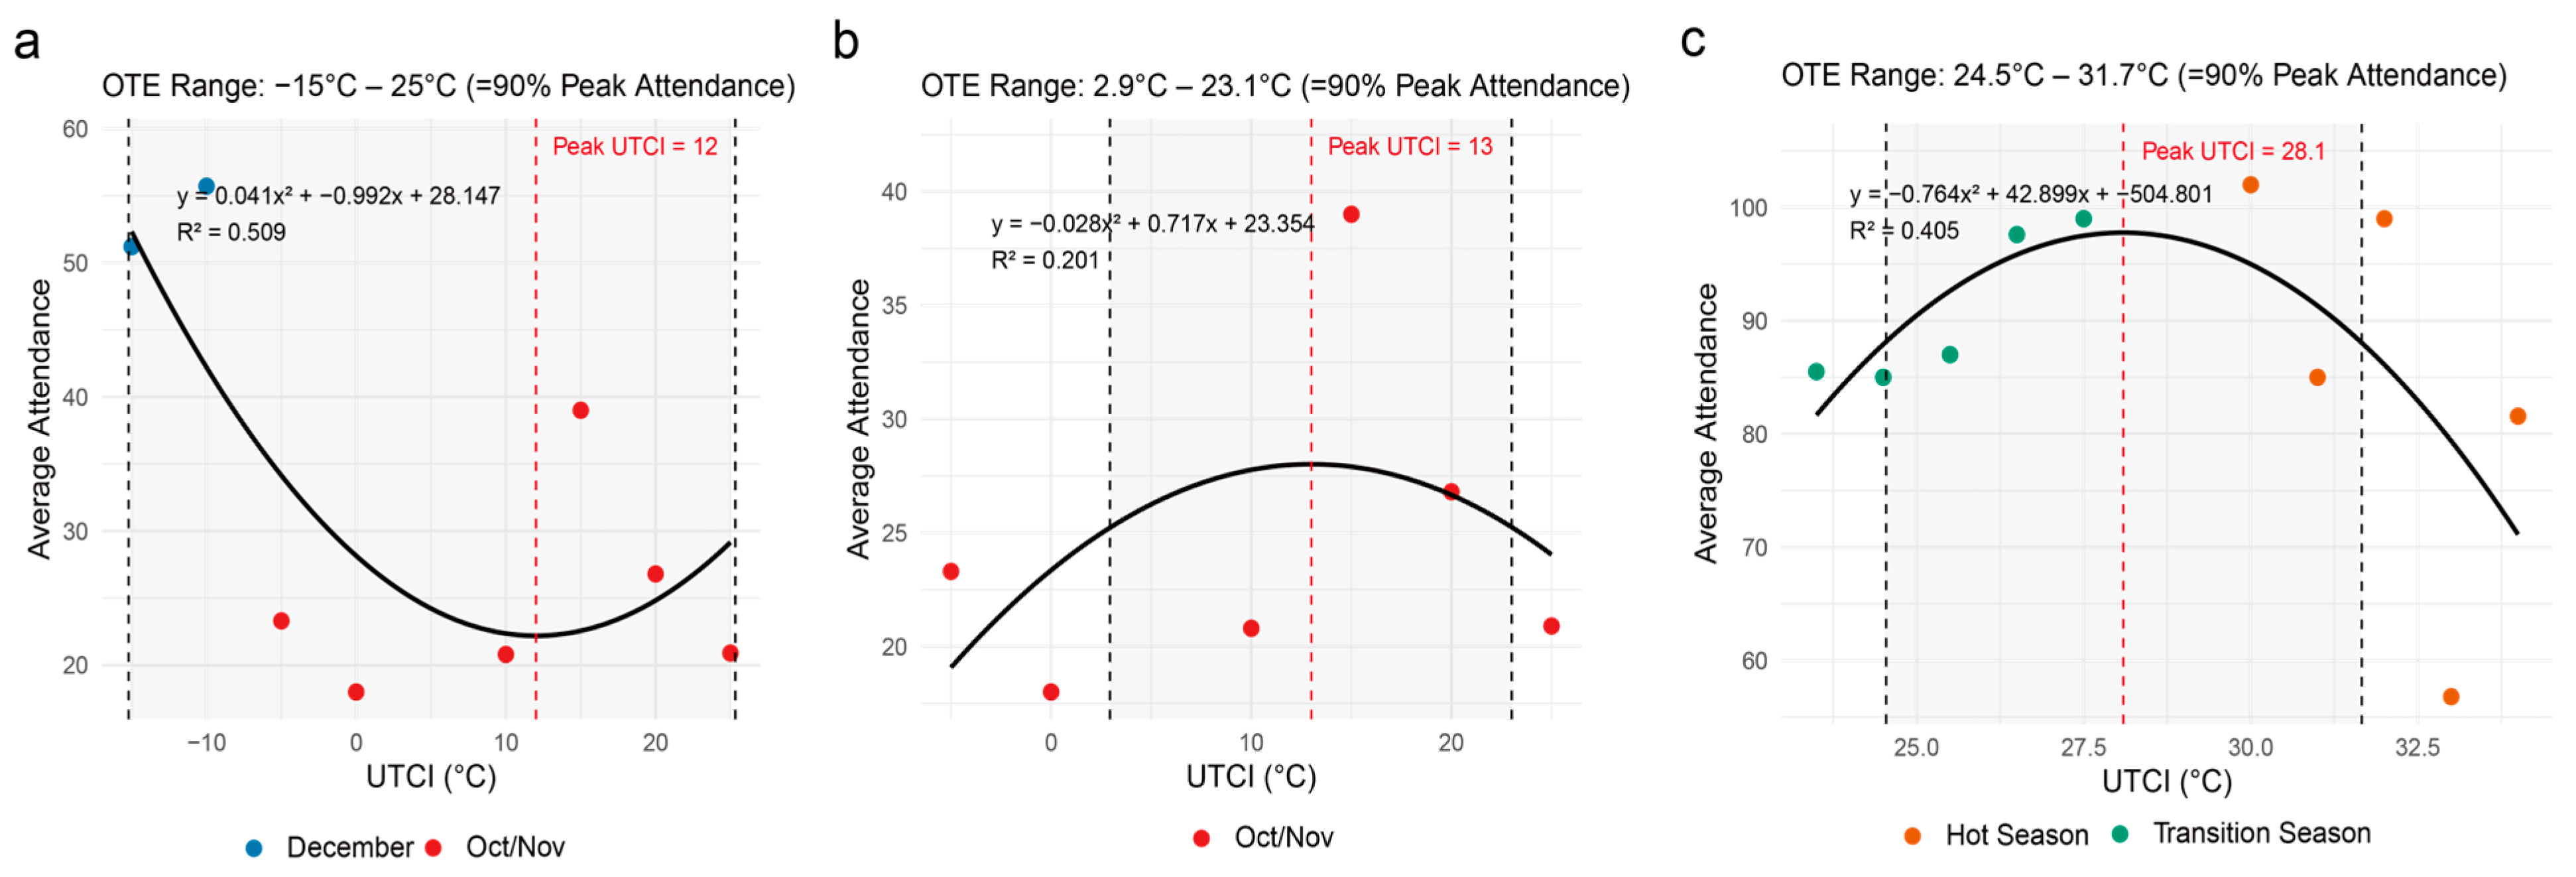
During the cold season, when UTCI is above −10 °C, the attendance is considerably lower than warmer seasons. However, when UTCI is below −10 °C, the attendance considerably increases because Harbin’s winter tourism peaks, reducing the influence of thermal comfort on street use (Figure 5a). Visitors linger despite the severe cold. Across all seasons, the crowd’s composition is stable: females outnumber males (approximately 60% to 40%), respectively. The highest proportion of attendance of approximately 55% is in the 18–39 age group, followed by 40–69 age group (approximately 30%). This indicates that Central Avenue attracts more females and younger individuals. Using all available data points, the optimal thermal environment (OTE) defined as the UTCI range where attendance remains at least 90% of its maximum, was found to span from −15 °C to 25 °C. This unusually wide tolerance range indicates that visitors to Central Avenue are generally resilient to both cold and moderately warm conditions. Peak attendance occurred at UTCI = 12 °C, suggesting a preference for mild–cool thermal conditions. Such tolerance may be explained by local climatic adaptation to Harbin’s long, cold winters, as well as the strong attractiveness of seasonal events, which can offset the negative impact of less favourable weather on attendance. When focusing specifically on the October–November period, the OTE narrowed to 2.9–23.1 °C, with peak attendance at UTCI = 13 °C. Compared to the all-season result, this narrower range reflects reduced cold tolerance outside the winter tourism peak, when extremely low temperatures are less common and visitors are less motivated to endure harsh conditions. The peak in mid-cool conditions is consistent across both analyses, reinforcing the finding that attendance is maximised in moderately cool weather, which encourages longer stays and greater participation in outdoor activities.
In the hot season, attendance declines as the UTCI rises, whereas in the transitional season it increases. When the two seasons are combined, the relationship is best described by a quadratic curve that peaks at 29 °C (Figure 5c). We define the optimal thermal environment (OTE) as the UTCI range within which attendance is at least 90% of this peak— representing the thermal conditions acceptable to 90% of the population as ASHRAE standards. This was a thermal environment range conducive to outdoor activities [25]. The resulting OTE for Central Avenue is 24.5–31.7 °C UTCI, a band that previous work identifies as moderate heat stress for Harbin [47].
In general, attendance studies focus on individuals who remain in a specific location for a specified period, excluding passersby. This is because the decision to visit a location is often made in advance, based on personal judgment about environmental conditions. In extreme situations, such as during a rainstorm, when there is no place to take shelter in parks and squares, people will choose not to arrive at these places. Therefore, there is little research on the total pedestrian volume in parks and squares. In contrast, pedestrian streets, such as Central Avenue, are lined with shops that offer shelter and attract foot traffic. When the rain makes the outdoor environment uncomfortable, people on the street will quickly disappear, and they will promptly reappear after the rain stops. For example, on Central Avenue, we observed that during the transition from heavy rain (14:35) to light rain (14:50) and then to no rain (15:10), the number of people in the observation area rose from 3 to 22, and then to 45. This example illustrates that total pedestrian volume on commercial streets is highly sensitive to short-term environmental fluctuations, such as sudden changes in weather.
A regression analysis was conducted to examine the relationship between total pedestrian volume and the UTCI. The results show distinct seasonal patterns. During the transitional season, pedestrian volume increases with rising UTCI, as warmer temperatures enhance outdoor comfort. In contrast, during the hot season, pedestrian volume decreases with a higher UTCI, likely due to thermal discomfort caused by excessive heat. In cold season, an inverse relationship is also observed: pedestrian volume declines as the UTCI rises, consistent with the pattern noted for attendance during this season. This is likely due to Harbin’s winter tourism effect, where more people venture outdoors despite colder conditions. Upon conducting a year-round analysis of the data, as shown in Figure 6, it is observed that when UTCI is above 15 °C, the relationship between total pedestrian volume and UTCI follows a quadratic trend, with the peak volume occurring at 26 °C. During the transitional season, pedestrian volume increases as the UTCI rises, as warmer temperatures enhance outdoor comfort and encourage longer outdoor stays. In contrast, during the hot season, pedestrian volume decreases as the UTCI rises, primarily due to thermal discomfort from excessive heat, which aligns with studies on heat stress and its effect on outdoor activities. Interestingly, during the cold season, pedestrian volume decreases as UTCI rises, which contrasts with the typical trend seen in warmer seasons. This can be attributed to Harbin’s winter tourism effect, where people are more likely to venture outdoors to engage in winter tourism activities despite the cold temperatures. Moreover, when UTCI exceeds 15 °C, a quadratic relationship emerges between total pedestrian volume and UTCI, with peak pedestrian volume occurring at 26 °C. This suggests the presence of an optimal thermal comfort zone, where conditions are neither excessively hot nor cold, leading to the highest levels of pedestrian activity.

3.1.3. Stay Duration

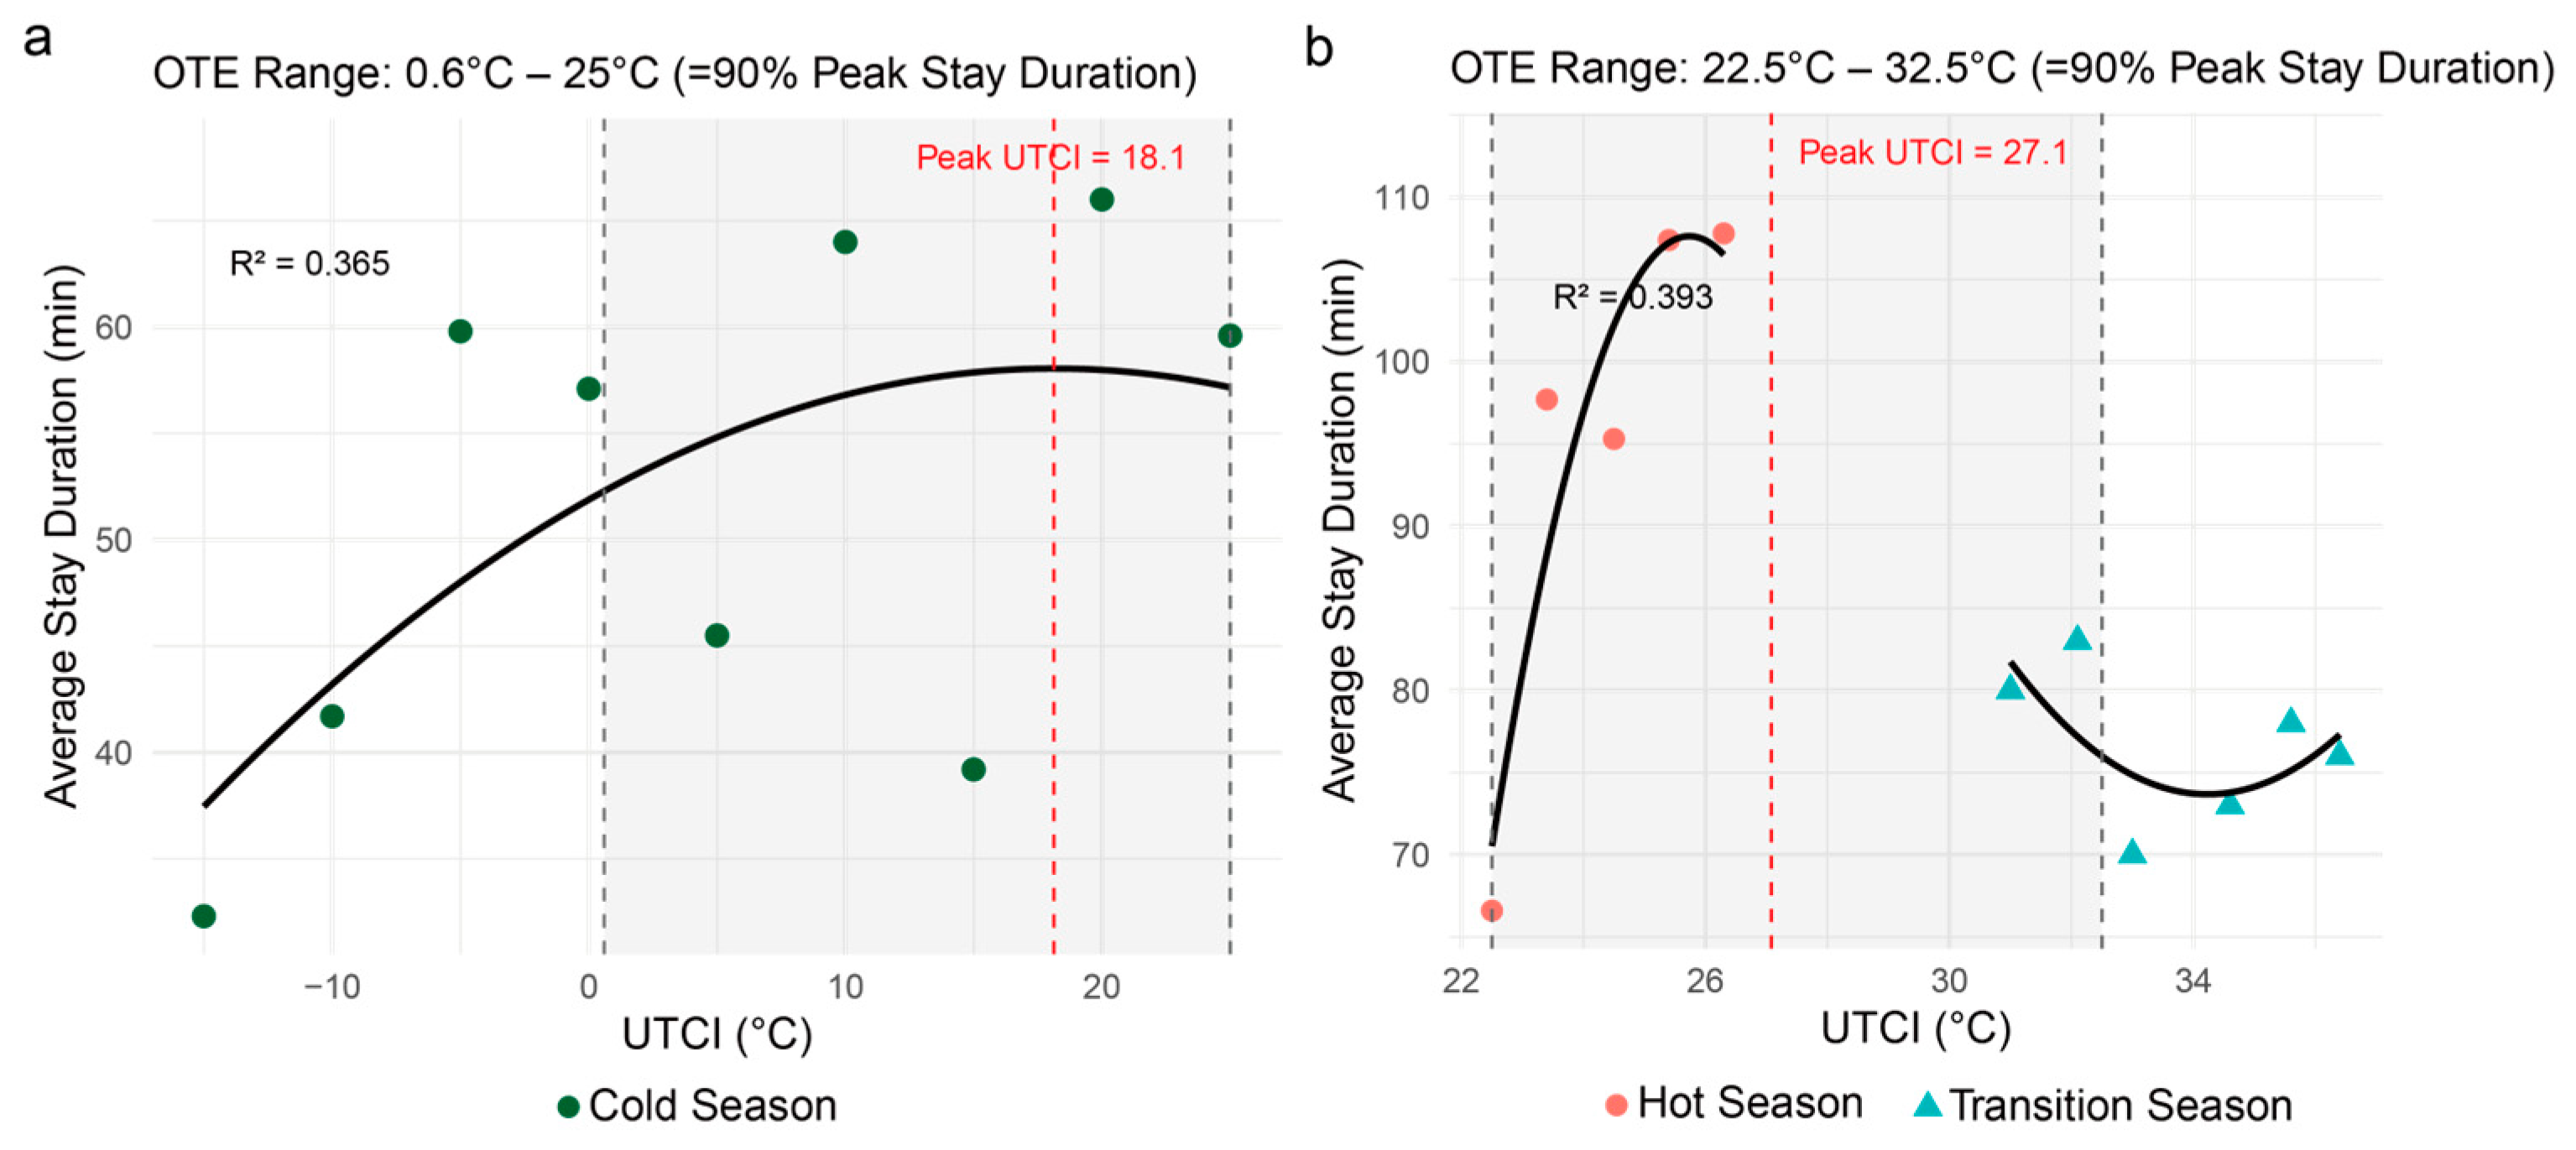
Before analysing stay duration, it was necessary to account for the influence of daily rhythms. Due to typical activity patterns, stay durations are generally shorter in the morning (9:00–10:00) and during lunchtime (12:00–13:00); therefore, these periods were excluded from the analysis. As shown in Figure 7, seasonal differences are observed in the relationship between UTCI and stay duration. During the hot season, stay duration decreases as the UTCI rises to a certain point, after which it stabilizes once UTCI exceeds 33 °C. This pattern suggests that extreme heat initially reduces outdoor activity time, but once the temperature reaches a discomfortable threshold, the impact on stay duration levels off, possibly reflecting behavioral adaptation or physiological tolerance to heat. In contrast, during the transitional and cold seasons, stay duration increases as UTCI rises, indicating that milder temperatures in these seasons encourage people to stay outdoors for longer periods. Overall, stay duration is longest when UTCI is 26 °C, which occurs during the transitional season. This finding highlights that moderate temperatures create the most comfortable conditions for outdoor activities, leading to the longest stays.
To further explore the relationship between stay duration and thermal environmental parameters, a regression analysis was conducted. Due to collinearity between RH and Tair, RH was excluded in the regression analysis. As shown in Table 2, Tair and SR had an impact on stay duration in hot and transitional seasons. Additionally, the interaction effects of Tair, WS and SR were found to be significant in both hot and cold seasons, as shown in Table 3. This indicates that stay duration is most influenced by Tair and SR.
Further analysis was conducted to compare stay durations in sunlight versus shadow, as shown in Figure 8. During the hot and transitional seasons, people spend longer periods of time in the shade. Moreover, this phenomenon becomes more pronounced when sunlight is more abundant after 12:00. In the cold season, people tend to spend slightly more time in sunlight during the morning hours, likely seeking warmth. However, after 13:00, the sun altitude angle is low and there are few areas under the sun in the site, which are in the shadow. As a result, the stay duration in shaded areas increases during the afternoon.
Compare the stay durations of individuals of different genders and ages. There is no significant difference in stay duration between males and females (Mann–Whitney U test, p > 0.05). Across all age groups, stay duration decreases as temperatures drop during the transition to the cold season. However, the decline is more pronounced among individuals aged 0–18, suggesting that younger individuals are more sensitive to colder conditions. Despite this observation, a correlation analysis revealed no significant relationship between stay duration and age (p > 0.05).

3.2. Relationship Between Activity State and Thermal Comfort

3.2.1. Activity Intensity

Most people who stay on the street were observed either enjoying the scenery or chatting. Other common behaviours include taking photos and engaging in conversations. The intensity of physical activity varied across different activity states. Herein, the caloric cost of specific physical activity (PA) was estimated by multiplying Metabolic Equivalent of Task (MET) with weight according to the ‘Compendium of Physical Activities’ [61]. Compiled by Barbara Ainsworth and colleagues, the Compendium provides a standardized classification of energy expenditure for various activities and has been widely adopted since its initial publication in the journal Medicine and Science in Sports & Exercise in 1993, with updates in 2000 and 2011. This study uses the 2011 edition.
However, incorporating body weight may introduce bias into the results. It is possible to compute a PA score that is independent of body weight by dividing the kilocalories expended by body weight. It also is easy to compute MET-minute (MET-min) scores that are independent of body weight by multiplying the activity MET value by the duration of the activity in hours or minutes, respectively [61]. This method is applicable to calculate the overall score based on MET levels and the time spent.
According to the ‘Compendium of Physical Activities’ the observed street activities were mapped to their corresponding MET values, and crowd distributions by activity type were analysed for each season, as shown in Table 4.
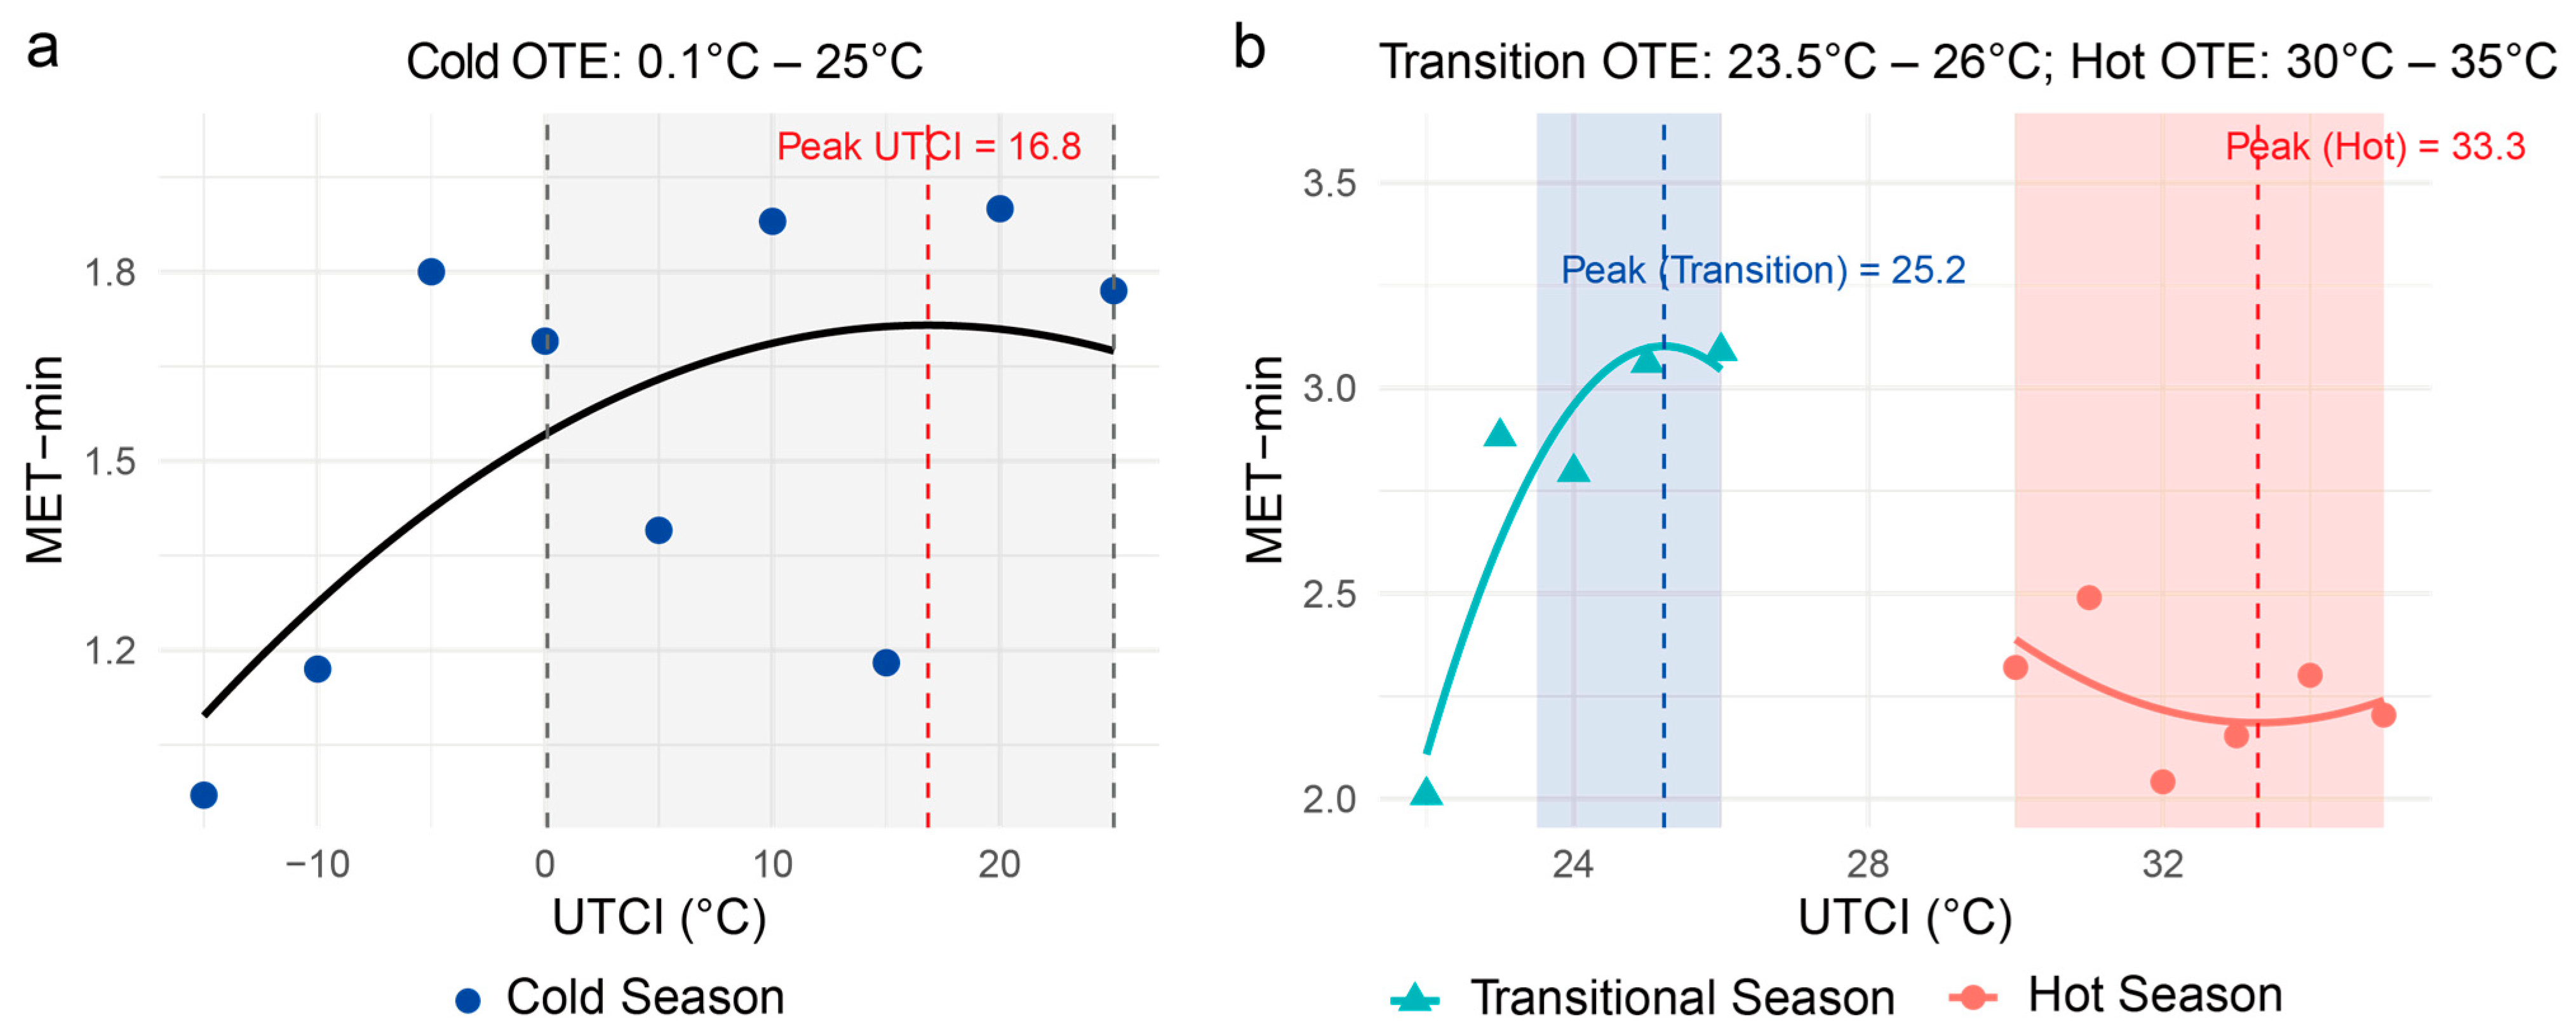
Based on the activity intensity calculated using the method described above, a regression analysis was conducted between UTCI and MET-min values. The average MET-min for every 1 °C of UTCI was calculated, as shown in Figure 9. During the hot and transitional seasons, MET-min exhibits a quadratic function relationship with UTCI, with the maximum occurring around a UTCI of 25.2 °C in the transition season and 33.3 °C in the hot season. In the cold season, MET-min consistently remains lower than that in the hot and transitional seasons.

3.2.2. Walking Speed

In Experiment 2, walking speed was randomly measured, with a sample size of over 60 individuals per hour. To minimize the influence of external variables, measurements were taken only in the rectangular box in the middle of the road (Select a 10 × 10.8 m square within the curb) [62]. The data collection process followed these steps:
(1)
The time taken for a pedestrian to enter and exit the rectangular frame was recorded. Walking speed was then calculated by dividing the length of the rectangular frame by the recorded time.
(2)
The video was rewound to the moment the pedestrian was in the middle of the frame. The total number of people within the frame was counted and divided by the area to calculate pedestrian density.
(3)
Information such as the age and gender of the observed pedestrian was also recorded.
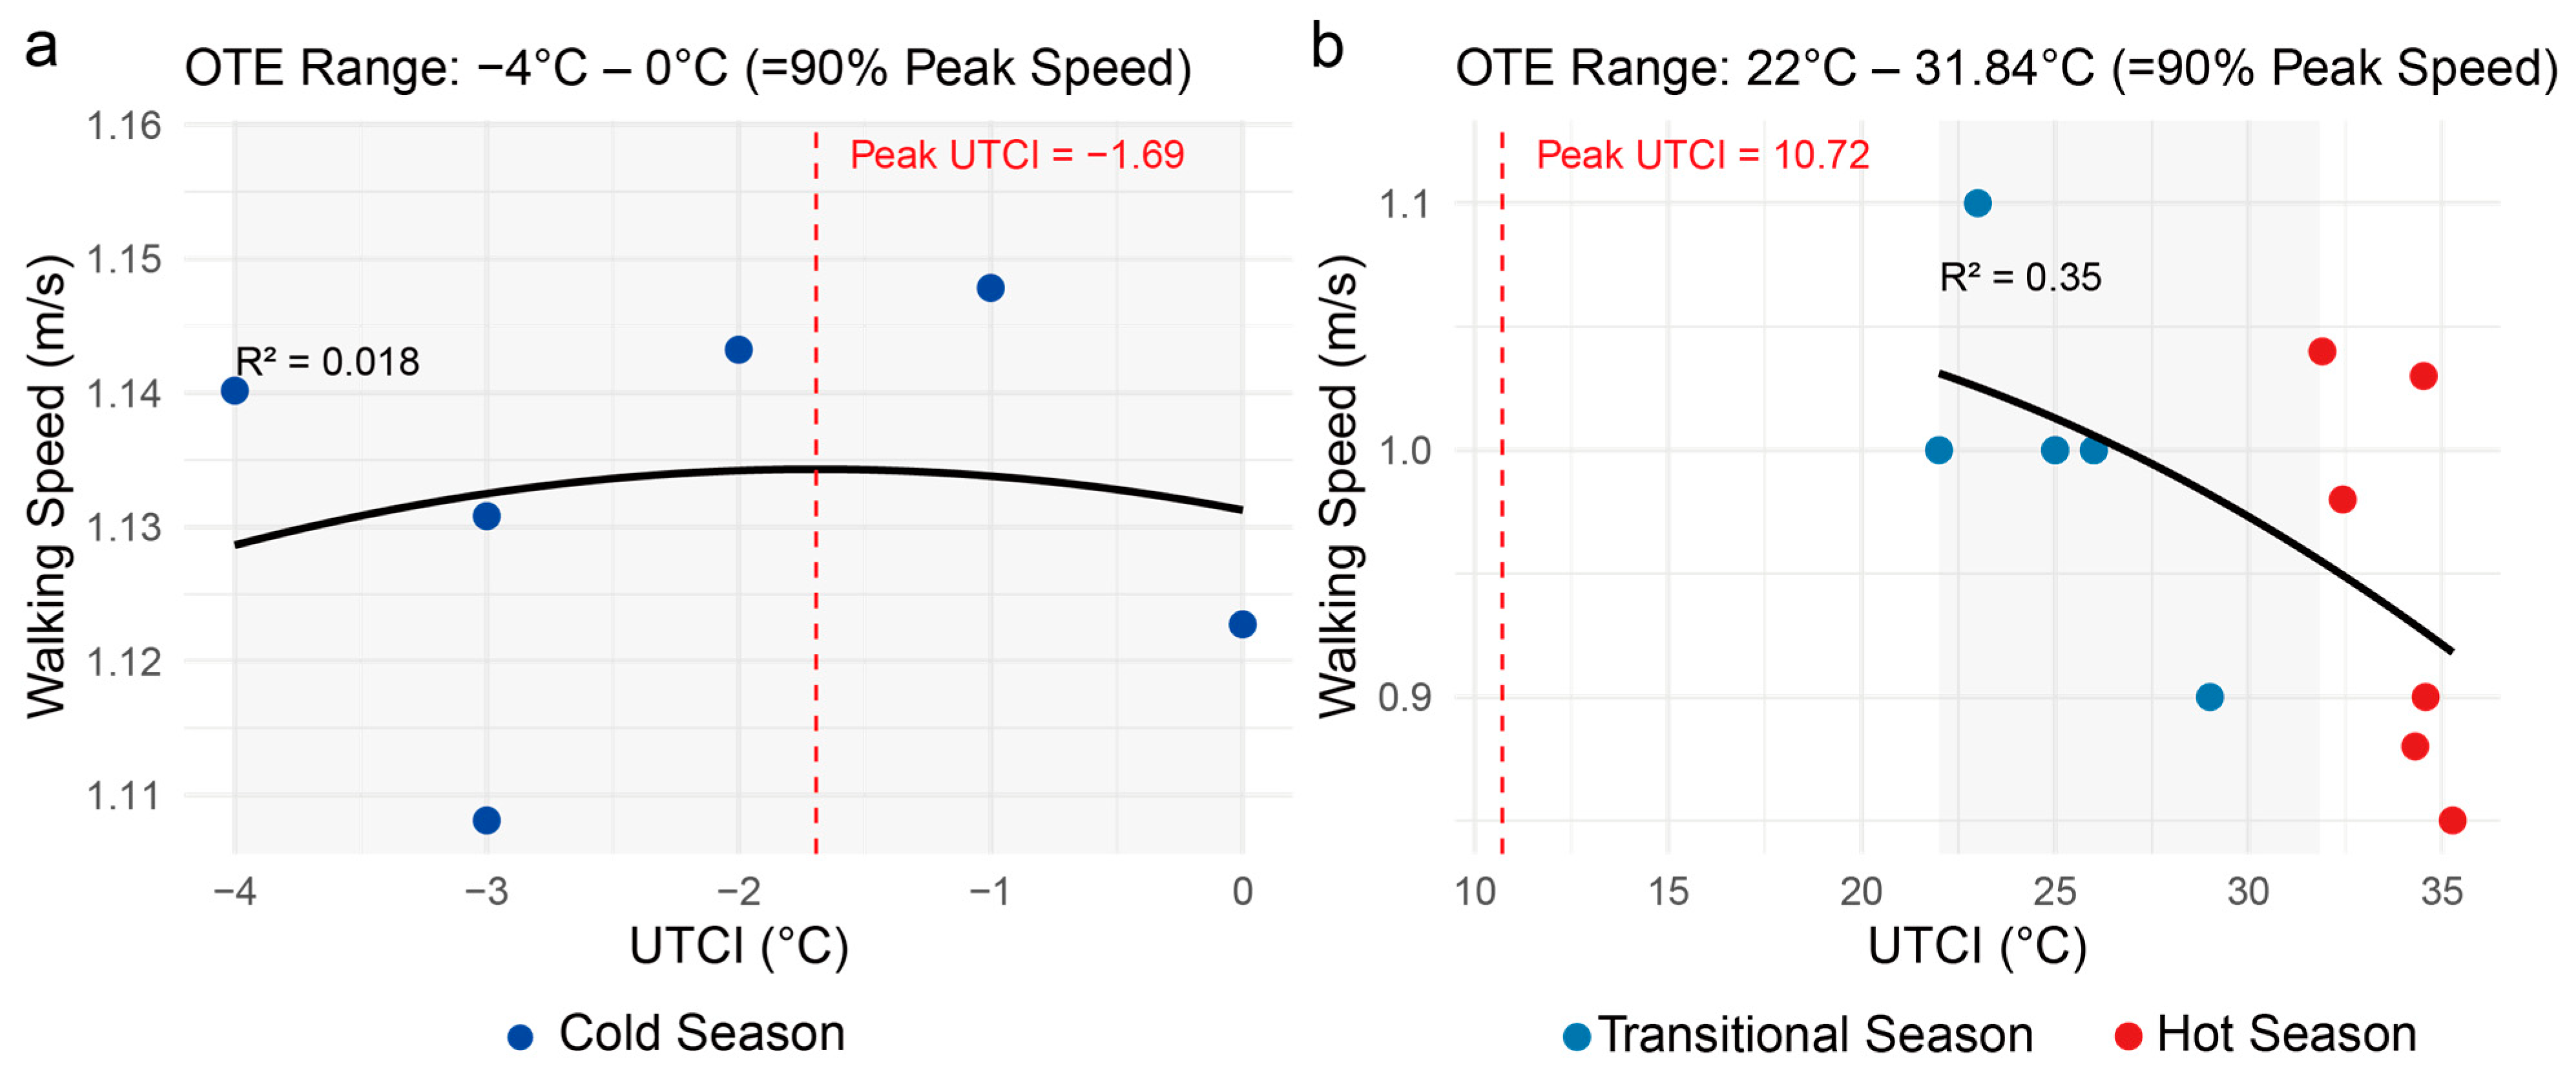
To analyse whether other variables have an impact on pedestrian walking speed, a Kruskal–Wallis test was conducted. The results show that across most seasons, males, individuals aged 20–40, and those walking alone tend to walk at a faster pace. Furthermore, during the transitional season, when pedestrian density was highest (average 0.11 people/m2), walking speed showed a negative correlation with pedestrian density. To reduce the influence of these factors, the average walking speed per hour was used in the analysis. Upon calculating the sample, it was found that the mean values of influencing factors such as gender and age are similar for each hour. The relationship between walking speed and UTCI was then analysed (Figure 10). From a year-round perspective, walking speed generally decreases as UTCI increases, with this inverse relationship being most pronounced.

3.2.3. Seating Behaviour

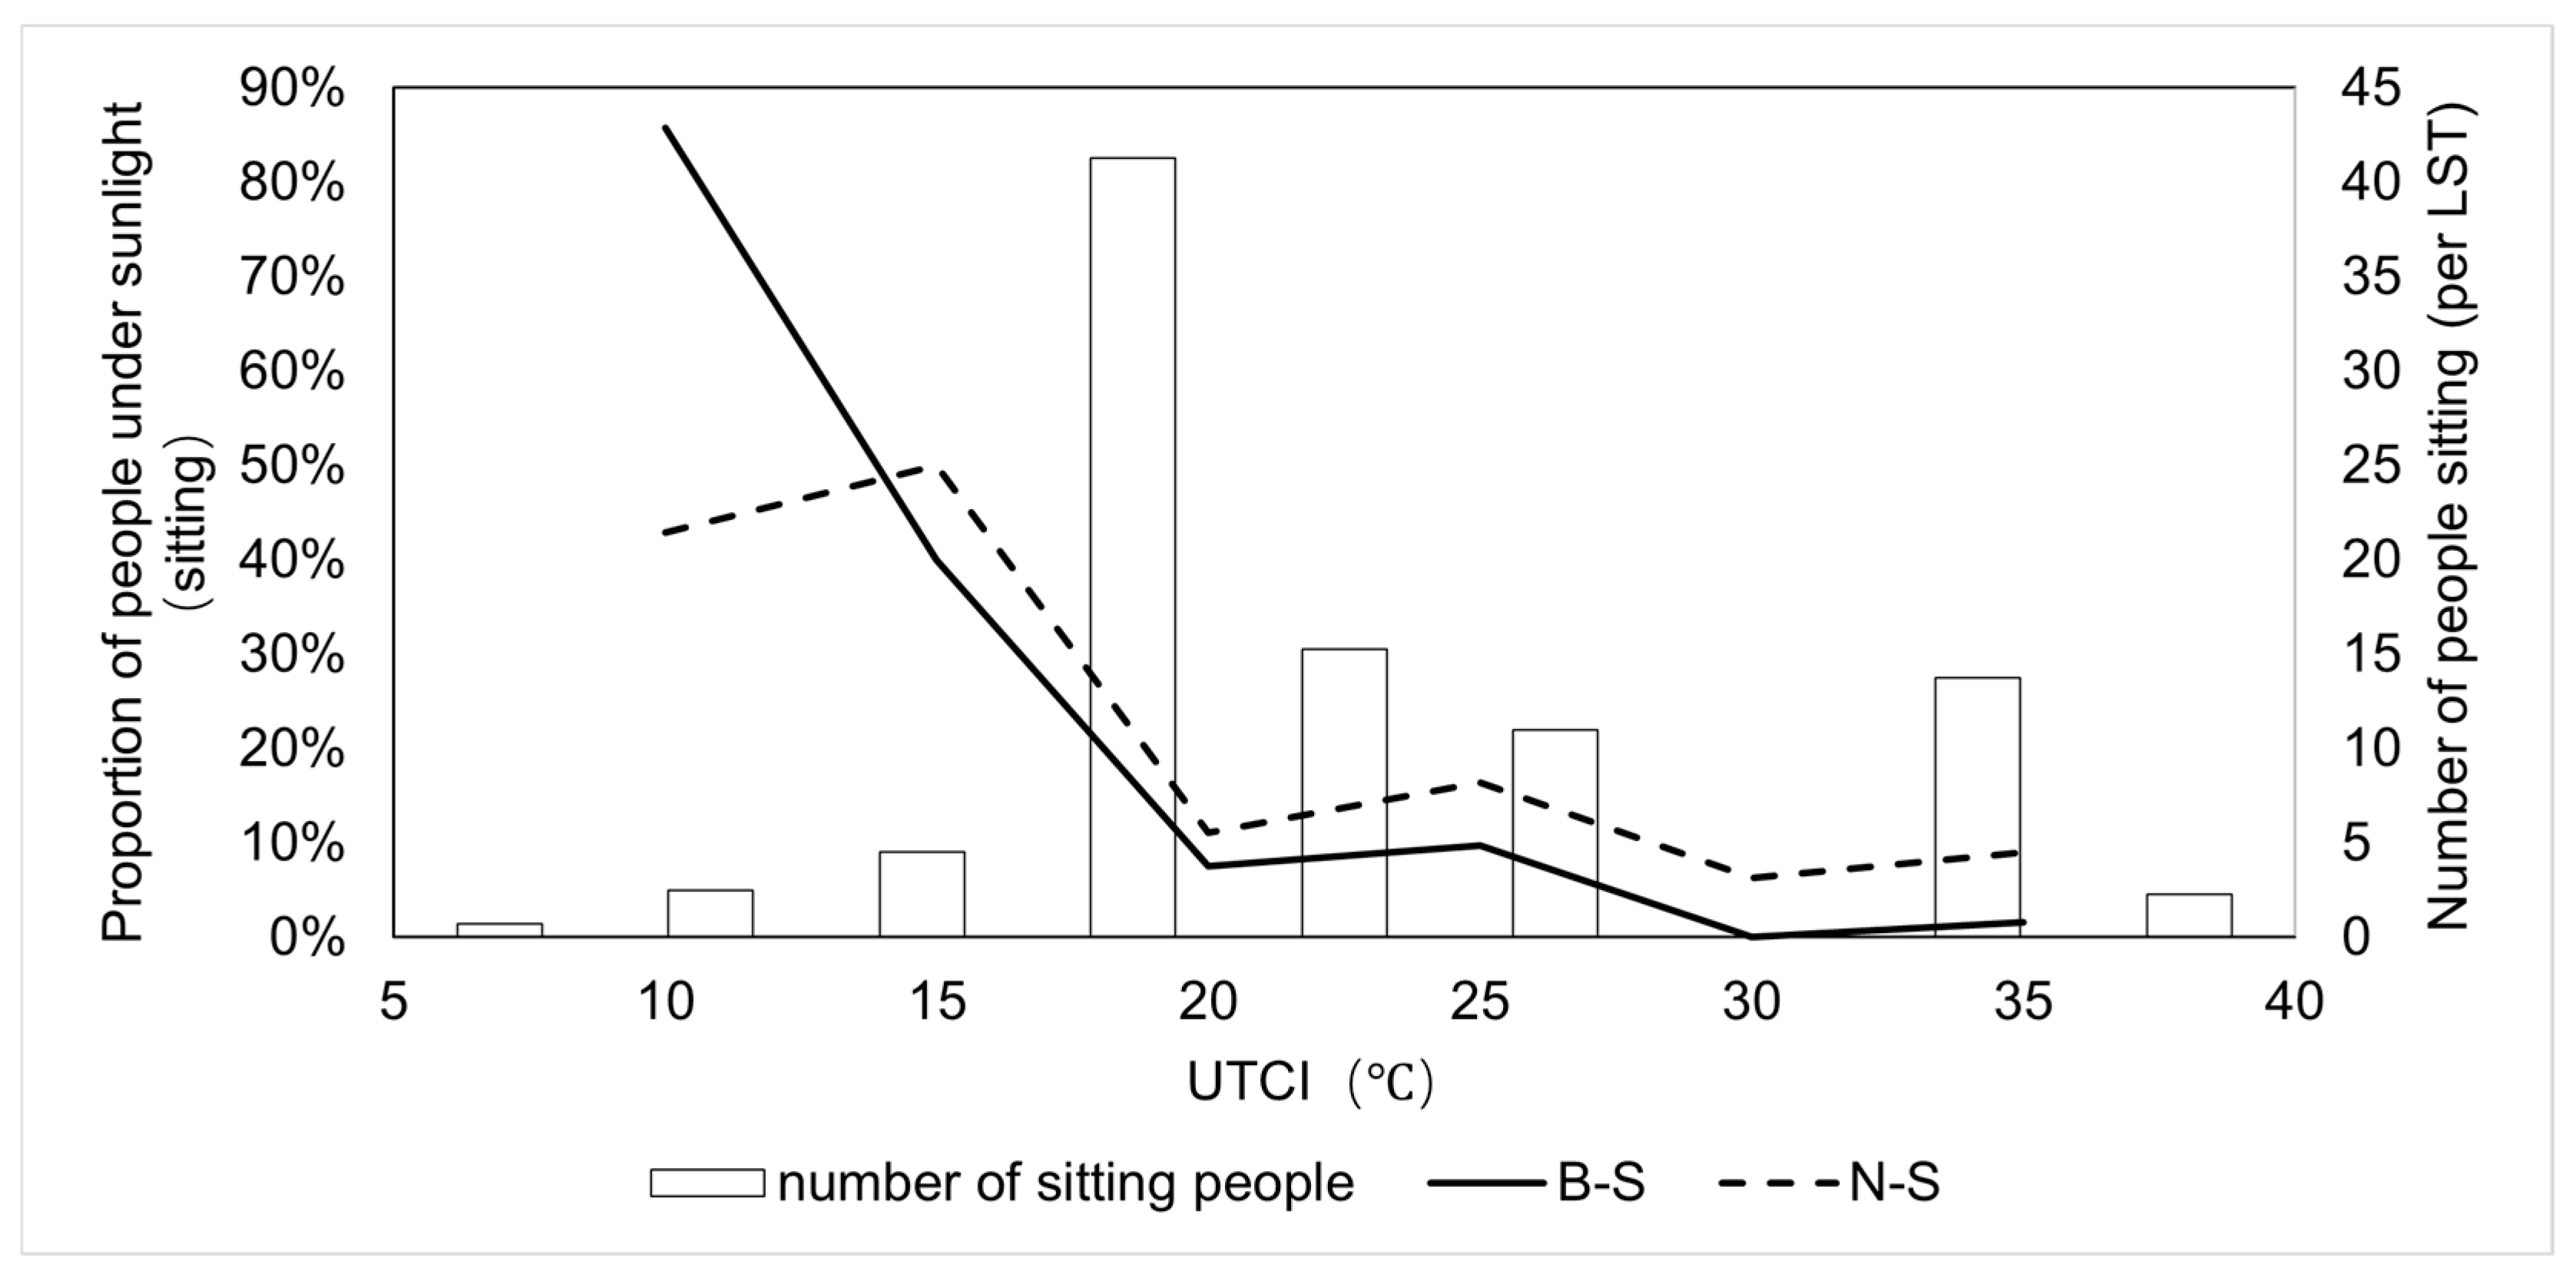
Seating behaviour is analysed under two scenarios: with seats and without seats. First, research is conducted on the N-S range (where seats are present). Through observation, it was found out that the number of people sitting reaches the highest level during the transitional season and decreases during the cold and hot seasons, with a more significant decrease observed during the cold season. As shown in Figure 11, when UTCI falls below 10 °C, the hourly average number of people sitting is less than 1.
Figure 11 also illustrates the relationship between UTCI and the proportion of people sitting under sunlight to the total number of people sitting. When UTCI is 15 °C, approximately 50% of seated people are exposed to sunlight; when UTCI increases to 30 °C, this proportion falls below 10%. Comparing the seated and standing populations (Figure 11 and Figure 4), it was found that as UTCI increases, the proportion of people sitting in the sun decreases faster than the proportion of people standing in the sun. This suggests that seated individuals are more sensitive to thermal discomfort and prefer shaded areas under hot conditions. In the B-S range, where formal seating is absent, people tend to be seated on the windowsill and flower beds. Here, the decline in the proportion of people sitting in the sun with rising UTCI is even more pronounced than in the N-S range. As shown in Figure 11, when UTCI is below 15 °C, the proportion of people sitting in the sun in the N-S range is 40% lower than that in the B-S range. This difference can be attributed to the greater seating convenience in the N-S range, which reduces thermal comfort demands —people in this area may be more willing to sit in slightly less comfortable thermal conditions due to the availability and comfort of designated seating.

4. Discussion

4.1. Crowd Behaviour Comparison with Other Regions

In terms of spatial distribution, studies reveal clear regional differences in people’s preferences for sun or shade depending on Tair. In subtropical and temperate regions, when Tair drops to around 15 °C, the proportion of people in sunlight ( N s u n / N ) approaches 100%, indicating a strong preference for sun exposure in cooler conditions [1,3,12]. In subtropical regions, when Tair increases to approximately 30 °C, N s u n / N approaches 0% [2,3]. However, in most temperate regions, N s u n / N never approaches 0% [1,12,14]. In addition, when N s u n / N approaches 50%, Tair is approximately 25 °C in subtropical regions [2,3]. In contrast, N s u n / N usually remains more than 50% in temperate regions [1,12,14]. This indicates that people in subtropical regions are more sensitive to sunlight. In Harbin, the influence of Tair on N s u n / N is smaller than that in subtropical regions but larger than that in other temperate regions (Figure 12). It should be noted that, in addition to air temperature, spatial distribution is also influenced by a combination of environmental and social factors, including wind speed, humidity, solar radiation, shade availability, surrounding landscape features, urban morphology, crowd density, cultural norms, social interactions, and the presence of amenities such as benches or cafés. These factors may interact with thermal conditions to determine where people choose to stand or sit, and should be considered in a comprehensive analysis of crowd distribution.
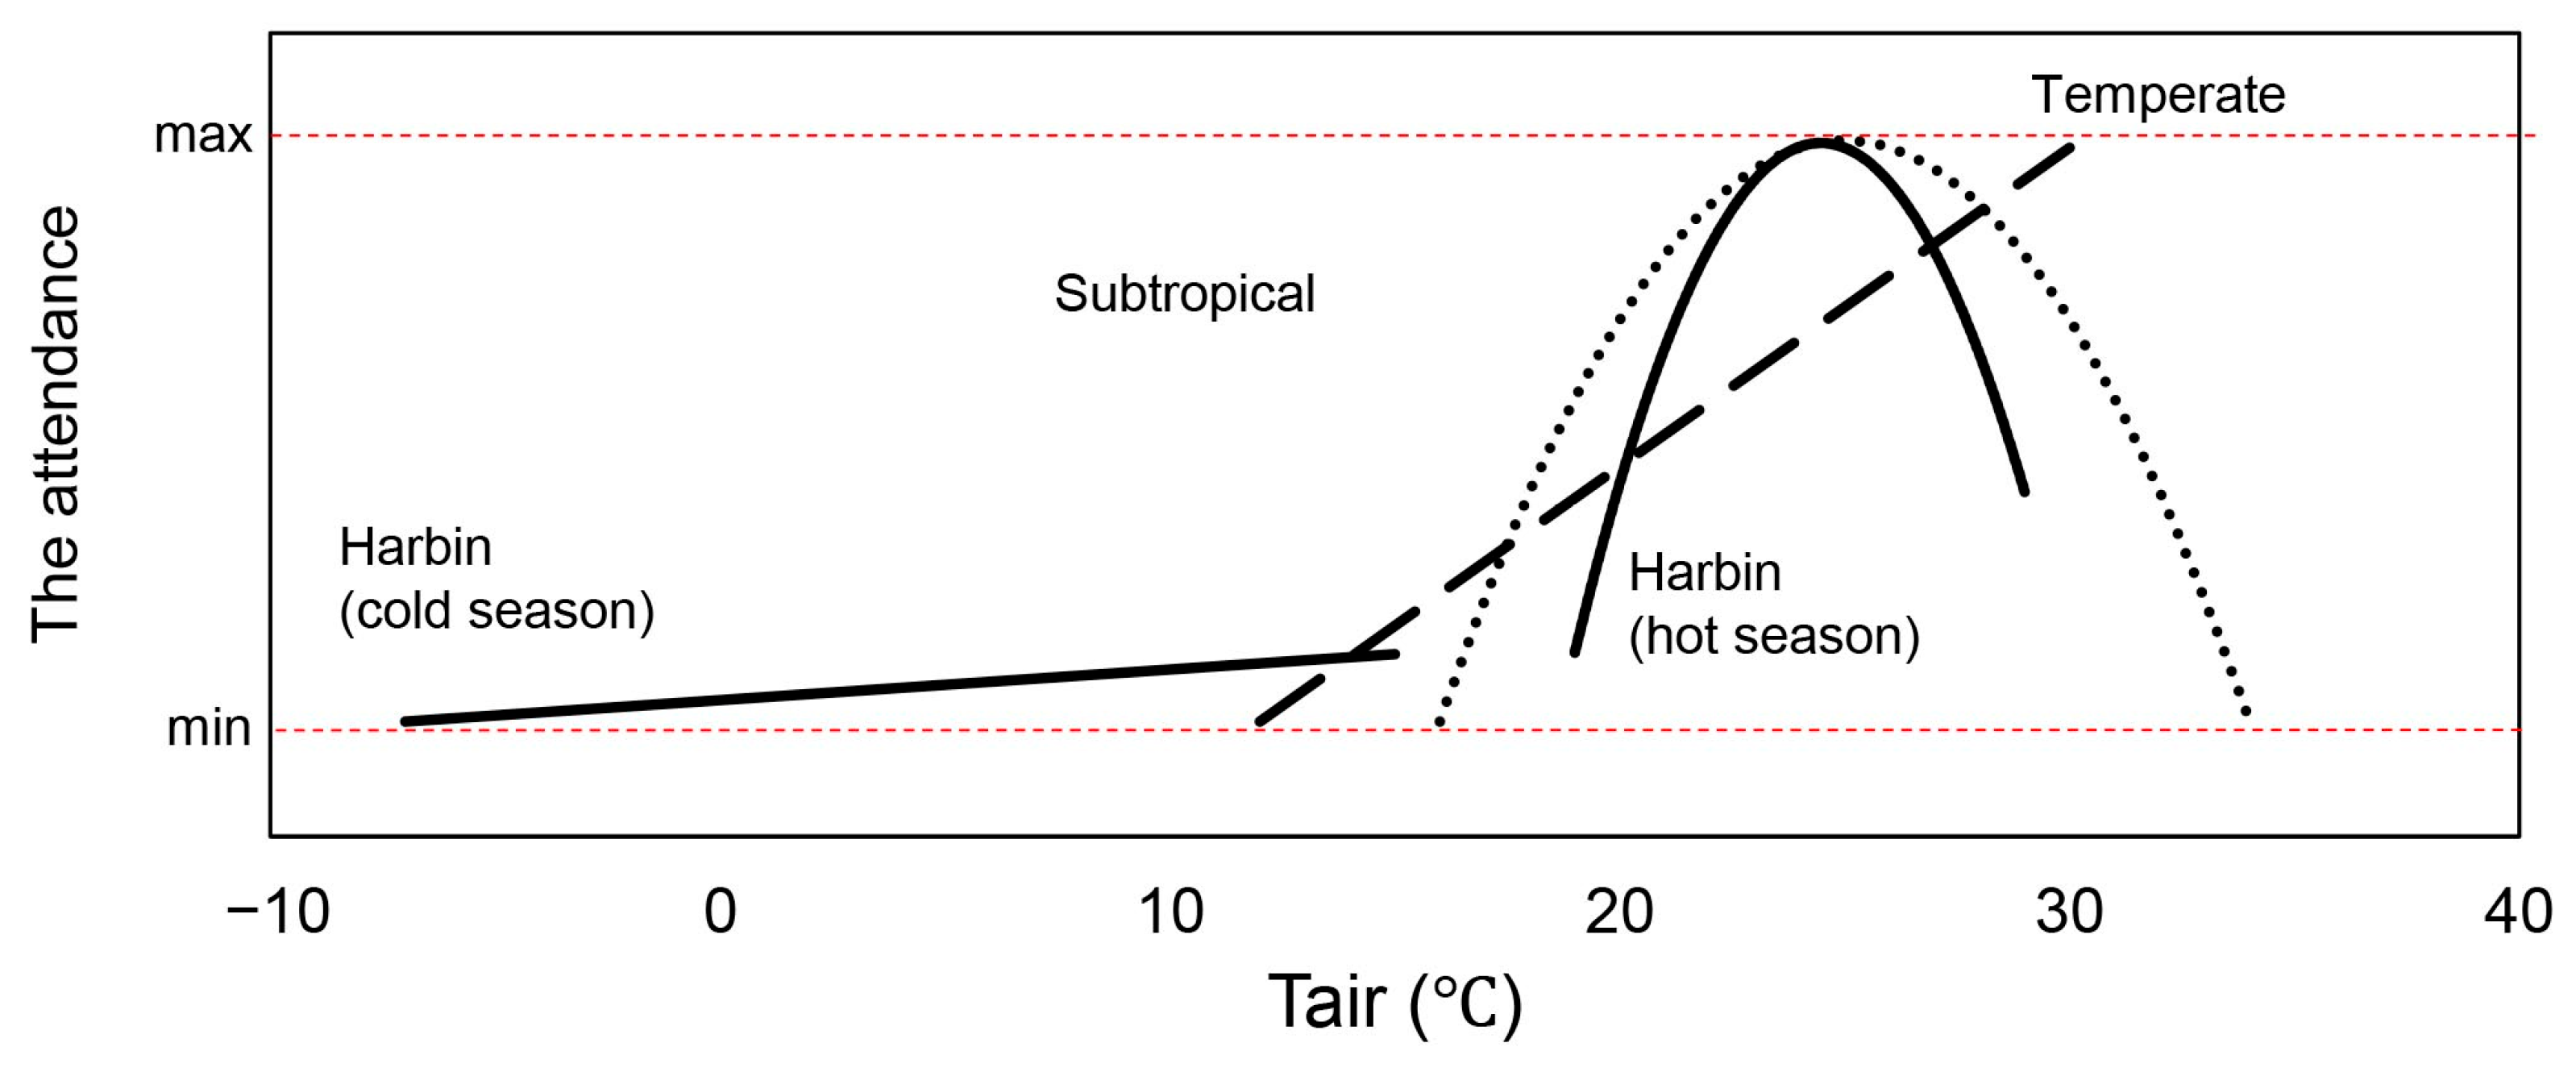
In terms of attendance, studies in temperate regions show a consistent increase in attendance as temperature rises [1,12,13,14]. In subtropical regions, attendance initially increases with increasing temperature but then decreases at a turning point [2,23,24,25]. In Harbin, attendance during the cold season is notably low, influenced by external factors such as tourism and event schedules. During the transitional and hot seasons, the research results obtained in Harbin are found to be comparable to those obtained in subtropical regions (Figure 13). This similarity is likely due to the fact that, despite being located in a temperate zone, Harbin’s peak summer temperatures are close to those of subtropical climates, leading to similar behavioural responses. Attendance is also affected by a wide range of additional factors beyond temperature. These include accessibility of the location, type and timing of events, perceived crowding, availability of recreational activities, cultural practices, socioeconomic characteristics of visitors, social group dynamics, and even psychological factors such as perceived comfort, safety, or enjoyment. Considering these variables can help explain variability in attendance across regions.
Significant differences in stay duration are observed across locations. Although in most cases stay duration initially increases and then decreases with rising temperatures, in some regions no clear correlation with temperature is evident. Nevertheless, when the thermal environment changes, similar patterns of variation in stay duration are observed across different locations. For instance, in Matsushima, Japan, a higher proportion of individuals spent more than 10 min in parks (43.4%) than those in squares (24.4%). By contrast, in the pedestrian street discussed in this study, only 1.0% of people stayed for more than 5 min. However, when the thermal environment changes, a similar pattern of crowd behaviour change is observed in stay duration in different locations. For example, as suggested in most studies mentioned in the introductory section, the length of stay first increases and then decreases with temperature rise. However, several regions exist with different patterns of variation. For instance, in San Francisco, USA, no correlation exists between stay duration and temperature [32]. Stay duration is influenced by multiple factors besides temperature, including the type and quality of available amenities (benches, shelters, food options), the attractiveness and aesthetic quality of the surroundings, noise levels, social interactions, perceived safety, crowd density, individual purposes (commuting vs. leisure), cultural habits, and personal health or mobility conditions. Incorporating these factors provides a more complete understanding of how long people remain in a given space.
Regarding walking speed, comparisons are made across different regions. According to the average values of all types of roads, the walking speed is lower in tropical regions than in temperate regions, indicating a lower walking speed in regions with higher temperatures (Table 5). In addition, Harbin experiences a large temperature range throughout the year, with the walking speed gradually decreasing from the cold season to the hot season, indicating that the walking speed decreases when the temperature increases (Section 3.2.2). However, walking speed in Harbin are still lower than those reported in other regions. First, this may be due to people walking slowly on the pedestrian street to enjoy the scenery. Second, it may also be because the locals have a higher metabolic rate to resist harsh winter, which leads them to lower their pace to lower their core temperature. Additionally, walking speed may be influenced by the composition of the crowd, which warrants further verification. Walking speed is also influenced by many additional factors, including age, gender, physical fitness, mobility limitations, walking purpose (e.g., leisure vs. commuting), social interactions (walking in groups vs. alone), crowd density, path slope, obstacles or urban design features, footwear and clothing, environmental noise, lighting conditions, and even psychological factors such as stress, mood, or time pressure. Considering these variables can help explain the variability observed in walking speed across different contexts and seasons.
In Harbin, a city located in a severe cold region, the crowd exhibits a greater adaptability to the varying thermal environments, as reflected in their behavioural responses. This adaptability is evident in several key aspects:
(1)
In hotter environments, both attendance and N s u n / N in Harbin are comparable to those in other regions with higher annual temperatures, particularly subtropical regions.
(2)
During winter, attendance and stay duration are significantly lower than in other regions; however, attendance can increase considerably due to the appeal of snow and ice landscapes, which attract both locals and tourists.
(3)
Walking speed in Harbin is lower than in other regions across all observed seasons. Based on the above analysis, this phenomenon may be attributed to the high metabolic rates of local residents, which are required to cope with extreme cold conditions.
Overall, compared to other regions, people in severe cold regions are more adaptable to the varying thermal environments. This is because they are very experienced in coping with various conditions and environments, which makes them more accustomed to both hot and cold environments. It is important to highlight that crowd behaviour is influenced by a complex interplay of thermal, environmental, social, cultural, infrastructural, and individual factors. For a comprehensive understanding, variables such as crowd density, group behavior, cultural practices, perceived safety, accessibility, landscape design, amenities, individual characteristics, and psychological states should all be considered alongside thermal conditions. It should be noted that the high adaptability of people in severe cold regions is only compared to other regions, and there is still a persistent impact of the thermal environment on crowd behaviour across seasons.

4.2. Method of Measuring Thermal Comfort Using Crowd Behaviour

4.2.1. Usage Rate Model—Based on Attendance

According to previous analysis, thermal comfort is one of the factors that affect the use of outdoor space. Lai et al. established a linear utilisation model (Formula 2) based on the relationship between attendance and thermal sensation (TSV) [63]. In this model, there is a maximum usage rate that decreases linearly with an increase or decrease in TSV.
u s a g e   r a t e = N N m a x = f T S V ; μ , α c , α h 1 α c ( T S V + μ ) ,   T S V < μ 1 ,     T S V   =   μ 1 α h ( T S V μ ) ,   T S V > μ
where N represents the actual attendance (10 min), Nmax represents the maximum attendance (10 min), αc represents the usage reduction rate (cooling), αh represents the usage reduction rate (warming), TSV represents the thermal sensation vote and μ represents the TSV value when the maximum attendance is reached.
Using the TSV data from previous studies [57], a usage rate model for Harbin was established. The corresponding TSV was mapped to attendance, and then, the average value was calculated for every 0.25 TSV, normalised by the highest attendance. As shown in Figure 14, αc = 0.15, αh = 0.59 and μ = 1.00. When TSV is 1, N/Nmax reaches its maximum value (models for different activity intensities and age groups may vary, but this model is targeted at the overall population).

4.2.2. Foot Vote—Based on Spatial Distribution

To objectively indicate people’s acceptance of SR, Xue et al. defined a new term as ‘foot vote’ [31]. Theoretically, it assumes that individuals make spatial choices—such as standing in sunlit or shaded areas—in response to their thermal sensations, thereby reflecting collective thermal preferences within a given environment. This behavioral response forms the basis for translating subjective comfort perception into a quantifiable indexas Formula (3) [7].
F o o t   v o t e = log 2 ( N s u n / N s h a d e ) ,
where Nsun represents the number of people under the sun and Nshade represents the number of people in the shadow.
According to the above formula, we can obtain the following:
when foot vote = 0, Nsun = Nshade; when foot vote > 0, Nsun > Nshade;
when foot vote = 1, Nsun = 2 Nshade; when foot vote < 0, Nsun < Nshade.
Behavioral mapping was conducted through systematic field observations at fixed time intervals, during which observers recorded pedestrian distribution across pre-defined spatial grids. To minimize potential observer bias, all observers were trained with standardized protocols, and cross-validation was performed among multiple observers during overlapping observation periods. The derived foot vote values were then compared with corresponding UTCI values to assess their relationship with objective thermal conditions.
The calculation results are shown in Figure 15. The UTCI values corresponding to the foot vote value of 0 are invariably close to 10 °C, which is comparable to the UTCI value corresponding to the minimum unacceptable ratio [57]. It is indicated that when people find the thermal environment most agreeable, their sensitivity to SR also reaches the lowest level. The acceptable heat range in Harbin is −3.8 –23.0 °C UTCI [57], and the foot vote obtained after substitution into Figure 15 is −1.6–1. Within this range, people are most accustomed to the change in outdoor SR and thermal environment.
Compared with traditional thermal comfort assessment tools that rely solely on environmental parameters, the foot vote method integrates objective microclimatic data with observed behavioral responses, thereby improving both the accuracy and replicability of thermal comfort evaluations in cold-climate urban environments.

4.3. Guidance for Design and Research Limitations

This study investigates the relationship between thermal comfort and crowd behaviour in outdoor public spaces in severe cold regions of Northeast China, specifically Harbin. The analysis combines thermal environment measurement and crowd behavioural observation. Two experiments were conducted: Experiment 1 employed mobile cameras across two 200 m × 200 m areas, recording 4250 stays lasting over 10 s each across different seasons. Experiment 2 used a fixed camera in a 150 m2 zone, collecting 7500 stays and 75,000 pedestrian counts. Minute-by-minute environmental data were collected on sunny days, and UTCI (with a validated clothing model) was used to assess thermal comfort.
During the transitional and hot seasons, attendance, stay duration, and activity intensity exhibited a non-linear relationship with UTCI. A quadratic model was selected after preliminary data exploration suggested a non-linear trend. Alternative models, including linear and cubic forms, were also considered, and the quadratic form provided a visually and conceptually reasonable fit. Model performance was evaluated using R2 values and residual distributions, indicating that the quadratic model captured the main trend without obvious systematic deviations. While error margins, confidence intervals, and sensitivity analyses were not performed, the manuscript clarifies the variability and limitations inherent in the observational data, emphasizing the need for cautious interpretation of the results. Peak values for attendance, stay duration, and activity intensity occurred at approximately 29 °C, 26 °C, and 27 °C, respectively—within the optimal thermal environment (OTE) range of 24–32 °C UTCI, corresponding to moderate heat stress in Harbin. In the cold season, these parameters were generally lower; however, attendance and stay duration increased when UTCI fell below −10 °C, reflecting the influence of winter tourism peaks. Shading conditions and age were also found as influential behavioural modifiers.
Walking speed was inversely correlated with UTCI throughout the year, likely as a means to avoid uncomfortable conditions. Seating behaviour also varied with temperature: the number of people sitting was highest around UTCI = 21 °C and nearly zero below 10 °C. As UTCI increased, the proportion of people sitting in the sunlight decreased faster than those standing, suggesting seated individuals were less accustomed to uncomfortable environments.
Compared with other studies, people in subtropical regions were more sensitive to sunlight, and the degree of influence of air temperature on sun exposure (N_sun/N) was greater than in Harbin and other temperate regions. While attendance patterns in Harbin were similar to subtropical regions, they differed from other temperate areas. Explicit data sources, comparison metrics, and discussion of how cultural norms or urban morphology may influence these deviations should be clarified. Stay durations in pedestrian streets were generally shorter than in parks or squares, though the overall pattern of increasing then decreasing stay duration with temperature was consistent across space types.
Two models were established to infer human thermal comfort in severe cold regions. Based on our observations of crowd behavior and thermal comfort in Harbin, the findings provide several practical implications for urban planning and design in cold-climate cities. The two models include a usage rate model based on the relationship between attendance and TSV, and a foot vote model based on N_sun and UTCI to estimate acceptance of thermal conditions. First, the results can inform thermal zoning strategies by identifying areas that receive prolonged sunlight or remain shaded, allowing planners to optimize spatial layouts that enhance outdoor comfort throughout the day and across seasons. Second, they also guide material selection for pavements, building facades, and street furniture to reduce heat loss in winter or limit heat gain in transitional and hot periods, thereby improving the overall thermal experience for pedestrians. Third, the arrangement and placement of urban furniture—including benches, seating clusters, and shade structures—can be tailored to the observed patterns of pedestrian stay duration, activity intensity, and seating behavior, ensuring that public spaces accommodate both thermal comfort and behavioral preferences. By integrating these considerations, urban planners and designers can create public environments that not only respond to climatic conditions but also encourage longer stays, greater engagement, and enhanced well-being for residents and visitors. These applications demonstrate how empirical observations of human behavior under different thermal conditions can be translated into actionable strategies for designing more resilient and user-centered cold-climate cities.
However, this study primarily focuses on crowd behaviour and thermal comfort, without incorporating specific architectural or landscape design methods. In future research, we plan to integrate design strategies to explore ways to enhance space utilisation at the overall design level. The findings from this study will contribute to the long-term goal of proposing urban planning and design strategies that improve outdoor thermal comfort, which is crucial for citizens’ well-being and health. The study is based on specific areas of Central Avenue in Harbin and observations were limited to sunny days, which may reduce generalizability. Other environmental factors, such as wind, humidity, or air pollution, were not included, and the models rely on observational rather than direct subjective data, which may introduce uncertainties. While error margins, confidence intervals, and sensitivity analyses were not performed, these limitations are acknowledged in the manuscript, and cautious interpretation of the results is emphasized.

5. Conclusions

This study investigates the relationship between thermal comfort and crowd behaviour in outdoor public spaces in severe cold regions of Northeast China, specifically Harbin, through thermal environment measurement and crowd behavioural observation. In addition, it analyses the characteristics of severe cold regions and compares them with other research findings.
Two experiments were conducted to achieve the above objectives. Experiment 1 used mobile cameras in two 200 m × 200 m areas, recording 4250 10 s+ stays seasonally to observe distribution/activities. Experiment 2, with a fixed camera in a 150 m2 zone, collected 7500 stays and 75,000 counts. Sunny-day thermal data was taken minute-by-minute; UTCI (with validated clothing model) assessed comfort. The main conclusions drawn are as follows:
First, crowd distribution is related to the availability of sunlight and shade. In high-temperature environments, the spatial distribution of people is primarily influenced by the distribution of shadows and sunlight, and in low-temperature environments, people are less sensitive to sunlight. Moreover, people prefer architectural shadows more than tree shadows. Therefore, when only building shadows are provided in an area, the observation results of crowd distribution can better reflect people’s sensitivity to sunlight.
Second, during the transitional and hot seasons, attendance, stay duration and activity intensity exhibit a quadratic function relationship with UTCI, reaching their peak values at 29 °C, 26 °C and 27 °C, respectively, within the OTE range of 24–32 °C UTCI and the moderate heat stress range in Harbin. These three parameters are typically much lower in the cold season than in other seasons. However, when UTCI is below −10 °C, both attendance and stay duration considerably increase, leading up to the arrival of the peak tourist season. Shading conditions also influence stay duration—people stay longer in the shade during the hot and transitional seasons, although this pattern is less pronounced in winter. Moreover, individuals under 18 years old show a more rapid decline in stay duration as temperature decreases, indicating greater sensitivity to cold. Furthermore, the total pedestrian volume in pedestrian streets reaches its peak at UTCI of 26 °C and decreases as UTCI increases or decreases.
Third, walking speed is inversely correlated with UTCI throughout the year, likely as a means of avoiding uncomfortable environments. Seating behaviour also varies with temperature. The number of people sitting is the highest when UTCI is approximately 21 °C and almost zero when UTCI decreases below 10 °C. As UTCI rises, the proportion of people sitting in the sunlight decreases at a faster pace than those standing in the sunlight, indicating that those seated are less accustomed to uncomfortable environments.
Fourth, compared with other studies, our findings revealed that people in the subtropical regions are more sensitive to sunlight and the degree of influence of Tair on N s u n / N is greater in subtropical regions than in Harbin, China, and other temperate regions. In terms of the relationship between attendance and thermal comfort, the research results in Harbin are similar to those in subtropical regions but considerably different from other temperate regions. Additionally, stay durations in pedestrian streets are generally shorter than in parks or squares. However, a similar pattern of change is observed in stay duration across different space types, stay duration tends to increase with temperature up to a point, then decline.
Lastly, according to the research findings, two models for inferring human thermal comfort in the severe cold regions of Northeast China were established. The first model is a usage rate model, which is based on the relationship between attendance and TSV. By counting attendance, the corresponding TSV can be estimated. The second model is a foot vote model, which is based on the N s u n and UTCI and can determine the acceptance level of the thermal environment based on the spatial distribution of the crowd. These two models can be applied to evaluate the subjective thermal comfort felt by the crowd against the crowd observation data. These models enable researchers and planners to assess crowd thermal comfort without relying on extensive questionnaire surveys, providing a faster and more practical method for evaluating outdoor thermal conditions and supporting more responsive urban design.

Author Contributions

Conceptualization, S.L. and H.J.; methodology, S.L.; software, S.L. and H.J.; validation, S.L.; formal analysis, S.L.; investigation, S.L.; resources, S.L.; data curation, S.L.; writing—original draft preparation, S.L.; writing—review and editing, S.L.; visualization, S.L.; supervision, S.L. and H.J.; project administration, H.J.; funding acquisition, H.J. All authors have read and agreed to the published version of the manuscript.

Funding

This work was supported by the National Natural Science Foundation of China [grant number 51438005].

Data Availability Statement

The original contributions presented in this study are included in the article material. Further inquiries can be directed to the corresponding authors.

Acknowledgments

The authors would like to thank all the respondents who participated in this study.

Conflicts of Interest

The authors declare no conflicts of interest.

References

  1. Thorsson, S.; Honjo, T.; Lindberg, F.; Eliasson, I.; Lim, E.-M. Thermal Comfort and Outdoor Activity in Japanese Urban Public Places. Environ. Behav. 2007, 39, 660–684. [Google Scholar] [CrossRef]
  2. Lin, T.-P.; Tsai, K.-T.; Liao, C.-C.; Huang, Y.-C. Effects of Thermal Comfort and Adaptation on Park Attendance Regarding Different Shading Levels and Activity Types. Build. Environ. 2013, 59, 599–611. [Google Scholar] [CrossRef]
  3. Li, K.; Zhang, Y.; Zhao, L. Outdoor Thermal Comfort and Activities in the Urban Residential Community in a Humid Subtropical Area of China. Energy Build. 2016, 133, 498–511. [Google Scholar] [CrossRef]
  4. Watanabe, S.; Ishii, J. Effect of Outdoor Thermal Environment on Pedestrians’ Behavior Selecting a Shaded Area in a Humid Subtropical Region. Build. Environ. 2016, 95, 32–41. [Google Scholar] [CrossRef]
  5. Krüger, E.L.; Piaskowy, N.A.; Moro, J.; Minella, F.O. Identifying Solar Access Effects on Visitors’ Behavior in Outdoor Resting Areas in a Subtropical Location: A Case Study in Japan Square in Curitiba, Brazil. Int. J. Biometeorol. 2019, 63, 301–313. [Google Scholar] [CrossRef]
  6. Cheung, P.K.; Jim, C.Y. Subjective Outdoor Thermal Comfort and Urban Green Space Usage in Humid-Subtropical Hong Kong. Energy Build. 2018, 173, 150–162. [Google Scholar] [CrossRef]
  7. Han, S.; Song, D.; Xu, L.; Ye, Y.; Yan, S.; Shi, F.; Zhang, Y.; Liu, X.; Du, H. Behaviour in Public Open Spaces: A Systematic Review of Studies with Quantitative Research Methods. Build. Environ. 2022, 223, 109444. [Google Scholar] [CrossRef]
  8. Chen, Y.C.; Hou, K.S.; Liao, Y.J.; Honjo, T.; Cheng, F.-Y.; Lin, T.-P. The Application of a High-Density Street-Level Air Temperature Observation Network (HiSAN): Spatial and Temporal Variations of Thermal and Wind Condition in Different Climatic Condition Types. Sustain. Cities Soc. 2024, 109, 105547. [Google Scholar] [CrossRef]
  9. Li, J.; Niu, J.; Mak, M.C.; Huang, T.; Xie, Y. Exploration of Applicability of UTCI and Thermally Comfortable Sun and Wind Conditions Outdoors in a Subtropical City of Hong Kong. Sustain. Cities Soc. 2020, 52, 101793. [Google Scholar] [CrossRef]
  10. Kim, M.; Lee, K.; Cho, G.H. Temporal and Spatial Variability of Urban Heat Island by Geographical Location: A Case Study of Ulsan, Korea. Build. Environ. 2017, 126, 471–482. [Google Scholar] [CrossRef]
  11. Yan, H.; Fan, S.; Guo, C.; Wu, F.; Zhang, N.; Dong, L. Assessing the Effects of Landscape Design Parameters on Intra-Urban Air Temperature Variability: The Case of Beijing, China. Build. Environ. 2014, 76, 44–53. [Google Scholar] [CrossRef]
  12. Kántor, N.; Unger, J. Benefits and Opportunities of Adopting GIS in Thermal Comfort Studies in Resting Places: An Urban Park as an Example. Landsc. Urban. Plan. 2010, 98, 36–46. [Google Scholar] [CrossRef]
  13. Nikolopoulou, M.; Lykoudis, S. Use of Outdoor Spaces and Microclimate in a Mediterranean Urban Area. Build. Environ. 2007, 42, 3691–3707. [Google Scholar] [CrossRef]
  14. Thorsson, S.; Lindqvist, M.; Lindqvist, S. Thermal Bioclimatic Conditions and Patterns of Behaviour in an Urban Park in Göteborg, Sweden. Int. J. Biometeorol. 2004, 48, 149–156. [Google Scholar] [CrossRef] [PubMed]
  15. Lopes, H.S.; Remoaldo, P.C.; Ribeiro, V.; Martín-Vide, J. Perceptions of Human Thermal Comfort in an Urban Tourism Destination—A Case Study of Porto (Portugal). Build. Environ. 2021, 205, 108246. [Google Scholar] [CrossRef]
  16. Fan, Q.; Li, X.; Li, H. Crowd Gathering and Thermal Comfort Research in Different Park Shading Spaces. Sustainability 2022, 14, 2687. [Google Scholar] [CrossRef]
  17. Laureti, F.; Martinelli, L.; Battisti, A. Assessment and Mitigation Strategies to Counteract Overheating in Urban Historical Areas in Rome. Climate 2018, 6, 18. [Google Scholar] [CrossRef]
  18. Guo, Z.; Watanabe, N.; Setoguch, T.; Huo, K. Urban Canyon Microclimate and Spatial Behavior in Extreme Climate Situations. Int. J. Archit. Urban Dev. 2019, 9, 22–34. [Google Scholar]
  19. Kim, S.W.; Brown, R.D. Pedestrians’ Behavior Based on Outdoor Thermal Comfort and Micro-Scale Thermal Environments, Austin, TX. Sci. Total Environ. 2022, 808, 152143. [Google Scholar] [CrossRef]
  20. Lin, T.-P. Thermal Perception, Adaptation and Attendance in a Public Square in Hot and Humid Regions. Build. Environ. 2009, 44, 2017–2026. [Google Scholar] [CrossRef]
  21. Huang, K.-T.; Lin, T.-P.; Lien, H.-C. Investigating Thermal Comfort and User Behaviors in Outdoor Spaces: A Seasonal and Spatial Perspective. Adv. Meteorol. 2015, 2015, 423508. [Google Scholar] [CrossRef]
  22. Lin, C.-H.; Lin, T.-P.; Hwang, R.-L. Thermal Comfort for Urban Parks in Subtropics: Understanding Visitor’s Perceptions, Behavior and Attendance. Adv. Meteorol. 2013, 2013, 640473. [Google Scholar] [CrossRef]
  23. Lin, T.-P.; Tsai, K.-T.; Hwang, R.-L.; Matzarakis, A. Quantification of the Effect of Thermal Indices and Sky View Factor on Park Attendance. Landsc. Urban. Plan. 2012, 107, 137–146. [Google Scholar] [CrossRef]
  24. Huang, J.; Zhou, C.; Zhuo, Y.; Xu, L.; Jiang, Y. Outdoor Thermal Environments and Activities in Open Space: An Experiment Study in Humid Subtropical Climates. Build. Environ. 2016, 103, 238–249. [Google Scholar] [CrossRef]
  25. Cheng, B.; Gou, Z.; Zhang, F.; Feng, Q.; Huang, Z. Thermal Comfort in Urban Mountain Parks in the Hot Summer and Cold Winter Climate. Sustain. Cities Soc. 2019, 51, 101756. [Google Scholar] [CrossRef]
  26. Guo, W.; Jiang, L.; Cheng, B.; Yao, Y.; Wang, C.; Kou, Y.; Xu, S.; Xian, D. A Study of Subtropical Park Thermal Comfort and Its Influential Factors during Summer. J. Therm. Biol. 2022, 109, 103304. [Google Scholar] [CrossRef] [PubMed]
  27. Deng, Y.; Gan, D.; Tang, N.; Cai, Z.; Li, X.; Chen, S.; Li, X. Research on Outdoor Thermal Comfort and Activities in Residential Areas in Subtropical China. Atmosphere 2022, 13, 1357. [Google Scholar] [CrossRef]
  28. Boumaraf, H.; Amireche, L. Thermal Comfort and Pedestrian Behaviors in Urban Public Spaces in Cities with Warm and Dry Climates. Open House Int. 2020, 46, 143–159. [Google Scholar] [CrossRef]
  29. Niu, J.; Xiong, J.; Qin, H.; Hu, J.; Deng, J.; Han, G.; Yan, J. Influence of Thermal Comfort of Green Spaces on Physical Activity: Empirical Study in an Urban Park in Chongqing, China. Build. Environ. 2022, 219, 109168. [Google Scholar] [CrossRef]
  30. Faustini, F.B.; de Faria, J.R.G.; Fontes, M.S.G.d.C. The Influence of Thermal Comfort Conditions on User’s Exposure Time in Open Spaces. Int. J. Biometeorol. 2020, 64, 243–252. [Google Scholar] [CrossRef]
  31. Xue, J.; Liu, W.; Liu, K. Influence of Thermal Environment on Attendance and Adaptive Behaviors in Outdoor Spaces: A Study in a Cold-Climate University Campus. Int. J. Environ. Res. Public Health 2021, 18, 6139. [Google Scholar] [CrossRef] [PubMed]
  32. Zacharias, J.; Stathopoulos, T.; Wu, H. Spatial Behavior in San Francisco’s Plazas: The Effects of Microclimate, Other People, and Environmental Design. Environ. Behav. 2004, 36, 638–658. [Google Scholar] [CrossRef]
  33. Kim, Y.; Brown, R. Effect of Meteorological Conditions on Leisure Walking: A Time Series Analysis and the Application of Outdoor Thermal Comfort Indexes. Int. J. Biometeorol. 2022, 66, 1109–1123. [Google Scholar] [CrossRef]
  34. Tsai, K.-T.; Lin, Y.-H. Identification of Urban Park Activity Intensity at Different Thermal Environments and Visible Sky by Using Sound Levels. Int. J. Biometeorol. 2018, 62, 1987–1994. [Google Scholar] [CrossRef]
  35. Handoyo, A.D.; Wulandari, R.; Tiara, A.F. The Importance and Impact of User Behavior on Thematic Park; Atlantis Press: Dordrecht, The Netherlands, 2020; pp. 221–228. [Google Scholar]
  36. Wei, R.; Yan, J.; Cui, Y.; Song, D.; Yin, X.; Sun, N. Studies on the Specificity of Outdoor Thermal Comfort during the Warm Season in High-Density Urban Areas. Buildings 2023, 13, 2473. [Google Scholar] [CrossRef]
  37. Subedi, R.; Rijal, H.B.; Khadka, S.; Aqilah, N.; Lamsal, P. Development of Adaptive Thermal Comfort Model for Urban Park Based on Field Survey and Literature Review. Front. Built Environ. 2025, 10, 1526919. [Google Scholar] [CrossRef]
  38. Norouzi, M.; Chau, H.-W.; Jamei, E. Design and Site-Related Factors Impacting the Cooling Performance of Urban Parks in Different Climate Zones: A Systematic Review. Land. 2024, 13, 2175. [Google Scholar] [CrossRef]
  39. Alinasab, N.; Mohammadzadeh, N.; Karimi, A.; Mohammadzadeh, R.; Gál, T. A Measurement-Based Framework Integrating Machine Learning and Morphological Dynamics for Outdoor Thermal Regulation. Int. J. Biometeorol. 2025, 69, 1645–1662. [Google Scholar] [CrossRef]
  40. Sauquet, H.; Weston, P.H.; Anderson, C.L.; Barker, N.P.; Cantrill, D.J.; Mast, A.R.; Savolainen, V. Contrasted Patterns of Hyperdiversification in Mediterranean Hotspots. Proc. Natl. Acad. Sci. USA 2009, 106, 221–225. [Google Scholar] [CrossRef]
  41. Tousi, E.; Tseliou, A.; Mela, A.; Sinou, M.; Kanetaki, Z.; Jacques, S. Exploring Thermal Discomfort during Mediterranean Heatwaves through Softscape and Hardscape ENVI-Met Simulation Scenarios. Sustainability 2024, 16, 6240. [Google Scholar] [CrossRef]
  42. Romero, P.; Miranda, M.T.; Isidoro, R.; Arranz, J.I.; Valero-Amaro, V. Thermal Comfort and Sustainability in University Classrooms: A Study in Mediterranean Climate Zones. Appl. Sci. 2025, 15, 694. [Google Scholar] [CrossRef]
  43. Diz-Mellado, E.; López-Cabeza, V.P.; Roa-Fernández, J.; Rivera-Gómez, C.; Galán-Marín, C. Energy-Saving and Thermal Comfort Potential of Vernacular Urban Block Porosity Shading. Sustain. Cities Soc. 2023, 89, 104325. [Google Scholar] [CrossRef]
  44. Nastos, P.; Saaroni, H. Living in Mediterranean Cities in the Context of Climate Change: A Review. Int. J. Climatol. 2024, 44, 3169–3190. [Google Scholar] [CrossRef]
  45. Kántor, N. Differences between the Evaluation of Thermal Environment in Shaded and Sunny Position. Hung. Geogr. Bull. 2016, 65, 139–153. [Google Scholar] [CrossRef]
  46. Founda, D.; Katavoutas, G.; Pierros, F.; Mihalopoulos, N. The Extreme Heat Wave of Summer 2021 in Athens (Greece): Cumulative Heat and Exposure to Heat Stress. Sustainability 2022, 14, 7766. [Google Scholar] [CrossRef]
  47. Havenith, G.; Fiala, D. Thermal Indices and Thermophysiological Modeling for Heat Stress. Compr. Physiol. 2016, 6, 255–302. [Google Scholar] [CrossRef]
  48. Laouadi, A. Physiological Indicators of Thermal Comfort: A Comprehensive Approach Using the Metabolic-Based Predicted Mean Vote Index. Buildings 2024, 14, 3861. [Google Scholar] [CrossRef]
  49. Li, K.; Liu, X.; Bao, Y. Evaluating the Performance of Different Thermal Indices on Quantifying Outdoor Thermal Sensation in Humid Subtropical Residential Areas of China. Front. Environ. Sci. 2022, 10, 1071668. [Google Scholar] [CrossRef]
  50. Krüger, E.L.; Minella, F.O.; Matzarakis, A. Comparison of Different Methods of Estimating the Mean Radiant Temperature in Outdoor Thermal Comfort Studies. Int. J. Biometeorol. 2014, 58, 1727–1737. [Google Scholar] [CrossRef]
  51. Qin, J.; Tian, M.; Xu, X.; Yuan, L. Mapping High-Resolution Spatio-Temporal Patterns of Pedestrian Thermal Comfort at Different Scales Using Street View Imagery and Deep Learning. Sustain. Cities Soc. 2025, 121, 106209. [Google Scholar] [CrossRef]
  52. Shooshtarian, S.; Rajagopalan, P.; Wakefield, R. Effect of Seasonal Changes on Usage Patterns and Behaviours in Educational Precinct in Melbourne. Urban. Clim. 2018, 26, 133–148. [Google Scholar] [CrossRef]
  53. Blondin, D.P.; Haman, F. Shivering and Nonshivering Thermogenesis in Skeletal Muscles. Handb. Clin. Neurol. 2018, 156, 153–173. [Google Scholar] [CrossRef]
  54. Yuan, T.; Hong, B.; Qu, H.; Liu, A.; Zheng, Y. Outdoor Thermal Comfort in Urban and Rural Open Spaces: A Comparative Study in China’s Cold Region. Urban. Clim. 2023, 49, 101501. [Google Scholar] [CrossRef]
  55. GB 50352-2019; Unified Design Standard for Civil Buildings. Architecture & Building Press: Beijing, China, 2019.
  56. Peng, Z.; Wang, Y.; Li, L. Correlational Study on Thermal Comfort and Outdoor Activities. J. Phys. Conf. Ser. 2019, 1343, 012025. [Google Scholar] [CrossRef]
  57. Jin, H.; Liu, S.; Kang, J. Thermal Comfort Range and Influence Factor of Urban Pedestrian Streets in Severe Cold Regions. Energy Build. 2019, 198, 197–206. [Google Scholar] [CrossRef]
  58. Yang, Y.; Lyu, J.; Lian, Z.; Xie, Y.; Jiang, Y.; Lin, J.; Niu, J. Subjective Information in Thermal Comfort Evaluation Methods: A Critical Review. Energy Build. 2024, 325, 115019. [Google Scholar] [CrossRef]
  59. Fiala, D.; Lomas, K.J.; Stohrer, M. Computer Prediction of Human Thermoregulatory and Temperature Responses to a Wide Range of Environmental Conditions. Int. J. Biometeorol. 2001, 45, 143–159. [Google Scholar] [CrossRef]
  60. Weihs, P.; Staiger, H.; Tinz, B.; Batchvarova, E.; Rieder, H.; Vuilleumier, L.; Maturilli, M.; Jendritzky, G. The Uncertainty of UTCI Due to Uncertainties in the Determination of Radiation Fluxes Derived from Measured and Observed Meteorological Data. Int. J. Biometeorol. 2012, 56, 537–555. [Google Scholar] [CrossRef]
  61. Ainsworth, B.E.; Haskell, W.L.; Herrmann, S.D.; Meckes, N.; Bassett, D.R.; Tudor-Locke, C.; Greer, J.L.; Vezina, J.; Whitt-Glover, M.C.; Leon, A.S. 2011 Compendium of Physical Activities: A Second Update of Codes and MET Values. Med. Sci. Sport. Exerc. 2011, 43, 1575–1581. [Google Scholar] [CrossRef] [PubMed]
  62. Al-Azzawi, M.; Raeside, R. Modeling Pedestrian Walking Speeds on Sidewalks. J. Urban. Plan. Dev. 2007, 133, 211–219. [Google Scholar] [CrossRef]
  63. Lai, D.; Chen, B.; Liu, K. Quantification of the Influence of Thermal Comfort and Life Patterns on Outdoor Space Activities. Build. Simul. 2020, 13, 113–125. [Google Scholar] [CrossRef]
Figure 1. Research area in this study. (a) Geographic location of Harbin. (b) Central Avenue, the primary pedestrian street in Harbin, has two observation areas measuring 200 m × 200 m, selected in the northern (B-S) and southern (N-S) sections for crowd observation. (c,d) In the northern (B-S) and southern (N-S) sections, record crowd behaviour along linear street segments in the yellow area; the blue circles indicate the thermal environment measurement points.
Buildings 15 03812 g001
Figure 2. Point density maps for crowd distribution across seasons and locations. (a) Hot season B–S. (b) Transitional season B–S. (c) Cold season B–S. (d) Hot season N–S. (e) Transitional season N–S. (f) Cold season N–S. Higher densities are represented by darker colour.
Buildings 15 03812 g002
Figure 3. Proportion of people of the sun ( N s u n / N ) across different regions. B-S range: (ae). N-S range: (fj). Proportion of people of the sun ( N s u n / N ) in hot season (a,f), transitional season (b,g), and cold season (ch). Area division in the B-S range (d) and the N-S range (i), red colour indicates the locations of curbs and steps. Statistics analysis proportion under different ages in the B-S (e) range and the N-S range (j).
Buildings 15 03812 g003
Figure 4. Recorded number (a,b) and proportion (c) of people under the sun ( N s u n / N ) versus UTCI.
Buildings 15 03812 g004
Figure 5. Seasonal patterns in attendance response to thermal conditions. (a) Cold season. (b) October and November. (c) Hot season and transition seasons.
Buildings 15 03812 g005
Figure 6. UTCI and total pedestrian volume under different seasons. (a) Cold season. (b) October and November. (c) Days above 15 °C.
Buildings 15 03812 g006
Figure 7. Relationship between stay duration and UTCI across different seasons. (a) Cold season. (b) Hot and transition season.
Buildings 15 03812 g007
Figure 8. Difference in stay duration under sunlight and in the shade across different seasons. (a) Cold season. (b) Transition season. (c) Hot season.
Buildings 15 03812 g008
Figure 9. MET-min versus UTCI in cold season (a) and transitional and hot seasons (b).
Buildings 15 03812 g009
Figure 10. Walking speeding versus UTCI in cold season (a), transitional and hot season (b).
Buildings 15 03812 g010
Figure 11. Proportion of people sitting under sunlight.
Buildings 15 03812 g011
Figure 12. Proportion of people under the sun ( N s u n / N ).
Buildings 15 03812 g012
Figure 13. Comparison of attendance across different seasons.
Buildings 15 03812 g013
Figure 14. Usage rate model of Central Avenue.
Buildings 15 03812 g014
Figure 15. The relationship of foot vote and UTCI.
Buildings 15 03812 g015
Table 1. Area division.
Street OrientationArea DivisionMaximum Crowd Point DensityPartition
ColdTransitionalHot
B-S45° north by westUnder the steps0.310.510.89
East west directionAbove the steps1.410.760.89
0.470.170.33
15° south by westAbove the steps0.470.420.56
0.940.510.89
Under the steps0.160.150.11
0.470.340.22
65° north by eastUnder the steps0.160.150.33
N-S75° south by westOutside the curbstone0.310.590.56
0.630.590.56
East west directionOutside the curbstone0.780.761.00
0.310.430.44
0.310.250.33
South north directionOutside the curbstone0.630.170.33
0.310.250.89
Inside the curbstone1.410.590.89
Bold font indicates that the point density difference between two adjacent regions is greater than 0.3.
Table 2. Regression analysis.
Non-Standardised CoefficientStandardisation CoefficientSignificanceVIF
BStandard Error
Hot seasonTair−21.105.54−0.890.001.01
WS7.595.200.030.151.04
SR0.000.010.000.991.03
Transitional seasonTair7.15311.570.010.541.10
WS−3.1910.11−0.010.751.22
SR−0.140.04−0.070.001.17
Cold seasonTair0.650.640.050.322.35
WS−2.9010.20−0.010.781.05
SR−0.010.02−0.020.672.36
Table 3. Interactive regression analysis.
Non-Standardised CoefficientStandardisation CoefficientSignificanceVIF
BStandard Error
Hot seasonTair−21.995.50−4.000.001.00
SR−0.000.01−0.010.821.00
Tair*SR0.070.020.070.001.00
Cold seasonTair0.440.420.030.301.01
WS−1.979.94−0.010.841.01
Tair*WS−4.011.59−0.080.011.00
Cold seasonWS−0.819.97−0.000.941.01
SR0.010.020.020.611.01
WS*SR−0.110.05−0.060.051.00
The meaning of “*” is interaction, for example, “Tair*SR” is the interaction of air temperature and solar radiation.
Table 4. Activity intensity.
NumberActivityMETsSeason
ColdTransitionalHot
07040Standing/quietly1.311.4%17.1%15.6%
09050Standing/talking, making phone calls or sending text messages1.884.8%79.3%79.3%
13035Standing/Eating and talking2.02.7%1.6%2.7%
09101Family reunion activities involving playing with children3.00.0%0.0%0.2%
11870Work in a store, be an actor, be a staff member3.01.2%0.5%1.0%
02045Regulatory exercise, fitness training3.50.0%1.4%1.1%
Table 5. Walking speed comparison.
CountryPedestrian Streets (m/s)All Roads (m/s)Climate ZoneLiterature
France-1.50temperate, Mediterranean, continental[54]
New Zealand-1.47Subtropical, temperate, Mediterranean[57]
India1.191.20Tropical monsoon[54]
Bangladesh1.15-Subtropical monsoon[56]
Saudi Arabia-1.08Tropical Desert[54]
All roads: the average value of all types of roads.
Disclaimer/Publisher’s Note: The statements, opinions and data contained in all publications are solely those of the individual author(s) and contributor(s) and not of MDPI and/or the editor(s). MDPI and/or the editor(s) disclaim responsibility for any injury to people or property resulting from any ideas, methods, instructions or products referred to in the content.