Article

Thermal Comfort Differences Between the Elderly and Young People Under Different Infrared Radiation Conditions: A Quantitative Study Based on Subjective Evaluation and EEG Characteristics

1
Qingdao University of Technology Architectural Design and Research Institute Company, Qingdao 266033, China
2
College of Architecture and Urban Planning, Qingdao University of Technology, Qingdao 266033, China
3
School of Environment and Municipal Engineering, Qingdao University of Technology, Qingdao 266033, China
4
Department of Neurology, Affiliated Hospital of Qingdao University Medical College, Qingdao 266003, China
*
Author to whom correspondence should be addressed.
Buildings 2025, 15(20), 3798; https://doi.org/10.3390/buildings15203798
Submission received: 28 August 2025 / Revised: 17 October 2025 / Accepted: 17 October 2025 / Published: 21 October 2025
(This article belongs to the Section Building Energy, Physics, Environment, and Systems)

Abstract

With the intensification of global aging, a comfortable indoor environment is crucial for the well-being of the elderly. However, research on the thermal effect of solar radiation, i.e., infrared radiation, remains scarce. This study innovatively used infrared heaters to simulate the thermal effect of solar radiation and conducted a comprehensive thermal comfort experiment involving subjective evaluations and electroencephalogram (EEG) measurements on 30 elderly participants and 30 young participants in an artificial climate laboratory. The results showed that there were significant age-related differences in the subjective ratings and EEG power under different infrared radiation levels. Under low radiation conditions, as the irradiated area increased, the elderly participants’ thermal sensation ratings were 0.5 points higher than those of young participants, and their evaluation results in terms of comfort, relaxation, and alertness were also higher. The logarithmic EEG power of both age groups decreased, but the overall power level of the elderly was consistently lower. Notably, under high radiation conditions, the comfort level of both groups decreased, with a more significant decline in young people. Interestingly, when the EEG power of young people decreased, that of the elderly increased, indicating that despite the elderly’s better subjective evaluations, they are more susceptible to heat stress. In addition, this study shows that under the action of infrared radiation, the logarithmic EEG power of young participants is approximately 1.0% to 1.5% higher than that of elderly participants. This study found that the frontal alpha band is a key indicator for predicting thermal comfort in people of different ages, which highlights the innovative contribution of this research. To fill the gap in the field of thermal comfort research, this study explored the elderly’s response to infrared radiation, an aspect that has not been fully studied before. These insights can provide references for the design of more comfortable environments in facilities for the elderly, thereby significantly improving the quality of life of this population.

1. Introduction

With the spread of global aging across the world, the global elderly care industry is confronting severe challenges [1,2,3,4]. Modern humans spend nearly all of our lives confined to indoor spaces, with the World Health Organization estimating that we spend 80% of our lives indoors on average [5,6]. For the elderly, due to suffering from multiple chronic diseases, many of them spend even 90% to 95% of their time indoors [7,8]. This reality creates a need for indoor environments that are healthy but also comfortable [9,10,11]. One of the main mechanisms through which we can do this is to ensure that these spaces have been designed to promote the elderly’s well-being and quality of life.
Elderly care institutions are the cornerstone of the elderly care service system, and their environmental quality directly impacts the quality of life of the elderly. However, a survey carried out by the author’s team on elderly care institutions in the four central urban districts of Qingdao indicates that many such institutions face issues with their environmental conditions, with one prominent problem being the insufficient utilization of solar radiation. Figure 1 shows the evaluation results of solar radiation in relation to the elderly in 36 representative elderly care institutions within the survey scope. It reveals that the elderly have a relatively high demand for solar radiation in all spaces except outdoor spaces and auxiliary spaces, while the current solar radiation environment can barely meet this demand.
According to Rajapaksha’s research, the elderly, regardless of the season, often engage in various activities in environments that feel warm [12]. The creation of this warmth is strongly generated by solar radiation. Physiologically, this directly impacts the human body: exposure to solar radiation induces the body’s sensation of warmth, prevents heat retention, and regulates body temperature. Additionally, sunlight increases serotonin levels in the brain, which helps improve the elderly’s mood and overall health [13]. Psychologically, sufficient solar radiation ensures the bright illumination of indoor spaces, fostering a sense of warmth and comfort for the elderly. In contrast, the elderly report feeling colder in dark environments and require additional insulation. It can be seen that the role of solar radiation in creating a comfortable living environment for the elderly has become an important issue.
Early research on solar radiation focused on its effects in vehicles. For instance, Hodder et al. modeled the solar radiation environment of automobile cabins and evaluated thermal comfort under six environmental conditions, such as black flat radiation and direct solar radiation, among nine male subjects. Under these conditions, they found considerable variation for subjective thermal comfort [14]. Subsequent research identified infrared energy as the leading factor for most of the sun’s warmth. Infrared irradiation directly impacts thermal sensation by influencing skin temperature [15,16,17]. Infrared radiation has a relatively long wavelength and is mostly absorbed by the skin, where it is converted into heat energy and plays a major role in generating warmth [18]. In experiments, using infrared heaters to simulate the infrared component of solar radiation is an effective research method. Common radiation indicators are typically used to quantify solar radiation exposure; specifically, these include the irradiance (W/m2) at the subjects’ location or the mean radiant temperature (MRT). When applicable, Δtpr (Predicted Mean Vote Difference) is also incorporated to assess the thermal effects of solar radiation and facilitate comparisons between different studies. In existing research, investigations into how solar radiation’s thermal effects influence comfort have primarily focused on young people, relying on subjective assessment tools, such as self-reported thermal sensation votes. However, the elderly possess unique physiological characteristics, and it remains unclear whether the findings regarding the impact of solar radiation’s thermal effects on comfort are applicable to this population.
This research is informed, at least in part, by age-based differences in the perception of comfort. Early studies suggested that there was no difference between the elderly and young people in terms of comfort perception [19,20,21]. But some other studies have suggested otherwise. For example, Soebarto et al. found that the elderly and young people had different thermal sensations and comfort levels under certain PMV conditions [22]. Schellen et al. observed that the elderly’s thermal sensation was generally 0.5 units lower than that of young people; they further noted that in a constant temperature environment with identical clothing insulation, the elderly preferred a higher ambient temperature than young people [23]. Regarding the two main user groups in elderly care facilities, existing studies have shown that there are differences in the thermal comfort perception between the elderly and caregivers in shared spaces. Yokoe et al. found that in care institutions, the elderly have a lower metabolic rate (1.0 met), while caregivers have a higher activity level (1.0–5.0 met), resulting in different perceptions of the same temperature [24]. In daily life scenarios, the elderly have a limited ability to adjust their environment due to mobility restrictions—for example, they need assistance to add or remove clothing—whereas caregivers can actively regulate the environment [25]. This may imply that the elderly and young people may have different thermal sensations when exposed to the same heat source stimulation, which puts forward higher requirements for the personalized regulation of the thermal environment in elderly care institutions. However, in terms of current existing thermal comfort standards, these standards are mainly formulated based on the needs of young people, lacking comparative analysis applicable to the elderly [26,27]. Moreover, the research methods of these studies are mostly limited to the use of subjective psychological questionnaires, and the depth and reliability of the research need to be further improved.
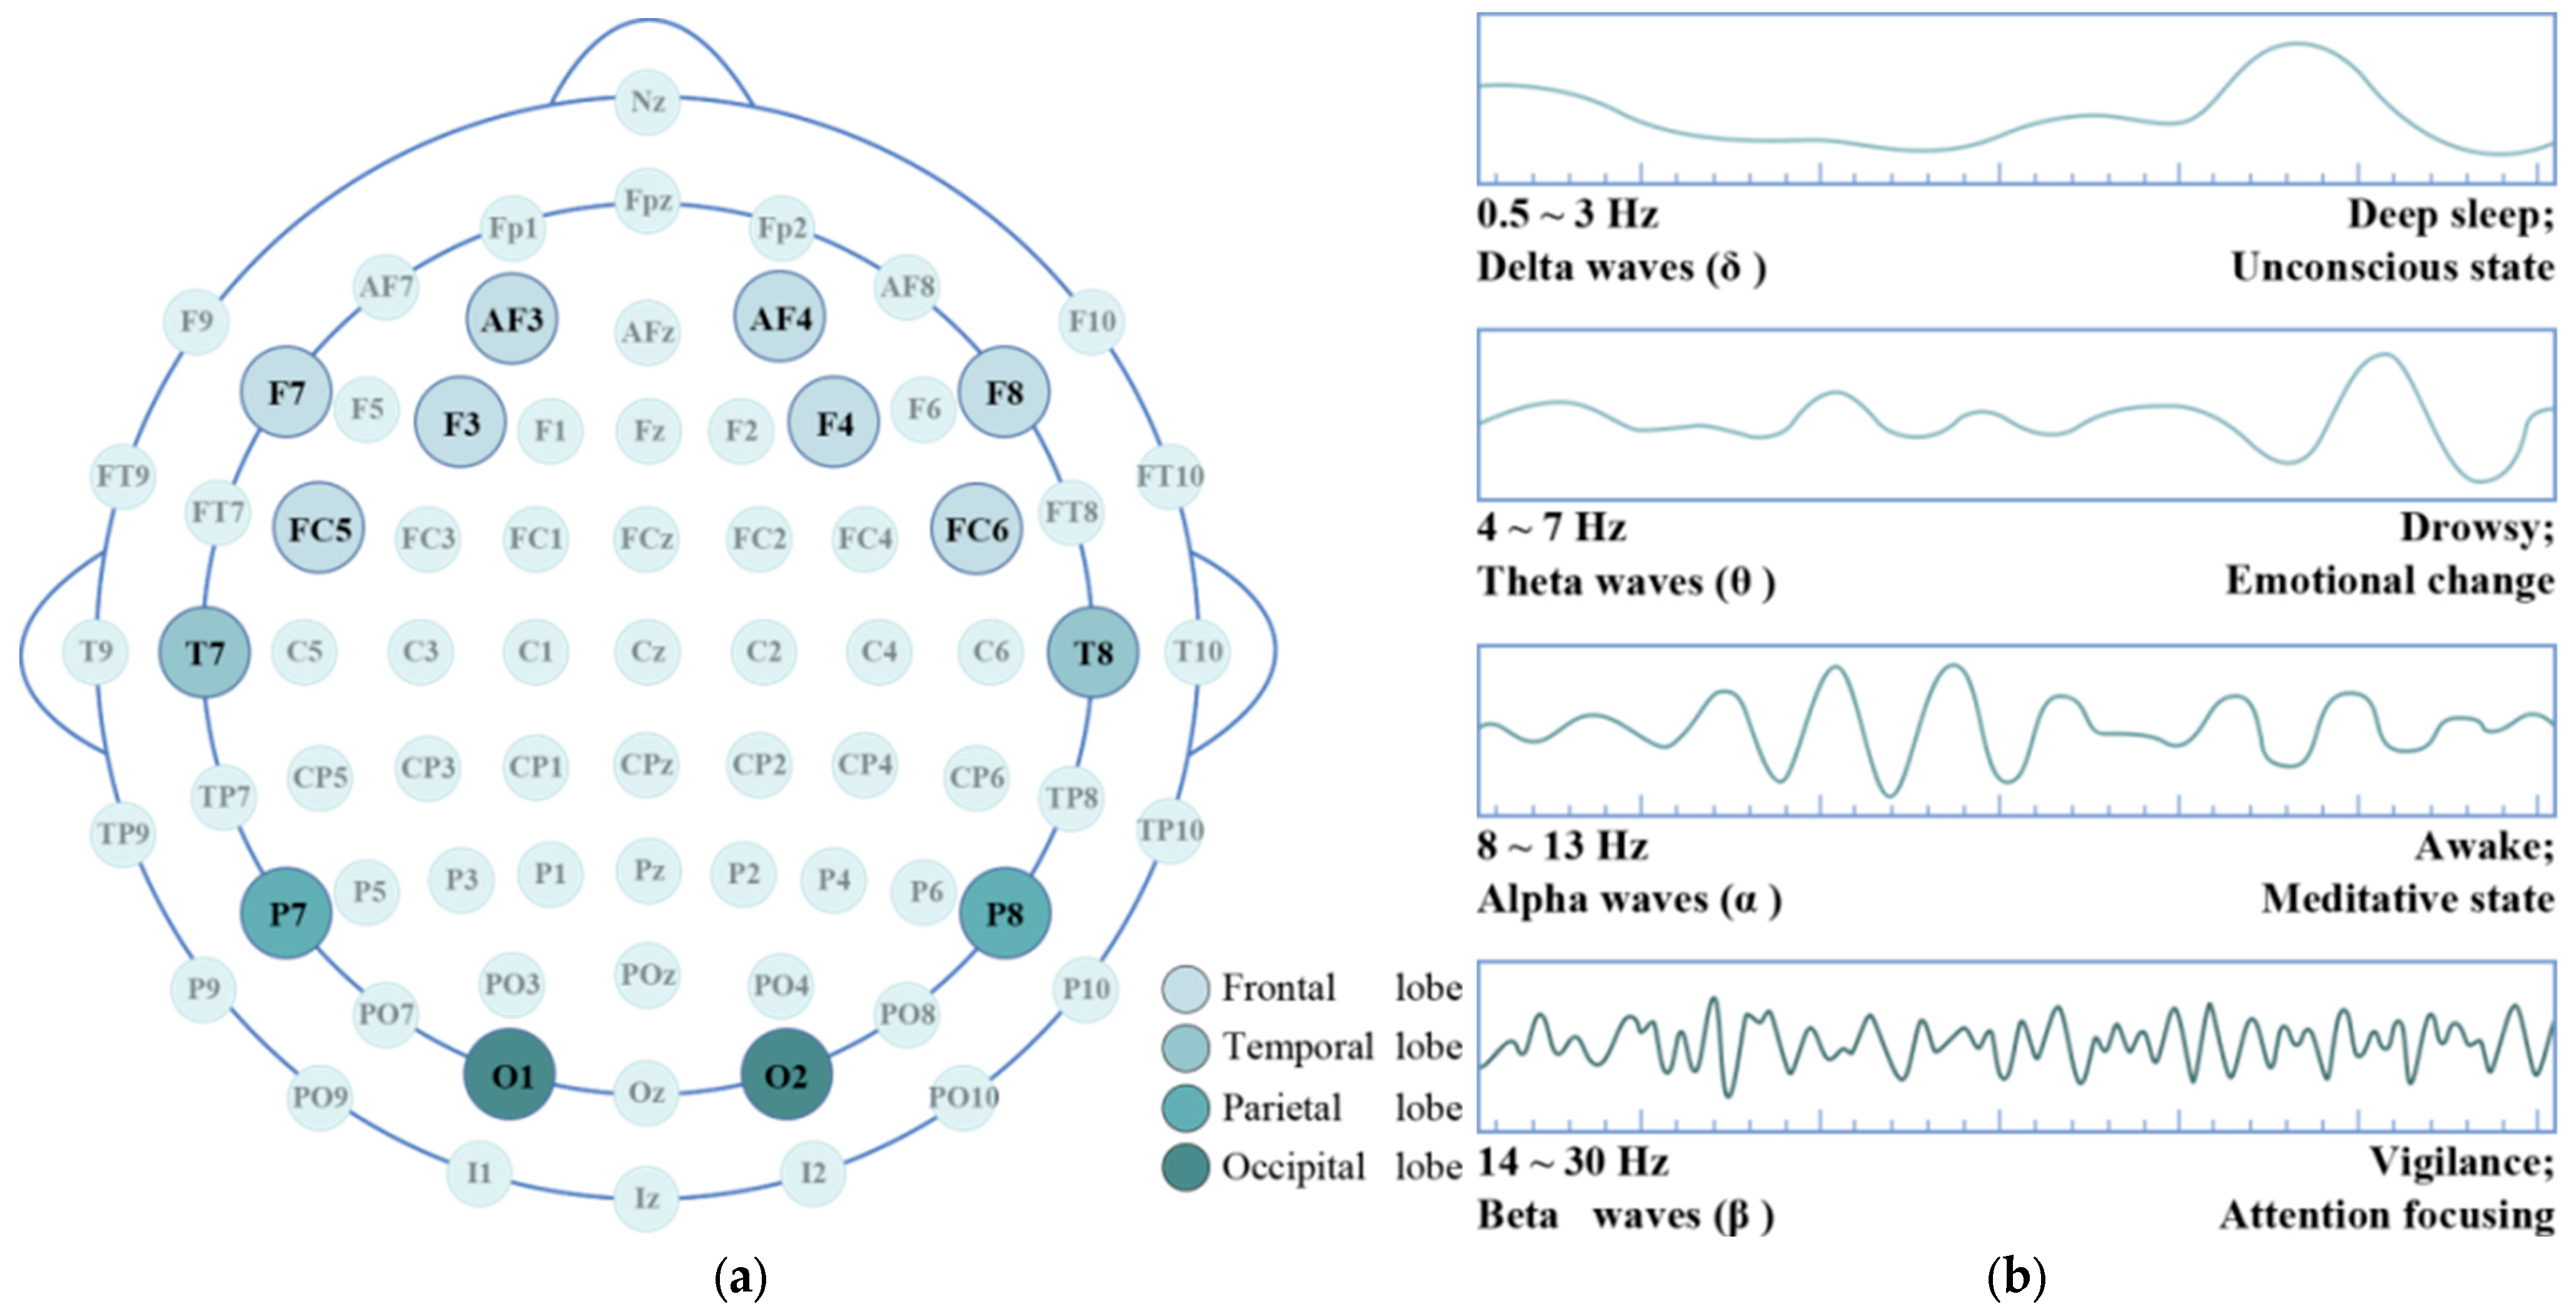
With the continuous progress of the science of human factors, physiological parameters such as the electroencephalogram (EEG), electrocardiogram (ECG), skin temperature (ST), and galvanic skin response (GSR) are used as thermal comfort indicators [28]. Physiological signals, including heart rate fluctuations, reflect responses of the body, while the EEG directly measures brain activity, thus enhancing our understanding of human behavior and thermal adaptations in a thermal environment [29]. As an electrical signal generated by the brain’s neuronal activity, an EEG is captured via electrodes placed on the cerebral cortex. This has been widely applied in medicine, neuroscience, and engineering [30,31,32]. By observing and amplifying the potential differences produced by the neural activities of the brain, an EEG can clearly reflect the neural activities and emotional changes in different individuals. The partitioning of electrodes is shown in Figure 2a,b and displays the four basic types of EEG signals divided according to the frequency spectrum range. Regarding EEG responses to thermal environments, Loughran et al. demonstrated that the impact of EEGs resulted from physiological modifications of homeostatic body temperature regulation [33]. Yao et al. investigated how the EEG responds to ambient temperature and found that the global relative power of different EEG frequency bands is sensitive to the ambient temperature and subjects’ thermal sensation [34]. Notably, the α band power percentage showed significant differences at 21 °C, 24 °C, 26 °C, and 29 °C, whereas the θ, δ, and β bands did so at specific temperatures [35]. At 26 °C, the α band power of the EEG increased significantly, while the δ band power decreased, as shown by Lv et al. when thermal stimulation was applied to the human body [36]. All such studies provided evident support for the operational capability of EEGs in evaluating human thermal comfort.
This study uses infrared heaters to simulate the thermal effect of solar radiation (i.e., infrared radiation) and quantifies the experimental environment through the mean radiant temperature (MRT) by collecting subjective evaluation data and objective electroencephalogram (EEG) data from elderly and young participants. Focused on exploring thermal comfort differences between the two groups, this study aims to achieve two goals: it seeks to provide support data and theoretical references for both the design of personalized thermal services in elderly care institutions and the future optimization of thermal radiation environment utilization. The existing thermal comfort research across age groups has predominantly focused on parameters like the air temperature, relative humidity, and air velocity, while the influence of infrared radiation on inter-age thermal comfort differences remains poorly understood. Notably, the elderly are often sedentary and tend to live in warm climates—making it critical to evaluate how infrared radiation affects their thermal comfort. Additionally, self-reported data in thermal comfort studies have inherent limitations (e.g., recall bias and response inconsistency). Thus, developing a comprehensive approach that combines subjective assessments with objective physiological measurements to unravel thermal comfort mechanisms not only addresses these limitations but also represents a promising direction for field advancement, and this motivates the methodological design of this study. The main research questions are as follows:
(1)
What effects do different infrared radiation conditions have on the subjective thermal comfort of the elderly and young people?
(2)
What are the differences in EEG power changes between the elderly and young people under infrared radiation?
(3)
Which EEG channel or frequency band best reflects thermal comfort in the elderly and young people?

2. Methods

2.1. Experimental Protocol

At Qingdao University of Technology’s artificial climate laboratory, 60 participants (comprising 30 elderly and 30 young people) were recruited to collect both subjective and objective data. The research process involved four steps: ① defining the scope, ② optimizing experimental protocols, ③ gathering and processing data, and ④ analyzing experimental results and discussing.

2.1.1. Determination of Experimental Conditions

Based on our team’s research results of the elderly facilities in the four central districts of Qingdao City, we drew a schematic diagram of the solar radiation situation in the most common double bedrooms in such facilities. By comprehensively taking into account the distance of the elderly from the windows and the coverage of the solar radiation, we determined four typical solar radiation scenarios, as shown in Figure 3.
To explore how the thermal effect of solar radiation affects the elderly, we designed an experiment that uses infrared radiation to simulate the thermal effect of solar radiation. We required the subjects to face the heat source on one side (of the body), and by controlling the simulator’s power, height, and irradiation angle, we formed seven experimental conditions. Specifically, the radiation simulator had two power settings: 500 W and 1000 W. These power settings were combined with three body irradiation areas: ① lower body, ② lower body and upper body, and ③ lower body, upper body, and head. Additionally, there was a non-irradiated control group. The specific experimental conditions can be seen in Table 1 and Figure 4. Considering that the experimental sequence factor can easily lead to deviations, the Latin square design was adopted in the arrangement of this experiment to ensure the scientific validity of the experimental data, and rest time was provided during the experiment to eliminate the influence from the previous experiment.

2.1.2. Selection and Arrangement of Infrared Radiators

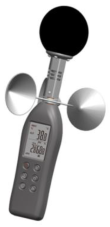
According to previous studies, infrared radiation in solar radiation is a key factor affecting human thermal sensation, and this radiation is also the main driving factor regulating human thermal sensation. To simulate the characteristics of this radiation in the experiment, this study prioritized the use of infrared heaters. On the one hand, their heat wave propagation mode is highly similar to solar radiation. The short-wave infrared radiation emitted can penetrate human skin, accounting for 30% of the total infrared radiation absorbed by the human body [37]. Moreover, the human body has a natural adaptation to this type of radiation, and this part of the radiation can directly enhance comfort [38]. On the other hand, compared with natural solar radiation, infrared heaters can achieve precise temperature control by adjusting the opening duration, radiation intensity, and irradiation angle, ensuring the scientificity and repeatability of the experiment [39]. Based on this, this experiment used infrared radiation heaters as the main heat source, and at the same time used a black globe thermometer to measure and calculate the mean radiant temperature as a standardized indicator. The models of the infrared heaters and black globe thermometers used are shown in Table 2.
A pre-experiment with 3 young and 3 elderly participants was conducted prior to the formal trial to ensure safety and effectiveness. The infrared heater was positioned at distances of 0.5 m, 1 m, and 1.5 m from each subject, respectively, and a 10 min infrared radiation experiment was carried out. Throughout this period, the subjects’ electroencephalogram (EEG) data were monitored concurrently. Before the start of each experimental phase, the researchers checked all physical parameters to ensure the consistency of the initial physical environment across different phases. During the experiment, an infrared heater (CQ-51) was placed 1 m away from the subject; its height and power were adjusted to match different experimental conditions. Given that participants remained seated throughout the experiment, a black globe thermometer (Model: AZ87785) was positioned 50 cm laterally to each participant at a height of 0.7 m. This placement prevented obstruction by the participants’ bodies and ensured that measurements reflected the direct radiant environment surrounding the participants.
Following the radiation exposure, the subjects completed a subjective questionnaire to assess the effects of different radiation distances on their perceptual experiences. Additionally, a black globe thermometer was utilized to record the ambient air temperature and black globe temperature in the vicinity of the subjects during the experiment, which enabled the calculation of the average radiant temperature variation throughout the experiment. Given that the wind speed in the laboratory is less than 0.15 m/s, the mean radiant temperature was calculated using the B7 formula specified in ISO 7726-2023 [40], which is referred to as Equation (1) in this study.
t ¯ r = [ ( t g + 273 ) 4 + 0 ,   25 × 10 8 ε g ( | t g t a | D ) 1 / 4 × ( t g t a ) ] 1 / 4 273
t ¯ r represents the mean radiant temperature in °C, t g represents the globe temperature in °C, t a represents the air temperature in °C, ε g represents the emissivity, and D represents the globe thermometer diameter in m.
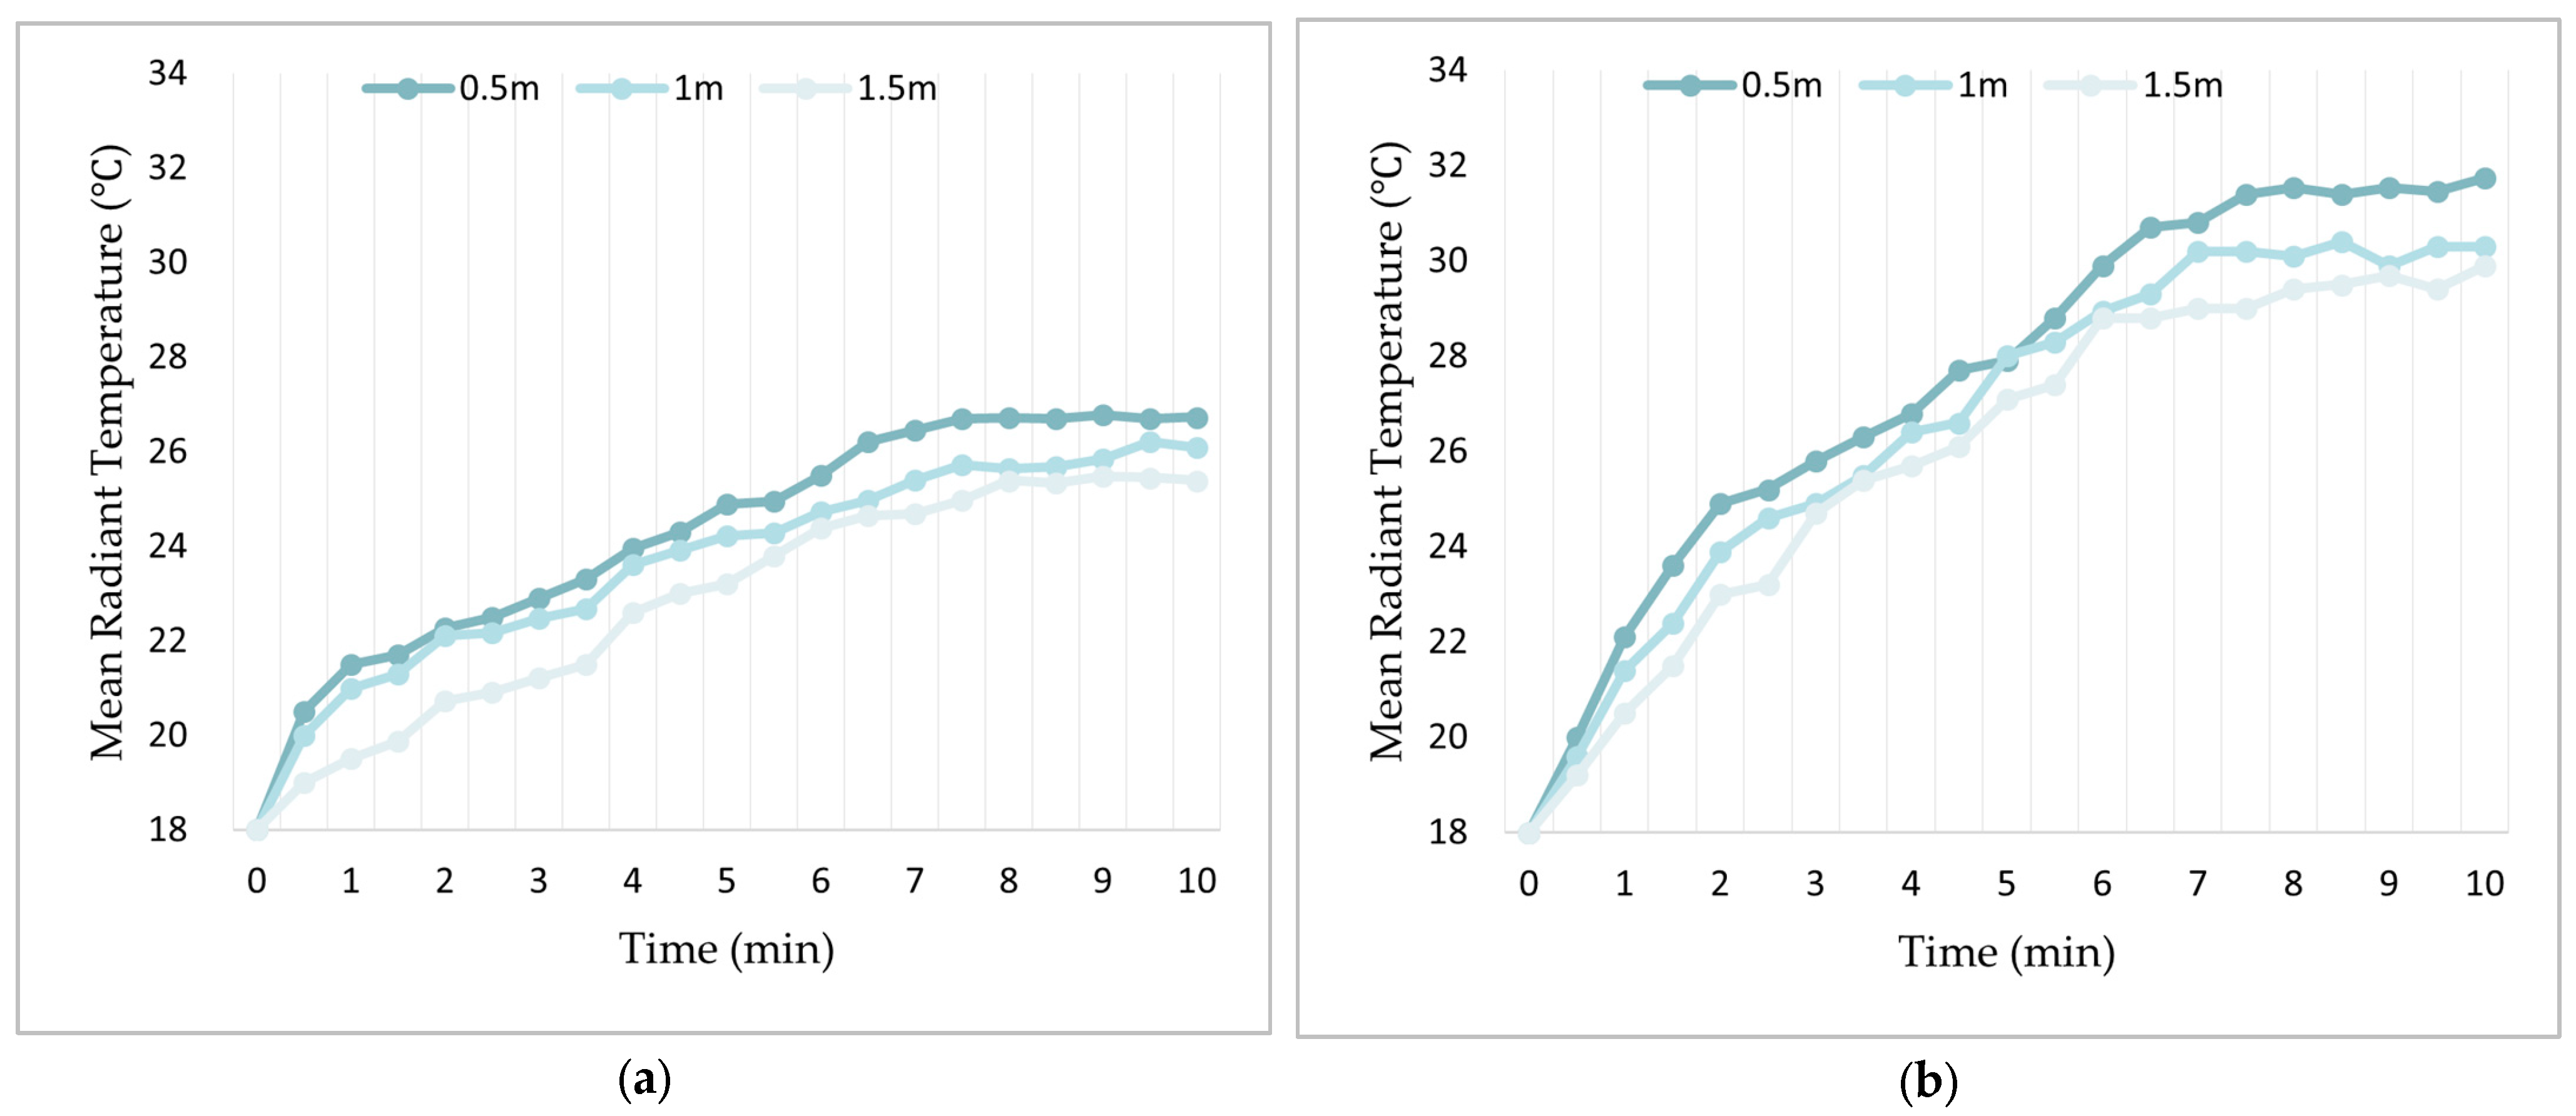
As depicted in Figure 5, after the 7th minute, fluctuations in the mean radiant temperature (MRT) surrounding the participants stabilized within a range of ±0.5 °C, indicating that the thermal radiation environment around the participants had reached a relatively steady state. Accordingly, the experimental duration was set to 10 min to ensure the collection of adequate valid evaluation data. Furthermore, analyses of electroencephalogram (EEG) data and subjective questionnaire results revealed distinct response patterns: when the infrared heater was positioned 0.5 m from the participants, the elevated MRT elicited significant discomfort in some individuals, impeding their ability to complete the experiment. Conversely, at a distance of 1.5 m, no statistically significant differences were observed in either subjective or objective assessment outcomes among the participants. Notably, at a distance of 1 m, the participants’ subjective responses demonstrated sensitive and meaningful changes corresponding to changes in experimental conditions. Even under the maximum power setting, all participants maintained an acceptable level of thermal comfort. Consequently, a distance of 1 m between the infrared heater and the participants was selected for subsequent experiments.

2.1.3. Laboratory Layout

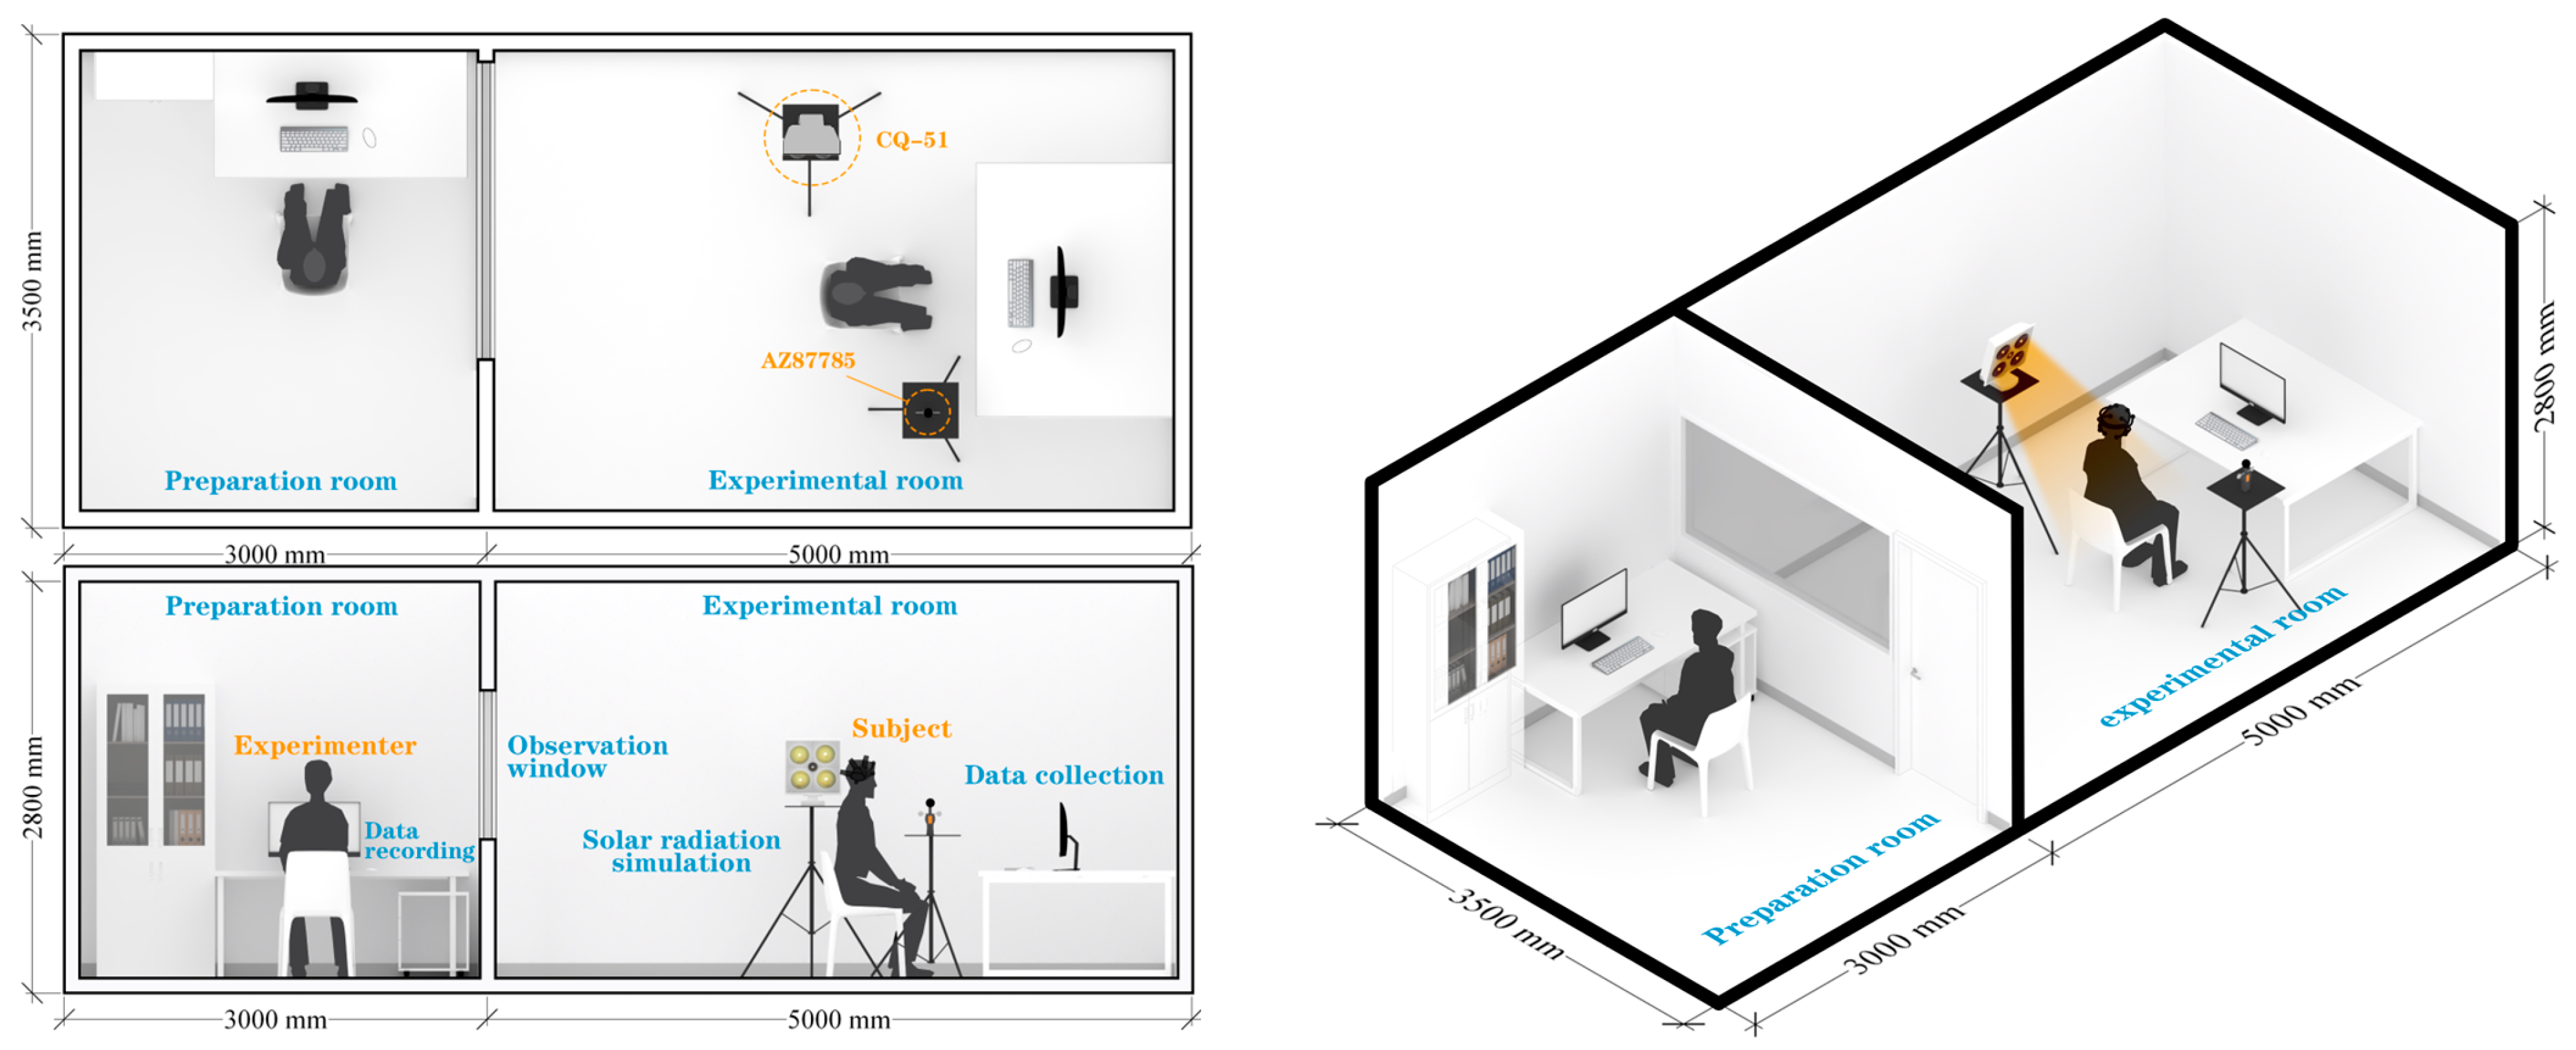
The experiment was conducted from 25 April 2024 to 30 June 2024. In order to facilitate the laboratory layout and the operation of experimental equipment, the experiment was carried out at the laboratory at Qingdao University. Figure 6 shows the layout of the laboratory, which is mainly divided into two parts: a preparation room and a laboratory.
The preparation room was used for the experimental preparation and data recording. During the experiment, the subjects’ EEG data were transmitted in real time via cables and were recorded on a monitoring computer. The experimental room was only connected to the outside through a single door—with good airtightness to minimize interference from external air flow, temperature, and humidity variations—and was equipped with a temperature and humidity control system. The experimental room’s temperature and humidity were set with reference to the typical measured averages of Qingdao in May, ensuring the subjects’ comfort under the initial experimental operating conditions. Throughout the experiment, the experimental room was fully enclosed, and only one subject was present at a time to ensure a relatively stable wind speed (controlled at <0.1 m/s) and noise level (controlled at <40 dB). The specific settings of the initial physical environment parameters are presented in Table 3.

2.2. Participants

The required sample size for the experiment was calculated using GPower 3.1 (HHU, Düsseldorf, Germany). As this study employed a mixed-design experiment involving two factors, a repeated-measures ANOVA was selected as the statistical method to analyze between-subject and within-subject interactions, with an effect size set to f = 0.25. The number of between-subject variables and within-subject variables was defined as 2 and 7, respectively. Power analysis indicated that to achieve a statistical power of 0.9, 22 participants per group were required (resulting in a total of 44 participants). A total of 60 participants were recruited, including 30 elderly people (aged 62–75 years) and 30 young people (aged 24–30 years); their detailed demographic information is presented in Table 4.
Participants in the elderly group were clinically healthy, with no history of severe cardiovascular diseases, metabolic disorders, or neurological diseases that affect thermoregulation. They had clear communication abilities and could complete the entire study either independently or with minimal assistance. Additionally, all participants in the elderly group were long-term nursing home residents (with an admission duration of at least 2 years) and were capable of performing activities of daily living independently or with only slight assistance from caregivers. Participants in the young people group were full-time undergraduate and graduate students from the College of Architecture and Urban Planning, Qingdao University of Technology, who had resided in Qingdao for at least 2 years.
To ensure the rigor of the study and the reliability of data, all participants received standardized guidance on the experimental procedures and were required to comply with pre-experimental behavioral norms: ensuring adequate sleep before the experiment and refraining from behaviors that might affect nervous system function (e.g., alcohol consumption, staying up late, and drinking coffee) within 24 h prior to the experiment. Additionally, since all the elderly participants were recruited from elderly care institutions, to minimize the number of visits by the subjects as much as possible, we adopted a strategy of controlling thermal resistance through unified clothing to create the planned range of thermal sensations. Under all experimental conditions, participants were required to wear clothing of a standardized type. The thermal resistance of the clothing was determined with reference to the recommended values specified in the Chinese national standard GB/T 50785 [41,42,43], encompassing the following components: short-sleeved tops (0.05–0.15 clo), shorts (0.06–0.12 clo), thin, short socks (0.02–0.05 clo), and closed leather shoes (0.02–0.04 clo). If the clothing brought by participants did not comply with the above specifications, they were requested to change into size-matched, standardized clothing provided by the laboratory.

2.3. Procedure of Experiments

Figure 7 shows the complete process of the infrared radiation experiment. In the preparation stage, the subjects were informed of the experimental process, filled in basic information, and wore EEG detection devices. The formal experiment consisted of two parts. In experiment stage I, the subjects proceeded under experimental condition S0. This phase was intended to collect the subjects’ initial subjective evaluations and EEG data, facilitating a comparison with subsequent working conditions. In experiment stage II, the subjects underwent the remaining 6 working conditions. To avoid data bias caused by varying adaptability or accumulated fatigue, the experiment followed a Latin square design. Through a randomized and balanced arrangement, this design ensured that each condition appeared with the same frequency in different sequential positions, thereby eliminating systematic errors caused by the experimental sequence [44]. Under each working condition (S0–S6), the subjects needed to undergo 10 min of infrared radiation, during which EEG signals were collected synchronously. After the radiation period ended, the experimental assistant removed the EEG equipment and replenished the experimental consumables (physiological saline) to maintain the conductivity of the EEG electrodes. Between adjacent working conditions, we referred to the rest time setting specified in [45]. After each working condition, the subjects had a 10 min rest period to fill out subjective questionnaires and replenish fluids.

2.4. Data Collection and Processing

Subjective questionnaires and objective EEG readings were used to assess participants’ mental states and comfort. This research was performed in time frames designated to compensate for circadian rhythms, confirming the research. All individuals were informed about the experiment and provided their signed consent, maintaining the anonymity of the personal and experimental data.

2.4.1. Subjective Questionnaires

The subjective evaluations of the subjects were conducted by means of filling out questionnaires. As shown in Table 5, this study selected four basic comfort evaluation scales to assess the impact of different working conditions on the subjects. In the evaluation of the thermal environment, we chose the commonly used thermal sensation vote (TSV) and thermal comfort vote (TCV) [46]. In addition, traditional thermal environment evaluation indicators (TSV, TCV) can only assess the body’s thermal sensation and comfort. Although electroencephalography (EEG) can objectively monitor the psychological state of subjects, it lacks corresponding subjective evaluation support. Due to the decline in physiological functions, the fluctuations in the mental state of the elderly under thermal radiation may differ from those of young people. Therefore, this study additionally designed a relaxation sensation vote (RSV) and alertness level vote (ALV) to subjectively and objectively verify the EEG, which not only improved the credibility of the results but also met the need to explore the comprehensive impact of the infrared radiation environment. The TSV, TCV, and RSV were evaluated by using the modified ASHRAE 7-point scale; the ALV was evaluated by using the modified Karolinska Sleepiness Assessment (KSS) [47]. The Karolinska Sleepiness Assessment (KSS) is a tool for assessing the degree of daytime sleepiness in individuals. It measures sleepiness via a 9-point Likert scale and can effectively evaluate the mental state of people. It has also been applied in the research on thermal environments [48].

2.4.2. EEG Signals

The EEG device selected was the EPOC+ developed by Emotiv (Emotiv Systems, San Francisco, CA, USA). This device is based on the 10/20 system by IFCN [49], and it contains 2 reference channels (DRL and CMS) as well as 14 EEG measurement channels. These channels were located in the four main regions of the brain, namely the frontal lobe (AF3, F7, F3, FC5, FC6, F4, F8, and AF4), the parietal lobe (P7, P8), the temporal lobe (T7, T8), and the occipital lobe (O1, O2) [50]. The sampling rate of the EPOC+ device was set to 128 Hz in this experiment, which corresponds to a sampling interval of 0.0078 s. With the device’s accompanying Emotiv PRO (Emotiv PRO Standard version) software, the EEG signals were recorded and stored in real time.
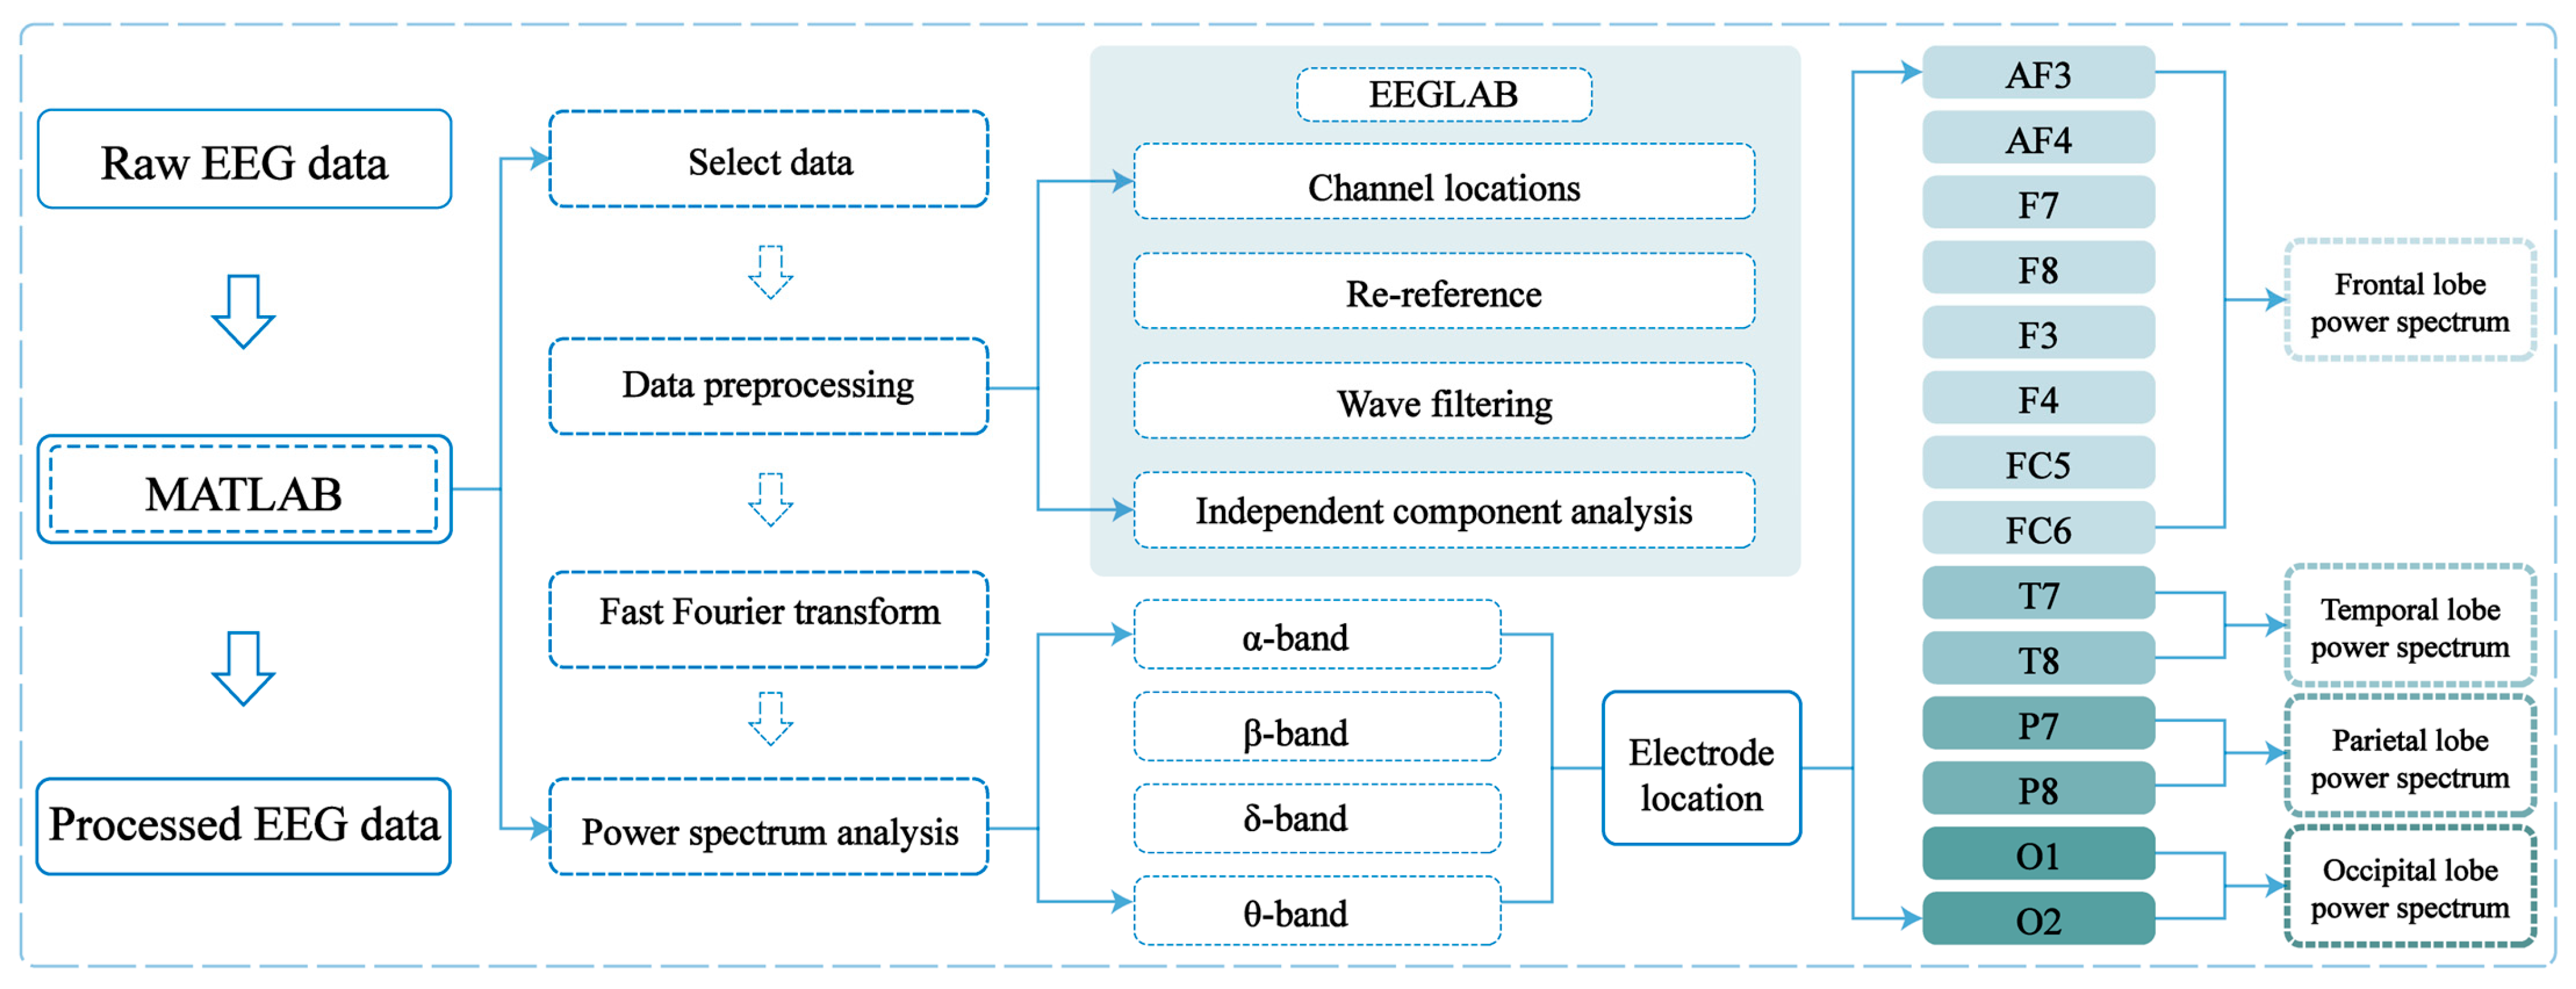
The measured EEG data were preprocessed using the EEGLAB plug-in of MATLAB R2022b. Figure 8 shows the analysis process of EEG data [51,52]. First, we manually checked the EEG signals to screen for abnormal spikes or oscillations and eliminated outliers caused by poor electrode contact, muscle twitches, etc. Under physiological conditions, the amplitude range of scalp EEG in healthy adults is 15–150 microvolts (with an average of 30–80 microvolts). In this study, amplitudes exceeding 100 μV, transient spikes exceeding 150 μV due to poor electrode contact, and high-frequency oscillations (>30 Hz) exceeding 80 μV caused by muscle twitches were all included in outlier removal [53]. Second, we used a band-pass filter to remove low-frequency (0.5 Hz and below) and high-frequency (48 Hz and above) components from the EEG signals. This step could reduce background noise and unnecessary high-frequency interference, while retaining the frequency range of 0.5–48 Hz, which covers the δ, θ, α, and β bands related to the thermal comfort assessment. Third, we employed Independent Component Analysis (ICA), a technique that utilizes the statistical independence of source signals, to decompose multi-channel EEG data into independent components. Artifacts such as electrooculography (EOG, originating from eye movements) and electromyography (EMG, originating from muscle contractions) were identified and removed through their characteristic waveforms, without interfering with effective brain activity. Finally, we converted the time-domain signals to the frequency domain using Fast Fourier Transform (FFT). To decompose the spectral power values of four bands (δ: 0.5–4 Hz, θ: 4–8 Hz, α: 8–13 Hz, β: 13–30 Hz), we provided quantitative data for analyzing the relationship between EEG band activities and thermal comfort, as shown in Equation (2).
P t o t a l = n = i j | X n | 2
P t o t a l represents the total power of the EEG, i represents the lower limit of the frequency, j represents the upper limit of the frequency, and X n represents the frequency domain sequence.
The total energy of 14 electrodes for each subject was calculated through the above formula. Since the order of magnitude of the data was relatively large, logarithmic processing was carried out on it, as shown in Equation (3).
P t o t a l = l o g 10 ( P t o t a l )
P t o t a l represents the EEG logarithmic power; P t o t a l represents the total power of EEG.

3. Results

3.1. Results of Subjective Evaluation

The data analysis was conducted using the SPSS 24 (IBM, SPSS Inc., Chicago, IL, USA) software. First, we conducted a normality test on the data. Since the sample size of the research data was greater than 50, the Kolmogorov–Smirnov test method was used. The results are shown in Table 6. It can be seen that the p-values of all subjective questionnaires demonstrated significance (p < 0.05), which means that the null hypothesis (data normality) was rejected. All the data did not possess the characteristic of normality, which means that the conventional analysis of the variance method was not applicable. Subsequently, the homogeneity of the variance of the data was tested. The test results are shown in Table 7. The p-values of the TCV and ALV for the elderly and those of the TSV, TCV, and RSV for the young people were less than 0.05, which confirmed that the data in this study had heteroscedasticity. This means that the conventional analysis of variance method might obtain inaccurate results.
Given the violations of the normality and homogeneity of the variance assumptions in the data of this study, the Generalized Estimating Equations (GEEs) approach was adopted for statistical analysis. This method offers distinct advantages: first, it is suitable for handling correlated data—each participant in this study was required to complete tests under multiple experimental radiation condition combinations, generating repeated-measures data, and GEEs can effectively capture the inherent correlation of such data; second, it does not require the data to meet the prerequisites of the normality and homogeneity of variance, thus avoiding the result bias caused by the violation of assumptions in traditional parametric test methods. Most importantly, GEEs can reliably estimate the main effects of core variables and the interaction effects between core variables, which plays an irreplaceable role in clarifying the “age-related differences in subjective evaluations”—the core focus of this study.
The results of the GEE analysis are presented in Table 8. At the main effect level, the age, radiation intensity, and radiation area all exerted significant impacts on the subjective evaluation indicators (e.g., thermal sensation vote [TSV], thermal comfort vote [TCV], and relaxation sensation vote [RSV]) (p < 0.05). At the interaction effect level, the interaction effects of “age × radiation intensity” and “age × radiation area” were both statistically significant (both p < 0.05).
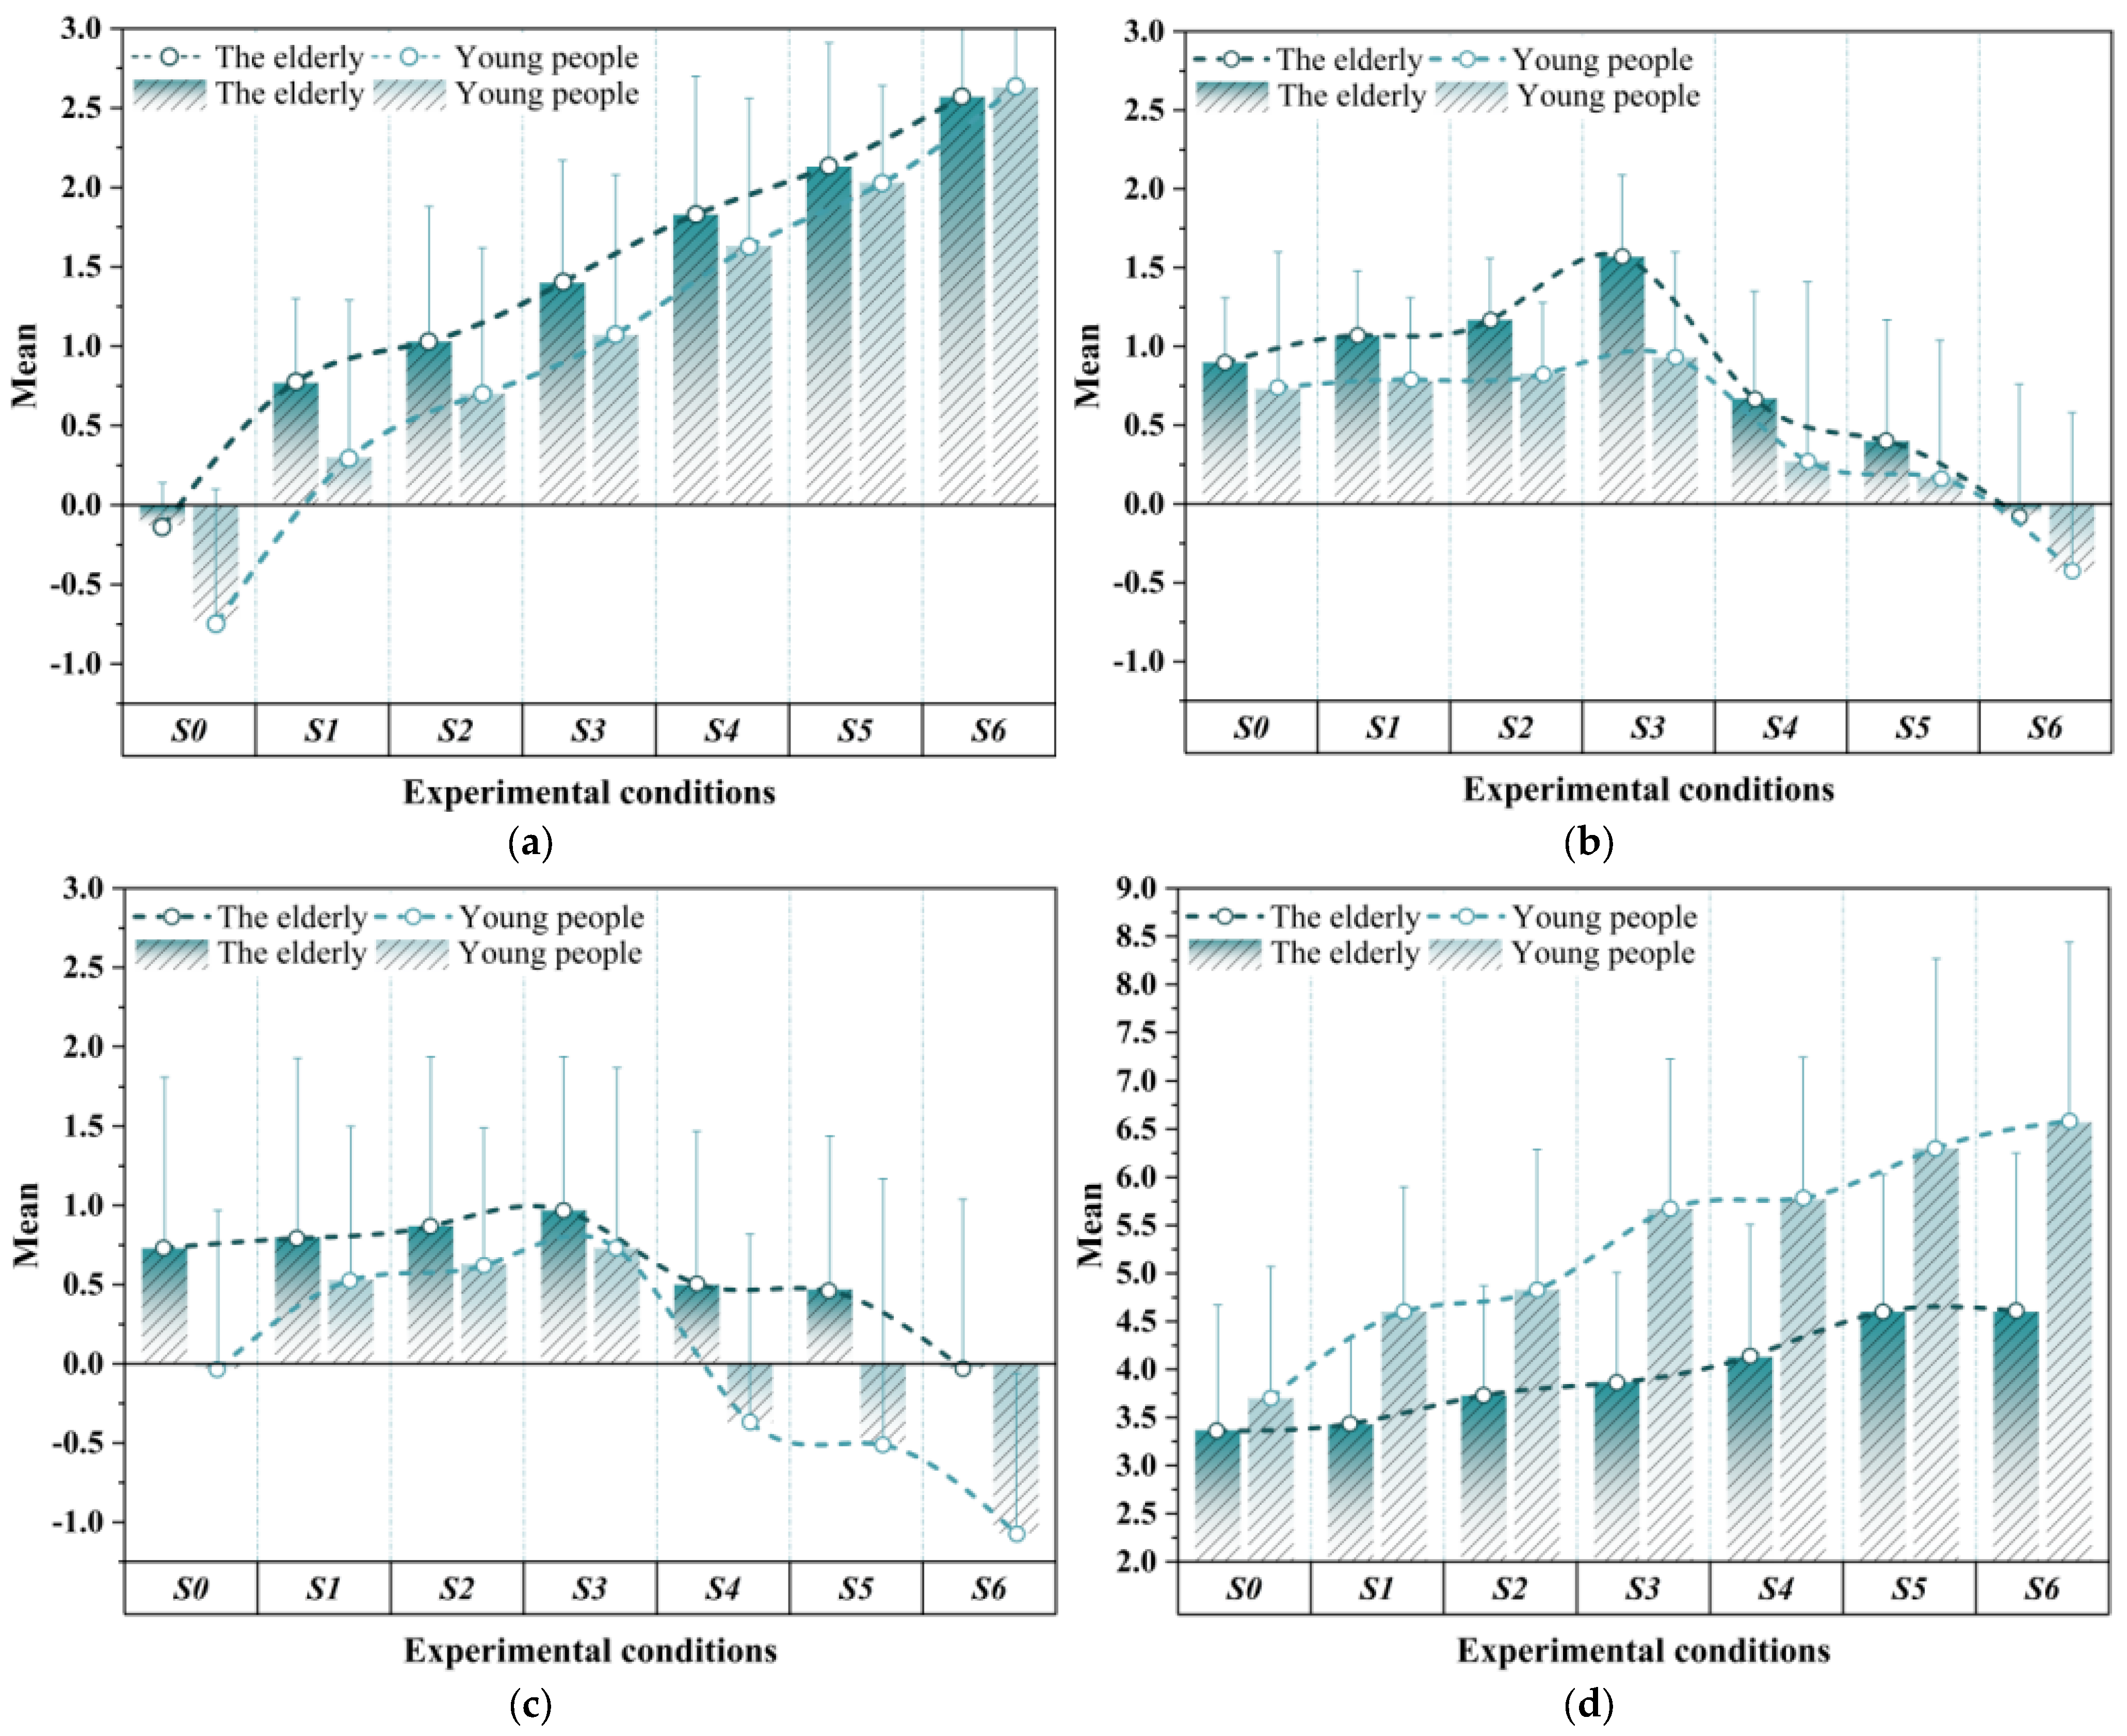
A further simple effect analysis showed that under the “high radiation intensity + large area” condition combination, the TSV scores of the elderly were significantly lower than those of young people, with a mean difference of 1.32 (p < 0.01), while under the “low radiation intensity + small area” condition combination, the TCV scores of young people were significantly higher than those of the elderly, with a mean difference of 0.95 (p < 0.05). The above results directly confirm that there are significant differences in the subjective evaluations between the two groups of participants under different radiation condition combinations. To more intuitively present the complex relationships and inter-group differences revealed by the GEE analysis, Figure 9 shows the variation trends of subjective scores of different age groups under different radiation intensity and radiation area conditions.

3.1.1. TSV

As illustrated in Figure 9a, the mean of young people’s overall scores was about 0.5 scale points lower than that of the elderly. The elderly expressed significantly higher thermal sensations during low-power conditions (S1–S3). As the irradiated areas enlarged, both groups’ scores increased; the elderly group’s score remained approximately 0.5 higher. Under high-power conditions (S4–S6), scores also peaked, with the elderly score increased by 16.39% (S4–S5) and 20.66% (S5–S6), and the young score increased by 24.54% and 29.56%, respectively. This suggests that young people were more sensitive to the high-intensity infrared radiation condition.

3.1.2. TCV

Figure 9b shows the research on the thermal comfort of subjects under different experimental conditions. Overall, the elderly indicated higher thermal comfort scores under all conditions. Under low-power conditions (S1–S3), subjects in the young people group did not show a decline in scores, while the elderly’s scores varied more. S3 was the peak for both groups, with the elderly’s scores at 1.52, some 0.5 units higher than young people’s scores at 0.96. With low infrared radiation, the elderly were more affected by the irradiation area. Under extreme conditions (S4–S6), both groups showed a significant drop in comfort scores; however, the elderly’s scores remained superior (showing that the elderly had a greater tolerance for the high-heat environment).

3.1.3. RSV

As shown in Figure 9c, overall, the score change trends of both types of subjects showed an inverted “V” shape. Under the low-power experimental conditions (S1–S3), the score change trend of the elderly was more stable than that of the young people. The scores of both types of subjects reached their maximum values at experimental condition S3, indicating that both the elderly and the young people felt the most relaxed when their whole bodies were irradiated under the low radiation intensity. Under the high-power experimental conditions (S4–S6), the scores of both types of subjects began to decline, and the decline range of young people was significantly higher than that of the elderly. In experimental condition S6, the score of the elderly was −0.03, and their relaxation sensation was at a moderate level, while the score of the young people was −1.07, showing a slightly unrelaxed state. This indicates that the young people are more sensitive than the elderly when dealing with changes in the thermal environment, and it also reflects that the elderly have a higher subjective acceptance of the relatively hot environment.

3.1.4. ALV

The differences between the elderly and the young people in terms of alertness are shown in Figure 9d. Overall, the score change trends of both types of subjects were consistent with the TSV shown in Figure 9a, but the change ranges were significantly different. In experimental condition S0, the scores of both types of subjects were relatively consistent, approximately 3.5 points, and they were in an alert state at this time. As the experimental conditions changed, the scores of the elderly increased slowly, while those of the young people increased significantly. Under most experimental conditions, the scores of the young people were approximately 1.5 scales higher than those of the elderly. In experimental condition S6, the score of the young people reached its maximum value of 6.57. At this time, the young people demonstrated a sleepy state, while the score for the elderly was 4.35 and did not increase significantly. This indicates that the young people were more sensitive in terms of alertness to changes in the thermal environment. A warm environment accelerates the sleepiness of the young people and reduces their alertness. The elderly may have been able to stay alert under higher environmental temperatures due to physiological mechanisms, such as a lower metabolic rate or different thermoregulatory mechanisms.

3.2. Results of EEG Features

Based on the results of the preliminary experiment in Section 2.1.2, we intercepted the EEG data during the stable state of the experimental conditions (7–10 min) for statistical analysis. The normality test results indicated that the EEG data across all four brain regions conformed to a normal distribution. The Pearson correlation coefficient was chosen to further test the data correlation. Table 9 shows the results of the correlation analysis. It can be seen that there were significant age differences (p < 0.05) in the average EEG logarithmic power in the frontal lobe area, the temporal lobe area, the parietal lobe area, and the occipital lobe area.

3.2.1. Brain Region Power

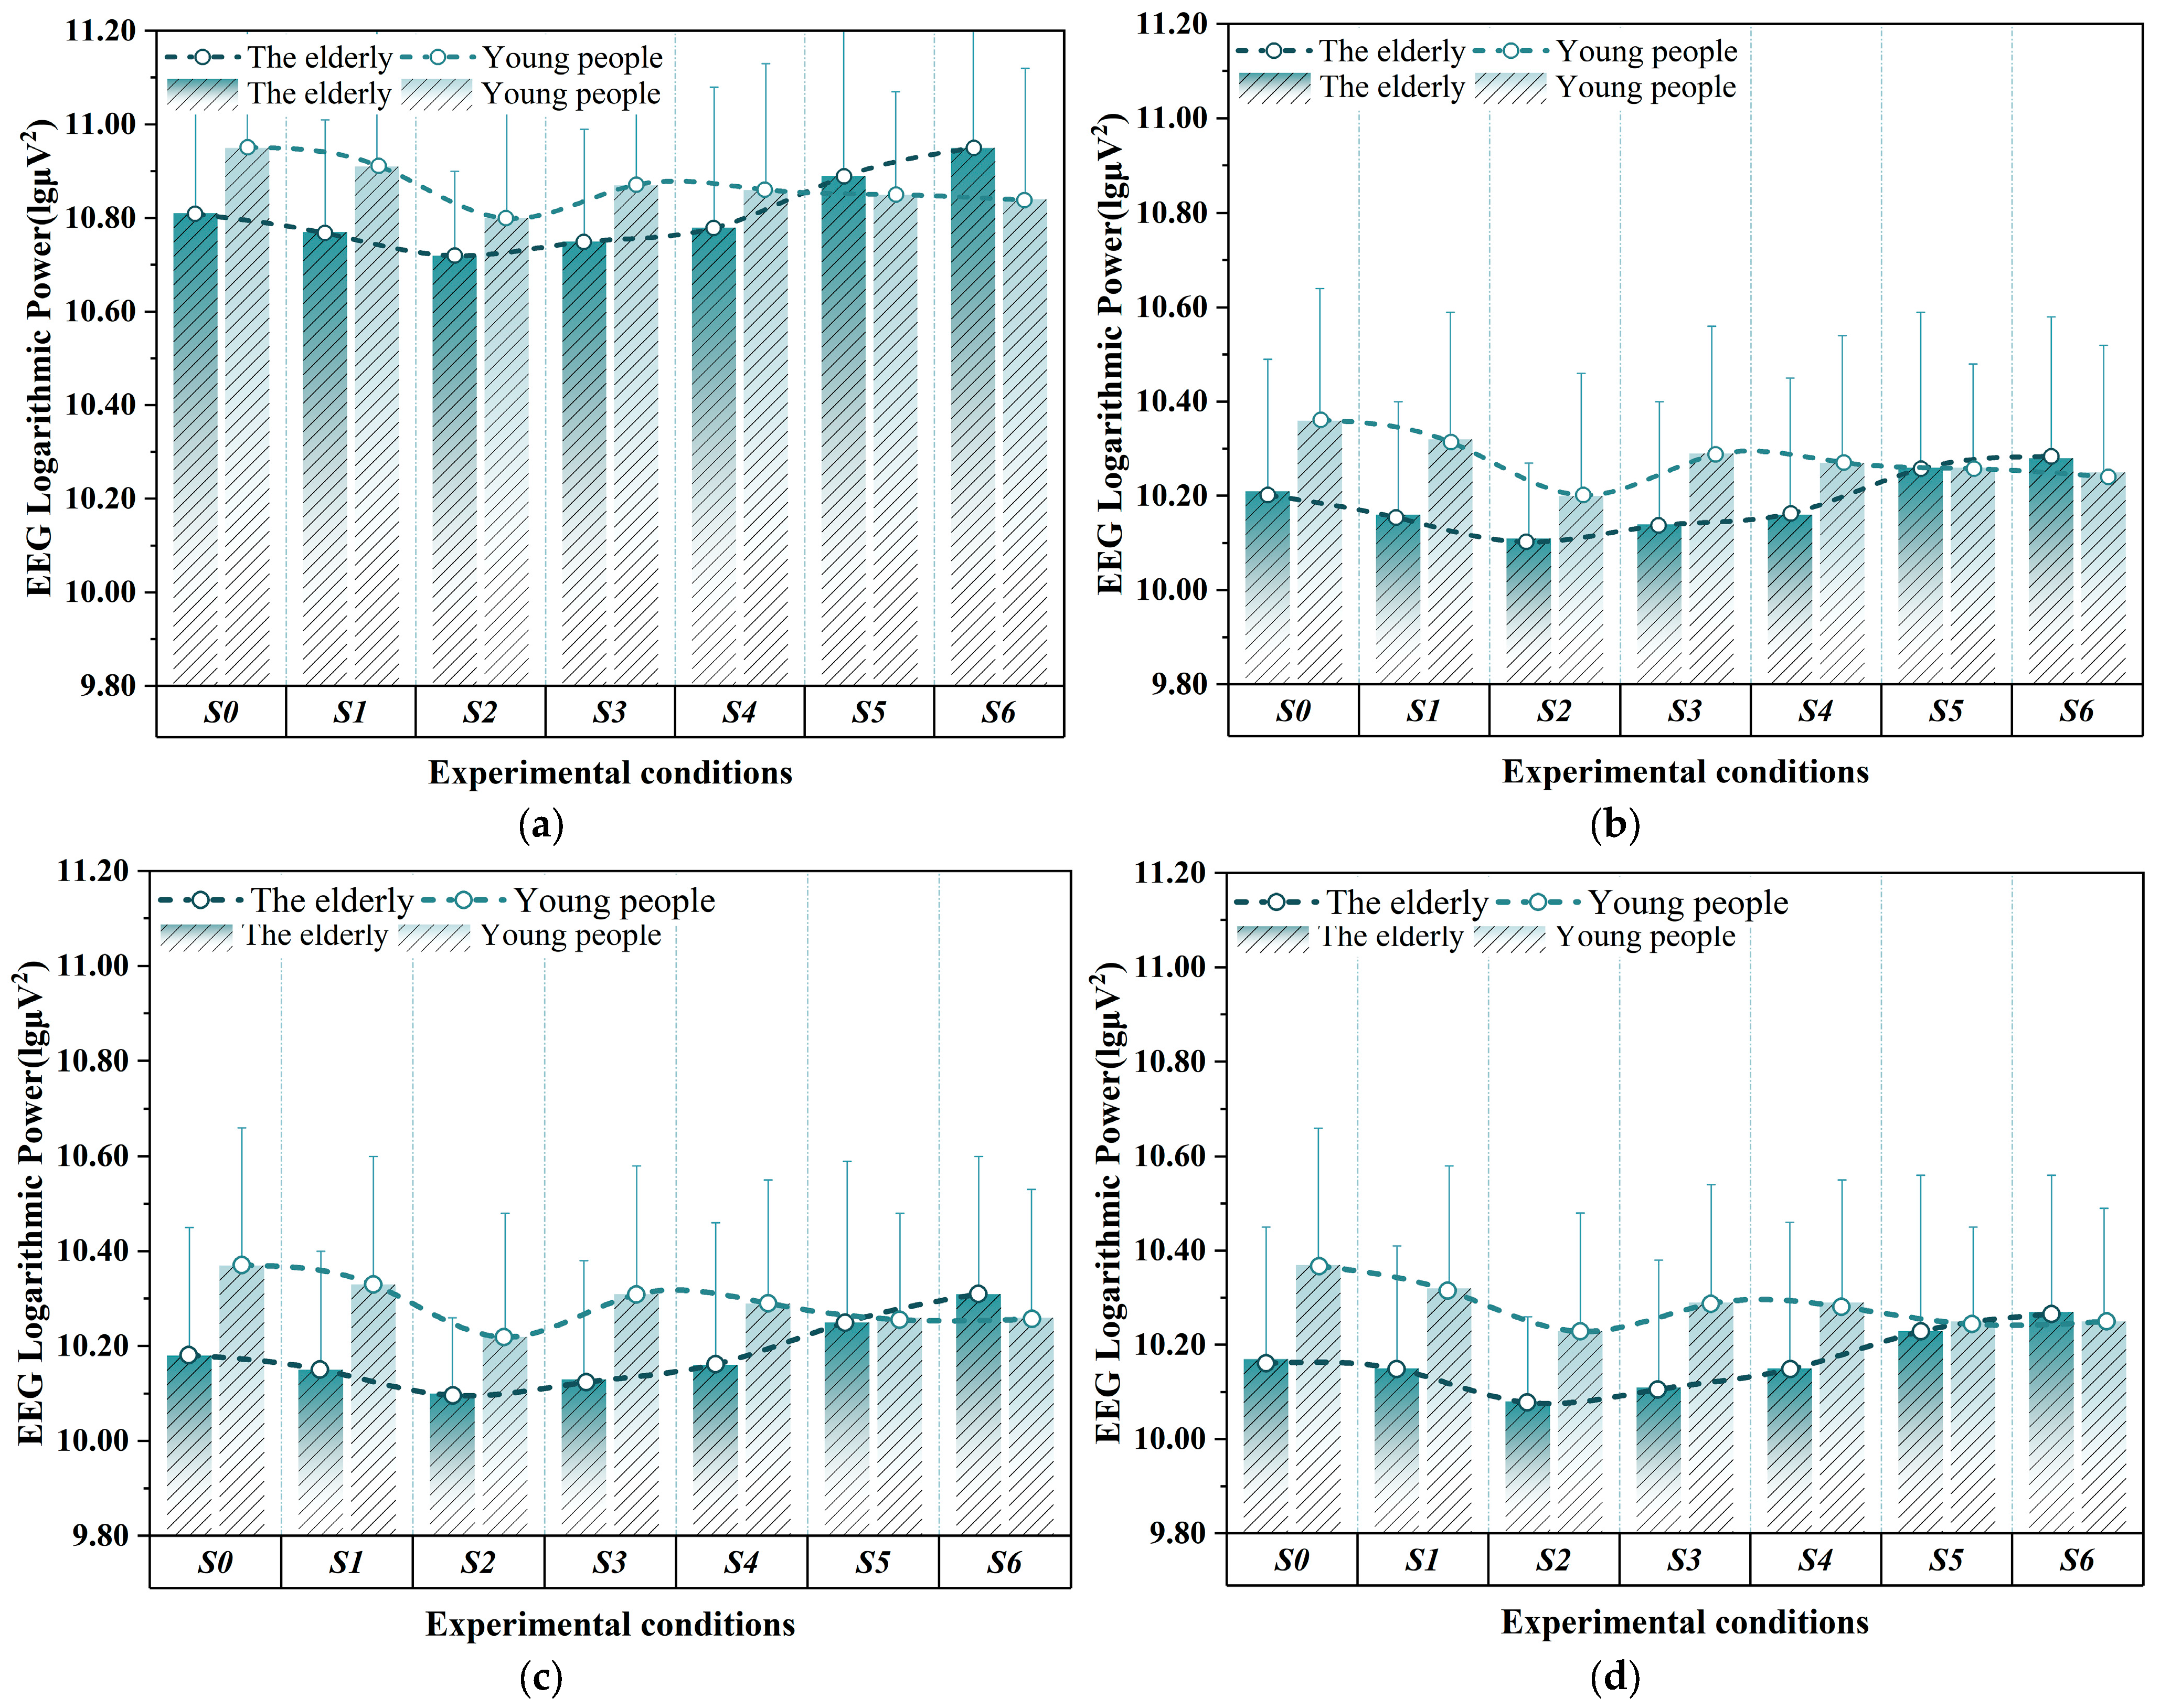
Figure 10 shows the mean changes in the EEG logarithmic power across brain regions. The frontal lobe EEG power of both the elderly and young people was higher than that of the temporal, parietal, and occipital lobes, likely due to the frontal lobe’s role in regulating thermal perception and mental state. Under low-power conditions (S1–S3), both groups exhibited a decrease followed by an increase in EEG power. Young people had a 1.0–1.5% higher average frontal lobe EEG power than the elderly, with the lowest power at S2, indicating a state of relaxation. Power increased at S3, possibly due to heat radiation affecting brain regulation.
In the high-power experimental conditions (S4–S6), with the increase in the irradiated area, the frontal lobe EEG power of the elderly slowly increased and reached a maximum value at experimental condition S6, while young people showed the opposite trend. The differences in self-regulation between the elderly and young people are the reason behind this trend. Under intense infrared radiation conditions, the elderly’s relatively weakened neural regulatory function means they must allocate more brain energy to process sensory signals related to heat stress (such as monitoring body temperature changes and adjusting basic physiological functions), whereas young people’s robust self-regulation allows them to quickly activate adaptive responses to mitigate heat-related stress, thereby minimizing the consumption of the EEG power.

3.2.2. Band Power

As presented in Section 3.2.1, the analysis revealed significant age-related differences in the mean EEG logarithmic power across the frontal, temporal, parietal, and occipital regions under each experimental condition; to further explore age-specific changes in the EEG band activity, a repeated-measures analysis of variance (repeated-measures ANOVA) was therefore conducted for the α, β, δ, and θ bands in both the elderly and young people. The results of the ANOVA showed that under different experimental conditions, in the EEG logarithmic power of each brain region in the two groups of subjects, only the logarithmic power of the δ band EEG in each brain region of the elderly had significant differences, while the logarithmic power of the δ band EEG in different brain regions of the young people had no significant changes. The detailed results of this analysis are shown in Table 10.
It can be seen from Figure 11 that the power of the δ band in the four brain regions of the elderly reached its lowest value in experimental condition S3. This change trend demonstrates symmetry with the change trend of the TCV scores shown in Figure 9b. When the elderly’s thermal comfort score was the highest (S3), the power of the δ band was the lowest, and the elderly were in the most comfortable state at this time. Under the high-power experimental conditions (S4–S6), as the irradiated area increased, the power of the δ band of the elderly also gradually increased and reached their maximum values at S6, when the elderly’s comfort score was the lowest. In contrast, the young people did not show an obvious change trend. Moreover, since the EEG power in the frontal lobe area of the elderly was significantly higher than that in the other three brain regions, in order to further study the variation characteristics of the EEG in the frontal lobe area, a correlation analysis was conducted between the eight electrodes distributed in the frontal lobe area and the experimental conditions. Table 11 lists several electrodes that showed significant correlations with the experimental conditions. It is worth noting that these electrodes showing significant differences were all distributed in the right frontal lobe area of the brain. It can be seen that the right frontal lobe area of the brain plays a relatively important role in the elderly’s perception of the thermal environment.

3.3. Comprehensive Evaluation Between EEG and TCV

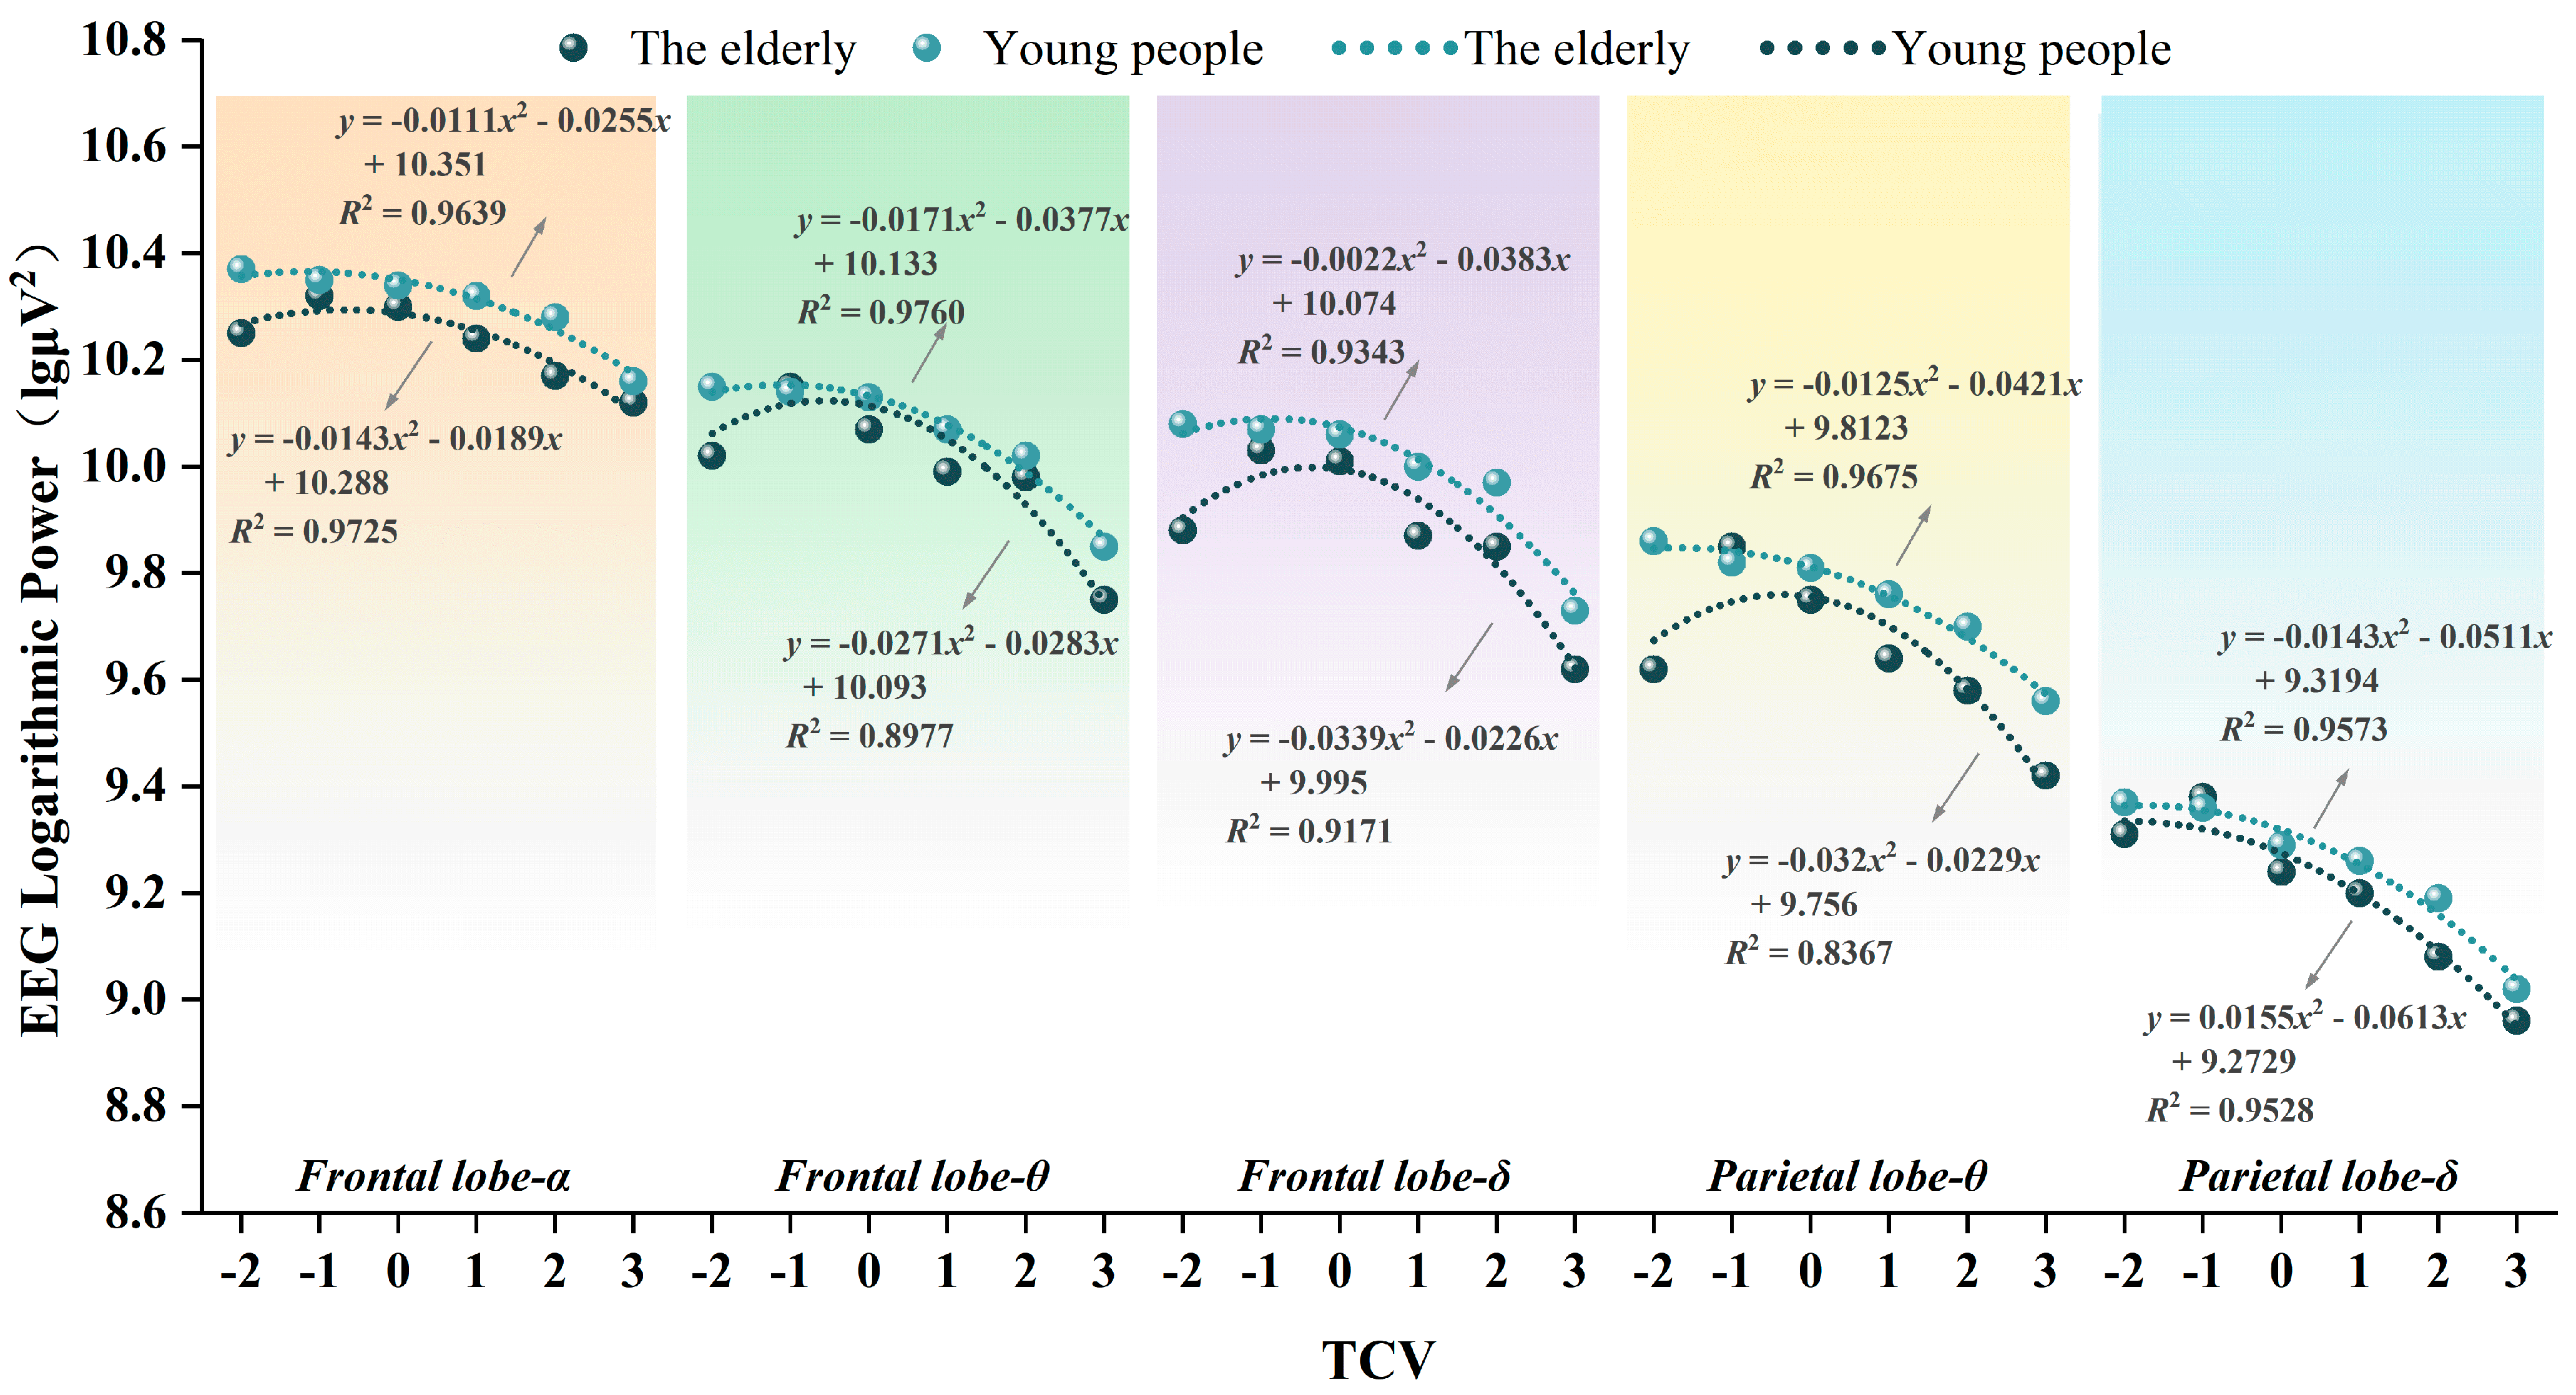
A correlation analysis of the TCV and the average logarithmic (log) of the electroencephalogram (EEG) power in separate brain regions was conducted. As shown in Table 12 above, further analysis showed that the TCV was strongly correlated to the α, δ, and θ bands of the frontal lobe and the δ and θ bands of the parietal lobe. To analyze the correlation between the EEG power and thermal comfort, the EEG power of distinct frequency bands was regressed with the TCV. The data exhibited a parabolic scatter plot correlating with the TCV score variations. Comfort increased with thermal sensation up to a point but subsequently decreased. The fitting was performed by means of a quadratic polynomial, as illustrated in Figure 12. The order of the power values was as follows: frontal lobe-α > frontal lobe-θ > frontal lobe-δ > parietal lobe-θ > parietal lobe-δ. The EEG power of the elderly first increased and then decreased as the scores rose. In both age groups, under an adverse thermal environment with a TCV score of −2 (discomforting), low EEG power occurred due to brain inhibition. Conversely, a value of −1 (mildly uncomfortable) sparked a degree of nervous system activity, as shown by the rise in EEG power. With improved comfort, the EEG power decreased monotonically across both age groups and was minimal at a score of three (highly pleasant). The average EEG power discrepancy found in young people was 1.0–1.5% higher than that in the elderly. The frontal lobe α band EEG power was significantly larger than that of other EEG bands, suggesting that this band is a key indicator of thermal comfort in all age groups.

4. Discussion

4.1. Subjective Evaluations

4.1.1. Evaluation of Thermal Environment

Figure 9a,b display two common types of subjective questionnaires in thermal environment evaluation. Under the low-radiation working condition, the scores of the young people on the two questionnaires were approximately 0.5 scales lower than those of the elderly. From a physiological perspective, the elderly exhibit weaker temperature regulation than young people, and their responses to cold-induced vasoconstriction and heat production are also weaker. These physiological changes led to the elderly perceiving higher temperatures in the same thermal environment [54,55]. Under the high-radiation experimental conditions, although the thermal comfort scores of both types of subjects were decreasing, the change range of the elderly was smaller than that of the young people. When the young people began to feel uncomfortable, the elderly still felt relatively comfortable. This was similar to the research results reported in [56]. The elderly felt hotter in the same thermal environment, but at the same time, they had a higher evaluation of thermal comfort. This may be due to the weakened thermal regulation responses of the elderly under high-heat environment exposure [57] or due to the long-term living habits or physiological acclimatization, resulting in a greater adaptability to warmer environments [58,59,60].

4.1.2. Evaluation of Mental State

As shown in Figure 9d, as the radiant thermal environment changes, ALV scores differ by age, getting larger and larger. The young people became more and more sleepy, while the elderly remained awake. This is consistent with the research results in [61]. In a suitable environment, the elderly have the ability for sustained attention comparable to or even better than that of young adults. In this study, the continuous thermal radiation stimulation increased the EEG power in the elderly, enabling them to maintain good alertness when experiencing thermal stimulation. The EEG changes shown in Figure 10 indirectly explain this phenomenon. In the elderly, because the baseline neural activity was weakened (for example, gamma oscillation power declined with age [62]), this infrared radiation may have triggered compensatory activation. As a result, under high infrared radiation conditions, the logarithmic power of the electroencephalogram in various brain regions in the elderly increased with the increase in the radiation area, while that in young people decreased. Moreover, it could be seen from the relaxation sensation vote (RSV) scores shown in Figure 9c that the elderly remained in a relatively relaxed state under different radiant thermal environments, while the scores of the young people fluctuated significantly. This may be related to their delayed thermoregulatory threshold temperature. The triggering thresholds of thermoregulatory responses such as vasodilation, vasoconstriction, sweating, and shivering all changed, making the response pattern of the elderly in a hot environment relatively stable [63]. The metabolic rate of the elderly is lower than that of young people, which means that they are weaker in their ability to generate heat. Therefore, they may have been more inclined to seek a warm environment to stay comfortable [12]. Thus, in a comfortable radiant thermal environment, the elderly were more likely to feel relaxed and remain mentally alert.

4.2. EEG Features

The spectral power change in the EEG is closely related to individuals’ perception and adaptation to the thermal environment, reflecting its influence on individuals’ thermal sensation, emotional states, and physiological responses [29]. As shown in Figure 7, the EEG power in the frontal lobe significantly exceeded that in other brain regions. This was consistent with the research findings of [64,65]. Under different heat exposures and thermal stimulations, there were significant differences in the power density in the frontal lobe. The prefrontal cortex takes up roughly 29% of the overall brain area and represents the most developed area of the brain, regulating multiple processes within the brain, including cognition, thought, and emotion [66]. The frontal lobe exhibited significantly higher EEG power than the other three brain regions. Notably, electrodes AF4, F4, F8, and FC6, located in the right prefrontal cortex, demonstrated substantial changes in EEG power. Research indicates that the right dorsolateral prefrontal cortex (DLPFC) plays a key role in processing pain-related perceptions and emotional responses to pain [67]. In this experiment, infrared radiation was applied as a direct heat source to the human body, causing thermal pain sensations and influencing the subjects’ moods; in this case, the right prefrontal lobe may have down-regulated the activity of brain regions related to pain to reduce pain perception. These findings may account for the existing association between the right prefrontal cortex and thermal comfort, whereby it regulates emotional responses that may modulate an individual’s perception of thermal stimuli [68]. In addition, the analysis of brain region-specific frequency bands revealed that under different infrared radiation conditions, the δ band EEG power of various brain regions in the elderly exhibited significant differences, whereas no such variation was observed in young people. As the δ band is well-documented to be closely associated with sleep depth, brain inhibitory states, and cerebral metabolic activity, this finding suggests that despite the elderly maintaining relatively favorable subjective comfort evaluations under high-intensity infrared radiation, the elevated EEG logarithmic power of the δ band provides objective evidence that they may be undergoing passive neural regulation induced by heat stress.

4.3. Correlation Between Subjective Evaluation and EEG Features

By comparing subjective evaluations and EEG characteristics, it became evident that the subjective evaluations of young people were more variable than those of the elderly under varying infrared radiation conditions. Simultaneously, the EEG power in the elderly group was more consistent. Notably, while the elderly experienced greater heat stress during exposure, no more severe symptoms or emotional distress were reported in the elderly compared to young people. This phenomenon aligned with existing research that indicates a discrepancy between physiological responses and subjective evaluations [56,69]. On the one hand, due to an age-related decline in sensory abilities—including interoceptive awareness, the core ability of the human body to perceive and interpret internal physiological states—interoceptive awareness includes the recognition and judgment of bodily signals such as an elevated core body temperature and palpitations caused by heat stress. Studies have confirmed that with the increase in age, the sensitivity of the human internal sensory system shows a downward trend. When facing thermal stimulation, the thermal sensation scores of the elderly were generally about 0.5 scale units lower than those of young people, and even at the same core body temperature level, their subjective thermal discomfort was significantly lower [23]. This kind of perception delay and reduced sensitivity were particularly obvious when the elderly were exposed to extreme thermal environments, indicating a decline in the signal recognition and judgment capabilities of the elderly’s internal sensory system [70,71]. Another possibility stemmed from psychological adaptation and reporting bias. After long-term life experiences, the elderly developed a higher psychological threshold for discomfort. They may have actively downplayed or failed to report discomfort due to the perception of “not wanting to cause trouble”. This reporting style was not only influenced by a personal mentality but was also closely related to sociodemographic factors, such as educational levels and cultural backgrounds [72]. It is likely that this comprehensive effect of reduced sensory sensitivity and reporting bias further separated the subjective evaluations of the elderly from their objective physiological states in this study.
The frontal lobe EEG power correlated with the thermal comfort (TCV) curve, as shown in Figure 12. Among the EEG bands significantly correlated with thermal comfort values (TCVs), the power values in the α and θ bands of the frontal lobe were the highest. Regardless of age, the fitting degrees of the curves remained above 0.96, indicating a strong correlation. This consistency corroborates previous studies demonstrating that α and θ bands can effectively predict thermal comfort [73,74]. The frontal lobe θ band fitted best for young people but worst for the elderly. Hence, the frontal lobe θ band predicted thermal comfort in young people, yet it was not a good predictor of the elderly’s thermal comfort.

4.4. Application and Limitations

Experimental findings revealed that the elderly exhibited a smaller magnitude of comfort degradation in infrared radiation environments compared to young people. Notably, even when young people perceived discomfort, the elderly maintained relative comfort and demonstrated superior mental stability in warm infrared radiation environments. These observations underscored the potential for integrating infrared thermal environment design with the psychological needs of the elderly in elderly care facilities. For instance, cognitive training zones and reading areas should be maintained at a stable medium–low infrared radiation level to capitalize on the elderly’s inherent advantage of sustained attention under stable infrared radiative conditions. Conversely, rehabilitation activity spaces may benefit from a moderate elevation in infrared radiation levels; by leveraging the elderly’s enhanced tolerance to higher infrared radiation, this approach mitigates cold-induced decreases in willingness to engage in activities, thereby facilitating the establishment of personalized infrared thermal environment regulation strategies for elderly care institutions.
Furthermore, electroencephalography (EEG)-based analyses indicated that the frontal EEG alpha wave activity exhibited strong consistency in predicting thermal comfort across all age groups (goodness-of-fit > 0.96), whereas the EEG theta wave activity was only applicable to young people and demonstrated relatively poor predictive validity for the elderly. In subsequent research, a combined evaluation criterion of “subjective scales + frontal EEG alpha wave power” is recommended to avoid over-reliance on singular physiological metrics or age-specific assessment frameworks tailored exclusively to young people. This study has contributed a critical evaluation index for the multi-age applicability of thermal comfort assessment research and has provided neuroscientific insights to inform future interdisciplinary investigations in this field. Moving forward, efforts should focus on optimizing EEG signal processing methods, integrating relevant multimodal data (e.g., environmental parameters and physiological signals) with artificial intelligence technologies, and enhancing the accuracy and practical utility of thermal comfort assessments.
However, this study used infrared heaters to simulate the thermal effects of solar radiation and analyzed data by integrating subjective thermal comfort assessments with electroencephalographic (EEG) signals. It should be clearly noted that while infrared heaters and solar radiation share similarities in heat transfer mechanisms, the former cannot fully replicate all characteristics of the latter. First, solar radiation—an inherent natural phenomenon—is omnidirectional, whereas the radiation emitted by infrared heaters is inherently directionally constrained. Second, due to equipment limitations, this study only set two infrared radiation conditions with specific intensity levels; in contrast, solar radiation intensity in real-world environments varies over a much wider range, as it is dynamically influenced by factors like the solar altitude angle, atmospheric turbidity, and cloud cover. Therefore, measuring and controlling the mean radiant temperature (MRT) will remain essential for eliminating relevant confounding effects in future research. Notably, this gap in the MRT consideration is common across the general literature and is not a limitation unique to any single study. Air temperature alone is insufficient to capture all environmental influences in thermal analysis—unlike the MRT, it cannot reflect the radiant heat exchange between the human body and surrounding surfaces. Neglecting MRT measurements and control in future work will lead to incomplete thermal environment assessments, undermining the accuracy and generalizability of research findings. Thus, integrating MRT monitoring into future experimental designs is critical for ensuring comprehensive, reliable evaluations of thermal environments.
Notably, this study marks the first attempt to investigate how infrared heater radiation affects human thermal comfort under controlled conditions, laying a foundational framework for subsequent research in this field. Future studies could use equipment capable of simulating solar radiation characteristics to further improve the authenticity and applicability of research results. Additionally, this study included two subject groups (the elderly and young adults), which also represents a direction for expanding subgroup analyses in future work. For instance, further comparisons could explore differences in thermal comfort responses among the elderly across different age brackets, genders, or health statuses—ultimately deepening the universality of relevant research conclusions.

5. Conclusions

The results revealed that elderly and young individuals have different comfort levels and physiological responses to different infrared radiation environment conditions. Specifically, thermal sensation assessments indicated that the participants in the elderly group scored higher in all experimental conditions than did the young participants. When infrared radiation was low, with the growth of the radiation area, the increase in the thermal comfort value (TCV) in elderly participants was significantly greater than in young participants. In contrast, the young showed a greater decline in their thermal sensation rating variation in a thermal environment with high radiation. Older adults maintained relative comfort and demonstrated superior mental stability in warm environments.
In addition, the EEG characteristics significantly distinguished the two age groups under various conditions of thermal radiation. During low radiation exposure, the EEG power of both age groups decreased early on and then increased, with the young participants showing higher logarithmic power by 1.0% to 1.5% compared to the elderly. This contrasted with high radiation conditions, whereby the EEG power of the elderly gradually increased and that of the young subjects decreased. We postulate that these physiological responses can partly account for increased heat-related illness risks in the elderly, despite their reporting of increased thermal comfort.
Moreover, we observed a significantly higher power of the EEG in the frontal lobe as compared to other regions, consistent with theories regarding its functional relevance in cognition, the regulation of emotion, and information processing. This human-centered design is evident in the use and confluence of multiple parameters, of which the effects of EEG alpha (α) and theta (θ) bands, particularly in the frontal lobe measurement and association with thermal comfort, are prominent as an area ripe for future investigations. Compared with the θ band, which fails to properly reflect the thermal comfort of the elderly, the frontal lobe-α EEG can be a primary indicator for simultaneously evaluating thermal comfort for the elderly and young people. Future experiments could focus on measuring these EEG bands to further understand the dynamics of thermal comfort. In subsequent research, a combined evaluation criterion of “subjective scales + frontal alpha wave power” is recommended to avoid an over-reliance on singular physiological metrics or age-specific assessment frameworks tailored exclusively to young people.

Author Contributions

P.G.: Conceptualization, Supervision, Project Administration, Funding acquisition, Resources, Writing—Review and Editing. Y.L.: Methodology, Software, Formal Analysis, Data Curation, Writing—Original Draft, Writing—Review and Editing, Visualization. K.H.: Formal Analysis, Resources, Writing—Review and Editing, Validation. M.L.: Validation, Formal Analysis, Data Curation, Writing—Review and Editing. C.L.: Formal Analysis, Validation, Writing—Review and Editing, Investigation. H.G.: Methodology, Software, Writing—Review and Editing. W.Y.: Validation, Resources, Investigation. J.L.: Investigation, Validation, Resources, Data Curation. All authors have read and agreed to the published version of the manuscript.

Funding

This research was funded by the Natural Science Foundation of Shandong Province, China (No. ZR2025MS925) and the Qingdao Social Sciences Planning Project (No. QDSKL2301150).

Institutional Review Board Statement

This study was conducted in accordance with the Declaration of Helsinki and approved by the Research Ethics Committee of the Innovation Institute for Sustainable Maritime Architecture Research and Technology (iSMART) (Protocol Code: 2024-04-25-01; Approval Date: 25 April 2024). In addition, we have obtained the participants’ permission and informed consent to participate in this study.

Informed Consent Statement

Informed consent was obtained from all subjects involved in this study.

Data Availability Statement

The data presented in this study are available from the corresponding author upon reasonable request.

Conflicts of Interest

Author Peiping Gao is employed by the Qingdao University of Technology Architectural Design and Research Institute Company. The remaining authors declare that the research was conducted in the absence of any commercial or financial relationships that could be construed as a potential conflict of interest.

References

  1. Kinsella, K.; Phillips, D. Global Aging: The Challenge of Success. Popul. Bull. 2005, 60, 5–42. [Google Scholar]
  2. Feng, Z. Global Convergence: Aging and Long-Term Care Policy Challenges in the Developing World. J. Aging Soc. Policy 2019, 31, 291–297. [Google Scholar] [CrossRef]
  3. Bloom, D.E.; Canning, D.; Lubet, A. Global Population Aging: Facts, Challenges, Solutions & Perspectives. Daedalus 2015, 144, 80–92. [Google Scholar] [CrossRef]
  4. Khan, H.T.A. Population Ageing in a Globalized World: Risks and Dilemmas? J. Eval. Clin. Pract. 2019, 25, 754–760. [Google Scholar] [CrossRef] [PubMed]
  5. Khajehzadeh, I.; Vale, B. How New Zealanders Distribute Their Daily Time between Home Indoors, Home Outdoors and out of Home. Kōtuitui N. Z. J. Soc. Sci. Online 2017, 12, 17–31. [Google Scholar] [CrossRef]
  6. Lewis, T.; Holcombe-James, I.; Glover, A. More than Just ‘Working from Home’: Domestic Space, Economies and Living Infrastructures during and beyond Pandemic Times. Cult. Stud. 2024, 38, 299–321. [Google Scholar] [CrossRef]
  7. Fletcher, M.J.; Johnston, D.K.; Glew, D.W.; Parker, J.M. An Empirical Evaluation of Temporal Overheating in an Assisted Living Passivhaus Dwelling in the UK. Build. Environ. 2017, 121, 106–118. [Google Scholar] [CrossRef]
  8. Almeida-Silva, M.; Wolterbeek, H.T.; Almeida, S.M. Elderly Exposure to Indoor Air Pollutants. Atmos. Environ. 2014, 85, 54–63. [Google Scholar] [CrossRef]
  9. Baniassadi, A.; Lipsitz, L.; Pascual-Leone, A.; Manor, B.; Yu, W. A Platform to Study the Effects of Home Environment on Health and Wellbeing of Older Adults. Innov. Aging 2021, 5, 965. [Google Scholar] [CrossRef]
  10. Engineer, A.; Sternberg, E.M.; Najafi, B. Designing Interiors to Mitigate Physical and Cognitive Deficits Related to Aging and to Promote Longevity in Older Adults: A Review. Gerontology 2018, 64, 612–622. [Google Scholar] [CrossRef]
  11. Tsoulou, I.; Taylor, J.; Symonds, P.; Mohajeri, N.; Davies, M. Improving Indoor Thermal Comfort, Air Quality and the Health of Older Adults through Environmental Policies in London. J. Phys. Conf. Ser. 2021, 2069, 012240. [Google Scholar] [CrossRef]
  12. Rajapaksha, I.; Sandamini, R.G.P. Appraising Indoor Thermal Perception of Elderly in Hot Climates: An Experimental Investigation of Free-Running Residential Aged Care Homes in Colombo. In Proceedings of the Faculty of Architecture Research Unit (FARU), Moratuwa, Katubedda, 3–5 December 2021. [Google Scholar] [CrossRef]
  13. Traynor, V.; Fernandez, R.; Caldwell, K. What Are the Effects of Spending Time Outdoors in Daylight on the Physical Health of Older People and Family Carers: A Systematic Review Protocol. JBI Evid. Synth. 2013, 11, 76. [Google Scholar] [CrossRef]
  14. Hodder, S.; Parsons, K. The Effects of Solar Radiation and Black Body Re-Radiation on Thermal Comfort. Ergonomics 2008, 51, 476–491. [Google Scholar] [CrossRef] [PubMed]
  15. Xiao, Y.; Gao, Y.; Wang, Y.; Meng, X. Effects of Solar Radiation on Thermal Sensation and Physical Fatigue of the Human Body under Heavy-Load Exercise. Indoor Built Environ. 2022, 31, 7–16. [Google Scholar] [CrossRef]
  16. Otani, H.; Goto, T.; Goto, H.; Hosokawa, Y.; Shirato, M. Solar Radiation Exposure Has Diurnal Effects on Thermoregulatory Responses During High-Intensity Exercise in the Heat Outdoors. J. Strength Cond. Res. 2019, 33, 2608. [Google Scholar] [CrossRef]
  17. Hendler, E.; Hardy, J.D. Infrared and Microwave Effects on Skin Heating and Temperature Sensation. IRE Trans. Med. Electron. 1960, ME-7, 143–152. [Google Scholar] [CrossRef]
  18. Meffert, H.; Piazena, H. Wirkungen Künstlich Erzeugter Infra-rotstrahlung Auf Den Menschen. Aktuelle Dermatol. 2002, 28, 187–192. [Google Scholar] [CrossRef]
  19. Van Hoof, J. Forty Years of Fanger’s Model of Thermal Comfort: Comfort for All? Abstract. Indoor Air 2008, 18, 182–201. [Google Scholar] [CrossRef]
  20. Taylor, N.A.; Allsopp, N.K.; Parkes, D.G. Preferred Room Temperature of Young vs Aged Males: The Influence of Thermal Sensation, Thermal Comfort, and Affect. J. Gerontol. A Biol. Sci. Med. Sci. 1995, 50, M216–M221. [Google Scholar] [CrossRef]
  21. Kalmár, F. An Indoor Environment Evaluation by Gender and Age Using an Advanced Personalized Ventilation System. Build. Serv. Eng. Res. Technol. 2017, 38, 505–521. [Google Scholar] [CrossRef]
  22. Soebarto, V.; Zhang, H.; Schiavon, S. A Thermal Comfort Environmental Chamber Study of Older and Younger People. Build. Environ. 2019, 155, 1–14. [Google Scholar] [CrossRef]
  23. Schellen, L.; Van Marken Lichtenbelt, W.D.; Loomans, M.G.L.C.; Toftum, J.; De Wit, M.H. Differences between Young Adults and Elderly in Thermal Comfort, Productivity, and Thermal Physiology in Response to a Moderate Temperature Drift and a Steady-State Condition. Indoor Air 2010, 20, 273–283. [Google Scholar] [CrossRef] [PubMed]
  24. Yokoe, A.; Mitsuda, M.; Tanamura, T.; Yamaha, M.; Nepal, B. Observed Thermal and Odor Environment in Elderly Welfare Facilities: Results of Summer Survey on Two Facilities in Kasugai City. J. Environ. Eng. (Trans. AIJ) 2020, 85, 29–35. [Google Scholar] [CrossRef]
  25. Yi, C.y.; Childs, C.; Peng, C.; Robinson, D. Thermal Comfort Modelling of Older People Living in Care Homes: An Evaluation of Heat Balance, Adaptive Comfort, and Thermographic Methods. Build. Environ. 2022, 207, 108550. [Google Scholar] [CrossRef]
  26. Itani, M.; Ghaddar, N.; Ghali, K.; Laouadi, A. Development of Heat Stress Charts for Older People under Indoor Environmental Conditions. Energy Build. 2020, 224, 110274. [Google Scholar] [CrossRef]
  27. Zhang, Z.; Wu, Y.; Liu, H.; Li, B.; Kosonen, R. Experimental Study on the Thermal Comfort and Physiological Responses of the Elderly in Unstable Environments. In Proceedings of the 16th ROOMVENT Conference (ROOMVENT 2022), Xi’an, China, 16–19 September 2022; Volume 356, p. 03011. [Google Scholar] [CrossRef]
  28. Mansi, S.A.; Barone, G.; Forzano, C.; Pigliautile, I.; Ferrara, M.; Pisello, A.L.; Arnesano, M. Measuring Human Physiological Indices for Thermal Comfort Assessment through Wearable Devices: A Review. Measurement 2021, 183, 109872. [Google Scholar] [CrossRef]
  29. Wu, M.; Li, H.; Qi, H. Using Electroencephalogram to Continuously Discriminate Feelings of Personal Thermal Comfort between Uncomfortably Hot and Comfortable Environments. Indoor Air 2020, 30, 534–543. [Google Scholar] [CrossRef]
  30. Tuţă, L.; Roşu, G.; Popovici, C.; Nicolaescu, I. Real- Time EEG Data Processing Using Independent Component Analysis (ICA). In Proceedings of the 2022 14th International Conference on Communications (COMM), Bucharest, Romania, 16–18 June 2022; pp. 1–4. [Google Scholar]
  31. Kirschstein, T.; Köhling, R. What Is the Source of the EEG? Clin. EEG Neurosci. 2009, 40, 146–149. [Google Scholar] [CrossRef]
  32. Hu, S.; Lu, M.; He, M.; Wang, G.; Liang, P.; Tong, L.; Liu, G. Research on the Light Comfort Characterization Method Based on Visual Evoked Potential Energy. Build. Environ. 2021, 197, 107831. [Google Scholar] [CrossRef]
  33. Loughran, S.P.; Verrender, A.; Dalecki, A.; Burdon, C.A.; Tagami, K.; Park, J.; Taylor, N.A.S.; Croft, R.J. Radiofrequency Electromagnetic Field Exposure and the Resting EEG: Exploring the Thermal Mechanism Hypothesis. Int. J. Environ. Res. Public Health 2019, 16, 1505. [Google Scholar] [CrossRef]
  34. Yao, Y.; Lian, Z.; Liu, W.; Jiang, C.; Liu, Y.; Lu, H. Heart Rate Variation and Electroencephalograph--the Potential Physiological Factors for Thermal Comfort Study. Indoor Air 2009, 19, 93–101. [Google Scholar] [CrossRef] [PubMed]
  35. Yao, Y.; Lian, Z.; Liu, W.; Shen, Q. Experimental Study on Physiological Responses and Thermal Comfort under Various Ambient Temperatures. Physiol. Behav. 2008, 93, 310–321. [Google Scholar] [CrossRef] [PubMed]
  36. Lv, B.; Su, C.; Yang, L.; Wu, T. Effects of Stimulus Mode and Ambient Temperature on Cerebral Responses to Local Thermal Stimulation: An EEG Study. Int. J. Psychophysiol. 2017, 113, 17–22. [Google Scholar] [CrossRef] [PubMed]
  37. Al-Dabbas, M.A. Heating by Catalytic Gas Infrared Rays. Energy Eng. 2011, 108, 26–45. [Google Scholar] [CrossRef]
  38. Petras, D.; Kalús, D. Effect of Thermal Comfort/Discomfort Due to Infrared Heaters Installed at Workplaces in Industrial Buildings. Indoor Built Environ. 2000, 9, 148–156. [Google Scholar] [CrossRef]
  39. Hirn, T.; Kirmas, A.; Backes, D.; Eckstein, L. Impact of Different Radiation Types on Thermal Comfort Modelling. In Proceedings of the Comfort Congress 2021 Proceedings, Nottingham, UK, 2–3 September 2021. [Google Scholar]
  40. ISO 7726: 2023; Ergonomics of the Thermal Environment—Instruments for Measuring and Monitoring Physical Quantities. ISO: Geneva, Switzerland, 2023.
  41. Yao, F.; Fang, H.; Han, J.; Zhang, Y. Study on the Outdoor Thermal Comfort Evaluation of the Elderly in the Tibetan Plateau. Sustain. Cities Soc. 2022, 77, 103582. [Google Scholar] [CrossRef]
  42. Hu, J.; Lyu, C.; Hou, Y.; Zhu, N.; Liu, K. Research on Summer Indoor Air Conditioning Design Parameters in Haikou City: A Field Study of Indoor Thermal Perception and Comfort. Sustainability 2024, 16, 3864. [Google Scholar] [CrossRef]
  43. GB/T 50785-2012; Evaluation Standard for Indoor Thermal and Humid Environment of Civil Buildings. Standardization Administration of the People’s Republic of China & Ministry of Housing and Urban-Rural Development of the People’s Republic of China: Beijing, China, 2012.
  44. Wu, Z.; Li, N.; Schiavon, S. Experimental Evaluation of Thermal Comfort, SBS Symptoms and Physiological Responses in a Radiant Ceiling Cooling Environment under Temperature Step-Changes. Build. Environ. 2022, 224, 109512. [Google Scholar] [CrossRef]
  45. Smallcombe, J.W.; Foster, J.; Hodder, S.G.; Jay, O.; Flouris, A.D.; Havenith, G. Quantifying the Impact of Heat on Human Physical Work Capacity; Part IV: Interactions between Work Duration and Heat Stress Severity. Int. J. Biometeorol. 2022, 66, 2463–2476. [Google Scholar] [CrossRef]
  46. Sun, R.; Xu, S.; Han, Y.; Zhuang, D.; Yan, B.; Sun, C. Exploring Impacts of Thermal and Lighting Conditions on Office Workers’ Subjective Evaluations, Cognitive Performance and EEG Features in Multi-Person Offices. J. Build. Eng. 2024, 95, 110170. [Google Scholar] [CrossRef]
  47. Shahid, A.; Wilkinson, K.; Marcu, S.; Shapiro, C. STOP, THAT and One Hundred Other Sleep Scales; Springer: Berlin/Heidelberg, Germany, 2012; ISBN 978-1-4419-9892-7. [Google Scholar]
  48. Gwak, J.; Shino, M.; Ueda, K.; Kamata, M. An Investigation of the Effects of Changes in the Indoor Ambient Temperature on Arousal Level, Thermal Comfort, and Physiological Indices. Appl. Sci. 2019, 9, 899. [Google Scholar] [CrossRef]
  49. Yadav, H.; Maini, S. Electroencephalogram Based Brain-Computer Interface: Applications, Challenges, and Opportunities. Multimed. Tools Appl. 2023, 82, 47003–47047. [Google Scholar] [CrossRef]
  50. López-Hernández, J.L.; González-Carrasco, I.; López-Cuadrado, J.L.; Ruiz-Mezcua, B. Framework for the Classification of Emotions in People With Visual Disabilities Through Brain Signals. Front. Neuroinform. 2021, 15, 642766. [Google Scholar] [CrossRef]
  51. Chu, H.; Cao, Y.; Jiang, J.; Yang, J.; Huang, M.; Li, Q.; Jiang, C.; Jiao, X. Optimized Electroencephalogram and Functional Near-Infrared Spectroscopy-Based Mental Workload Detection Method for Practical Applications. Biomed. Eng. OnLine 2022, 21, 9. [Google Scholar] [CrossRef]
  52. Wang, Z.; Hu, C.; Liu, W.; Zhou, X.; Zhao, X. EEG-Based High-Performance Depression State Recognition. Front. Neurosci. 2024, 17, 1301214. [Google Scholar] [CrossRef] [PubMed]
  53. Naydenov, C.; Yordanova, A.; Mancheva, V. Methodology for EEG and Reference Values of the Software Analysis. Open Access Maced. J. Med. Sci. 2022, 10, 2351–2354. [Google Scholar] [CrossRef]
  54. Frank, S.M.; Raja, S.N.; Bulcao, C.; Goldstein, D.S. Age-Related Thermoregulatory Differences during Core Cooling in Humans. Am. J. Physiol -Regul. Integr. Comp. Physiol. 2000, 279, R349–R354. [Google Scholar] [CrossRef] [PubMed]
  55. Tsuzuki, K.; Ohfuku, T. Thermal Sensation and Thermoregulation in Elderly Compared to Young People in Japanese Winter Season. In Proceedings of the Indoor Air 2002, Monterey, CA, USA, 30 June–5 July 2002. [Google Scholar]
  56. Umemiya, N.; Terao, K.; Chen, Y. Difference of Cooling Use during Sleep between Elderly and Young People. J. Phys. Conf. Ser. 2021, 2069, 012239. [Google Scholar] [CrossRef]
  57. McKenna, Z.J.; Foster, J.; Atkins, W.C.; Belval, L.N.; Watso, J.C.; Jarrard, C.P.; Orth, B.D.; Crandall, C.G. Age Alters the Thermoregulatory Responses to Extreme Heat Exposure with Accompanying Activities of Daily Living. J. Appl. Physiol. 2023, 135, 445–455. [Google Scholar] [CrossRef]
  58. Navas-Martín, M.Á.; López-Bueno, J.A.; Ascaso-Sánchez, M.S.; Follos, F.; Vellón, J.M.; Mirón, I.J.; Luna, M.Y.; Sánchez-Martínez, G.; Linares, C.; Díaz, J. Heat Adaptation among the Elderly in Spain (1983–2018). IJERPH 2023, 20, 1314. [Google Scholar] [CrossRef]
  59. Mukhopadhyay, B.; Weitz, C.A. Heat Exposure, Heat-Related Symptoms and Coping Strategies among Elderly Residents of Urban Slums and Rural Vilages in West Bengal, India. IJERPH 2022, 19, 12446. [Google Scholar] [CrossRef]
  60. Sun, N.; Ding, X.; Bi, J.; Cui, Y. Field Study on Winter Thermal Comfort of Occupants of Nursing Homes in Shandong Province, China. Buildings 2024, 14, 2881. [Google Scholar] [CrossRef]
  61. Robison, M.K.; Diede, N.T.; Nicosia, J.; Ball, H.; Bugg, J. A Multimodal Analysis of Sustained Attention in Younger and Older Adults. Psychol. Aging 2021, 37, 307–325. [Google Scholar] [CrossRef]
  62. Murty, D.V.P.S.; Manikandan, K.; Kumar, W.S.; Ramesh, R.G.; Purokayastha, S.; Javali, M.; Rao, N.P.; Ray, S. Gamma Oscillations Weaken with Age in Healthy Elderly in Human EEG. Neuroimage 2020, 215, 116826. [Google Scholar] [CrossRef]
  63. Laouadi, A. A New General Formulation for the PMV Thermal Comfort Index. Buildings 2022, 12, 1572. [Google Scholar] [CrossRef]
  64. Zhang, H.; Hu, S.; Wang, Z.; Li, X.; Wang, S.; Chen, G. A Temporospatial Study of Sympathetic Skin Response and Electroencephalogram in Oral Mucosa Thermal Perception. Front. Neurosci. 2022, 16, 907658. [Google Scholar] [CrossRef]
  65. Wang, X.; Li, D.; Menassa, C.C.; Kamat, V.R. Investigating the Neurophysiological Effect of Thermal Environment on Individuals’ Performance Using Electroencephalogram. Computing in Civil Engineering 2019, Atlanta, GA, USA, 17–19 June 2019; pp. 598–605. [Google Scholar] [CrossRef]
  66. Manes, F.; Torralba, T. Funciones Ejecutivas y Trastornos Del Lóbulo Frontal; Instituto de Neurología Cognitiva (INECO): Buenos Aires, Argentina, 2005. [Google Scholar]
  67. Lorenz, J.; Minoshima, S.; Casey, K.L. Keeping Pain out of Mind: The Role of the Dorsolateral Prefrontal Cortex in Pain Modulation. Brain 2003, 126, 1079–1091. [Google Scholar] [CrossRef] [PubMed]
  68. Davidson, R.J.; Ekman, P.; Saron, C.D.; Senulis, J.A.; Friesen, W.V. Approach-Withdrawal and Cerebral Asymmetry: Emotional Expression and Brain Physiology: I. J. Personal. Soc. Psychol. 1990, 58, 330–341. [Google Scholar] [CrossRef]
  69. Worfolk, J.B. Heat Waves: Their Impact on the Health of Elders. Geriatr. Nurs. 2000, 21, 70–77. [Google Scholar] [CrossRef] [PubMed]
  70. Wang, Z.; Yu, H.; Jiao, Y.; Chu, X.; Luo, M. Chinese Older People’s Subjective and Physiological Responses to Moderate Cold and Warm Temperature Steps. Build. Environ. 2019, 149, 526–536. [Google Scholar] [CrossRef]
  71. Lin, C.; Feng, Q.; Huang, J.; Zhong, R. Investigation on the Perception of Microclimatic Factors by the Elderly in Humid and Hot Areas: The Case of Guangzhou, China. Atmosphere 2023, 14, 1570. [Google Scholar] [CrossRef]
  72. Spitzer, S.; Weber, D. Reporting Biases in Self-Assessed Physical and Cognitive Health Status of Older Europeans. PLoS ONE 2019, 14, e0223526. [Google Scholar] [CrossRef]
  73. Lim, J.; Baek, G.; Jeon, E. Analysis of the Correlation between Thermal Sensations and Brain Waves via EEG Measurements. Int. J. Appl. Eng. Res. 2018, 13, 6069–6075. [Google Scholar]
  74. Lang, X.; Wargocki, P.; Liu, W. Investigating the Relation between Electroencephalogram, Thermal Comfort, and Cognitive Performance in Neutral to Hot Indoor Environment. Indoor Air 2022, 32, e12941. [Google Scholar] [CrossRef]
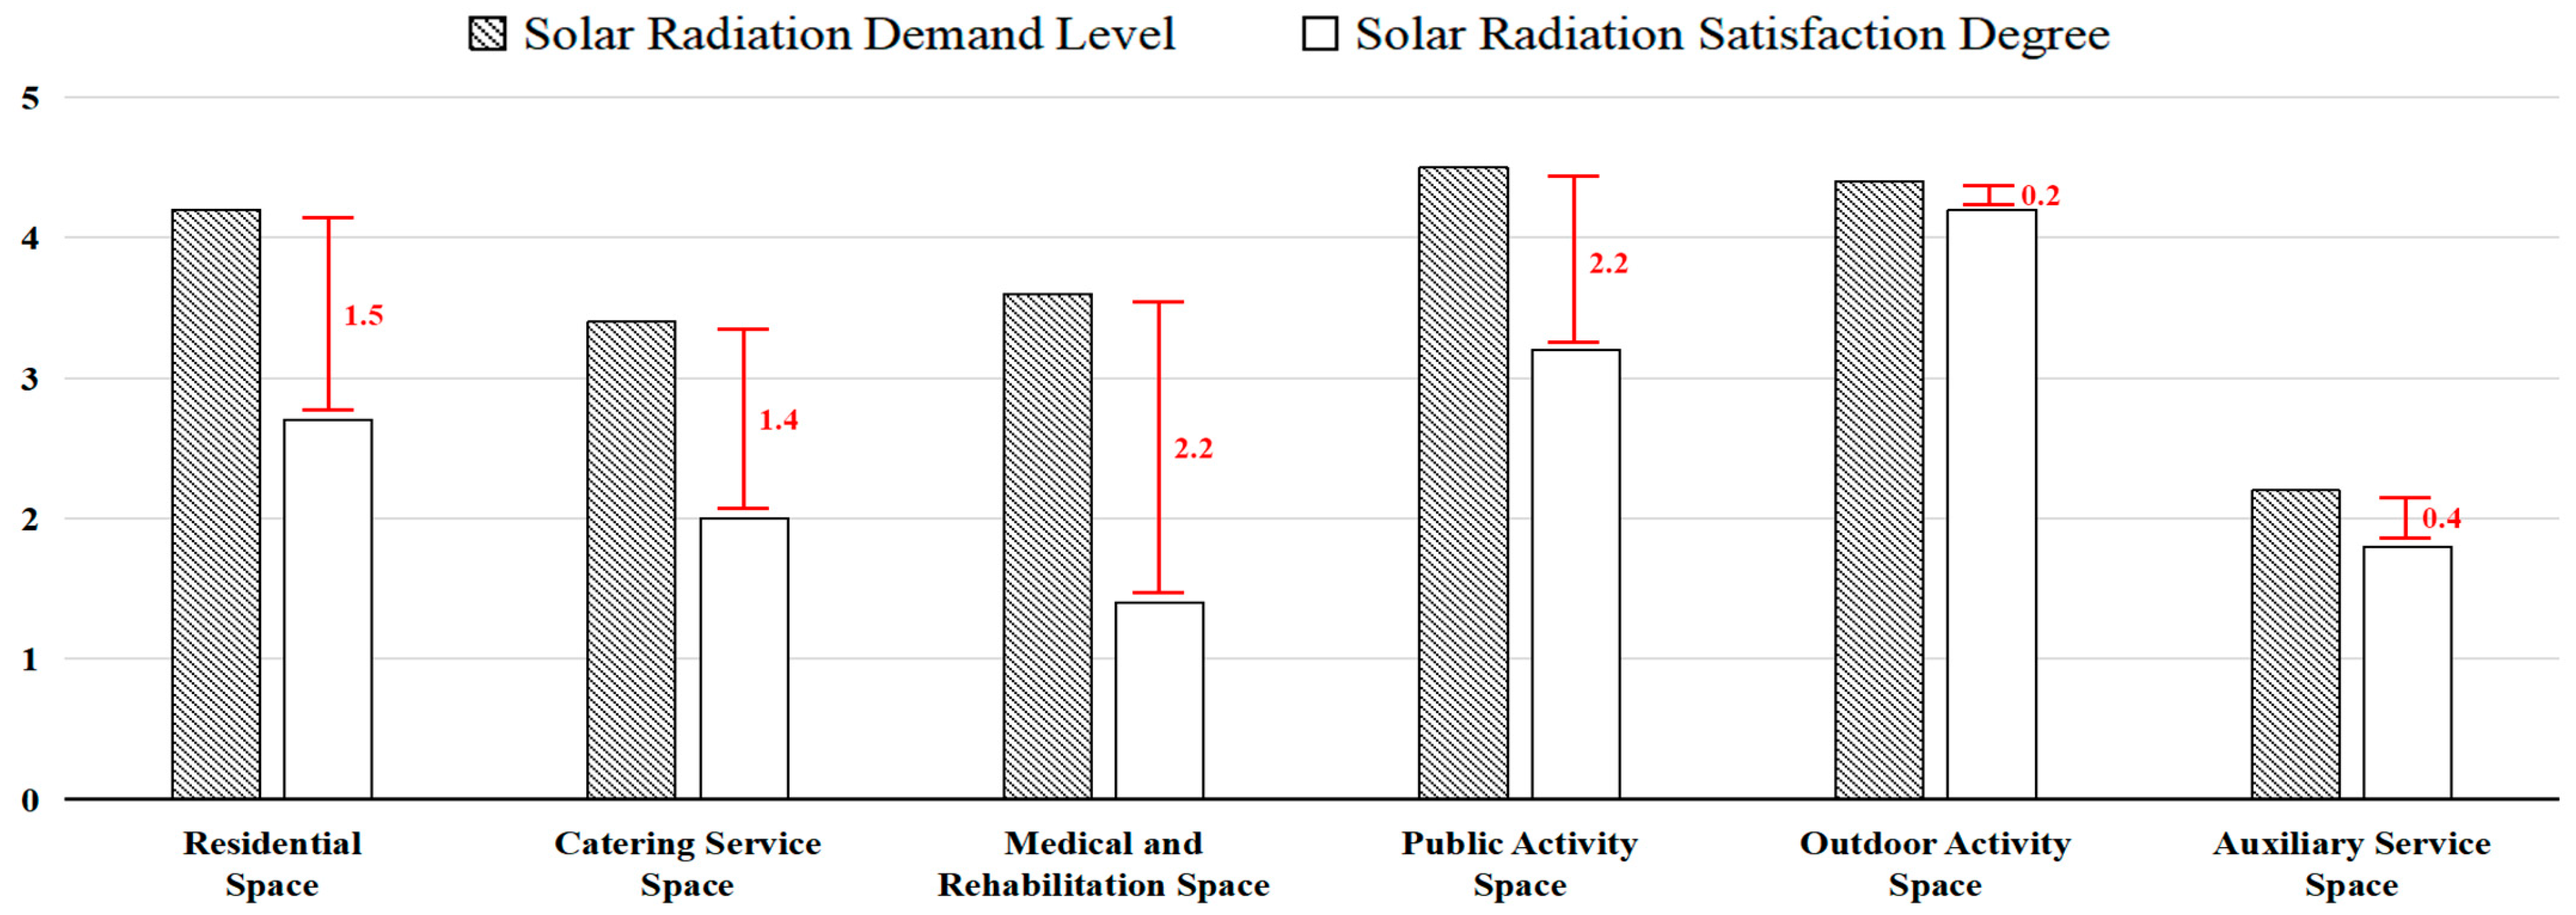
Figure 1. Demand level and satisfaction degree of solar radiation for the elderly in various spaces of elderly care institutions. Scoring: 1 (demand: very needed; satisfaction: very dissatisfied); 2 (demand: slightly needed; satisfaction: slightly dissatisfied); 3 (demand: neutral; satisfaction: neutral); 4 (demand: slightly unneeded; satisfaction: slightly satisfied); and 5 (demand: very unneeded; satisfaction: very satisfied).
Buildings 15 03798 g001
Figure 2. Basic EEG information. (a) Electrode position; (b) EEG waveform.
Buildings 15 03798 g002
Figure 3. Common infrared radiation scenarios in elderly facilities.
Buildings 15 03798 g003
Figure 4. Schematic of irradiation mode. ① No irradiation; ② Lower body; ③ Lower + upper body; and ④ Lower body + upper body + head.
Buildings 15 03798 g004
Figure 5. The 10 min mean radiant temperature (MRT). (a) The power of the infrared heater is 500 W. (b) The power of the infrared heater is 1000 W.
Buildings 15 03798 g005
Figure 6. The layout of the laboratory.
Buildings 15 03798 g006
Figure 7. Experimental procedure.
Buildings 15 03798 g007
Figure 8. EEG data processing.
Buildings 15 03798 g008
Figure 9. Subjective evaluation difference. (a) Thermal sensation vote (TSV); (b) thermal comfort vote (TCV); (c) relaxation sensation vote (RSV); and (d) alertness level vote (ALV).
Buildings 15 03798 g009
Figure 10. Differences in EEG logarithmic power among various brain regions. (a) Frontal lobe; (b) temporal lobe; (c) parietal lobe; and (d) occipital lobe.
Buildings 15 03798 g010
Figure 11. Differences in EEG logarithmic power of the δ band among various brain regions. (a) Frontal lobe-δ; (b) temporal lobe-δ; (c) parietal lobe-δ; and (d) occipital lobe-δ.
Buildings 15 03798 g011
Figure 12. Fitting curves of TCV and EEG logarithmic power.
Buildings 15 03798 g012
Table 1. Experimental conditions.
Experimental ConditionsRadiator PowerIrradiation Area
S00 WNo irradiation (control group)
S1500 WLower body
S2500 WLower body + Upper body
S3500 WLower body + Upper body + Head
S41000 WLower body
S51000 WLower body + Upper body
S61000 WLower body + Upper body + Head
Table 2. Experiment equipment.
EquipmentSpecific ParametersEquipmentSpecific Parameters
Buildings 15 03798 i001ModelXianhe CQ-51Buildings 15 03798 i002ModelAZ87785Temperature Accuracy±0.6 °C
Power500 W/
1000 W
Diameter75 mmTemperature Measurement Resolution0.1 °C
Spectrum2–25 μmOperating Temperature0~50 °CBlack Globe Temperature Range0~80 °C
Frequency50 HzTemperature Range0~50 °CBlack Globe Temperature Accuracy±1.5 °C
(at 15–40 °C)
Table 3. Initial physical parameter settings of the laboratory.
ParameterUnitRange
Air temperature°C18 ± 0.5
Relative humidity%55 ± 5
Wind speedm/s<0.1
Sound pressuredB<40
Table 4. Subject information.
SubjectsSample
Size
AgeMaximum
Age
Minimum
Age
Body Weight (kg)Stature (cm)Body Mass Index (kg/m2)
Elderly Males1566.20 ± 2.51726261.00 ± 4.41166.67 ± 3.6621.99 ± 1.80
Elderly Females1568.73 ± 3.47756454.87 ± 6.52159.20 ± 4.1821.59 ± 1.73
Young Males1524.53 ± 0.74262464.53 ± 5.99173.00 ± 5.5821.56 ± 1.72
Young Females1525.13 ± 1.73302454.00 ± 4.21159.00 ± 3.2121.37 ± 1.66
Total6046.15 ± 21.64752458.60 ± 6.84164.47 ± 7.1821.62 ± 1.70
Table 5. Subjective questionnaires.
Score (Implication)
TSV−3−2−10123
ColdCoolMildly coolNeutralMildly warmWarmHot
TCV−3−2−10123
Intensely
unpleasant
DiscomfortingMildly
uncomfortable
BalancedMildly
comfortable
CozyHighly
pleasant
RSV−3−2−10123
Extremely
unrelaxed
UnrelaxedSlightly
unrelaxed
NeutralSlightly
relaxed
RelaxedExtremely
relaxed
ALV123456789
Extremely alertVery alertAlertSlightly alertNeutralSlightly sleepySleepyVery sleepyExtremely sleepy
Table 6. Normality test.
SubjectsSubjective
Evaluations
Sample
Size
MeanStandard
Deviation
SkewnessKurtosisKolmogorov–Smirnov
Dp
The elderlyTSV2101.3711.122−0.075−1.0080.1840.000 **
TCV2100.690.855−0.6090.4680.3170.000 **
RSV2100.5051.175−0.226−1.1090.1970.000 **
ALV2104.0191.3590.37−0.4460.240.000 **
Young peopleTSV2101.091.347−0.356−0.7540.1980.000 **
TCV2100.4710.924−0.4120.4160.2590.000 **
RSV2100.2241.242−0.101−1.1420.2010.000 **
ALV2105.3481.83−0.061−0.8140.1110.000 **
p-value < 0.05 (*) indicates significance, p-value < 0.01 (**) indicates strong significance.
Table 7. Homogeneity of variance test.
SubjectsSubjective
Evaluations
S0
(n = 30)
S1
(n = 30)
S2
(n = 30)
S3
(n = 30)
S4
(n = 30)
S5
(n = 30)
S6
(n = 30)
Fp
The elderlyTSV0.510.730.850.770.870.780.681.8670.088
TCV0.710.640.590.920.880.770.832.2230.042 *
RSV1.081.131.070.981.010.961.160.9530.458
ALV1.300.901.141.141.381.431.653.2310.005 **
Young peopleTSV0.830.990.921.010.930.610.614.1570.001 **
TCV0.870.530.450.871.140.871.013.6910.002 **
RSV1.000.970.861.141.191.671.5111.5590.000 **
ALV1.371.301.461.561.481.971.870.960.454
p-value < 0.05 (*) indicates significance; p-value < 0.01 (**) indicates strong significance.
Table 8. Results of GEE analysis.
Regression CoefficientRegression CoefficientStandard Errorzp95% CIOR ValueOR 95% CI
TSVIntercept−4.7840.751−6.3690.001 **−6.256~−3.3120.0080.002~0.036
Age1.1670.4452.6210.013 *0.294~2.0393.2111.342~7.682
Radiation intensity1.5490.3754.130.001 **0.814~2.2854.7092.257~9.823
Radiation area3.1680.3558.9220.000 **2.472~3.86423.7711.851~47.676
Age × Radiation intensity−0.2330.227−1.0280.304−0.678~0.2120.7920.507~1.236
Age × Radiation area−0.5330.232−2.2950.022 *−0.989~−0.0780.5870.372~0.925
Radiation intensity × Radiation area−0.9960.157−6.3470.003 **−1.304~−0.6890.3690.271~0.502
Age × Radiation intensity × Radiation area0.1670.11.6590.097−0.030~0.3641.1810.970~1.438
TCVIntercept2.3210.8212.8280.005 **0.713~3.93010.1862.039~50.884
Age0.2190.1042.0990.036 *0.014~0.4241.2451.015~1.527
Radiation intensity−1.0080.403−2.5000.012 *−1.798~−0.2180.3650.166~0.804
Radiation area−1.360.428−3.180.001 **−2.198~−0.5220.2570.111~0.594
Age × Radiation intensity0.5070.2442.0790.038 *0.029~0.9861.6611.029~2.679
Age × Radiation area0.2780.2651.0480.295−0.242~0.7981.3210.785~2.222
Radiation intensity × Radiation area0.5970.1723.4680.001 **0.260~0.9351.8171.297~2.547
Age × Radiation intensity × Radiation area−0.1940.105−1.840.066−0.400~0.0130.8240.670~1.013
RSVIntercept−2.2130.986−2.2440.025 *−4.146~−0.2800.1090.016~0.756
Age2.4150.6093.9670.000 **1.222~3.60911.1953.394~36.929
Radiation intensity0.7740.3532.1930.028 *0.082~1.4662.1691.086~4.332
Radiation area0.7770.621.2530.210−0.439~1.9932.1750.645~7.339
Age × Radiation intensity−0.7190.219−3.2790.001 **−1.149~−0.2890.4870.317~0.749
Age × Radiation area−1.1430.364−3.1360.002 **−1.857~−0.4290.3190.156~0.651
Radiation intensity × Radiation area−0.2620.207−1.2670.205−0.668~0.1430.7690.513~1.154
Age × Radiation intensity × Radiation area0.3970.1193.3350.001 **0.164~0.6311.4881.178~1.879
ALVIntercept0.6851.4030.4890.625−2.064~3.4341.9850.127~31.012
Age−1.0950.518−2.1120.035 *−2.111~−0.0790.3350.121~0.924
Radiation intensity1.4540.5382.70.007 **0.399~2.5104.2811.490~12.299
Radiation area3.2210.8863.6340.000 **1.484~4.95825.0544.410~142.355
Age × Radiation intensity−0.5410.311−1.7410.082−1.149~0.0680.5820.317~1.071
Age × Radiation area−1.0950.518−2.1120.035 *−2.111~−0.0790.3350.121~0.924
Radiation intensity × Radiation area0.8380.8281.0110.312−0.786~2.4622.3120.456~11.726
Age × Radiation intensity × Radiation area0.3110.1811.7140.087−0.045~0.6661.3640.956~1.946
p-value < 0.05 (*) indicates significance; p-value < 0.01 (**) indicates strong significance.
Table 9. Correlation analysis (age and EEG).
Prefrontal CortexLateral CortexUpper Brain RegionVisual Cortex
Age0.125 *0.164 **0.206 **0.218 **
p-value < 0.05 (*) indicates significance; p-value < 0.01 (**) indicates strong significance.
Table 10. EEG logarithmic power in the delta band across each brain region (mean ± standard deviation).
S0 (n = 30)S1 (n = 30)S2 (n = 30)S3 (n = 30)S4 (n = 30)S5 (n = 30)S6 (n = 30)p
Frontal lobe-δ
The elderly9.93 ± 0.389.91 ± 0.309.84 ± 0.289.88 ± 0.399.93 ± 0.4410.04 ± 0.4210.10 ± 0.420.030 *
Young people10.07 ± 0.4310.07 ± 0.459.91 ± 0.3410.05 ± 0.3210.00 ± 0.3510.01 ± 0.319.95 ± 0.390. 533
Temporal lobe-δ
The elderly9.26 ± 0.459.26 ± 0.339.19 ± 0.299.22 ± 0.409.28 ± 0.449.43 ± 0.459.53 ± 0.410.008 **
Young people9.39 ± 0.459.39 ± 0.509.18 ± 0.429.39 ± 0.389.31 ± 0.409.33 ± 0.339.39 ± 0.450.362
Parietal lobe-δ
The elderly9.19 ± 0.459.19 ± 0.359.12 ± 0.279.17 ± 0.389.22 ± 0.479.39 ± 0.479.50 ± 0.430.002 **
Young people9.35 ± 0.469.31 ± 0.519.11 ± 0.469.32 ± 0.419.26 ± 0.429.29 ± 0.349.19 ± 0.520.403
Occipital lobe-δ
The elderly9.17 ± 0.469.16 ± 0.369.08 ± 0.299.12 ± 0.429.15 ± 0.519.35 ± 0.509.50 ± 0.460.001 **
Young people9.30 ± 0.469.27 ± 0.519.06 ± 0.469.27 ± 0.419.21 ± 0.449.23 ± 0.339.15 ± 0.510.432
p-value < 0.05 (*) indicates significance; p-value < 0.01 (**) indicates strong significance.
Table 11. The EEG logarithmic power of electrodes in the frontal lobe area that show significant correlation (mean ± standard deviation).
S0 (n = 30)S1 (n = 30)S2 (n = 30)S3 (n = 30)S4 (n = 30)S5 (n = 30)S6 (n = 30)p
AF4-θ9.19 ± 0.449.20 ± 0.339.12 ± 0.319.21 ± 0.349.23 ± 0.459.40 ± 0.489.44 ± 0.440.016 *
F4-δ8.76 ± 0.508.67 ± 0.368.60 ± 0.438.63 ± 0.498.58 ± 0.648.82 ± 0.558.98 ± 0.440.025 *
F4-θ9.23 ± 0.389.22 ± 0.289.17 ± 0.289.24 ± 0.339.28 ± 0.419.40 ± 0.469.45 ± 0.400.037 *
F8-θ9.21 ± 0.399.21 ± 0.309.17 ± 0.309.24 ± 0.349.28 ± 0.429.40 ± 0.479.44 ± 0.430.049 *
FC6-δ8.78 ± 0.538.72 ± 0.378.66 ± 0.398.69 ± 0.478.65 ± 0.638.88 ± 0.539.04 ± 0.430.021 *
p-value < 0.05 (*) indicates significance; p-value < 0.01 (**) indicates strong significance.
Table 12. Correlation analysis between TCV and the EEG logarithmic power in specific EEG bands.
Frontal Lobe-αFrontal Lobe-βFrontal Lobe-δFrontal Lobe-θParietal Lobe-αParietal Lobe-βParietal Lobe-δParietal Lobe-θ
TCV−0.126 **−0.085−0.195 **−0.182 **−0.085−0.07−0.186 **−0.157 **
p-value < 0.05 (*) indicates significance; p-value < 0.01 (**) indicates strong significance.
Disclaimer/Publisher’s Note: The statements, opinions and data contained in all publications are solely those of the individual author(s) and contributor(s) and not of MDPI and/or the editor(s). MDPI and/or the editor(s) disclaim responsibility for any injury to people or property resulting from any ideas, methods, instructions or products referred to in the content.