Article

Simulation of Reinforced Concrete Beam–Column Joint Pouring Process Based on Three-Dimensional Particle Flow Method

1
Department of Civil Engineering, Tsinghua University, Beijing 100084, China
2
Arup, Beijing 100020, China
3
State Key Laboratory of Water Cycle and Water Security, China Institute of Water Resources and Hydropower Research, Beijing 100048, China
*
Author to whom correspondence should be addressed.
Buildings 2025, 15(20), 3795; https://doi.org/10.3390/buildings15203795
Submission received: 24 September 2025 / Revised: 13 October 2025 / Accepted: 17 October 2025 / Published: 21 October 2025
(This article belongs to the Special Issue Application of Experiment and Simulation Techniques in Engineering)

Abstract

The concrete pouring process is difficult to observe inside formwork. With increasingly complex formwork systems and denser reinforcement layouts, honeycomb defects and surface pores are prone to form at beam–column joint core locations. The modeling of pouring processes that were performed earlier is insufficient and there is relatively little research on simulating concrete void defects at typical joints. Therefore, a refined numerical model based on the three-dimensional particle flow method was established to simulate the flow of fresh concrete within formwork and predict concrete voids after pouring. The feasibility of the particle flow method was verified through numerical simulations of slump flow and J-ring tests. Several groups of joint models were set up based on different influencing factors, and the developed particle flow model was used for pouring simulations to investigate the influence of various factors on concrete void formation. The results show that the void volume and distribution patterns obtained from experiments and simulations are basically consistent. The numerical model can accurately simulate the working performance of self-compacting concrete and predict the size and location distribution of pouring defects. Based on both experimental and numerical studies, the following suggestions are proposed to avoid potential void defects in practical concrete pouring projects: reasonably select the number and diameter of joint longitudinal bars; appropriately increase the spacing of column stirrups; appropriately reduce the maximum coarse aggregate particle size; and choose concrete with better fluidity and filling ability.

1. Introduction

Reinforced concrete structures have been widely used in modern construction due to their outstanding mechanical properties and durability. Their construction quality directly affects structural safety performance, durability, and long-term service performance. With increasingly complex formwork systems and denser reinforcement layouts, large and complex concrete structures may encounter issues such as inadequate formwork filling, insufficient air expulsion, and aggregate segregation during construction, making it difficult to ensure concrete pouring quality. Reinforced concrete joints, as key parts of seismic design in buildings, can significantly reduce the bearing capacity of structures with quality defects [1]. Joints usually have extremely dense reinforcement arrangements. It is difficult for coarse aggregates to pass through the gaps between reinforcements, leading to uneven distribution of coarse aggregates and easy formation of honeycomb defects and surface pores, significantly reducing the shear strength and durability of the joints [2]. Meanwhile, vibrators cannot penetrate densely reinforced areas, potentially causing concrete layering or segregation, thus affecting the concrete pouring quality.
Traditional concrete pouring quality assessment often relies on field tests and measured data, which has problems such as strong reliance on experience, high assessment costs, high trial-and-error costs, unclear multi-factor coupling mechanisms, and limited universality of the results. Therefore, there is an urgent need to simulate the concrete pouring process, establish a refined numerical simulation method for concrete flow within formwork, predict the size and location of defects after pouring, reveal the formation mechanism of void defects, and thus propose optimized concrete pouring techniques suitable for typical complex reinforced concrete joints.
The particle flow method is a kind of discrete element numerical simulation method based on microstructure of granular materials, used for simulating mechanical behavior [3,4], optimizing concrete materials and developing new types of concrete [5,6,7,8,9,10]. Since its proposal, this method has been applied to simulate the working performance of fresh concrete, and its feasibility has been widely verified in experiments [11,12]. For example, considering that continuum modeling methods (such as the finite element method) cannot reproduce the large amount of particle movement and rotation, Noor et al. [13] used the 3D particle flow program PFC3D as a tool to simulate the performance of fresh concrete. They directly solved the motion equations using an explicit time advancement method, qualitatively simulated the flow behavior of fresh concrete in slump, L-box, and V-funnel tests. Petersson [14] used the Discrete Element Method (DEM) based on PFC3D for numerical simulation and verified the feasibility of the particle flow method through L-box and J-ring tests. Mechtcherine et al. [15] proposed and implemented a rheological model for simulating fresh concrete based on the DEM, correlating key parameters such as the yield stress and bond strength of concrete. Numerical simulation of slump tests under three different yield stresses was conducted and quantitatively reliable results were obtained.
To more accurately simulate the rheological behavior of concrete, the research on contact model and simulation method has been developed [16,17,18,19,20]. Remond et al. [21] proposed a hard-core soft-shell model suitable for concrete flow simulation, modeling fresh concrete using composite particles composed of two concentric spheres. Rheological tests and slump test numerical simulations were conducted to show that this model can qualitatively simulate the rheological behavior of concrete. Considering the limitations of using spherical particles to simulate irregular coarse aggregates, Cui et al. [22] proposed a technique for rapidly generating irregular polyhedral particles based on an overlapping sphere algorithm to more realistically simulate the shape of concrete coarse aggregates. Through numerical simulations of slump and L-box tests, they found that using irregular polyhedra to simulate coarse aggregates improved simulation accuracy. Ramyar et al. [23] proposed a DFC model formulated within the framework of DEM to simulate the behavior of different types of fresh concrete. Each particle combined one coarse aggregate piece and a soft layer of embedding mortar in the model. The accuracy of the model was verified by comparing the test and simulation results of the slump test, L-box test, and V-funnel test.
The selection of parameters of fresh concrete in numerical simulation is very important, and domestic and foreign scholars have conducted in-depth research on the determination of model microscopic parameters [24,25,26]. Cao et al. [27] experimentally measured physical properties including density, friction coefficient, and recovery coefficient, and investigated the rheological characteristics of fresh concrete using the DEM and Box–Behnken Response Surface Method (RSM). Their study validated the effectiveness of RSM in calibrating surface energy parameters. Li et al. [28] developed a discrete numerical model for self-compacting concrete (SCC) using the parallel bonding model combined with excess mortar theory. By applying neural network algorithm for parameter inversion, they demonstrated that the discrete numerical model with inverse parameters could accurately simulate SCC flow patterns.
In summary, current research on fresh concrete rheological properties mainly focuses on numerical model development and simulation of standard concrete workability tests. The simulation of actual pouring processes in complex structures, such as concrete flow at typical reinforced concrete beam–column joints, needs further study. Currently, there is relatively little research on concrete void defects at typical joints. The formation mechanisms and influencing factors of defects have not been thoroughly explored, and existing studies can hardly provide effective suggestions for optimization of construction process parameters and structural design. Therefore, to propose a refined simulation method suitable for the concrete pouring process at beam–column joints of reinforced concrete structures, this paper uses three-dimensional particle flow method to numerically simulate the concrete pouring process at a frame structure joint. Firstly, slump and J-ring tests were conducted, and reinforced concrete beam–column joint pouring tests were designed and completed. Numerical models suitable for concrete flow simulation were established based on the particle flow method, and model parameters were inverted based on laboratory test results. Using the inverted parameters, joint pouring was simulated and compared with experimental results. Finally, seven sets of beam–column joint pouring numerical models with different design parameters were established to analyze the influence of parameters such as reinforcement layout, concrete fluidity, and pouring speed on pouring results, providing references for the optimization design of beam–column joint structures.

2. Three-Dimensional Particle Flow Method

2.1. Basic Theory of Particle Flow Method

The three-dimensional particle flow method overcomes the limitation of traditional continuum models in explaining particle movement and rotation. It explains the macroscopic mechanical behavior of materials from the perspective of microstructure and can well simulate the interaction laws of finite-sized particles within discontinuous media, making it suitable for simulating the concrete pouring flow process [29,30]. It is assumed that particle elements are rigid bodies with mass and no deformation, and can translate and rotate. By defining the physical properties of rigid particles, such as particle size, friction coefficient, and bond strength, and specifying the boundaries and loading conditions of the discrete system, contacts are generated between rigid particles according to interaction laws. The deformation simulation of discontinuous body under specific loads can be realized by iterative solution of force and displacement for all particles.
The basic interaction between particles is determined by the force–displacement relationship and Newton’s second law of motion. The force–displacement relationship links the relative displacement at the contact point between particle elements to the particle contact force. Newton’s second law of motion updates the motion state of particles according to the force and moment on the particle element. In the particle flow method, contact types are mainly divided into particle-to-particle contact and particle-to-wall contact. The contact plane position x c is the center of the interaction volume between the two contacting entities, and its normal direction n c is the direction from the first entity to the second entity, as shown in Figure 1.
The control equations for the motion state of each particle are Newton’s second law and the torque equation:
F i = m · ( x ¨ i g )
M i = I i · ω ˙ i
where F i is the resultant force on the particle; m is the particle mass; x ¨ i is the particle acceleration; g is the gravitational acceleration; M i is the resultant moment on the particle; I i is the principal moment of inertia of the particle; and ω ˙ i is the particle angular acceleration.
The relative motion of particles at the contact includes the relative translation velocity x ˙ and rotation velocity θ ˙ . The central difference method is used to solve the particle motion. Considering particle acceleration within time step Δ t , the position coordinates and angular displacement of the particle at time ( t + Δ t ) are, respectively as follows:
x i ( t + Δ t ) = x i ( t ) + x ˙ i ( t + Δ t / 2 ) · Δ t
θ i ( t + Δ t ) = θ i ( t ) + θ ˙ i ( t + Δ t / 2 ) · Δ t
where x i ( t + Δ t ) and x i ( t ) are the particle displacement at time ( t + Δ t ) and t , respectively; x ˙ i ( t + Δ t / 2 ) is the particle velocity at time ( t + Δ t / 2 ) ; θ i ( t + Δ t ) and θ i ( t ) are the particle angular displacement at time ( t + Δ t ) and t , respectively; and θ ˙ i ( t + Δ t / 2 ) is the particle angular velocity at time ( t + Δ t / 2 ) .
To obtain an accurate solution, it is necessary to determine an appropriate time step. An excessively large time step may lead to instability, while a too small time step may result in excessively long simulation times. In PFC, time step includes fixed time step, automatic time step, and time step scaling. Due to the large model size leading to a long convergence time and a greater focus on the steady-state solution, time step scaling is adopted. A fictitious inertial mass is calculated for each particle, with its default stable time step set to 1. The particle velocity will be scaled proportionally to ensure stability.
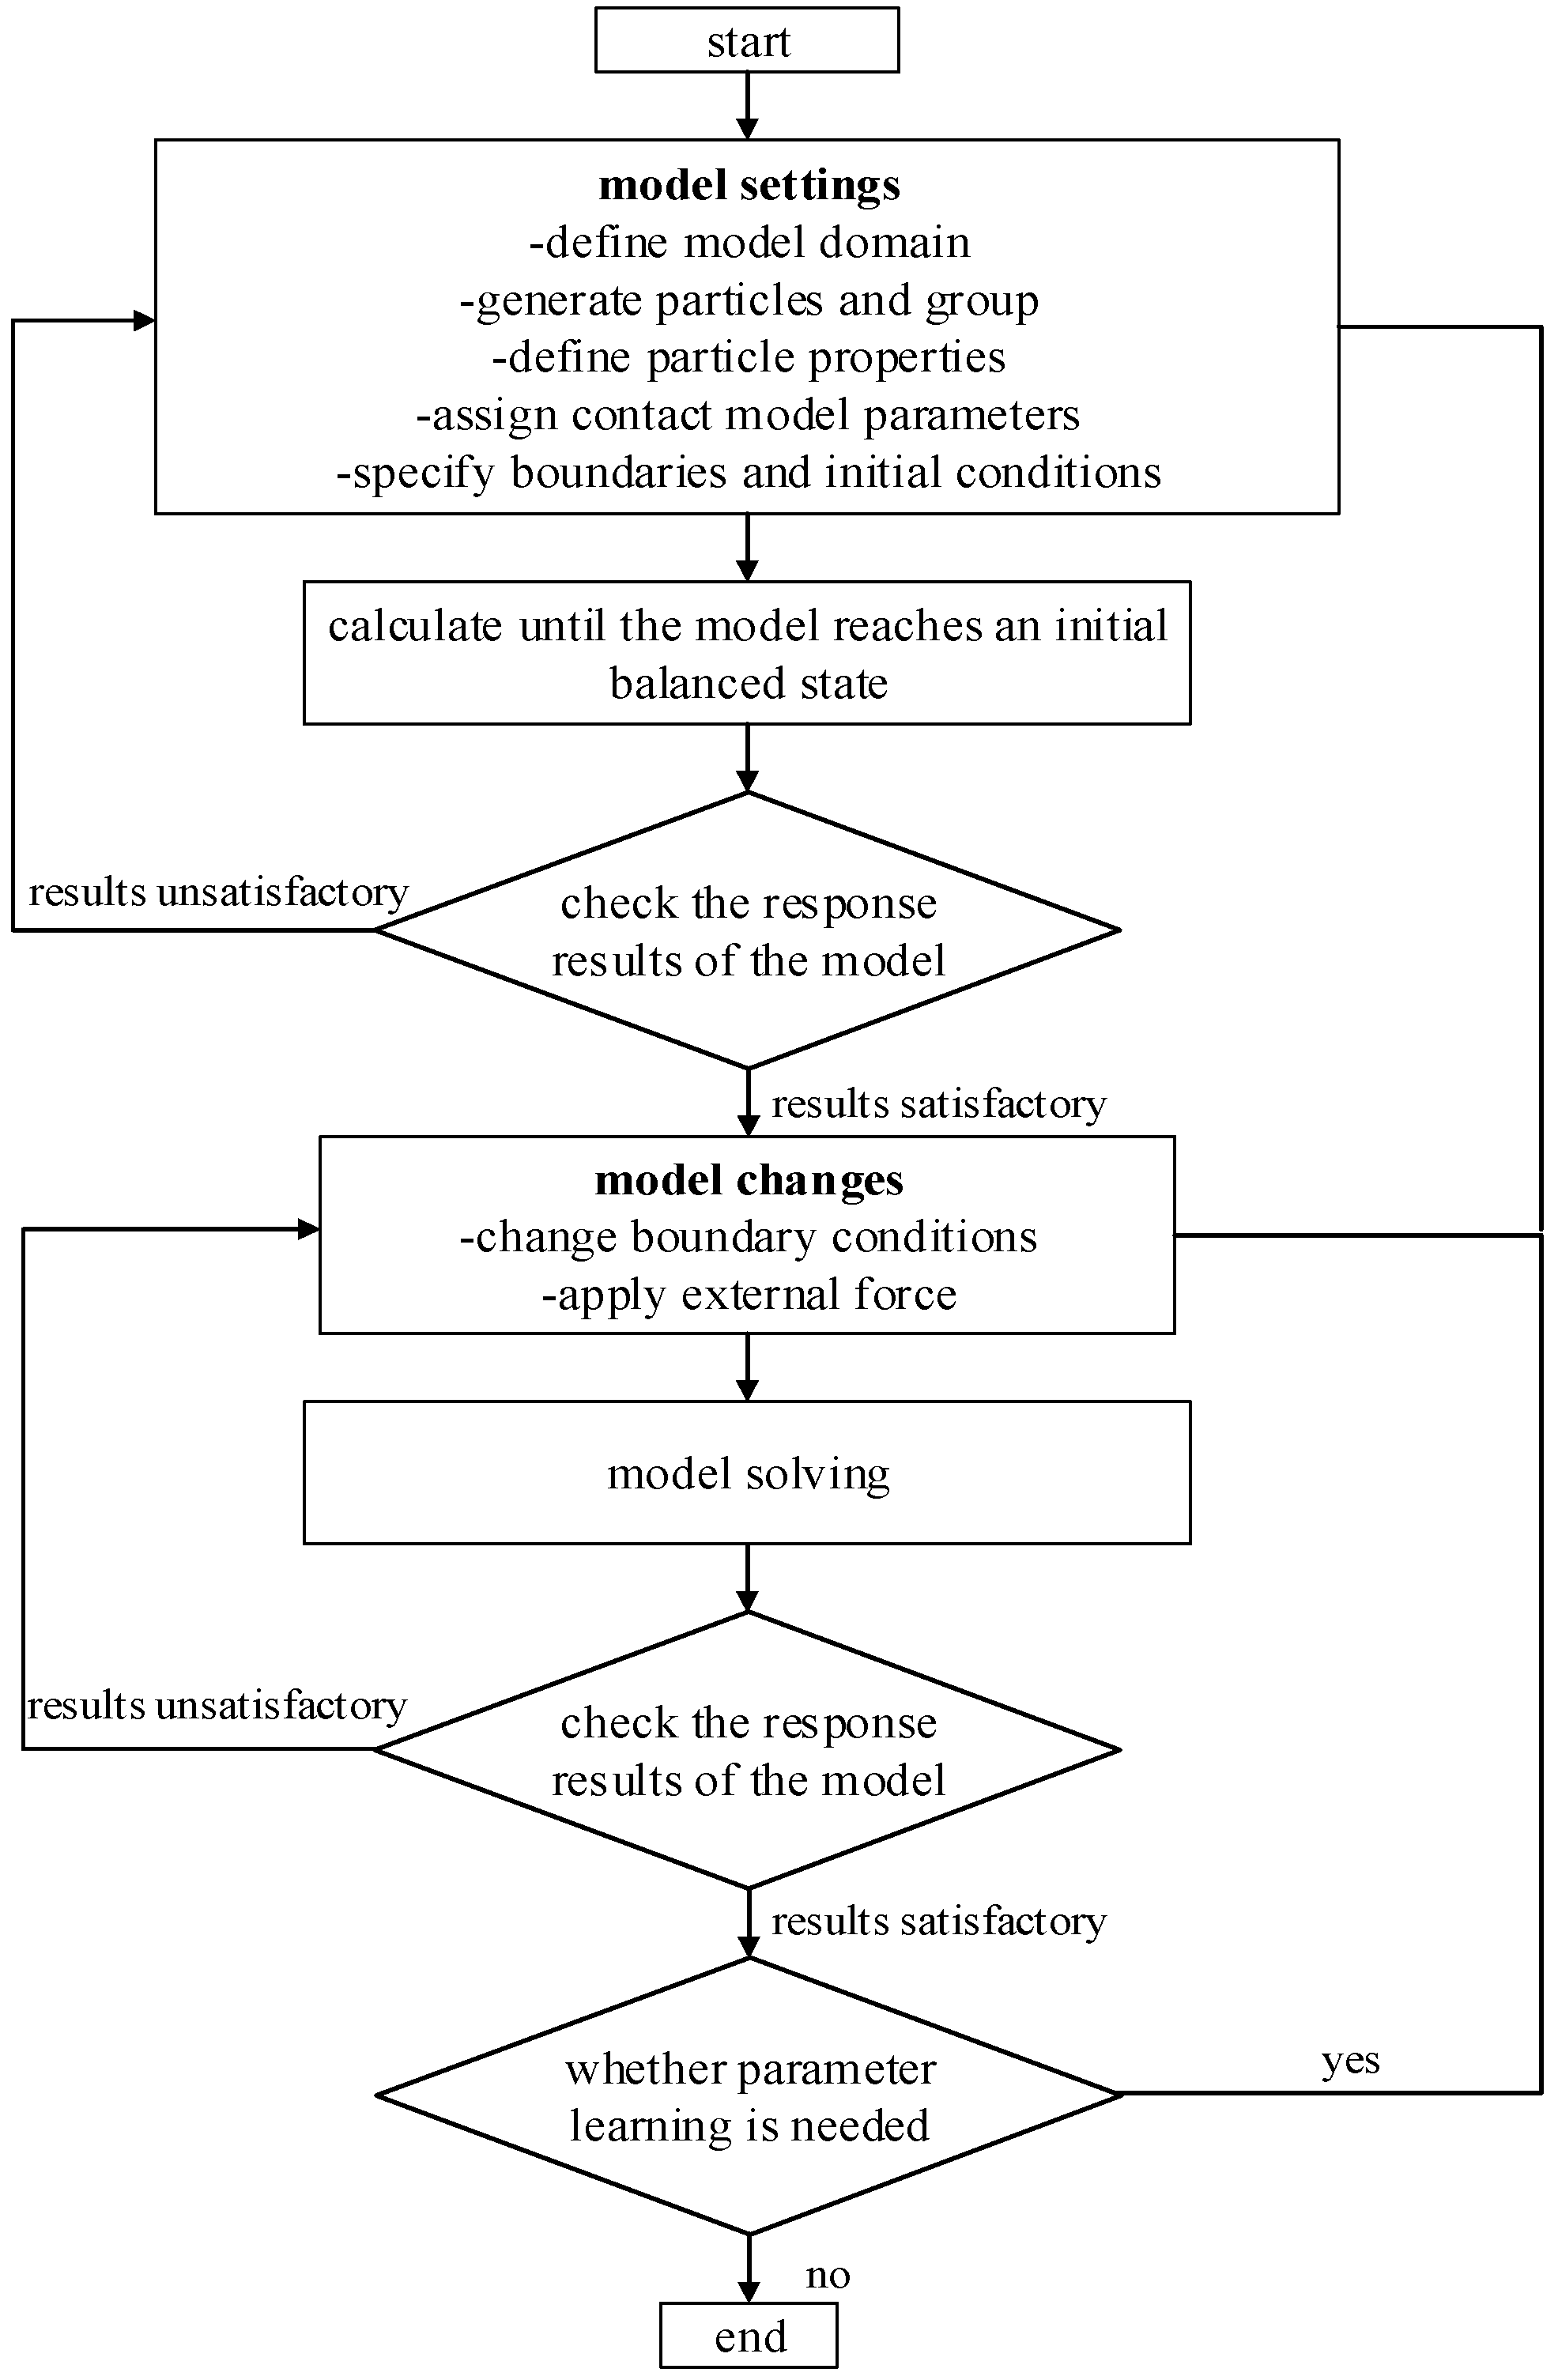
The modeling process of 3D particle flow method is shown in Figure 2, which mainly includes model setting, condition change and model solving. An explicit finite difference method is used for iterative solving. Each cycle requires applying the physical equations of the force–displacement relationship to all contacts in the system, applying Newton’s second law of motion to all particles in the system, and updating the positions of walls and particles. Before the cycle begins, the data used during the cycle is initialized. Then it enters a sequence of cycles composed of multiple single-step cycles until the preset solution limit of the termination cycle is met, obtaining numerical simulation results in line with the calculation expectations. Convergence can typically be determined by specifying solution targets, such as setting the solution to achieve a minimum magnitude of unbalanced force, a certain solution duration, or a number of cycles. Given the large scale of the model, the unbalanced force remains relatively unstable in the steady state. Therefore, based on preliminary tests, the number of cycles is set to 500,000 to ensure particles cease movement and the model tends to stabilize, indicating that convergence has been achieved.

2.2. Rolling Resistance Linear Model

Based on the linear model, the rolling resistance linear model introduces resistance moments to prevent excessive rotation of particles due to rolling, which can be used to simulate the energy loss generated by friction between particles and walls. According to the force–displacement relationship, the contact force and moment in the model are expressed as follows:
F c = F l + F d
M c = M r
where F d is the damping force; F l is the linear force; and M r is the rolling resistance moment, updated according to the following equation:
M r : = M r k r Δ θ b
where Δ θ b is the relative bending rotation increment; and k r is the rolling resistance stiffness, given by the following:
k r = k s R ¯ 2
where k s is the elasticity coefficient of the tangential line; and R ¯ is the contact effective radius, given by the following:
1 R ¯ = 1 R 1 + 1 R 2
where R 1 and R 2 are the radii of two spheres.

2.3. JKR Contact Model

The contact constitutive model determines the contact properties between particle units. The JKR (Johnson–Kendall–Roberts) contact model is an extension of the Hertz contact model [31]. This model considers the suction caused by van der Waals effects and is often used to simulate adhesive materials with capillary forces or liquid bridge forces. Tabor [32] conducted experiments on adhesion forces between soft elastic materials, and concluded that the JKR model was more suitable for contacts with large deformation. Johnson et al. [33] defined the applicable scope of different contact models by considering the ratio of elastic deformation to surface force, as well as the apparent average load caused by applied forces and adhesion forces. They demonstrated that the JKR model was applicable to high elastic deformation. Fresh concrete undergoes significant flow deformation during pouring, with particle mechanical responses aligning with the application conditions of the JKR model. Existing research has shown that this model demonstrates good applicability for simulating the flow behavior of fresh concrete [34,35]. Therefore, this paper adopts the JKR contact model to describe inter-particle contact.
The contact force and moment in the JKR contact model are expressed as follows:
F c = F J K R + F d
M c = M r
where F J K R is the nonlinear force, decomposed into normal and tangential directions:
F J K R = F n J K R + F s J K R
The attraction between particles is achieved by introducing the material surface energy γ . The normal attractive force is as follows [31]:
F a d h = 2 π a 2 γ
where a is the radius of the circular contact area.
According to the contact stress distribution, the total normal contact force can be obtained as follows:
F n J K R = 4 E * a 3 3 R e 16 π γ E * a 3
where E * is the equivalent elastic modulus; and R e is the equivalent radius of the contact system.
From Equation (14), the normal deformation is nonlinear. The deformation δ n can be obtained from the following:
δ n = a R e ( 4 π γ a E * ) 1 2
When a certain pulling force is applied to the two contacting particles to break the contact, the maximum pulling force between the contacts is defined as the tensile force. Its size depends only on the particle surface energy and radius:
F p o = 3 π γ R e
The tangential component F s J K R is updated incrementally and can be obtained from the following:
F s [ n e w ] J K R = F s [ b e f o r e ] J K R + k s t Δ δ s
where Δ δ s is the relative shear displacement increment; and k s t is the tangential shear stiffness, given by the following [36]:
k s t = 8 G * a
where G * is the effective shear modulus.

3. Materials and Methods

3.1. Experimental Materials

Reinforced concrete beam–column joints are key parts of frame structures, typically with dense and spatially interwoven reinforcement, which hinders concrete flow and can easily lead to issues such as insufficient compaction and uneven aggregate distribution during construction, subsequently forming internal pores or honeycomb void defects. Since vibration is difficult to achieve during the pouring process, SCC is used to ensure good filling performance. The concrete mix proportion used in the test is shown in Table 1, and the main raw materials are coarse aggregate, fine aggregate, cement, fly ash, water reducer, and tap water. The coarse aggregate was limestone crushed stone with a continuous gradation of 5–20 mm shown in Table 2 and an apparent density of 2760 kg/m3. The fine aggregate was medium sand with Zone II gradation. The cement was ordinary Portland Cement PO42.5, the water reducer was a slump-retaining high performance water reducer, and the water was from the municipal water supply in Beijing.

3.2. Standard Tests and Joint Pouring Test

According to Technical Specification for Application of Self-compacting Concrete (JGJ/T 283-2012) [37], slump flow tests and J-ring tests were conducted to evaluate its filling ability and passing ability. In addition, to further validate the accuracy of the particle flow method, a beam–column joint pouring test was designed.

3.2.1. Slump Flow Test

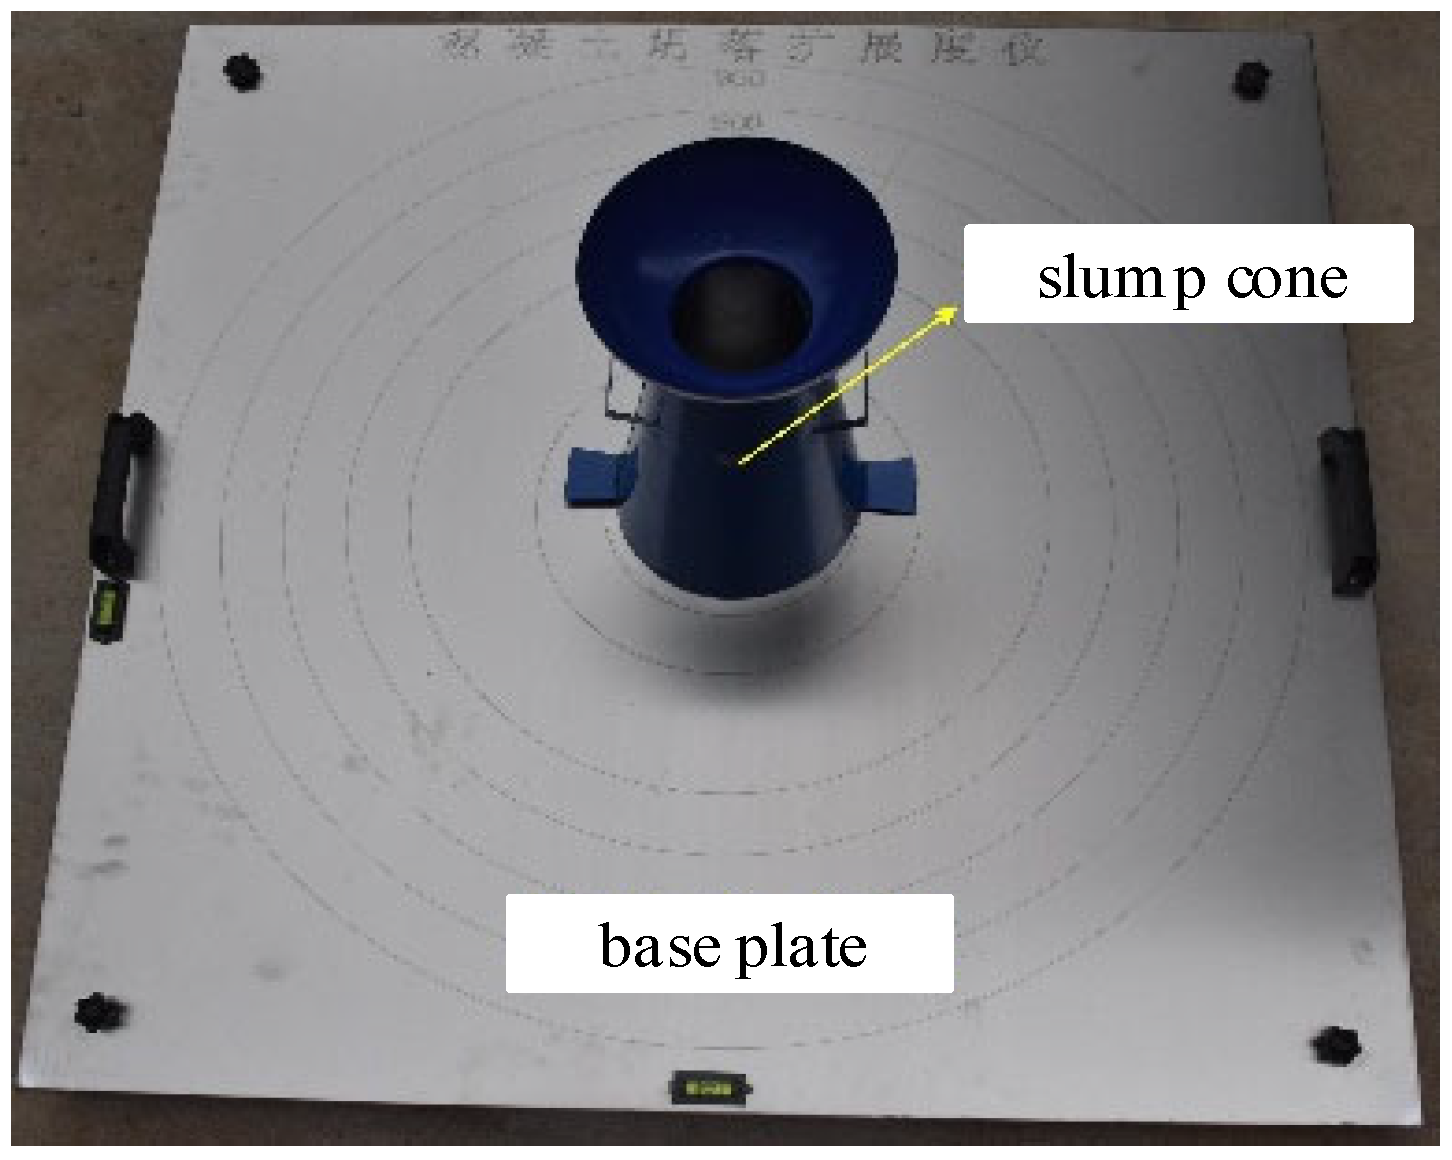
The slump flow test device mainly includes a slump cone and a base plate, as shown in Figure 3. During the test, filled the slump cone with concrete at once without vibration, and smoothed the concrete surface with a trowel. Then lifted the slump cone vertically and quickly [38]. When flow ceased and stabilized, recorded the slump height H s and calculated the slump flow D s by averaging the spread diameters measured in two orthogonal directions. A larger slump flow indicates better concrete fluidity and filling ability. Considering the dispersion of test results, two slump flow tests were conducted to reduce errors, and the same applied to the J-ring test.

3.2.2. J-Ring Test

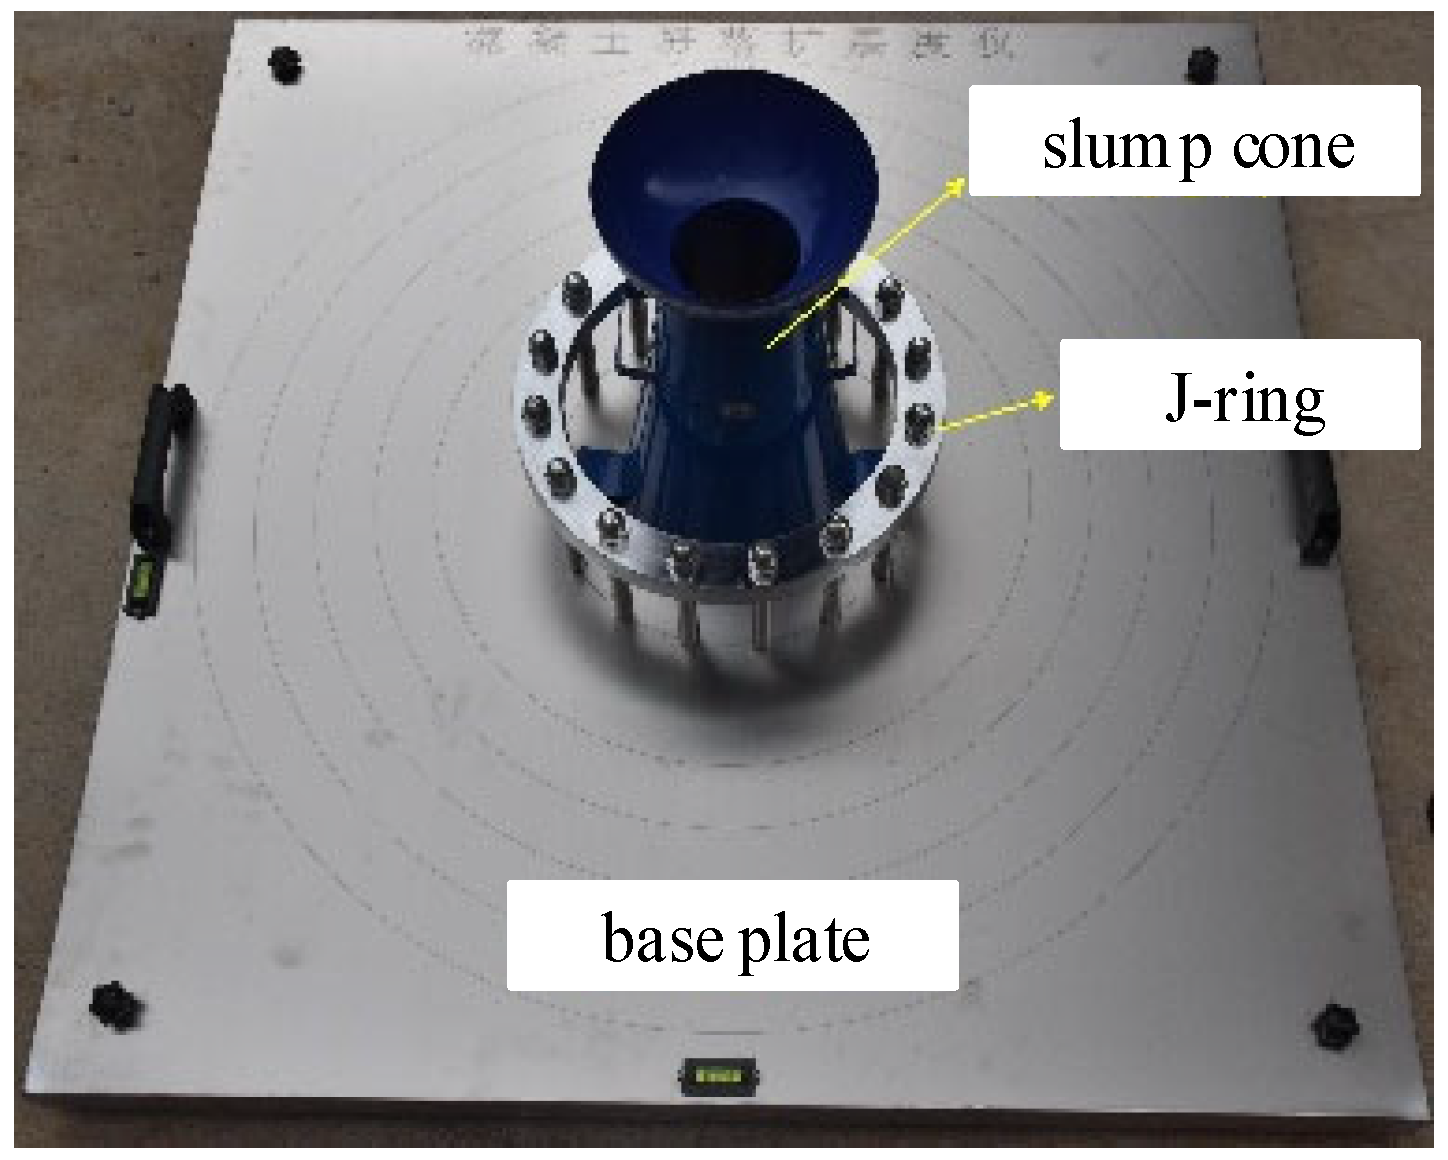
The J-ring test is mainly used to evaluate the passing ability of fresh concrete. During the test, a J-ring was added to the slump test device, as shown in Figure 4. The operating steps were the same as the slump test. After the test, recorded the J-ring spread D J and the slump height H J , and calculated the difference between the J-ring spread D J and the slump flow D s . A larger difference indicates weaker passing ability of the mixture, and aggregate blocking may occur during the pouring process.

3.2.3. Joint Pouring Test

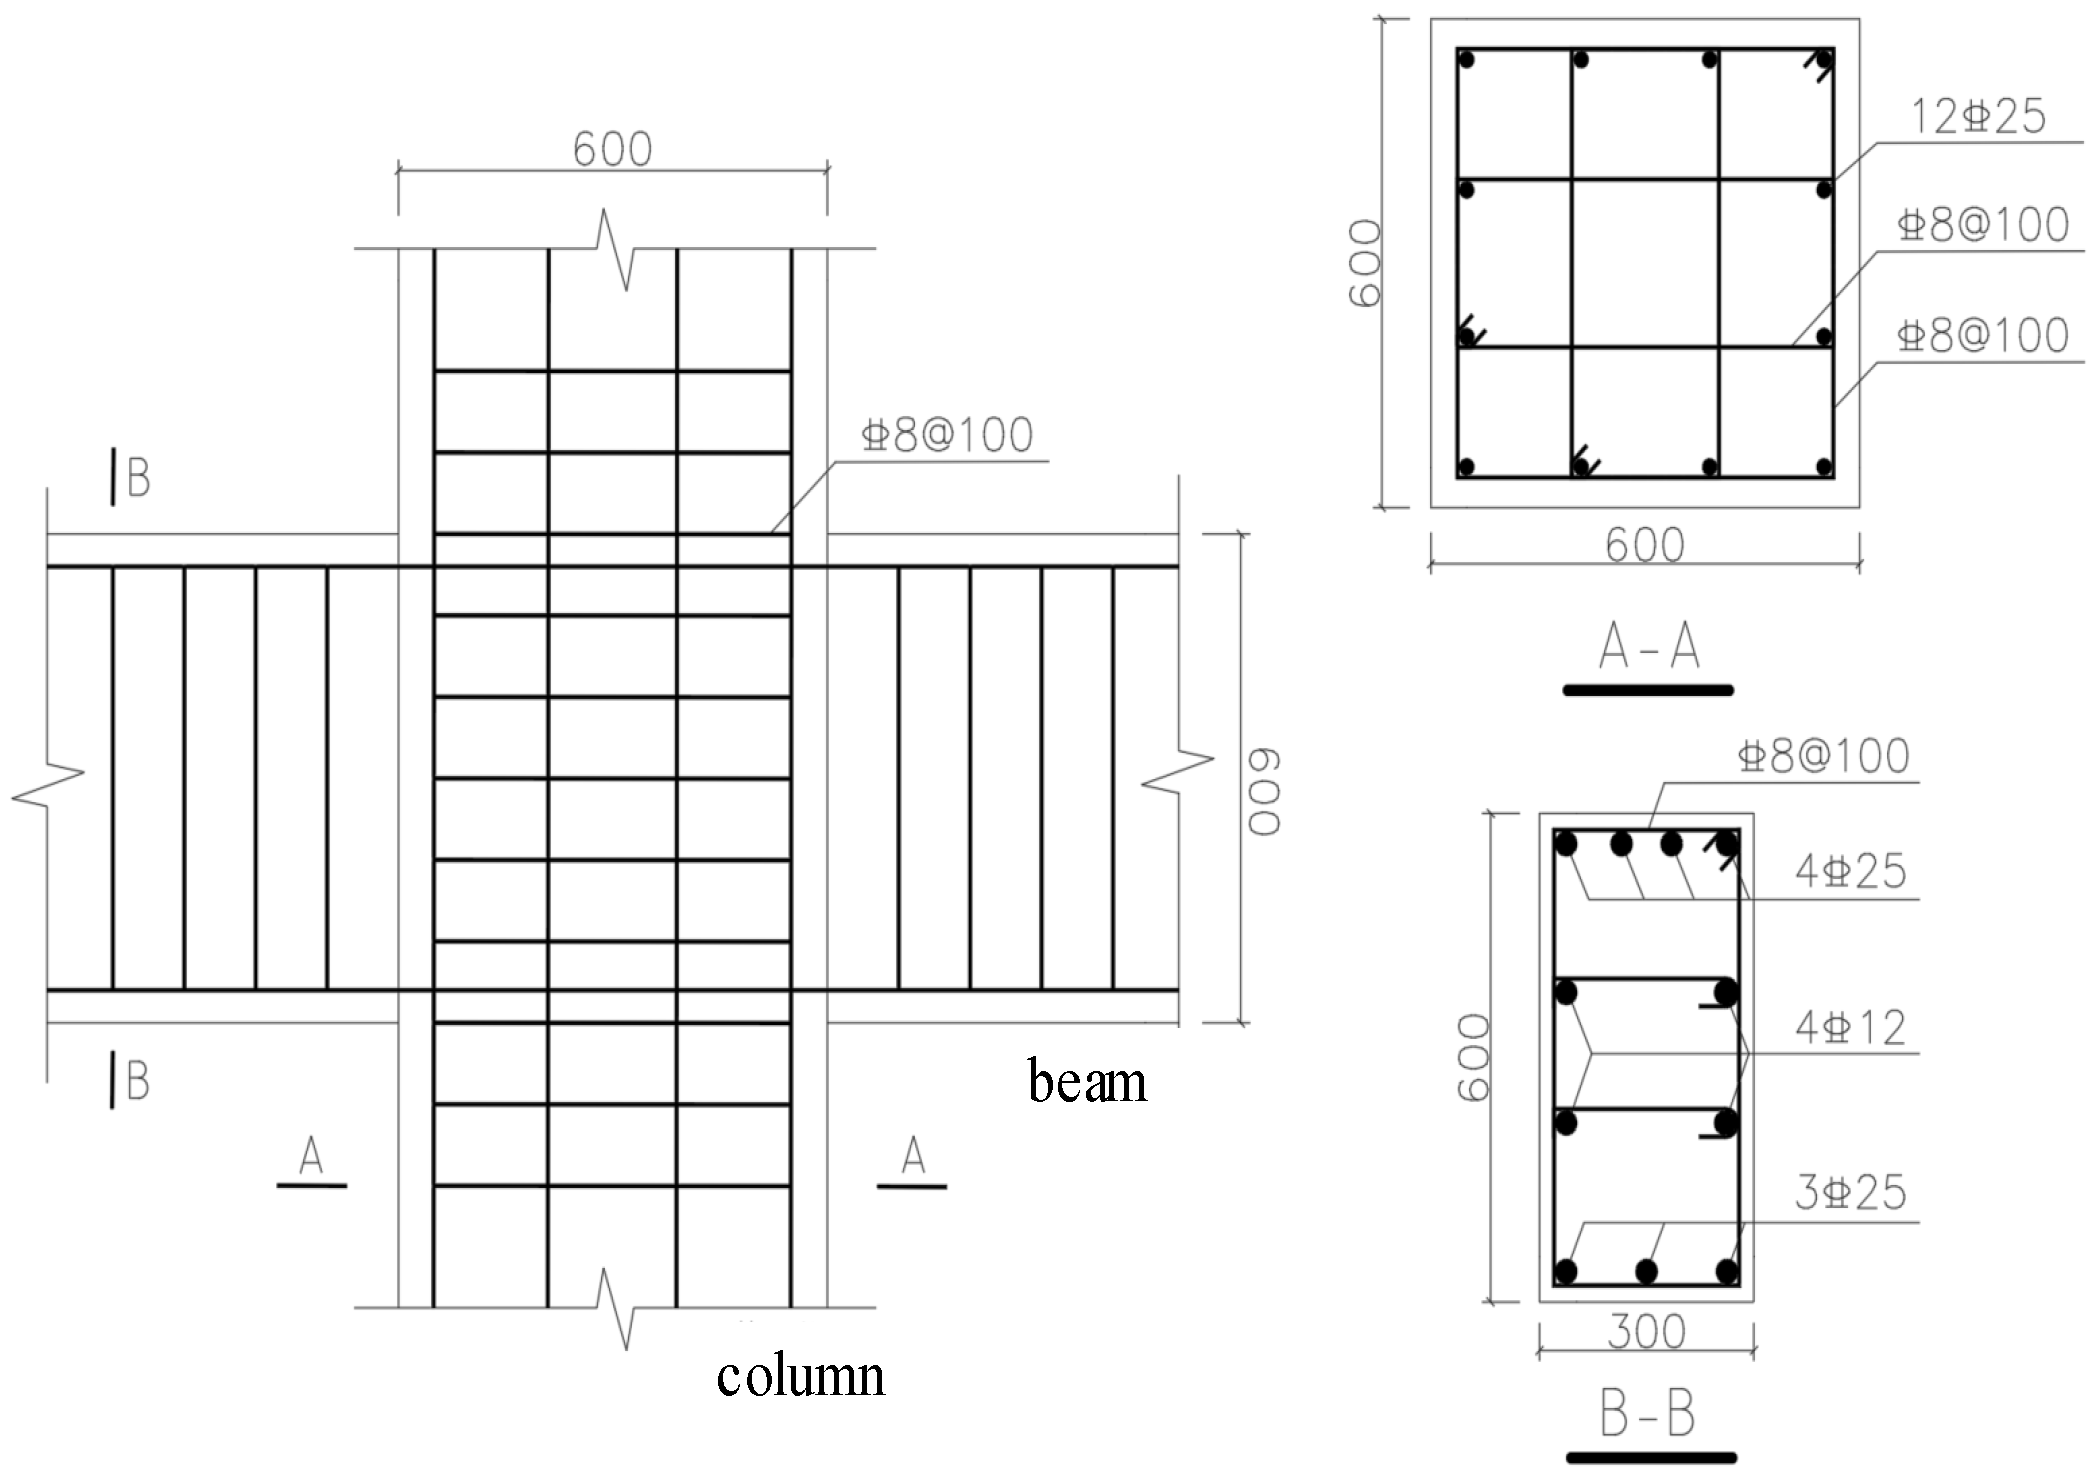
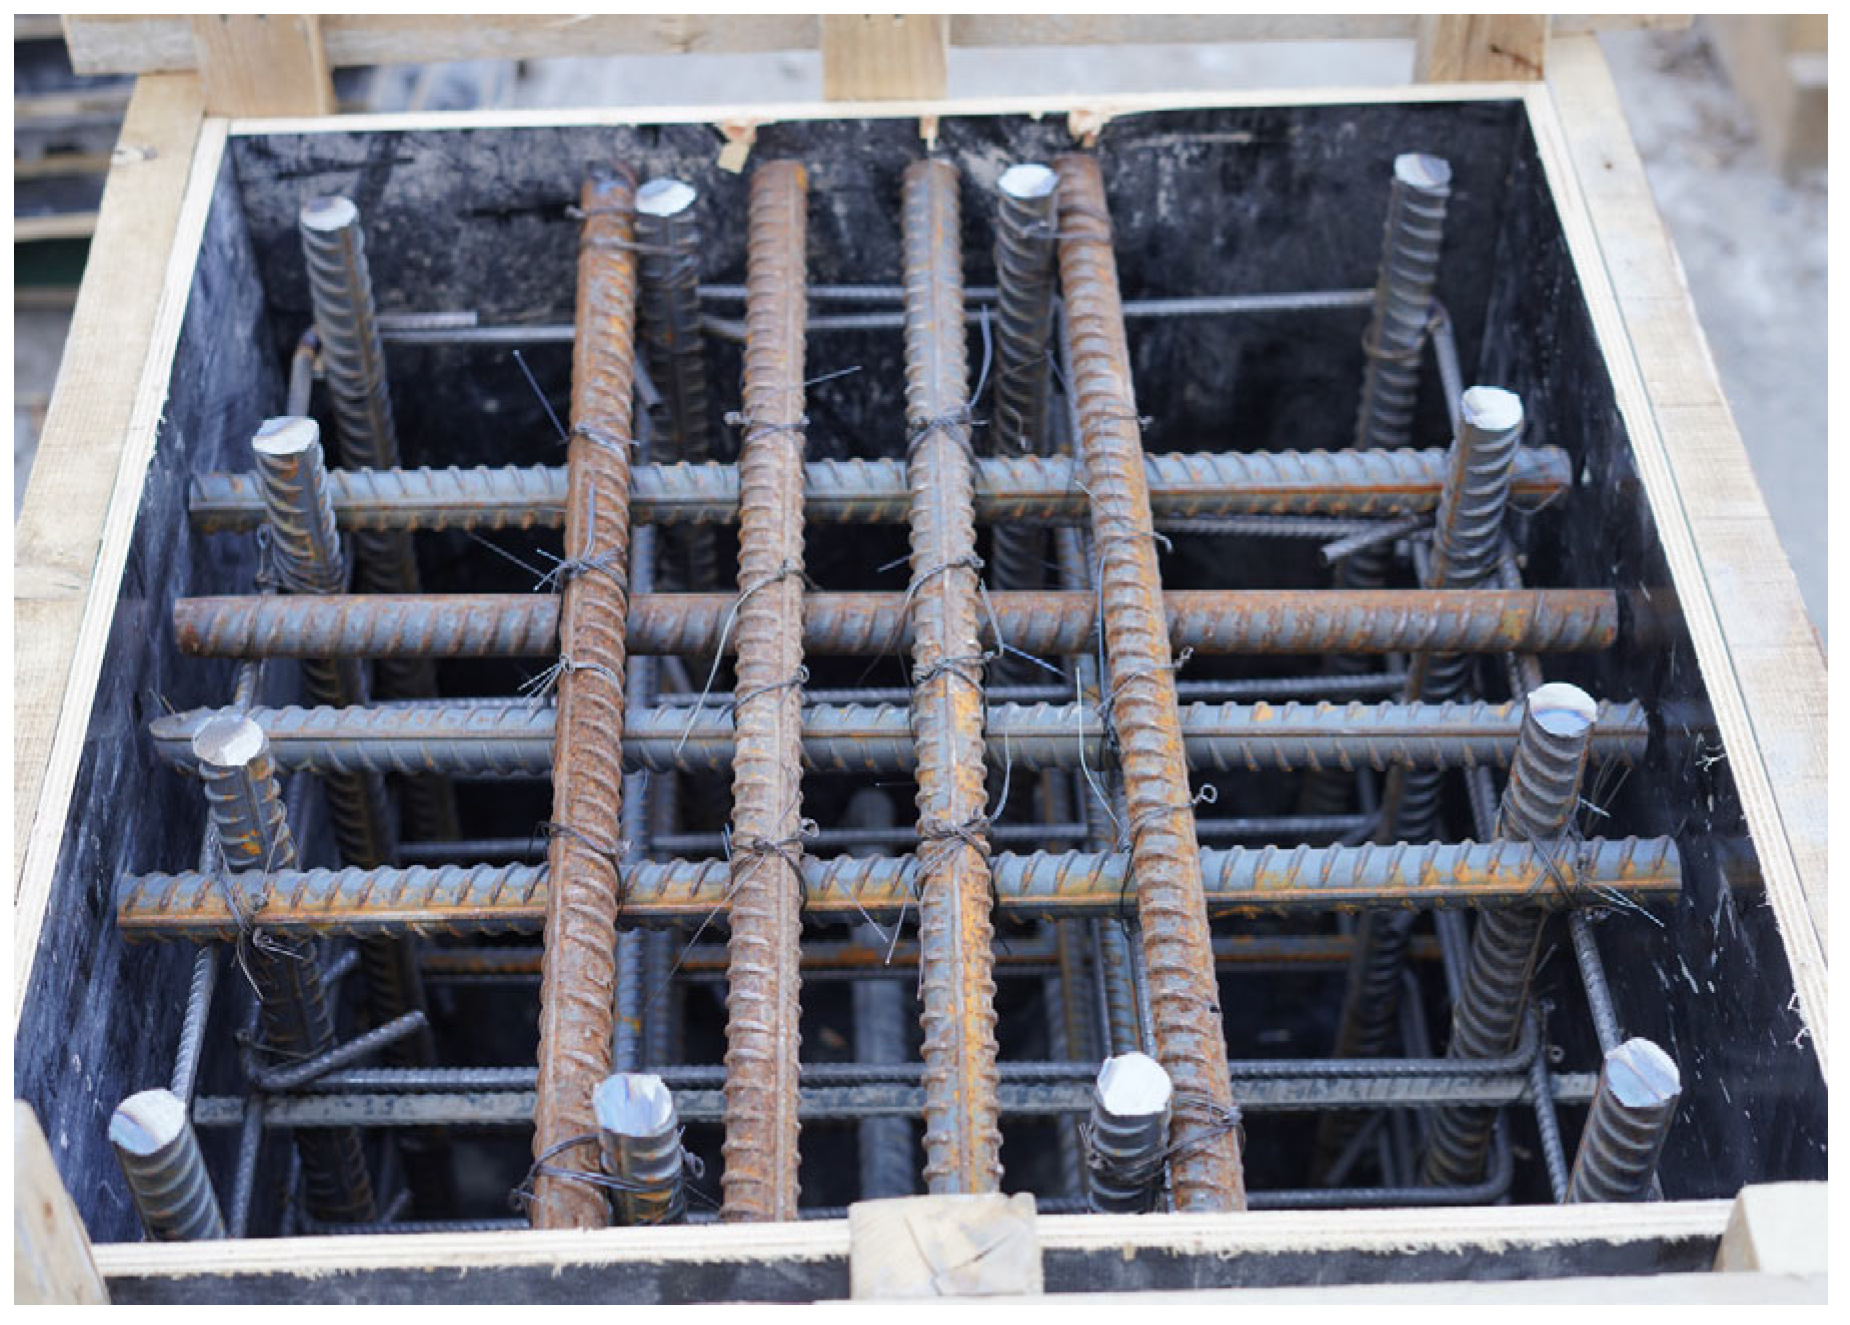
Specimen J1 was designed for a joint of a frame structure. Its dimensions and reinforcement are shown in Figure 5. The beam–column joint specimen is shown in Figure 6. The column cross-section size was 600 mm × 600 mm, configured with 12 HRB400 longitudinal bars with a diameter of 25 mm, symmetrically arranged with 4 bars on each side. The cover thickness was 50 mm. The joint core used a six-limb composite stirrup, with HRB400 stirrups of 8 mm diameter and 100 mm spacing, continuously passing through the column and the orthogonal bidirectional beam areas. The cross-sectional dimensions of the beams in the orthogonal direction were both 300 mm × 600 mm. The top of each beam was configured with 4 tension bars of 25 mm diameter, and the bottom was configured with 3 compression bars of 25 mm diameter. To avoid spatial conflicts, the top longitudinal bars of the bidirectional beams were arranged in layers. Each beam web was configured with two rows of HRB400 structural waist muscle of a 12 mm diameter. The beam stirrups did not enter the joint core.

3.3. Numerical Simulation

3.3.1. Slump Model Establishment

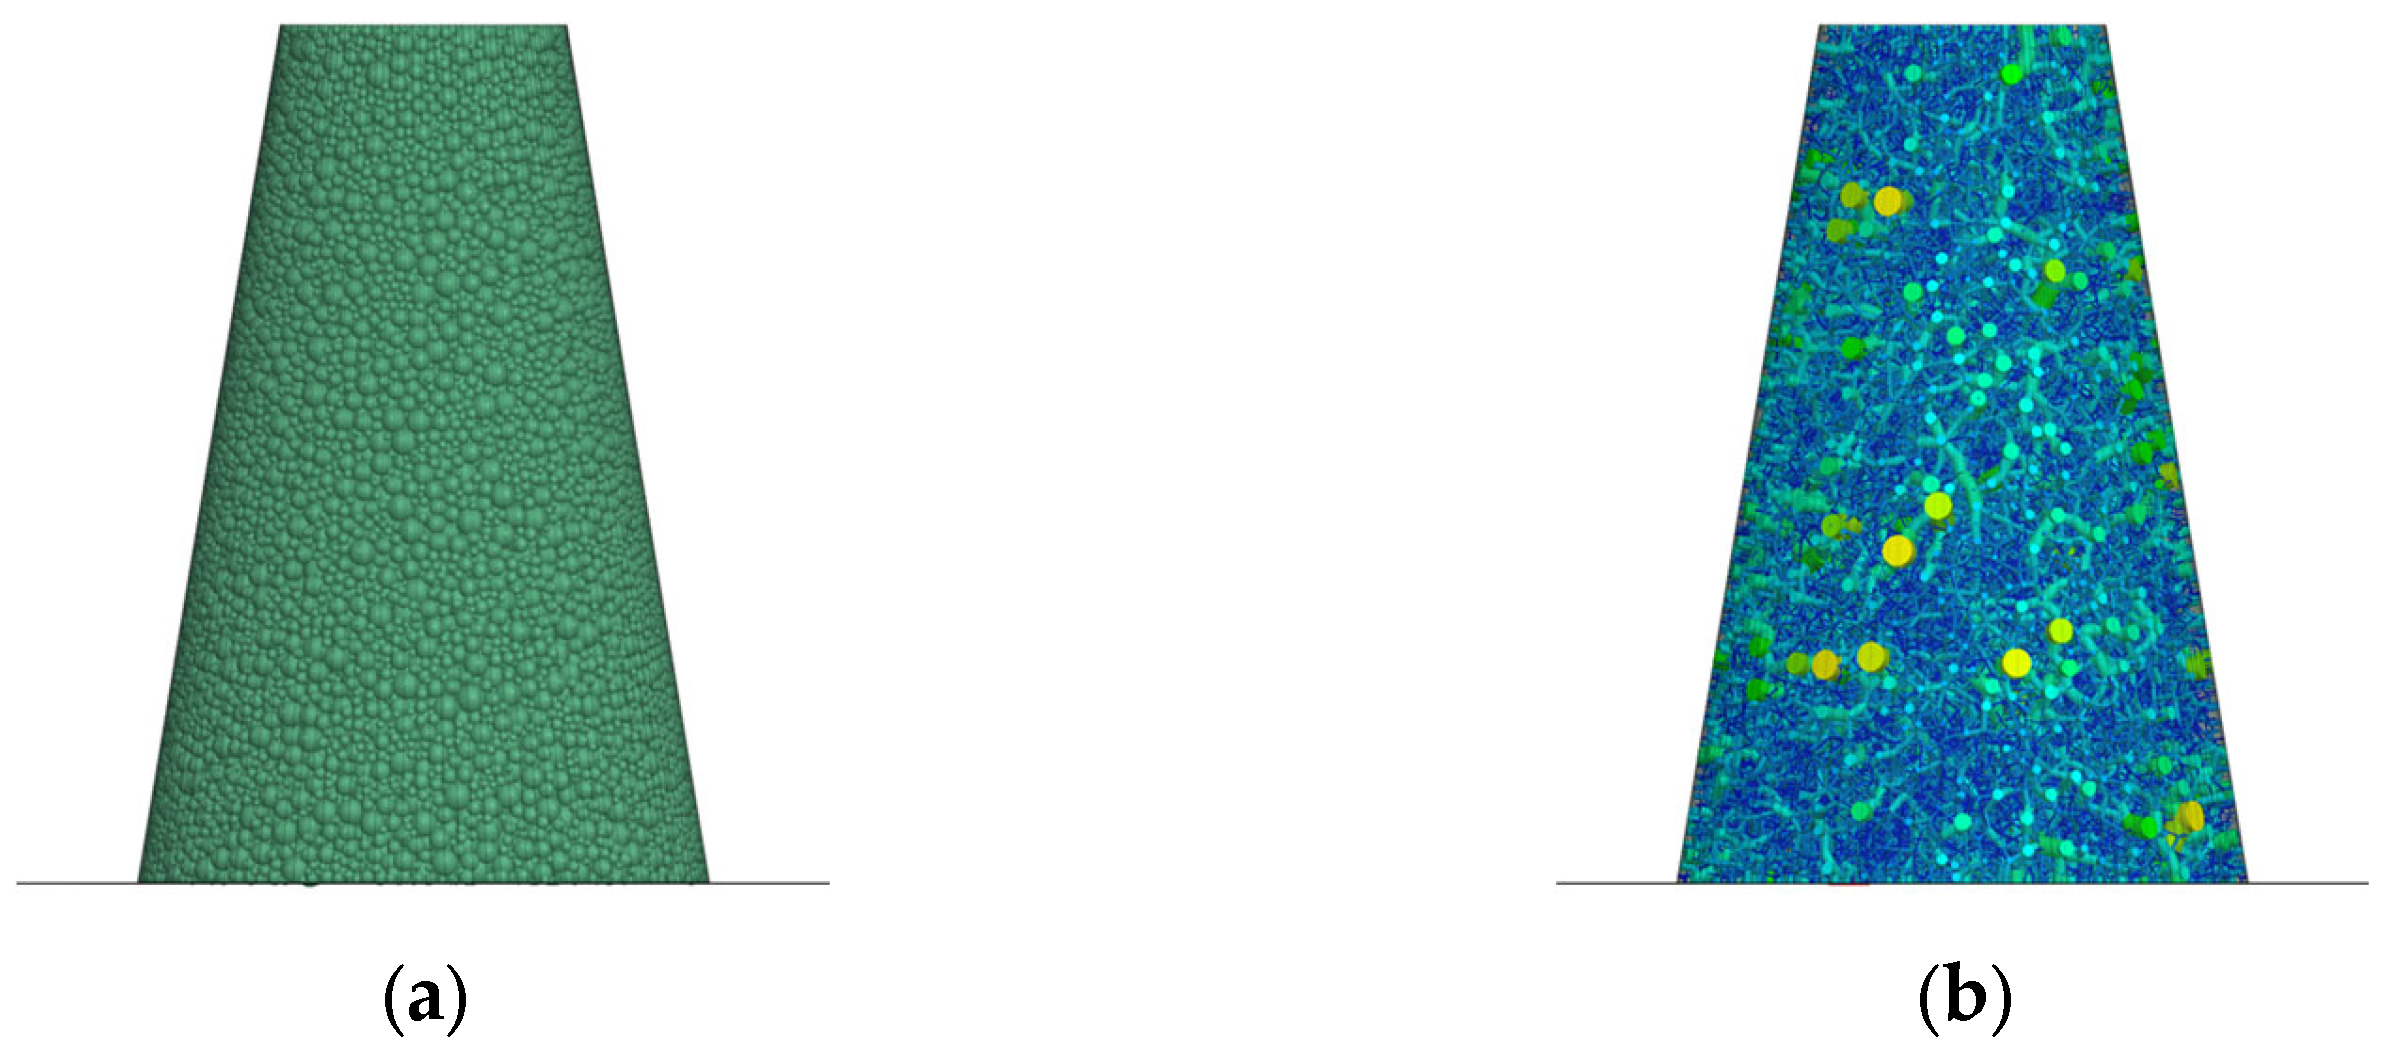
A concrete slump test model was established in PFC3D software (version 7.0). The fresh concrete is discretized by using single-phase unit model, coarse aggregates were simulated with spherical particles of the same particle size distribution as in Table 2. The ground and slump cone were simulated using wall elements. The enveloping and adhesive effect of mortar on coarse aggregates was considered through the JKR contact model between particles. The rolling resistance linear model was used between particles and wall elements to simulate energy loss due to friction. The numerical slump model is shown in Figure 7. On this basis, the vertical lifting speed of the slump cone was set to 0.15 m/s, consistent with laboratory test conditions. After the particles stopped moving, the slump flow and slump height results were obtained.

3.3.2. Model Parameter Calibration

When simulating the flow of fresh concrete, the microscopic parameters of the model need to be calibrated. The contact parameters between particles and wall elements mainly include the collision recovery coefficient, static friction coefficient, and rolling friction coefficient, which need to be calibrated through indoor tests. Li et al. [34] used an inclinometer to measure the collision recovery coefficient and friction coefficients between particles and wall elements multiple times. They suggested an average collision recovery coefficient of 0.248, an average static friction coefficient of 0.228, and an average rolling friction coefficient of 0.107 between particles and wall elements. Based on these reference parameters, this paper measured a static friction coefficient of 0.223, and a rolling friction coefficient of 0.146 between coarse aggregate and the slump plate. The collision recovery coefficient from impact testing was determined to be 0.25, which closely matched the reference values. As shown in Figure 4, the impact rebound device operated by releasing coarse aggregate particles from height H to initiate free-fall motion. After colliding with the slump plate, the particles rebound to a height h, and the collision recovery coefficient is given by the following:
e = h / H
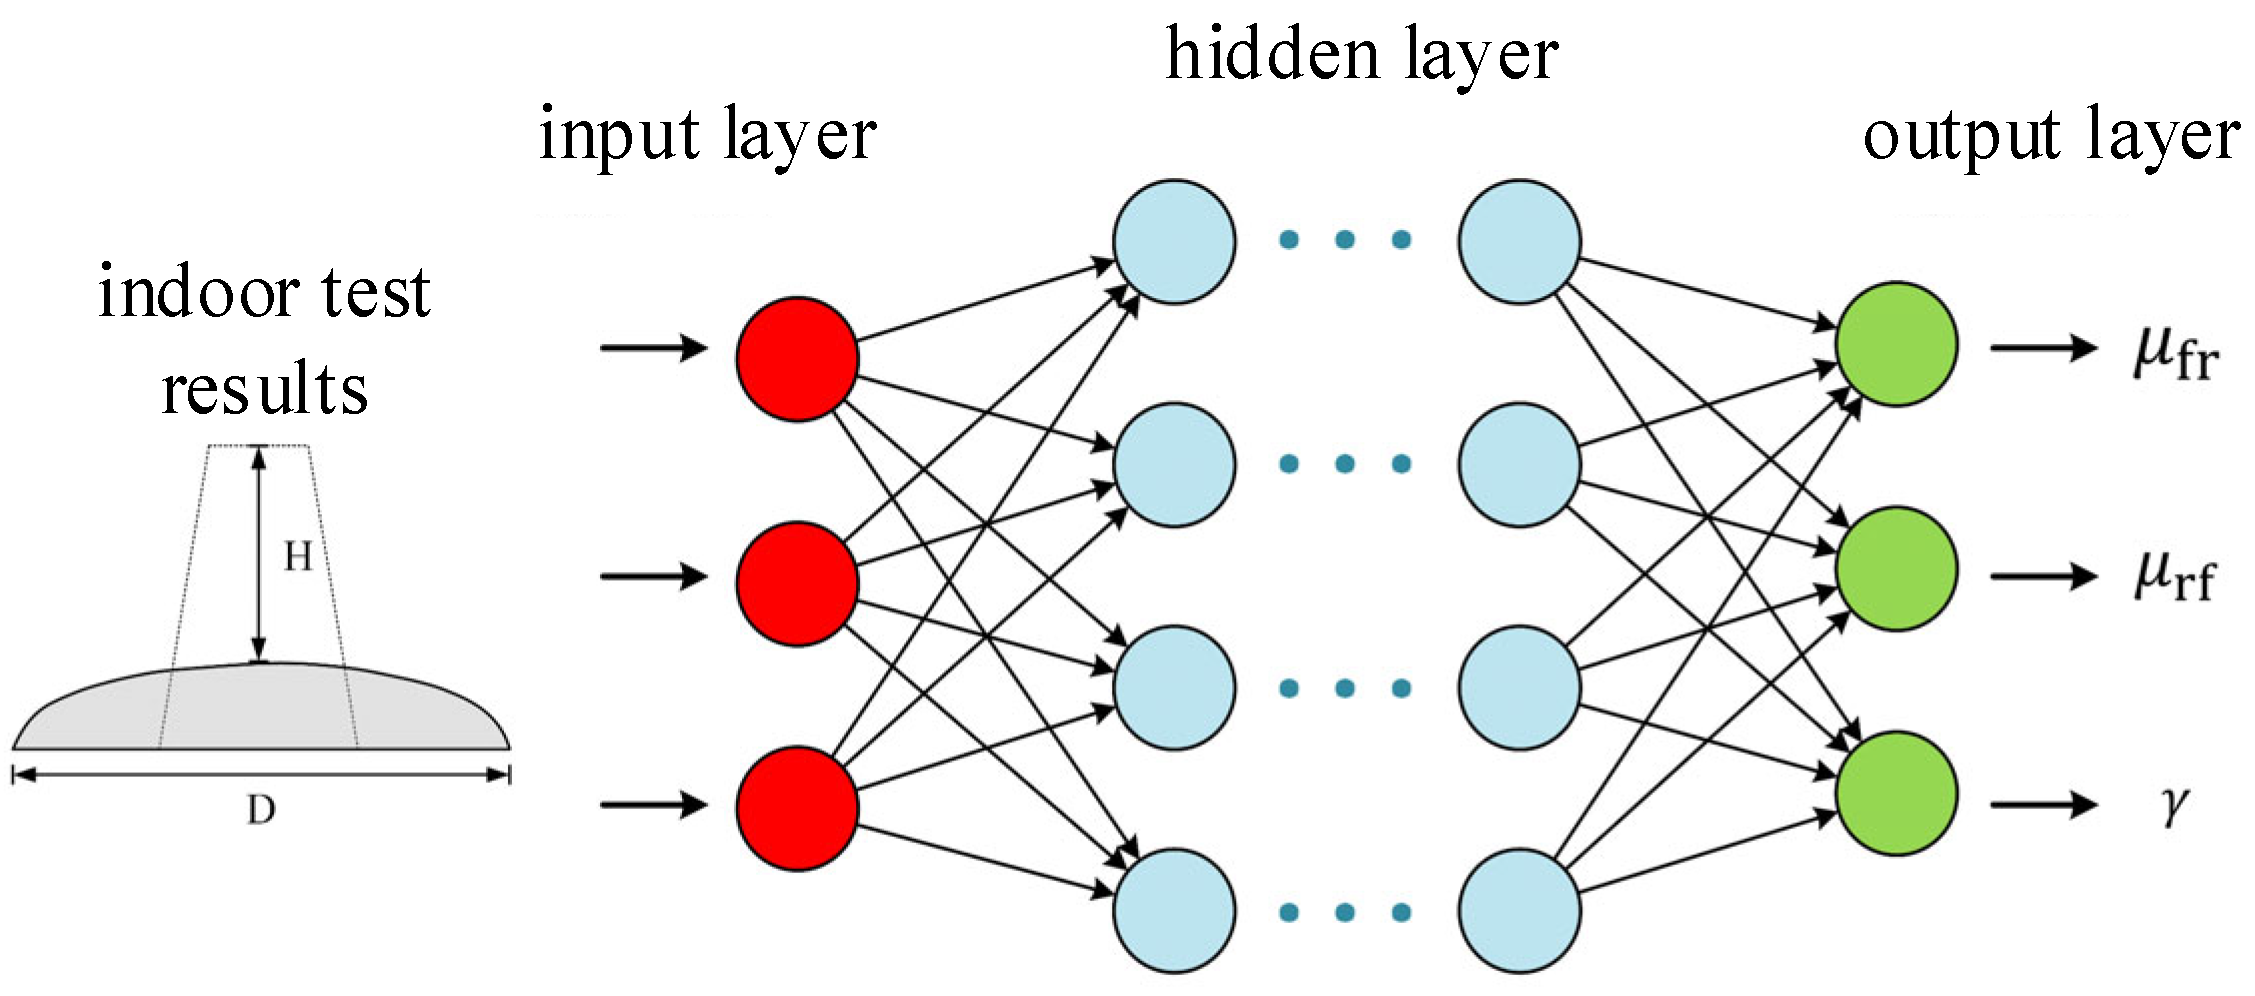
The contact parameters between particles mainly include sliding friction coefficient μ f r , rolling friction coefficient μ r f , and surface energy E a d in the JKR contact model. Through preliminary calculation and comparison, the analysis range for μ f r and μ r f was determined to be 0.05~0.5, and the analysis range for E a d was determined to be 0.1~0.5. To more accurately calibrate the microscopic parameters of the contact model, a neural network parameter inversion algorithm was introduced. The target output parameters were μ f r , μ r f , and E a d . The objective function was defined as the minimum error between the laboratory test observed value X and the numerical simulation result X * , expressed by the following equation:
M i n   f ( μ f r , μ r f , E a d ) = [ ( X X * ) 2 ]
where X = ( D , H ) ; X * = ( D * , H * ) ; D and D * are the experimental and numerical simulation slump flows, respectively; and H and H * are the experimental and numerical simulation slump heights, respectively.
Figure 8 shows the schematic diagram of the neural network parameter inversion algorithm. The inversion algorithm used a Multi-Layer Perceptron (MLP) neural network as the main architecture. The laboratory slump test results were input into the neural network model for parameter inversion, obtaining the values of μ f r , μ r f , and E a d as 0.138, 0.222, and 0.151, respectively. The inverted parameters were finally input into the slump test model for verification.

4. Analysis of Test and Numerical Simulation Results

4.1. Slump Test Analysis

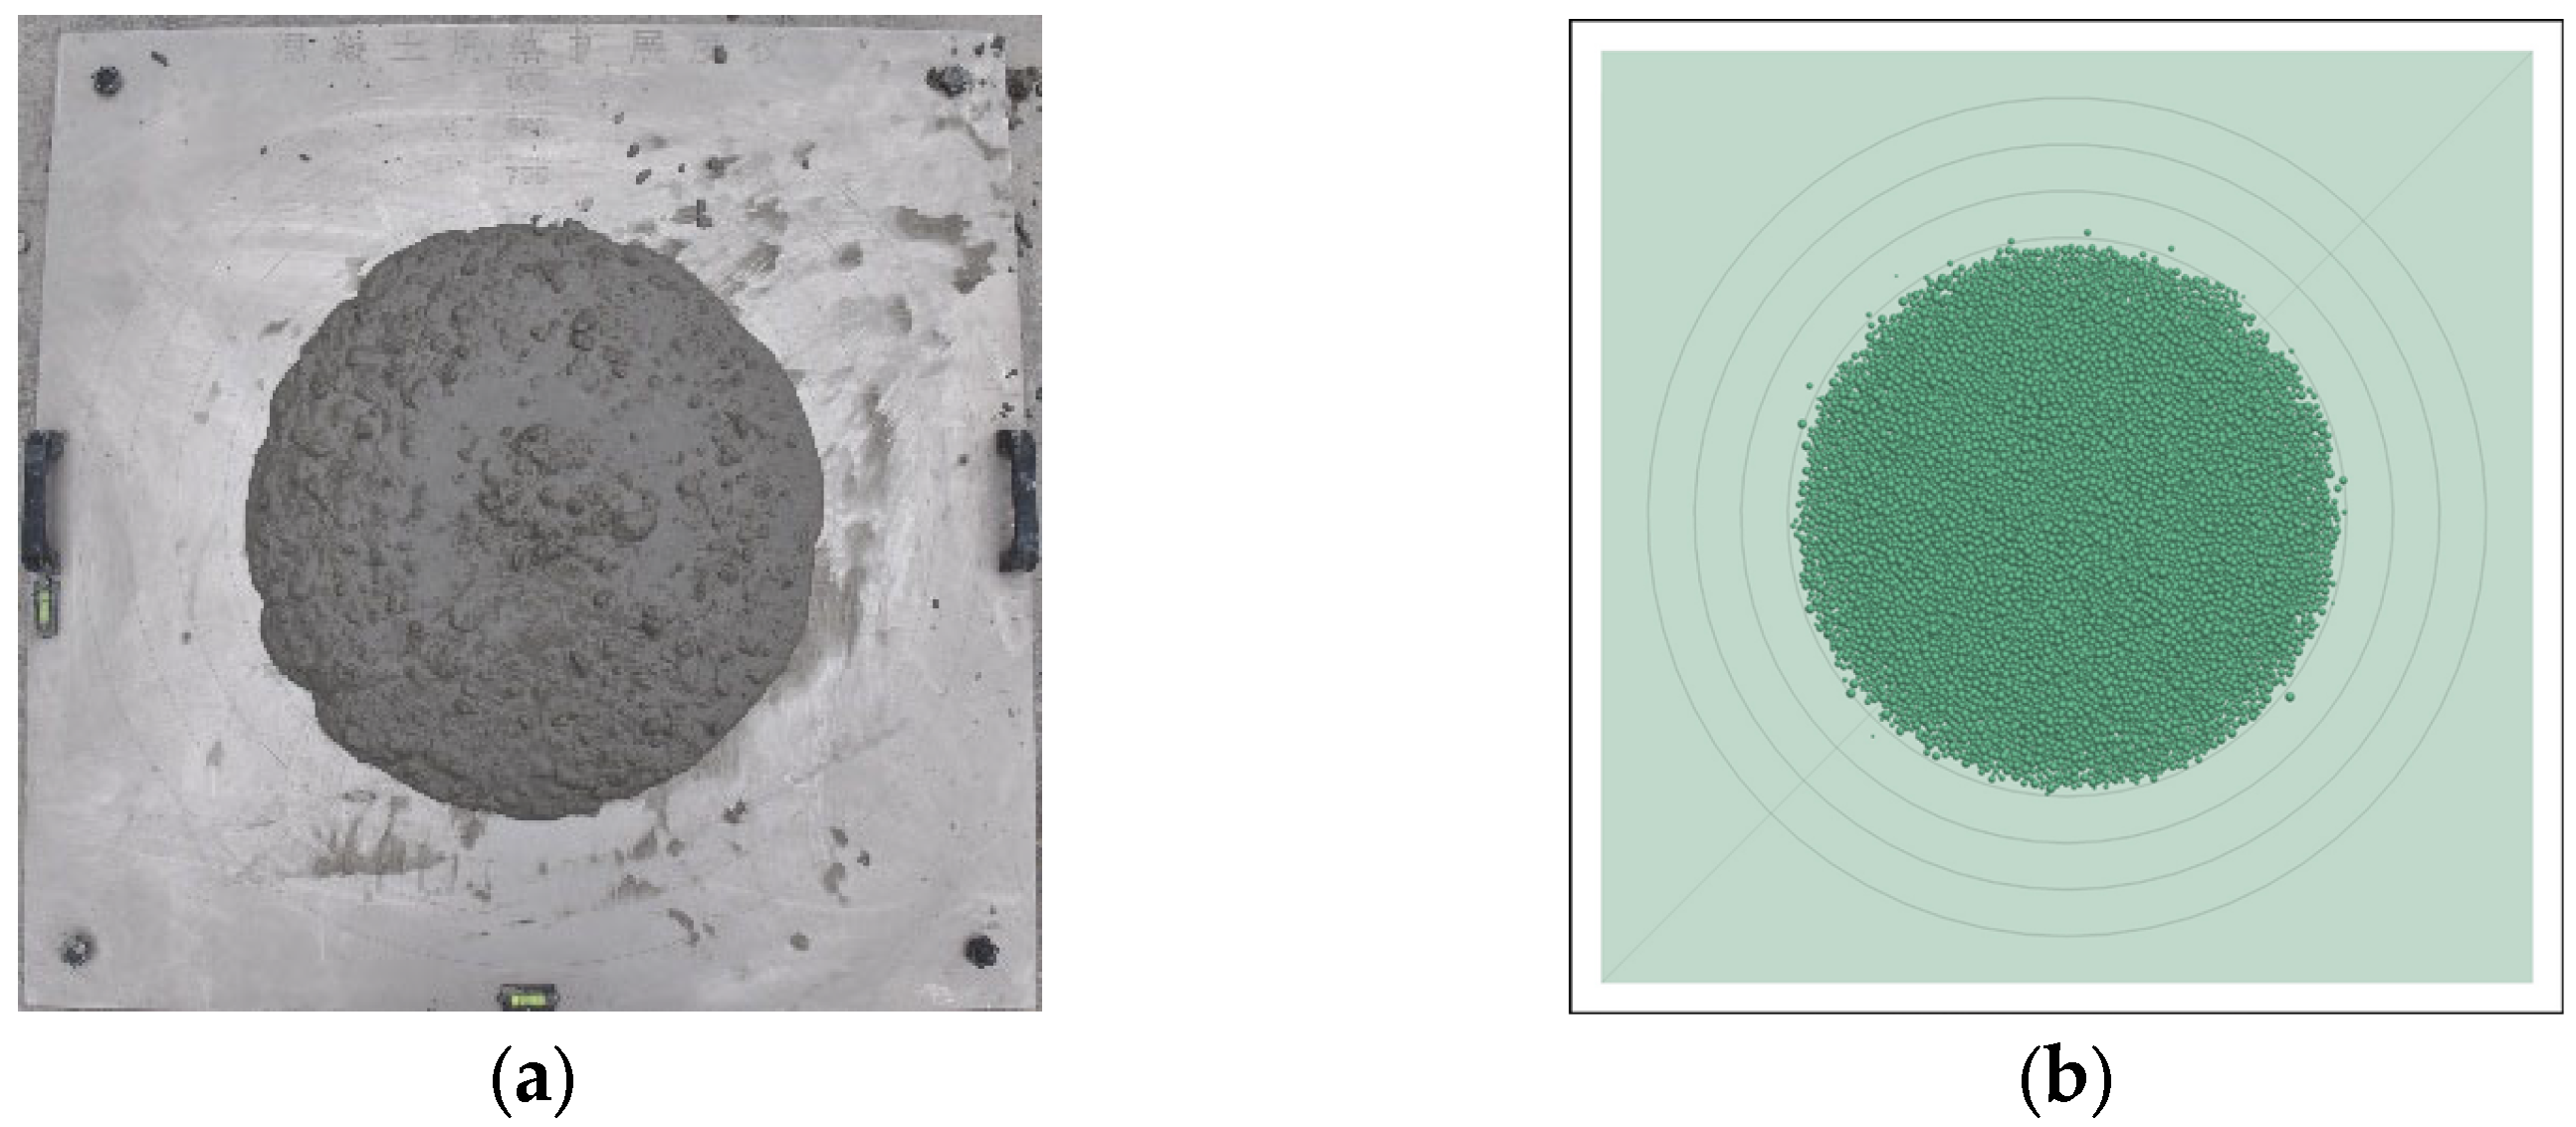
As shown in Figure 9 and Table 3, the average slump flow was finally obtained as 582.4 mm, meeting the requirements of standard performance indicators. The performance grade was SF1 with good fluidity and filling ability. The comparison results show that the relative errors of both the spread and height were less than 1%, indicating that the model and parameter calibration method were reasonable and could effectively evaluate the workability of concrete.

4.2. J-Ring Test Analysis

Figure 10 and Table 4 show the J-ring test and numerical simulation results. The difference between the average slump flow and the average J-ring spread was 42.8 mm, meeting the specification performance index requirements. The performance grade was PA1 with good passing ability. The errors between the test and numerical simulation results were below 1%, verifying the feasibility of the particle flow method.

4.3. Joint Pouring Test Analysis

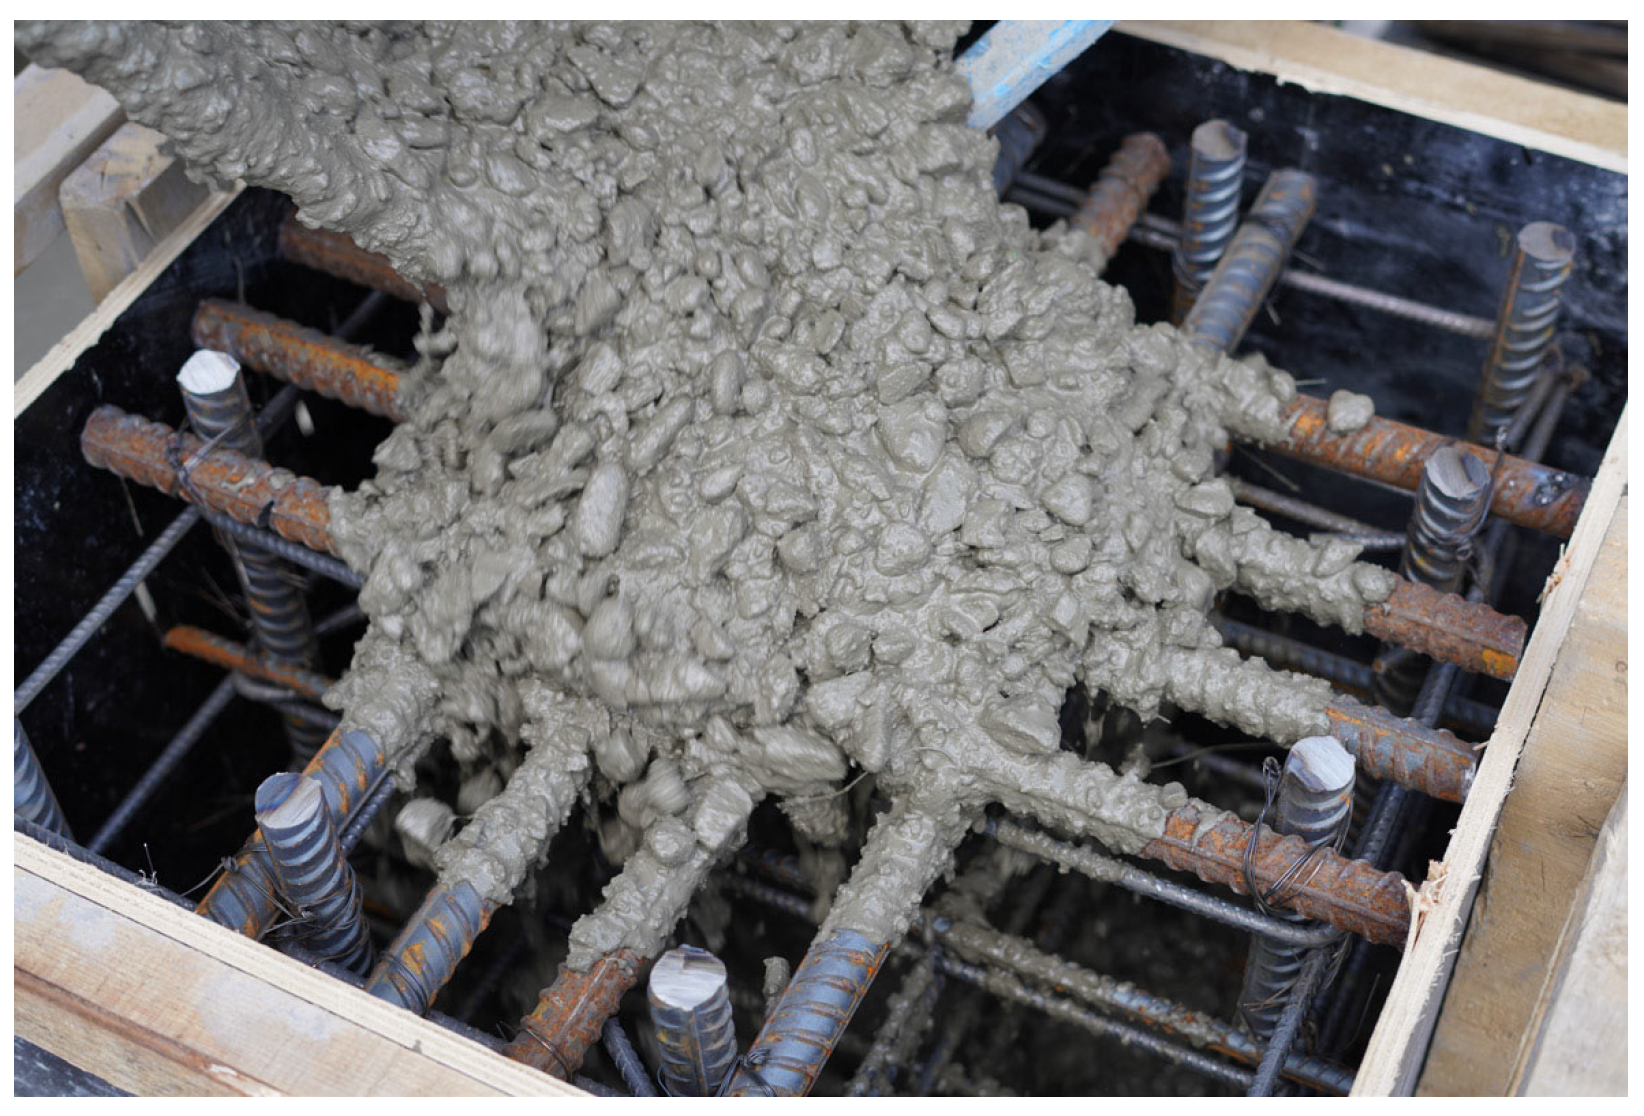
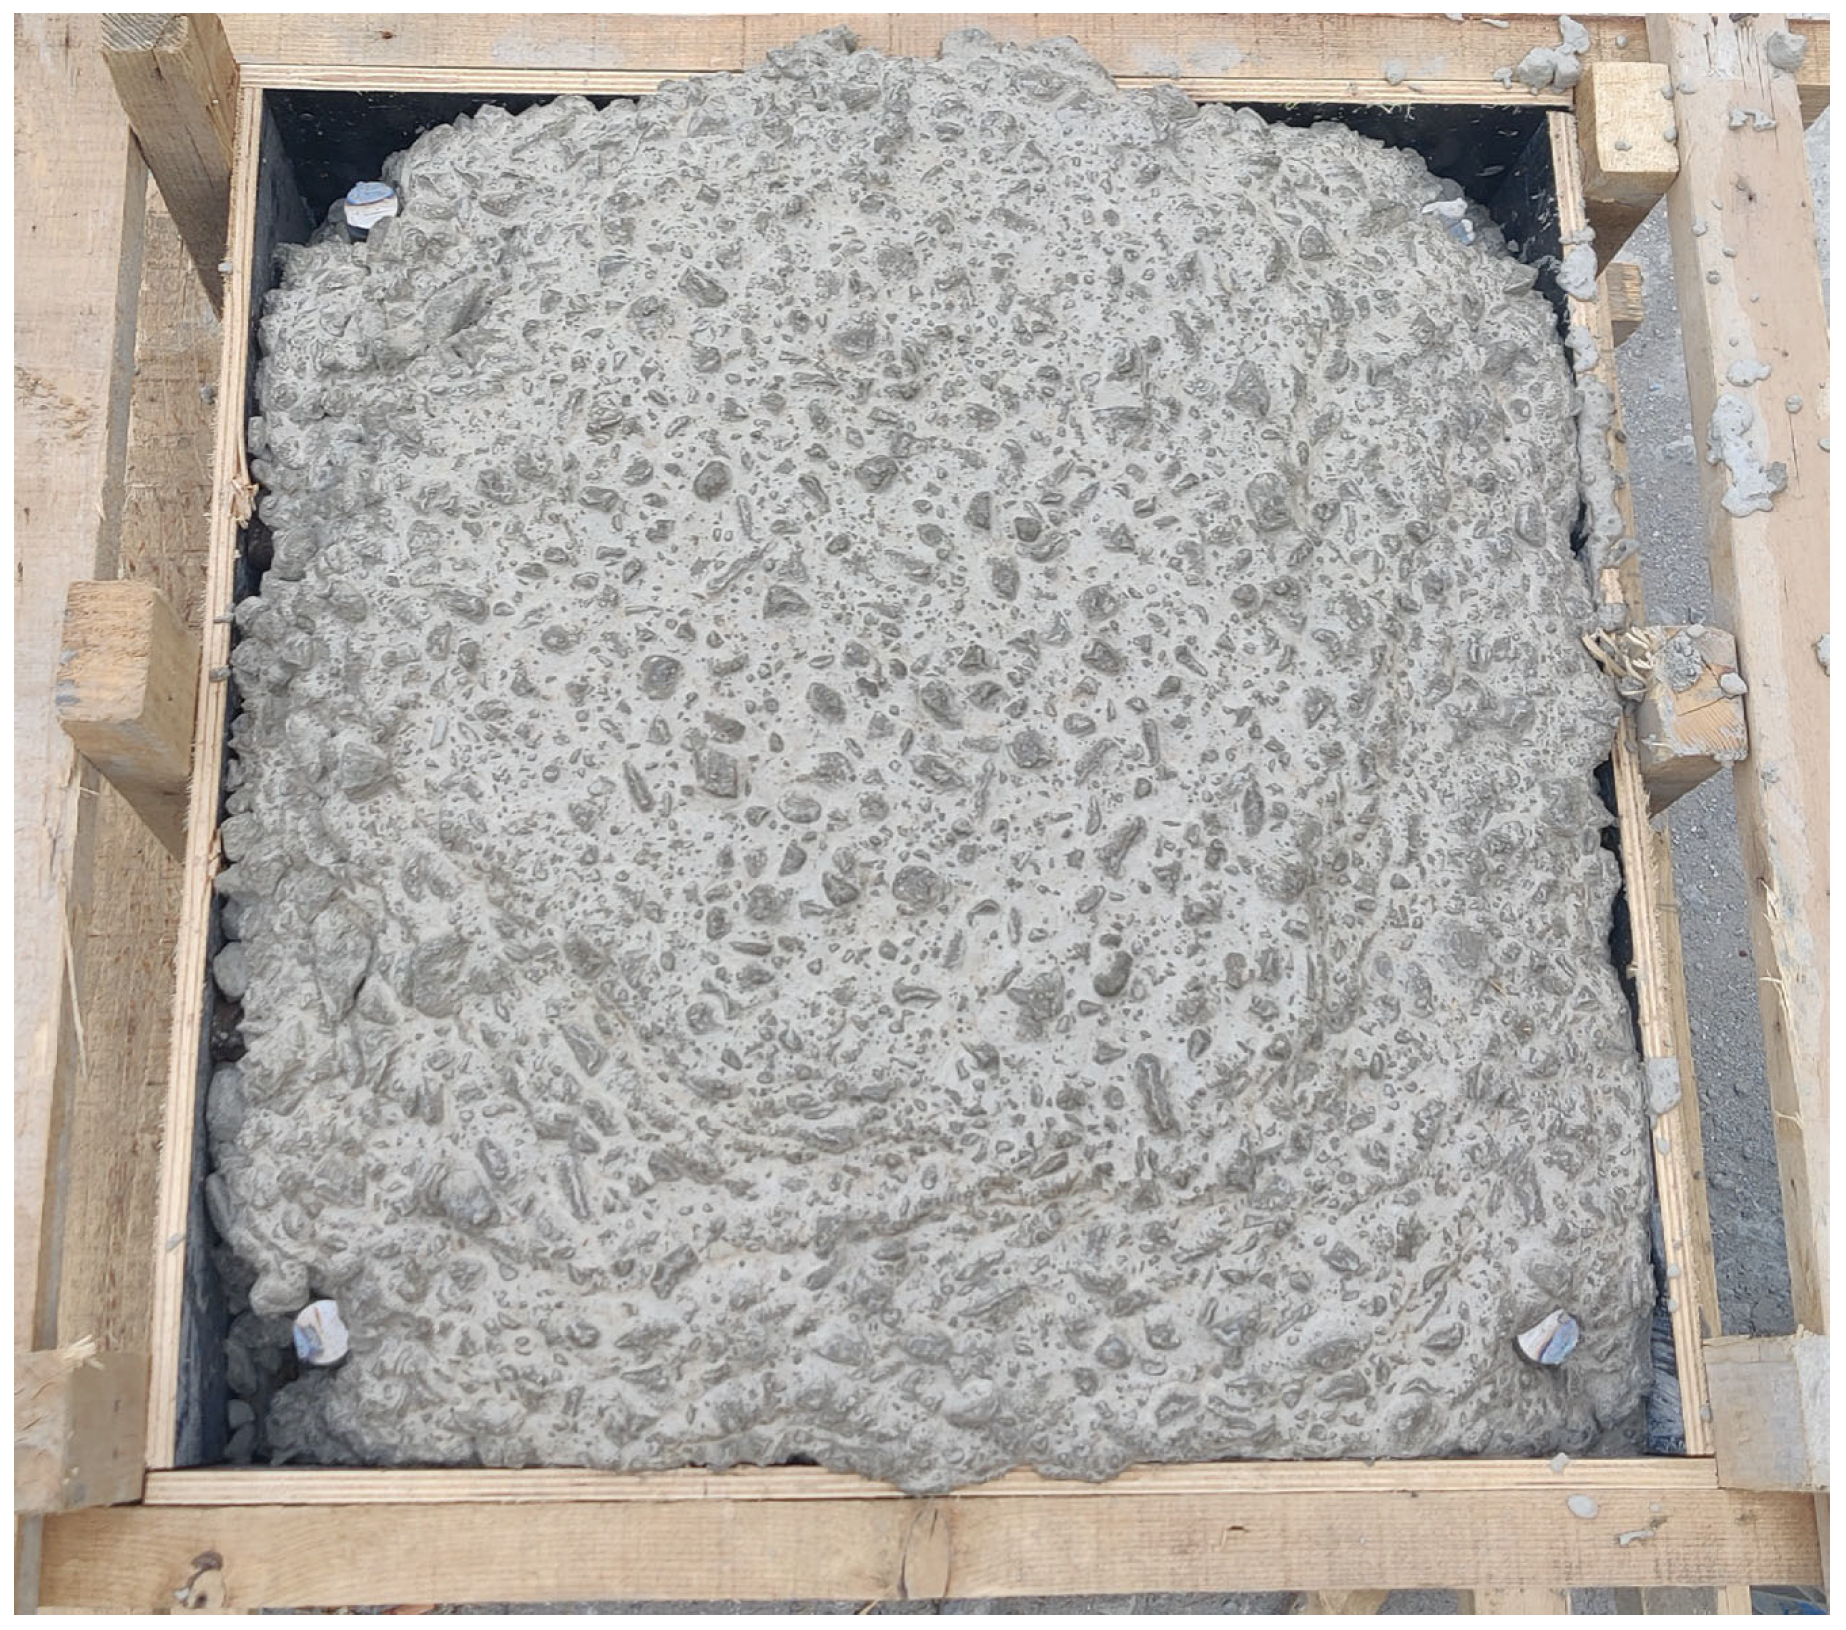
During the pouring process, the obvious hindering effect of the top beam longitudinal bars on concrete flow could be observed, as shown in Figure 11. Local accumulation temporarily formed at the top beam longitudinal bar mesh. The concrete was hindered by the accumulation area and flowed downward from both sides. Simultaneously, the concrete in the accumulation area gradually dissipated under the continuous impact from above. In the early stage of pouring, concrete at the bottom of the joint mainly gathered in the central area. When flowing towards the surroundings, it was significantly hindered by the bottom beam reinforcement and column stirrups. When the upper surface of the concrete approached the top of the joint, due to insufficient concrete fluidity and the obstruction of column reinforcement, relying solely on gravity could not fully fill the corner areas, eventually forming void defects. The result after pouring completion is shown in Figure 12.
After the concrete completely hardened, the pouring results were quantitatively evaluated, obtaining key indicators such as void volume ratio, void area distribution, and maximum void height. According to the results, the concrete had good fluidity, and no segregation occurred. Significant voids appeared in the concrete pouring of the specimen, mainly concentrated in the top corner areas, with small-area voids also occurring at the top edges. According to the pouring results, the concrete distribution was symmetrical. Therefore, the void situation in a 1/4 area was measured and the elevation results of the upper concrete surface are shown in Figure 13. The void volume ratio is 0.48%.
Considering the symmetry of the specimen, a 1/4 numerical model of the beam–column joint was established in PFC3D software to simulate the pouring process. A pouring pipe with the same size as the pouring hole was set above the pouring hole. Particles were generated in the pouring pipe and reached initial equilibrium. The 1/4 numerical model is shown in Figure 14, in which the total number of particles is 218,025. The pouring speed was set to 15 m3/h, the same as the test pouring speed. Particles in the pouring pipe flowed under gravity. The simulation results for model J1 after the particles stopped moving are shown in Figure 14.
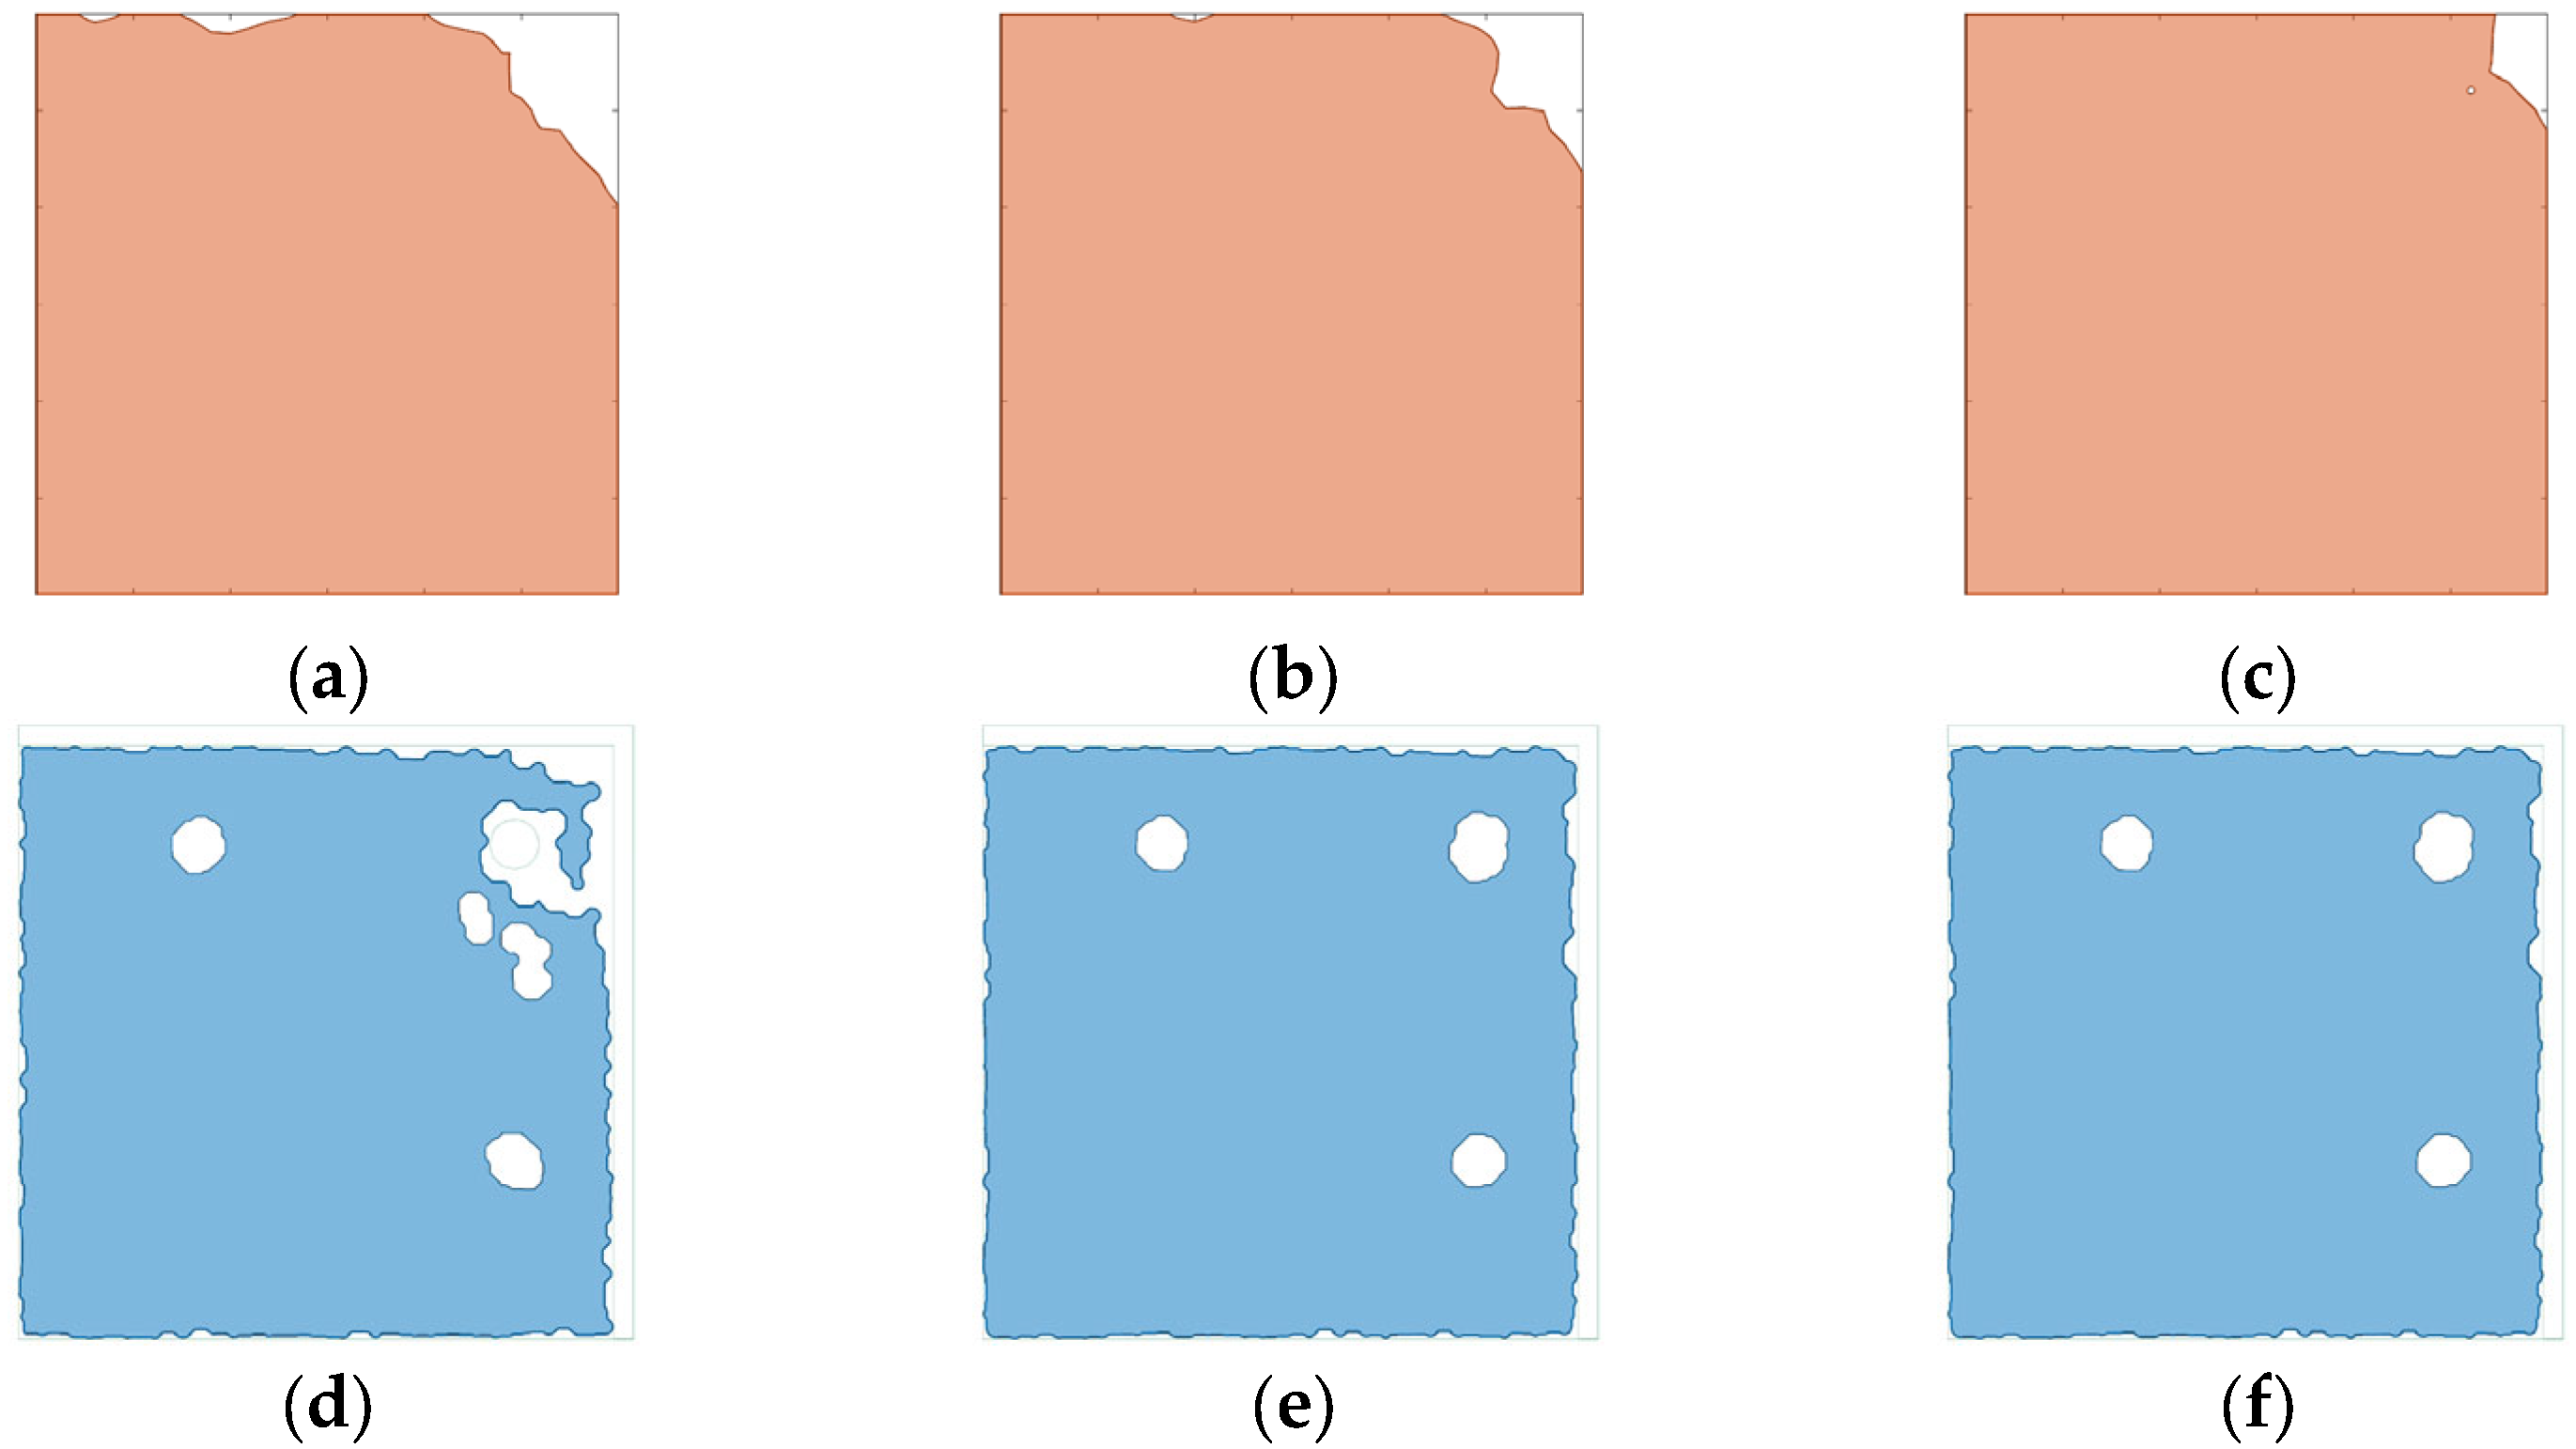
Comparing the particle flow simulation results with the experimental results shows the following: The concrete flow pattern during the pouring simulation was similar to that in the test, and local accumulation phenomena could be observed in both. The overall void volume ratio in the simulation result was 0.47%. Horizontal section planes were set at 1 cm, 2 cm, and 3 cm from the top of the joint to analyze the void distribution. The comparison of test and simulation sections is shown in Figure 15 and Table 5. It can be seen that the concrete void volume and void area distribution from the experiment and simulation were basically consistent. It is noteworthy that the simulation results were generally slightly larger than the experimental results, especially with a relative error of 19.88% at 1 cm. This discrepancy can be attributed to two primary factors. On one hand, the actual pouring process involved significant randomness and many unpredictable factors, such as the workmanship quality. On the other hand, the simulation data were obtained through sectioning, including voids within the internal concrete, while the experimental results were limited to the voids on the external surface, leading to generally lower values compared to the simulation. Despite this, the overall magnitude of error is acceptable, and the particle flow method can well simulate the flow behavior of concrete during the beam–column joint pouring process and predict the size and location distribution of pouring defects.

5. Analysis of Parameters Affecting Joint Pouring Quality

To study the influence of reinforcement arrangement, concrete workability, and pouring speed on pouring results, seven sets of numerical models of joint units with different structures and working conditions were established, as shown in Table 6. Some joint models are shown in Figure 16. Model J1 was taken as the benchmark model. J2 reduced the number of top beam longitudinal bars to 2 based on J1. J3 changed the top beam longitudinal bar diameter to 20 mm. J4 changed the column stirrup spacing to 50 mm. J5 changed the concrete fluidity. J6 changed the maximum coarse aggregate particle size to 16 mm, and J7 changed the pouring speed to 30 m3/h. Considering symmetry, the 1/4 model was established during actual simulation. Since the rebar and formwork were from the same batch, there was no need to recalibrate the contact parameters between coarse aggregates and formwork. Model J5 and J6 required recalibrating particle contact parameters due to adjustments in concrete mix proportions, while other models can maintain their original contact parameters unchanged.
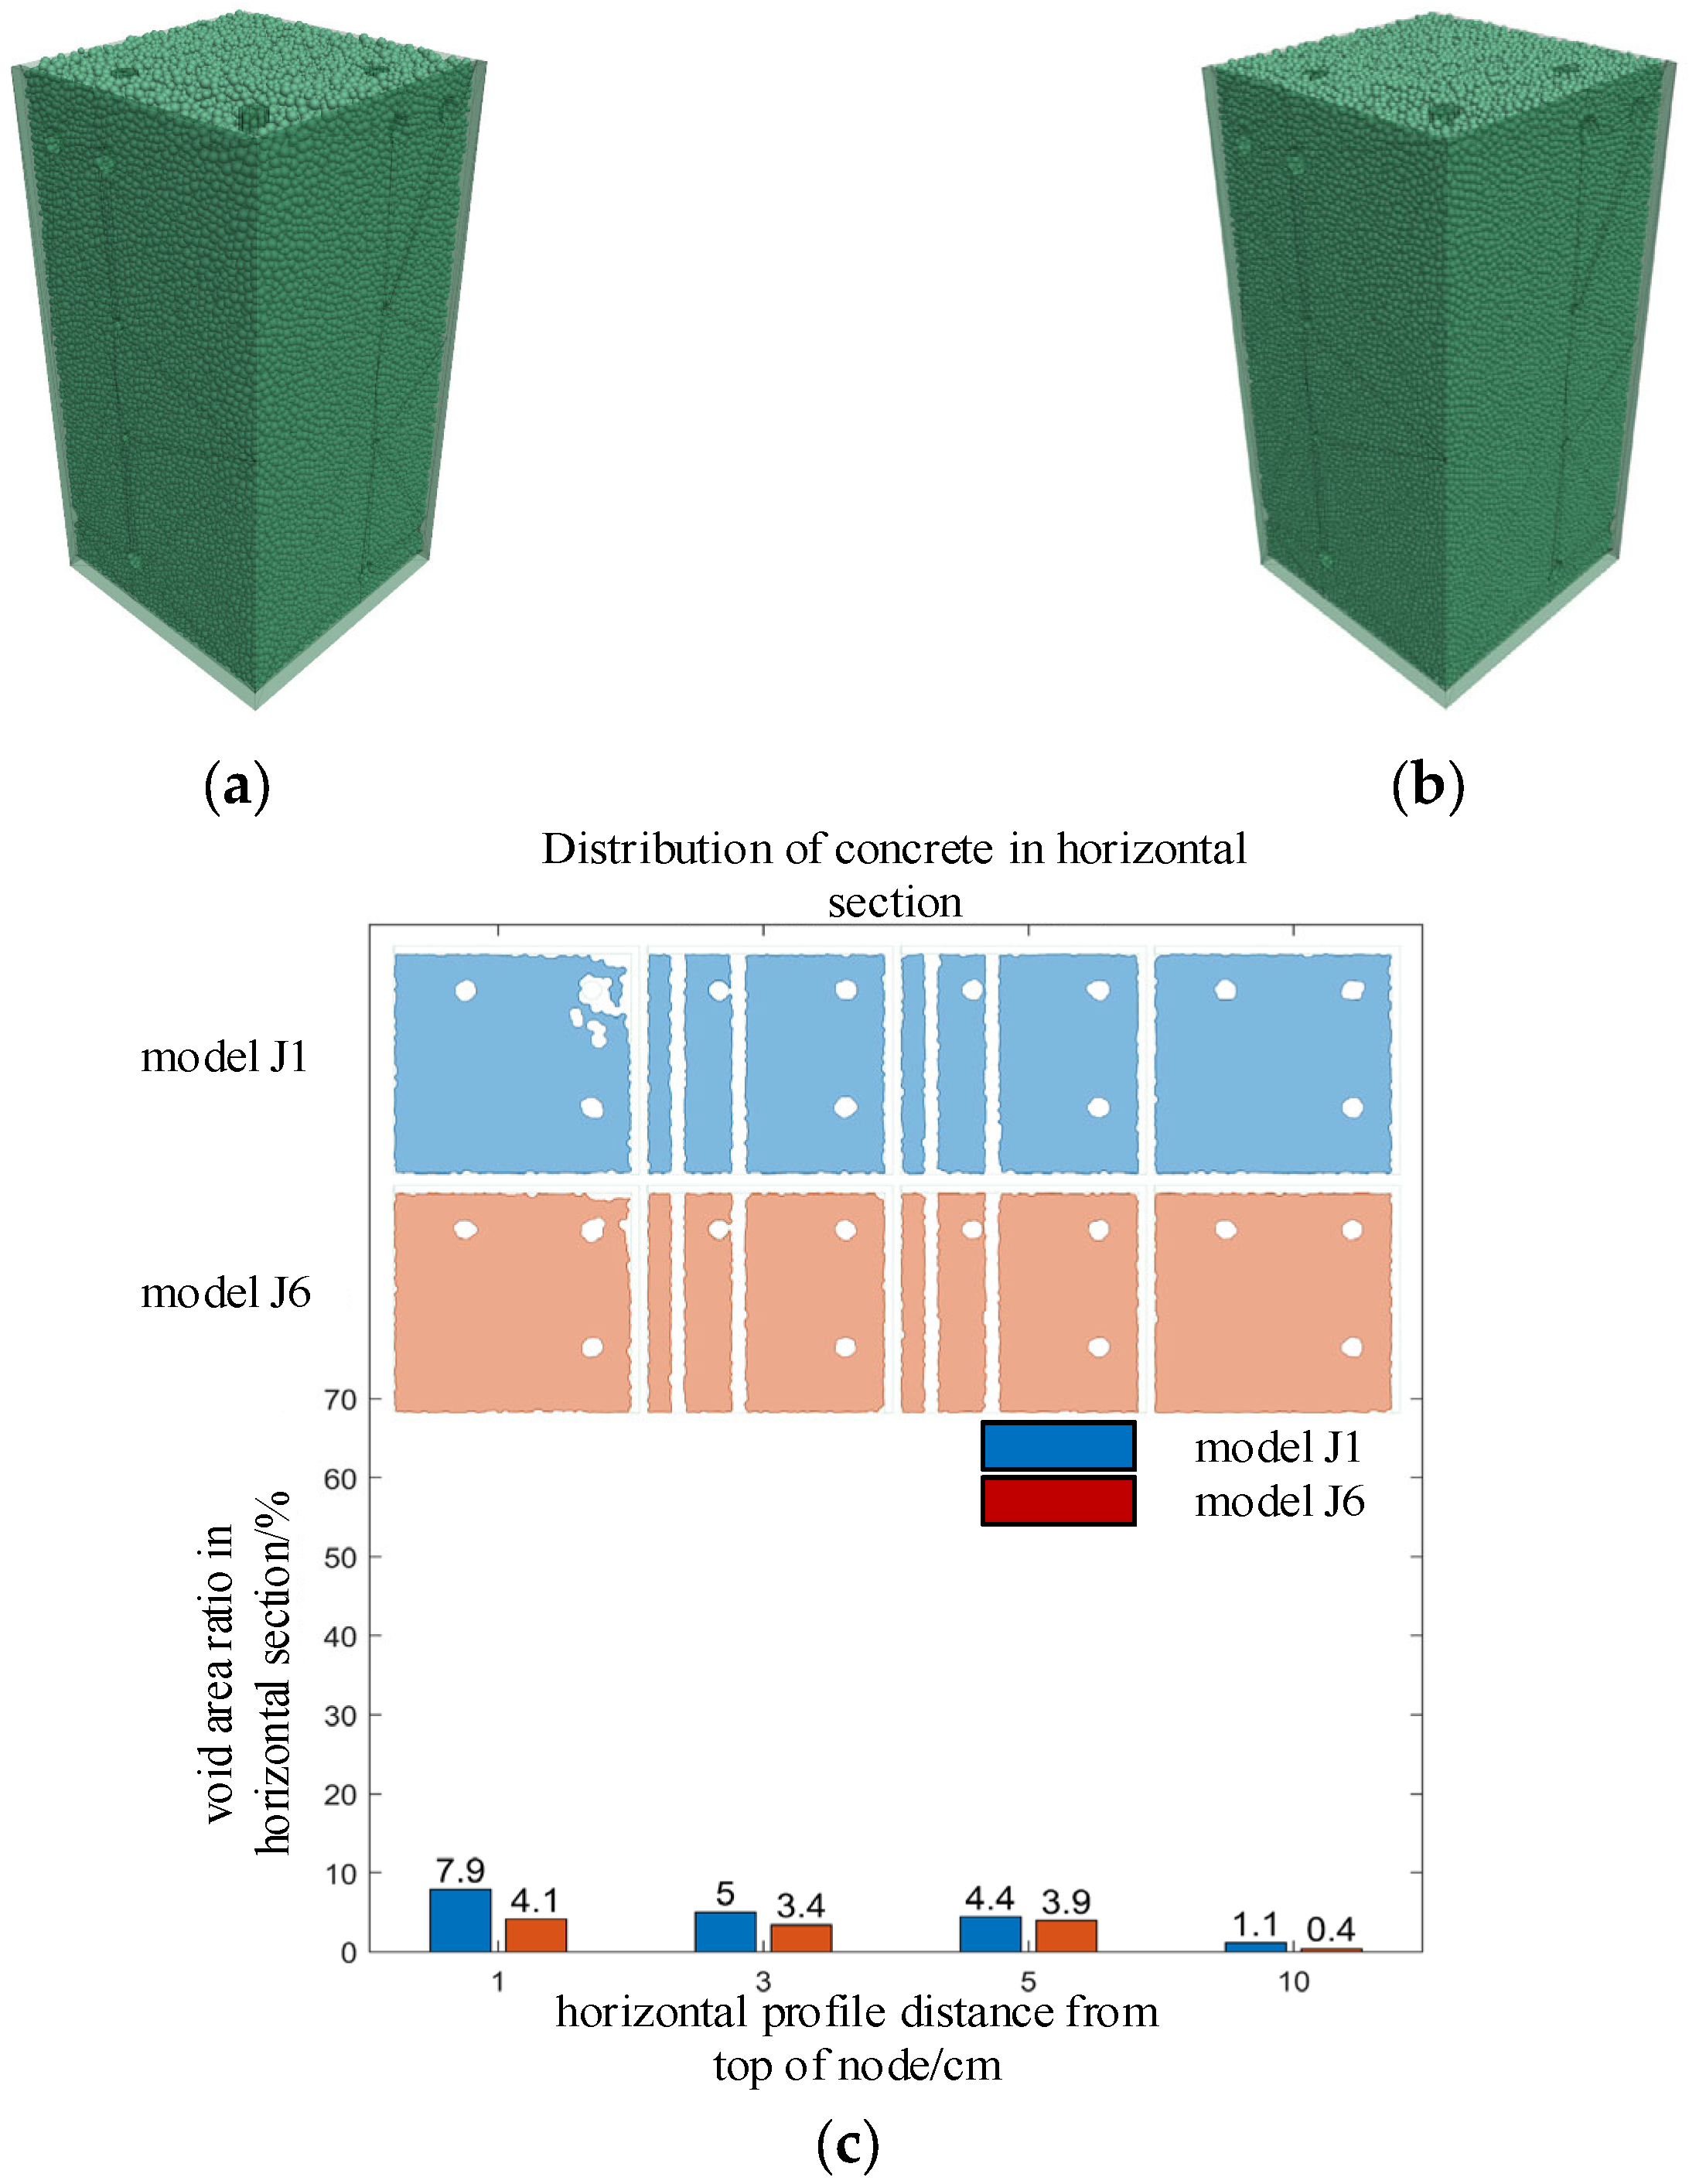
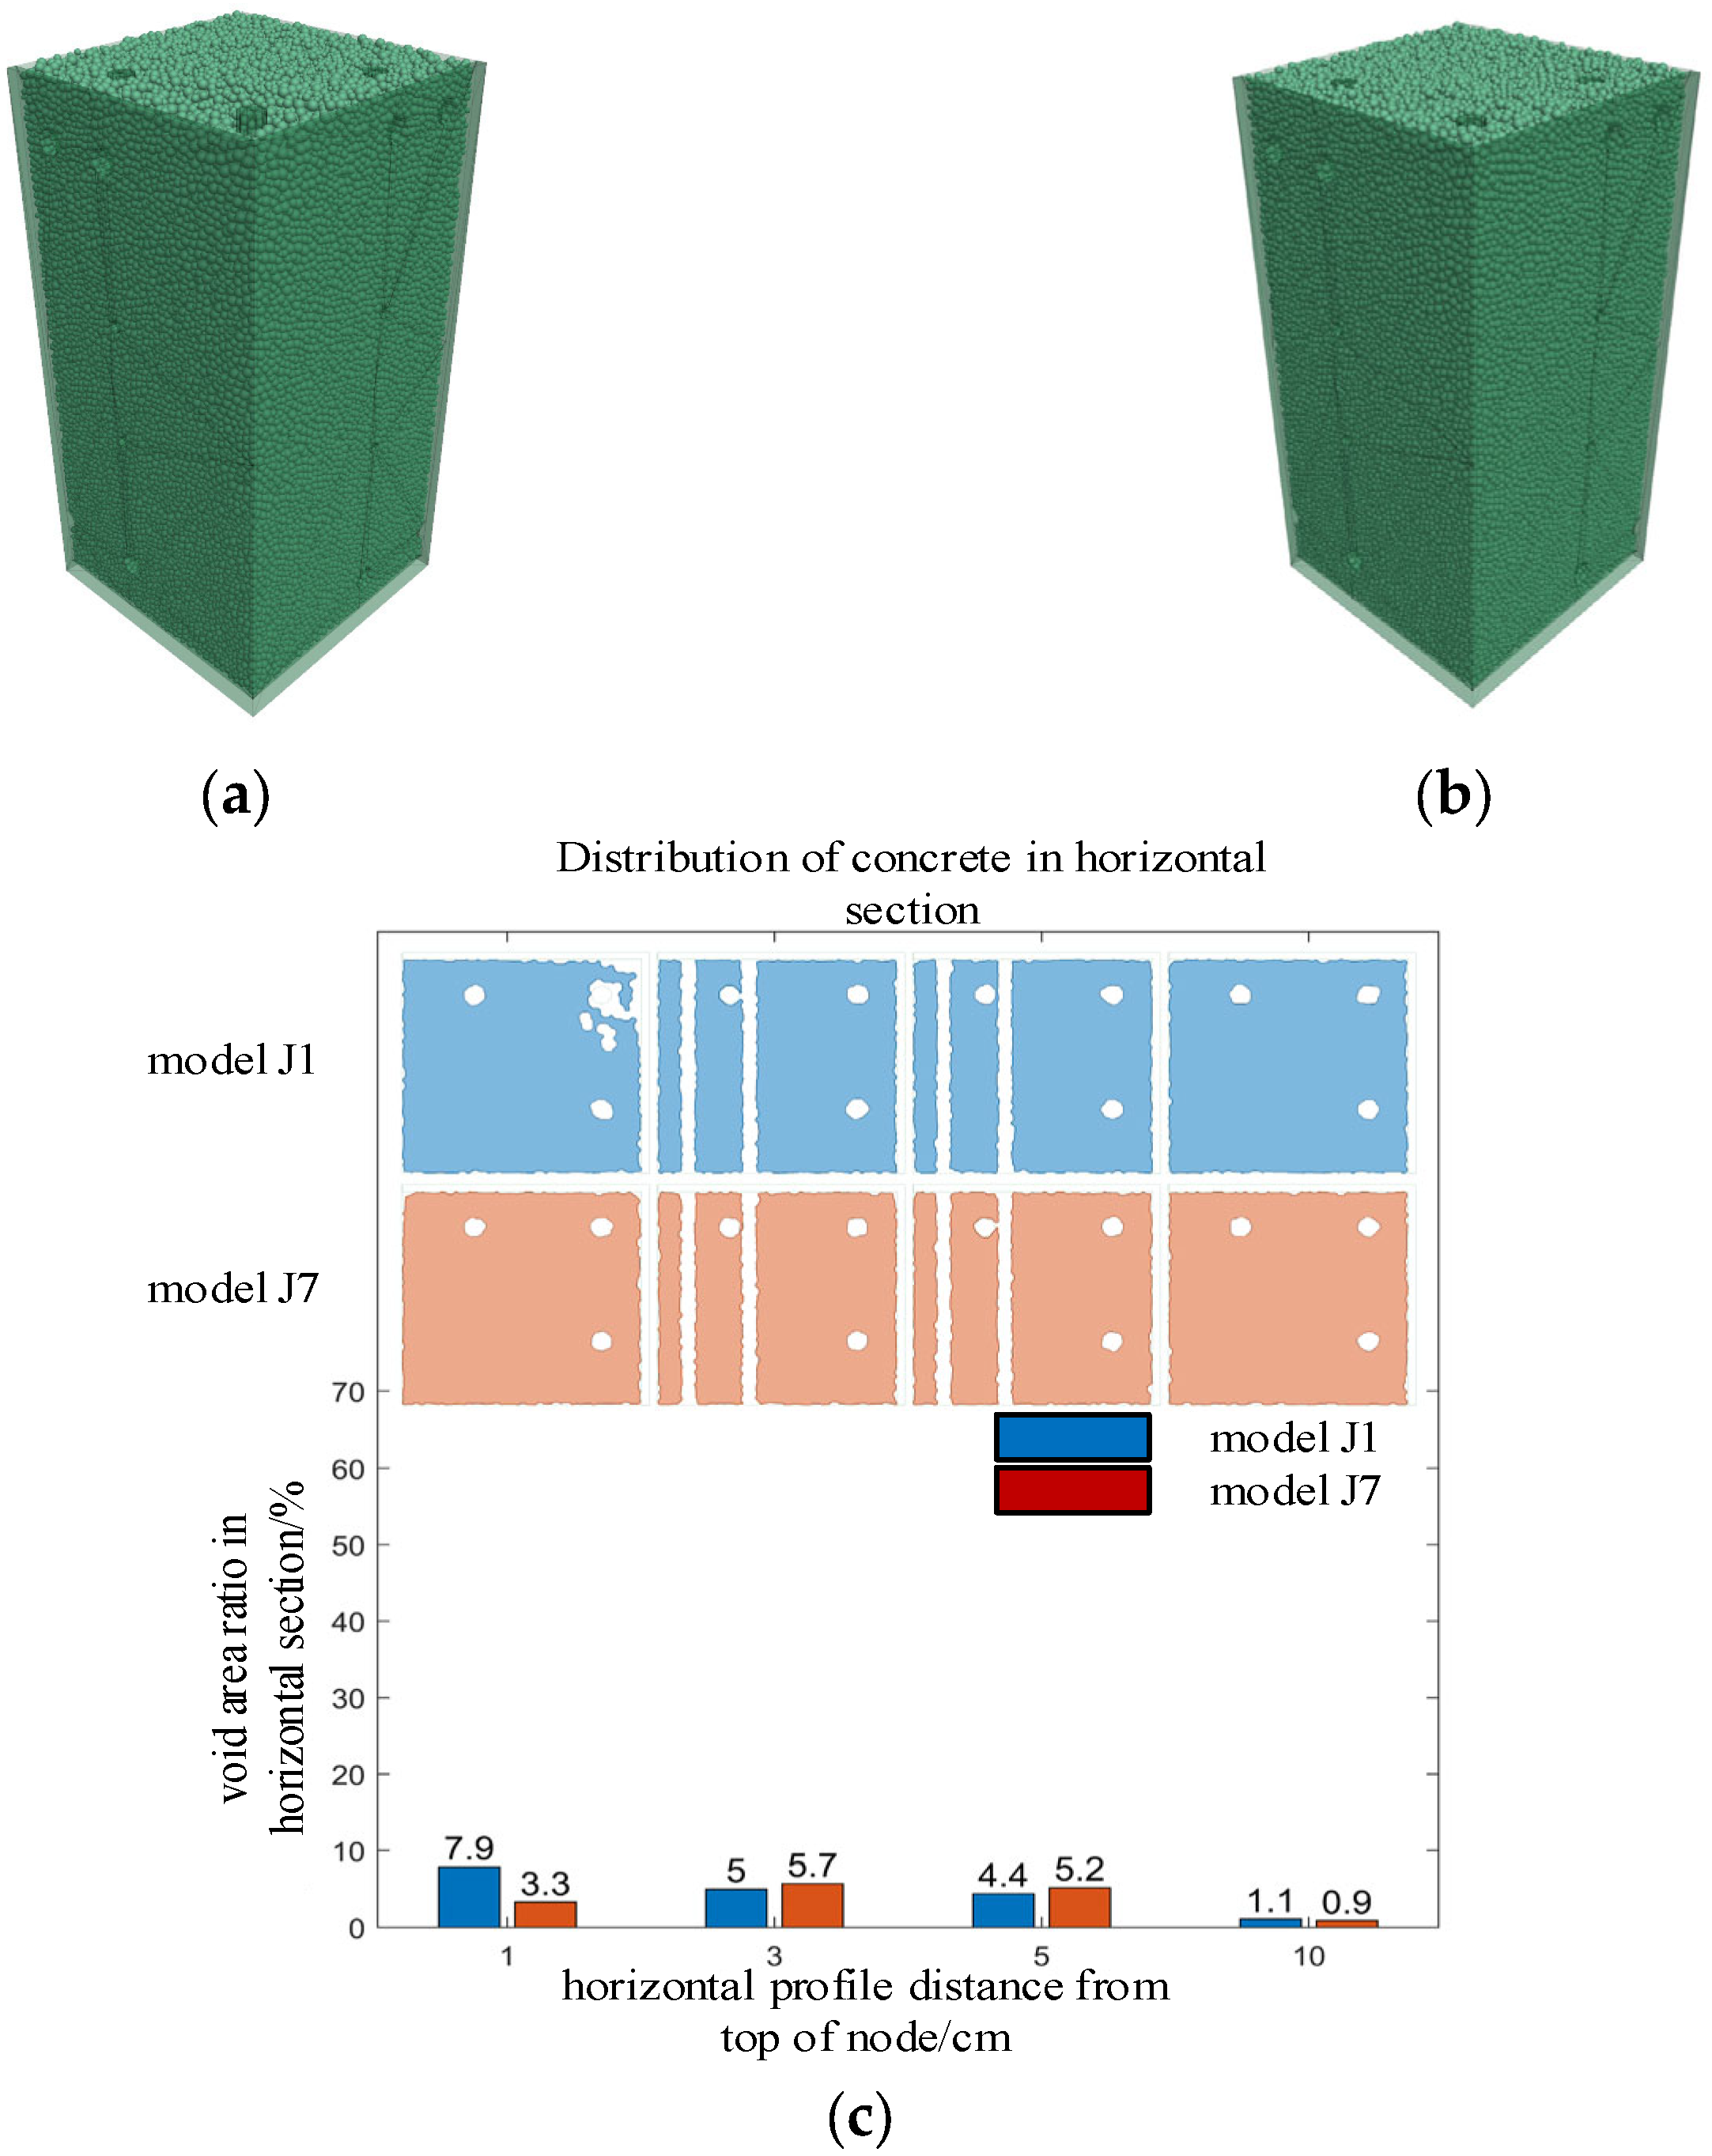
To quantitatively describe the distribution of concrete after pouring, horizontal section planes were set at 1 cm, 3 cm, 5 cm, and 10 cm from the top of the joint. Boundary envelope analysis was performed on the particles within the section planes to quantitatively evaluate the void situation within the sections. For ease of analysis, a void area ratio below 2% was considered as dense pouring with no void defects.

5.1. Number of Top Beam Longitudinal Bars

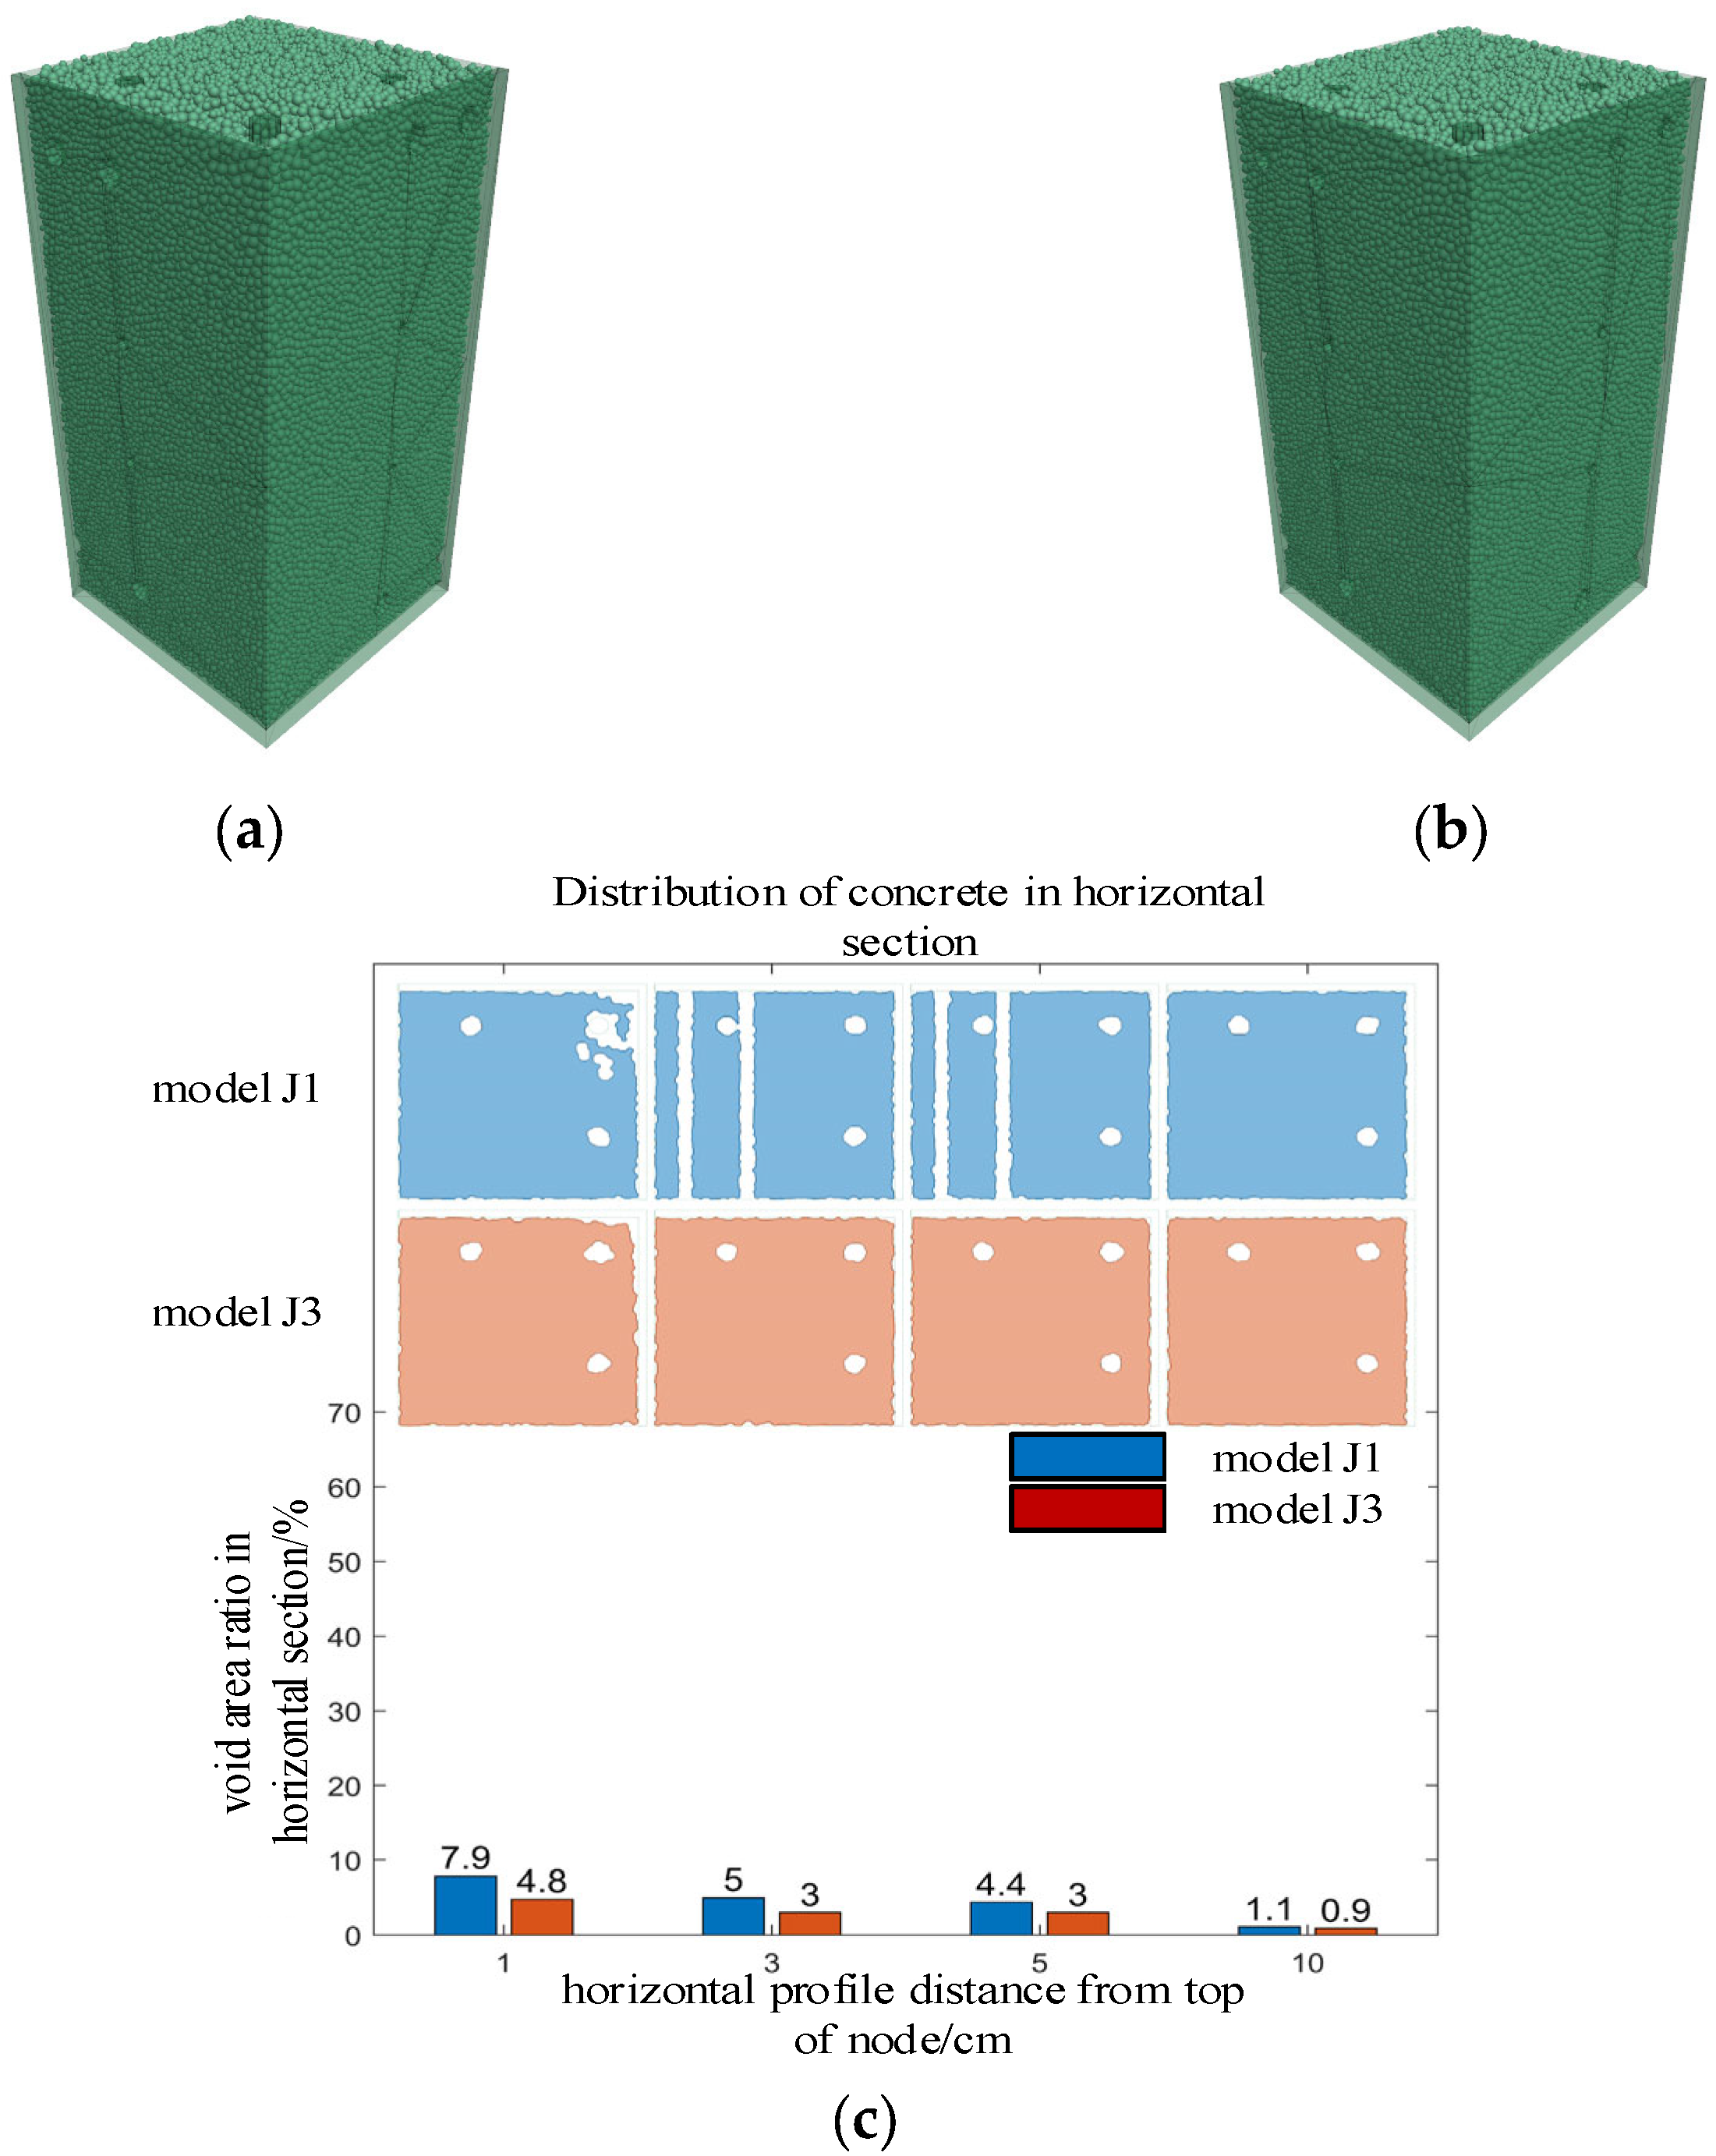
To study the influence of the number of top beam longitudinal bars on pouring quality, the numerical simulation results of models J1 and J2 were compared. Figure 17 shows the pouring simulation results and the distribution of voids in concrete in horizontal sections at different heights from the joint top. It can be seen from the figure that: (1) Voids in J1 are mainly concentrated at the model corners and near the reinforcement, with significant voids occurring at the top corners. Voids in J2 are mainly concentrated near the reinforcement. (2) Compared to J1, J2 has a reduced number of top beam longitudinal bars, which reduces the hindering effect of the top beam longitudinal bars on concrete flow. The void area ratios in the section plane 1 cm from the joint top are 7.9% and 4.2% for J1 and J2, respectively, and the void area ratios in the section planes 3 cm and 5 cm from the joint top are 5% and 4.4% and 4.2% and 3.7%, respectively, indicating that J2 has reduced void areas compared to J1. The void area ratio in the 10 cm section plane shows little difference, and no voids occurred in either. (3) Particle accumulation phenomena can be clearly observed in J1. Overly dense top beam longitudinal bars hinder the flow of concrete from the pouring hole to the joint bottom and also hinder the flow of concrete to the surroundings. The mesh structure formed by the reinforcement significantly limits the fluidity of the concrete, leading to potential void defects at the corners. In summary, reducing the number of top beam longitudinal bars can weaken the influence of the reinforcement mesh structure on concrete flow and promote dense pouring in the corner areas of the beam–column joint.

5.2. Diameter of Top Beam Longitudinal Bars

To study the influence of the diameter of top beam longitudinal bars on pouring quality, the numerical simulation results of models J1 and J3 were compared. Figure 18 shows the pouring simulation results and the distribution of voids in concrete in horizontal sections at different heights from the joint top. It can be seen from the figure that: Compared to J1, J3 has better pouring quality. The void area ratios in the section planes 1 cm, 3 cm, and 5 cm from the joint top decreased from 7.9%, 5%, and 4.4% to 4.8%, 3%, and 3%, respectively. The void area ratio in the section plane 10 cm from the joint top shows little difference. In summary, reducing the diameter of the top beam longitudinal bars weakens the barrier effect of the mesh reinforcement structure and improves the corner void situation to some extent.

5.3. Column Stirrup Spacing

To study the influence of column stirrup spacing on pouring quality, the numerical simulation results of models J1 and J4 were compared. Figure 19 shows the pouring simulation results and the distribution of voids in concrete in horizontal sections at different heights from the joint top. The following can be seen from the figure: (1) Significant voids occur near the reinforcement and in corner areas in J4, resulting in exposed reinforcement defects. Compared to J1, the void area ratio in the section plane 1 cm from the joint top increased from 7.9% to 21.2% in J4. The void areas in the section planes 3 cm and 5 cm from the joint top also increased slightly. (2) Changing the column stirrup spacing from 100 mm to 50 mm makes the reinforcement arrangement denser, leading to narrower concrete flow paths. When flowing under gravity-driven force, the resistance to particle passage increases significantly, blocking the particle flow path. The stirrup spacing relative to the maximum aggregate size decreased from 5 times to 2.5 times, significantly reducing the mobility of aggregates passing through the reinforcement gaps. Coarse aggregates are prone to local accumulation when passing through dense stirrups, thus forming void areas between the stirrups and the formwork. In summary, column stirrup spacing has a great influence on the pouring results. Overly dense column stirrup spacing needs to be avoided in engineering.

5.4. Concrete Fluidity

To study the influence of concrete fluidity on pouring quality, the numerical simulation results of models J1 and J5 were compared. Figure 20 shows the pouring simulation results and the distribution of voids in concrete in horizontal sections at different heights from the joint top. It can be seen from the figure that: Compared to J1, the void area ratios in the section planes 1 cm, 3 cm, and 5 cm from the joint top in J5 increased from 7.9%, 5%, and 4.4% to 65.3%, 52.2%, and 35.2%, respectively. The void area in the section plane 10 cm from the joint top is basically the same. Due to the poor fluidity of concrete in J5, the void area is larger, with significant voids on both the inside and outside of the stirrups. The pouring quality of J5 is significantly lower than that of J1. In summary, concrete fluidity has a great influence on the pouring results. Enhancing concrete fluidity can improve the passing ability of concrete through reinforcement and promote dense pouring of beam–column joints.

5.5. Maximum Coarse Aggregate Particle Size

To study the influence of the maximum coarse aggregate particle size on pouring quality, the numerical simulation results of models J1 and J6 were compared. Figure 21 shows the pouring simulation results and the distribution of voids in concrete in horizontal sections at different heights from the joint top. It can be seen from the figure that: Compared to J1, the overall pouring of J6 is denser. The void area ratios in the section planes 1 cm, 3 cm, and 5 cm from the joint top decreased from 7.9%, 5%, and 4.4% to 4.1%, 3.4%, and 3.9%, respectively. The void areas in the section plane 10 cm from the joint top are all less than 2%, indicating dense concrete pouring. As the maximum coarse aggregate particle size decreases, the resistance on the flow path from the center to the corner areas decreases, promoting dense pouring in the corner areas. In summary, reducing the maximum coarse aggregate particle size can improve the passing ability of concrete and promote dense pouring of beam–column joints.

5.6. Pouring Speed

To study the influence of pouring speed on pouring quality, the numerical simulation results of models J1 and J7 were compared. Figure 22 shows the pouring simulation results and the distribution of voids in concrete in horizontal sections at different heights from the joint top. It can be seen from the figure that: (1) Void areas in J1 are mainly concentrated in the corner areas, while void areas in J7 are mainly concentrated near the reinforcement-concrete interface. (2) Compared to J1, the overall void area ratio in the section plane 1 cm from the joint top in J7 decreased from 7.9% to 3.3%. A higher pouring speed enhances concrete fluidity, pushing concrete to fill corner areas. (3) Compared to J1, the void area ratios in the section planes 3 cm and 5 cm from the joint top in J7 increased from 5% and 4.4% to 5.7% and 5.2%, respectively. Faster particle speeds cause voids to form near the reinforcement-concrete interface, leading to an increase in void area. In summary, increasing the pouring speed can promote concrete filling into corner areas, increasing the filling density in corner areas, but it also causes void defects near complex formwork interfaces. The pouring speed needs to be reasonably controlled according to the actual situation in engineering.

6. Discussion and Conclusions

This paper investigated the flow behavior of fresh concrete in typical complex joints through an integrated approach of laboratory experiments and numerical simulation. Numerical models based on the particle flow method were established to simulate the pouring process in complex joints, which revealed the formation mechanism of void defects. The similarities and differences between this paper and previous studies are shown in Table 7.
(1)
By selecting the rolling resistance linear model and the JKR model to simulate the contact between particles and the wall and between particles, respectively, a PFC numerical model suitable for concrete flow simulation was established using the appropriate modeling method. Numerical simulations of concrete workability tests such as the slump flow test and J-ring test were conducted, showing good agreement with laboratory test results.
(2)
The contact parameters between particles and wall units were calibrated by using the laboratory test. The nonlinear mapping relationship between microscopic parameters and macroscopic rheological properties was established by the neural network parameter inversion algorithm, so as to calibrate the inter-particle contact parameters. The results showed that the inversion algorithm could accurately calibrate the microscopic parameters of the contact model.
(3)
Through pouring tests and numerical simulations of reinforced concrete beam–column joint pieces, it was found that the void volume and distribution patterns from both were basically consistent. The established numerical model could accurately simulate the rheological behavior of concrete and predict the size and location distribution of pouring defects.
(4)
The established numerical simulations of seven sets of beam–column joints with different design parameters showed that the number and diameter of the top beam longitudinal bars affected the hindering effect of the mesh structure at the joint top on concrete. Column stirrup spacing affected the particle flow path, and the maximum coarse aggregate particle size and pouring speed also influenced the concrete pouring results.
(5)
Based on comprehensive experimental and numerical studies, to avoid potential void defects in practical concrete pouring projects, it is recommended that the number and diameter of joint longitudinal bars be selected reasonably and the spacing of column stirrups be increased appropriately. In addition, it is recommended to appropriately reduce the maximum coarse aggregate particle size and choose concrete with better fluidity and filling ability.
However, there are still some limitations and deficiencies in this study that require further improvement in the following aspects:
(1)
In the discrete element model of fresh concrete, spherical particles were used to simulate irregular coarse aggregates. Future studies can employ irregular polyhedral particles to more accurately simulate coarse aggregates, enabling more precise simulation of the accumulation and blocking behavior of fresh concrete.
(2)
When using the particle flow method for numerical simulation, a large number of particles results in low computational efficiency, while practical engineering has strict time constraints. Therefore, future work can explore parallel computing or other approaches to reduce computation time and better meet the demands of engineering applications.
(3)
This study focused solely on reinforced concrete beam–column joints. Future research can extend to pouring simulations of other structural forms, such as steel–concrete composite structures. By incorporating more factors influencing the pouring process, more widely applicable construction optimization techniques can be developed.

Author Contributions

Conceptualization, M.T., R.D. and J.F.; methodology, M.T., R.D. and J.F.; software, X.Z. (Xinhao Zhang) and X.Z. (Xiao Zhang); validation, X.Z. (Xinhao Zhang) and X.Z. (Xiao Zhang); formal analysis, X.Z. (Xinhao Zhang); investigation, X.Z. (Xinhao Zhang); resources, M.Z. and Q.Z.; data curation, X.Z. (Xinhao Zhang); writing—original draft preparation, X.Z. (Xiao Zhang); writing—review and editing, M.T. and X.Z. (Xiao Zhang); visualization, X.Z. (Xinhao Zhang) and X.Z. (Xiao Zhang); supervision, R.D. and X.Z. (Xinhao Zhang); project administration, R.D., J.F., M.Z. and Q.Z.; funding acquisition, M.T. All authors have read and agreed to the published version of the manuscript.

Funding

The writers gratefully acknowledge the financial support provided by the National Natural Science Foundation of China (Grant No. U24A20162 and 52121005).

Data Availability Statement

All data, models, and codes generated or used during the study are included in the submitted article.

Conflicts of Interest

Author Meng-Jia Zhou was employed by the company Arup. The remaining authors declare that the research was conducted in the absence of any commercial or financial relationships that could be construed as a potential conflict of interest.

References

  1. Jiang, J. Study on Seismic Behavior of New Cast-In-Situ Joints in Reinforced Concrete Frames. Master’s Dissertation, Qingdao University of Technology, Qingdao, China, 2018. [Google Scholar]
  2. Huang, Q.L. Analysis of common problems in construction of steel and concrete frame structure. Sci. Technol. Inf. 2014, 12, 29. [Google Scholar]
  3. Zheng, Z.; Li, S.X.; Zhang, Q.; Tang, H.; Liu, G.F.; Pei, S.F.; Lu, G.M. True triaxial test and DEM simulation of rock mechanical behaviors, meso-cracking mechanism and precursor subject to underground excavation disturbance. Eng. Geol. 2024, 337, 107567. [Google Scholar] [CrossRef]
  4. Jiang, L.; Zhao, C.; Zhang, S.; Qiu, M.; Zhang, R.; Li, Y.; Zhang, W.; Yu, S. Failure mechanisms of basalt fiber concrete under splitting tensile tests and DEM simulations. Buildings 2025, 15, 3035. [Google Scholar] [CrossRef]
  5. Roussel, N.; Geiker, M.R.; Frédéric, D.; Thrane, L.N.; Szabo, P. Computational modeling of concrete flow: General overview. Cem. Concr. Res. 2007, 37, 1298–1307. [Google Scholar] [CrossRef]
  6. Mechtcherine, V.; Gram, A.; Krenzer, K.; Schwabe, J.H.; Shyshko, S.; Roussel, N. Simulation of fresh concrete flow using Discrete Element Method (DEM): Theory and applications. Mater. Struct. 2014, 47, 615–630. [Google Scholar] [CrossRef]
  7. Cao, G.D.; Li, Z.J.; Jiang, S.Q.; Tan, Y.Q.; Li, Z.G.; Long, S.G.; Tong, Z.G. Experimental analysis and numerical simulation of flow behavior of fresh steel fibre reinforced concrete in magnetic field. Constr. Build. Mater. 2022, 347, 128505. [Google Scholar] [CrossRef]
  8. Li, Z.J.; Cao, G.D.; Jiang, S.Q.; Zhou, H.M.; Hu, X.Y.; Liu, J.W.; Wei, H.; Zhang, Y.C. Fluidity and mechanical properties of magnetic-field-enhanced steel fibre reinforced coral mortar. Powder Technol. 2025, 452, 120524. [Google Scholar] [CrossRef]
  9. Zhang, J.Y.; Xu, P.J.; Gao, X.J. Multi-scale particles optimization for some rheological properties of Eco-SCC: Modelling and experimental study. Constr. Build. Mater. 2021, 308, 125151. [Google Scholar] [CrossRef]
  10. Xiao, Q.; Hu, X.; Li, X.; Zhang, G.; Zhao, J. Study on the basic mechanical properties and discrete element method simulation of permeable concrete. Sustainability. 2023, 15, 13310. [Google Scholar] [CrossRef]
  11. Zhou, X.; Xie, Y.J.; Long, G.C.; Zeng, X.H.; Li, J.T.; Wang, F. Simulating passing ability of self-compacting concrete in the J-ring test using cohesive particle liquid bridge model. Powder Technol. 2023, 416, 118218. [Google Scholar] [CrossRef]
  12. Wu, J.Q.; Zhao, L.J.; Zhou, X.L. Discrete element analysis of the effect of aggregate morphology on the flowability of self-compacting concrete. Case Stud. Constr. Mater. 2023, 18, e02010. [Google Scholar] [CrossRef]
  13. Noor, M.A.; Uomoto, T. Three-dimensional discrete element simulation of rheology tests of self-compacting concrete. In Proceedings of the 1st International RILEM Symposium on Self-Compacting Concrete, Stockholm, Sweden, 1 January 1999. [Google Scholar]
  14. Petersson, Ö. Simulation of self-compacting concrete-laboratory experiments and numerical modelling of testing methods, J-ring and L-box tests. In Proceedings of the 3rd International RILEM Symposium on Selfcompacting Concrete, Reykjavik, Iceland, 17–20 August 2003. [Google Scholar]
  15. Mechtcherine, V.; Shyshko, S. Simulating the behaviour of fresh concrete with the Distinct Element Method–Deriving model parameters related to the yield stress. Cem. Concr. Compos. 2015, 55, 81–90. [Google Scholar] [CrossRef]
  16. Hoornahad, H.; Koenders, E.A.B. Simulating macroscopic behavior of self-compacting mixtures with DEM. Cem. Concr. Compos. 2014, 54, 80–88. [Google Scholar] [CrossRef]
  17. Li, M. Numerical simulating workability of fresh SCC flow based on DEM. Master’s Dissertation, Tianjin University, Tianjin, China, 2017. [Google Scholar]
  18. Anjneya, K.; Deb, A. Effect of material fabric on gravity flow in fresh concrete. Int. J. Solids Struct. 2025, 316, 113386. [Google Scholar] [CrossRef]
  19. Anjneya, K.; Deb, A.; Mukherjee, S. Simulating Fresh Concrete Behavior Through Discrete Element Approach. In Recent Developments in Structural Engineering; Goel, M.D., Vyavahare, A.Y., Khatri, A.P., Eds.; Springer: Singapore, 2024; Volume 4, pp. 243–253. [Google Scholar]
  20. Qiu, P.; Yang, L.; Huang, C.; Hu, J.; Meng, Q. An efficient discrete element method-enhanced mesoscale modeling method for multi-phase concrete-like composites with high volume fraction. Buildings 2025, 15, 1716. [Google Scholar] [CrossRef]
  21. Remond, S.; Pizette, P. A DEM hard-core soft-shell model for the simulation of concrete flow. Cem. Concr. Res. 2014, 58, 169–178. [Google Scholar] [CrossRef]
  22. Cui, W.; Ji, T.Z.; Li, M.; Wu, X.L. Simulating the workability of fresh self-compacting concrete with random polyhedron aggregate based on DEM. Mater. Struct. 2017, 50, 92. [Google Scholar] [CrossRef]
  23. Ramyar, E.; Cusatis, G. Discrete fresh concrete model for simulation of ordinary, self-consolidating, and printable concrete flow. J. Eng. Mech. 2021, 148, 04021142. [Google Scholar] [CrossRef]
  24. Noor, M.A.; Uomoto, T. Numerical simulation of fresh concrete(1): Three-dimensional discrete element model for fresh concrete. Seisan Kenkyu. 1999, 51, 169–172. [Google Scholar]
  25. Zhang, K.; Yu, T.X.; Yu, W.D.; Zou, D.F.; Zhang, S.Y. Calibration of concrete discrete element parameters based on JKR bond model. Concrete 2020, 08, 46–50+55. [Google Scholar]
  26. Anjneya, K.; Deb, A. Uncertainty propagation in discrete element models using PDEM. Structures 2023, 57, 105326. [Google Scholar] [CrossRef]
  27. Cao, G.D.; Tan, T.; Jiang, S.Q.; Deng, D.Q.; Liu, Y.; Su, H.W. Measurement and calibration of discrete element parameters of fresh concrete. J. Xiangtan Univ. Nat. Sci. 2024, 46, 13–21. [Google Scholar]
  28. Li, Y.J.; Cui, W.; Qi, L.; Li, M. Numerical simulation of performance of fresh SCC based on DEM. Eng. J. Wuhan Univ. 2019, 52, 33–39. [Google Scholar]
  29. Yang, Y.; Tang, S.G. Discrete element method simulation of granular flow and its advances. China Powder Sci. Technol. 2006, 12, 38–43. [Google Scholar]
  30. Shi, C.; Zhang, Q.; Wang, S.N. Numerical simulation technology and application with particle flow code(PFC5.0). Rock Soil Mech. 2018, 39, 36. [Google Scholar]
  31. Johnson, K.L.; Kendall, K.; Roberts, A.D. Surface energy and the contact of elastic solids. Proc. R. Soc. Lond. A. 1971, 324, 301–313. [Google Scholar]
  32. Tabor, D.J. Surface forces and surface interaction. J. Colloid Interface Sci. 1977, 58, 2–13. [Google Scholar] [CrossRef]
  33. Johnson, K.L.; Greenwood, J.A. An adhesion map for the contact of elastic spheres. J. Colloid Interface Sci. 1997, 192, 326–333. [Google Scholar] [CrossRef]
  34. Li, Y.; Hao, J.; Jin, C.; Wang, Z.G.; Liu, J.L. Simulation of the flowability of fresh concrete by discrete element method. Front. Mater. 2021, 7, 603154. [Google Scholar] [CrossRef]
  35. Qi, L.; Liu, C.P.; Cui, W.; Li, Y.J. Calibration of contact parameters of DEM for fresh self-compacting concrete. J. Funct. Mater. 2018, 49, 7050–7056. [Google Scholar]
  36. Marshall, J.S. Discrete-element modeling of particulate aerosol flows. J. Comput. Phys. 2009, 228, 1541–1561. [Google Scholar] [CrossRef]
  37. JGJ/T 283-2012; Technical Specification for Application of Self-Compacting Concrete. China Architecture & Building Press: Beijing, China, 2012; pp. 8–9.
  38. GB/T50080-2016; Standard for test method of performance of ordinary fresh concrete. China Architecture & Building Press: Beijing, China, 2012; pp. 7–8.
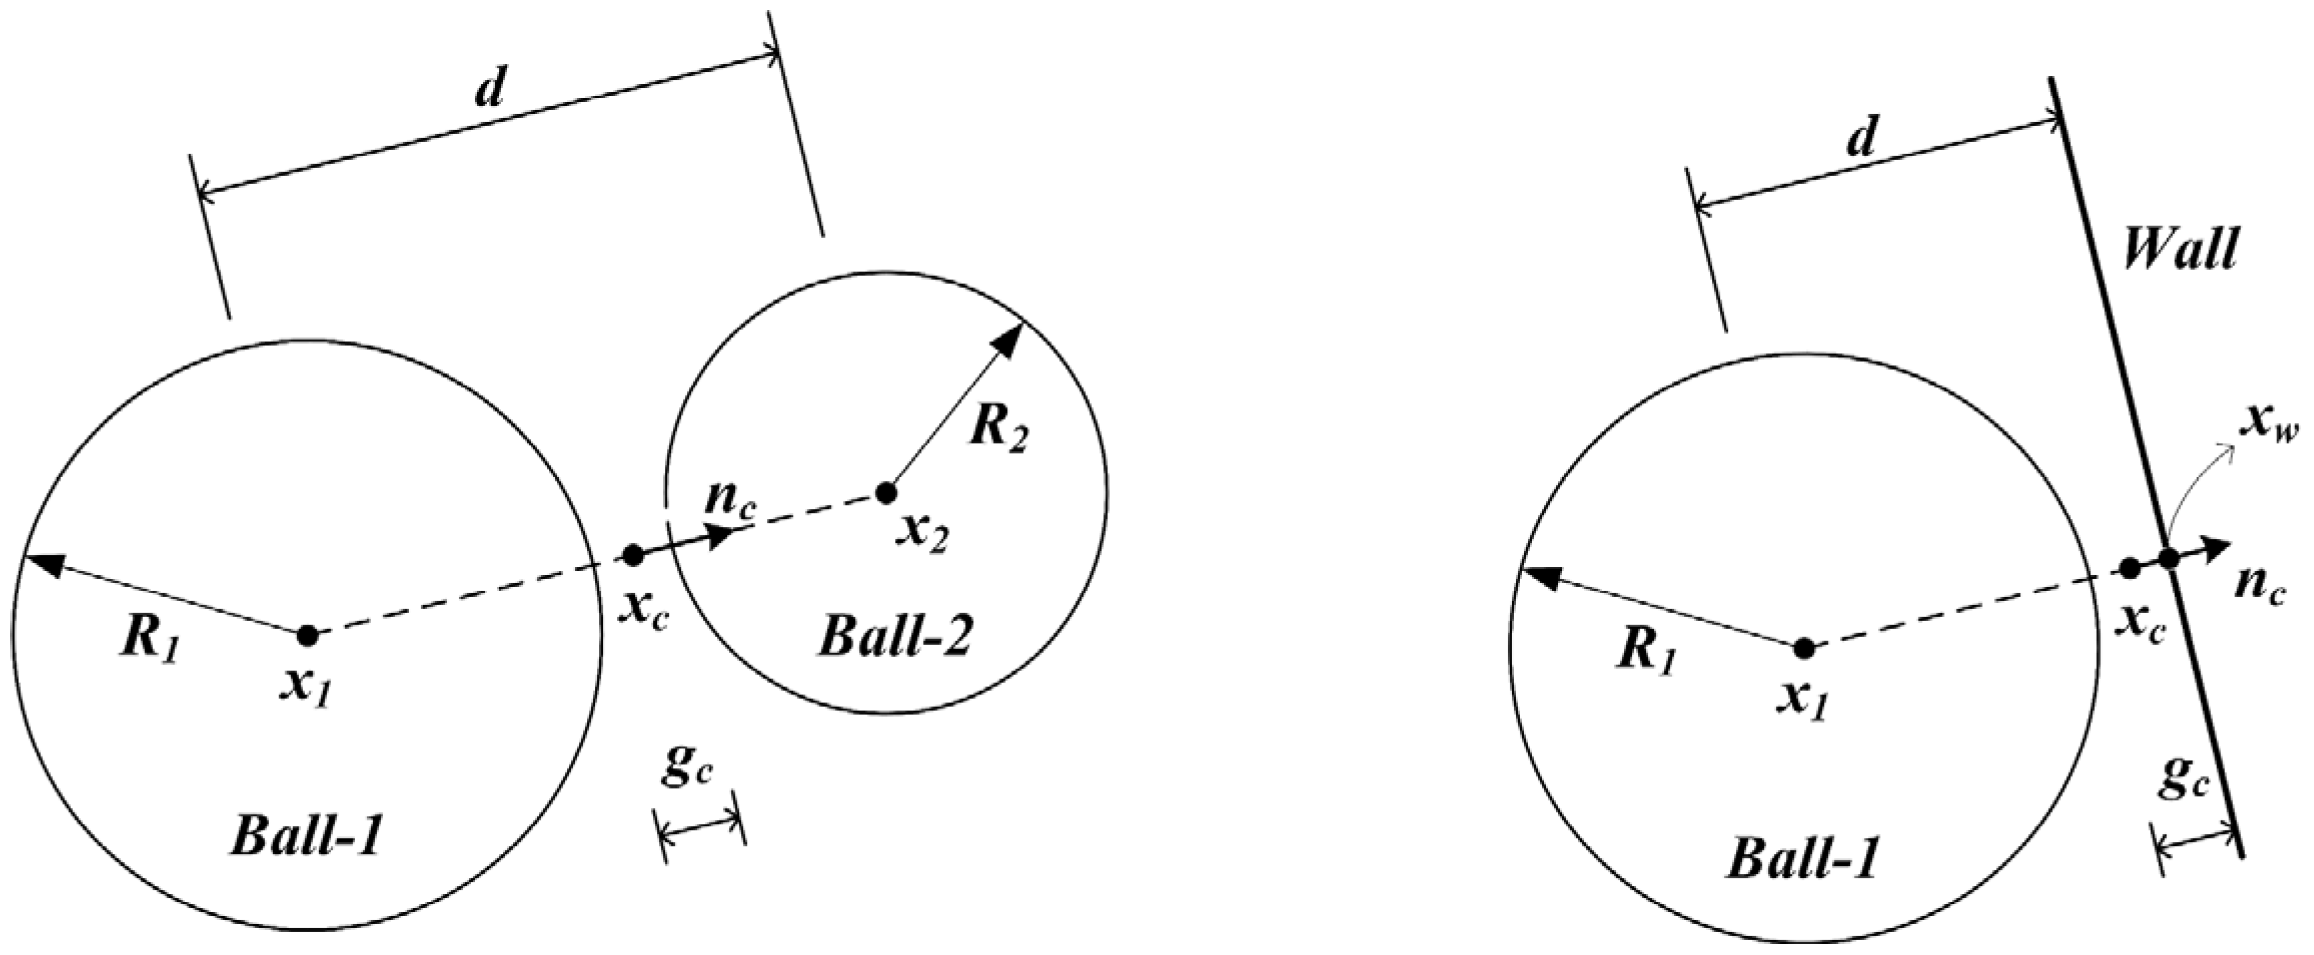
Figure 1. Two basic contact types.
Buildings 15 03795 g001
Figure 2. Modeling process.
Buildings 15 03795 g002
Figure 3. Slump test device.
Buildings 15 03795 g003
Figure 4. J-ring test device.
Buildings 15 03795 g004
Figure 5. Dimensions and reinforcement of J1 test piece.
Buildings 15 03795 g005
Figure 6. Beam–column joint specimen.
Buildings 15 03795 g006
Figure 7. Numerical model and force chain of slump: (a) numerical model; (b) chain of slump (the colorful points represent cross-sections of force chain lines, with warmer colors indicating stronger force chains).
Buildings 15 03795 g007
Figure 8. Neural network parameter inversion algorithm.
Buildings 15 03795 g008
Figure 9. Comparison of slump test results and simulation results: (a) test result; (b) simulation result.
Buildings 15 03795 g009
Figure 10. Comparison of J-ring test results and simulation results: (a) test result; (b) simulation result.
Buildings 15 03795 g010
Figure 11. Accumulation during pouring.
Buildings 15 03795 g011
Figure 12. Test piece pouring result.
Buildings 15 03795 g012
Figure 13. Pouring results at 1/4 zone.
Buildings 15 03795 g013
Figure 14. Numerical model and pouring simulation results: (a) 1/4 numerical model; (b) simulation result.
Buildings 15 03795 g014
Figure 15. Comparison of test results and simulation results: (a) test depth of 1 cm; (b) test depth of 2 cm; (c) test depth of 3 cm; (d) simulation depth of 1 cm; (e) simulation depth of 2 cm; (f) simulation depth of 3 cm.
Buildings 15 03795 g015
Figure 16. Schematic diagram of construction of different node models: (a) model J1; (b) model J2; (c) model J3; (d) model J4.
Buildings 15 03795 g016
Figure 17. Influence of number of top beam longitudinal bars on pouring results: (a) model J1; (b) model J2; (c) distribution of concrete.
Buildings 15 03795 g017
Figure 18. Influence of diameter of top beam longitudinal bars on pouring results: (a) model J1; (b) model J3; (c) distribution of concrete.
Buildings 15 03795 g018
Figure 19. Influence of column stirrup spacing on pouring results: (a) model J1; (b) model J4; (c) distribution of concrete.
Buildings 15 03795 g019
Figure 20. Influence of concrete fluidity on pouring results: (a) model J1; (b) model J5; (c) distribution of concrete.
Buildings 15 03795 g020
Figure 21. Influence of maximum coarse aggregate particle size on pouring results: (a) model J1; (b) model J6; (c) distribution of concrete.
Buildings 15 03795 g021
Figure 22. Influence of pouring speed on pouring results: (a) model J1; (b) model J7; (c) distribution of concrete.
Buildings 15 03795 g022
Table 1. Mix proportion of self-compacting concrete.
ComponentUsage/(kg/m3)
coarse aggregate 1145
fine aggregate 763
PO42.5 cement375
flyash45
water reducer4.4
water181
Table 2. Grading distribution of coarse aggregate.
Size Distribution/mmVolume Fraction/%
0~50
5~104.43
10~1546.27
15~2030.28
20~2519.02
total100.00
Table 3. Comparison between slump test and numerical results.
Test ResultsParameters TestNumerical SimulationRelative Error/%
slump test divergence/mm582.4587.00.79
height/mm249.0246.90.83
Table 4. Comparison between J-ring test and numerical results.
Test ResultsParameters TestNumerical SimulationRelative Error/%
J-ring test divergence/mm539.6542.50.54
height/mm223.0224.50.67
Table 5. Comparison between test and PFC results.
ParametersTest Result/%Simulation Result/%Relative Error/%
Depletion volume ratio0.480.472.08
Proportion of void area in the section 1 cm away from the roof6.587.9019.88
Proportion of void area in the section 2 cm away from the roof5.746.6014.98
Proportion of void area in the section 3 cm away from the roof4.605.008.70
Table 6. Parameters influencing joint pouring quality.
NumberSCC Fluidity Number of Longitudinal BeamsTop Beam Longitudinal Bars Diameter/mmMaximum
Aggregate Size/mm
Pouring Speed/(m3/h)Spacers
Spacing/mm
J1SCC14252015100
J2SCC12252015100
J3SCC14202015100
J4SCC1425201550
J5SCC24252015100
J6SCC14251615100
J7SCC14252030100
Table 7. Comparison between this study and previous studies.
This StudyPrevious Studies
PFC3D was used to simulate standard concrete tests, providing clearer comparison with experimental results.Hoornahad and others used PFC2D to simulate concrete flow, which only offers a vertical plane view and is less clear than a 3D visualization.
Compared to experimental results, the simulation errors for both the slump test and J-ring test were controlled within 1%, demonstrating high accuracy.Li used PFC for numerical simulation of standard concrete tests, controlling the error within 7%.
Simulating the pouring of beam–column joints from engineering projects held greater practical application value.Most scholars such as Cui primarily simulated standard concrete tests without applying the method to practical engineering.
Disclaimer/Publisher’s Note: The statements, opinions and data contained in all publications are solely those of the individual author(s) and contributor(s) and not of MDPI and/or the editor(s). MDPI and/or the editor(s) disclaim responsibility for any injury to people or property resulting from any ideas, methods, instructions or products referred to in the content.