Article

Study on Engineering Geopolymer Composites (EGCs) Under Sustained Thermal Environment: Linking Strain-Hardening Characteristics, Static/Impact Load Mechanical Properties, and Evolution Mechanism

1
China Railway Tiegong City Construction Co., Ltd., Jinan 250000, China
2
Engineering Research Center of Zero-Carbon Energy Buildings and Measurement Techniques, Ministry of Education, Hebei University, Baoding 071002, China
*
Author to whom correspondence should be addressed.
Buildings 2025, 15(20), 3792; https://doi.org/10.3390/buildings15203792
Submission received: 20 August 2025 / Revised: 29 September 2025 / Accepted: 4 October 2025 / Published: 21 October 2025

Abstract

This study focuses on the performance evolution of Engineering Geopolymer Composites (EGCs) in long-term thermal environments, investigating the mechanical properties and microstructural evolution of alkali-activated fly ash–slag composites under sustained 60 °C thermal conditions. The research results indicate that sustained exposure to 60 °C significantly enhances the static and impact loading compressive strength of EGCs; however, single-slag or high-alkalinity systems exhibit strength retrogression due to insufficient long-term thermal stability. After exposure to elevated temperatures, the tensile strain-hardening curve of EGCs becomes smoother, with a reduced number of cracks but increased crack width, leading to a transition from a distributed multicrack propagation pattern to rapid widening of primary cracks. Due to the bridging effect of PVA fibers, sustained elevated temperature significantly enhances the peak impact load stress of the S50-6 sample. Microscopic analysis attributes this improvement to the matrix-strengthening effect caused by accelerated C-(A)-S-H gel polymerization and refined pore structure under continuous heat, as well as the energy dissipation role of the fiber system. The study recommends an optimal EGC system formulation with a fly ash–slag mass ratio of 1:1 and a Na2O concentration of 4–6%. This research provides a theoretical foundation for understanding the performance evolution and strength stability of EGC materials under sustained elevated temperature.

1. Introduction

Green, low-carbon, and sustainable development represent important directions for the future of civil engineering materials. Alkali-activated cementitious materials have emerged as the most extensively researched binders due to their low energy consumption, reduced carbon emissions, and exceptional strength and durability properties [1,2,3]. Engineered Cementitious Composites (ECCs), characterized by high ductility, superior toughness, and fine crack distribution, demonstrate strain-hardening behavior and multiple microcracking under direct tensile or flexural loading, exhibiting outstanding deformation capacity and crack width control capabilities [4,5,6]. However, the preparation of ECCs requires 2–3 times more cementitious materials than conventional concrete [7], which raises concerns regarding environmental sustainability due to the high carbon footprint associated with cement production. This inherent drawback has spurred the exploration of alternative cementitious materials to overcome the environmental limitations of ECCs while retaining their superior mechanical properties [8]. Fiber-reinforced composites that completely replace cement with alkali-activated materials are termed Engineered Geopolymer Composites (EGCs) or Strain-Hardening Geopolymer Composites (SHGCs).
EGCs exhibit remarkable strain-hardening and multiple crack propagation behavior [9]. Extensive research has been conducted on EGCs, including the preparation methods, strain-hardening mechanisms, multiple crack propagation, and durability [10,11,12,13,14,15]. A critical driver for this research is the deployment of structures in sustained thermal environments, such as those found in hot–arid regions, elevated-temperature industrial plants, high-ground-temperature tunnels, and deep-well cement pastes, where service temperatures typically range from 60 °C to 80 °C [16,17]. This underscores the necessity for materials capable of maintaining long-term performance under continuous heating. Current research on the temperature effects of EGC materials is limited to short-term high-temperature conditions (≤2 h) [18], with no reported studies on the strain-hardening behavior and dynamic mechanics under impact loading of EGCs in continuous thermal environments. For fiber-reinforced composites, strain-hardening performance decreases with increasing age, and if coupled with sustained elevated temperature action, the bonding between various components within EGCs becomes more complex. Elevated temperature exposure is detrimental to an ECC’s multiple cracking behavior. It is well established that while high temperature generally degrades mechanical properties, both ECCs and EGCs can retain strain-hardening characteristics below 200 °C [18,19,20]. For instance, EGCs demonstrate greater impact resistance than ECCs at 100 °C and achieve exceptional tensile strain capacity (e.g., 3.22%) after exposure to 105 °C. A lightweight EGC has also been shown to maintain strain-hardening behavior and crack control capability even after 1 h at 200 °C, albeit with reduced tensile stress due to interface degradation [21]. A key factor governing the high-temperature performance of these composites is the properties of the fibers. Although both polyethylene (PE) and polyvinyl alcohol (PVA) fibers are widely used in applications below 200 °C, their performance diverges significantly with increasing temperature. The melting point of PE fibers is below 200 °C, whereas that of PVA fibers is approximately 248 °C. When heated, PVA fibers experience elongation and a reduction in stiffness, which compromises the fiber–matrix interface and energy dissipation mechanisms. PE fibers, due to their inferior thermal resistance, suffer more pronounced stiffness loss [22]
To investigate the thermal resistance of EGCs and their strain-hardening and impact-resistant properties after long-term exposure to high temperatures, EGC materials were prepared using PVA fibers and alkali-activated fly ash–slag mortar. The study examined their tensile strain capacity and static/impact compressive strength after sustained exposure to 60 °C. Additionally, X-ray diffraction (XRD), mercury intrusion porosimetry (MIP), and scanning electron microscopy (SEM) tests were employed to characterize changes in hydration products, pore structure, and micro-morphology following long-term 60 °C conditions. The research aims to elucidate the evolution mechanism of an EGC’s mechanical properties under prolonged thermal conditions, providing a theoretical foundation for its application in complex elevated temperature environments.

2. Materials and Methods

2.1. Raw Materials

Fly ash and slag are considered the most suitable precursors for alkali-activated materials due to their large annual production volumes. Class F grade I fly ash and S95-grade slag were selected. The fly ash appears as a gray powder with a density of 2.81 g/cm3, while the slag is a white powder with a density of 2.84 g/cm3. The chemical compositions of fly ash and slag were analyzed by X-ray fluorescence (XRF) spectroscopy, as shown in Table 1. The particle size distributions of the two powder materials were measured using a Mastersizer 3000 laser particle size analyzer (Malvern, UK), as shown in Figure 1. The alkali activators used were analytical-grade sodium hydroxide and sodium silicate solution (with a modulus of 3.22). The aggregate used was 80-mesh silica sand. PVA fibers produced by a Japanese company (TvNets Co., Ltd.) were selected, and the geometric and mechanical properties are listed in Table 2. Chemically pure isopropanol was used to terminate sample hydration. Photographs of the raw materials used in the experiment are shown in Figure 2.

2.2. Sample Preparation

Fly ash–slag mass ratios were set as 1:0, 3:1, 1:1, and 0:1, with Na2O concentrations of 2%, 4%, 6%, and 8%. The specific mix proportions are shown in Table 3, where the liquid–solid ratio is 0.3, the sand–binder ratio is 0.3, and the PVA fiber content is 2 vt% [23,24]. According to the mix proportions in Table 3, the alkali activator solution was prepared 24 h in advance. After the fly ash–slag powder was uniformly mixed, the alkali activator was poured in and mixed with stirring for 3 min. PVA fibers were added in batches, and stirring continued until the fibers were completely dispersed. The freshly mixed samples were quickly poured into 50 mm × 50 mm × 50 mm cubic molds, dog-bone-shaped molds (with a cross section of 30 mm × 13 mm and a gauge length of 80 mm), and cylindrical molds with a diameter of 50 mm and a height of 50 mm. The samples were covered with plastic wrap and transferred to a standard curing chamber (temperature = 20 °C ± 2 °C, relative humidity = 95% ± 1%) for 24 h before demolding. After demolding, the samples were continuously cured in the standard chamber until reaching 27 d of age. Following standard curing, the samples were removed and placed in a room-temperature (humidity = 65%; temperature = 20–22 °C) dry environment for 24 h. They were then transferred to a constant-temperature drying oven at 60 °C for durations of 3 d, 7 d, 28 d, and 90 d. For control purposes, additional samples were maintained in standard curing conditions for 28 d and 90 d, respectively.

2.3. Sample Tests

(1) Static compressive strength test: Samples with a size of 50 mm × 50 mm × 50 mm were tested at a loading rate of 0.5 MPa/s. Three samples were tested per group, and the average value of the three samples was taken as the final compressive strength.
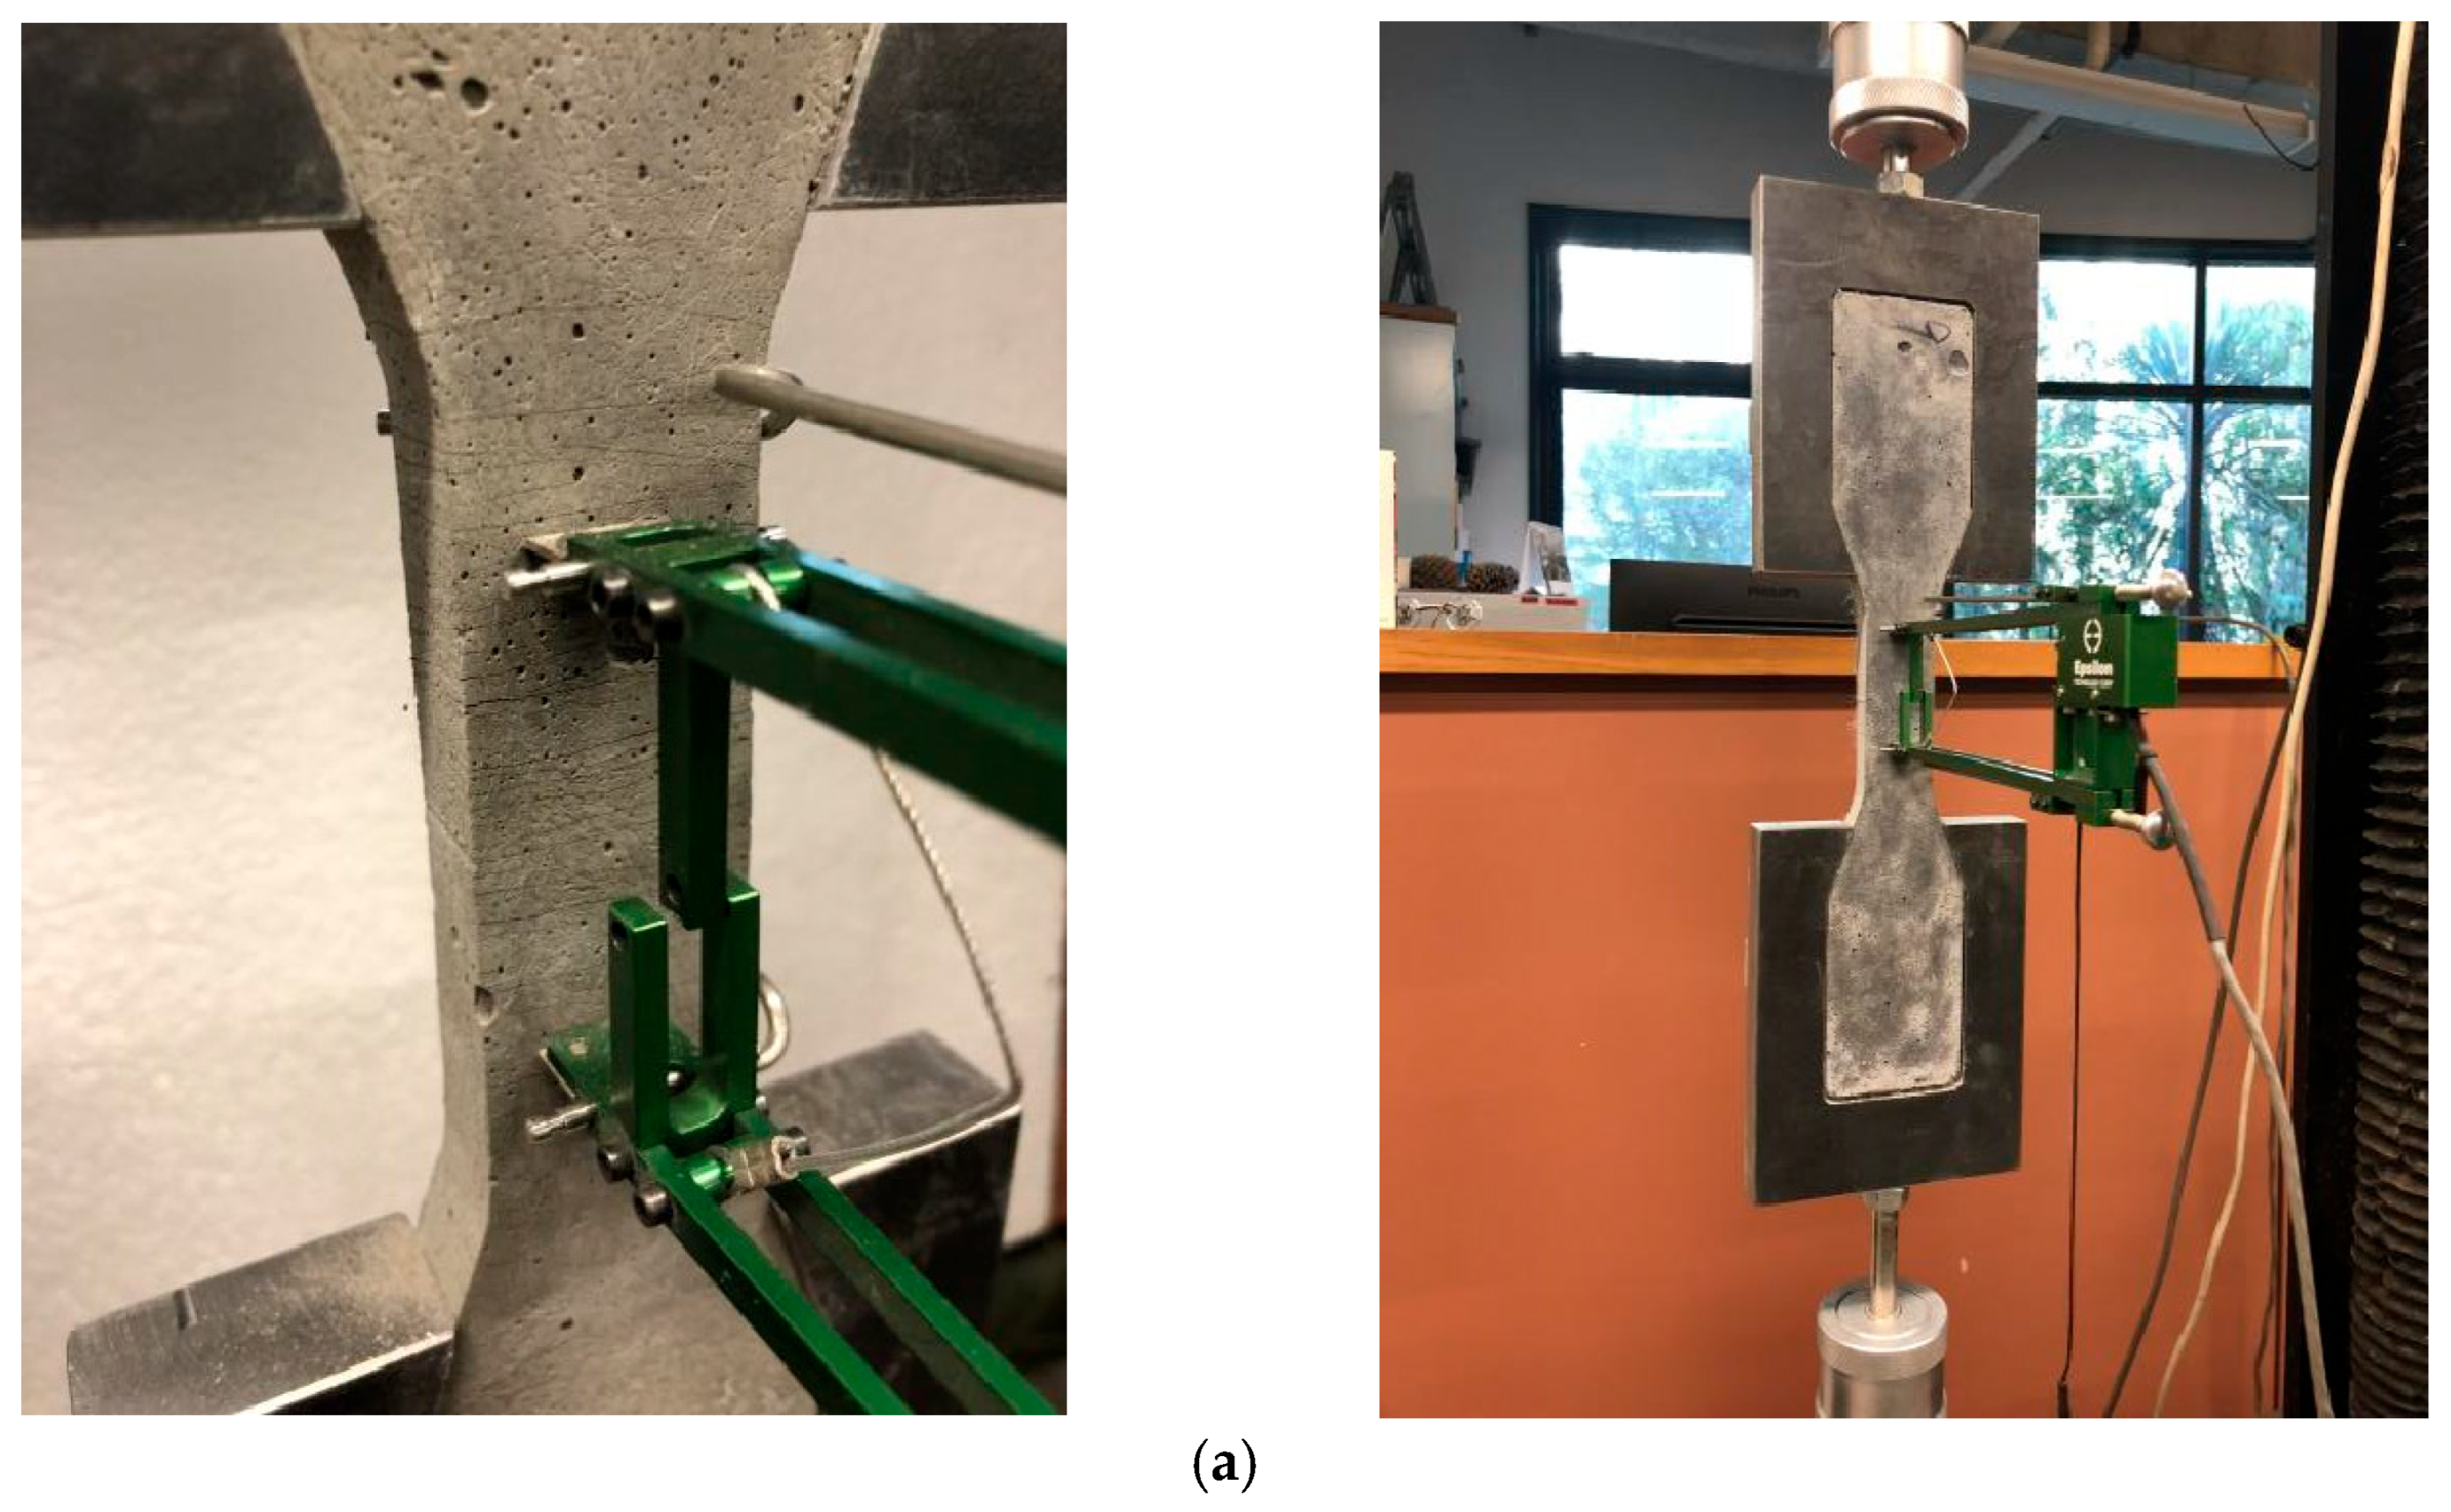
(2) Tensile strength test: Dog-bone-shaped samples were secured using specialized grips and tested at a loading rate of 0.5 mm/min. Strain within the gauge length was measured using linear variable differential transformers (LVDTs), and the experimental setup is shown in Figure 3a.
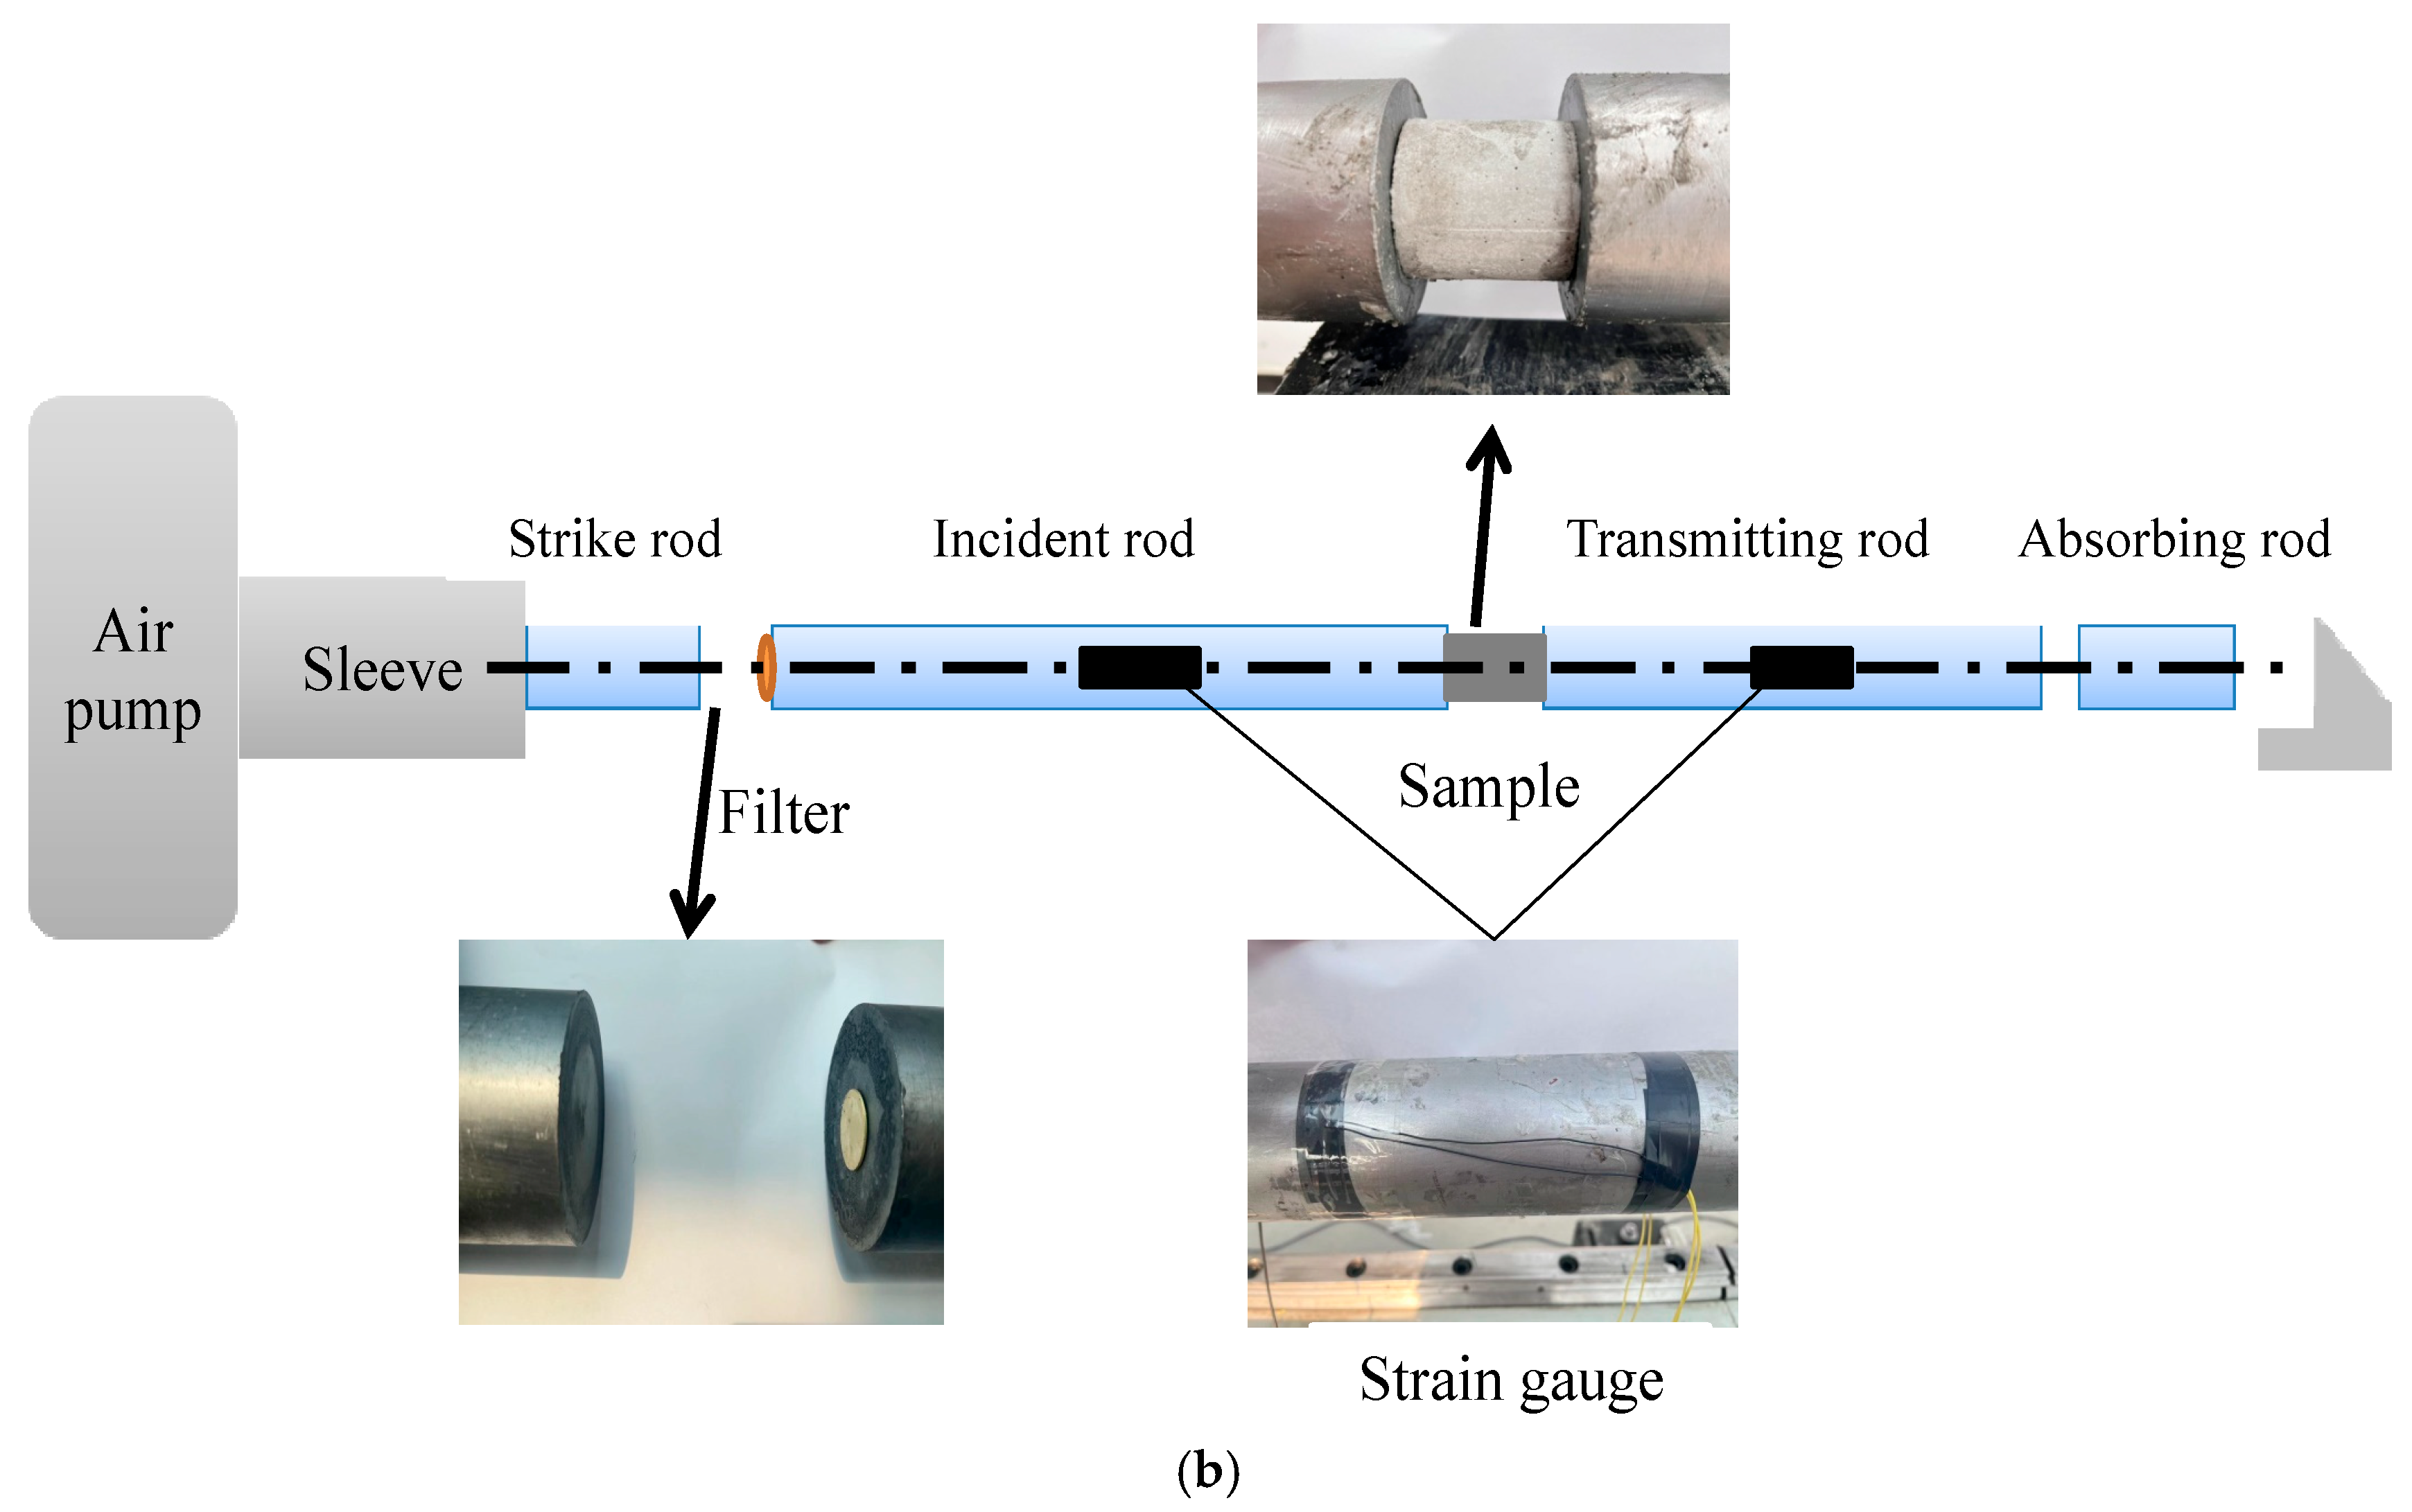
(3) Impact load compressive strength test: A split Hopkinson pressure bar (SHPB) test device with a diameter of 75 mm was used for impact compression testing, as shown in Figure 3b. The SHPB device mainly consisted of a power device, a test device, and a signal acquisition device. The bullet, incident bar, transmission bar, and absorption bar were made of high-strength alloy steel, with lengths of 0.6 m, 4.0 m, 3.6 m, and 0.8 m, respectively. To optimize the shape of the stress wave and compensate for inherent issues such as pulse oscillation in the testing device, a copper plate with a diameter of 15 mm and a thickness of 1 mm (Φ15 × 1 mm) was used as a pulse shaper, placed between the bullet and the incident bar. The air pressure was uniformly set at 0.5 MPa. The test samples were cylindrical with a diameter of 50 mm and height of 50 mm, satisfying the aspect ratio requirement to avoid inertial effects and waveform dispersion. During the test, a high-speed camera was used to capture digital images of the samples under impact loading.
(4) XRD tests: The EGC samples were peeled, crushed, and cored, and then hydration was terminated using isopropanol at 4 °C for 24 h, followed by drying in a low-temperature vacuum environment for 24 h. The samples were ground finely using an agate mortar and sieved through a 200-mesh sieve (primarily to remove fibers and larger particles). A Netherlands-made X’Pert PRO MPD X-ray diffractometer was used, with continuous scanning at a rate of 2°/min over a range of 10–70°.
(5) MIP Tests: The EGC samples were crushed, and larger fragments were selected and then immersed in isopropanol at 4 °C for 24 h to terminate hydration, followed by drying in a low-temperature vacuum environment for 24 h. The AutoPore 9600 fully automatic mercury intrusion porosimeter was used, with a tested pore size range of 3 nm to 1000 μm.
(6) SEM tests: Sample preparation was the same as that for the MIP tests. A Hitachi Regulus8100 scanning electron microscope was used for the test, with a testing voltage of 15 kV, a current of 1 nA, and a magnification of 2000×.

3. Results Analysis

3.1. Static Compressive Strength Analysis

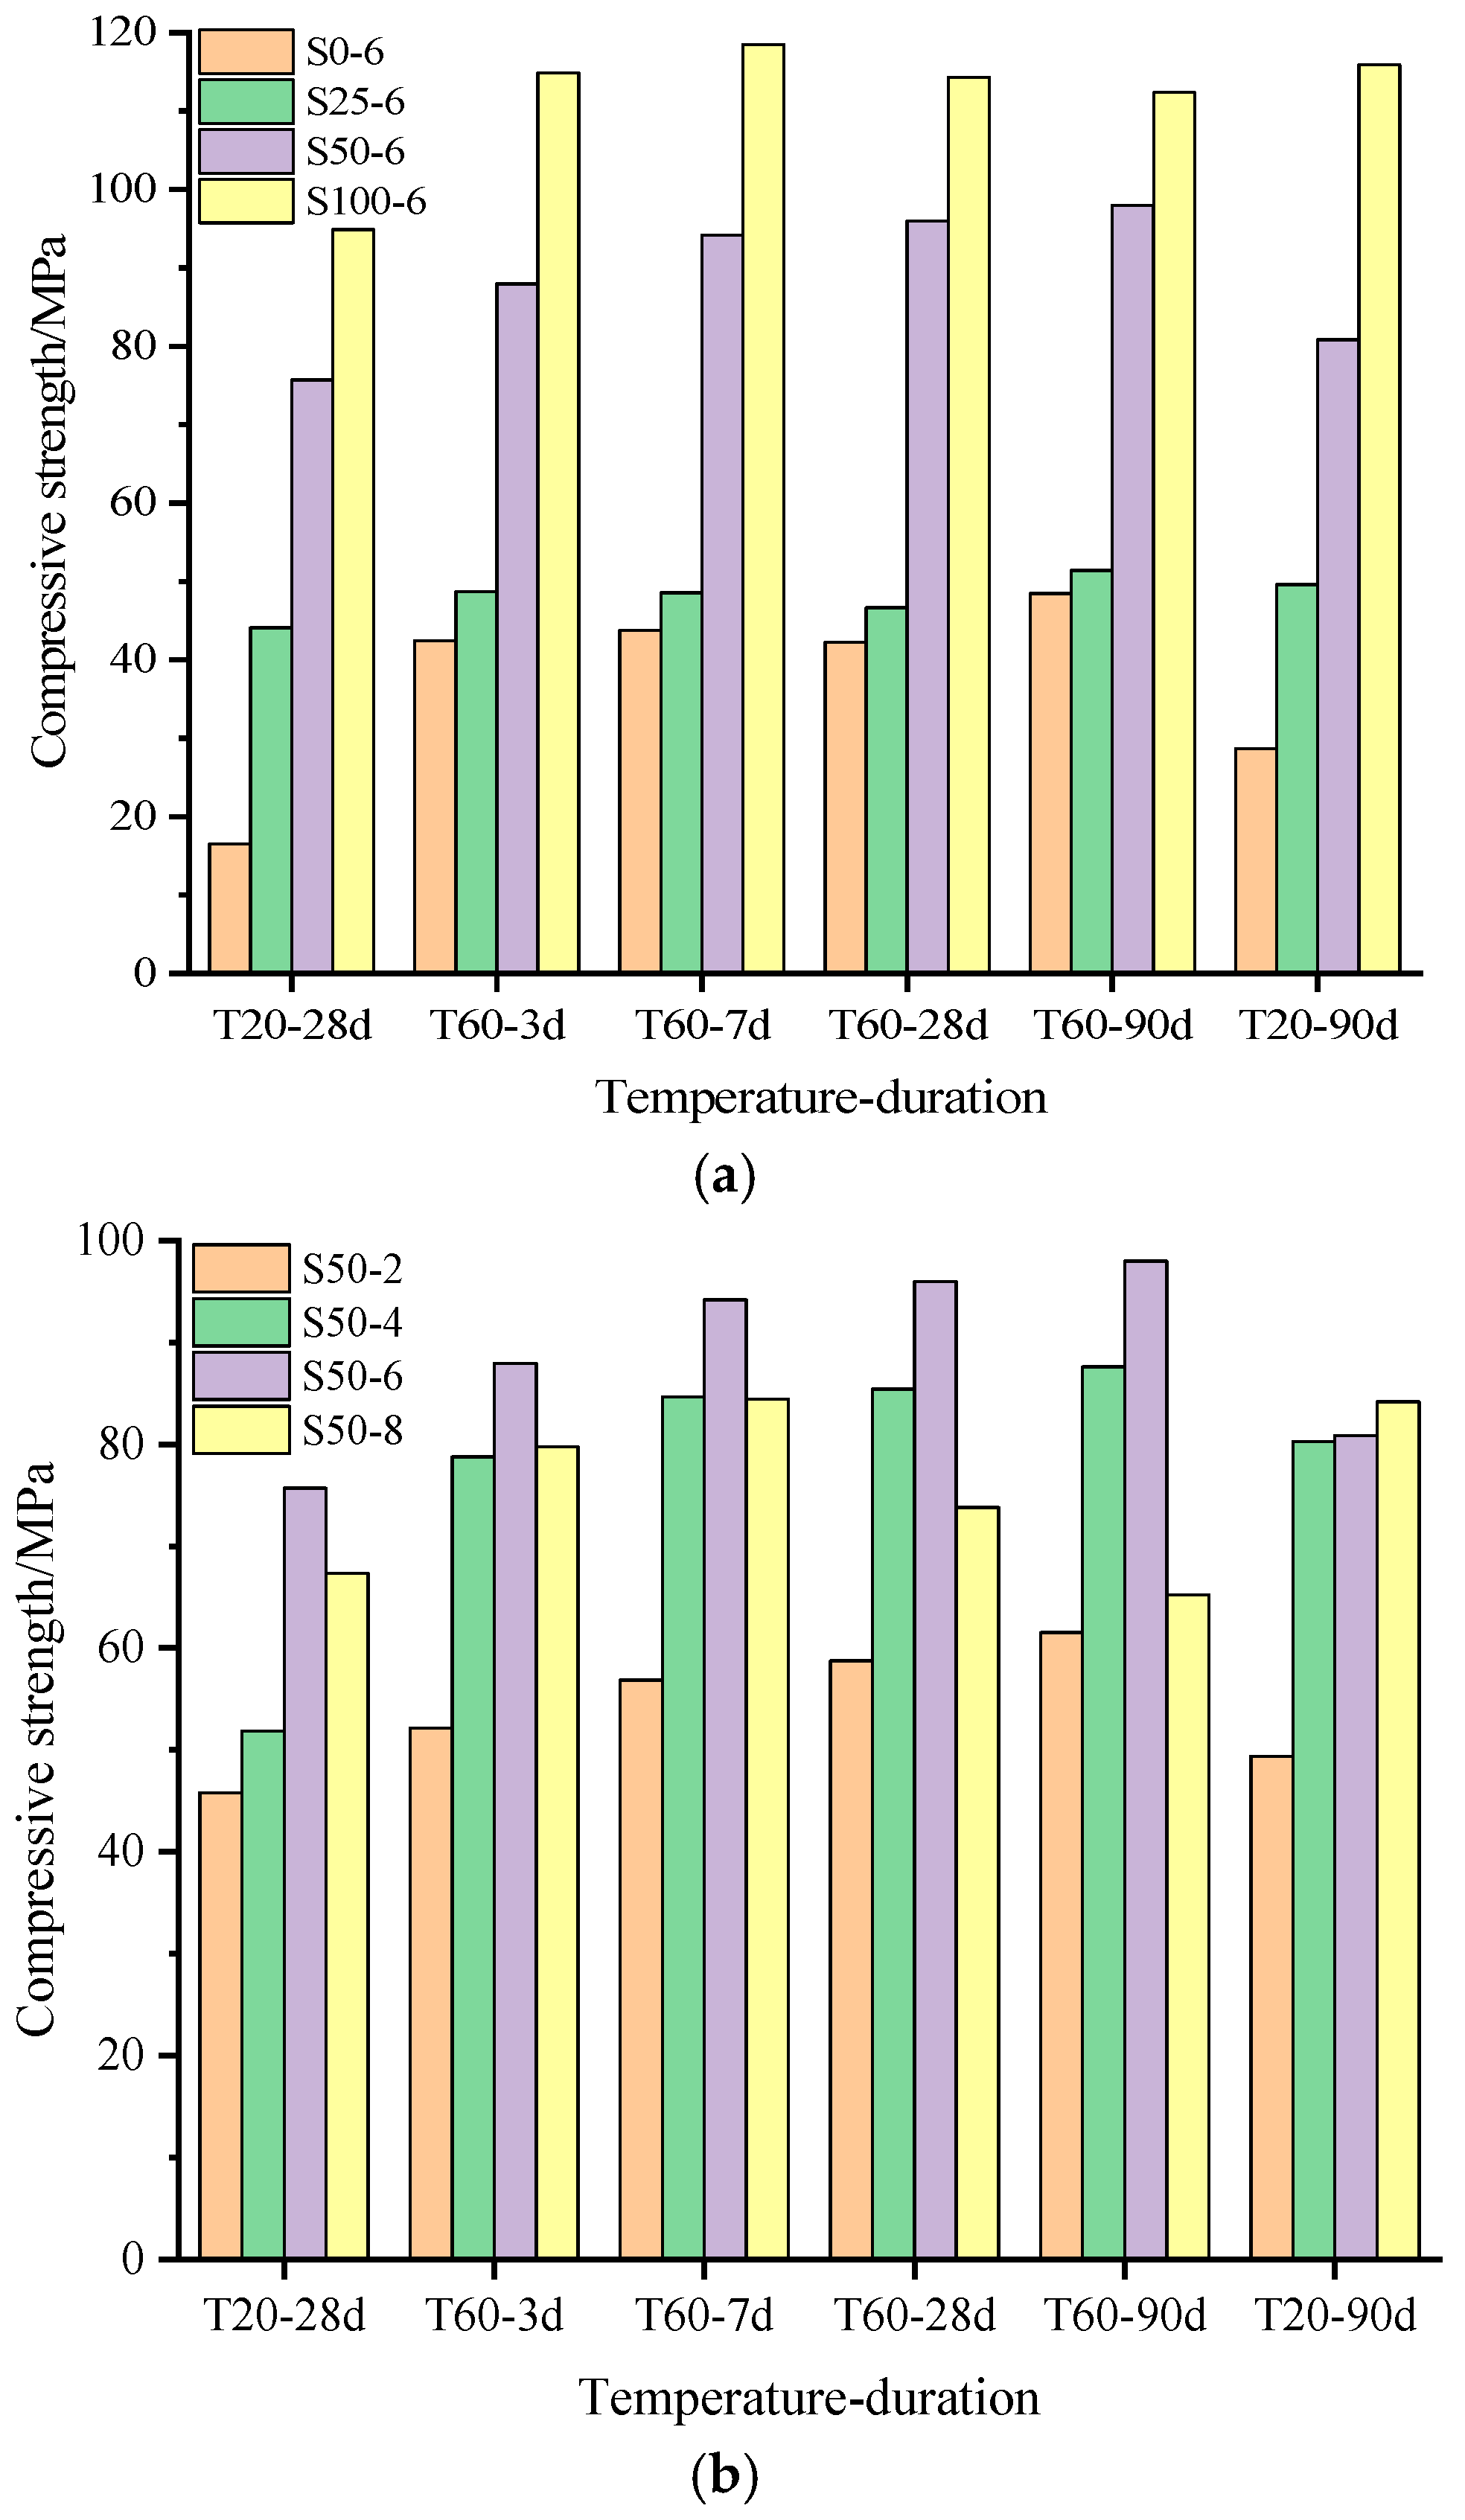
Figure 4 shows the static compressive strength of EGC samples, where the horizontal axis “T60-3d” represents samples subjected to sustained exposure at 60 °C for 3 d; “T20-28d” and “T20-90d” represent control samples under standard curing conditions for 28 and 90 d, respectively. Figure 4a shows the fly ash–slag mass ratios. The compressive strength of the S0-6 sample doubled after exposure to 60 °C. The compressive strengths of samples S0-6 and S25-6 show no significant differences after continuous exposure to 60 °C for 3 d, 7 d, 28 d, and 90 d, all being higher than those cured at room temperature. For the S50-6 sample, the compressive strength continuously increases after sustained exposure to 60 °C. After 90 d, the compressive strength increases by 17.16 MPa compared to that of the standard-cured 90 d, indicating that the system exhibits excellent potential for strength development in long-term thermal environments. For the S100-6 sample, the compressive strength first increases and then decreases after sustained exposure to 60 °C, reaching the maximum at 7 d, and the compressive strength after 90 d of sustained elevated temperature is lower than that of the standard-cured 90 d, indicating that the single slag EGC system has poor stability in long-term thermal environments. Figure 4b presents the effect of Na2O concentration. For the Na2O concentrations of 2%, 4%, and 6%, the compressive strength continuously increases after 90 d of sustained exposure at 60 °C. However, when the Na2O concentration is 8%, the highest compressive strength is achieved after 7 d at 60 °C, indicating that excessively high alkalinity is detrimental to the high-temperature resistance of the alkali-activated system. When the Na2O concentration is 6%, the best elevated temperature resistance is exhibited, indicating that moderate alkalinity optimizes the thermal stability of alkali-activated materials.
Previous studies by the research group found that the compressive strength of alkali-activated fly ash–slag samples after exposure to 60 °C was lower than that without sustained elevated temperature treatment [25]. However, after adding PVA fibers, the compressive strength was significantly increased and exceeded that of standard-cured 28 d samples. In particular, the compressive strength of the S0-6 sample doubled, which is attributed to the synergistic effect between the fiber bridging effect and the alkali-activated matrix (the specific mechanism will be further explained in combination with microscopic analysis). Considering the stability of EGCs in long-term thermal environments, it is recommended that the fly ash–slag mass ratio is 1:1 and the Na2O concentration is 4–6%.

3.2. Tensile Strength Analysis

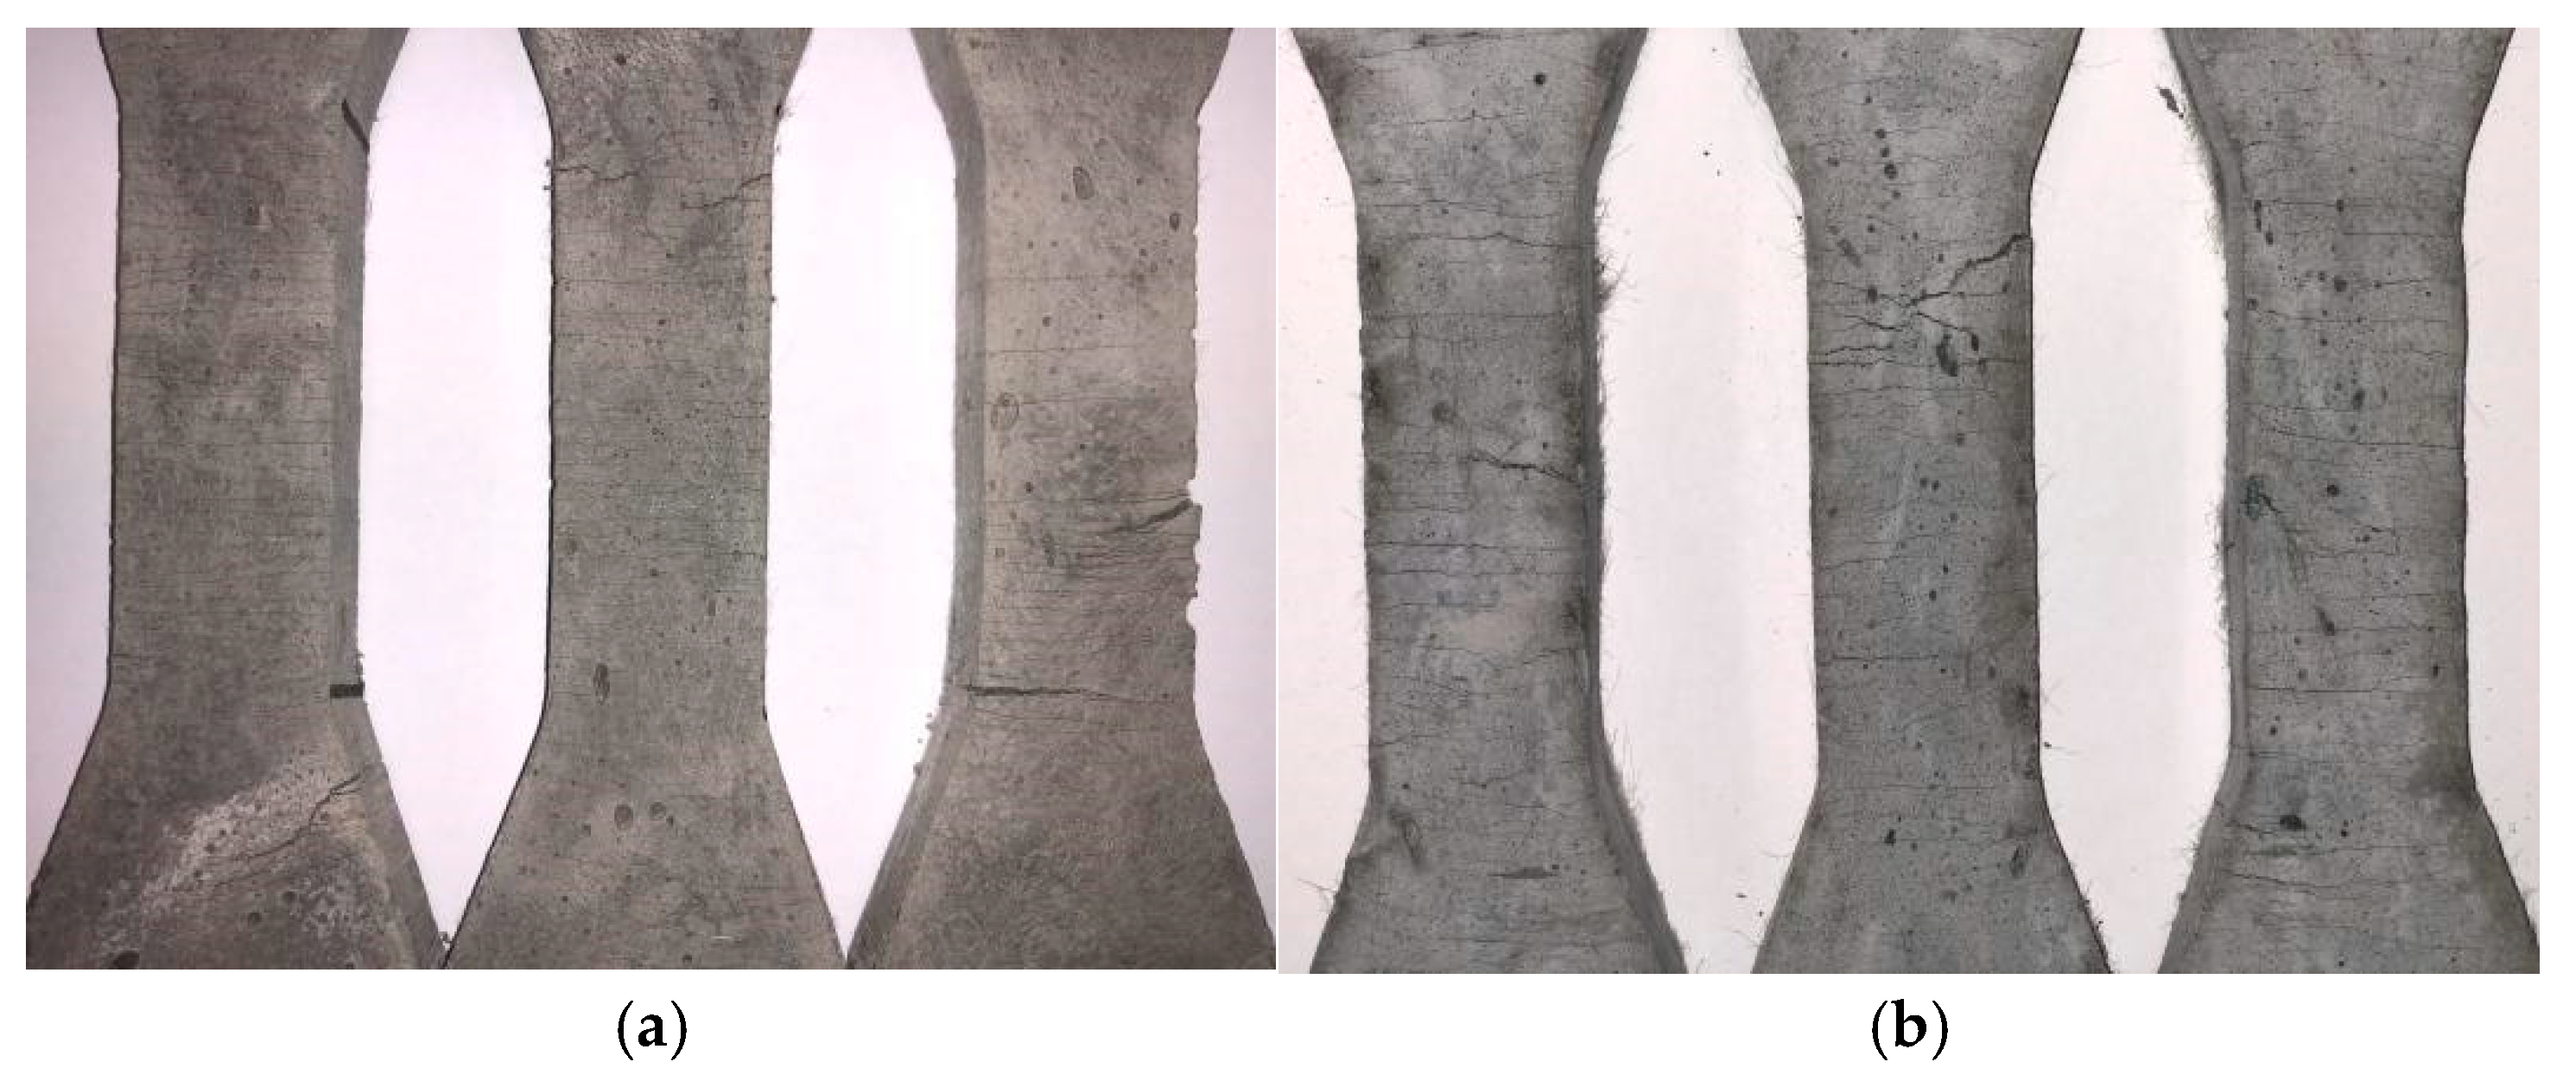
Figure 5 shows the tensile stress–strain curve of S50-6 samples. Both standard-cured and sustained-elevated-temperature-exposed EGC samples exhibited distinct strain-hardening behavior, with ultimate tensile strains exceeding 3%, demonstrating typical multiple-cracking characteristics [26,27]. The strain-hardening curves of standard-cured samples exhibit an obviously fluctuating multi-peak morphology, corresponding to the ordered propagation of multiple cracks during the tensile process of the material. As shown in Figure 6a, standard-cured samples have a larger number of cracks, demonstrating obvious multiple crack propagation behavior. The distributed microcracks effectively alleviate localized stress concentration, preventing the unstable propagation of a single dominant crack. Simultaneously, the bridging effect of PVA fibers across multiple crack planes continuously dissipates energy, enabling the material to maintain a stable strain-hardening response until reaching its ultimate tensile strain. After sustained exposure to 60 °C, the multi-peak characteristics of the strain-hardening curve disappear (the curve becomes smooth), transitioning to a steady ascending pattern. The number of cracks decreases while crack widths increase, no longer exhibiting distinct multiple-crack propagation. This may be related to changes in the bond properties of the fiber–matrix interfacial transition zone caused by elevated temperature exposure, which weakens the fiber bridging efficiency. As a result, there is insufficient fiber resistance to crack propagation, making it easier for a single crack to absorb energy and widen rapidly. It is worth noting that the strain-hardening rate of the samples is lower than that of the standard-cured 28 d samples in the early stage of elevated temperature at 60 °C, but higher than that of the standard-cured 90 d samples, indicating that long-term thermal exposure may have stage-specific effects on the properties of the fiber–matrix interface.

3.3. Impact Load Compressive Strength Analysis

3.3.1. Stress Equilibrium Check

The SHPB setup must satisfy two fundamental assumptions: the one-dimensional stress wave hypothesis and the stress uniformity condition [28,29]. In this experiment, the EGC samples were designed with a length–diameter ratio of 1.0, and the geometric parameters comply with the sample size requirements of one-dimensional stress wave theory [30]. Meanwhile, the striker bar length was significantly greater than that of the EGC samples, providing geometric assurance for stress–strain uniformity conditions. Figure 7 shows the SHPB test waveform diagram. Figure 7a presents the empty-bar test waveform, demonstrating that the incident and reflected waves maintained essentially identical amplitudes with no transmitted wave generation. This confirms stable stress wave propagation characteristics in the pressure bar system without sample intervention, verifying the inherent waveform quality of the device itself. When the striker bar impacts the incident bar from the launch chamber, it generates an incident pulse in the incident bar. This incident pulse propagates continuously forward through the incident bar, sample, and transmission bar. Due to the impedance mismatch between the sample and pressure bars, the incident pulse undergoes reflection and transmission at the sample–bar interfaces. One portion reflects back into the incident bar as a reflected wave, while the other portion continues propagating forward, driving high-rate deformation of the sample. The pulse transmitted through the sample enters the transmission bar, forming the transmitted wave [31]. Figure 7b,c show the typical waveform diagrams and stress equilibrium verification curves. The waveform of the incident wave + reflected wave exhibits excellent consistency with the transmitted wave, satisfying the stress uniformity assumption.

3.3.2. Stress–Strain Curve of Impact Load

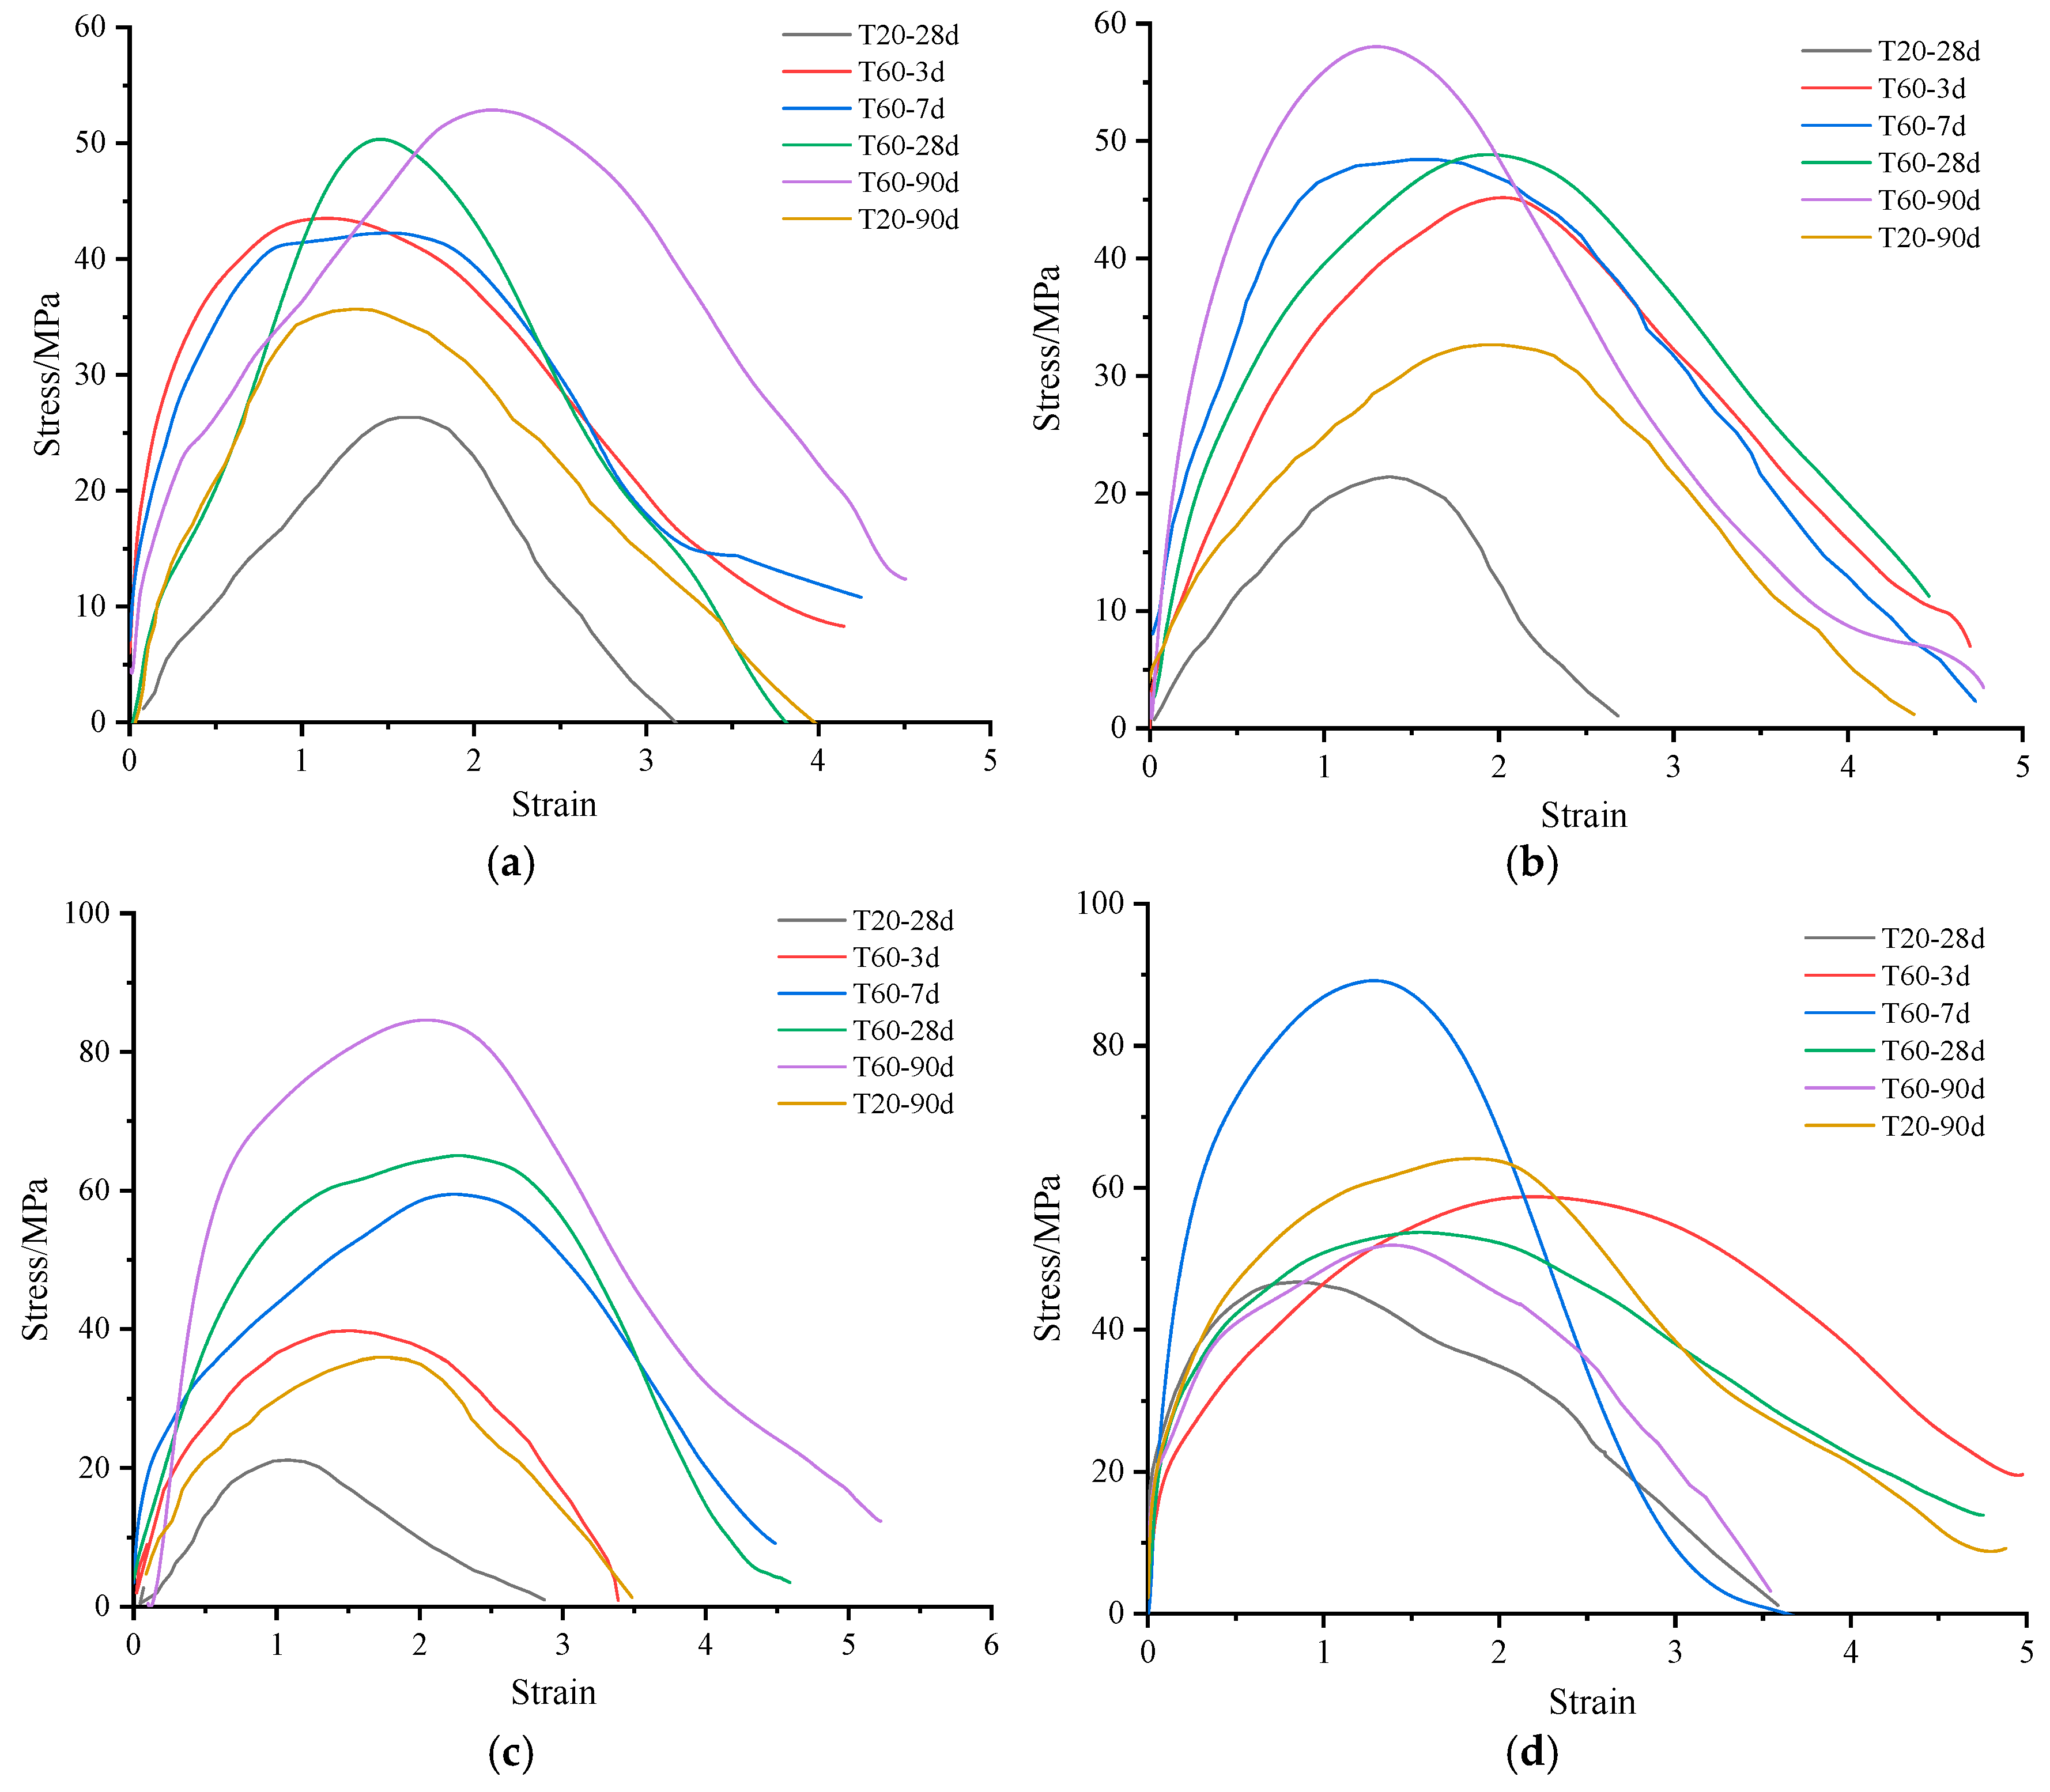
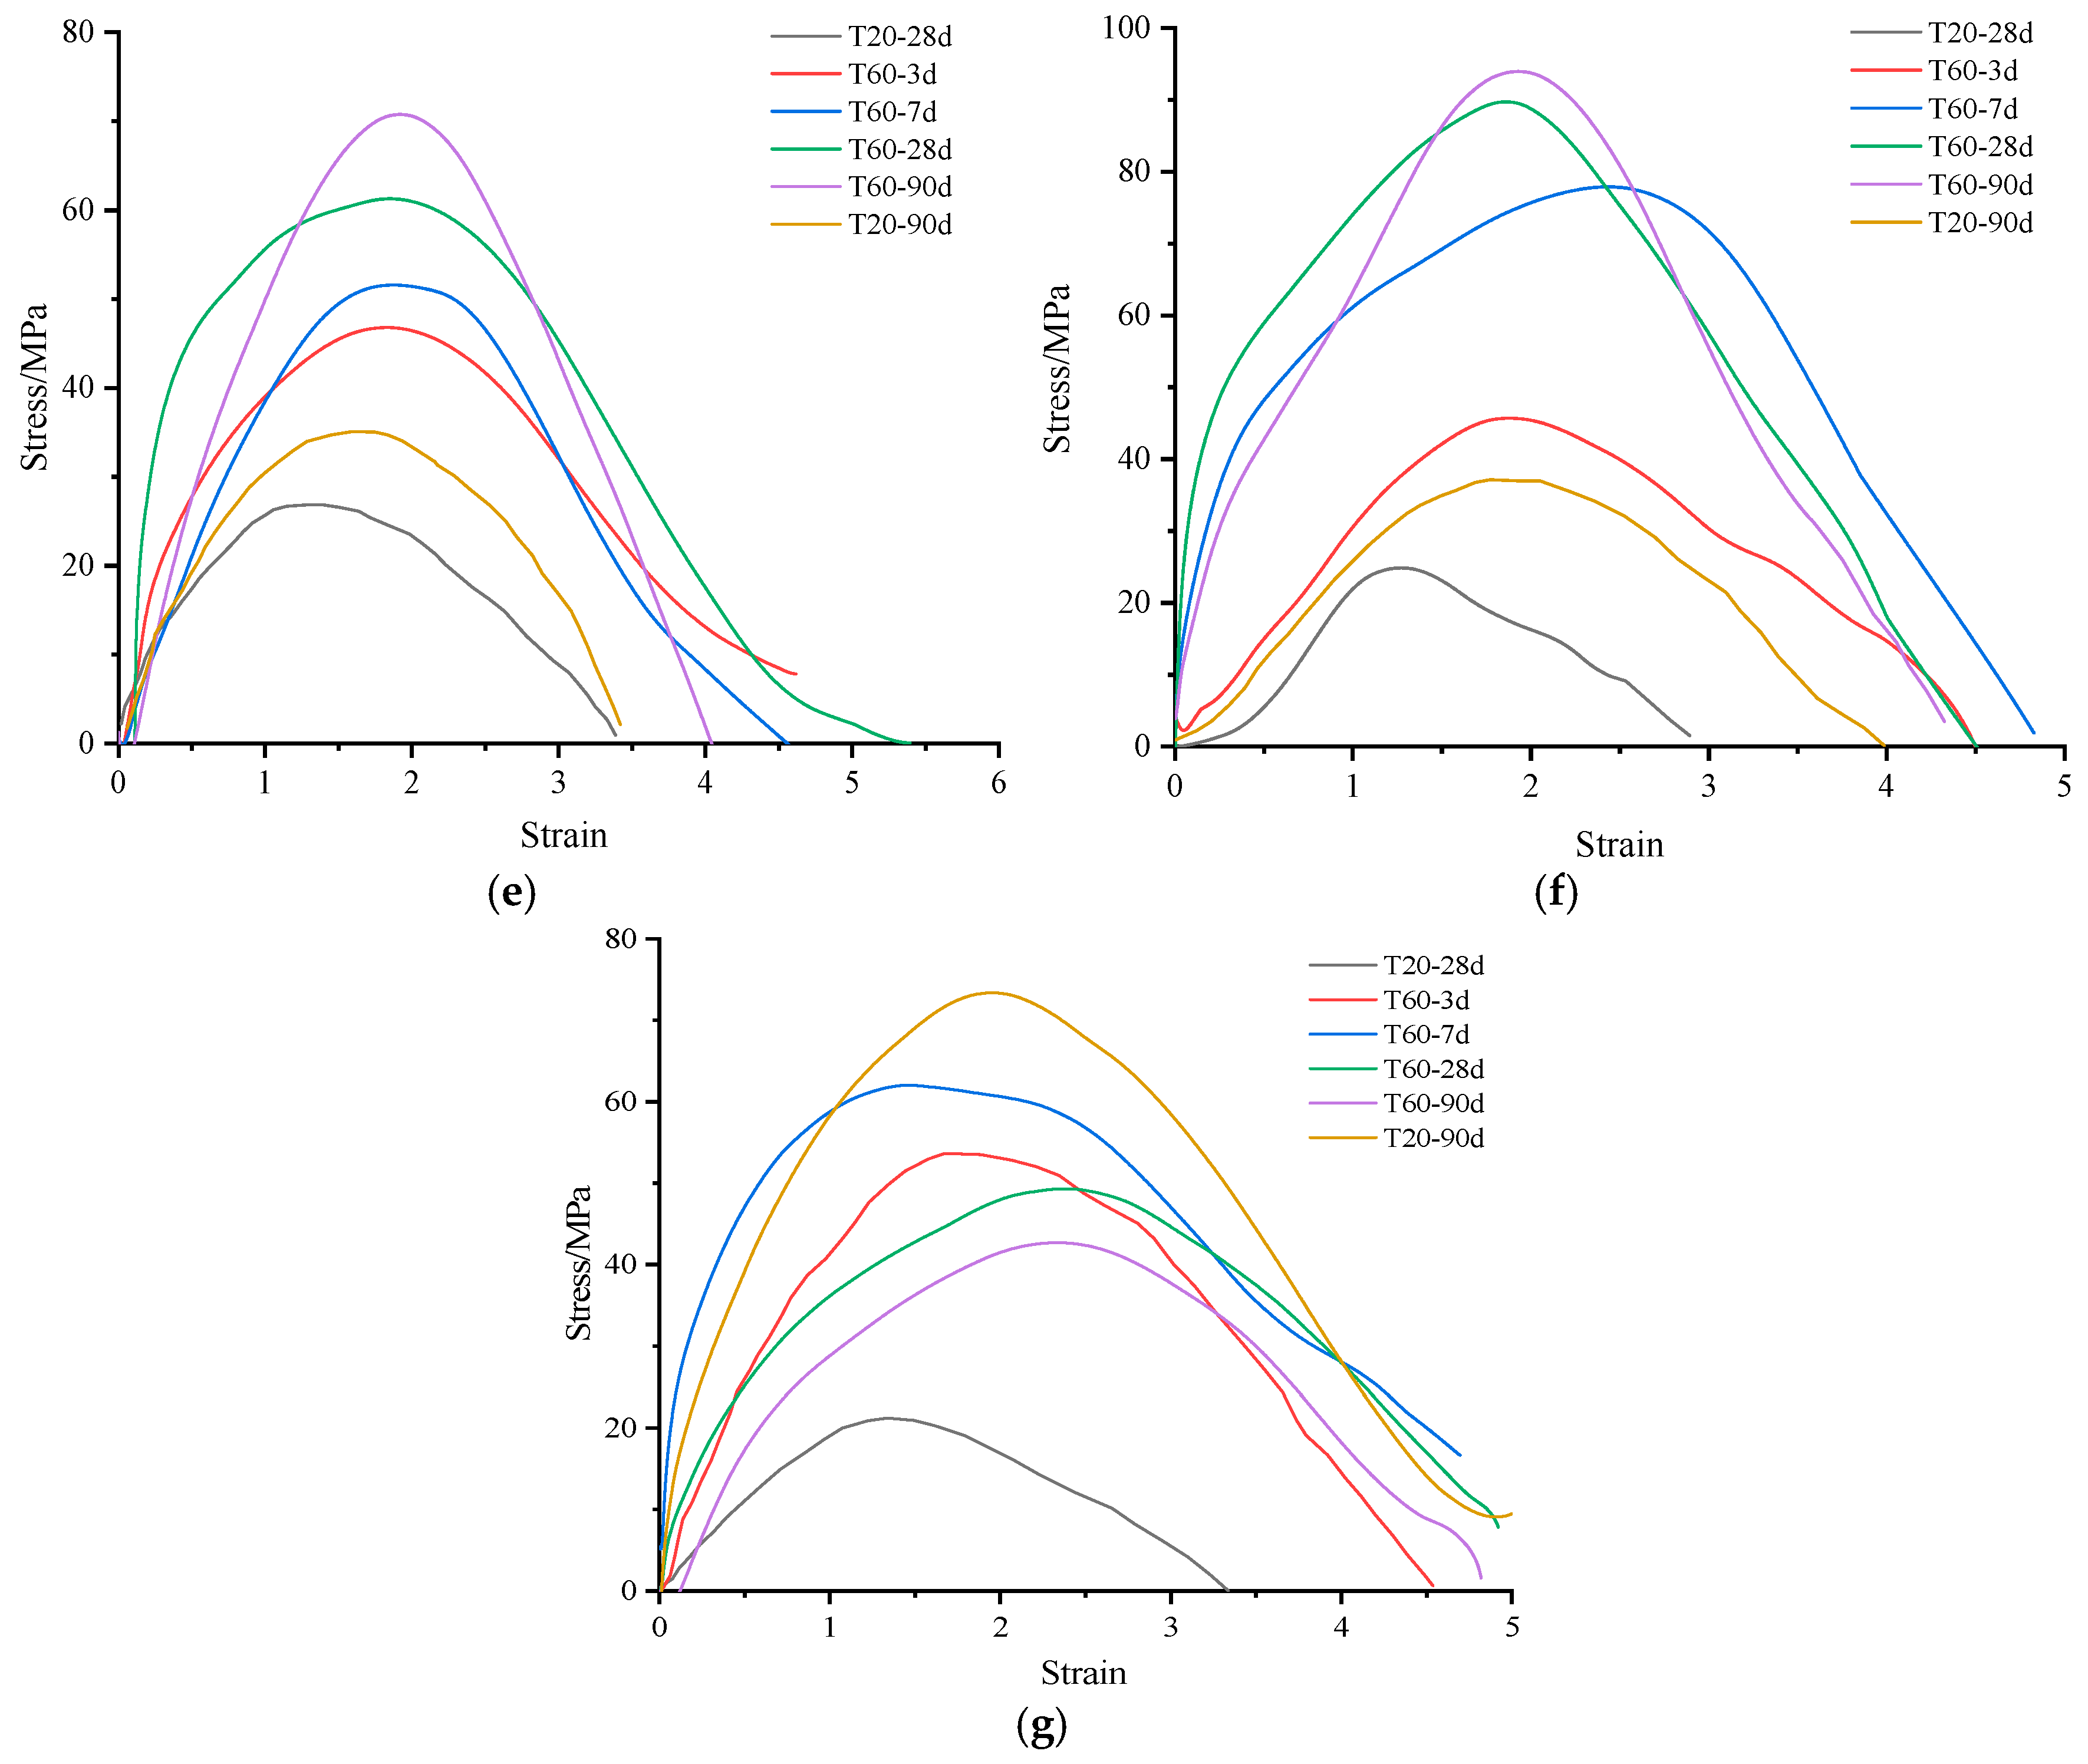
Figure 8 shows the impact load stress–strain curves of EGC samples, which exhibit a three-stage variation trend: elastic stage, elastoplastic strengthening stage, and plastic failure stage. In the early stage of the elastic stage, the curve is slightly convex toward the stress axis. This is due to the inertial effect of stress wave propagation during high-speed impact loading, which leads to instantaneous stress concentration. The kinetic energy at the moment of impact is converted into pulse stress within the sample, causing the stress–strain relationship to deviate from the ideal linear state [32]. As the strain increases, the curve enters the elastoplastic strengthening stage, where the material stiffness gradually decreases (the slope of the curve decreases), reflecting progressive damage caused by the initiation and propagation of internal microcracks. When the stress reaches its peak, the sample enters the plastic failure stage: the penetration of the main crack triggers a sudden stress drop, but deformation continues to increase, demonstrating the energy dissipation characteristics of the material under impact loading.
Overall, the variation trend of the peak stress under impact loading follows the same pattern as the static compressive strength: the peak stress under impact loading first increases and then decreases with the increase in slag content. Especially for the S50-6 sample (see Figure 8c), the peak stress after sustained elevated temperature at 60 °C is 2–3 times that of the standard-cured sample. This indicates that the impact resistance of EGC samples is significantly improved after sustained elevated temperature. This is related to the effective energy dissipation and inhibition of rapid crack propagation by the bridging effect of PVA fibers, as well as the morphological changes of hydration products in the gel-phase matrix. The peak stress of T60-28d is approximately 150% higher than that of T20-28d, indicating that the 60 °C elevated temperature environment continuously optimizes the dynamic mechanical properties of the material by accelerating hydration reactions and the polymerization of the gel phase.

3.3.3. Digital Image Correlation (DIC) Analysis

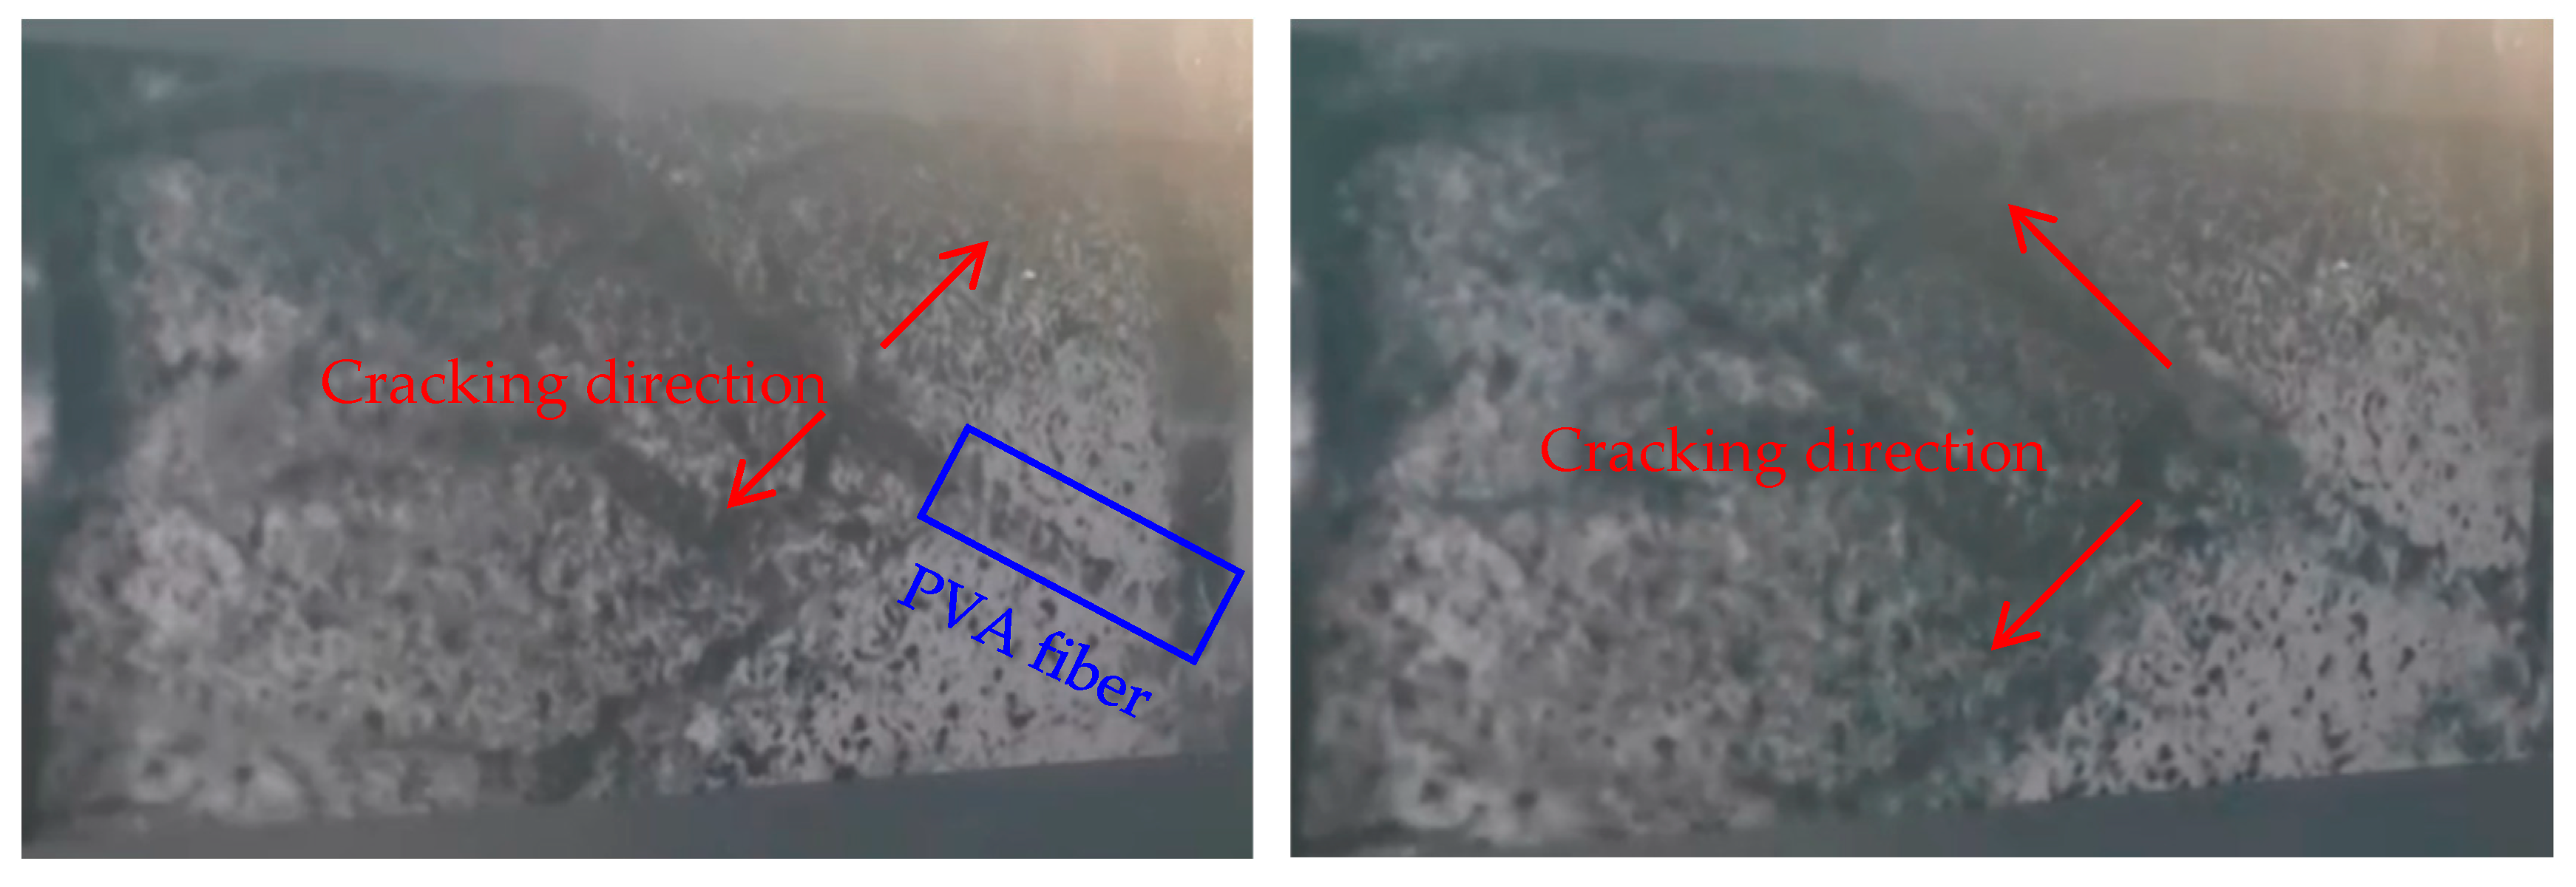
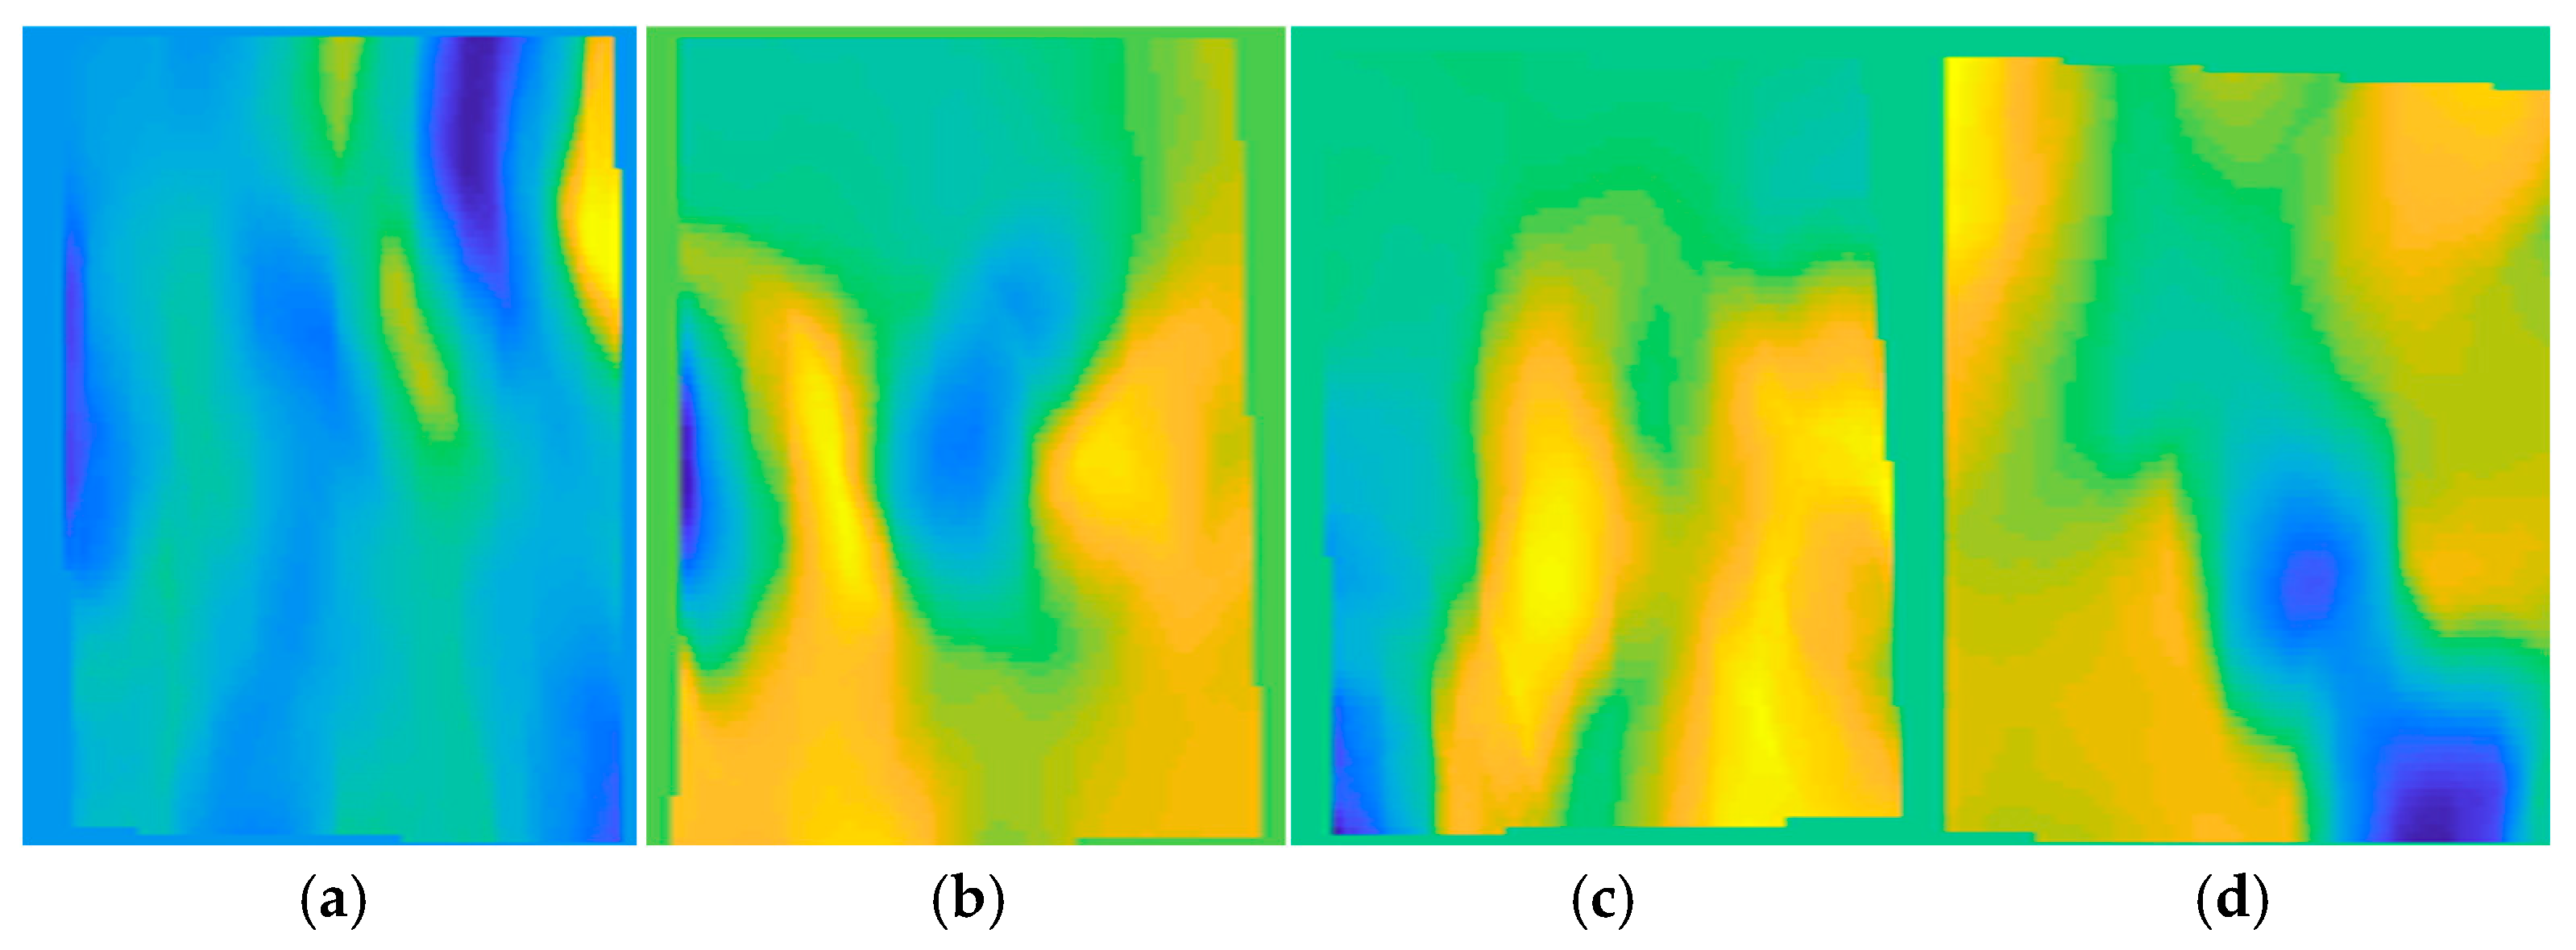
Figure 9 shows the failure images of the S50-6 sample captured by a high-speed camera after 28 d of sustained exposure at 60 °C. Influenced by the bridging effect of PVA fibers, the sample exhibits typical shear failure characteristics, with the main crack propagating along a 45° direction. As exposure time increases, the primary crack widens, and its width gradually increases; the local crushing failure occurs in the crack intersection area due to stress concentration. PVA fibers enhance the regulation of crack propagation paths. The displacement contour and strain contour obtained by analyzing the images captured by the high-speed camera during the impact compression failure process of EGC samples using VIC-2D are shown in Figure 10 and Figure 11, respectively. There are significant differences in the displacement distribution characteristics of samples with different fly ash–slag contents. The displacement contour of the S0-6 sample shows dense linear streaks, with cracks propagating in multiple dispersed directions. As the slag content increases, the number of linear streaks decreases significantly, and stress concentrates on 1–2 principal cracks. This phenomenon is directly related to the crack confinement effect caused by the improvement in material strength. EGC samples with high slag content tend to develop cracks directionally along the principal stress direction rather than forming complex crack networks. The strain contour (see Figure 11) demonstrates the spatiotemporal evolution characteristics of strain distribution during impact loading. At 100 μs, strain first accumulates locally at the end face where the sample contacts the pressure bar, while initial strain concentration appears at internal micro-defects. At 200 μs, a diagonal principal crack initially forms, and the strain distribution propagates from the end face contact area toward the middle of the sample. At 300 μs, the strain concentration region completely shifts to the sample interior, marking the stage transition of crack propagation from surface initiation to internal extension. At 400 μs, the principal crack penetrates the entire sample, with strain values in the crack region increasing sharply, ultimately leading to the instability failure of the material. This process clearly demonstrates the accumulation–release mechanism of strain energy under impact loading, as well as the dynamic evolution law of cracks from initiation and propagation to penetration.

3.3.4. Dynamic Increase Factor (DIF) Analysis

To quantitatively evaluate the strain rate sensitivity of EGC materials under sustained thermal exposure, the Dynamic Increase Factor (DIF) was introduced. The DIF is defined as the ratio of the dynamic compressive strength (fd, obtained from SHPB tests at ~100 s−1) to the quasi-static compressive strength (fs, obtained from tests at 0.5 MPa/s) for samples with an identical mix proportion and curing condition.
The DIF values for all formulations are summarized in Table 4. A notable observation is that the S50-6 sample exhibits the most significant strain rate strengthening effect after sustained thermal exposure. For instance, the DIF of the S50-6 sample after T60-28d treatment reaches 2.35, which is substantially higher than that of its standard-cured counterpart (T20-28d, DIF = 1.85). This indicates that the 60 °C thermal environment not only enhances the intrinsic matrix strength but also optimizes the fiber–matrix interface, thereby significantly improving the energy dissipation capacity and impact resistance of the material under high-rate loading. The DIF curve for the S50-6 sample across different curing conditions is graphically presented in Figure 8b, providing a clear visualization of the synergistic enhancement effect of sustained heat treatment on the dynamic mechanical properties of EGC.

3.4. XRD Analysis

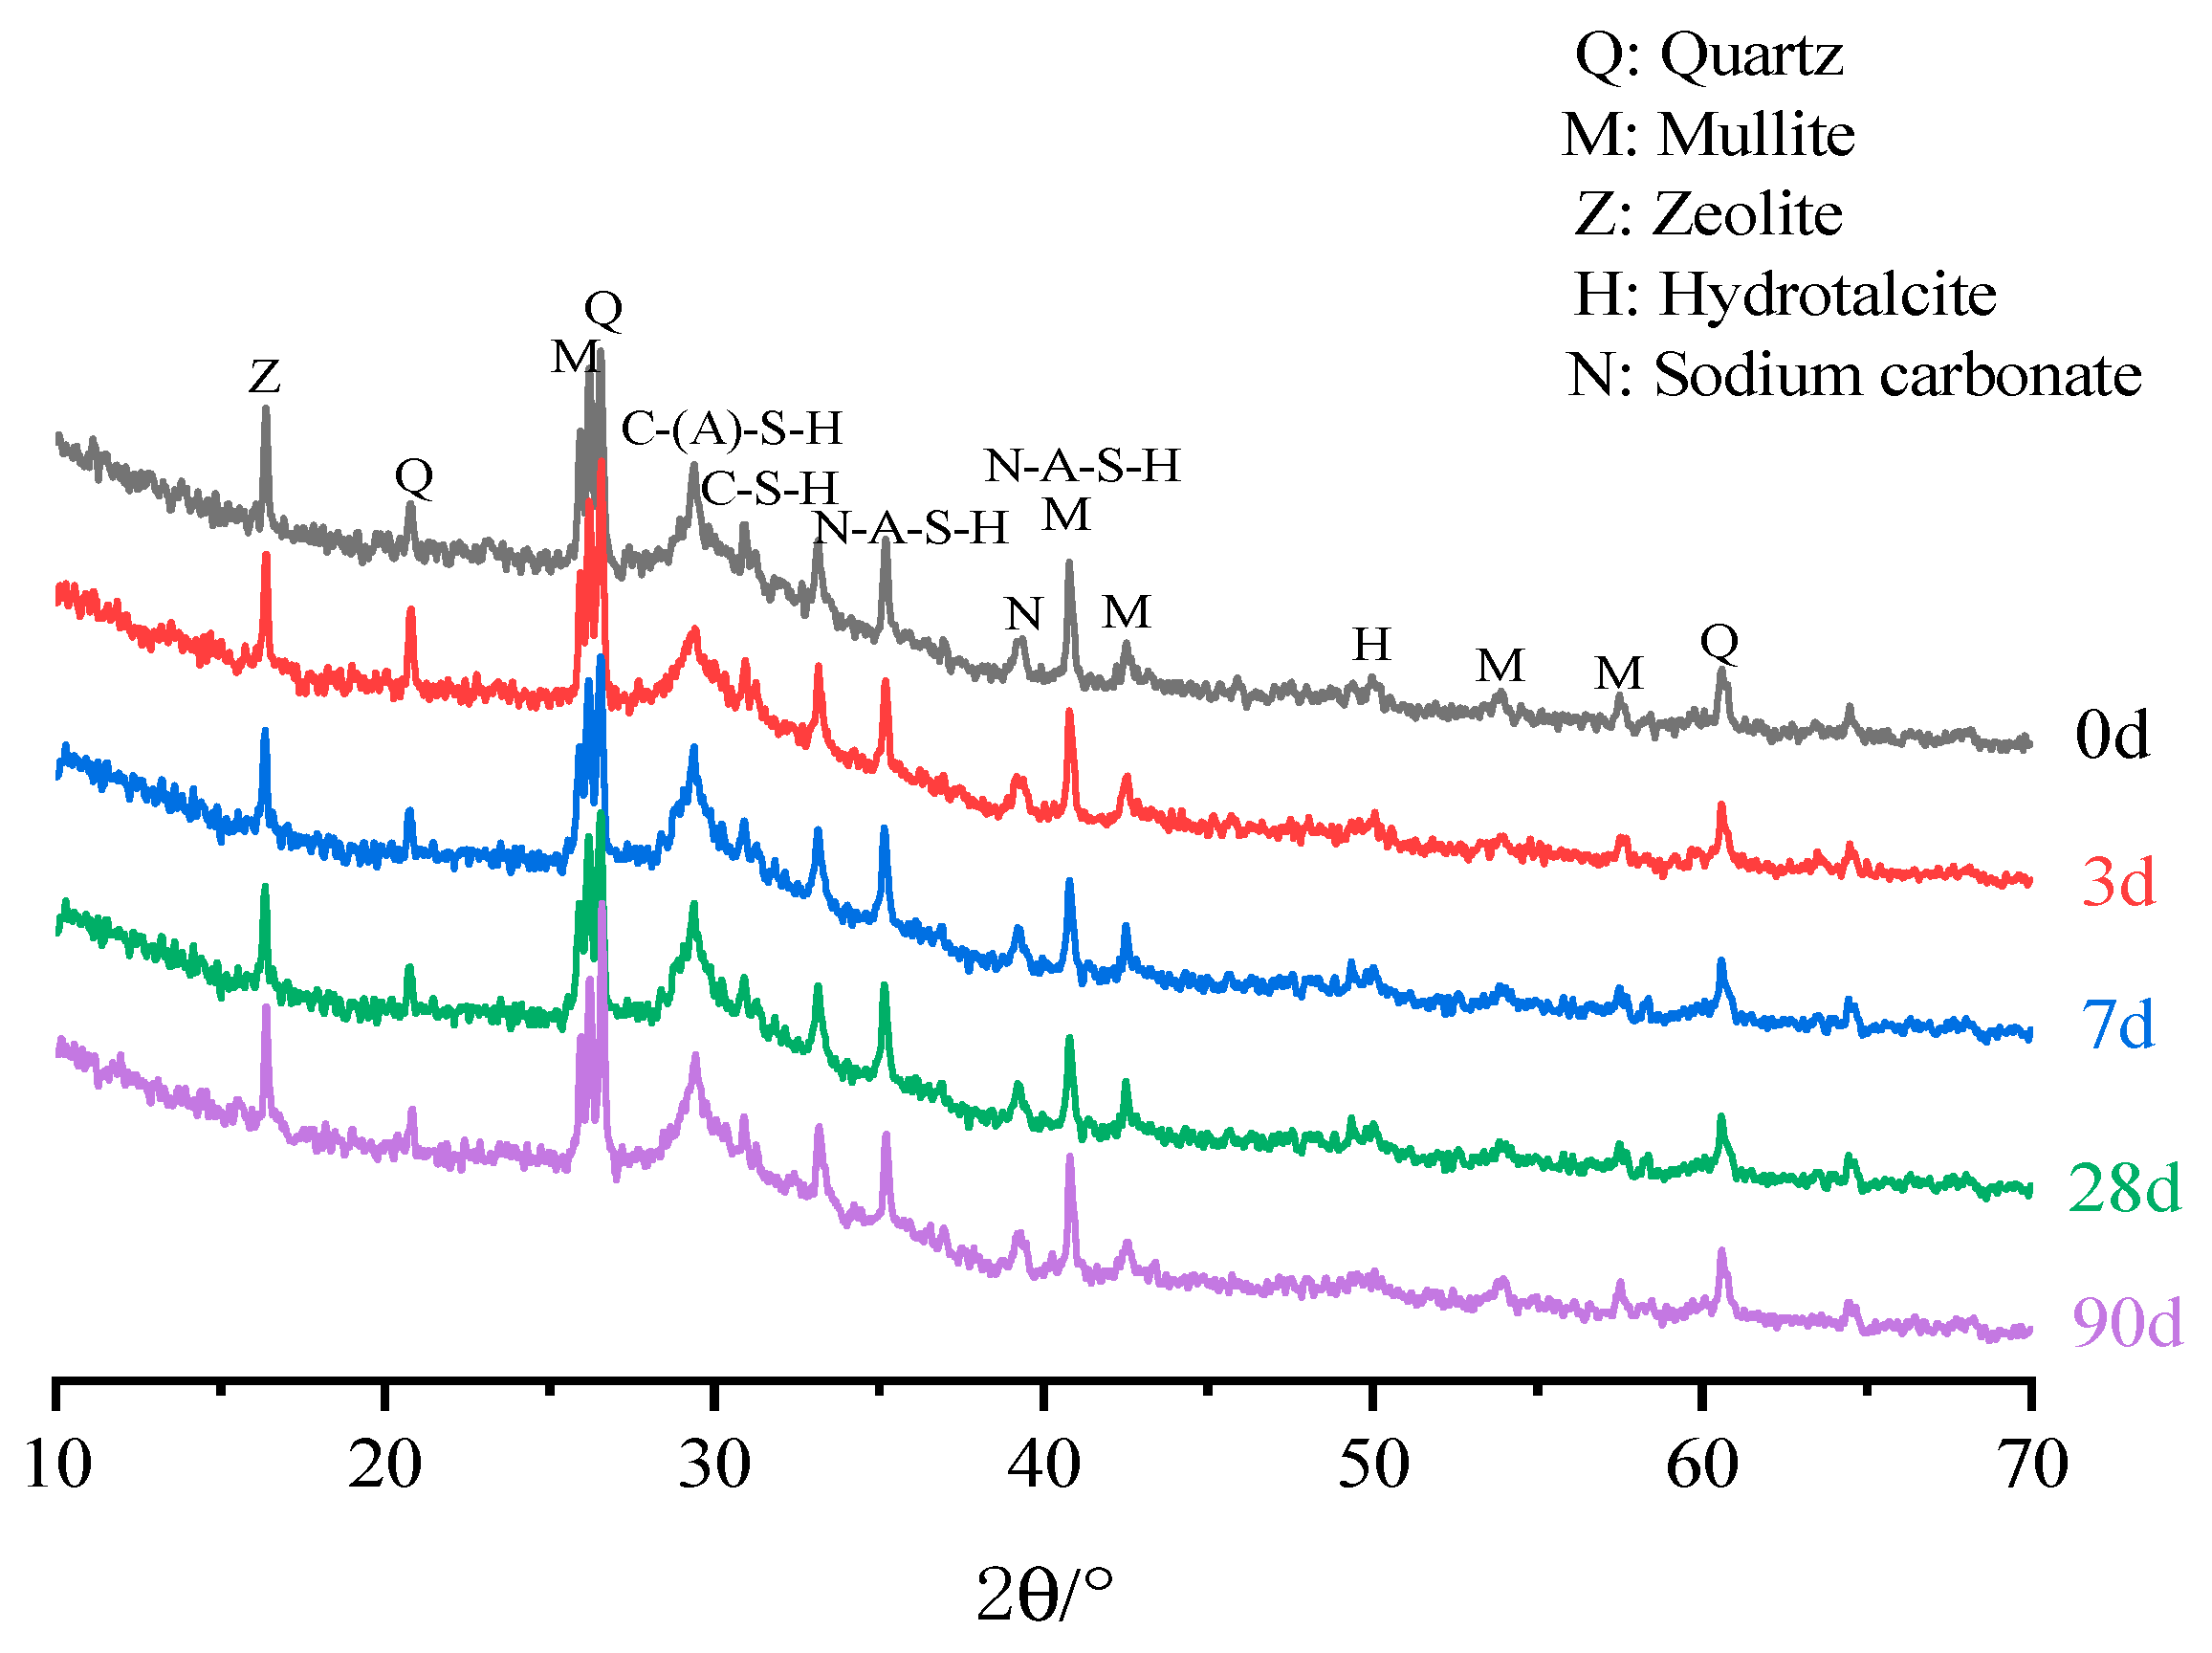
Figure 12 shows XRD patterns of the S50-6 sample, with identified mineral phases including quartz, mullite, zeolite, hydrotalcite, and sodium carbonate [33]. The changes in the diffraction peak intensities of quartz and zeolite are the most significant, showing a decreasing trend with the prolongation of sustained exposure at 60 °C, directly reflecting the continuous promotion of the elevated temperature environment on the internal hydration reactions of the sample. This phenomenon indicates that even under low-water or water-free conditions, the system can still consume crystalline phase minerals through the polymerization reaction of the gel phase, demonstrating the material’s sustained reactive activity in special environments. A broadened characteristic diffraction peak of C-(A)-S-H gel is observed at 2θ = 29.5°, and its intensity significantly increases with the prolongation of elevated temperature duration. This feature serves as direct evidence of the continuous hydration reaction, indicating that the degree of polymerization in the cementitious system deepens over time under elevated temperature conditions, leading to a gradual accumulation of the gel phase content. By contrast, the XRD diffraction characteristics of the N-A-S-H gel phase did not exhibit significant differences under different durations, indicating that the gel phase has good structural stability in a 60 °C environment, with no significant changes in its phase composition or crystalline state despite prolonged elevated temperature exposure. Through XRD testing, the evolution of mineral phases and the characteristics of some gel crystalline phases within the alkali-activated system under sustained 60 °C exposure are clearly revealed, which is of great significance for evaluating the stability of the microstructure.

3.5. MIP Analysis

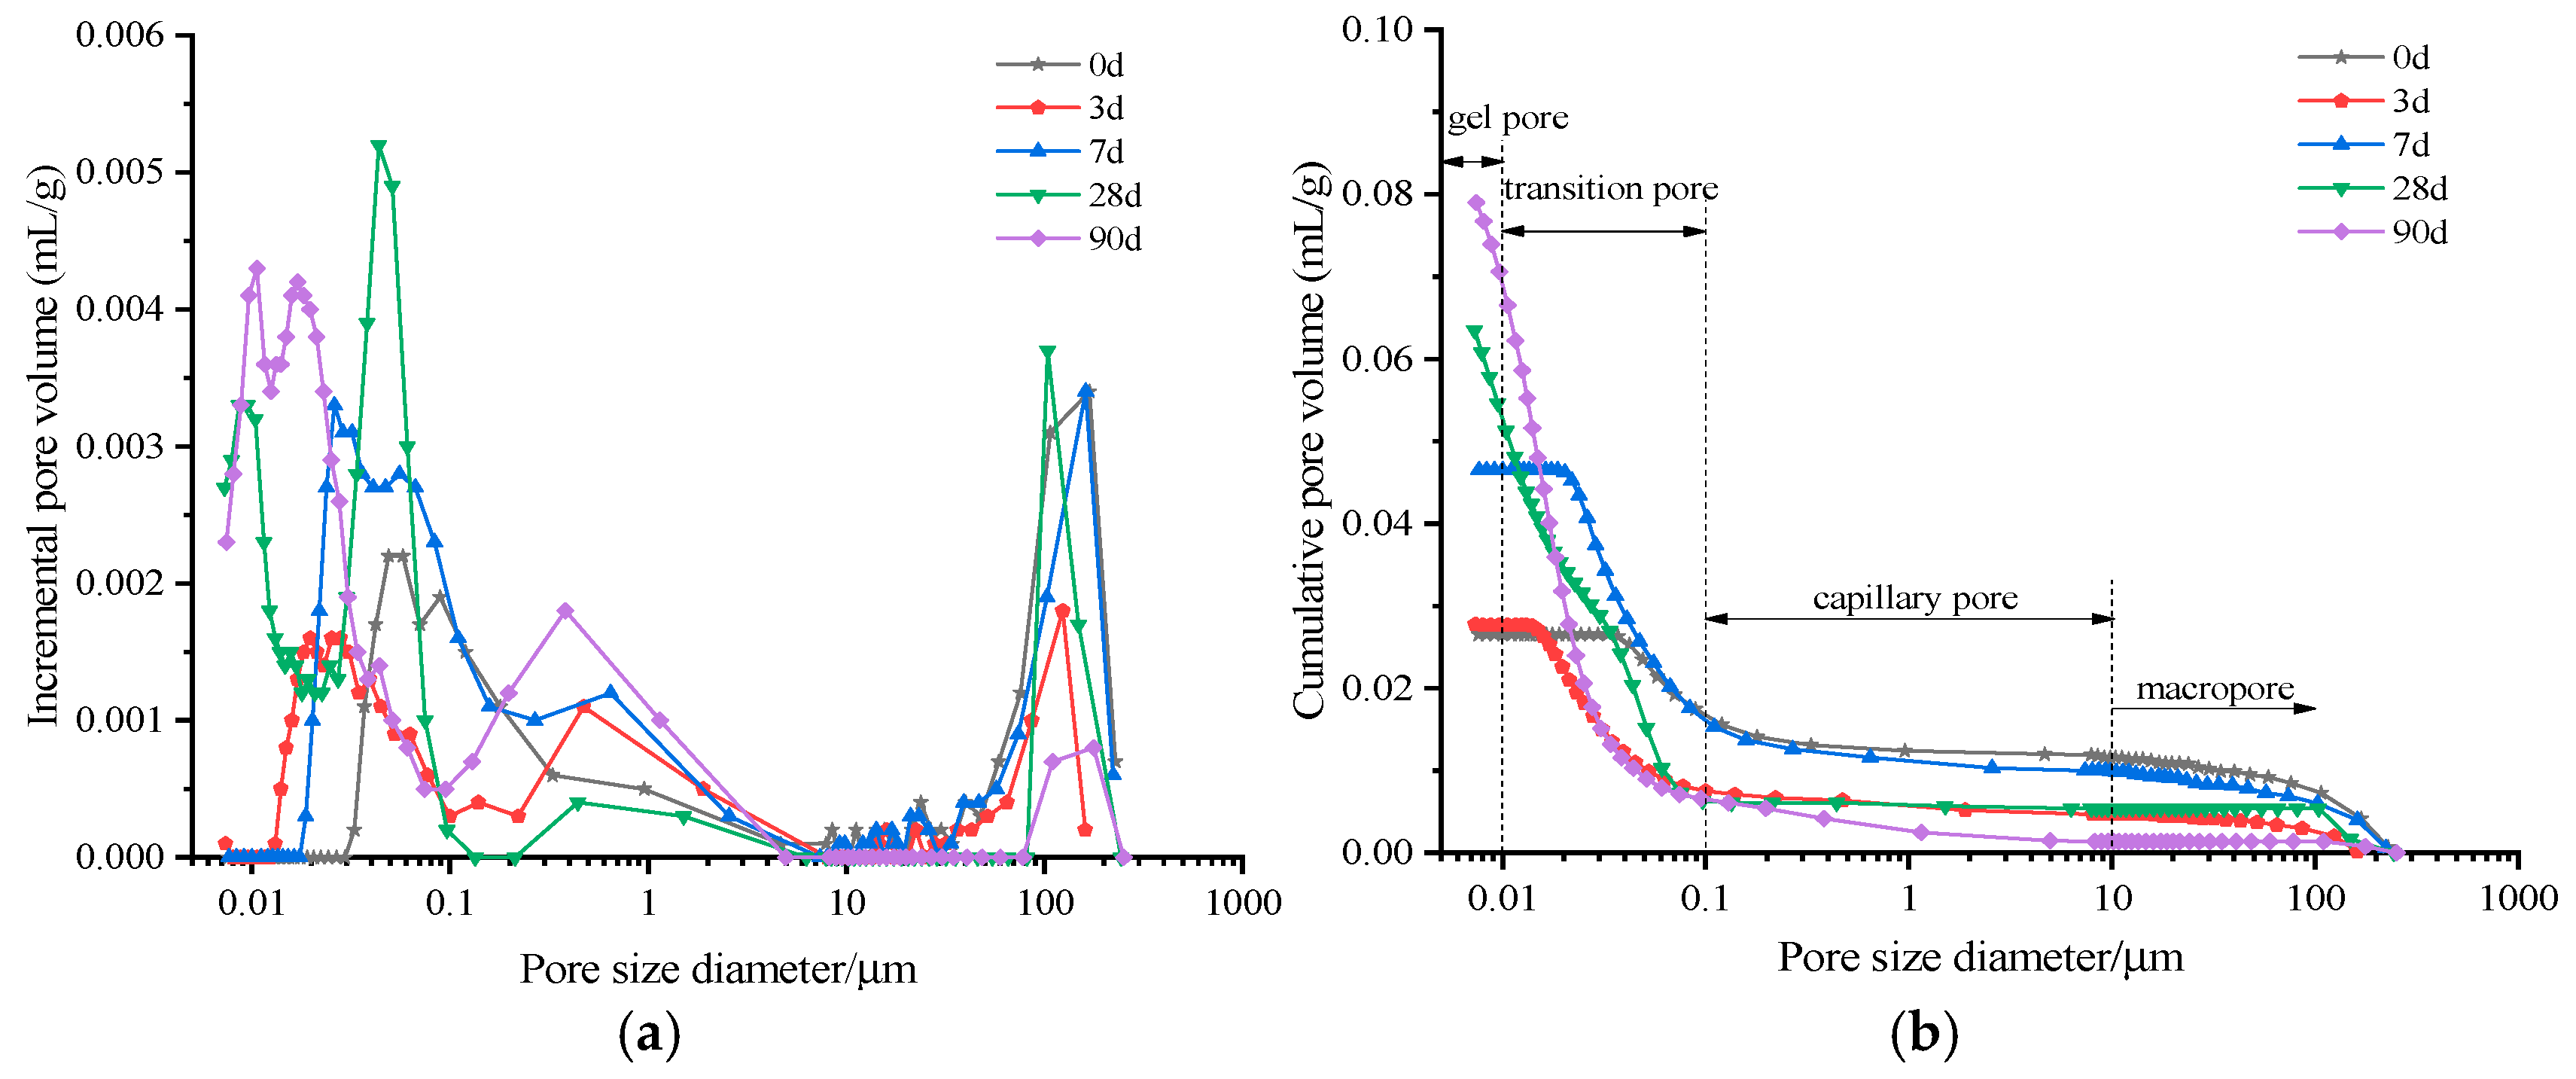
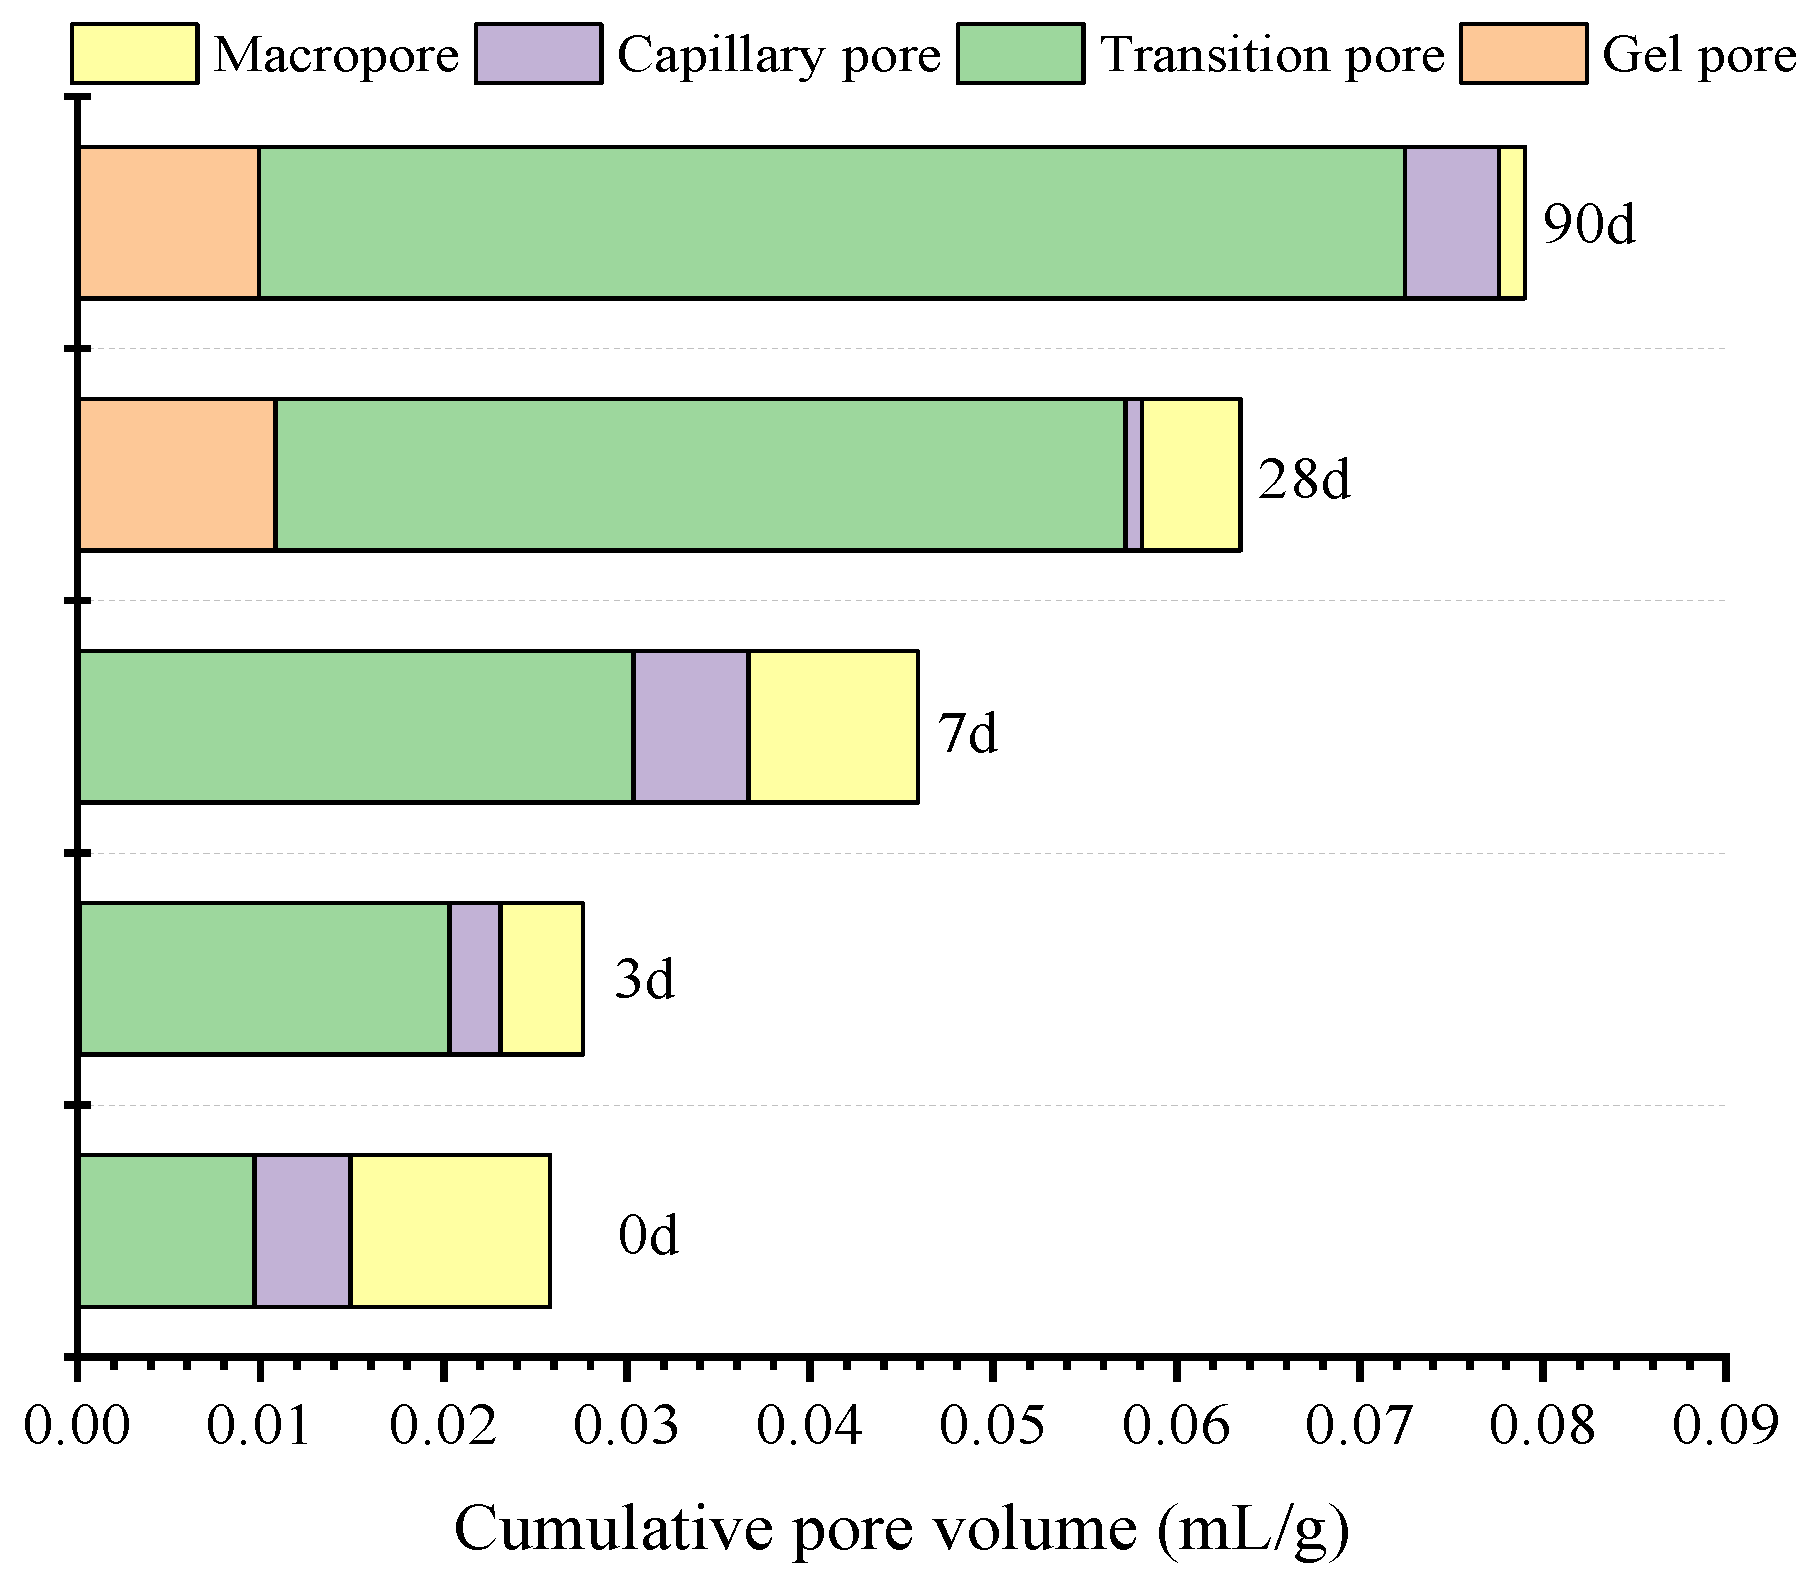
The pore structure can be divided into gel pores (0.5–10 nm), transition pores (10–100 nm), capillary pores (10 nm–10 μm), and macropores (>10 μm) according to pore size and formation mechanism [34,35,36]. Figure 13 shows the pore size distribution of S50-6 samples with different durations at 60 °C, and Figure 13a,b show the incremental and cumulative pore volumes. Figure 14 shows the pore volume distribution across different pore sizes obtained from MIP testing. With the increase in the duration at 60 °C, the total pore volume of EGC samples increases; the cumulative pore volumes after 3 d, 7 d, 28 d, and 90 d of exposure are 1.07, 1.78, 2.46, and 3.06 times that of the standard-cured 28 d sample, respectively. The largest increase in volume occurs in transition pores, while the volume fractions of capillary pores and macropores decrease. When subjected to sustained elevated temperature for 28 d and 90 d, the volume proportion of gel pores exceeds 12%, indicating that sustained elevated temperature promotes the formation of a large number of gel pores in the system while inhibiting the development of large-diameter pores, ultimately achieving a refinement effect on the pore size distribution. The sustained elevated temperature accelerates the polymerization reaction of C-(A)-S-H gel. The intensive formation of the gel phase fills the early-formed capillary pores while generating a large number of nanoscale gel pores, leading to a transition of the pore structure from “macropore-dominated” to “micropore-dominated”. The increase in gel pores reflects the enhancement in the degree of densification of the EGC system, which corresponds to the significant enhancement in peak stress under impact loading at the microstructural mechanism level.

3.6. SEM Analysis

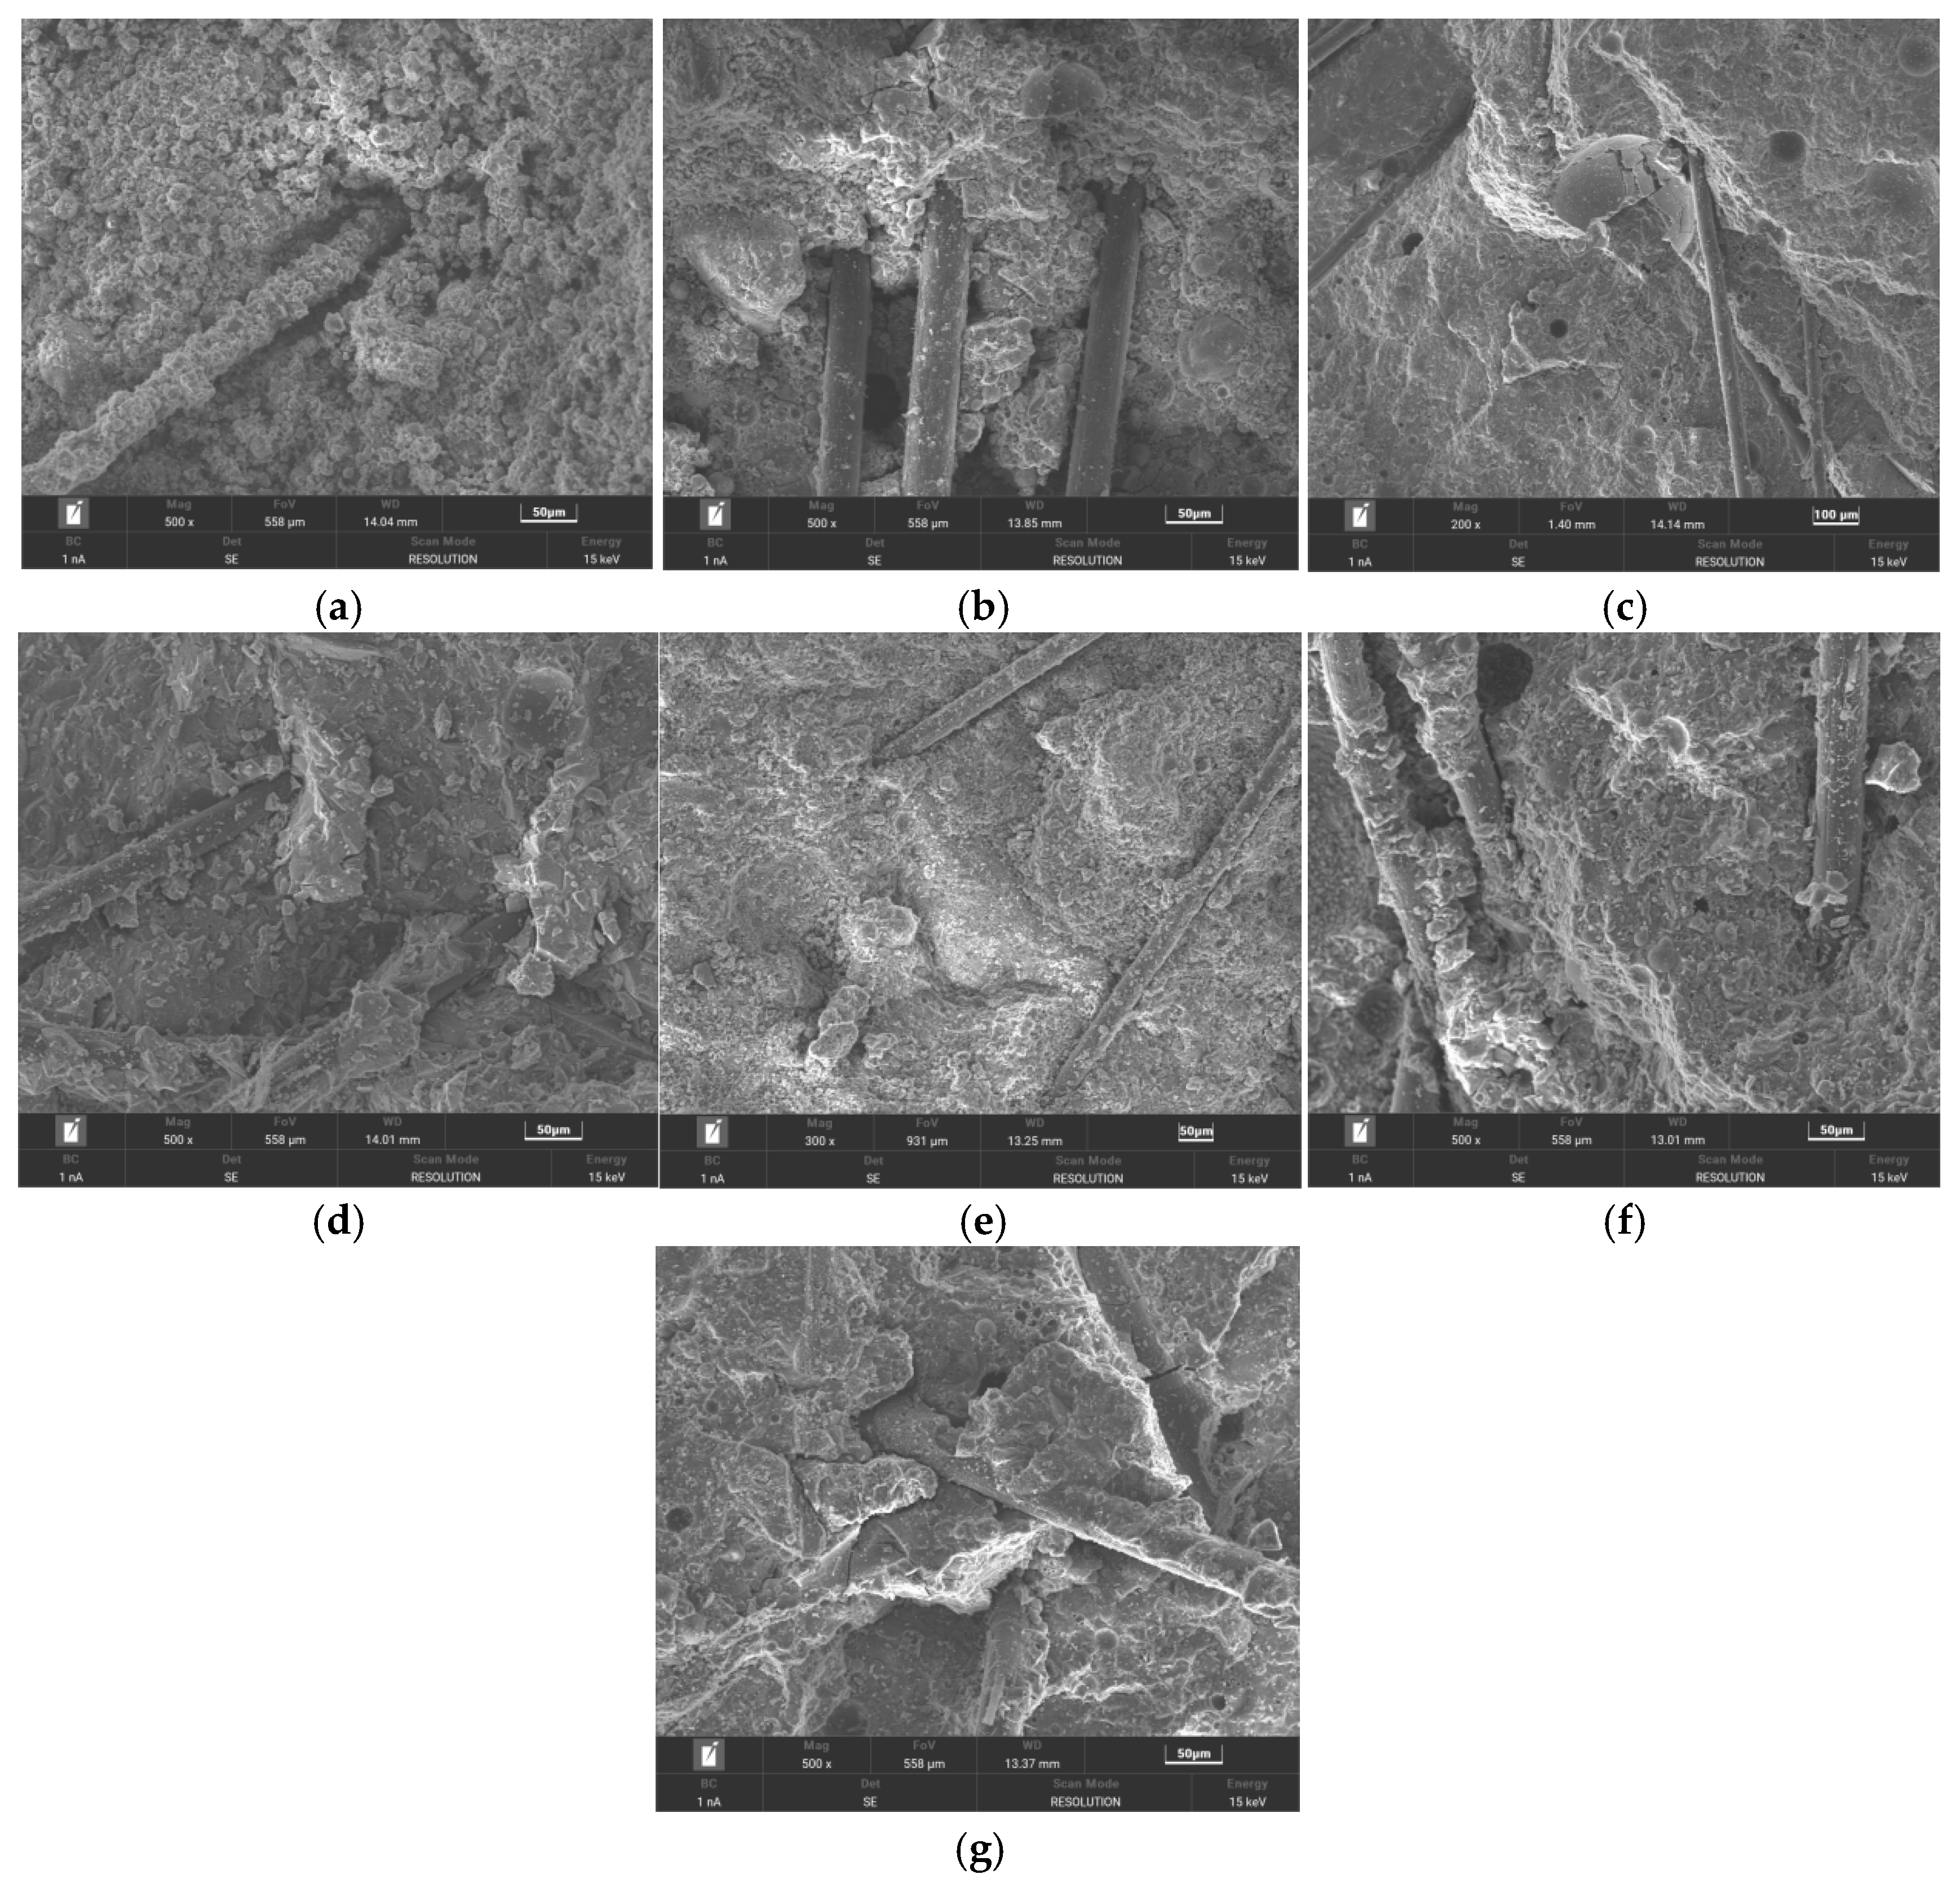
Figure 15 shows SEM photos of the EGC sample with a duration of 90 d at 60 °C; spherical/spindle-shaped C-S-H gels can be observed [37]; foliated and platy C-A-S-H gels are also observed [38]. Spherical fly ash particles are significantly present in the S0-6 and S25-6 samples; they are bound together by cemented materials and primarily serve a physical filling role. In the S50-6 sample, the surface of fly ash particles is significantly roughened, forming a continuous cementitious interface with the C-(A)-S-H gel generated by slag hydration; in the S100-6 sample, small amounts of unreacted slag debris are observed on the surface, with increased structural densification. The surfaces of exposed PVA fibers in the sample preparation process are all coated with hydration products, indicating a strong bridging force between the fibers and the gel phase. However, the densification of the bonding interface varies with the mix proportion: in the S0-6 and S25-6 samples, the bonding between fibers and the matrix is relatively loose, whereas in the S50-6 and S100-6 samples, the fibers are tightly wrapped by hydration products, with a uniform and dense interfacial transition zone that facilitates load transfer. Microcracks are observed at the fiber–matrix bonding interface in the S50-8 sample, representing a critical factor contributing to its lower compressive strength compared to S50-4 and S50-6.

4. Evolution Mechanism of EGC System Performance Under Sustained Action at 60 °C

Based on macroscopic mechanical properties and microstructural tests, the performance evolution of EGC materials under long-term exposure at 60 °C exhibits differences, which originate from the coupled effects of the alkali-activated matrix hydration, pore structure densification, and fiber–matrix synergistic interactions. The bridging effect of PVA fibers causes the strength of the EGC system to be significantly higher than that of the alkali-activated fly ash–slag paste system [39,40]. The strength of the S0-6 sample doubles after exposure at 60 °C, and SEM observation shows that the fiber surface is coated with a large amount of hydration products, confirming the strong interfacial bonding between the fibers and the matrix. However, sustained elevated temperature leads to performance degradation of the fiber–matrix interfacial transition zone, manifested as the disappearance of multiple cracking characteristics and an increase in crack width during tensile testing, indicating that the crack resistance efficiency of the fibers decreases with duration increase. Notably, when the slag content is excessively high (100%) or the Na2O concentration is too high (8%), the compressive strength exhibits a declining trend, which is associated with increased brittleness resulting from matrix microcracks and excessive gelation [41]. In tensile testing, standard-cured samples exhibit multi-peak strain-hardening curves corresponding to multiple crack propagation patterns, while elevated-temperature-exposed samples show smoother curves with increased crack widths. This indicates that the fiber bridging efficiency changes with the enhancement of interfacial bonding; though tighter bonding improves load transfer capacity, it may promote rapid single-crack propagation instead. Under impact loading, EGC exhibits a significant strain rate strengthening effect, with the peak stress of the S50-6 sample reaching 2–3 times that of the standard-cured sample. This is associated with two key mechanisms: first, the bridging effect of PVA fibers effectively dissipates energy during dynamic loading, inhibiting the penetration of main cracks; second, gel phase polymerization promoted by high temperature and pore refinement enhances the matrix stiffness, causing the stress–strain curve to exhibit a distinct elastoplastic strengthening stage. DIC analysis captures the cross-scale characteristics of crack evolution: EGC samples with low slag content exhibit multidirectional crack propagation, while those with high slag content show stress concentration in 1–2 main cracks, reflecting the constraining effect of increased material strength on crack paths.
Sustained exposure at 60 °C accelerates the reaction kinetics of the alkali-activated system, manifested as a decrease in the intensity of quartz and zeolite diffraction peaks with prolonged exposure time, while the broadened diffraction peak of C-(A)-S-H gel gradually enhances. This phenomenon indicates that elevated temperature promotes the polymerization reaction of the amorphous gel phase, consuming some crystalline phase minerals and thereby optimizing the cementation properties of the matrix. When the slag content is 50% (S50-6 sample), the surfaces of fly ash particles are roughened and form a continuous interface with C-(A)-S-H gel, further enhancing the compactness of the matrix. Additionally, MIP tests show that after sustained exposure at 60 °C, the volume of transition pores increases significantly while the proportions of capillary and macropores decrease, indicating that the intensive formation of gel phase fills large-diameter pores and achieves refinement of the pore size distribution. This optimization of the pore structure is directly correlated with the increase in compressive strength under impact loading, demonstrating that elevated temperature environments significantly improve the material’s dynamic mechanical properties by promoting gelation reactions and pore refinement.
In summary, a mix proportion design with a fly ash–slag mass ratio of 1:1 and a Na2O concentration of 4–6% not only ensures the continuous formation of the gel phase and stability of interfacial bonding but also avoids structural defects caused by excessive alkalinity or single mineral content, providing an optimized pathway for the engineering application of the material in long-term thermal environments. The integrity of the fiber–matrix interface, the degree of gel phase polymerization, and the refinement of pore size distribution in the microstructure collectively constitute the key controlling factors for the performance evolution of EGCs.

5. Conclusions

Focusing on the safe use of EGCs in sustained elevated temperature service environments, this study investigates the evolution characteristics of an EGC’s static/impact load compressive strength and strain-hardening capacity after sustained exposure at 60 °C and deeply reveals the evolution mechanism of sustained thermal environments on EGC performance. The specific conclusions are as follows:
(1)
Sustained thermal exposure at 60 °C enhances EGC strength; however, long-term stability is optimal with a fly ash–slag mass ratio of 1:1 and moderate alkalinity (Na2O concentration of 4–6%). This recommended formulation ensures robust performance by fostering a stable, dense microstructured matrix, crucial for applications like geothermal well casings.
(2)
EGC samples exhibit excellent strain-hardening characteristics. After sustained elevated temperature, the tensile strain-hardening curve of EGC tends to become smoother, with a reduction in the number of cracks and an increase in crack width. The alteration in fiber–matrix interfacial bonding properties weakens the capacity for multiple crack propagation.
(3)
The impact load compressive strength of EGC after sustained elevated temperature reaches 2–3 times that of standard curing, where the bridging effect of PVA fibers and matrix densification significantly improves the energy dissipation capacity.
(4)
Sustained exposure to 60 °C promotes the formation of C-(A)-S-H gel and consumes quartz and zeolite phases. While increasing the porosity of the EGC system, sustained elevated temperature refines the pore distribution; the volumes of gel pores and transition pores increase significantly, leading to a shift in the pore structure from “macropore-dominated” to “micropore-dominated”. SEM observations show that a fly ash–slag ratio of 1:1 results in a dense fiber–matrix interface with high load transfer efficiency; however, excessive alkalinity induces microcracks and reduces mechanical properties.
(5)
Outlook: The thermal stability of an EGC system is related to the mix proportion. Tensile tests show that sustained thermal environments weaken the fiber’s crack resistance efficiency, but through mix proportion optimization (including multi-source reactive precursors and appropriate alkalinity), a “gel strengthening–fiber toughening–pore regulation” multiscale action mechanism is formed, collectively determining the macroscopic mechanical behavior of EGCs. It is important to note that this study focused on a dry thermal environment. Real-world applications in tunnels or industrial settings often involve humidity and thermal cycles, which could lead to more complex performance evolution mechanisms. Future work should investigate EGC performance under coupled thermal–hydraulic–mechanical cycling conditions to better predict long-term durability. This study provides experimental guidance and a theoretical basis for the practical application of EGC systems in thermal environments, demonstrating significant scientific and engineering value.

Author Contributions

S.W.: Writing—Original Draft. W.W.: Data Curation. H.L.: Data Curation. A.H.: Data Curation. H.M.: Methodology, Writing—Review and Editing. All authors have read and agreed to the published version of the manuscript.

Funding

This work was funded by the Natural Science Foundation of Hebei Province (E2025201002).

Data Availability Statement

The original contributions presented in this study are included in the article. Further inquiries can be directed to the corresponding author.

Conflicts of Interest

Author Shuo Wang, Wei Wang, Haoxing Liu, and Ao Huang were employed by the company China Railway Tiegong City Construction Co. Ltd. The remaining authors declare that the research was conducted in the absence of any commercial or financial relationships that could be construed as a potential conflict of interest.

References

  1. Wang, C.; Zhao, X.; Zhang, X.Y.; Zhao, Y.; Wang, Y.T.; Zhao, J.J. Effects of alkali equivalent and polypropylene fibres on performance of alkali-activated municipal waste incineration bottom ash-slag mortar. J. Build. Eng. 2024, 84, 108496. [Google Scholar] [CrossRef]
  2. Feng, H.; Xin, X.; Guo, A.F.; Yu, Z.Y.; Shao, Q.; Sheikh, M.N.; Sun, Z.H. Effect of mix proportion parameters on chloride erosion resistance of fly ash/slag-based engineered geopolymer composites. J. Clean. Prod. 2024, 438, 140785. [Google Scholar] [CrossRef]
  3. He, S.; Huang, X.J.; Yu, P.; Zhou, Y.T.; Luo, Y.J. Mechanical properties and durability of alkali-activated fly ash-municipal sludge concrete. Constr. Build. Mater. 2024, 419, 135515. [Google Scholar] [CrossRef]
  4. Ma, H.Q.; Yi, C.; Wu, C. Review and outlook on durability of engineered cementitious composite (ECC). Constr. Build. Mater. 2021, 287, 122719. [Google Scholar] [CrossRef]
  5. Hou, M.J.; Zhang, D. Crack width control and mechanical properties of low carbon engineered cementitious composites (ECC). Constr. Build. Mater. 2022, 348, 128692. [Google Scholar] [CrossRef]
  6. Hu, Z.H.; Elchalakani, M.; Yehia, S.; Ran, H.Y.; Sadakkathulla, M.A.; Guo, X. Engineered cementitious composite (ECC) strengthening of reinforced concrete structures: A state-of-the-art review. J. Build. Eng. 2024, 86, 108941. [Google Scholar] [CrossRef]
  7. Lyu, B.C.; Ding, C.; Guo, L.P.; Chen, B.; Wang, A.G. Basic performance and potential research problems of strain hardening geopolymer composites: A critical review. Constr. Build. Mater. 2021, 287, 123030. [Google Scholar] [CrossRef]
  8. Lao, J.C.; Huang, B.T.; Xu, L.Y.; Khan, M.; Fang, Y.; Dai, J.G. Seawater sea-sand engineered geopolymer composites (EGC) with high strength and high ductility. Cem. Concr. Compos. 2023, 138, 104998. [Google Scholar] [CrossRef]
  9. Zhong, W.L.; Zhang, Y.H.; Fan, L.F. High-ductile engineered geopolymer composites (EGC) prepared by calcined natural clay. J. Build. Eng. 2023, 63, 105456. [Google Scholar] [CrossRef]
  10. Artyk, Z.; Kuan, Y.; Zhang, D.C.; Shon, C.S.; Ogwumeh, C.M.; Kim, J. Development of engineered geopolymer composites containing low-activity fly ashes and ground granulated blast furnace slags with hybrid fibers. Constr. Build. Mater. 2024, 422, 135760. [Google Scholar] [CrossRef]
  11. Elmesalami, N.; Celik, K. A critical review of engineered geopolymer composite: A low-carbon ultra-high-performance concrete. Constr. Build. Mater. 2022, 346, 128491. [Google Scholar]
  12. Ling, Y.F.; Wang, K.J.; Li, W.G.; Shi, G.Y.; Lu, P. Effect of slag on the mechanical properties and bond strength of fly ash-based engineered geopolymer composites. Compos. Part B Eng. 2019, 164, 747–757. [Google Scholar] [CrossRef]
  13. Han, J.S.; Cai, J.M.; Lin, Y.Z.; Sun, Y.Q.; Pan, J.L. Impact resisitance of engineered geopolymer composite (EGC) in cold temperatures. Constr. Build. Mater. 2022, 343, 128150. [Google Scholar] [CrossRef]
  14. Zhong, H.; Zhang, M.Z. Engineered geopolymer composites: A state-of-the-art review. Cem. Concr. Compos. 2023, 135, 104850. [Google Scholar]
  15. Yaswanth, K.K.; Revathy, J.; Gajalakshmi, P. Influence of copper slag on mechanical durability and microstructural properties of GGBS and RHA blended strain hardening geopolymer composites. Constr. Build. Mater. 2022, 342, 128042. [Google Scholar] [CrossRef]
  16. Briffaut, M.; Benboudjema, F.; Torrenti, J.M.; Nahas, G. A thermal active restrained shrinkage ring test to study the early age concrete behaviour of massive structures. Cem. Concr. Res. 2011, 41, 56–63. [Google Scholar] [CrossRef]
  17. Ma, H.Q.; Fu, C.C.; Dai, E.T.; Huang, K.; Zhang, S.C.; Feng, J.J. Research on the effect of 60 °C thermal cycling on the properties of alkali-activated fly ash-slag materials: A new perspective. Constr. Build. Mater. 2024, 416, 135192. [Google Scholar] [CrossRef]
  18. Chan, C.L.; Zhang, M.Z. Behavior of strain hardening geopolymer composites at elevated temperatures. Cem. Concr. Compos. 2022, 132, 104634. [Google Scholar] [CrossRef]
  19. Zhang, Z.G.; Liu, J.C.; Li, J.X.; Qin, F.J.; Di, J. Micromechanics-based analysis of PVA-ECC after thermal exposure. Arch. Civ. Mech. Eng. 2023, 23, 213. [Google Scholar] [CrossRef]
  20. Cai, J.M.; Pan, J.L.; Han, J.S.; Lin, Y.Z.; Sheng, Z.L. Impact behaviours of engineered geopolymer composite exposed to elevated temperatures. Constr. Build. Mater. 2021, 312, 125421. [Google Scholar] [CrossRef]
  21. Trindade, A.C.C.; Liebscher, M.; Curosu, I.; Silva, F.D.A.; Mechtcherine, V. Influence of elevated temperatures on the residual and quasi in-situ flexural strength of strain-hardening geopolymer composites (EGC) reinforced with PVA and PE fibers. Constr. Build. Mater. 2022, 314, 125649. [Google Scholar]
  22. Humur, G.; Cevik, A. Mechanical characterization of lightweight engineered geopolymer composites exposed to elevated temperatures. Ceram. Int. 2022, 48, 13634–13650. [Google Scholar] [CrossRef]
  23. Li, F.P.; Zhou, Z.Z.; Lu, Y.Y.; Li, S. Effect of PVA fibers grafted with MWCNTs on the shrinkage behaviors of engineered geopolymer composite (EGC). Constr. Build. Mater. 2024, 449, 138508. [Google Scholar] [CrossRef]
  24. Cheng, Z.J.; An, J.P.; Li, F.P.; Lu, Y.Y.; Li, S. Investigation of dynamic compression properties of lightweight engineered geopolymer composites containing different ceramsites (LW-EGC). Constr. Build. Mater. 2024, 425, 136001. [Google Scholar]
  25. Ma, H.Q.; Fu, H.; Cao, C.Y.U.; Xu, Z.S.; Niu, X.Y. Effect of 60 °C sustained temperature conditions on the mechanical properties and microstructure of alkali-activated fly ash-slag pastes and mortars. J. Build. Eng. 2024, 95, 110346. [Google Scholar]
  26. Li, Y.Z.; Li, J.X.; Yang, E.H.; Guan, X.C. Multiple cracking and strain-hardening criteria of Engineered Cementitious Composites (ECC) with river sand. Cem. Concr. Res. 2024, 180, 107511. [Google Scholar] [CrossRef]
  27. Wang, F.; Zhai, J.B.; Ding, Y.; Nishiwaki, T.; Yu, J.T.; Li, V.C.; Yu, K.Q. Design-driven approach for engineered geopolymer composite with recorded low fiber content. Compos. Part B Eng. 2024, 287, 111834. [Google Scholar] [CrossRef]
  28. Ren, L.; Yu, X.M.; Guo, Z.Z.; Xiao, L.F. Numerical investigation of the dynamic increase factor of ultra-high performance concrete based on SHPB technology. Constr. Build. Mater. 2022, 325, 126756. [Google Scholar] [CrossRef]
  29. Kim, K.M.; Lee, S.H.; Cho, J.Y. Influence of friction on the dynamic increase factor of concrete compressive strength in a split Hopkinson pressure bar test. Cem. Concr. Compos. 2022, 129, 104517. [Google Scholar] [CrossRef]
  30. Zhang, M.; Wu, H.J.; Li, Q.M.; Huang, F.L. Further investigation on the dynamic compressive strength enhancement of concrete-like materials based on split Hopkinson pressure bar tests. Part I: Experiments. Int. J. Impact Eng. 2009, 36, 1327–1334. [Google Scholar] [CrossRef]
  31. Huang, R.Y.; Guan, Z.H.; Qin, J.; Wen, Y.B.; Lai, Z.C. Strain rate effect of concrete based on split Hopkinson pressure bar (SHPB) test. J. Build. Eng. 2024, 86, 108856. [Google Scholar] [CrossRef]
  32. Fang, X.F. A one-dimensional stress wave model for analytical design and optimization of oscillation-free force measurement in high-speed tensile test specimens. Int. J. Impact Eng. 2021, 149, 103770. [Google Scholar] [CrossRef]
  33. Feng, H.; Bilal, I.; Sun, Z.H.; Guo, A.F.; Yu, Z.Y.; Du, Y.X.; Su, Y.F.; Zheng, Y.L. Mechanical and shrinkage properties of cellulose nanocrystal modified alkali-activated fly ash/slag pastes. Cem. Concr. Compos. 2024, 154, 105753. [Google Scholar] [CrossRef]
  34. He, R.; Nantung, T.; Lu, N. Unraveling microstructural evolution in air-entrained mortar and paste: Insights from MIP and micro-CT tomography amid cyclic freezing-thawing damage. J. Build. Eng. 2024, 94, 109922. [Google Scholar] [CrossRef]
  35. Song, Y.; Zhou, J.W.; Bian, Z.N.; Dai, G.Z. Pore structure characterization of hardened cement paste by multiple methods. Adv. Mater. Sci. Eng. 2019, 3726953. [Google Scholar] [CrossRef]
  36. Xu, W.R.; Tang, Z.; Xie, Y.J.; Long, G.C.; Kai, M.F.; Zhang, Z.R.; Bu, M.X.; Zaland, S. Understanding the impact of synthesis parameters on the pore structure properties of fly ash-based geopolymers. Constr. Build. Mater. 2024, 411, 134640. [Google Scholar] [CrossRef]
  37. Zhang, L.N.; Yamauchi, K.; Li, Z.J.; Zhang, X.X.; Ma, H.Y.; Ge, S.G. Novel understanding of calcium silicate hydrate from dilute hydration. Cem. Concr. Res. 2017, 99, 95–105. [Google Scholar] [CrossRef]
  38. Ramadan, M.; Kohail, M.; Abadel, A.A.; Alharbi, Y.A.; Soilman, A.M.; Mohsen, A. Exploration of mechanical performance, porous structure, and self-cleaning behavior for hydrothermally cured sustainable cementitious composites containing de-aluminated metakaolin waste and TiO2 nanoparticles. J. Mater. Res. Technol. 2023, 25, 3998–4019. [Google Scholar] [CrossRef]
  39. Tu, W.L.; Fang, G.H.; Dong, B.Q.; Hu, Y.K.; Zhang, M.Z. Behaviour of alkali-activated fly ash-slag paste at elevated temperatures: An experimental study. Cem. Concr. Compos. 2024, 147, 105438. [Google Scholar] [CrossRef]
  40. Gong, J.H.; Ma, Y.W.; Wang, Y.R.; Cao, Y.B.; Fu, J.Y.; Wang, H. Assessment of the performance of alkali-activated slag/fly ash using liquid and solid activators: Early-age properties and efflorescence. J. Sustain. Cem.-Based Mater. 2024, 13, 300–310. [Google Scholar] [CrossRef]
  41. Yu, Z.; Wang, B.M.; Li, T.R.; Wang, W.L. Toughness study of polyacrylamide-modified slag/fly ash-based alkali-activated cementitious materials. Constr. Build. Mater. 2024, 450, 138622. [Google Scholar] [CrossRef]
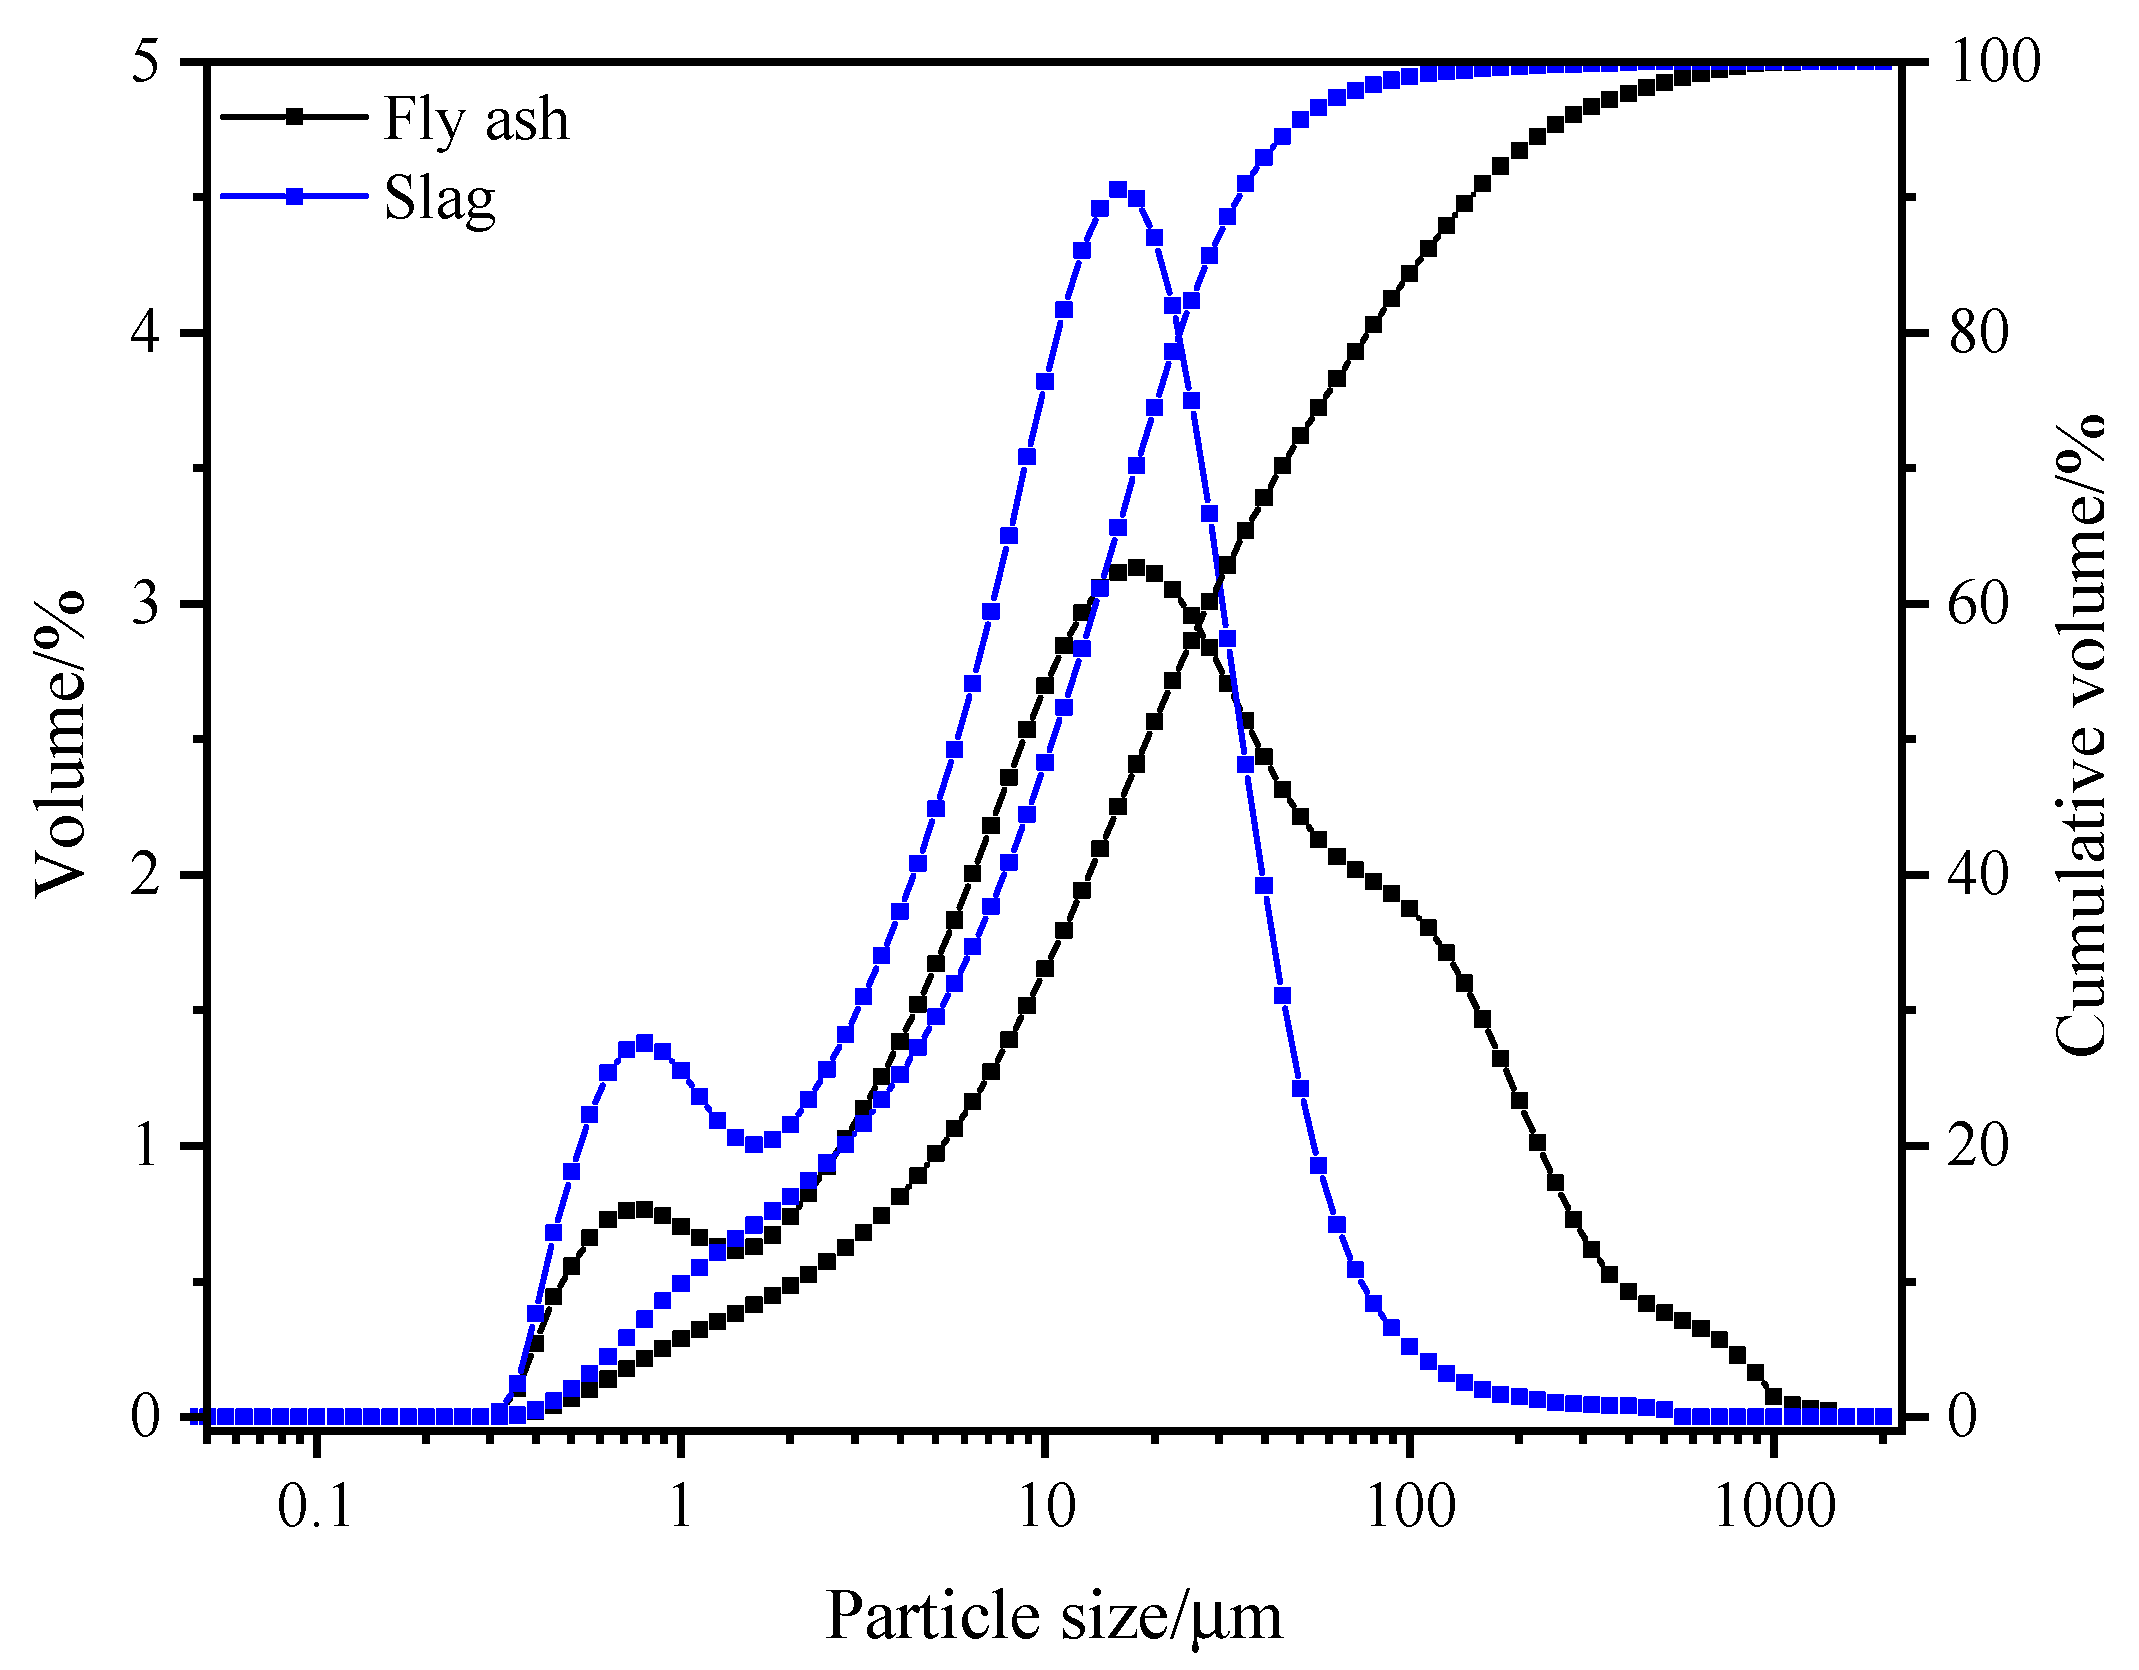
Figure 1. The size distribution of fly ash and slag.
Buildings 15 03792 g001
Figure 2. Photos of the raw materials. (a) Slag; (b) fly ash; (c) silica sand; (d) PVA fibers.
Buildings 15 03792 g002
Figure 3. Experimental testing device. (a) Tensile strength testing device for dog-bone samples; (b) SHPB testing device.
Buildings 15 03792 g003aBuildings 15 03792 g003b
Figure 4. Static compressive strength of EGC samples. (a) Fly ash–slag mass rates; (b) Na2O concentration.
Buildings 15 03792 g004
Figure 5. Tensile stress–strain curve of S50-6 samples.
Buildings 15 03792 g005
Figure 6. Evolution of cracks in dog-bone samples. (a) Standard curing, 28 d; (b) 60 °C, duration 28 d.
Buildings 15 03792 g006
Figure 7. SHPB test waveform diagrams. (a) Empty pole diagram; (b) typical waveform diagram; (c) stress balance verification curve.
Buildings 15 03792 g007
Figure 8. The stress–strain curve of an EGC sample under impact loading. (a) S0-6; (b) S25-6; (c) S50-6; (d) S100-6; (e) S50-2; (f) S50-4; (g) S50-8.
Buildings 15 03792 g008aBuildings 15 03792 g008b
Figure 9. Failure images of the S50-6 sample captured by a high-speed camera after 28 d of sustained exposure at 60 °C.
Buildings 15 03792 g009
Figure 10. Displacement cloud map of EGC samples with different fly ash–slag mass ratios. (a) S0-6; (b) S25-6; (c) S50-6; (d) S100-6.
Buildings 15 03792 g010
Figure 11. Strain contour of S50-6 sample: (a) 100 μs; (b) 200 μs; (c) 300 μs; (d) 400 μs.
Buildings 15 03792 g011
Figure 12. XRD patterns of the S50-6 sample under different durations at 60 °C (0 d represents 28 d of standard curing, T20-28d).
Buildings 15 03792 g012
Figure 13. The pore size distribution of S50-6 samples with different durations at 60 °C. (a) Incremental pore volume; (b) cumulative pore volume.
Buildings 15 03792 g013
Figure 14. Pore structure distribution volume.
Buildings 15 03792 g014
Figure 15. SEM photos of EGC sample with a duration of 90 d at 60 °C. (a) S0-6; (b) S25-6; (c) S50-6; (d) S100-6; (e) S50-2; (f) S50-4; (g) S50-8.
Buildings 15 03792 g015
Table 1. The chemical properties of the fly ash and slag.
OxideFly AshSlag
SiO255.7136.10
Al2O332.7916.32
MgO0.247.16
CaO2.6635.58
Fe2O34.430.23
SO31.71
TiO21.66
K2O1.54
LOI0.972.90
Table 2. The geometric–mechanical properties of PVA fibers.
Fiber TypeDiameter
/μm
Tensile Strength
/GPa
Young’s Modulus
/GPa
Rupture Elongation
/%
Density
g/cm3
PVA401.56416.51.3
Table 3. Specific mix proportion of EGCs.
Sample No.Fly AshSlagNa2O ConcentrationAlkali Activator ModulusLiquid–Solid RatioSilica Sand/Binder RatioPVA
S0-6100%0%6%1.30.30.32 vt%
S25-675%25%6%
S50-60.50.56%
S100-6016%
S50-20.50.52%
S50-40.50.54%
S50-80.50.58%
Table 4. DIF value of EGC samples.
Sample No.Curing ConditionQuasi-Static Strength
fs (MPa)
Dynamic Strength
fd (MPa)
DIF (fd/fs)
S50-6T20-28d78.5145.21.85
S50-6T60-3d85.2176.82.08
S50-6T60-28d95.7224.92.35
S100-6T20-28d88.3161.51.83
S100-6T60-28d82.1165.42.01
S0-6T60-28d64.5138.12.14
Disclaimer/Publisher’s Note: The statements, opinions and data contained in all publications are solely those of the individual author(s) and contributor(s) and not of MDPI and/or the editor(s). MDPI and/or the editor(s) disclaim responsibility for any injury to people or property resulting from any ideas, methods, instructions or products referred to in the content.