Article

Resilient Renewal of Aging Parks in High-Density Cities: Integrating Performance-Based Design and the Environmental Overlay Method in the Wuxi Case

by
Ren Zhou
1,
Zi Yang
2 and
Jia Liu
1,*
1
School of Design, Jiangnan University, Wuxi 214122, China
2
School of Design, The Hong Kong Polytechnic University, Hong Kong, China
*
Author to whom correspondence should be addressed.
Buildings 2025, 15(20), 3783; https://doi.org/10.3390/buildings15203783
Submission received: 19 September 2025 / Revised: 11 October 2025 / Accepted: 14 October 2025 / Published: 20 October 2025
(This article belongs to the Section Architectural Design, Urban Science, and Real Estate)

Abstract

Climate change exacerbates challenges for old urban parks in high-density cores, intensifying urban heat islands and overcrowding hazards and causing limited extreme weather resilience. These parks face climate maladaptation, urban health risks, and reduced adaptive capacity. This study applies performance-based urban design through an “environmental analysis Overlay method,” integrating space syntax, CFD-Phoenics wind simulation, and solar analysis to translate climate adaptation, urban health, and urban resilience dimensions into measurable indicators including ventilation efficiency, crowd dispersion comfort, and flexible space capacity. Using Chengzhong Park in Wuxi as a case study, the method employs a diagnosis–optimization–validation process. Results demonstrate substantial improvements: (1) Climate: Problematic wind areas (>4 m/s or <0.5 m/s (stagnant)) decreased from 30% to 11%, while comfortable wind zones (0.5–1 m/s) increased to over 30%, achieving optimal microclimate conditions 89% of the park; (2) Health: Pedestrian circulation capacity increased by 25%, and activity areas with under 3 h of winter sunlight reduced from 26% to 19%; (3) Resilience: Spatial units consolidated from 155 to 115, with global-local integration improving from R2 = 0.39 to 0.64, significantly enhancing network coherence and adaptive functionality. The findings confirm that this method provides a scientifically rigorous, replicable pathway for climate-adaptive renewal of old urban parks, supporting urban resilience agendas.

1. Introduction

In recent years, rapid urbanization and high-density development have intensified both environmental and social pressures on urban public spaces [1], posing multiple adaptive challenges for parks built in the mid-20th century. On the one hand, holiday crowding often leads to spatial fragmentation, circulation conflicts, and facility overload; in dense urban cores, limited park areas struggle to accommodate the growing demand for public use [2]. On the other hand, surrounding high-rise developments obstruct solar access and ventilation corridors, resulting in stagnant airflow and intensified urban heat islands, thereby undermining ecological buffering capacity and environmental comfort [3]. In some cases, excessive commercialization has eroded ecological functions [4], while traditional single-layout models fail to reconcile diverse needs such as leisure, sports, culture, and commerce [5]. The COVID-19 pandemic further exposed deficiencies in ventilation, spatial flexibility, and equitable access [6].
Historically, parks have served as responses to social transformation since their emergence in the 19th century: London’s Victoria Park (1845) was intended to improve the living conditions of the working class, while New York’s Central Park (1858) provided middle-class citizens with a natural retreat [7,8]. In China, urban green spaces evolved from imperial and private gardens, to public green areas in the Republican era, and later to welfare parks during the socialist construction period [9]. After the Reform and Opening-up, parks began to integrate multifunctionality, as seen in the ecological–activity synthesis of Beijing Olympic Forest Park [10], the vertical greening of Shanghai Jing’an Sculpture Park, and the traffic–landscape integration of Guangzhou Flower City Square [11]. Nevertheless, many mid-century parks in urban cores remain characterized by single-function and coarse-grained layouts, increasingly compressed by commercial expansion, and thus demand systematic renewal.
Existing studies have provided valuable insights into understanding and improving park adaptability, yet they often remain confined to a single dimension: spatial morphology studies emphasize layout and accessibility optimization [12]; environmental simulations focus on thermal comfort and ventilation [13]; sociological perspectives highlight behavioral and equity-related differences [14]. However, these dimensions are rarely integrated, rendering them insufficient to address the intertwined challenges of space, ecology, and function in aging urban parks [15]. In other words, there is still a clear research gap in developing a multidimensional assessment framework that can comprehensively coordinate spatial form, ecological resilience, and functional diversity.
To address this gap, this study adopts the concept of Performance-Based Urban Design [16], emphasizing quantifiable environmental and social performance as the basis for design and decision-making [17]. Within this framework, an “Environmental Analysis Overlay Method” is proposed, which evaluates three performance dimensions—Climatic Performance [18], Health Performance [19], and Resilience Performance [20]—through the integration of multi-source data (space syntax, mobility big data, CFD and solar simulations [21]). A case study of Wuxi is conducted to test the effectiveness of this approach in enhancing environmental performance and multifunctionality under high-density urban conditions, thereby offering methodological contributions and practical implications for the sustainable renewal of aging urban parks [15].

2. Literature Review

In recent years, mid-20th-century parks located in high-density urban cores have faced multidimensional challenges related to space, ecology, and functionality. Their planning logic and spatial form were largely shaped by the industrial-era concept of the “green lung,” yet they lack the flexibility and integration required to adapt to contemporary urban lifestyles [22,23]. Recent empirical studies in Chinese cities have documented these challenges extensively, with aging parks in Beijing and Xi’an showing significant infrastructure deterioration and functional obsolescence [24,25]. As urban design paradigms shift from formal aesthetics toward performance-oriented approaches, a growing number of digital tools based on environmental simulation and data analysis have been introduced into park renewal [26], providing new opportunities for transforming aging parks into high-performance, multifunctional spaces [27]. Case studies from Chengdu and Nanjing have demonstrated the potential of multidimensional assessment frameworks in guiding park renewal projects [28,29].
Among these methods, spatial syntax has become a widely adopted tool for quantitatively analyzing the relationship between spatial configuration and human behavior [30,31]. Extensive empirical applications in Chinese cities, including Changsha and Fuzhou, have validated its effectiveness in urban park accessibility analysis [12,32]. Through metrics such as connectivity, visibility, and spatial hierarchy, spatial syntax enables the identification of high-traffic routes and structural bottlenecks [33], thereby optimizing internal accessibility and functional organization [34]. Recent innovations in 3D spatial syntax analysis have enhanced the capability to capture complex three-dimensional spatial attributes in landscape systems [35]. When combined with POI data or human mobility big data, it can further capture dynamic crowd distributions and flow conflicts, offering quantitative evidence for spatial equity and peak-hour management [36,37]. Studies in Malmö and other European cities have demonstrated the correlation between space syntax measures and pedestrian behavior patterns [38]. In high-density urban environments, spatial syntax has also been applied to detect underserved areas and optimize the allocation of public resources [39]. Systematic reviews have highlighted both the achievements and limitations of space syntax applications in enhancing urban sociability [14].
Complementary to spatial syntax, computational fluid dynamics (CFD) has been widely employed for microclimate optimization. CFD can simulate wind velocity distribution, ventilation paths, and thermal comfort [40], and assess the impacts of terrain, vegetation, and building morphology on thermal environments [41]. Field-validated case studies in Chengdu and Hefei have demonstrated CFD’s effectiveness in evaluating outdoor thermal comfort in urban parks during different seasons [42,43]. It thus serves as a critical tool for mitigating urban heat islands and improving air circulation in dense city cores [44,45]. Recent applications in Mediterranean climates, such as studies in Annaba and Montería, have further validated CFD models for park thermal environment assessment [46,47]. When integrated with solar access analysis [48], visibility analysis [49,50], and pedestrian heat-mapping, CFD further supports comprehensive assessments of environmental comfort, usage potential, and safety [50]. Advanced multi-physics CFD simulations conducted with scStream (version 14) have enabled more sophisticated microclimate analysis in waterfront parks and urban squares [51].
Despite these methodological advances, systematic reviews reveal that most thermal comfort studies focus on individual squares or parks without establishing transferable design guidelines [52]. Nevertheless, three major gaps remain in current research: first, most studies focus on single dimensions such as spatial accessibility, microclimate simulation, or functional diversity, without achieving systematic cross-dimensional integration [53,54]; second, in the complex context of aging parks with layered histories and multifunctional demands, spatial syntax and CFD are often applied in isolation, making it difficult to reveal the coupled mechanisms between crowd organization, environmental comfort, and functional integration [55,56]; and third, few studies have combined the framework of Performance-Based Urban Design (PBUD) with spatial analysis and environmental simulation to establish an operational pathway for performance-oriented park renewal. These gaps constitute the core research void that this study seeks to address.

3. Materials and Methods

3.1. Study Area

This study selects an urban public garden in Wuxi as the study area (Figure 1), primarily due to its complex spatial structure, ecological pressure, and its multifaceted functional role within a high-density core area [57]. Located in Liangxi District—the historical and administrative center of Wuxi—the park area typifies the adaptability challenges faced by aging parks under intense urban development [58]. The park covers approximately 9.2 hectares and features a heterogeneous spatial composition. Its eastern section preserves traditional gardens and historic buildings dating back to 1905, designated as a protected area. The western section was originally planned as a city square but has experienced disorderly commercial encroachment since 2000. The park is enclosed on three sides by mid- to high-rise commercial buildings ranging from 24 to 266 m in height, forming a highly confined urban environment. It connects to surrounding pedestrian streets and a metro station through four main entrances, highlighting the urgent need for renewal and revitalization.
The core performance issues of the park are deeply rooted in its complex developmental history. This aging urban park in Wuxi integrates different developmental phases: the eastern traditional garden area, dating from the early modern urbanization period (1900–1949), is designated as a protected heritage district, while the western section represents the modernization and ecological civilization construction era. As a park primarily designed for leisure functions, its accessibility, balance, and ventilation capacity can no longer meet the demands of today’s surging population and diversified functional requirements, urgently requiring optimization and renewal.
These historical layers have resulted in fragmented pedestrian organization with persistent congestion at entrances and exits [59]; fragmented internal spaces with broken nodes [60] (Figure 2a); deep spatial hierarchies leading to uneven accessibility and weak wayfinding [61]; dense hedges and temporary stalls causing visual obstruction, thereby reducing spatial transparency and safety [62]; and solar access problems in the southwest area caused by a 266-m super-high-rise building (Figure 2b). The temporal mismatch between the park’s original design principles and contemporary urban demands exemplifies the broader challenges facing mid-20th-century parks in rapidly densifying urban cores [63]. At the same time, the heterogeneous park boundaries, composite functions, and vertically enclosed surroundings provide a representative context for the validation and practical application of the “Environmental Analysis Overlay Method” [53].

3.2. Research Data Sources

To ensure the reproducibility and transparency of the research, this study systematically collected multi-source data required for the optimization of high-density urban parks, covering climate, spatial, and human behavioral information. These datasets support subsequent space syntax analysis, CFD simulations, and solar radiation analysis. The specific data sources are shown in Table 1.
All datasets were unified into a standard grid system (35 cm × 40 cm), enabling multilayer overlay analysis and ensuring the integration of spatial, environmental, and behavioral data at a consistent scale. This data collection process provides a fundamental basis for the subsequent “environmental analysis overlay method” and guarantees the quantifiability, comparability, and dynamic adjustability of performance indicators.

3.3. Technical Framework of the “Environmental Analysis Overlay Method”

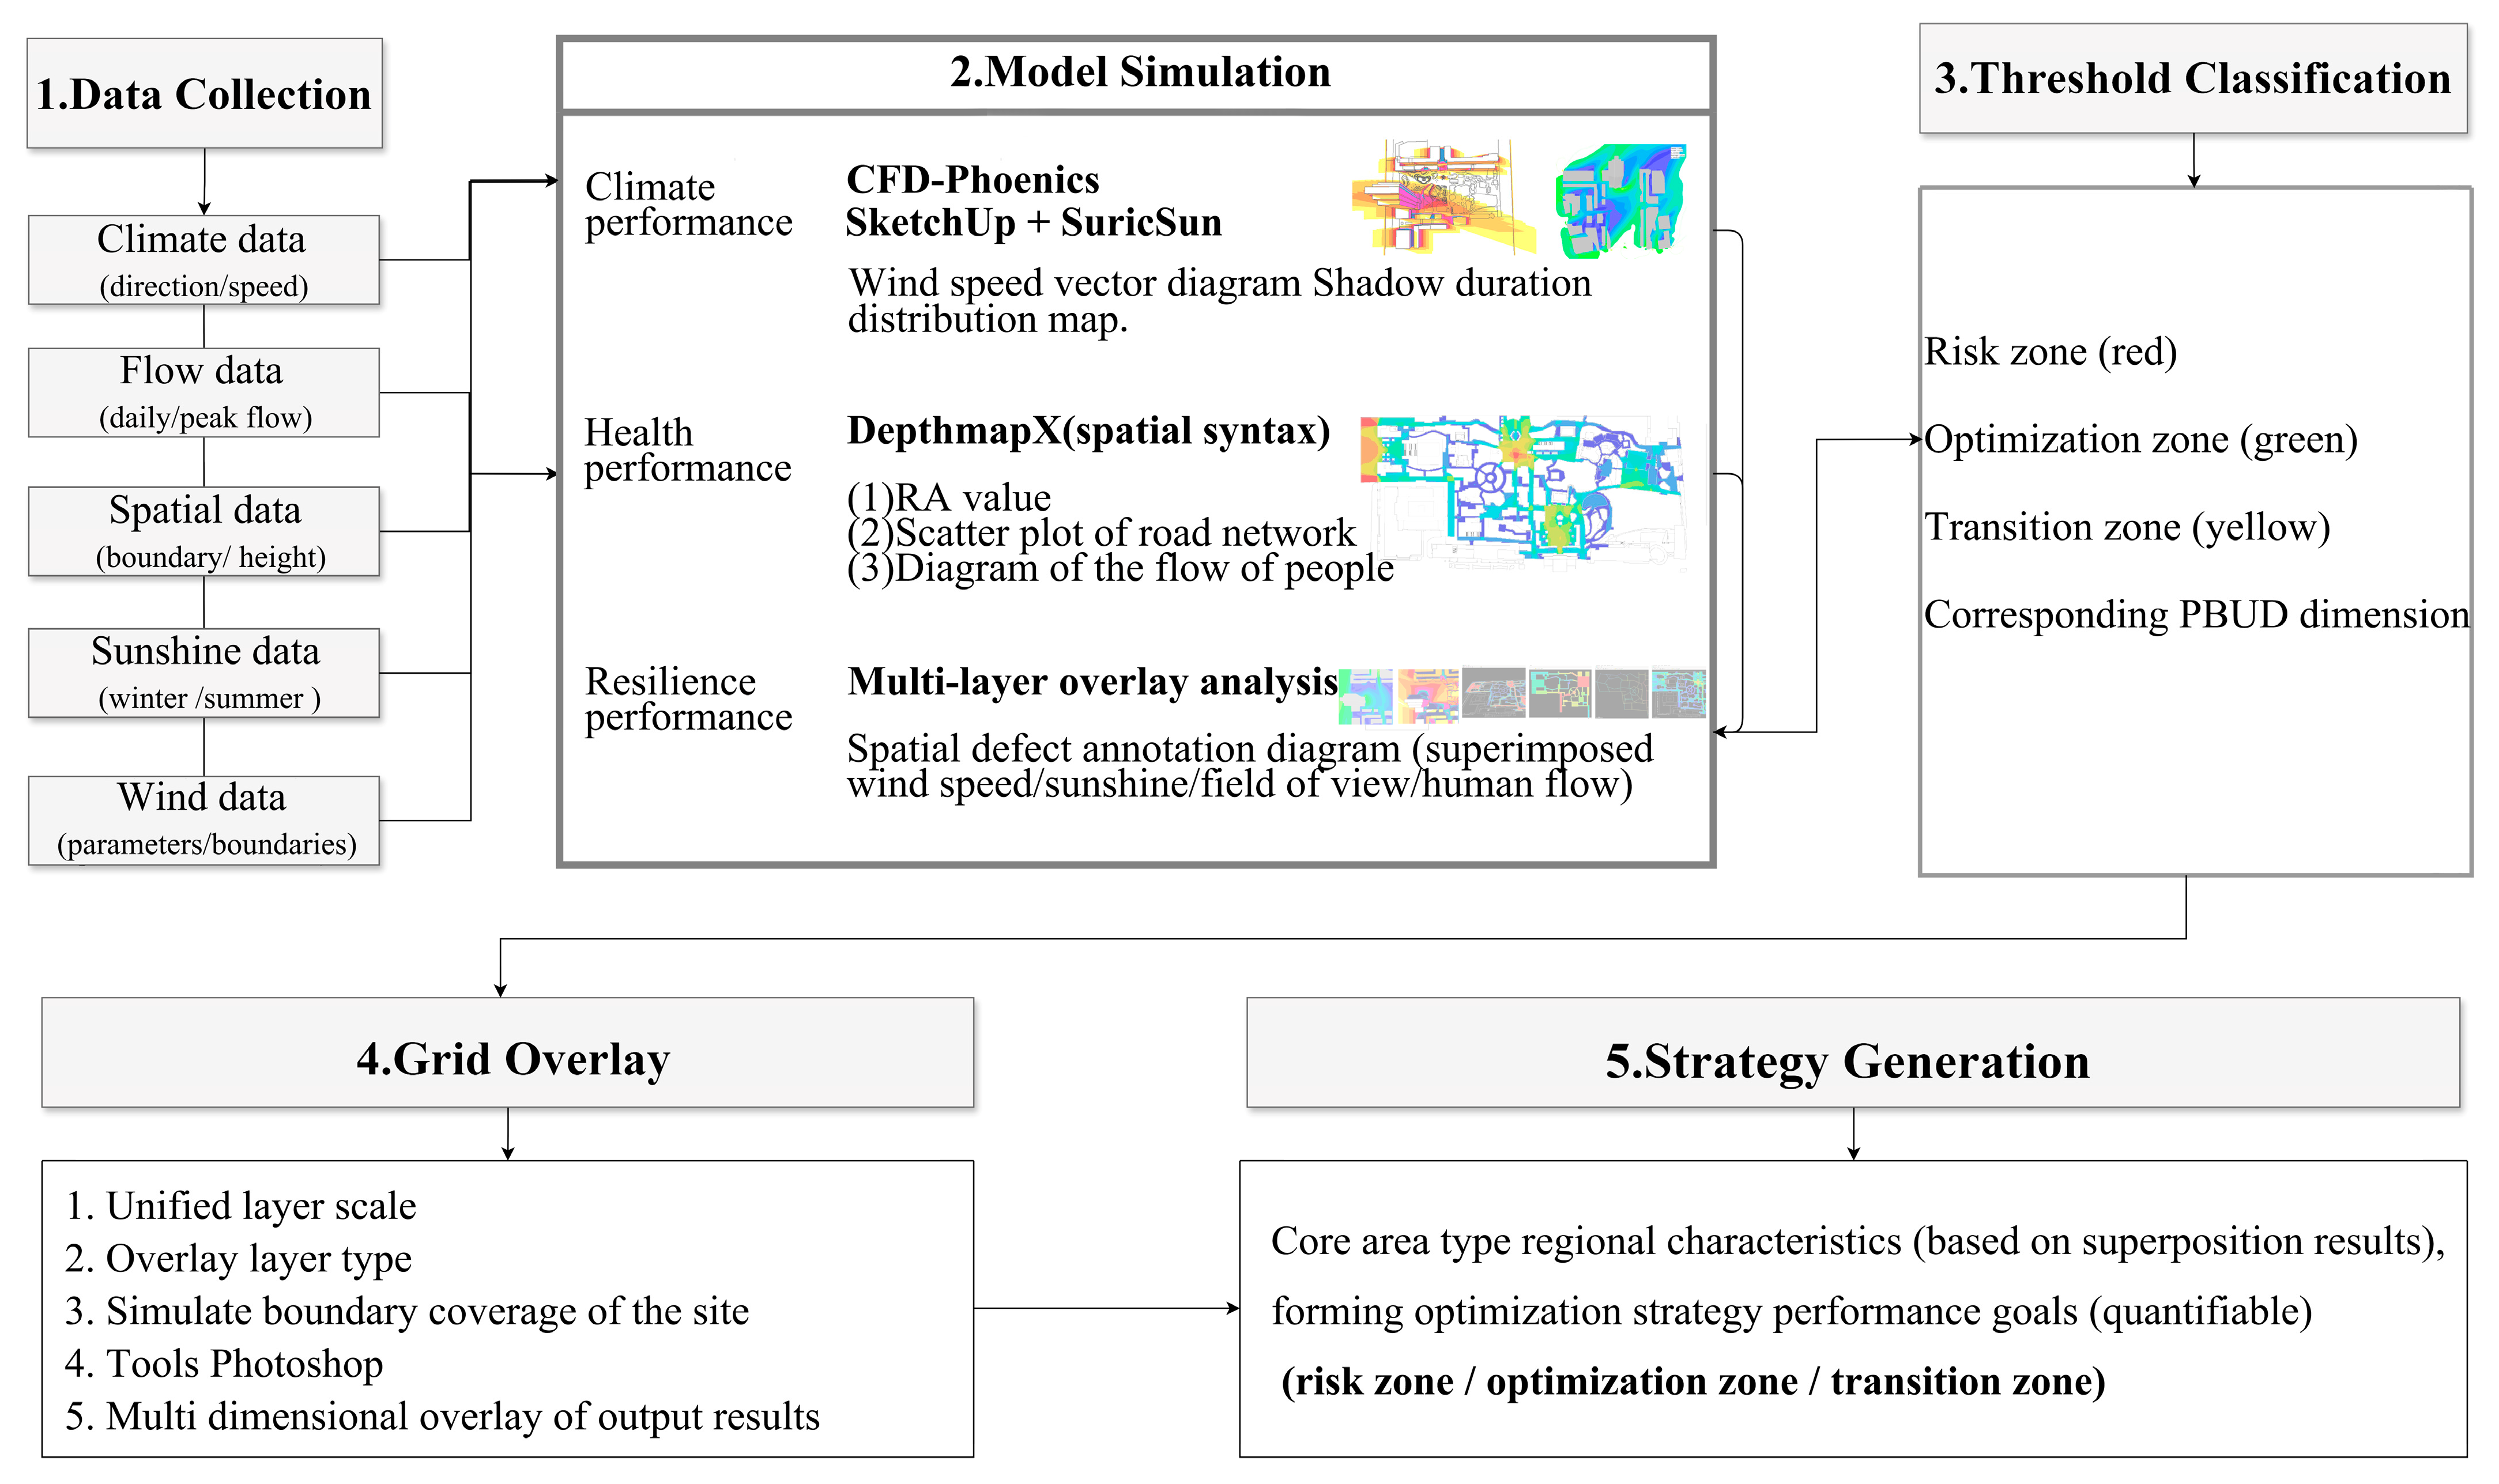
To optimize the spatial quality and environmental performance of aging urban parks in high-density urban cores, this study establishes a five-step technical workflow: “Data Collection → Model Simulation → Threshold Classification → Grid Overlay → Strategy Generation,” grounded in the three-dimensional performance framework of Performance-Based Urban Design (PBUD)—Climatic Performance, Health Performance, and Resilience Performance. A uniform grid size of 35 cm × 40 cm is used to ensure multidimensional spatial data alignment, with a fixed simulation boundary of X = 600 m and Y = 900 m covering the park area. The optimization focuses specifically on internal spatial layout, functional zoning, and landscape design to enhance analysis accuracy and facilitate targeted interventions.

3.3.1. Correspondence Between PBUD Three-Dimensional Performance and Technical Methods

The three-dimensional performance criteria are operationalized through specific technical approaches to quantify climatic, health, and resilience objectives, as summarized in Table 2.
Convex Space Analysis (Figure 3a) is carried out by dividing the park area into 155 units based on functional and enclosure structures [66]. Spatial permeability and entrance hierarchy are evaluated using total depth and relativized asymmetry (RA). Lower total depth implies higher integration and ease of movement, whereas high RA indicates excessive depth from activity nodes, reducing spatial efficiency. The calculation formula is as follows:
M e a n   D e p t h a 1 = T o t a l   D e p t h a 1 n 1
R e l a t i v i z e d   A s y m m e t r y a 1 = M e a n   D e p t h a 1 1 n 2 1
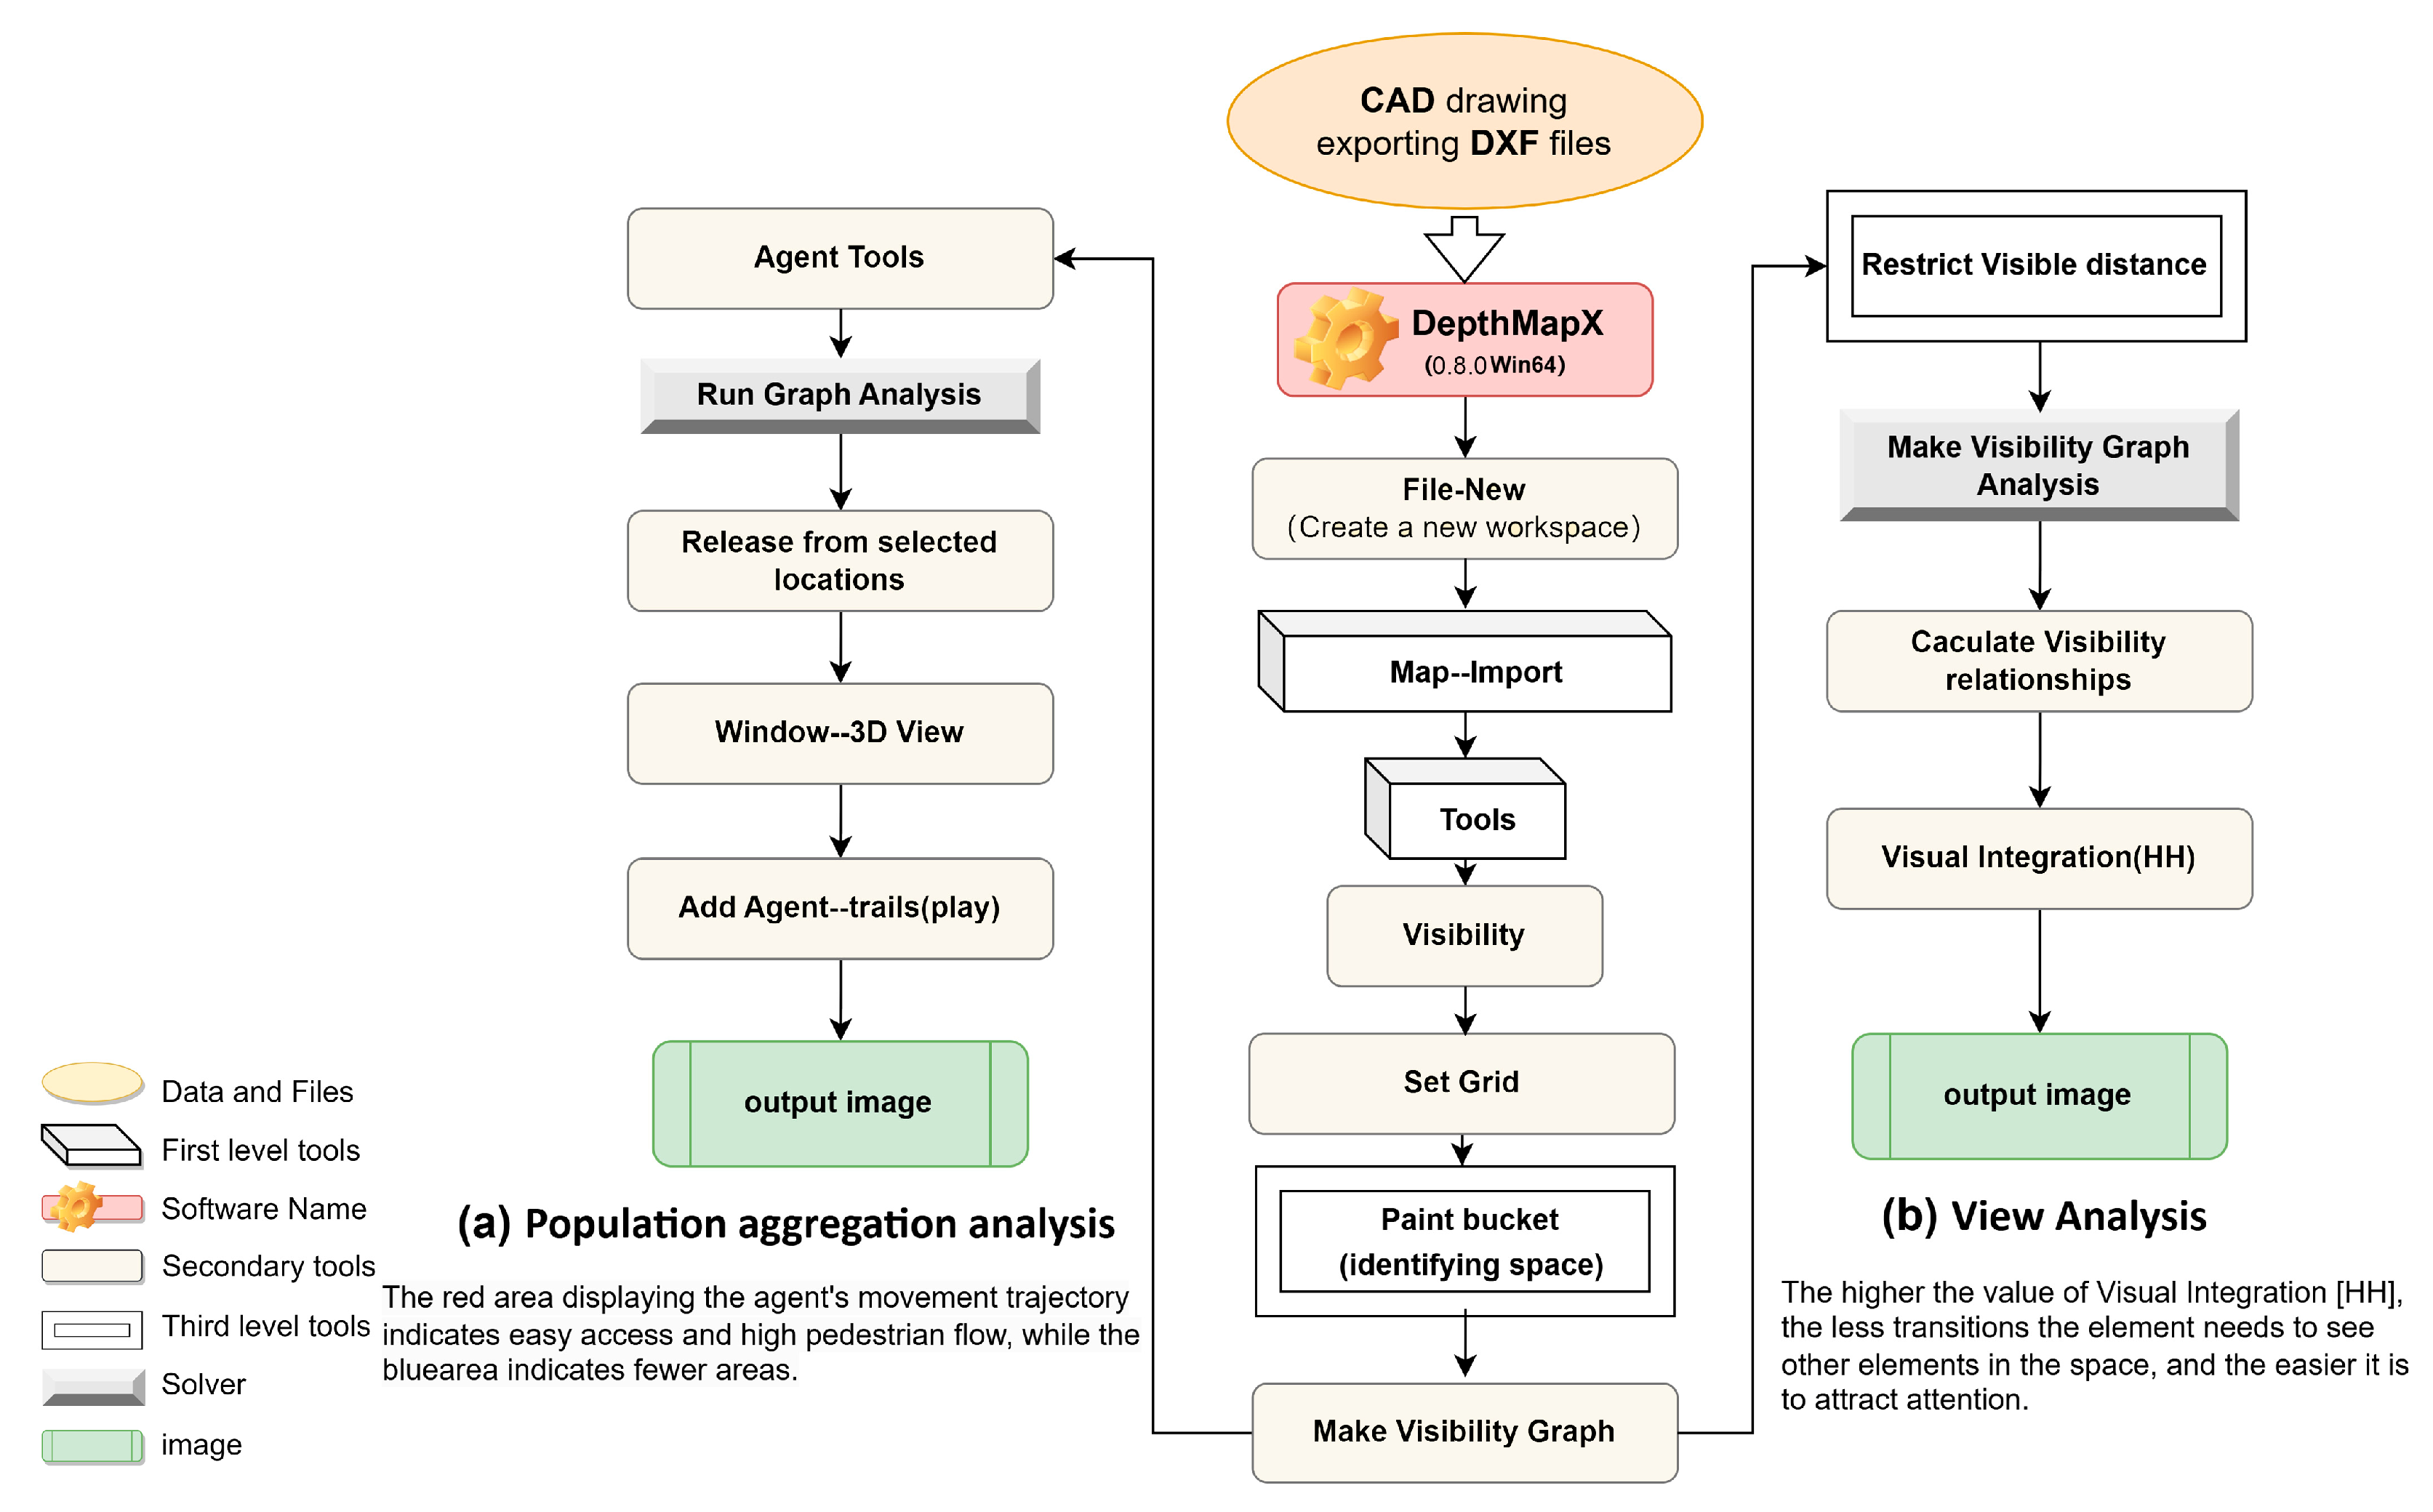
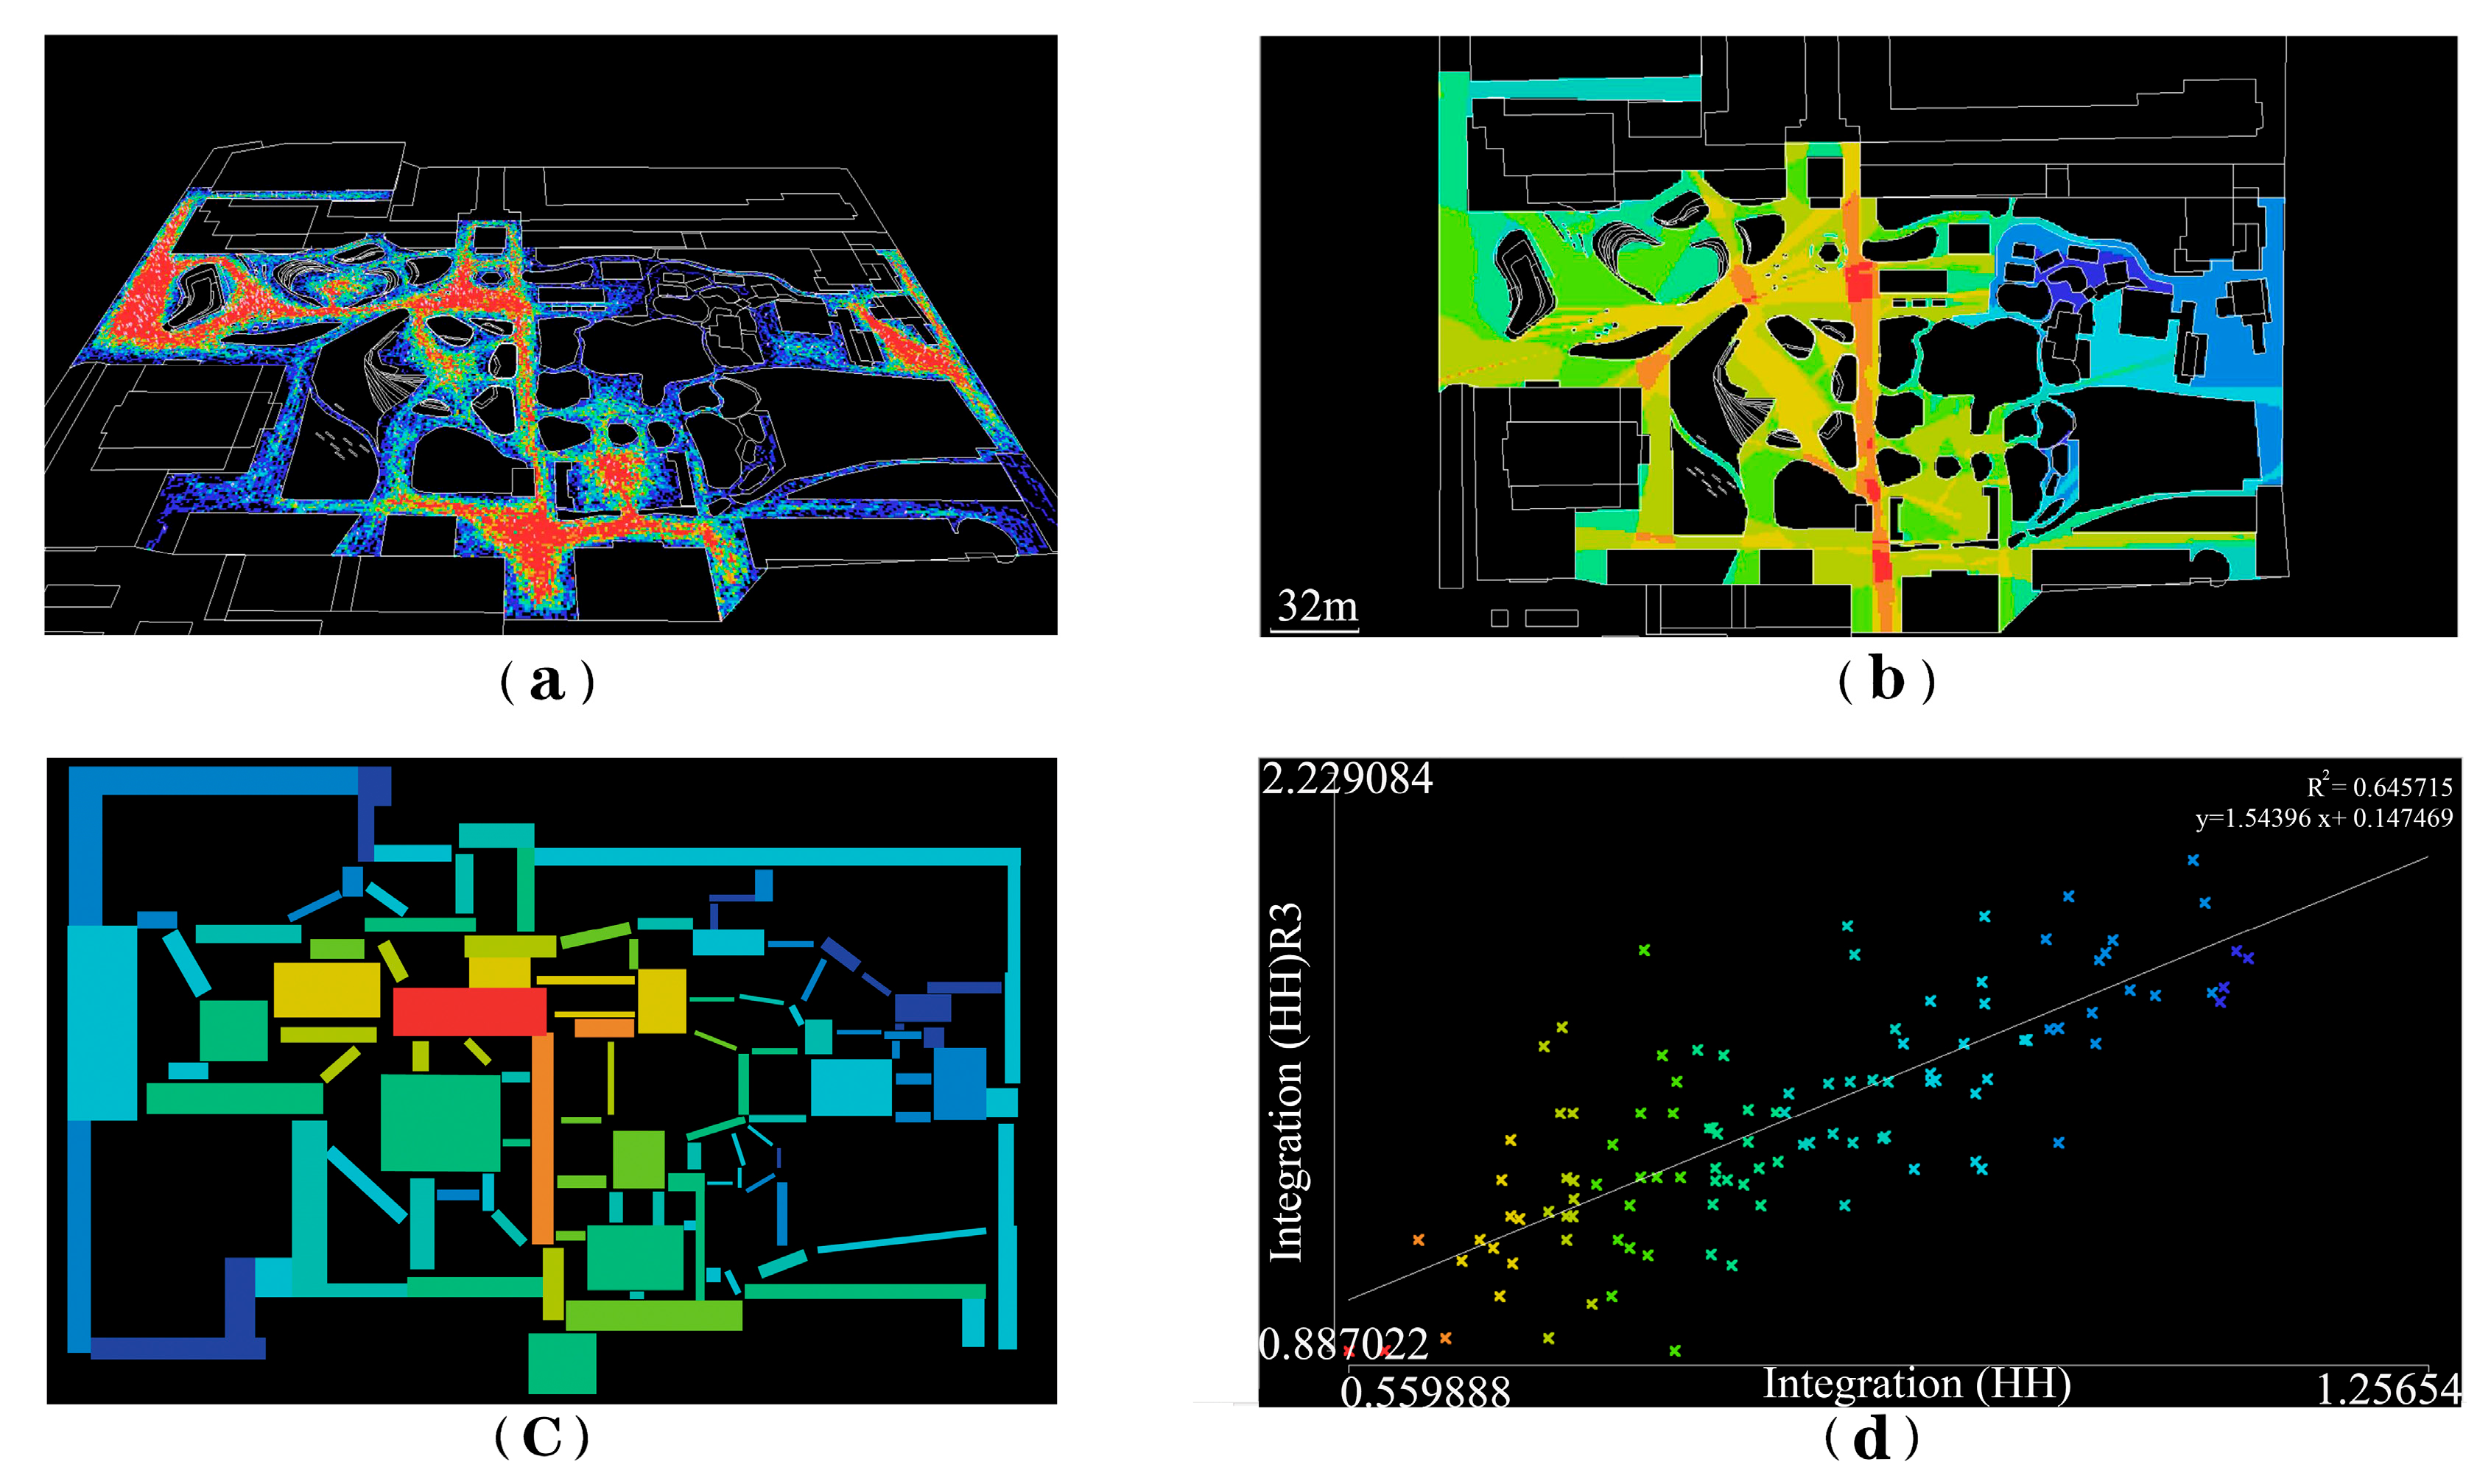
Axial Analysis (Figure 3b), a core space syntax technique, assesses global and local integration (HH and R3) via an axial map generated from the site’s network. Integration maps use a color spectrum (red = high, blue = low) to support spatial design decisions [67].
Agent-Based Simulation (Figure 4a) models pedestrian movement along integrated paths, correlating with Baidu heatmap data [68]. Warm colors indicate high integration and crowd concentration, supporting urban centrality analysis [69].
View Analysis (Figure 4b) simulates visual integration to detect blind spots and fragmented zones—critical for ensuring safety and accessibility for children and the elderly [70]. It computes mean and standard deviation of integration across sightlines.
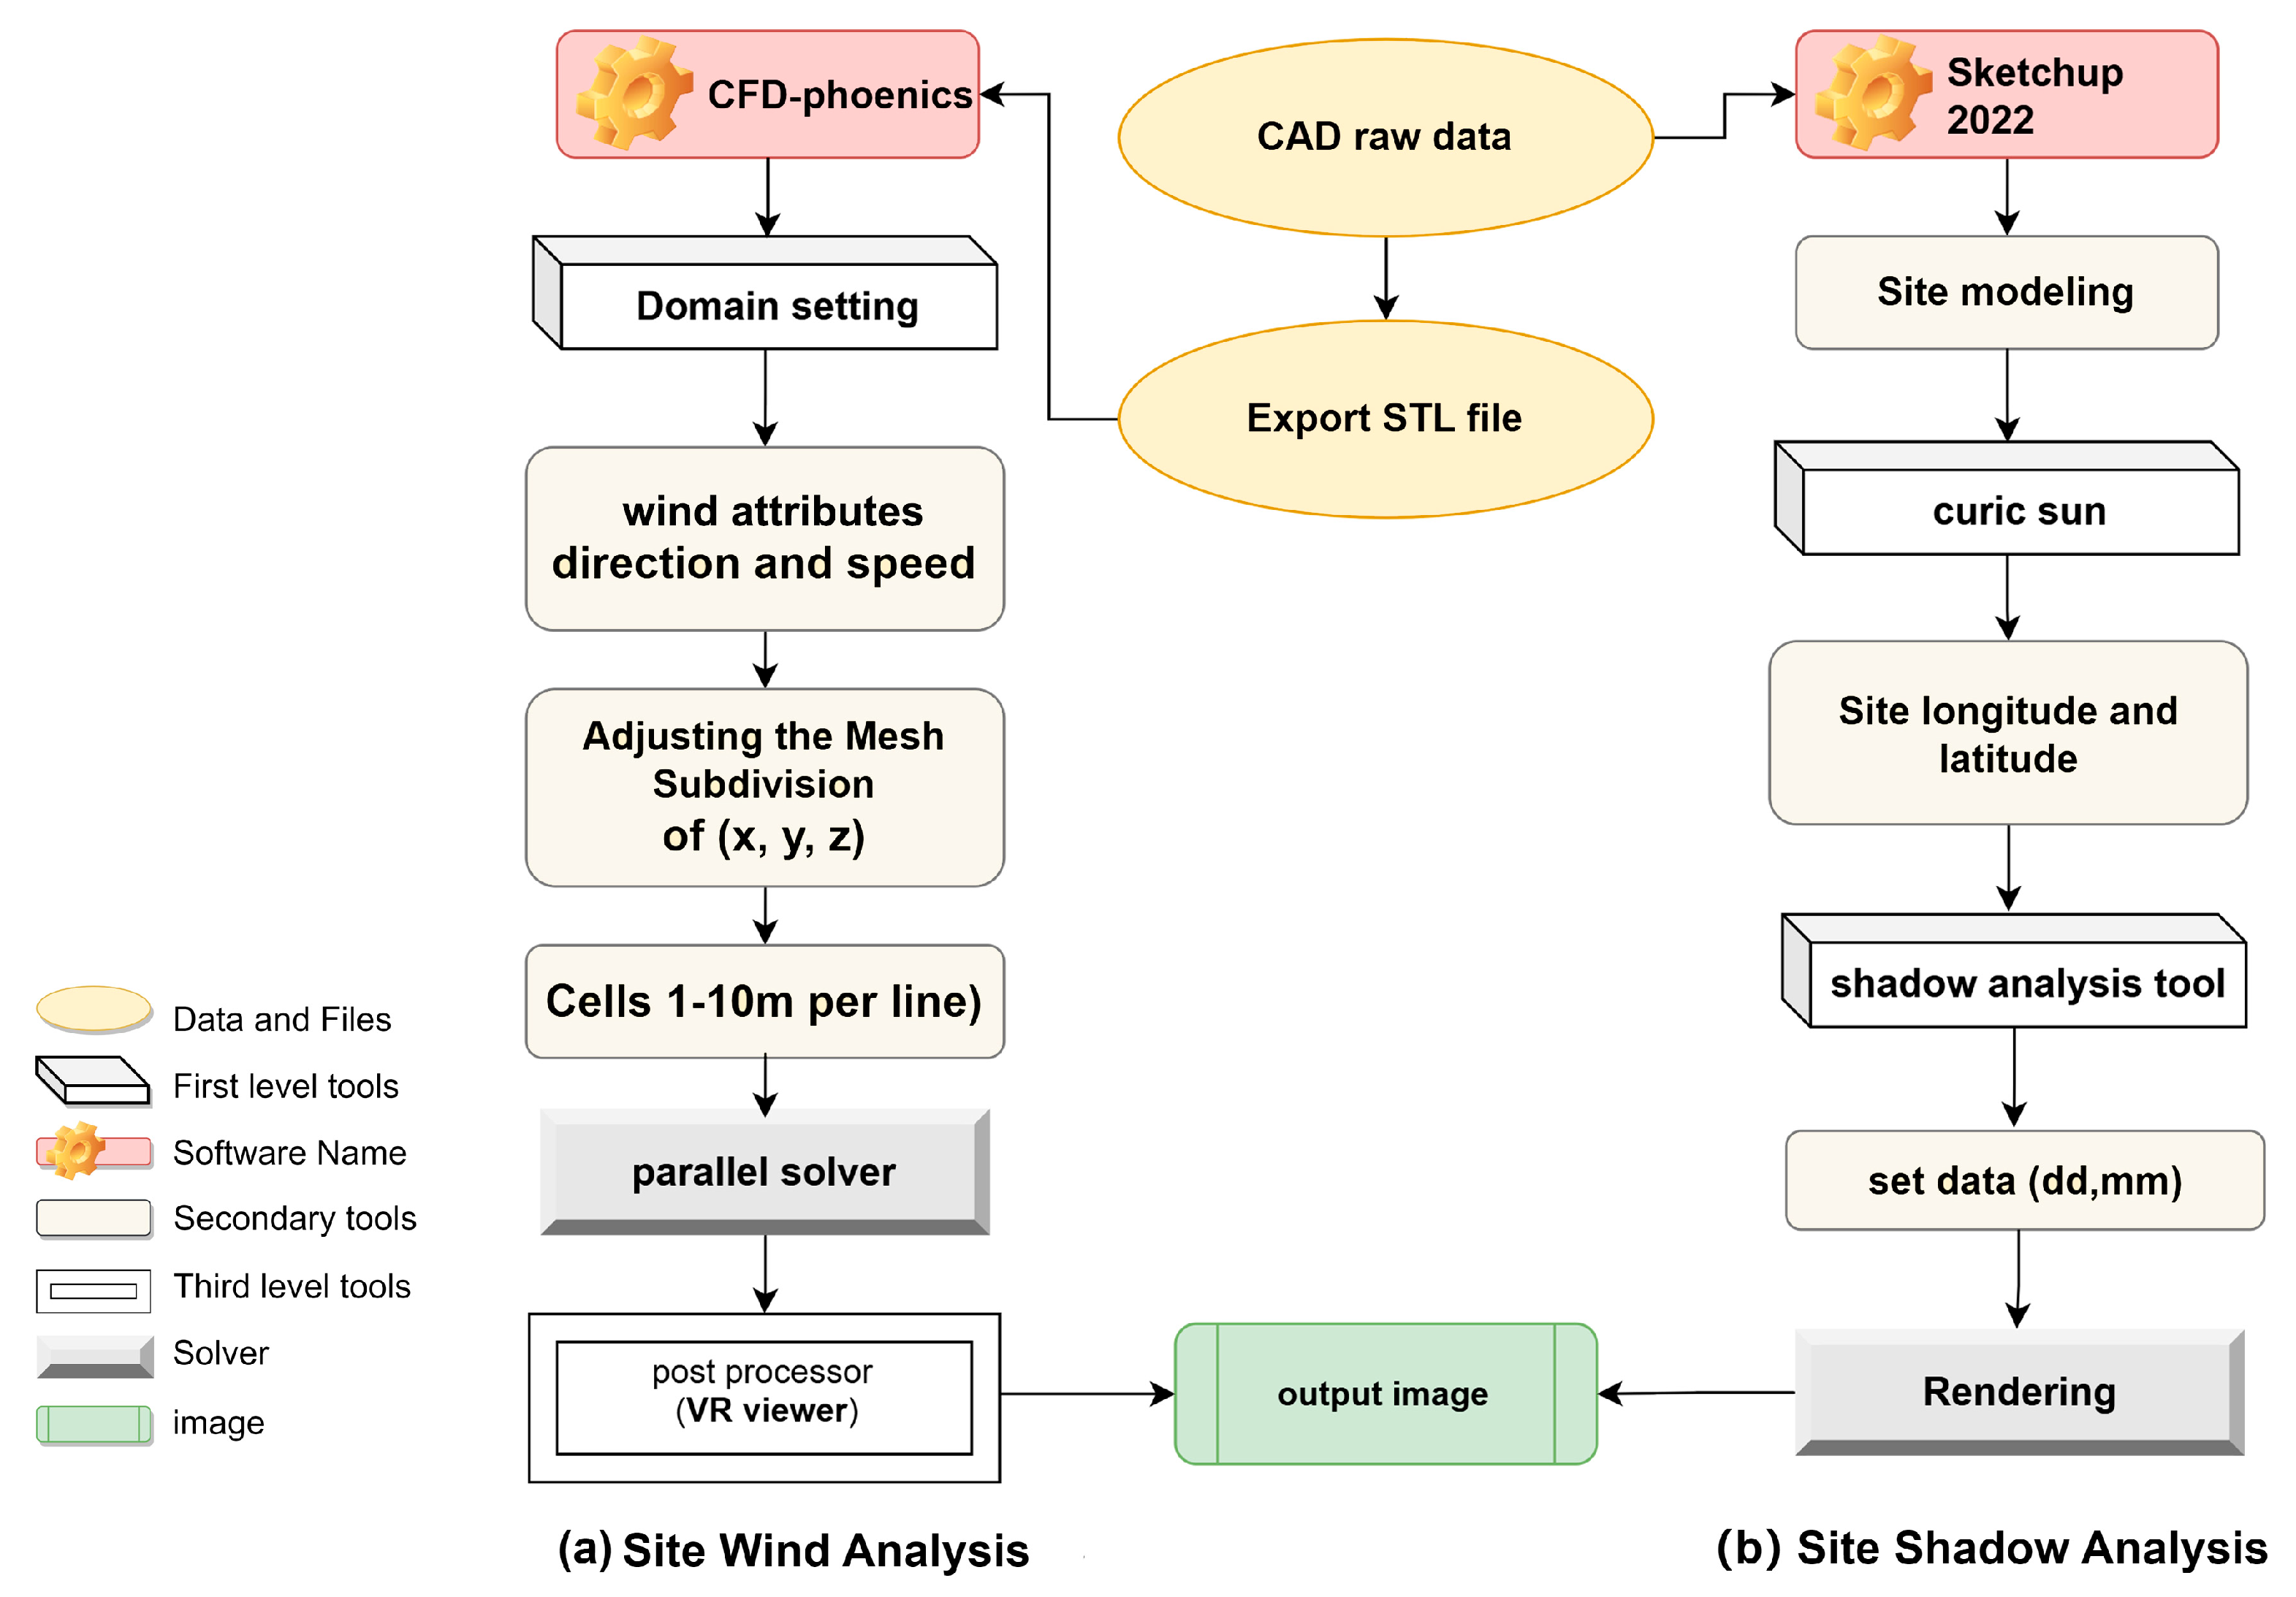
Wind Environment Simulation (Figure 5a) uses CFD-Phoenics with a CityEngine-generated 3D model to assess ventilation and thermal comfort. Parameters include RNG k–ε turbulence model, structured boundary conditions, and a domain of 600 m × 900 m × 80 m. Mesh refinement targets pedestrian height (Z = 1.5 m) and building edges. Results classify zones by wind speed: stagnant (0–0.5 m/s), suitable for pedestrians (0.5–1.5 m/s), and ideal for ventilation (2–4 m/s) [64]. Outputs are overlaid with other performance layers to guide planting, paving, and spatial reorganization.
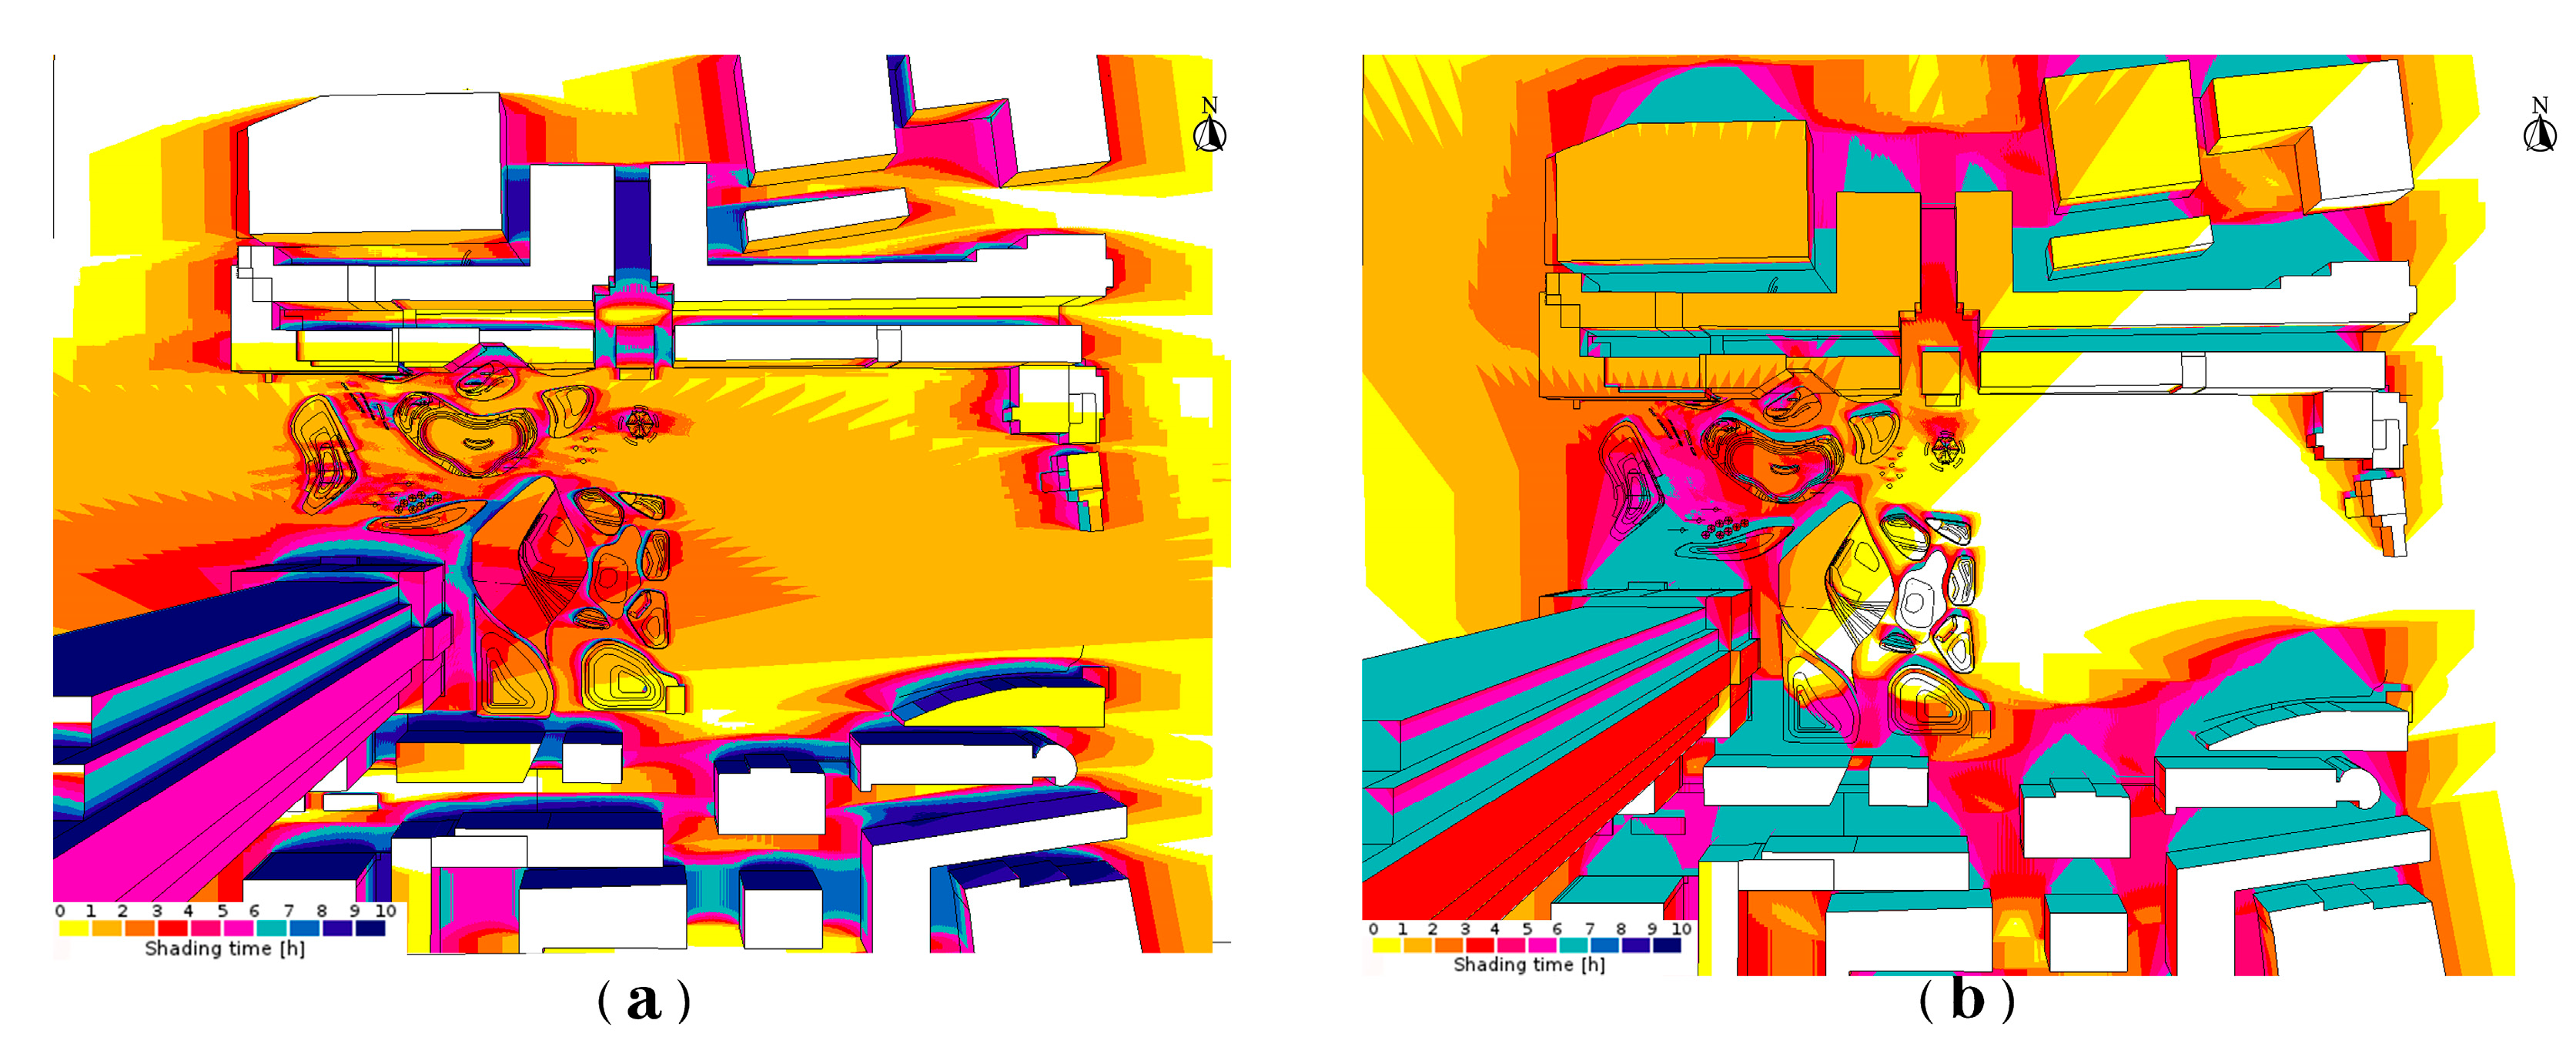
Sunshine Analysis Simulation (Figure 5b): Given the presence of surrounding super-high-rise buildings, which cast extensive shadows that significantly compromise spatial usability and microclimate conditions in high-density urban parks, effective sunlight utilization becomes crucial for spatial layout optimization.
All simulation results—exported as raster images—are integrated with space syntax and environmental data to form a coupled spatial basis for optimizing pathways, ventilation corridors, and sunlit areas. This systematic coupling ensures that renewal strategies are theoretically grounded and empirically validated.

3.3.2. Suitability Threshold Classification

Based on PBUD objectives, simulation results are classified into “Performance Risk Zone”, “Performance Optimization Zone”, and “Transition Zone” to identify deficiencies and guide design interventions. The classification standards integrate multiple performance dimensions with adapted thresholds (Table 3): RA values adopt a percentile-based classification approach rather than traditional space syntax theoretical thresholds, as empirical analysis revealed that site-specific RA values consistently fall below 0.1, making conventional standards (RA ≤ 0.25 for high integration) impractical for meaningful differentiation. Therefore, RA classification employs data distribution percentiles where the upper 33rd percentile represents segregated areas with relatively limited movement potential (Performance Risk Zone), the middle 33rd percentile suggests moderate accessibility (Transition Zone), and the lower 33rd percentile indicates high integration areas with optimal accessibility (Performance Optimization Zone). Wind environment thresholds are based on pedestrian comfort criteria where 0.5–2 m/s provides optimal conditions for outdoor activities, while speeds > 4 m/s or <0.5 m/s create discomfort or stagnation risks [71]. Solar exposure classification follows seasonal adaptation principles where <5 h ensures sufficient winter sunlight, 5–6 h allows deciduous tree mitigation, and >6 h indicates excessive winter exposure reducing outdoor activity [72]. Space syntax heat maps and visual field analyses use color-coded integration values where warmer colors (red/yellow-green) indicate higher accessibility and cooler colors (blue/dark blue) represent segregated or poorly connected spaces [73]. This multi-dimensional approach enables comprehensive performance evaluation while maintaining consistency with established urban design standards.

3.3.3. Implementation Details of the Five-Step Technical Workflow

This study establishes a Performance-Based Urban Design (PBUD) workflow that integrates data analysis, simulation, threshold classification, spatial overlay, and targeted optimization to guide the sustainable renewal of aging urban parks in high-density cores (Figure 6).
(1) Data Analysis: Establishing PBUD Performance Baselines
Pre-renovation site issues—including entrance congestion, fragmented landscape, age-segregated usage, and microclimate discomfort—were identified through a multi-source data collection system to support three-dimensional performance analysis:
  • Spatial Data: Park topography, building layout, and functional zoning were obtained via field surveys, CAD base maps, and GIS coordinates (31.5757° N, 120.3019° E).
  • Environmental Data: Wind, temperature, and sunlight parameters were derived from national meteorological records (subtropical monsoon climate in Liangxi District, Wuxi; prevailing southeast winds year round and north winds in winter; average annual wind speed of 4.2 m/s; temperature range from −7 °C to 42 °C); and on-site microclimate monitoring.
  • Behavioral Data: Agent-based modeling generates virtual pedestrian flows along integrated paths, enabling validation against Baidu heatmaps. As one of the most effective space syntax techniques, crowd flow simulation reflects urban spatial centrality [69] (daily 7500–9000 visitors, weekend/holiday peak 18,000–22,000) and was combined with field photography to capture crowd aggregation and activity preferences.
(2) Model Simulation: Dimension-Specific PBUD Tools
Each PBUD dimension was simulated using its corresponding technical tools for quantitative analysis:
  • Climatic Performance: CFD-Phoenics simulation was used to import STL models of the urban environment (including the park and surrounding high-rise buildings) with RNG k–ε turbulence model, fixed inlet wind speed, zero-pressure outlet, rough ground, and no-slip building walls. Simulation domain: X = 600 m, Y = 900 m, and Z = 80 m, refined at 1.5 m pedestrian height and 0.5 m near building edges. Wind vector maps were output. SketchUp Pro with Suric Sun plugin simulated summer and winter solstices (21 June, 7:00–18:00; 21 December, 9:00–15:00, hourly intervals) to generate shading duration maps.
  • Health Performance: DepthmapX was used for space syntax analysis. Eighty-eight convex spaces were defined to calculate RA values and mean depth. Axial maps generated global (HH) and local (R3) integration metrics, and agent-based simulations verified pedestrian routes against Baidu heat maps. Density conversion identified accessibility bottlenecks and congestion points (e.g., entrance peak > 8 persons/m2).
  • Resilience Performance: Preliminary integration of climate (wind, sunlight) and health (pedestrian flow, accessibility) layers identified potential elastic spaces (e.g., long sunlight + comfortable wind) and fragmented areas (e.g., high RA + stagnant wind).
(3) Threshold Classification: Linking to Suitability Standards
Simulation results were classified according to the thresholds in Table 1 to define PBUD performance attributes for each area:
  • Wind speed: <0.5 m/s (climatic risk), 0.5–2 m/s (optimized), 2–4 m/s (transition);
  • RA value: >0.07 (health risk), ≤0.04 (optimized), 0.04–0.07 (transition);
  • Pedestrian density: >8 persons/m2 (health risk), 1–3 persons/m2 (optimized), 3–8 persons/m2 (transition);
  • Shading duration: >6 h (climatic + health risk), <5 h (optimized), 5–6 h (transition).
(4) Grid Overlay: Establishing a Unified Spatial Benchmark
All classified layers—including pedestrian heat maps, RA maps, CFD wind maps, and solar shading maps—were aligned to a uniform 35 cm × 40 cm grid in Photoshop 2022 (https://www.adobe.com/products/photoshop.html, accessed on 12 October 2025). The simulation boundary (X = 600 m × Y = 900 m) was strictly maintained to ensure spatial consistency and comparability across PBUD dimensions, producing multi-layer overlay maps to inform strategy generation.
(5) Strategy Generation: Targeted Optimization of Park Interior Design
Based on overlay results, three core areas were identified and targeted optimization strategies were proposed according to PBUD performance goals, using an iterative “redesign–reevaluation” mechanism:
  • Performance Risk Zones (e.g., heat retention and congestion areas: <0.5 m/s stagnant wind + >6 h shading + red area (high density flow) + RA >0.07): Prioritize improving ventilation and accessibility by adding southeast-oriented wind corridors (tall trees guiding dominant winds), widening secondary paths to reduce RA ≤ 0.04, and dispersing entrance flows via 2–3 auxiliary entrances and buffer plazas.
  • Performance Optimization Zones (e.g., comfortable composite areas: 0.5–2 m/s wind + <5 h shading + green area (comfortable flow) + RA ≤ 0.04): Strengthen functional diversity by arranging multi-age activity nodes (elderly exercise areas, children’s playgrounds), seating, and service facilities (water stations, rain shelters) to ensure healthy and comfortable use.
  • Transition Zones (e.g., elastic buffer areas: 2–4 m/s wind + 5–6 h shading + yellow area (moderate flow) + RA 0.04–0.07): Serve as functional transition and elastic spaces, incorporating seasonal landscaping (deciduous trees) and temporary activity areas (weekend markets, science exhibitions) to enhance resilience and adaptability.
Iterative simulation verified the optimization effects, ensuring continuous improvement of PBUD three-dimensional performance. Following the identified optimization strategies, the park design was updated and re-imported into the respective simulation tools (CFD-Phoenics, SketchUp Pro, DepthmapX) to generate post-renovation performance maps, which were subsequently analyzed in AutoCAD for precise area calculation and comparative assessment of improvement percentages across all PBUD dimensions.

3.3.4. Data Visualization and Communication Strategy

Recognizing that complex environmental data requires strategic visual communication, this study employs a hierarchical visualization approach: Level 1: Diagnostic maps use color-coded zones (red = risk) to spatially represent performance deficiencies areas. Level 2: Overlay maps employ transparency gradients to visualize multi-layer conflicts, such as areas with overlapping wind stagnation, shading, and high pedestrian density. Level 3: Validation charts provide quantitative before–after comparisons, illustrating improvements in key indicators (e.g., wind comfort, RA values, solar exposure). All visualizations adhere to consistent cartographic principles: a unified 35 cm × 40 cm grid, standardized color schemes across PBUD dimensions, and explicit threshold indicators to facilitate interdisciplinary interpretation and decision-making.

4. Process and Results

4.1. PBUD Performance Diagnosis Before Optimization

Based on simulations using DepthmapX, Phoenics, and Suric Sun, combined with pedestrian flow data, the pre-renovation site exhibits significant deficiencies across the three dimensions of Performance-Based Urban Design (PBUD).
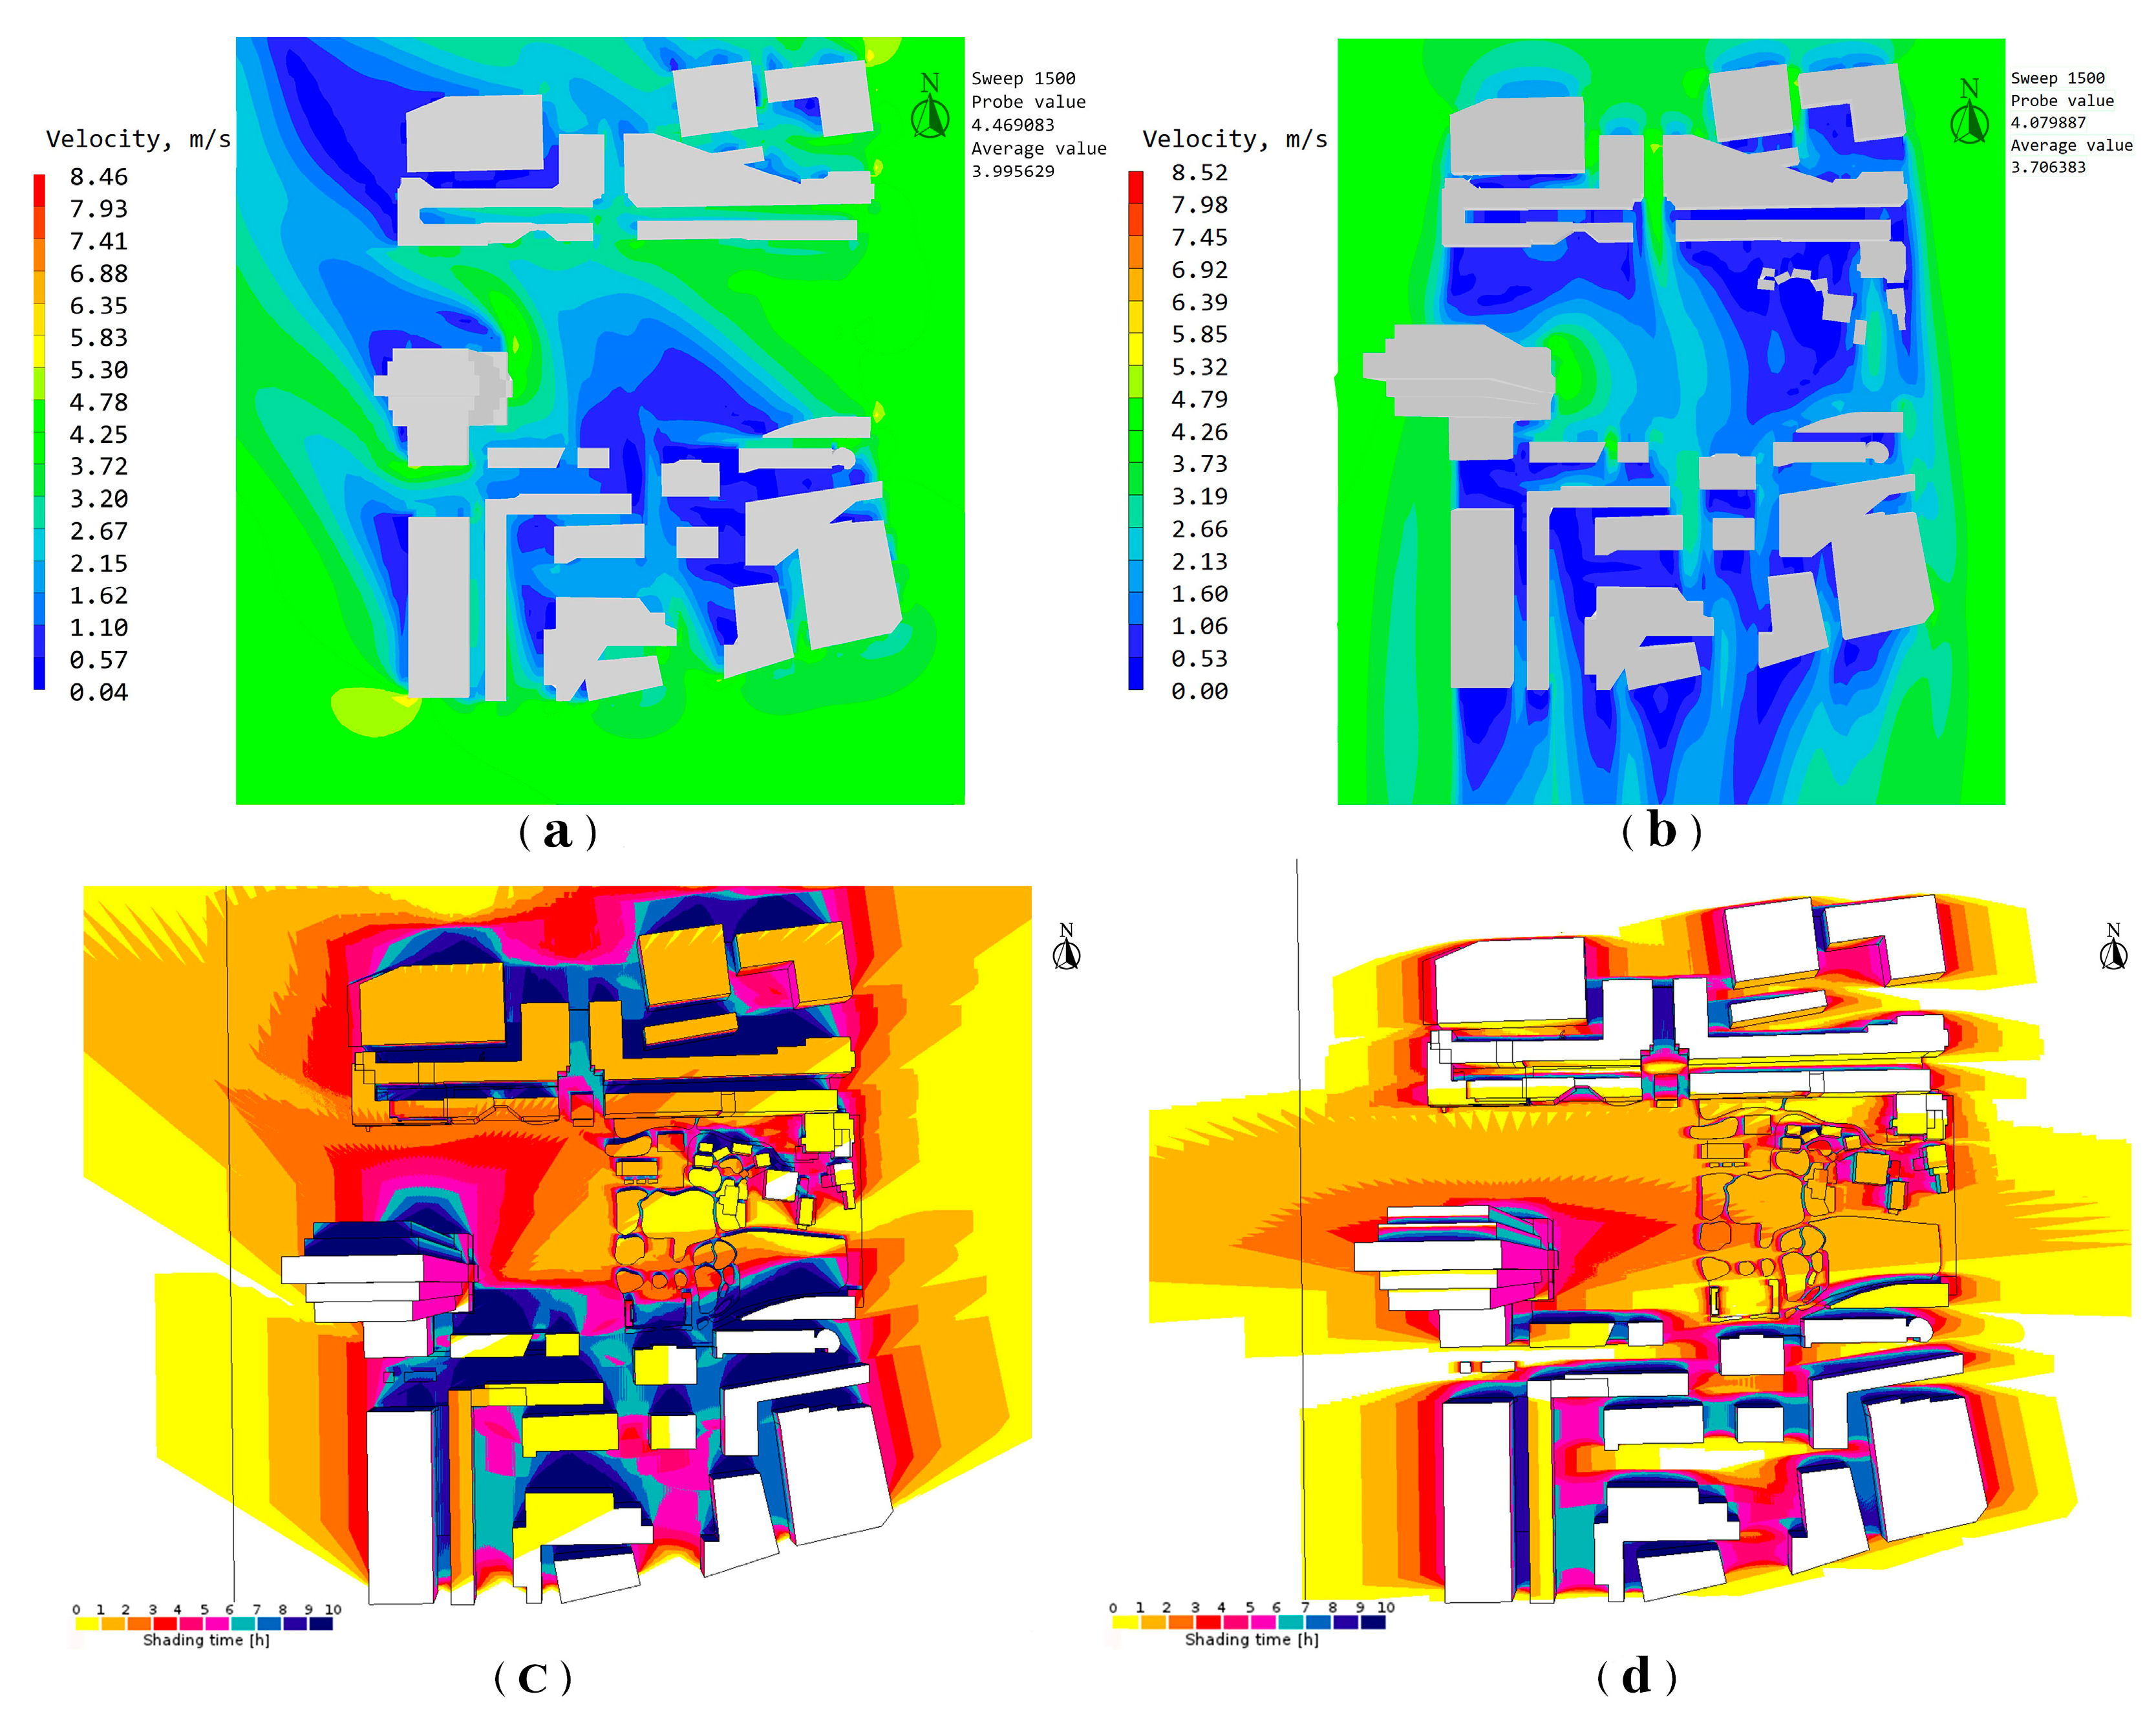
Climatic performance: The site’s microclimate system exhibits significant imbalance, with core issues in wind environment control, uneven sunlight distribution, and pronounced urban heat island effects. Under dominant summer southeast winds (Figure 7a) (average 30°, 3.3–4.2 m/s), only 15% of the site falls within the comfortable wind speed range (0.5–2 m/s). Although central open areas have potential ventilation zones with 2.0–4.0 m/s, no continuous wind corridors are established to guide airflow. Strong wind zones (>4 m/s) along the north–south commercial streets lack vegetative buffers, and the southwest corner behind buildings forms a core stagnation zone (<0.5 m/s). Combined with dense building coverage, overall stagnation areas account for 40%. In winter, under north winds (Figure 7b) (3.9–4.2 m/s), static wind zones (<0.5 m/s) are concentrated at the site edges and are not functionally adapted for low-wind activities (e.g., outdoor uses tolerant of cold but requiring minimal airflow), exacerbating discomfort. Additionally, overlapping shadows from the 266 m high-rise and surrounding 24 m commercial buildings reduce sunlight in the western activity areas to less than 3 h at winter solstice (Figure 7c), while the eastern traditional garden areas receive over 6 h (Figure 7d), creating imbalanced light distribution and further weakening winter microclimate comfort.
These climatic deficiencies were systematically captured through the overlay analysis framework. CFD wind speed mapping combined with solar duration analysis revealed critical conflict zones where stagnant wind areas (<0.5 m/s) coincided with excessive shading (>6 h), creating compound thermal discomfort zones covering approximately 18% of the site. This overlay analysis directly informed the subsequent optimization strategy targeting ventilation corridor establishment and terrain elevation interventions.
Health performance: User experience and health safety show multiple deficiencies, primarily reflected in unbalanced accessibility, high crowding risk, and low convenience. Spatial accessibility analysis based on 155 convex spatial units (Table A1) shows a mean RA (relative asymmetry) of approximately 0.092, with a maximum–minimum difference of 0.0697 (Unit 151:0.1306 vs. Unit 78: 0.0609), indicating significant differences in spatial permeability (Figure 8a,b). The health performance diagnosis employed multi-layer spatial analysis to identify accessibility-density conflicts.
Crowding risk is highlighted by DepthmapX agent-based simulations (Figure 9a): during peak hours at the western metro entrance (weekends/holidays, 18:00–20:00), 80–100 people enter every 5 min, leading to densities of 8 persons/m2. The western circular plaza disrupts natural circulation, causing backflows and intersections (Figure 9 b). Space syntax RA mapping overlaid with agent-based pedestrian flow simulation revealed that 12 spatial units with RA > 0.07 (poor accessibility) coincided with peak crowd density zones (Blue green area), creating bottleneck-isolation coupling effects. This overlay analysis quantified the spatial justice deficit, with 23% of the site experiencing simultaneous accessibility barriers and overcrowding risks, directly guiding the hierarchical pathway reorganization strategy.
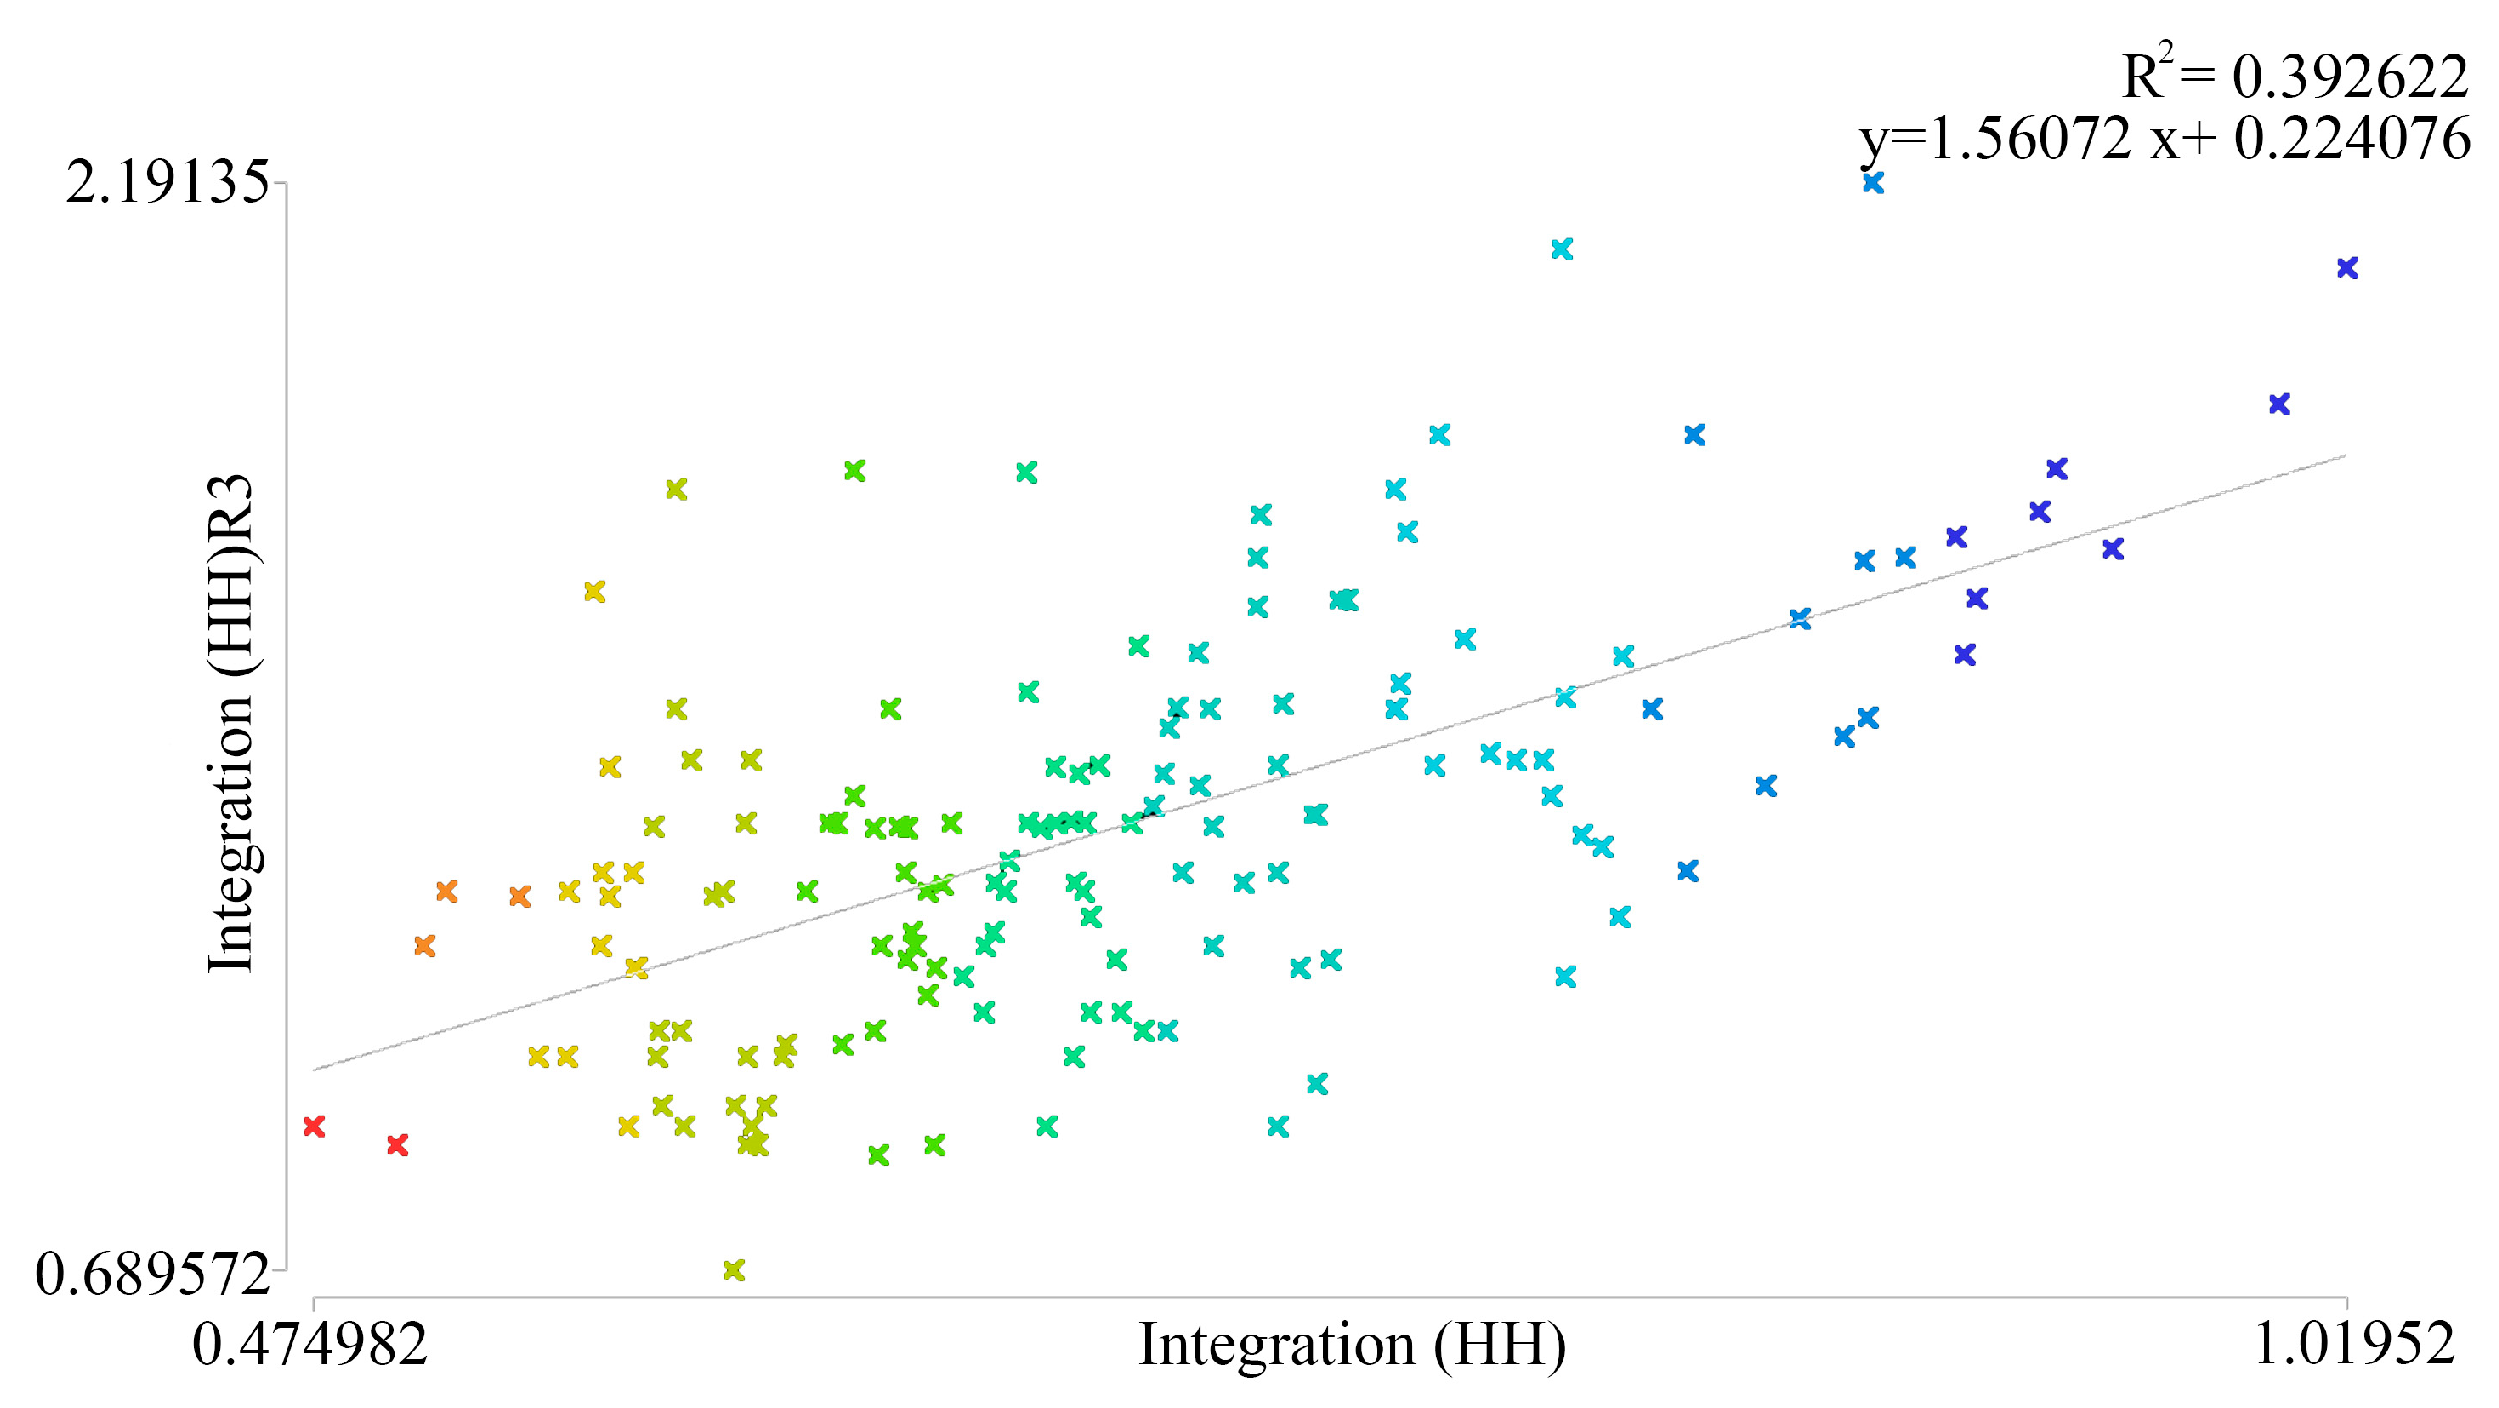
Global integration (HH) versus local integration (HH-R3) has a low R2 of 0.39 (Figure 10), reflecting a fragmented network: highly integrated areas are concentrated in the north, while accessibility in the south and southwest is weak, and weakly connected paths fail to divert pedestrian flows.
In terms of usability, Visibility Graph Analysis (VGA) conducted with DepthmapX reveals weak east–west visual connectivity (Figure 11a). The western circular space predominantly falls within low-visibility (deep blue) zones, where the hierarchy between primary and secondary paths is indistinct, thereby heightening congestion risks. These visual constraints particularly affect elderly and child users, who are more susceptible to disorientation, further intensifying accessibility barriers (Figure 11b). The viewshed analysis demonstrates a marked contrast between high-visibility zones (yellow and green) and blind spots (dark blue). To mitigate these shortcomings, spatial interventions are recommended, including the adjustment of hedge boundaries, removal of obstructive structures, and the establishment of visual corridors to enhance transparency, navigability, and overall wayfinding efficiency.
Resilience performance: The site demonstrates weak capacity to respond to external changes and internal demands, with core deficiencies in spatial structure, resource adaptation, and extreme weather preparedness. Structurally, the 155 spatial units (including four main functional units) are highly fragmented, and the fractured road network lacks integration. DepthmapX axial analysis confirms this weakness: global Integration (HH) shows activity concentrated in the north, while the south and southwest remain poorly connected (Figure 12a); the scatterplot comparing Integration (HH) and local Integration (HH-R3) reveals a low fit (R2 = 0.29), indicating significant network fragmentation and insufficient global–local coordination (Figure 12b).

4.2. Core Optimization Strategies

Based on multi-layer overlay analysis (Figure 13), optimization strategies were developed to enhance the three-dimensional PBUD performance—climate, health, and resilience—through coordinated interventions. Figure 13 establishes the methodological bridge between diagnosis and design intervention. The framework operates through three integrated steps: (1) Grid Standardization converts heterogeneous environmental data into comparable risk/optimization zones using evidence-based thresholds—pedestrian risk zones (RA > 0.07), wind risk zones (>4 m/s or <0.5 m/s (stagnant)), and shadow duration (>6 h); (2) Multi-Layer Overlay spatially superimposes these classified layers to reveal compound problem areas where multiple deficits converge—such as zones experiencing simultaneous thermal discomfort, accessibility barriers, and spatial fragmentation; (3) Strategy Generation translates these overlay findings into coordinated spatial interventions that address multiple performance dimensions simultaneously. This systematic overlay logic ensures renewal strategies target root causes rather than isolated symptoms. Spatial navigation proved complex and highly vulnerable to disruption, with congestion unable to be relieved through alternate routes due to fragmented connectivity. Resource adaptation analysis revealed critical shortcomings: Suric Sun winter solstice simulations indicated that 26% of activity areas receive less than 3 h of sunlight, with western areas severely shaded by a 266 m supertall tower, while shadows from adjacent 24 m commercial buildings further reduced effective greenery and landscape space, creating a significant mismatch between solar resources and user needs.
The system’s extreme weather response capabilities were particularly inadequate, lacking adaptive buffering mechanisms such as shading facilities for high temperatures (causing site usage to drop to 30%) and dedicated evacuation routes for heavy rain scenarios. Fragmented connectivity and obstructed sightlines, especially east–west visual blockages, further compromised evacuation efficiency. Additionally, winter static wind zones (<0.5 m/s) and summer strong wind zones (>4 m/s) lacked appropriate transitional functional spaces, while limited spatial integration prevented rapid reconfiguration, leaving the site unable to accommodate dynamic user needs under varying climatic conditions.
In response to these identified deficiencies, comprehensive optimization strategies were developed to enhance the three-dimensional PBUD performance—climate, health, and resilience—through coordinated interventions that address spatial fragmentation, resource distribution, and adaptive capacity simultaneously.
  • Climate Performance Optimization
Based on the updated wind environment simulation results (Figure 14), the optimization strategies demonstrate significant effectiveness. In the southeast wind-dominated simulation (Figure 14a), by maintaining 3-meter-wide continuous green corridors aligned with the prevailing summer southeast winds (30°), airflow is successfully channeled into the central area, with average wind speeds controlled at 0.7 m/s and maximum wind speeds reduced from previously extreme values to 2.5 m/s. The strategic use of tall deciduous trees (Cinnamomum camphora, 8–12 m height) along 3-meter-wide green corridors helps guide southeast winds while providing seasonal shade. Mixed camphor-holly tree-shrub belts in buffer zones further moderate wind speeds in previously problematic areas. In urban heat conflict zones (high solar exposure + strong winds + low accessibility), the introduction of undulating terrain and clustered vegetation effectively prevents vortex formation and enhances thermal regulation.
The north wind-dominated simulation (Figure 14b) shows more favorable wind environment improvements, with overall wind speed distribution becoming more uniform and maximum wind speeds being reduced to 3.2 m/s. The proportion of comfortable wind speed zones (0.5–1 m/s) has significantly increased to over 30%, primarily distributed in the central and southern areas of the site (shown in green and light blue zones). In the previously problematic north–south commercial street strong wind areas (>4 m/s), the installation of mixed camphor and holly tree-shrub belts successfully controls wind speeds within the 2–3 m/s range (shown in yellow-green zones), effectively mitigating interference with outdoor activities.
In winter-dominated north wind zones, edge grass mounds demonstrate clear effectiveness in buffering direct wind exposure, while low-wind areas (<0.5 m/s) are appropriately utilized for flexible activity spaces. The western topography elevation strategy effectively alleviates shading impacts from the adjacent 266-m supertall building, achieving optimized balance in sunlight distribution.
2.
Health Performance Optimization
The updated crowd flow simulation demonstrates significant improvements in spatial accessibility and circulation efficiency (Figure 15). The 1–2 h pedestrian flow path analysis (Figure 15a) reveals enhanced movement patterns, where high-density flow areas (red zones) now form coherent corridors connecting key activity nodes, whereas secondary circulation routes (blue paths) provide effective distribution throughout the site, eliminating previous bottleneck conditions. The updated field of view analysis (Figure 15b) shows substantial improvements in visual connectivity, with expanded high-visibility zones (green/yellow areas) replacing previous fragmented sightlines. Strategic removal of obstructive elements and hedge boundary adjustments have successfully addressed VGA blind spots, particularly enhancing east–west visual permeability across the central zones. Spatial depth analysis (Figure 15c,d) confirms the effectiveness of space unit consolidation from 155 to 115 functional areas. The improved integration is evident through the expanded medium-depth zones (green areas) that now provide better spatial continuity, while high-integration nodes (red zones) are strategically positioned at key circulation intersections to maximize accessibility.
3.
Resilience Performance Optimization
Functional Adaptation: Flexible activity areas (e.g., skate park) are placed in winter low-wind zones (<0.5 m/s); movable shading structures are installed in high-sunlight zones (<5 h shadow) to adapt to extreme heat, raising usage rates to 75%. Western shaded areas (<3 h sunlight) are mitigated with elevated terrain and vegetative buffers (Figure 16).
Spatial Elasticity (Figure 17): A central 6 m raised green area combined with terraced performance zones and sunken plazas forms a flexible system. Networked paths connect peripheral green spaces, reducing fragmentation. Primary paths also serve as emergency evacuation routes during heavy rainfall, enhancing extreme weather resilience. Scale Coordination: Ecological corridors and soft grass mounds at high-rise boundaries create a transitional buffer, reducing building dominance. The combination of elevated and sunken terrain generates varied spatial volumes, strengthening adaptability and disturbance resistance. These strategies collectively enhance connectivity, continuity, and compositeness, achieving integrated PBUD performance improvements in high-density urban park renewal.

4.3. Quantitative Validation of PBUD Performance After Optimization

The effects of the site renewal were quantitatively verified using the same simulation tools applied before optimization—DepthmapX for space syntax, Phoenics for wind environment, and Suric Sun for sunlight analysis. Results demonstrate that the three-dimensional PBUD performance—climate, health, and resilience—achieved the preset targets, with key indicators showing substantial improvements as follows:
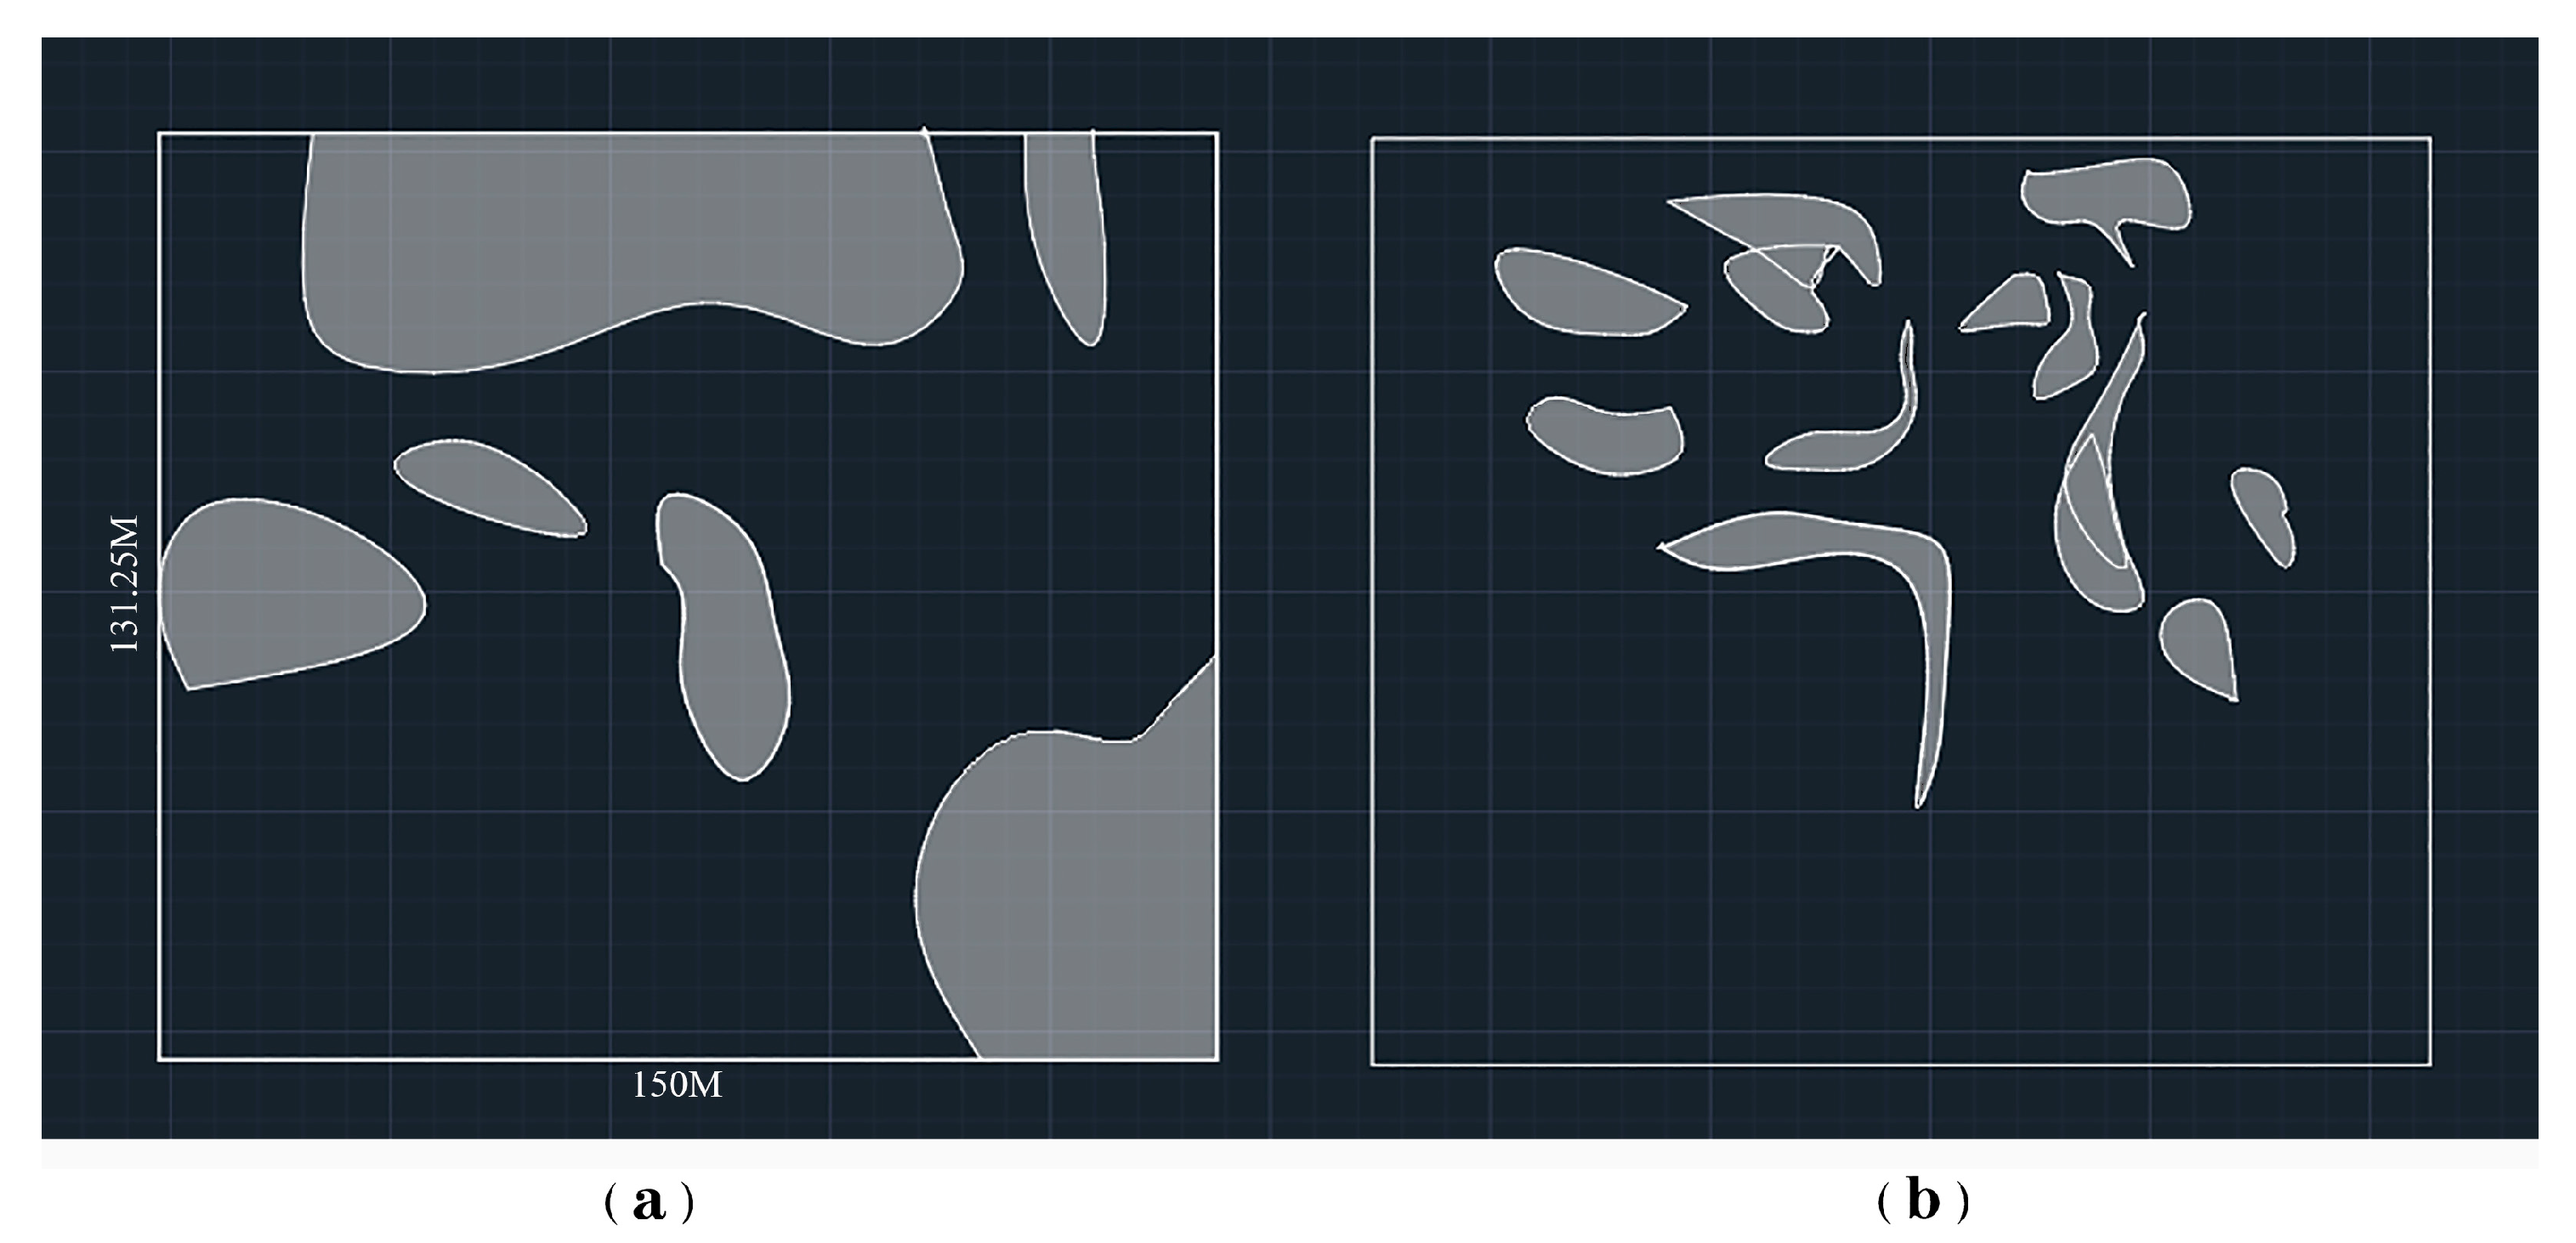
Climate Performance: Substantial Improvement in Microclimate Comfort and Regulation. Climate optimization focused on “ventilation enhancement, wind stagnation elimination, and heat island mitigation.” As demonstrated in the CAD analysis, problematic wind areas (static zones and excessive wind speeds > 4 m/s) were significantly reduced through strategic site modifications. Figure 18a shows that, before the update, areas affected by surrounding buildings had occupied about 30% of the site, while Figure 18b reveals that after applying terrain-undulation and airflow-introduction measures, windless and strong-wind zones were significantly reduced, occupying only 11% of the site, representing a 19-percentage-point improvement.
This improvement is attributed to the 3 m wide continuous green corridors guiding southeast winds, along with mixed tree–shrub belts (camphor + holly) in strong wind areas (>4 m/s), stabilizing wind speeds along main paths (0.5–1 m/s) and central activity zones (1–2 m/s), fully meeting human comfort requirements. The terrain undulations and strategic airflow introduction effectively resolved the original problematic areas, with wind shadow zones eliminated via terrain elevation and wind corridor connectivity. The combined effect of green corridors and vegetative buffers effectively reduced temperature differences with surrounding built areas, significantly enhancing thermal regulation and achieving optimal microclimate conditions across 89% of the park area. The design shifted from scattered tree placement to functional zoning: wind corridor vegetation (deciduous trees with 8–10 m spacing) along southeast wind paths, dense multi-layered buffer vegetation (trees + shrubs + groundcover) along commercial streets, and clustered planting (>60% canopy coverage) in the southwest thermal island zones. This systematic vegetation strategy directly supported the measured microclimate improvements.
Health Performance: Enhanced Accessibility, Safety, and Sunlight Exposure. The health performance evaluation focuses on three core indicators: “pedestrian flow management, spatial accessibility, and sunlight adaptation.” Analysis of red zones in pedestrian flow comparison maps during peak traffic hours reveals that before the renovation, the site suffered from poor east–west connectivity, with pedestrian congestion areas covering 3038 square meters (15.6% of the total site area) (Figure 19a). After the renovation, under high pedestrian flow patterns, the red and yellow-green high-density pedestrian areas expanded to 3798 square meters (19.5% of the site area) (Figure 19b). This represents a 25% increase in the effective area for accommodating pedestrian gathering and circulation, significantly enhancing the site’s pedestrian capacity and accessibility.
Reorganized circulation (main paths 5–8 m; secondary paths 3 m) with direct connections from the west entrance to the central area eliminated flow conflicts, confirmed by DepthmapX agent-based simulation. Space syntax metrics improved: RA (relative asymmetry) mean increased from 0.0921 (Table A1) to 0.0904 (Table A2) (−1.8%), achieving the accessibility target; consolidated 40 space units showed a more balanced RA distribution, with reduced disparity between maximum and minimum values, enhancing spatial permeability and wayfinding. Global (HH) and local integration (HH-R3) correlation R2 jumped from 0.39 to 0.64 (+64.1%), exceeding the target (≥0.6), effectively repairing the previously fragmented network and improving pedestrian flow efficiency.
Sunlight optimization significantly reduced the proportion of activity areas receiving less than 3 h of sun on the winter solstice from 26% to 19%. As illustrated in Figure 20, the spatial distribution of shadows was consolidated. The mitigation of shading, aided by the terrain elevation against the 266 m supertall building, was pivotal. This intervention enabled 81% of activity areas to receive 5–8 h of sunlight, ensuring adequate thermal comfort in winter. The comparison shows that the updated layout expands the activity area northward into zones with longer sunshine hours, creating a more contiguous and sun-rich environment.
Resilience Performance: Enhanced Spatial Integration and Extreme Weather Adaptability. Resilience performance aimed to “eliminate fragmentation and improve elasticity.” Space units were consolidated from 155 to 115 (−25.81%), well below the ≤40 unit target, eliminating redundant transitional spaces. The four main functional units were networked, resolving landscape and functional fragmentation. The comprehensive site analysis demonstrates the systematic approach to achieving spatial integration (Figure 21). The master plan (Figure 21a) illustrates the strategic arrangement of nine key functional zones, from the West Entrance Landscape (01) to the Quiet Rest Space (09), creating a cohesive network of interconnected spaces. The site analysis diagrams (Figure 21b) reveal the multi-layered design strategy through vegetation analysis, functional zoning, and streamline optimization, where main circulation routes (solid red lines) and secondary pathways (dotted red lines) form an integrated movement network.
The design process (Figure 21c) addresses scale-related fragmentation issues through terrain undulation strategies combined with strategic greenery placement, establishing appropriate landscape enclosure relationships. The spatial analysis (Figure 21d) showcases how the undulating terrain responds to prevailing wind patterns while the central square serves as a highly accessible hub. This integrated approach transforms the previously fragmented landscape into a resilient, adaptable system capable of accommodating diverse activities while maintaining spatial coherence during extreme weather conditions.
In summary, the optimized site achieved measurable improvements across all three PBUD performance dimensions, with all key indicators meeting or exceeding preset targets. These findings confirm the methodological rigor and practical effectiveness of the proposed framework, offering a quantifiable and verifiable reference for the sustainable renewal of aging parks in high-density urban cores.

5. Discussion

5.1. The Value of the Environmental Analysis Overlay Method Under the PBUD Framework

This study’s primary contribution lies in operationalizing PBUD theory through a novel analytical integration that addresses three fundamental gaps in existing park renewal methodologies. First, the Performance-Technology Synergy establishes a systematic correspondence between abstract PBUD dimensions and quantitative spatial analysis tools. Unlike previous studies that apply space syntax, CFD, or solar analysis in isolation, this method creates a unified analytical framework where spatial accessibility (DepthmapX), microclimate regulation (CFD-Phoenics), and environmental comfort (solar analysis) are coordinated through consistent grid-based overlay techniques. This integration enables the identification of performance conflicts—such as ventilation corridors that compromise pedestrian accessibility—that remain invisible to single-dimension approaches. Second, the Quantitative Operational Pathway introduces a replicable closed-loop methodology that transforms qualitative design intuitions into measurable performance criteria. The threshold classification system (Table 3) provides explicit quantitative targets (e.g., comfortable wind speed 0.5–2 m/s, optimal RA ≤ 0.04, resilience units ≤ 40), while the 35 cm × 40 cm grid overlay enables precise spatial mapping of performance conflicts and opportunities. This systematic approach moves beyond case-specific solutions to establish a transferable analytical protocol applicable across diverse urban park contexts. Third, the method addresses the Climate-Health-Resilience nexus through integrated performance assessment rather than sequential optimization. The overlay analysis reveals compound vulnerabilities—such as areas experiencing simultaneous thermal discomfort, accessibility barriers, and spatial fragmentation—that compromise park functionality under both routine and extreme conditions. This holistic approach enables targeted interventions that achieve multiple performance improvements simultaneously, as demonstrated by the Wuxi case study’s coordinated gains across all three PBUD dimensions.
1. Performance–Technology Synergy: Translating PBUD Theory into Spatial Practice
The method tightly couples the three-dimensional PBUD goals (climate, health, resilience) with spatial syntax (DepthmapX), CFD wind simulation (Phoenics), and sunlight analysis (Suric Sun), overcoming the limitations of single-technology approaches that tend to prioritize simulation over integrated design [79]. For example, by overlaying CFD wind fields with space syntax-based pedestrian heatmaps, conflicts between ventilation corridors and high-traffic areas were avoided, while simultaneously achieving “spatial justice” (restoring poorly connected zones), “ecological continuity” (microclimate regulation), and “functional compositeness” (flexible multi-use spaces). After optimization, the number of spatial units decreased from 155 to 115, RA mean decreased by 1.8%, confirming the alignment of PBUD performance with the core propositions of performance-oriented planning theory [16] and demonstrating the translation of abstract theory into perceptible spatial improvements.
2. Quantitative Operational Pathway: A Closed-Loop Tool of Threshold–Overlay–Feedback
The method introduces a unified 35 cm × 40 cm grid across multiple data layers (pedestrian flow, wind speed, sunlight, RA, visibility) to implement a closed-loop workflow: performance threshold classification → spatial overlay analysis → strategy generation → effectiveness validation. Thresholds explicitly define quantitative targets, e.g., comfortable wind speed 0.5–2 m/s, healthy RA 0.12–0.15, resilience units ≤ 40; overlay analysis visualizes “heat island conflict zones,” “microclimate coordination zones,” and “priority intervention zones”; feedback validation uses the same simulation tools (e.g., DepthmapX, Phoenics) to confirm results, such as R2 for HH-R3 vs. HH increasing from 0.39 to 0.64. This establishes a replicable, data-driven operational tool for rapidly guiding urban park renewal in aging high-density cores.
3. Addressing Core “Climatic–Health–Resilience” Needs
At the climatic dimension, CFD and sunlight overlays enable bioclimatic micro-applications, such as summer southeast wind guidance and winter sunlight provision. For health performance, spatial syntax and agent-based flow simulation ensure accessibility, crowd safety, and fair use. Resilience performance is supported through multi-layer overlays that inform extreme-weather adaptation measures, such as movable shading for high temperatures and emergency evacuation corridors during heavy rain. In the Wuxi case, indicators including reduced heat island intensity, lower peak crowd density, and higher usability under extreme heat demonstrate the method’s alignment with thematic objectives, offering a practical methodological reference for similar urban park renewal studies.

5.2. A Framework for PBUD Renewal Pathway for High-Density Urban Aging Parks

Based on PBUD performance improvements observed in the Wuxi case reflecting a practical translation of urban design theory, three scalable urban renewal strategies emerge [80]. First, climate–space synergy is achieved through a “ventilation corridor + solar adaptation” logic, preserving 3–5 m wide green wind corridors along the prevailing summer southeast wind to channel airflow (0.5–1.5 m/s) while planting green belts in stronger wind zones (2–4 m/s), and elevating terrain (1.2–2.5 m) to mitigate shading from the 266 m supertall building, ensuring winter solstice sunlight of 4–6 h and reducing <3 h areas from 26% to 19%, with heat conflict zones converted to ecological green belts. Second, health–accessibility is optimized via a three-tiered path hierarchy: primary paths (5–8 m) in high-integration areas connect the west metro entrance to central activity zones, secondary paths (3 m) link peripheral weakly connected areas, and tertiary paths (1–2 m) integrate with green belts and embedded seating to enhance social accessibility, dispersing crowds and supporting intergenerational interaction. Third, resilience–elasticity is promoted through spatial nesting and temporal programming, placing flexible activity zones (skate parks, extreme sports) in winter stagnation areas, movable shading in sunny zones to increase extreme heat usability, and configuring a nested structure of one main and multiple subspaces to support high- and low-intensity functions, temporal activity shifts, and age-friendly intergenerational use, fully realizing the goals of ventilation accessibility, temporal flexibility, and life-cycle continuity.
Underpinning these strategies, vegetation design serves as critical performance infrastructure [81]. The transformation from scattered single-layer planting to a functionally differentiated three-tier system directly enabled measured improvements (Figure 22). Pre-renovation monotonous tree arrangements lacked spatial hierarchy and microclimate regulation capacity (Figure 22a). Post-renovation design established: (1) wind corridor vegetation with 8–10 m tree spacing to guide airflow while permitting solar penetration; (2) multi-layered buffer zones (trees + shrubs + groundcover) moderating wind speeds along commercial streets; (3) thermal mitigation clusters with >60% canopy coverage in southwest zones. This systematic vegetation hierarchy created spatial depth and visual openness (Figure 22b). The emphasis on deciduous species (70% of tree palette) enables seasonal adaptability—summer shade combined with winter solar access—demonstrating that systematic planting constitutes measurable performance intervention in high-density park renewal.

5.3. Research Limitations and Future Directions

The existing urban park renewal performance evaluation framework still has room for development. This is particularly evident in the challenge of capturing the full spontaneity of human behavior. While our study employs agent-based modeling and heatmap validation to approximate pedestrian behavior [82], we acknowledge that human spontaneity and social appropriation of space—as exemplified by the Pruitt-Igoe complex—cannot be fully captured by quantitative models alone. Future research should integrate ethnographic observations and participatory design methods [83] to better capture the nuanced and evolving nature of lived urban experience, complementing the computational analysis presented here. Thus, the PBUD framework serves as a performance baseline rather than a deterministic prescription, allowing for adaptive and human-centered urban park design. Finally, it is important to note that this study presents a simulation-based conceptual design optimization. Its effectiveness was validated through an internal closed-loop ‘diagnosis-optimization-validation’ technical workflow but has not yet been empirically tested within a physically constructed park project. This remains a key limitation of the current study and highlights an important direction for future research.
First, in terms of climatic adaptation, most studies focus on subtropical monsoon climates (e.g., Wuxi), while validation and optimization are needed for diverse climatic conditions, such as temperate monsoon (Beijing), plateau monsoon (Kunming), and tropical (Guangzhou). Regional adjustments of comfort wind speed, sunlight duration, and shading/drainage strategies can help establish a climate-adaptive PBUD performance threshold guide.
Second, health performance quantification can be enhanced by integrating physiological data (e.g., heart rate, body temperature) collected via wearable devices with subjective comfort surveys, constructing a model linking objective indicators with human health responses. Third, the dynamic simulation capability of technical models should be strengthened by incorporating AI and machine learning, using real-time meteorological and pedestrian flow data to enable adaptive management under extreme weather and peak crowd conditions. Recent advances in machine learning applications for urban planning challenges [84] demonstrate significant potential for complex problem-solving based on experimental data in urban applications, including configurations of the built environment and architectural design.
The pathway from planning support to plan-making through AI integration [85] offers promising directions for enhancing the dynamic capabilities of performance-based urban design frameworks. Finally, PBUD core indicators (e.g., green accessibility, coverage of ventilation corridors) can be translated into urban renewal policy tools, forming a “theory–method–policy” closed loop to provide actionable and verifiable guidance for the sustainable renewal of old parks in high-density urban cores.
Despite these acknowledged limitations, the Wuxi case study provides empirical evidence supporting the potential of the Environmental Analysis Overlay Method for aging park renewal. The quantitative performance improvements are consolidated in Table 4 to summarize the observed outcomes. While these results are based on a single case and should be interpreted within the methodological constraints discussed above, the measurable gains across climate, health, and resilience dimensions suggest that the approach offers a promising framework for practitioners and researchers working in comparable high-density contexts. Further validation across diverse climatic regions and park typologies would strengthen confidence in the method’s broader applicability.

6. Conclusions

This study addressed the multifaceted challenges of renewing aging parks in high-density urban cores, where issues of climate maladaptation, public health risks, and resilience deficiencies are acutely concentrated. Using Chengzhong Park in Wuxi as a case study, this research implemented and validated a performance-based urban design (PBUD) framework through a novel “Environmental Analysis Overlay Method.” This method successfully integrated multi-source data and simulation tools—including space syntax (DepthmapX), computational fluid dynamics (CFD-Phoenics), and solar radiation analysis (Suric Sun)—within a unified spatial grid to diagnose, optimize, and quantitatively validate park renewal strategies.
The core achievement of this study lies in translating the three-dimensional PBUD objectives—Climatic, Health, and Resilience Performance—into a replicable, closed-loop technical workflow of diagnosis, optimization, and validation. The post-renewal simulation results confirm significant improvements across all targeted dimensions:
  • Climatic Performance: The proportion of comfortable wind zones (0.5–1 m/s) increased dramatically from 15% to over 30%, while stagnant wind areas were reduced from 30% to 11% (a reduction of 29 percentage points). Problematic wind areas (static zones and excessive wind speeds > 4 m/s) were reduced from 30% to 11% of the park.
  • Health Performance: Spatial accessibility was greatly improved, with the mean Relative Asymmetry (RA) decreasing from 0.0921 to 0.0904 (−1.8%) and the correlation (R2) between global and local integration rising from 0.39 to 0.64 (+64.1%). The effective area for pedestrian gathering and circulation increased by 25%. Winter sunlight exposure for activity zones was significantly increased, reducing areas receiving less than 3 h of sun on the winter solstice from 26% to 19%, while 81% of activity areas now receive 5–8 h of sunlight.
  • Resilience Performance: Spatial fragmentation was addressed by consolidating the number of spatial units from 155 to 115 (−25.81%), significantly exceeding the target reduction. The usability rate during extreme heat was dramatically improved, and the redesigned pathway network now doubles as an efficient emergency evacuation route.
The findings demonstrate that the “Environmental Analysis Overlay Method” provides an effective, quantifiable pathway for the sustainable renewal of aging urban parks. It moves beyond singular, isolated analyses to offer a holistic tool that synchronizes environmental performance with socio-spatial functionality. By establishing clear performance thresholds and a grid-based overlay system, the method enables designers and planners to identify conflict zones, prioritize interventions, and generate targeted strategies that are both scientifically grounded and practically actionable.
Notably, this study has certain limitations. First, the validation is based on a single case study; future research should apply this method across diverse geographic and climatic contexts to test its broader applicability and refine performance thresholds. Second, the CFD simulations, while rigorous, would benefit from validation with on-site sensor data to enhance accuracy. Third, the assessment of health and social performance primarily relied on quantitative spatial and flow data; integrating qualitative user feedback and physiological data (e.g., from wearable devices) would provide a more comprehensive understanding of perceived comfort and usability.
Future work should focus on expanding the case base, incorporating real-time data streams and AI-driven adaptive management for dynamic performance optimization, and translating the PBUD indicators into standardized policy tools [86]. This will further bridge the gap between theoretical research, design practice, and urban governance, ultimately supporting the development of more climate-adaptive, healthy, and resilient cities.

Author Contributions

Conceptualization, R.Z. and J.L.; methodology, R.Z. and Z.Y.; software, R.Z.; validation, R.Z. and Z.Y.; formal analysis, R.Z. and Z.Y.; investigation, R.Z. and Z.Y.; resources, R.Z. and Z.Y.; data curation, R.Z. and J.L.; writing—original draft preparation, R.Z. and Z.Y.; writing—review and editing, R.Z. and Z.Y.; visualization, R.Z.; supervision, J.L.; project administration, J.L.; funding acquisition, J.L. All authors have read and agreed to the published version of the manuscript.

Funding

This research received no external funding.

Data Availability Statement

The original contributions presented in this study are included in the article. Further inquiries can be directed to the corresponding author.

Acknowledgments

This article is based on the 2022 National Social Science Foundation Art Project “Research on Modern Jiangnan Urban Park Design”, project number (22BG124); the 2023 Jiangsu Provincial Social Science Foundation Project ‘Jiangnan Modern Ancestral Hall Architectural Design Art Research’ (Project No. 23YSB011); and the 2024 Postgraduate Research & Practice Innovation Program of Jiangsu Province’ (Project No. KYCX24_2496). We acknowledge the support of The Hong Kong Polytechnic University (PolyU) RPg Studentship. We also thank the researchers of Jiangnan University Architectural Heritage Protection Team and the PolyU Public Design Lab for their general assistance during the project.

Conflicts of Interest

The authors declare no conflicts of interest.

Appendix A

Table A1. The pre-renovation site data analysis, which includes spatial sequence number, Mean Depth, Total Depth, and RA.
No.Mean DepthTotal DepthRA
16.857142910560.076563962
27.311688411260.082505733
38.084415412450.092606738
49.077921913980.10559376
56.3181829730.069518715
66.616883310190.073423311
76.03896099300.065868773
88.129870412520.093200915
98.655843713330.10007639
108.538961413150.098548509
118.123376812510.093116038
128.038961412380.092012562
138.81818213580.10219845
148.311688412800.095577627
158.655843713330.10007639
169.298701314320.10847975
179.383116714450.10958323
187.461039111490.084458023
197.058441610870.079195313
207.058441610870.079195313
218.493506413080.097954333
226.18831169530.067821071
236.43506489910.071046598
247.110389710950.079874374
257.519480711580.085221969
266.33116879750.069688484
277.18181811060.080808081
287.512987111570.085137084
296.863636510570.076648839
307.720779411890.08785332
317.740259611920.088107973
327.753246811940.088277735
338.422078112970.097020626
34812320.09150327
357.474026211510.084627792
368.253246312710.094813682
379.448052414550.11043205
387.805194912020.088956796
396.954545510710.077837199
408.350648912860.096086919
418.59090913230.09922757
427.194805111080.080977842
438.188311612610.09396486
447.389610311380.083524317
457.331168711290.082760379
467.662337811800.087089382
479.006493613870.10466005
487.980519312290.091248624
498.714285913420.10084034
508.220779412660.094389267
518.961038613800.10406587
528.655843713330.10007639
539.461038614570.11060182
549.59090914770.11229946
559.733766614990.11416688
569.032467813910.10499957
576.26623399650.068839654
587.81818212040.089126557
598.246753712700.094728798
609.558441214720.11187505
619.95454515330.11705288
6210.29220815850.12146677
639.597402614780.11238435
649.623376814820.11272388
659.298701314320.10847975
669.233766614220.10763093
678.740260113460.10117987
689.012987113880.10474493
699.350648914400.10915881
708.902597413710.10330193
718.376623212900.09642645
729.025974313900.1049147
739.487012914610.11094134
749.740260115000.11425176
759.155843714100.10661234
769.116883314040.10610305
779.45454514560.11051694
785.65584428710.060860708
796.15584429480.067396656
806.32467569740.0696036
818.175324412590.093795091
827.519480711580.085221969
837.207792311100.081147611
847.948051912240.090824209
858.59090913230.09922757
868.487012913070.097869448
878.04545512390.092097446
887.837662212070.089381211
897.629869911750.086664967
906.902597410630.077158138
916.17532449510.067651302
926.36363659800.070112891
935.96103919180.064850181
947.207792311100.081147611
956.785714110450.075630255
967.668831311810.087174267
978.214285912650.09430439
987.876623212130.089890502
997.383116711370.08343944
1006.629869910210.073593073
1015.74025968840.06196418
1027.779220611980.088617265
1037.636363511760.086749852
1047.474026211510.084627792
1057.123376810970.080044135
1067.948051912240.090824209
1078.694805113390.10058569
1088.487012913070.097869448
1099.259739914260.10797046
1108.889610313690.10313216
1117.922078112200.090484679
1128.564934713190.09888804
1138.123376812510.093116038
1147.551948111630.085646383
1157.383116711370.08343944
1167.707792311870.087683558
1178.422078112970.097020626
1189.071428313970.10550887
1198.461038613030.097529918
1206.06493529340.066208303
1217.474026211510.084627792
1226.753246810400.07520584
1237.006493610790.078516252
1247.422078111430.083948731
1259.564934714730.11195993
1269.370129614430.10941346
1279.025974313900.1049147
1288.577921913210.099057809
1297.350649411320.083015025
1307.863636512110.089720733
1319.27272714280.10814022
1328.993506413850.10449028
1338.071428312430.092436977
1346.694805110310.074441895
1358.402597412940.09676598
1367.746753211930.08819285
1377.993506412310.091418386
1386.857142910560.076563962
1397.201298711090.081062727
1407.967532612270.091078855
1416.824675610510.076139547
1428.512987113110.098208979
1437.987012912300.091333501
1447.961039112260.090993971
1458.467532213040.097614802
1466.493506410000.071810544
1476.746753210390.075120956
1487.629869911750.086664967
1496.883116710600.076903492
15010.40259716020.12290977
15110.99350616930.13063407
15210.53896116230.1246923
1539.86363615190.11586453
1549.36363614420.10932858
1558.396103912930.096681096
Table A2. The post-renovation park area data analysis, which includes spatial sequence number, average depth, total depth, and RA.
No.Mean DepthTotal DepthRA
17.21052658220.10992082
25.74561416550.083993167
36.18421037050.091755942
45.46491246230.079024993
55.28947356030.075919889
65.11403515830.072814777
75.71929846520.083527401
84.51754385150.062257413
95.14912275870.073435798
105.00877195710.070951715
115.77192976580.084458932
125.61403516400.081664339
136.77192977720.10215805
146.46491247370.096724108
156.44736867350.096413597
166.29824547180.093774259
175.46491246230.079024993
185.13157895850.073125288
194.44736865070.061015371
204.89473685580.068933398
215.52631576300.080111787
225.88596496710.086477257
236.84210547800.1034001
245.16666655890.073746316
256.45614057360.096568853
265.25438595990.075298868
276.51754387430.097655647
286.68421037620.1006055
296.13157896990.090824403
305.07017565780.072038502
317.01754388000.1065052
325.78070166590.084614187
336.14912277010.091134913
345.68421036480.08290638
355.34210546090.07685142
365.63157896420.081974849
377.18421038190.10945506
387.50877198560.11519951
394.92105255610.069399163
404.79824545470.067225583
415.47368436240.079180248
424.8771935560.068622887
434.82456165500.067691356
445.91228066740.086943023
456.40350877300.095637321
466.61403517540.099363454
476.63157897560.099673964
486.43859677340.096258342
497.14912278150.10883404
507.18421038190.10945506
516.42982447330.096103087
527.21929848230.11007608
537.31578978340.11178388
546.38596497280.095326811
555.82456166640.085390471
565.82456166640.085390471
577.57894758640.11644155
584.85087735530.068157122
594.85964925540.068312377
605.35087736100.077006675
615.47368436240.079180248
625.63157896420.081974849
635.15789465880.073591061
645.45614056220.078869738
655.63157896420.081974849
665.22807035960.074833103
675.89473686720.086632513
686.05263146900.089427106
696.44736867350.096413597
707.18421038190.10945506
716.31578977200.094084769
725.49122816260.079490766
736.84210547800.1034001
747.28947358310.11131812
755.49122816260.079490766
765.78947356600.084769443
775.28070166020.075764634
786.59649137520.099052943
797.14035088140.10867877
805.25438595990.075298868
816.6228077550.099518709
826.07894756930.089892872
836.93859677910.1051079
846.36842117260.095016301
856.43859677340.096258342
865.96491246800.087874554
876.25438597130.092997983
885.92105256750.087098278
896.78947357740.10246856
906.42982447330.096103087
917.14035088140.10867877
927.14912278150.10883404
937.51754388570.11535476
946.78947357740.10246856
957.51754388570.11535476
967.84210548940.12109921
975.98245626820.088185064
987.71929848800.11892563
997.95614059070.12311753
1007.58771948650.1165968
1016.92982447900.10495265
1026.29824547180.093774259
1035.90350876730.086787768
1046.24561417120.092842728
1058.15789519300.12668841
1068.73684229960.13693526
1078.42105299600.13134606
1087.63157898700.11737308
1097.46491248510.11442322
1106.71052657650.10107126
1116.90350877870.10448688
1126.17543847040.091600686
1136.75438597700.10184754
1147.04385958030.10697097
1157.28947358310.11131812

References

  1. Wang, X.-J. Analysis of problems in urban green space system planning in China. J. For. Res. 2009, 20, 79–82. [Google Scholar] [CrossRef]
  2. Veal, A.J. The Use of Urban Parks. Ann. Leis. Res. 2006, 9, 245–276. [Google Scholar] [CrossRef]
  3. Sun, R.; Li, F.; Chen, L. A demand index for recreational ecosystem services associated with urban parks in Beijing, China. J. Environ. Manag. 2019, 251, 109612. [Google Scholar] [CrossRef]
  4. Choi, J.; Kim, G. History of Seoul’s Parks and Green Space Policies: Focusing on Policy Changes in Urban Development. Land 2022, 11, 474. [Google Scholar] [CrossRef]
  5. Hayward, J. Urban Parks. In Public Places and Spaces; Springer: Boston, MA, USA, 1989; pp. 193–216. [Google Scholar] [CrossRef]
  6. Honey-Rosés, J.; Anguelovski, I.; Chireh, V.K.; Daher, C.; van den Bosch, C.K.; Litt, J.S.; Mawani, V.; McCall, M.K.; Orellana, A.; Oscilowicz, E.; et al. The impact of COVID-19 on public space: An early review of the emerging questions—Design, perceptions and inequities. Cities Health 2021, 5, S263–S279. [Google Scholar] [CrossRef]
  7. Schuyler, D. The new urban landscape. In The Redefinition of City Form in Nineteenth Century America; Johns Hopkins University Press: Baltimore, MA, USA, 1986. [Google Scholar]
  8. Taylor, H.A. Urban Public Parks, 1840–1900: Design and Meaning. Gard. Hist. 1995, 23, 201–221. [Google Scholar] [CrossRef]
  9. Li, W.; Ouyang, Z.; Meng, X.; Wang, X. Plant species composition in relation to green cover configuration and function of urban parks in Beijing, China. Ecol. Res. 2006, 21, 221–237. [Google Scholar] [CrossRef]
  10. Zhang, S.; Liu, J.; Song, C.; Chan, C.-S.; Pei, T.; Wenting, Y.; Xin, Z. Spatial-temporal distribution characteristics and evolution mechanism of urban parks in Beijing, China. Urban For. Urban Green. 2021, 64, 127265. [Google Scholar] [CrossRef]
  11. Guo, Y.; Mell, I. The planning and design of good quality urban parks in China: The perspectives of technical professionals. Landsc. Res. 2021, 46, 1106–1120. [Google Scholar] [CrossRef]
  12. Long, Y.; Qin, J.; Wu, Y.; Wang, K. Analysis of Urban Park Accessibility Based on Space Syntax: Take the Urban Area of Changsha City as an Example. Land 2023, 12, 1061. [Google Scholar] [CrossRef]
  13. Huo, H.; Chen, F.; Geng, X.; Tao, J.; Liu, Z.; Zhang, W.; Leng, P. Simulation of the Urban Space Thermal Environment Based on Computational Fluid Dynamics: A Comprehensive Review. Sensors 2021, 21, 6898. [Google Scholar] [CrossRef]
  14. Askarizad, R.; Lamíquiz Daudén, P.J.; Garau, C. The Application of Space Syntax to Enhance Sociability in Public Urban Spaces: A Systematic Review. ISPRS Int. J. Geo-Inf. 2024, 13, 227. [Google Scholar] [CrossRef]
  15. Zhang, L.; Yuan, P.; Ding, Y. Evaluation and Analysis of Environmental Aging of Public Space in Cold Urban Settlements Based on Importance Performance Analysis Theory—Taking Urumqi as an Example. Buildings 2025, 15, 1225. [Google Scholar] [CrossRef]
  16. Zheng, F.; Wang, Y.; Shen, Z.; Wang, Y. Research on the Correlations between Spatial Morphological Indices and Carbon Emission during the Operational Stage of Built Environments for Old Communities in Cold Regions. Buildings 2023, 13, 2222. [Google Scholar] [CrossRef]
  17. Yang, Y.; Wang, Z.; Lin, G. Performance Assessment Indicators for Comparing Recreational Services of Urban Parks. Int. J. Environ. Res. Public Health 2021, 18, 3337. [Google Scholar] [CrossRef]
  18. Norouzi, M.; Chau, H.-W.; Jamei, E. Design and Site-Related Factors Impacting the Cooling Performance of Urban Parks in Different Climate Zones: A Systematic Review. Land 2024, 13, 2175. [Google Scholar] [CrossRef]
  19. Shi, W.; Mahdzar, S.S.; Li, W. Park Inclusive Design Index as a Systematic Evaluation Framework to Improve Inclusive Urban Park Uses: The Case of Hangzhou Urban Parks. Appl. Sci. 2023, 13, 12954. [Google Scholar] [CrossRef]
  20. Xue, F.; Luan, B.; Fan, Y.; Xie, S.; Yang, X.; Luo, J.; Zheng, R. Assessing the Lifecycle Environmental Resilience of Urban Green Infrastructures Coping with Acute Disturbances and Chronic Stresses. Water 2024, 16, 1162. [Google Scholar] [CrossRef]
  21. Cao, P.; Li, T. Optimization Study of Outdoor Activity Space Wind Environment in Residential Areas Based on Spatial Syntax and Computational Fluid Dynamics Simulation. Sustainability 2024, 16, 7322. [Google Scholar] [CrossRef]
  22. Chiesura, A. The role of urban parks for the sustainable city. Landsc. Urban Plan. 2004, 68, 129–138. [Google Scholar] [CrossRef]
  23. Low, S.; Taplin, D.; Scheld, S. Rethinking Urban Parks: Public Space and Cultural Diversity; University of Texas Press: Austin, TX, USA, 2005. [Google Scholar]
  24. Du, Y.; Zhao, R. Research on the Development of Urban Parks Based on the Perception of Tourists: A Case Study of Taihu Park in Beijing. Int. J. Environ. Res. Public Health 2022, 19, 5287. [Google Scholar] [CrossRef]
  25. Zhai, Y.; Li, K.; Liu, J. A Conceptual Guideline to Age-Friendly Outdoor Space Development in China: How Do Chinese Seniors Use the Urban Comprehensive Park? A Focus on Time, Place, and Activities. Sustainability 2018, 10, 3678. [Google Scholar] [CrossRef]
  26. Xue, S.; Yuan, L.; Wang, K.; Wang, J.; Pei, Y. Comparing the Impact of Urban Park Landscape Design Parameters on the Thermal Environment of Surrounding Low-Rise and High-Rise Neighborhoods. Forests 2023, 14, 1682. [Google Scholar] [CrossRef]
  27. Shach-Pinsly, D. Digital urban regeneration and its impact on urban renewal processes and development. Urban Plan. 2021, 6, 135–138. [Google Scholar] [CrossRef]
  28. Zhang, S.; Song, H.; Li, X.; Luo, S. Urban Parks Quality Assessment Using Multi-Dimension Indicators in Chengdu, China. Land 2024, 13, 86. [Google Scholar] [CrossRef]
  29. Li, C.; Zhang, T.; Wang, X.; Lian, Z. Site Selection of Urban Parks Based on Fuzzy-Analytic Hierarchy Process (F-AHP): A Case Study of Nanjing, China. Int. J. Environ. Res. Public Health 2022, 19, 13159. [Google Scholar] [CrossRef] [PubMed]
  30. Wang, X.; Che, B.; Lou, Q.; Zhu, R. Integrated Eye-Tracking Response Surface Analysis to Optimize the Design of Garden Landscapes. Land 2024, 13, 1045. [Google Scholar] [CrossRef]
  31. Jiang, B.; Claramunt, C. Integration of Space Syntax into GIS: New Perspectives for Urban Morphology. Trans. GIS 2002, 6, 295–309. [Google Scholar] [CrossRef]
  32. Huang, B.-X.; Chiou, S.-C.; Li, W.-Y. Accessibility and Street Network Characteristics of Urban Public Facility Spaces: Equity Research on Parks in Fuzhou City Based on GIS and Space Syntax Model. Sustainability 2020, 12, 3618. [Google Scholar] [CrossRef]
  33. Yang, X.; Xing, P. Study on the Spatial Distribution of Park Green Space in the Main Urban Area of Chengdu: Empirical and Visual Analysis Based on Big Data. Urban Archit. 2024, 21, 196–199. [Google Scholar] [CrossRef]
  34. Kai, H.; Mian, J. Research on the Sustainable Conservation of Urban Historic Environment Based on Space Syntax: A Case Study on Xiguan Historic Area in Guangzhou. New Build. 2019, 21–25. [Google Scholar] [CrossRef]
  35. Turner, A. From Axial to Road-Centre Lines: A New Representation for Space Syntax and a New Model of Route Choice for Transport Network Analysis. Environ. Plan. B Plan. Des. 2007, 34, 539–555. [Google Scholar] [CrossRef]
  36. Wang, P.; Han, L.; Hao, R.; Mei, R. Understanding the relationship between small urban parks and mental health: A case study in Shanghai, China. Urban For. Urban Green. 2022, 78, 127784. [Google Scholar] [CrossRef]
  37. Penn, A. Space syntax and spatial cognition: Or why the axial line? Environ. Behav. 2003, 35, 30–65. [Google Scholar] [CrossRef]
  38. Johnsson, C.; Camporeale, R. Exploring Space Syntax Integration at Public Transport Hubs and Public Squares Using Drone Footage. Appl. Sci. 2022, 12, 6515. [Google Scholar] [CrossRef]
  39. Hiasat, L.; Gomes Januário, P.M. The Syntactic Thermal Relationship Based on School Layouts in Jordan; CRC Press: Boca Raton, FL, USA, 2023; pp. 141–148. [Google Scholar] [CrossRef]
  40. Bo-ot, L.M.; Wang, Y.H.; Chiang, C.M.; Lai, C.M. Effects of a Green Space Layout on the Outdoor Thermal Environment at the Neighborhood Level. Energies 2012, 5, 3723–3735. [Google Scholar] [CrossRef]
  41. Ng, E. Policies and technical guidelines for urban planning of high-density cities—Air ventilation assessment (AVA) of Hong Kong. Build. Environ. 2009, 44, 1478–1488. [Google Scholar] [CrossRef]
  42. Zhang, L.; Wei, D.; Hou, Y.; Du, J.; Liu, Z.a.; Zhang, G.; Shi, L. Outdoor Thermal Comfort of Urban Park—A Case Study. Sustainability 2020, 12, 1961. [Google Scholar] [CrossRef]
  43. Xi, H.; Li, Y.; Hou, W. Impact of Environmental Factors on Summer Thermal Comfort of Ribbon Waterfront Park in Hot Summer and Cold Winter Regions: A Case Study of Hefei. Sustainability 2025, 17, 3026. [Google Scholar] [CrossRef]
  44. Feng, W.; Fei, M.; Zhen, M.; Feng, S. Digital Simulation of Wind Environment and Urban Optimization Design Strategy for Typical Blocks in Xi’an. Mod. Urban Res. 2019, 11, 35–40. [Google Scholar] [CrossRef]
  45. Yin, X.; Lu, T.; Ji, J. Sunlight Analysis Strategy in the Plan Stage: Reflections on the Teaching of “Residential Area Planning and Design” Course. Archit. Cult. 2020, 197–199. [Google Scholar] [CrossRef]
  46. Boussaidi, K.; Djaghrouri, D.; Benabbas, M.; Altan, H. Assessment of Outdoor Thermal Comfort in Urban Public Space, during the Hottest Period in Annaba City, Algeria. Sustainability 2023, 15, 11763. [Google Scholar] [CrossRef]
  47. Rosso-Alvarez, J.; Jiménez-Caldera, J.; Campo-Daza, G.; Hernández-Sabié, R.; Caballero-Calvo, A. Integrating Objective and Subjective Thermal Comfort Assessments in Urban Park Design: A Case Study of Monteria, Colombia. Urban Sci. 2025, 9, 139. [Google Scholar] [CrossRef]
  48. Sanaieian, H.; Tenpierik, M.; van den Linden, K.; Seraj, F.M.; Shemrani, S.M.M. Review of the impact of urban block form on thermal performance, solar access and ventilation. Renew. Sustain. Energy Rev. 2014, 38, 551–560. [Google Scholar] [CrossRef]
  49. Nasar, J.L.; Fisher, B. ‘Hot spots’ of fear and crime: A multi-method investigation. J. Environ. Psychol. 1993, 13, 187–206. [Google Scholar] [CrossRef]
  50. He, D.; Li, X.; Li, M. Evacuation behaviour modelling and simulation of pedestrian counter flow considering influence of visual field. J. Zhejiang Univ. (Eng. Sci.) 2020, 6, 1185–1193. [Google Scholar] [CrossRef]
  51. Ma, C.; Chen, Y.; Gao, W.; Liu, B. Optimization of Landscape Spatial Configuration and Form for Thermal Comfort: A Case Study of Urban Square, Shanghai. Atmosphere 2023, 14, 1357. [Google Scholar] [CrossRef]
  52. Mandić, L.; Đjukić, A.; Marić, J.; Mitrović, B. A Systematic Review of Outdoor Thermal Comfort Studies for the Urban (Re) Design of City Squares. Sustainability 2024, 16, 4920. [Google Scholar] [CrossRef]
  53. Li, Z.; Liang, Z.; Feng, L.; Fan, Z. Beyond Accessibility: A Multidimensional Evaluation of Urban Park Equity in Yangzhou, China. ISPRS Int. J. Geo-Inf. 2022, 11, 429. [Google Scholar] [CrossRef]
  54. Chen, K.; Xia, T.; Cao, Z.; Li, Y.; Lin, X.; Bai, R. Predictive Models for Environmental Perception in Multi-Type Parks and Their Generalization Ability: Integrating Pre-Training and Reinforcement Learning. Buildings 2025, 15, 2364. [Google Scholar] [CrossRef]
  55. Cui, H.; Maliki, N.Z.; Wang, Y. The Role of Urban Parks in Promoting Social Interaction of Older Adults in China. Sustainability 2024, 16, 2088. [Google Scholar] [CrossRef]
  56. Zhang, R.; Huang, L.; Wang, H. Accessibility Improvement and Renewal of Urban Park Green Space for the Elderly and the Disabled. Forests 2023, 14, 1801. [Google Scholar] [CrossRef]
  57. Yin, Z.; Wang, L.; Xu, Z. Retrofit-Oriented Large Parks’ Walking-Shed Evaluation—A Case Study of Rizhao, China. Land 2025, 14, 498. [Google Scholar] [CrossRef]
  58. Wang, C.; Wang, S.; Cao, Y.; Yan, H.; Li, Y. The Social Equity of Urban Parks in High-Density Urban Areas: A Case Study in the Core Area of Beijing. Sustainability 2023, 15, 13849. [Google Scholar] [CrossRef]
  59. Liao, Y.; Furuya, K. A Case Study on Children’s Accessibility in Urban Parks in Changsha City, China: Developing an Improved 2SFCA Method. Land 2024, 13, 1522. [Google Scholar] [CrossRef]
  60. Mu, B.; Liu, C.; Mu, T.; Xu, X.; Tian, G.; Zhang, Y.; Kim, G. Spatiotemporal fluctuations in urban park spatial vitality determined by on-site observation and behavior mapping: A case study of three parks in Zhengzhou City, China. Urban For. Urban Green. 2021, 64, 127246. [Google Scholar] [CrossRef]
  61. Kang, S.H.; Do, J.Y.; Kim, J.C. Impedance-derived phase angle is associated with muscle mass, strength, quality of life, and clinical outcomes in maintenance hemodialysis patients. PLoS ONE 2022, 17, e0261070. [Google Scholar] [CrossRef]
  62. Li, J.; Fu, J.; Gao, J.; Zhou, R.; Wang, K.; Zhou, K. Effects of the spatial patterns of urban parks on public satisfaction: Evidence from Shanghai, China. Landsc. Ecol. 2023, 38, 1265–1277. [Google Scholar] [CrossRef] [PubMed]
  63. Wang, Y.; Fan, Y.; Yang, Z. Challenges, Experience, and Prospects of Urban Renewal in High-Density Cities: A Review for Hong Kong. Land 2022, 11, 2248. [Google Scholar] [CrossRef]
  64. Liu, Y. Research on Landscape Design Based on CFD Numerical Simulation Technology for Outdoor Wind Environment of Buildings: A Case Study of Zhengda Feed Factory in Chuzhou City. J. Xi’an Univ. Arts Sci. (Nat. Sci. Ed.) 2021, 24, 64–68. [Google Scholar] [CrossRef]
  65. Ikegaya, N.; Ikeda, Y.; Hagishima, A.; Tanimoto, J. Evaluation of rare velocity at a pedestrian level due to turbulence in a neutrally stable shear flow over simplified urban arrays. J. Wind Eng. Ind. Aerodyn. 2017, 171, 137–147. [Google Scholar] [CrossRef]
  66. Fernandes, P.A. Space Syntax with Logic Programming: An Application to a Modern Estate. Urban Sci. 2023, 7, 78. [Google Scholar] [CrossRef]
  67. Zhou, Q.; Zheng, Y. Research on the spatial layout optimization strategy of Huaihe Road Commercial Block in Hefei city based on space syntax theory. Front. Comput. Neurosci. 2023, 16, 1084279. [Google Scholar] [CrossRef]
  68. López Baeza, J.; Carpio-Pinedo, J.; Sievert, J.; Landwehr, A.; Preuner, P.; Borgmann, K.; Avakumović, M.; Weissbach, A.; Bruns-Berentelg, J.; Noennig, J.R. Modeling Pedestrian Flows: Agent-Based Simulations of Pedestrian Activity for Land Use Distributions in Urban Developments. Sustainability 2021, 13, 9268. [Google Scholar] [CrossRef]
  69. Yuan, H.; Zhou, Y. The impact of crowds on visibility in based simulation and space syntax analysis. Front. Archit. Res. 2025, 14, 1398–1414. [Google Scholar] [CrossRef]
  70. Zhang, B.; Zhao, Y.; Liu, S. Multi-scene spatial configuration characteristics of Yongtai Zhuangzhai based on visibility graph analysis model. J. Fuzhou Univ. 2023, 51, 155–162. [Google Scholar] [CrossRef]
  71. Blocken, B.; Stathopoulos, T.; van Beeck, J.P.A.J. Pedestrian-level wind conditions around buildings: Review of wind-tunnel and CFD techniques and their accuracy for wind comfort assessment. Build. Environ. 2016, 100, 50–81. [Google Scholar] [CrossRef]
  72. Eastman, C.I. Natural summer and winter sunlight exposure patterns in seasonal affective disorder. Physiol. Behav. 1990, 48, 611–616. [Google Scholar] [CrossRef] [PubMed]
  73. Ericson, J.D.; Chrastil, E.R.; Warren, W.H. Space syntax visibility graph analysis is not robust to changes in spatial and temporal resolution. Environ. Plan. B Urban Anal. City Sci. 2020, 48, 1478–1494. [Google Scholar] [CrossRef]
  74. Wang, S.-M.; Huang, C.-J. Using Space Syntax and Information Visualization for Spatial Behavior Analysis and Simulation. Int. J. Adv. Comput. Sci. Appl. 2019, 10, 510–521. [Google Scholar] [CrossRef]
  75. Karabörk, R.N.; Yeşil, M. Evaluation of Campus Quality of Life (QCL) Through Space Syntax Analysis: The Case of Ordu University. In Architectural Sciences and Sustainable Approaches: University Campuses; Iksad Publication: Ankara, Türkiye, 2024; Volume 19, pp. 619–638. [Google Scholar] [CrossRef]
  76. Li, C.; Ma, X.; Li, Z. Axis extraction method research in space syntax. Computer Engineering and Application 2016, 52, 182–188. [Google Scholar] [CrossRef]
  77. Ostwald, M.J.; Dawes, M.J. Isovists: Spatio-Visual Mathematics in Architecture. Handb. Math. Arts Sci. 2020, 1–13. [Google Scholar] [CrossRef]
  78. Chen, X.; Hu, H.; Xu, Z.; Wu, Z.; Ma, R.; Wang, X. Wind comfort criteria and numbers of wind directions: The dual impact mechanism on pedestrian wind comfort evaluation in Qingdao, China. Build. Environ. 2025, 280, 113103. [Google Scholar] [CrossRef]
  79. Chokhachian, A.; Perini, K.; Giulini, S.; Auer, T. Urban performance and density: Generative study on interdependencies of urban form and environmental measures. Sustain. Cities Soc. 2020, 53, 101952. [Google Scholar] [CrossRef]
  80. Feitosa, F.O.; Wolf, J.H.; Lourenço Marques, J. Operationalizing spatial justice in urban planning: Bridging theory with practice. Urban Res. Pract. 2024, 17, 720–736. [Google Scholar] [CrossRef]
  81. Zhou, S.; Nijhuis, S.; Dijkstra, R. Towards a pattern language for green space design in high density urban developments. J. Urban Des. 2024, 29, 576–597. [Google Scholar] [CrossRef]
  82. Yang, S.; Dane, G.; Arentze, T.A. An agent-based model to simulate pedestrians’ affective experiences and activities for evaluating urban public space design. Cities 2025, 166, 106292. [Google Scholar] [CrossRef]
  83. Maginn, P.J. Towards more effective community participation in urban regeneration: The potential of collaborative planning and applied ethnography. Qual. Res. 2007, 7, 25–43. [Google Scholar] [CrossRef]
  84. Koutra, S.; Ioakimidis, C.S. Unveiling the Potential of Machine Learning Applications in Urban Planning Challenges. Land 2023, 12, 83. [Google Scholar] [CrossRef]
  85. Peng, Z.-R.; Lu, K.-F.; Liu, Y.; Zhai, W. The Pathway of Urban Planning AI: From Planning Support to Plan-Making. J. Plan. Educ. Res. 2023, 44, 2263–2279. [Google Scholar] [CrossRef]
  86. Batty, M. The New Science of Cities; The MIT Press: Cambridge, MA, USA, 2013. [Google Scholar] [CrossRef]
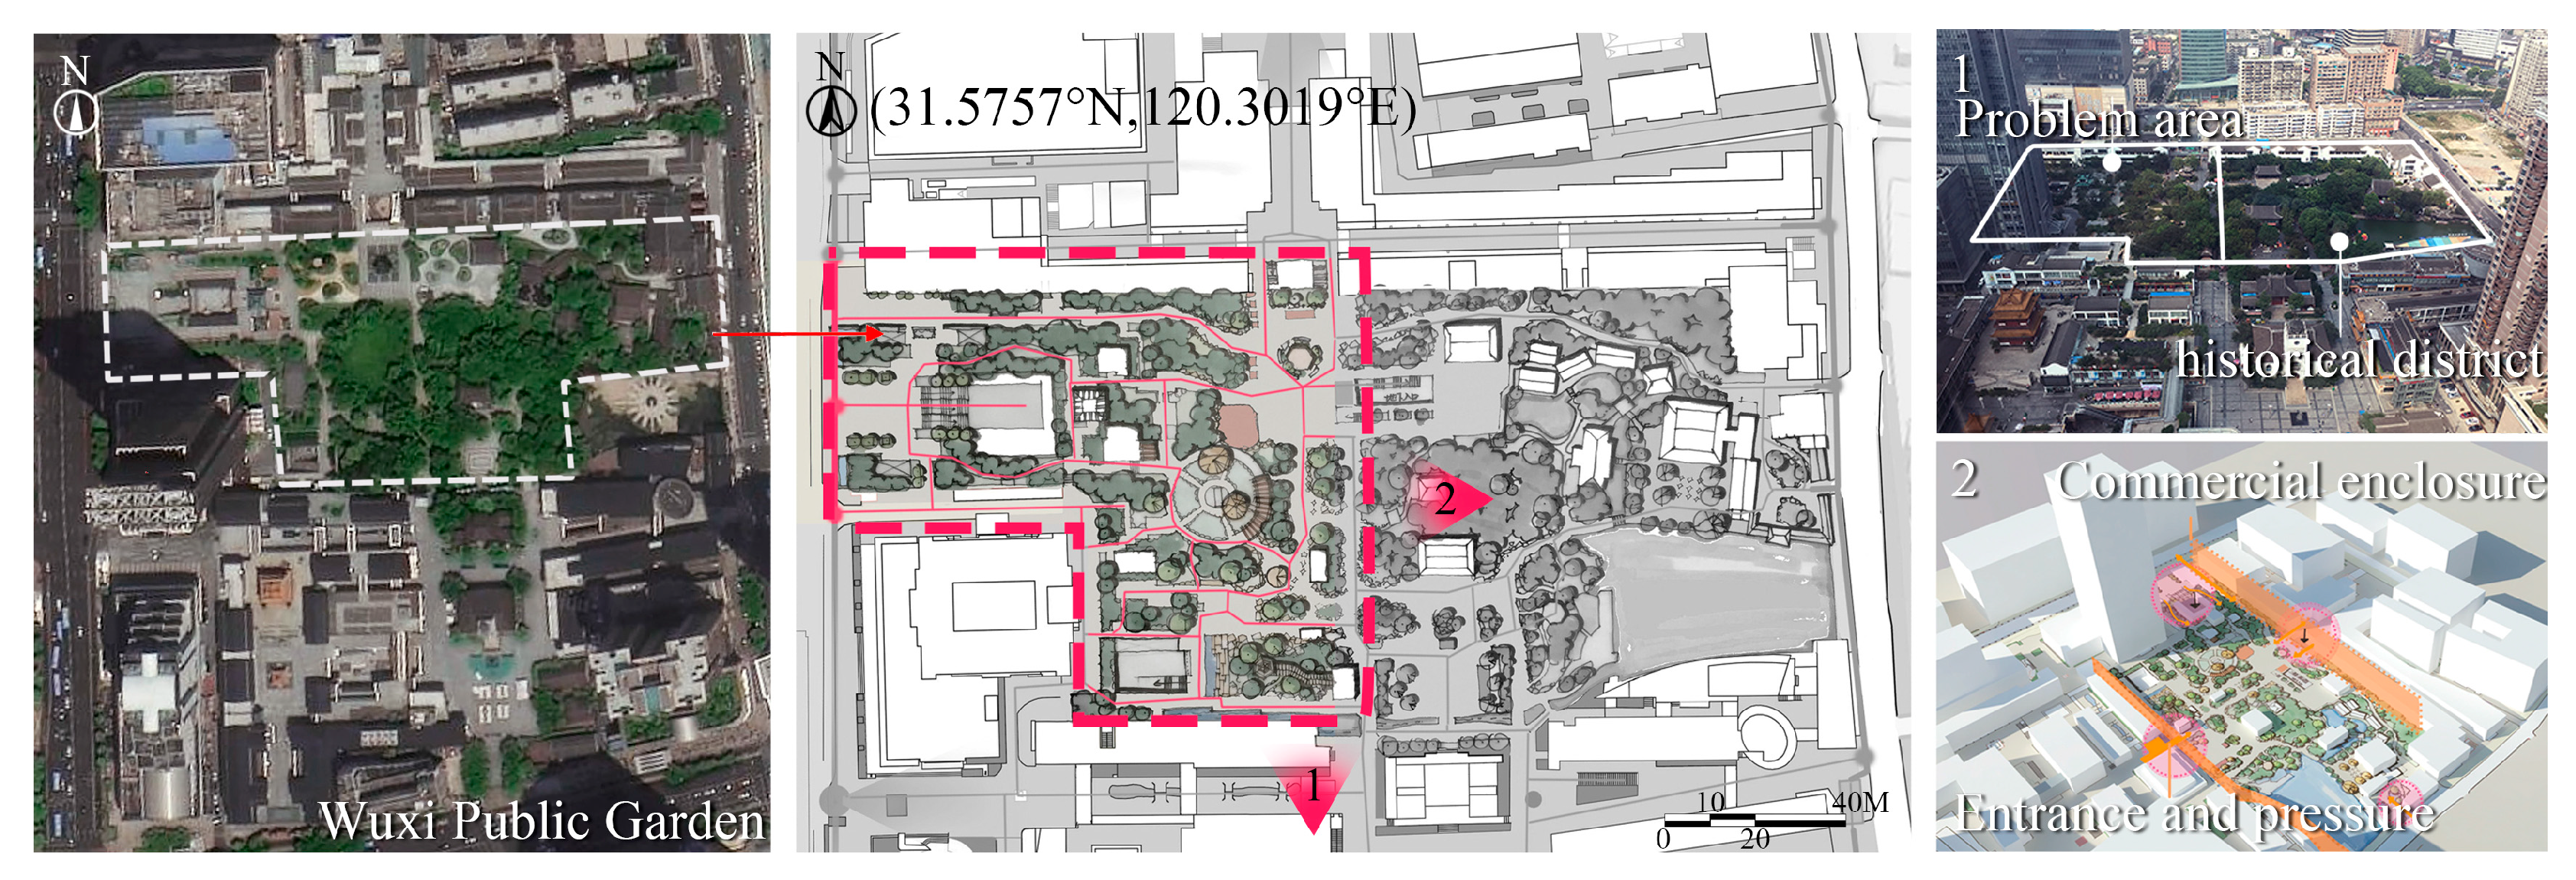
Figure 1. Location and Plan of Wuxi Public Garden (self-drawn by the author).
Buildings 15 03783 g001
Figure 2. Park area Images. (a) Commercial blocks adjacent to the public space, illustrating the high-rise building enclosure that characterizes the park’s urban context. (b) Shadow impact from the super-high-rise building on the park area (The image was taken by the author).
Buildings 15 03783 g002
Figure 3. Flowchart of spatial syntax software. (a) Convex space analysis. (b) Axis analysis (self-drawn by the author).
Buildings 15 03783 g003
Figure 4. Flowchart of spatial syntax software. (a) Population aggregation analysis. (b) View analysis (self-drawn by the author).
Buildings 15 03783 g004
Figure 5. Flowchart for Wind Environment and Sunlight Analysis. (a) Site wind analysis. (b) Site shadow analysis (self-drawn by the author).
Buildings 15 03783 g005
Figure 6. Implementation details diagram of the five-step technical workflow (self-drawn by the author).
Buildings 15 03783 g006
Figure 7. Pre-renovation Environmental Analysis. Key findings: 30% of park area experiences problematic wind conditions (stagnant < 0.5 m/s or excessive > 4 m/s), and 26% of activity areas receive <3 h of winter sunlight. (a) Summer southeast wind showing limited comfortable zones (green, only 15%). (b) Winter north wind with edge stagnation zones. (c) Summer solstice excessive sunlight in eastern areas. (d) Winter solstice severe shading from 266 m tower (self-drawn by the author).
Buildings 15 03783 g007
Figure 8. Analysis of Convex Space on the Site. (a) Analysis of 155 spaces in the pre-renovation site. (b)The subdivision of convex spaces reveals the spatial hierarchy and street network issues of the site.
Buildings 15 03783 g008
Figure 9. Pedestrian flow analysis. (a) Simulation results for 1–2 h. (b) Simulation results for 2–4 h.
Buildings 15 03783 g009
Figure 10. Integration (HH) R3/Integration (HH) scatter plot analysis of convex space on the pre-renovation site of the park (self-drawn by the author).
Buildings 15 03783 g010
Figure 11. Field View Analysis. (a) Original internal visual area analysis. (b) Analyzed the perspective of point positions (self-drawn by the author).
Buildings 15 03783 g011
Figure 12. (a) Road network connectivity analysis. (b) Scatter plot road network integration (HH) R3/integration (HH) (self-drawn by the author).
Buildings 15 03783 g012
Figure 13. Multi-Layer Performance Analysis Framework. This diagram illustrates the progression from data analysis to design intervention: Step 1 (Grid Standardization) transforms raw environmental data into standardized layers using evidence-based thresholds—risk zones; Step 2 (Multi-Layer Overlay) spatially superimposes these layers to identify critical intervention zones: problem road networks where risk factors converge and avoidance areas requiring mitigation; Step 3 (Strategy Generation) translates findings into spatial strategies—circulation relinking, functional zoning by microclimate suitability, and vertical coordination between built form and landscape (self-drawn by the author).
Buildings 15 03783 g013
Figure 14. Updated simulation of the wind environment in the study area. (a) Southeast wind dominant simulation. (b) North wind dominant simulation (self-drawn by the author).
Buildings 15 03783 g014
Figure 15. Updated simulation of crowd flow in the venue. (a) 1–2 h pedestrian flow path. (b) Updated field of view analysis. (c) Updated spatial depth analysis. (d) Scatter plot road network integration (HH) R3/integration (HH) (self-drawn by the author).
Buildings 15 03783 g015
Figure 16. Post-Renovation Solar Performance Optimization. Activity areas with <3 h winter sunlight reduced from 26% to 19%, while 81% now receive 5–8 h. (a)The venue receives sunlight on summer solstice days. (b) Sunshine on the winter solstice day (self-drawn by the author).
Buildings 15 03783 g016
Figure 17. Terrain Undulation Strategy for Resilience Performance. Vertical design creates spatial elasticity while maintaining green area foundation. (a) spatial representation of uplift and subsidence. (b) Ensure the green area foundation is maintained (self-drawn by the author).
Buildings 15 03783 g017
Figure 18. CAD analysis of static wind areas and areas with wind speeds greater than 4 m/S based on wind environment simulation. (a) The area affected by surrounding buildings before the update. (b) After the undulations of the plot, the windless areas or areas with strong winds that are introduced into the airflow are significantly reduced (self-drawn by the author).
Buildings 15 03783 g018
Figure 19. Pedestrian flow analysis during peak hours. (a) Pre-renovation congestion areas covering 3038 square meters (15.6% of site area). (b) Post-renovation expanded pedestrian zones covering 3798 square meters (19.5% of site area), showing 25% increase in effective circulation capacity (self-drawn by the author).
Buildings 15 03783 g019
Figure 20. Compare the shadow coverage of the activity area before and after the update. (a) Before the update, the coverage of the activity venue was fragmented and lacked areas with sufficient sunlight. (b) After optimization, the activity area will expand towards the northern region with longer sunshine hours (self-drawn by the author).
Buildings 15 03783 g020
Figure 21. Post-renovation Functional Composite Plan of the Park Area. (a) Overall layout and functional zoning. (b) Vegetation, function and water flow analysis. (c) Terrain treatment and spatial enclosure. (d) Activity venues and spatial organization (self-drawn by the author).
Buildings 15 03783 g021
Figure 22. Vegetation Transformation: From Ornamental to Functional Infrastructure. (a) Pre-renovation site photos showing single-layer monotonous tree planting lacking spatial hierarchy and visual openness. (b) Post-renovation effect showing three-tiered vegetation system (tall trees + mid-layer shrubs + groundcover) creating layered spatial depth and enhanced sightlines.
Buildings 15 03783 g022
Table 1. Data Collection Form.
Data TypeSourceKey ParametersCollection Period
Climate DataWuxi Liangxi District Station, China Meteorological AdministrationSummer: prevailing southeast wind 4.2 m/s, temperature 30 °C; Winter: north wind 3.9 m/s, temperature 0 °C; seasonal variation in wind direction and speedJanuary–December 2023 (four consecutive seasons)
Pedestrian Flow DataBaidu Heatmap + Field SurveysAverage daily flow: ~7500 visits; peak holiday flow: 18,000–22,000 visits; main concentrations at entrances, circular pathways, and street-facing plazasOctober–November 2023 (15 weekdays + 15 holidays)
Spatial DataWuxi Planning Institute CAD
Drawings + Field Surveys
Park boundaries (including preserved historical areas and urban square zones); building heights 18.5–266 m; subdivision of landscape and building spatial units within the parkSeptember 2023
Thermal/Solar Radiation DataSketchUp Pro + Suric Sun Plugin(31.5757° N, 120.3019° E) Summer solstice (21 June): 07:00–18:00; Winter solstice (21 December): 09:00–15:00; shadow duration grid refined to 1 m2September 2023 (post-modeling simulation)
Wind Environment DataSTL Models + Phoenics CFD SoftwareGrid resolution 0.5–1.5 m; simulation height 80 m; turbulence model: RNG k–ε; inlet wind speed 4.2 m/s; outlet zero-pressure gradient; ground rough-wall boundarySeptember 2023 (post-modeling simulation)
Table 2. The correspondence between three-dimensional performance and software technology methods.
Performance DimensionCore Technical ToolQuantified Objectives
Climatic PerformanceCFD-Phoenics 2022 (wind simulation) [64] + SketchUp Pro 2025 (Suric Sun plugin, solar analysis) [45] + AutoCAD 2024 (area calculation)
  • Improve ventilation: identify and expand comfortable wind zones (0.5–2 m/s), reduce stagnant (<0.5 m/s) and strong wind (>4 m/s) areas [65];
  • Mitigate urban heat island: achieve ≥1.5 °C temperature reduction in summer relative to surrounding built-up areas;
  • Ensure winter sunlight: guarantee ≥3 h daily solar exposure in key activity areas.
Health PerformanceSpace Syntax (DepthmapX 0.8.0; including convex space analysis, axial analysis, visibility analysis, agent-based simulation) [31] + AutoCAD 2024 (area calculation)
  • Optimize accessibility: maintain relative asymmetry (RA) of key nodes between 0.07–0.15;
  • Reduce crowding;
  • Enhance inclusivity: eliminate age-based spatial barriers.
Resilience PerformanceMulti-layer Overlay (CFD wind map + solar shadow map + pedestrian heat map + space syntax accessibility map) + AutoCAD 2024 (area calculation)
  • Identify adaptive spaces: prolonged shade zones and safe evacuation routes;
  • Integrate fragmented units: reduce fragmented areas by ≥50% to improve spatial and functional continuity.
Table 3. Performance Zoning across Density, Accessibility, Wind, and Solar Exposure.
Analysis TypeRisk ZoneOptimization ZoneTransition Zone
Space Syntax
Pedestrian Heat Map (Health) [74]
Red-orange area (congestion)Green area (comfortable flow)Yellow area (moderate flow)
Space Syntax (RA, Health) [75]
Based on percentile distribution of site-specific RA data (Table A1)
(low integration): RA > 0.07(moderate integration): 0.04 ≤ RA ≤ 0.07(Highly integrated): RA < 0.04
Space Syntax
Axis analysis [76]
(Health)
Blue line segmentRed line segmentYellow-green line segment
Space Syntax
Visual field analysis [77]
(Climatic)
Dark blue areaRed and yellow areaYellow-green area
Wind Environment [78] (Climatic)>4 m/s (strong wind risk) or <0.5 m/s (stagnant wind, heat retention)0.5–2 m/s (comfortable for core activity areas)2–4 m/s (green corridor adaptation; buffer strong winds)
Solar Exposure [72] (Shading; Climatic + Health)>6 h (cold winter spaces, reduced outdoor activity)<5 h (sufficient winter sunlight; comfortable for seasonal use)5–6 h (seasonal adaptation via deciduous trees)
Table 4. Quantitative comparison of pre- and post-renovation performance across climate, health, and resilience dimensions.
Performance DimensionKey IndicatorPre-RenovationPost-RenovationChange
ClimateComfortable wind zones (0.5–1 m/s) 15%>30%+100%
Problematic wind areas 30%11%−63%
HealthRA (Relative Asymmetry) 0.09210.0904−1.8%
Integration correlation (R2)0.390.64+64%
Effective pedestrian capacity 3038 m2 (15.6%)3798 m2 (19.5%)+25%
ResilienceNumber of spatial units 155115−26%
Activity areas with <3 h winter sunlight 26%19%−27%
Disclaimer/Publisher’s Note: The statements, opinions and data contained in all publications are solely those of the individual author(s) and contributor(s) and not of MDPI and/or the editor(s). MDPI and/or the editor(s) disclaim responsibility for any injury to people or property resulting from any ideas, methods, instructions or products referred to in the content.