Article

Noise Reducing Textile Diffuser of Building Ventilation System

1
Institute of Architecture and Construction, Kaunas University of Technology, Tunelio Str. 60, LT-44405 Kaunas, Lithuania
2
Faculty of Electrical and Electronics Engineering, Kaunas University of Technology, Studentu Str. 48, LT-51367 Kaunas, Lithuania
*
Author to whom correspondence should be addressed.
Buildings 2025, 15(20), 3775; https://doi.org/10.3390/buildings15203775
Submission received: 5 August 2025 / Revised: 26 September 2025 / Accepted: 2 October 2025 / Published: 20 October 2025
(This article belongs to the Section Building Energy, Physics, Environment, and Systems)

Abstract

The ventilation system is one of the most important elements of a building for the appropriate insurance of indoor climate parameters. Nowadays, textile ventilation systems are increasingly being used as a solution for low-energy buildings. Greater air movement and distribution in ventilation systems often leads to one of the most noticeable issues for people—increased noise in the indoor environment. One of the solutions is to use noise reducing diffusers. The aim of this research was to design and test a diffuser that fulfills noise regulations, would be light (weight less than 3 kg), be able to flexibly change geometry and have a design that harmonizes with the interior design, could be easily installed into a suspended ceiling, have a simple connection to the ventilation duct and be able to be effortlessly removed for maintenance, and be sustainable (usage of recycled materials). Three types of diffusers were created according to set characteristics and tested. The test results showed that the aim of the research was achieved—the emitted noise levels are below the regulation’s required level of less than 45 dBA. Also, it is light—the weight is 1.7 kg and 2.8 kg, respectively, for square and rectangular diffusers; has a flexible construction and design; is made from recycled materials.

1. Introduction

The functioning of a modern low-energy building is ensured by using various systems as ventilation, heating, air conditioning, etc., inside the building [1,2,3]. Passive houses (energy for heating ≤15 kWh/(m2 year)) are very tight (air exchange n50 = 0.6 1/h) [4], so indoor air quality (IAQ) and distribution to all zones at the same fresh air ratio is very important [5,6], as people spend 60–90% of their lifetime inside [3,7,8,9]. Ventilation plays an important role in maintaining healthy IAQ by diluting and flushing contaminants, and circulating fresh air throughout a building [3,6,10]. Indoor pollutant concentrations can be influenced by a variety of factors including outdoor air quality, internal pollutant sources, building airtightness and the efficiency of ventilation and passive removal processes [10]. Additionally, the airflow of ventilation systems is known to emit noise. The acoustic emissions of air diffusers (also known as outlets) have been shown to have a significant impact on perceived comfort levels [6]. With the increased demands for ventilation, the ventilation concept “Diffuse Ceiling Ventilation” (DCV) has become more well-known [11,12,13]. Today, more and more textile ventilation systems are being used as a solution for ventilation in buildings [14,15,16,17,18,19]. Different diffusers could be used, such as nozzle diffuser, slot (linear) diffuser, valve diffuser, displacement diffuser, round ceiling diffuser, square ceiling diffuser, vortex diffuser, grille diffuser, adaptive Variable Air Volume diffuser, etc., [3,20,21,22]. Various research has been conducted investigating the acoustic properties of textiles. Reto Pieren and colleagues proposed a new methodology for estimating the sound absorption of textiles, which is more accurate than existing ones due to the use of more parameters [23]. Iwan Prasetiyo and colleagues investigated the sound absorption of double-layer woven fabrics by comparing simulations and measurements and found a good match between the results [24]. G. Thilagavathi and colleagues investigated the absorption of fibrous mats and found that increasing the thickness of the sample and creating an air gap inside the sample improved sound absorption [25]. Hasan Koruk and colleagues have studied jute and Luffa fiber-reinforced biocomposites [26]. The study showed that increasing the fiber/binding ratio improves attenuation. Fujiang Chen and colleagues investigated the air distribution in a room ventilated by a fabric air dispersion system [27]. They determined that the fabric air dispersion system is a special ventilation terminal with complex physical properties compared to other conventional air diffusers. Peyman Raphe and colleagues examined the ventilation effectiveness of uniform and non-uniform perforated duct diffusers in the office room [28]. They found that distributions of the air velocity and the age of air indicate that the diffusers with the non-uniform perforations provide more uniform contours for both horizontal and vertical ventilations. The ventilation effectiveness of the diffusers has been improved using nonuniform perforations. The final results highlight an 18.4% reduction in the amount of required airflow and energy consumption by using perforated duct diffusers [28]. Fujiang Chen and colleagues performed a parametrical analysis of the characteristics of air flow generated by the fabric air dispersion system in the penetration mode [29]. It is shown that larger porosity or fiber diameter leads to lower pressure inside and poorer distribution of air velocity along the length direction of FADS. Higher supply air flow rate aggravates the nonuniformity of air velocity distribution and increases the pressure inside. The combined effects of the three factors should be taken into consideration in order to achieve a uniform distribution of air velocity along the length direction and reduce fan energy consumption and noise level [29]. Xiaoli Wang and Angui Li investigated airflow characteristics generated by fabric air dispersion ventilation [30]. The experimental results showed that this induction phenomenon can create more airflow patterns and that FADS can meet different requirements in practical engineering [30]. Fu-Jiang Chen and colleagues explored indoor air flow motion caused by the fabric air dispersion system: a simplified method for CFD simulations [31]. The results demonstrate that the mean velocity method performs, as well as the direction description, in predicting the airflow distribution generated by the fabric air dispersion system penetration mode.
The aim of this research was to design the textile diffuser which could be easily fitted and fully integrated into suspending ceilings (invisible construction); be flexibly adopted into suspending ceilings existing or new; surface of diffuser could be flexibly adjusted to ceiling design; could be in various colors; fulfill hygiene normative requirements for indoor noise levels. No information regarding textile diffusers with similar characteristics and properties was found in the analyzed scientific literature, which provided the rationale for conducting this research.

2. Samples, Test Bench, and Methodology

2.1. Samples

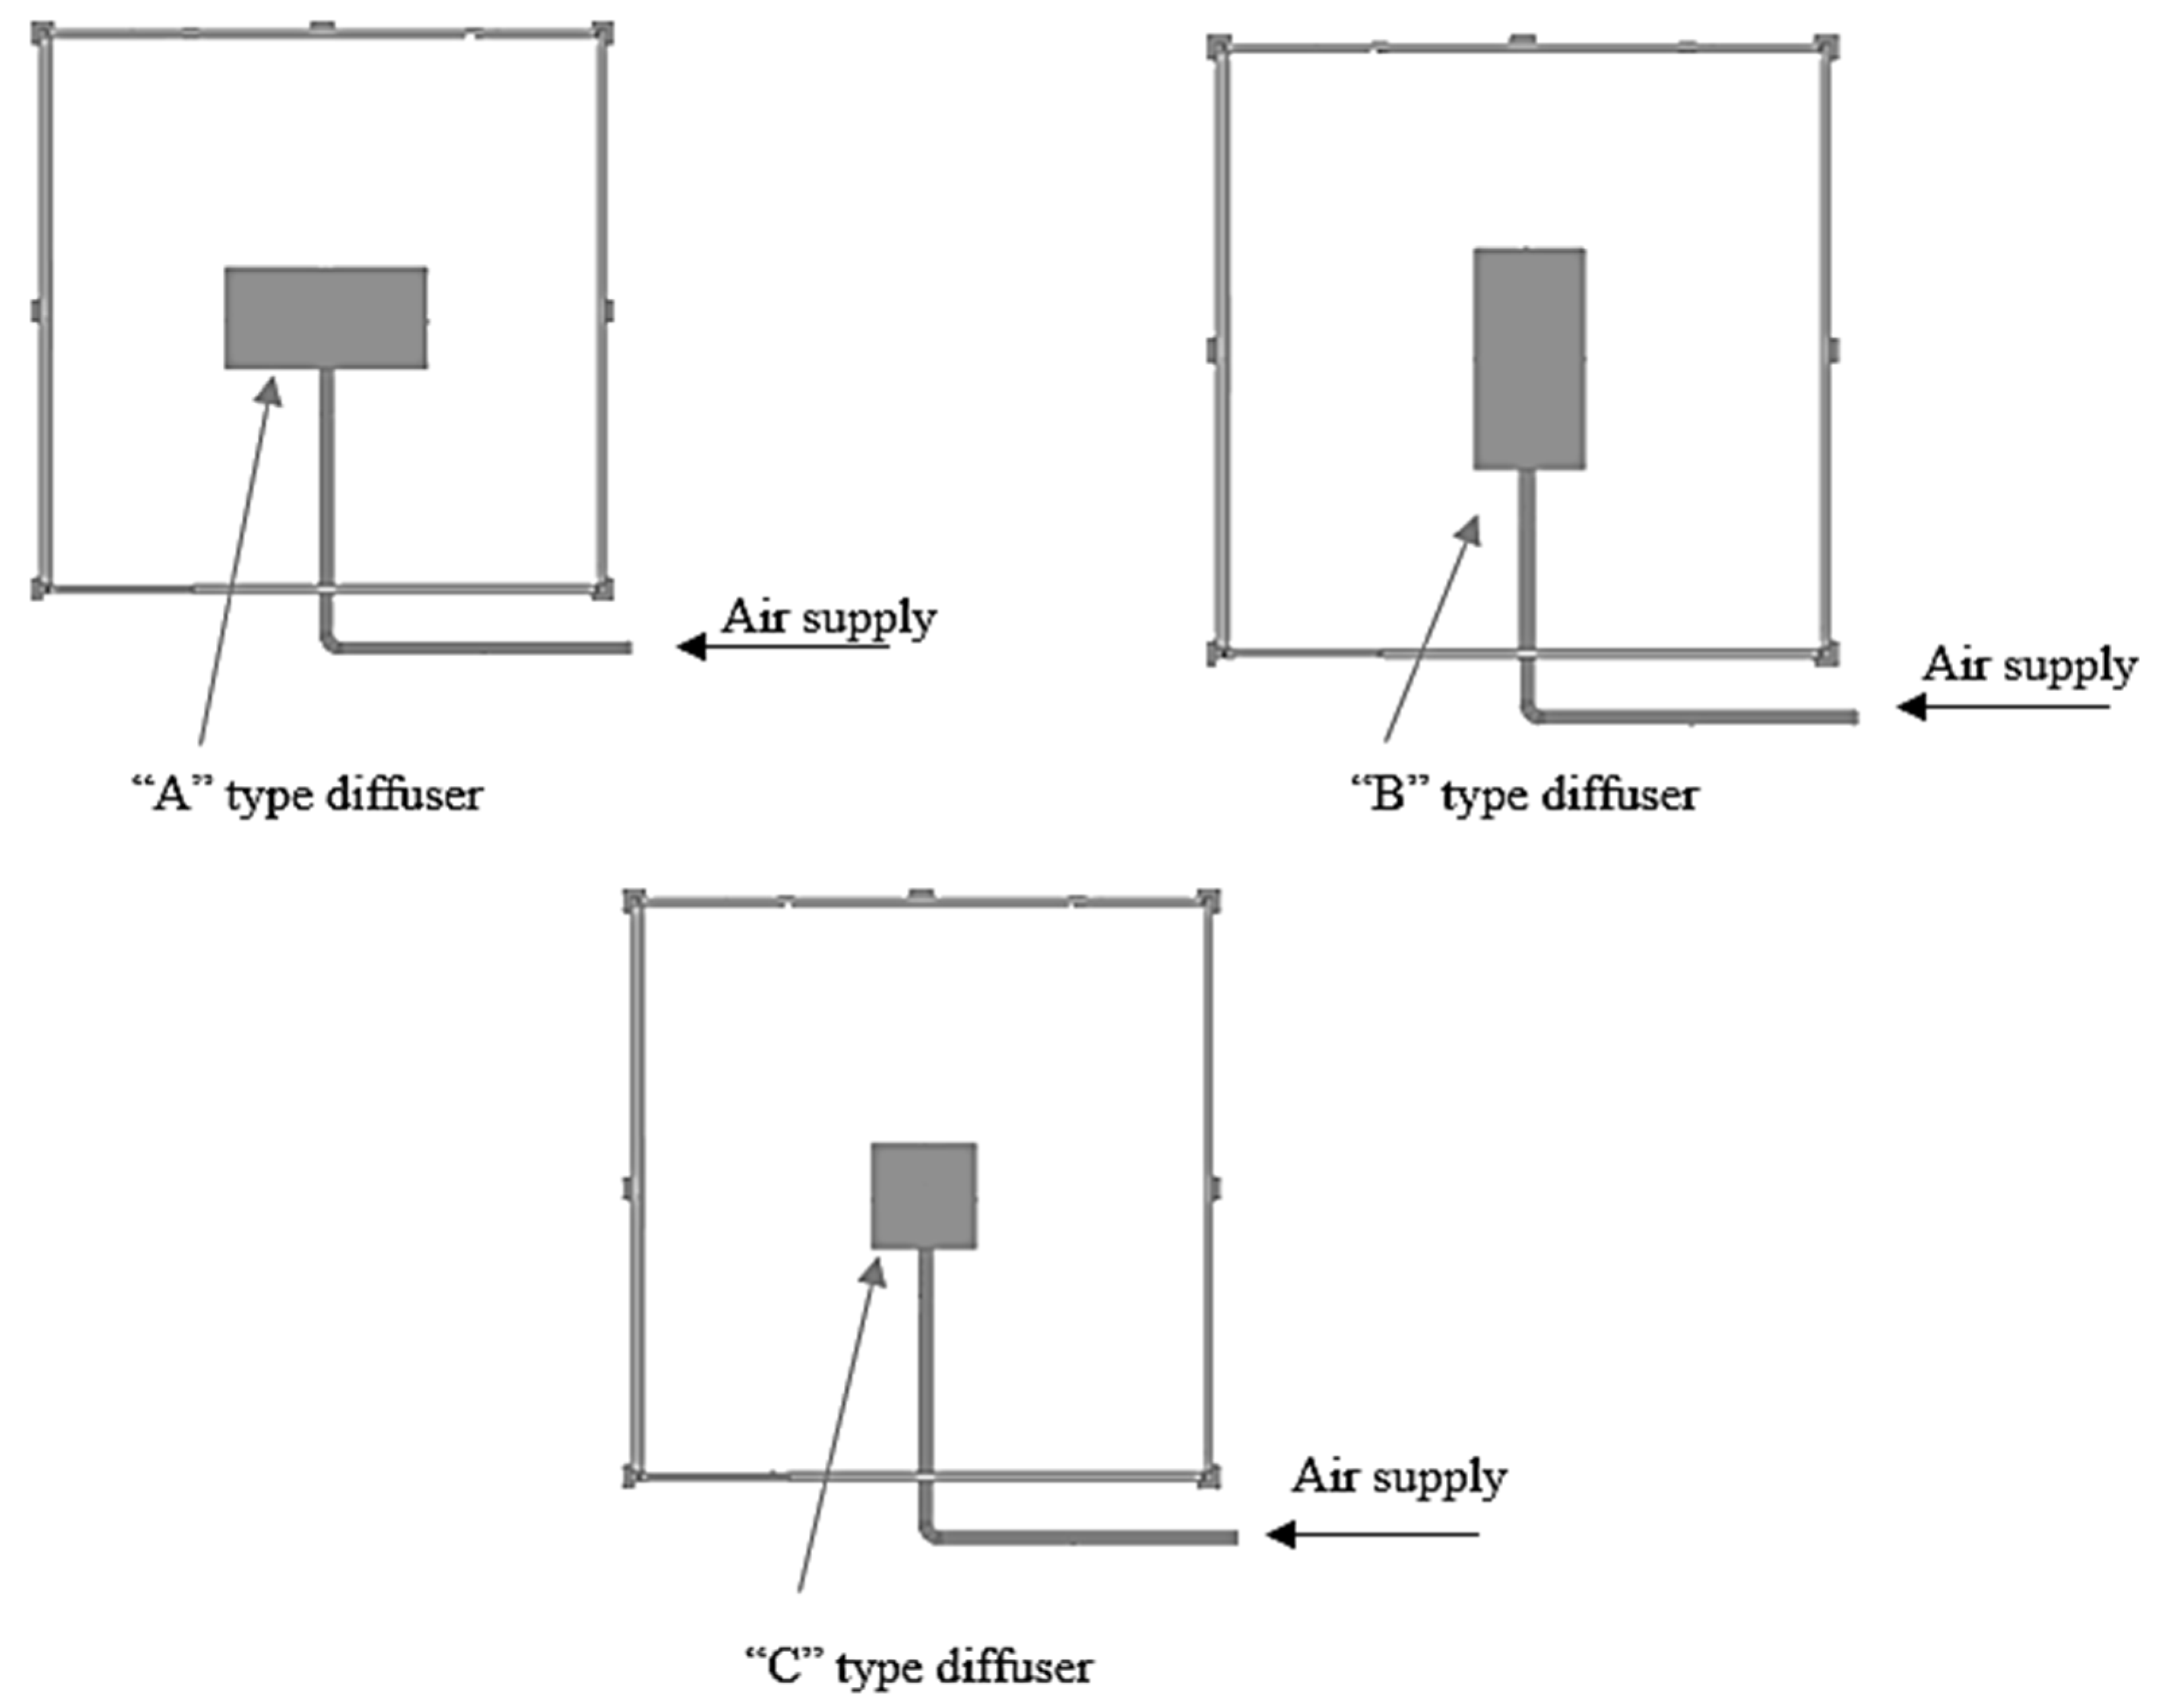
Suspended ceilings are usually divided into rectangles and/or square elements. Therefore, we decided to design and test the ceiling diffusers of rectangular and square shapes in this research. It was decided to use textile as the main material because it is light (aim to have diffuser mass less than 3 kg), easy to change shape and color (aim to flexibly change geometry and design harmonize with interior design). The textile for diffuser manufacture was taken from textile ducts production waste (aim to use recycled materials). For the research, we designed and manufactured three types of diffusers of different shape and dimensions: type ‘A’—1200 × 600 mm (air inlet at the longer edge); type ‘B’—1200 × 600 mm (air inlet at the shorter edge), and type ‘C’—600 × 600 mm (Figure 1).
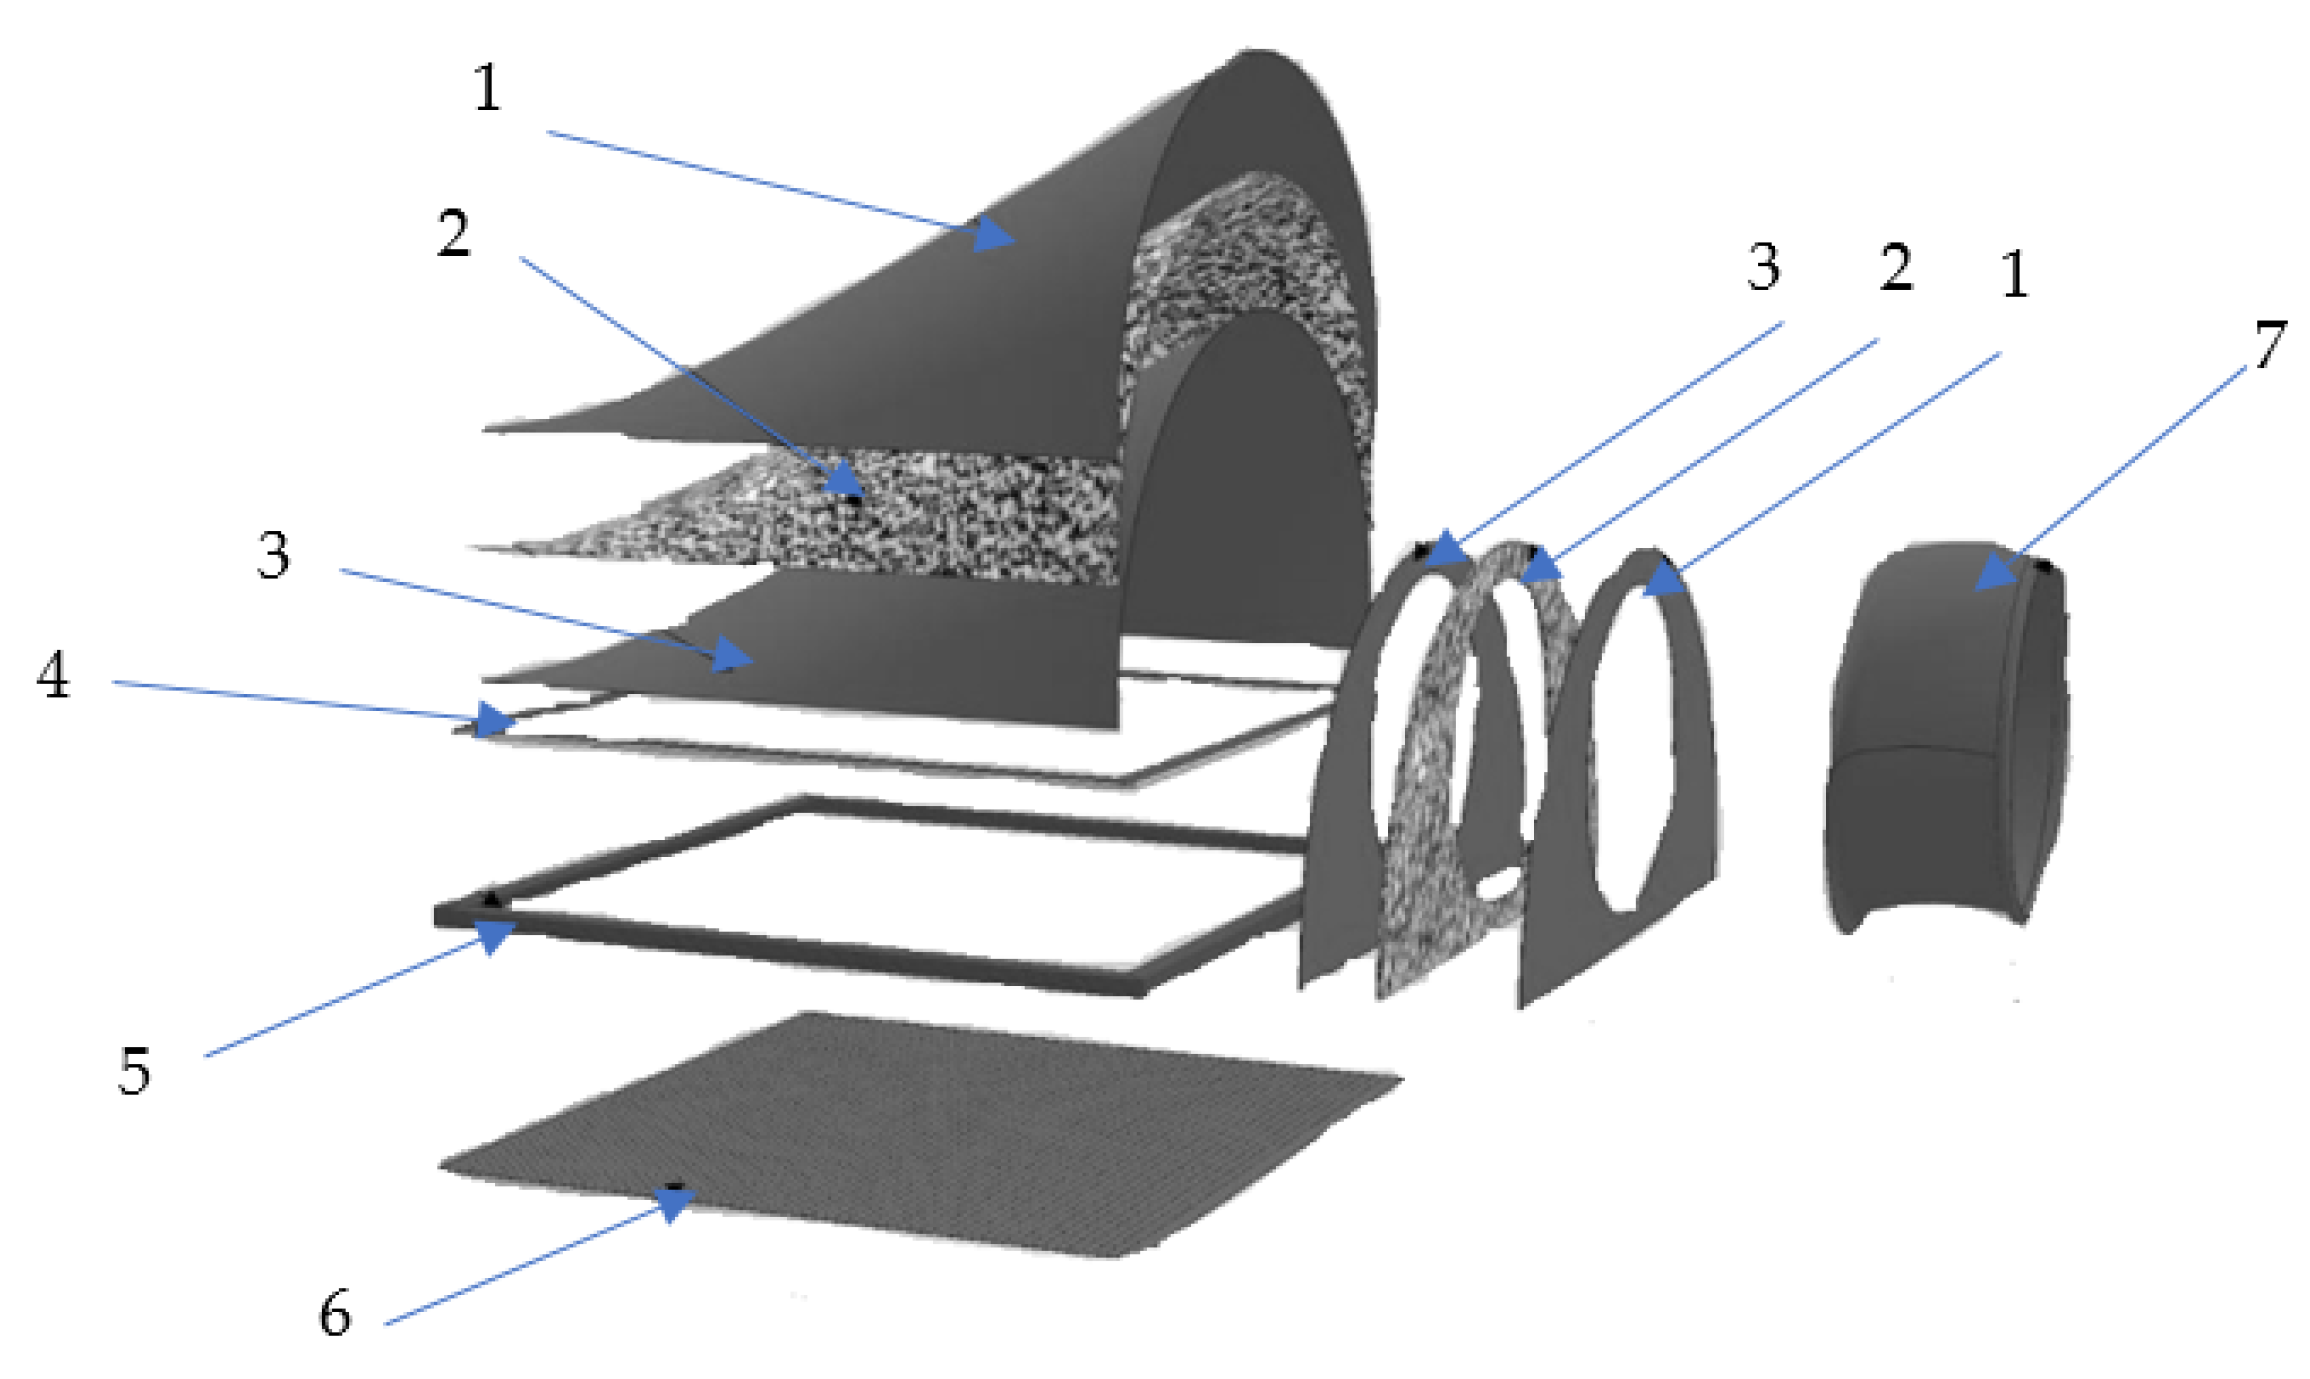
All three types of diffusers have the same construction (Figure 2). The diffusers’ walls (except lower side) are made of two layers of recycled airtight polyester fabric. Between fabric layers is installed a noise reducing mat. At the bottom of the diffuser is an aluminum frame used as support base for installation in the suspended ceiling (Figure 2). The connection with the duct at the side of the diffuser is made rig of airtight polyester fabric (Figure 2).
To ensure air pass and sufficient air supply into the room through the diffuser, 100% of the area of the lower plane fabric of rectangular and square shapes is perforated with 0.5 mm diameter holes (Figure 3).
The manufactured diffusers were tested in a custom-made test bench.

2.2. Test Bench

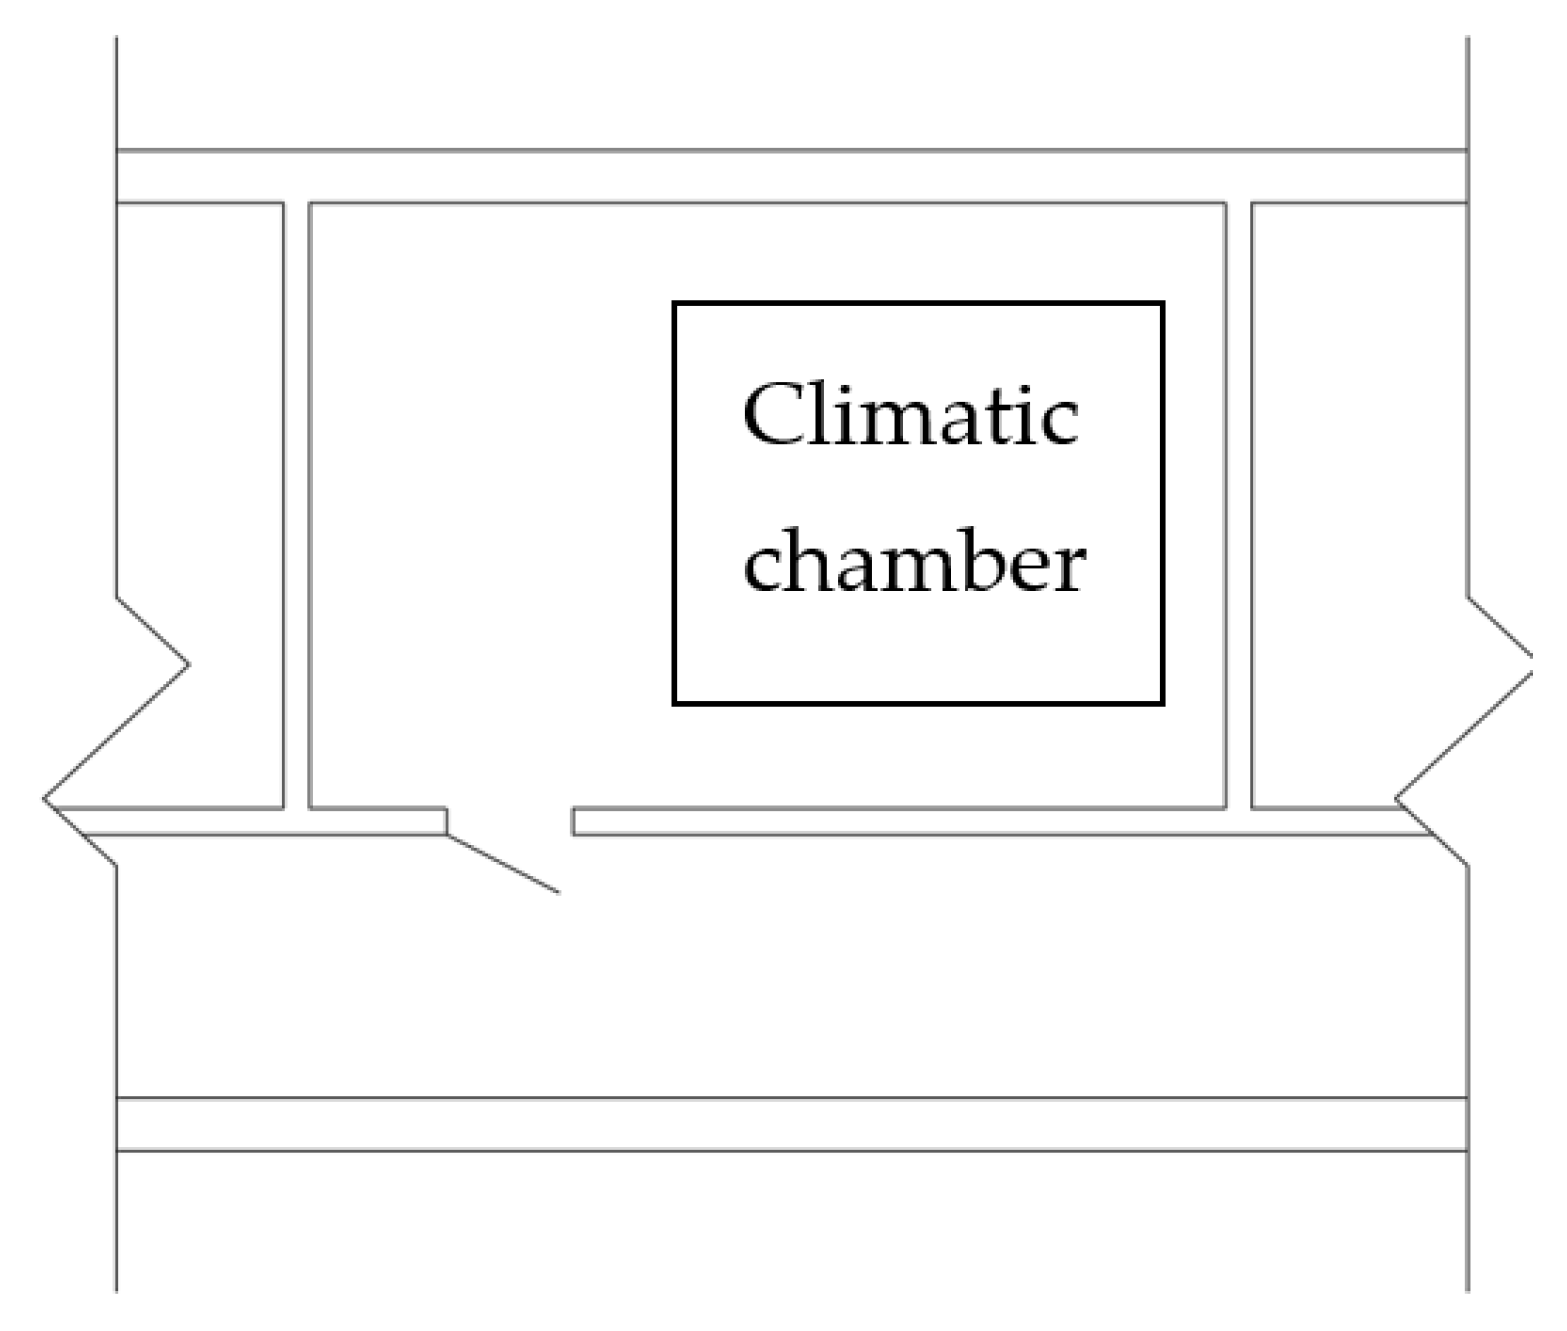
The acoustic characteristics of diffusers were determined in the custom-made climatic chamber of the Faculty of Construction and Architecture of Kaunas University of Technology. The chamber was installed inside a large laboratory room (Figure 4).
The dimensions (length/width/height) of the climatic chamber were 3.6 m × 3.6 m × 2.8 m, the floor area—12.96 m2, and the volume—36.29 m3. The chamber was made from light materials: metal frame (120 mm thickness) filled with mineral wool (120 mm thickness and density 60 kg/m3) and covered with OSB board (15 mm thickness and density 600 kg/m3) from both sides. The thickness of the walls was 150 mm. All the walls and floor surfaces of the room were rigid. A suspended ceiling was installed in the room, the tested diffusers were mounted in the center of these ceilings (Figure 5 and Figure 6).
The mechanical ventilation system was installed in the climatic chamber. The Swegon Gold PX air supply unit was located in adjacent room (on the right side) to the room where climatic chamber was installed (Figure 4). A diffuser with air supply unit was connected using metal (isolated with mineral wool 10 cm thickness) duct (125 mm diameter.)

2.3. Measurement Equipment and Methodology

A sound level meter Norsonic Nor118 with built-in real-time analyzer capabilities was used for acoustic measurements. The sound level meter had a measurement range of 120 dB and a frequency range from 6.3 Hz up to 20 kHz. The calibration of the sound level meter with verified calibrator Norsonic Nor1251 was performed each time before and after the measurement session. The acoustics measurements and calculations were performed according to standards: ISO 3741:2010 [32]; ISO 5135:2020 [33]; ISO 3382-2:2008 [34]. Using measured sound pressure level were calculated sound power level (Lw) and equivalent sound level (Leq).
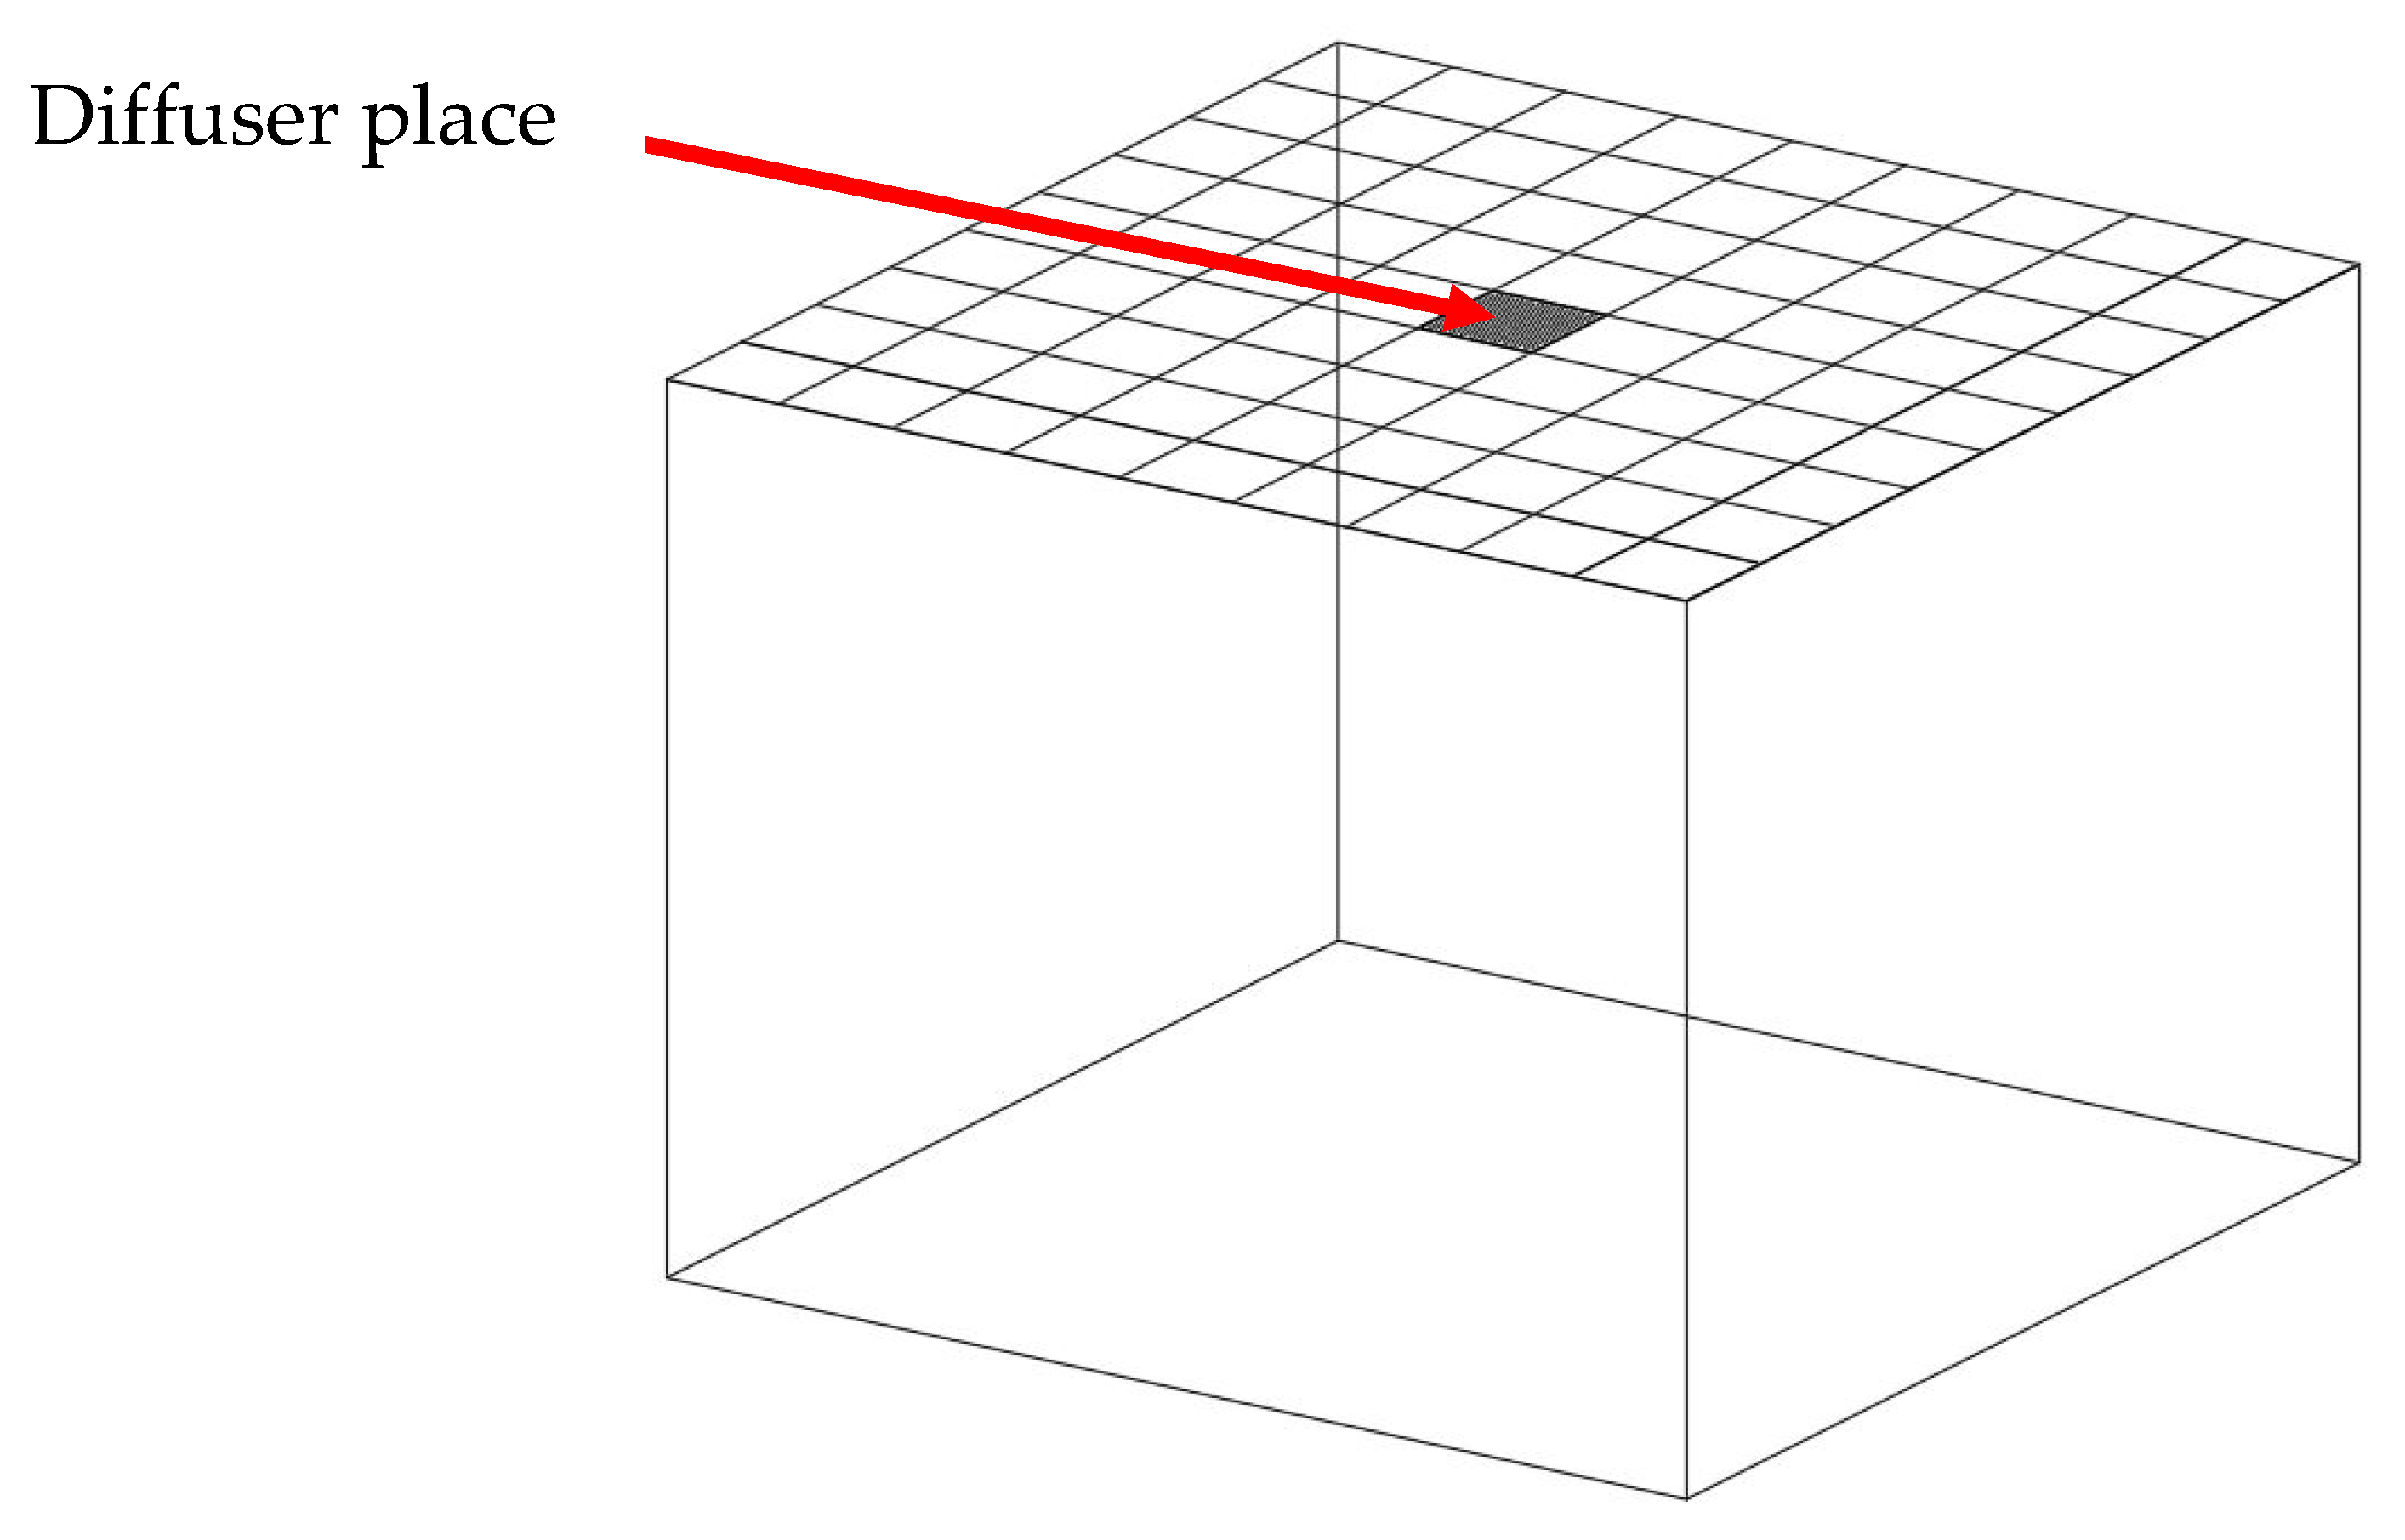
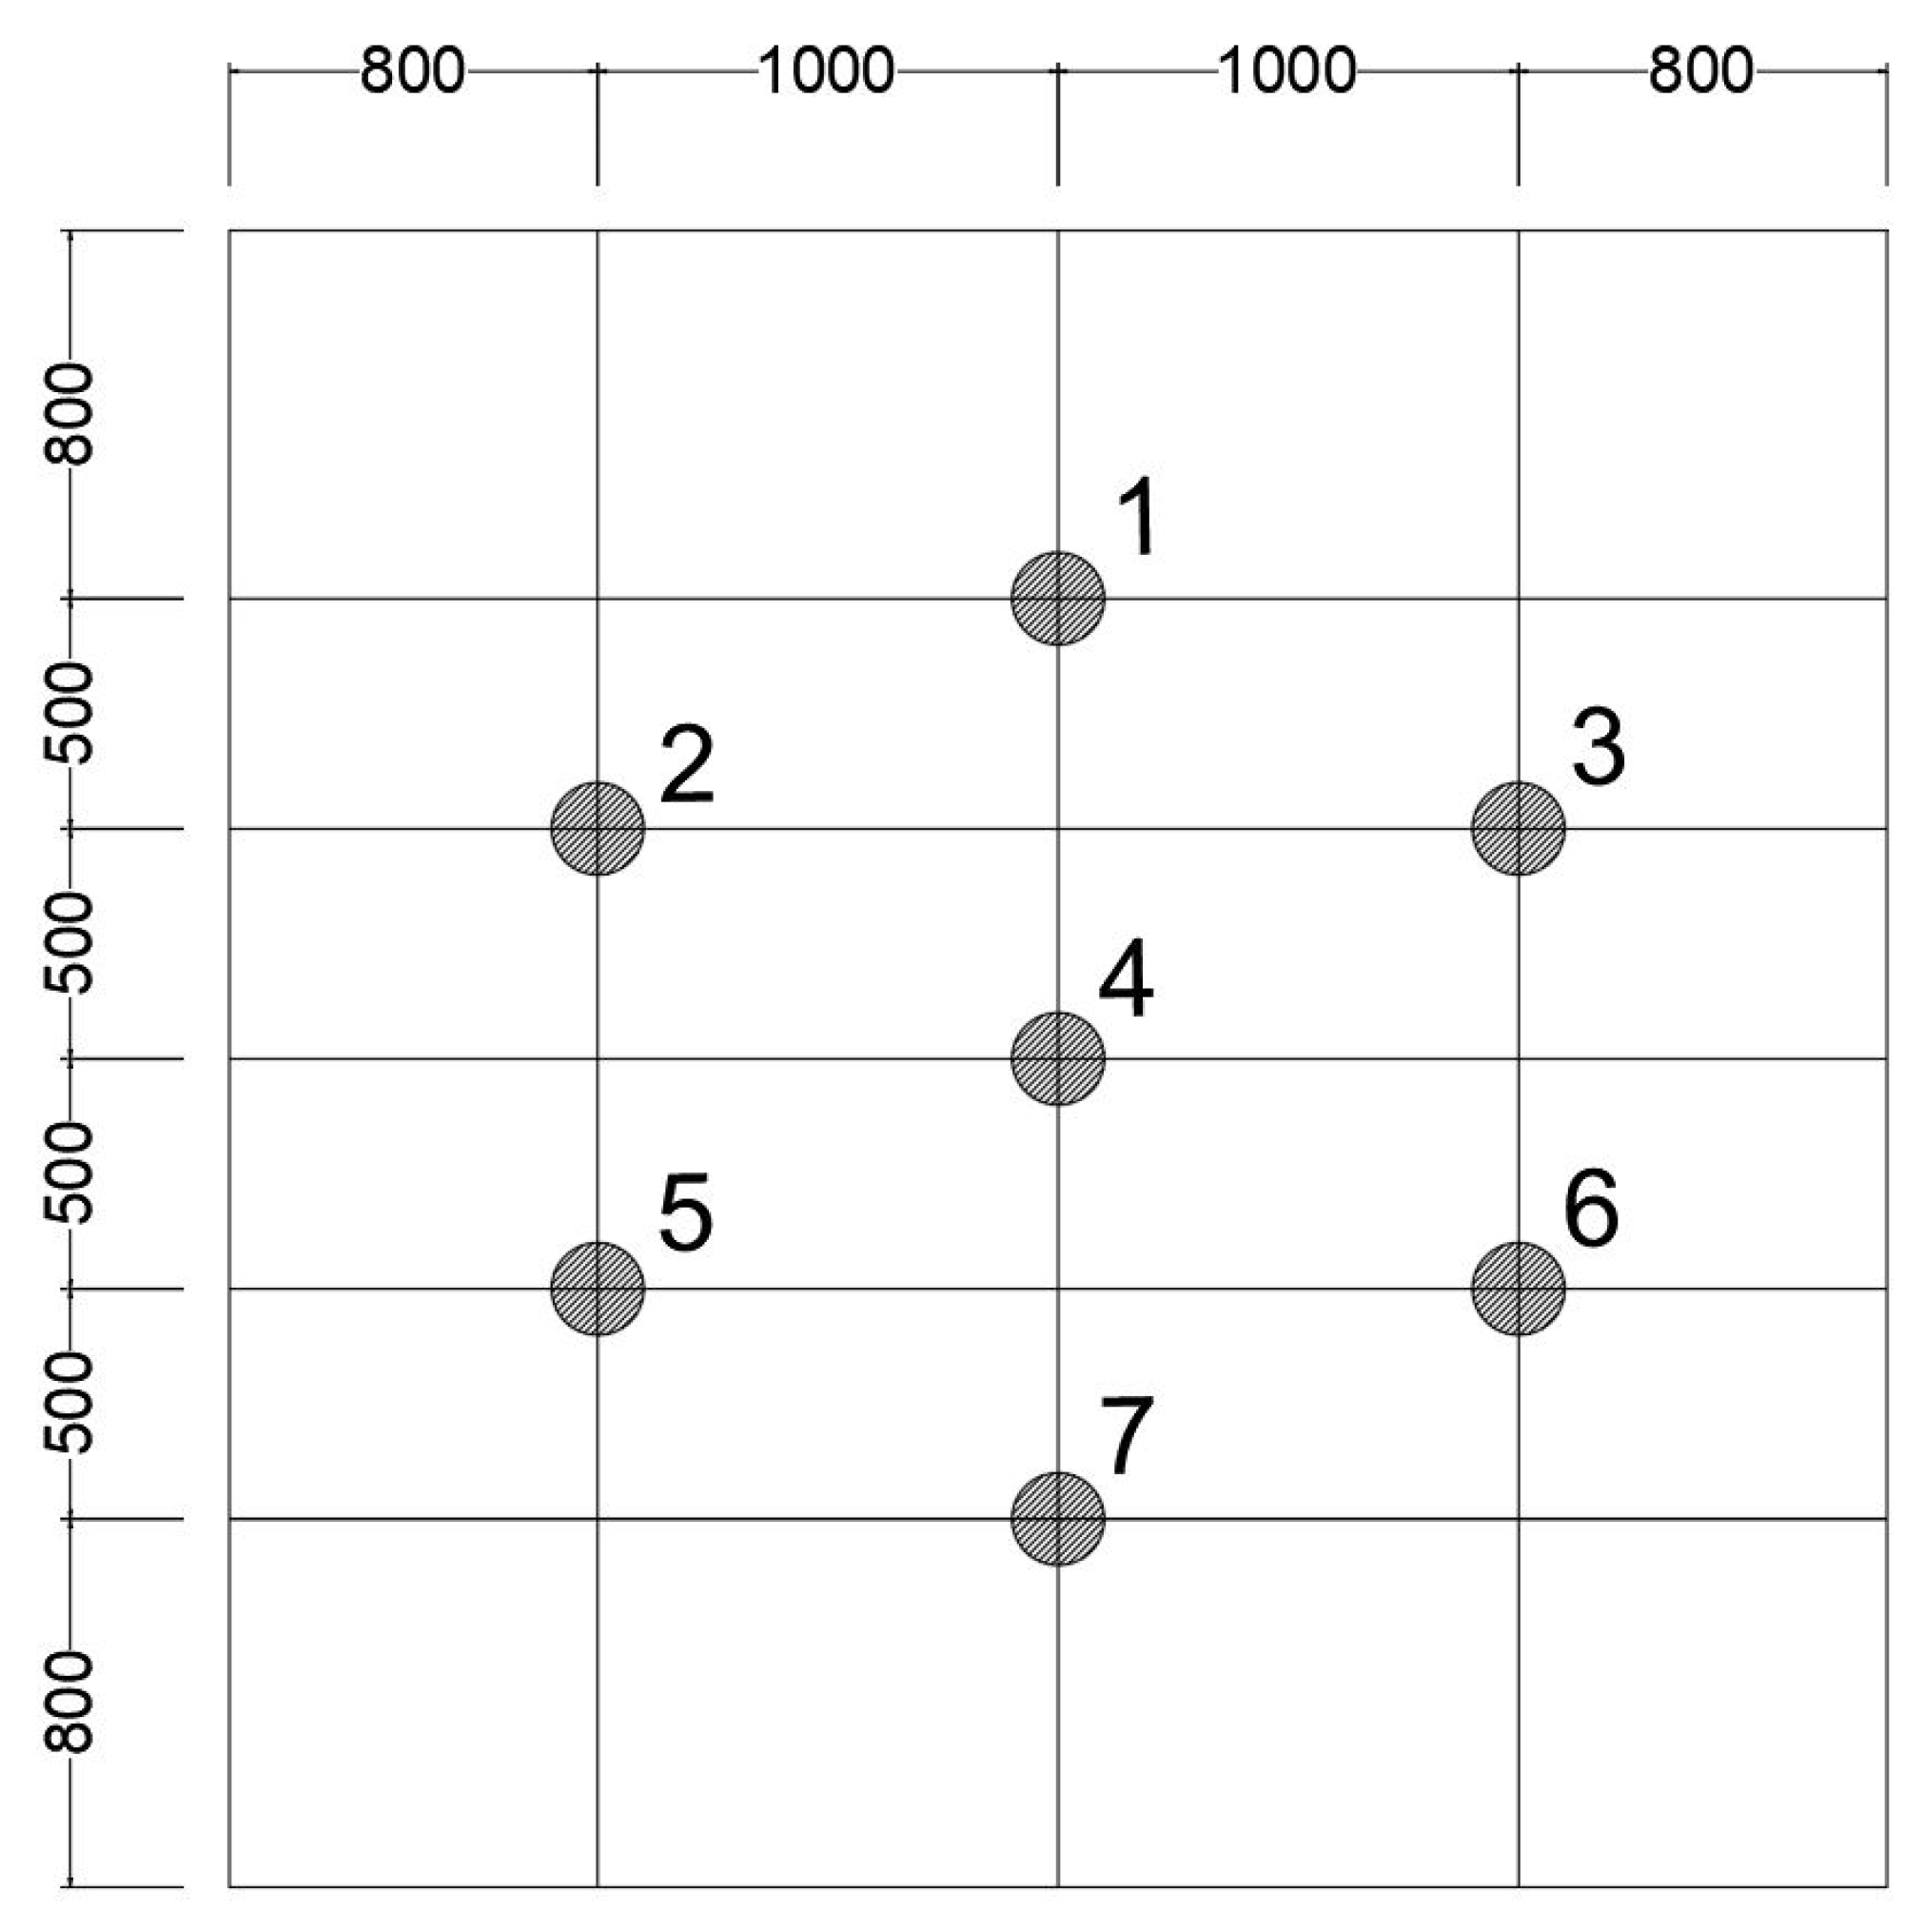
The chamber was divided into zones using a grid. (Figure 7). Seven measurement points and three heights from the floor surface: 130 cm, 180 cm, and 210 cm were chosen in this grid (Figure 7).
In each position and height, at certain air flow (1000 m3/h, 1200 m3/h and 1400 m3/h), measurements were performed three times, and the average value was calculated. The duration of one measurement was 15 s. The measurement uncertainty is in mid and high frequencies ±1.6 dB and in low frequencies ±2.0–2.8 dB. The sound level measurements in the 1/3 octave frequency band from 50 Hz to 5000 Hz were performed. This frequency range was chosen because people are most sensitive to noise of this frequency range.
The acoustic measurements (sound pressure level) were carried out in the following sequence: first, the background sound level was measured with the air supply unit switched off; second, the sound level measurements were taken with the air supply unit switched on without diffuser; third, measurements were carried out with the air supply unit switched on (flow rates were, respectively, 1000 m3/h, 1200 m3/h, 1400 m3/h) and with installed diffusers respectively ‘A’, ‘B’, and ‘C’. The reverberation time of the chamber was determined after level measurements (T20 of the chamber varies from 1.2 up to 2.5 s).
To ensure that background noise did not affect the measurement results, additional background noise sources in the chamber as the air extraction duct were disconnected and isolated, the lamps turned off, and no one was inside chamber during the measurements.

3. Results and Discussion

In this section, we present measured sound pressure levels in 1/3 octave bands at chosen air flow rates: 1000 m3/h, 1200 m3/h, 1400 m3/h of the three analyzed diffusers. Firstly, was installed ‘A’ type diffuser and performed measurements. In Section 3.1, we provide measurements results for this type of diffuser. ‘A’ diffuser was removed and installed ‘B’ type diffuser and performed measurements. In Section 3.2 are given measurements results of this type diffuser. ‘B’ diffuser was removed and installed ‘C’ type diffuser and performed measurements. In Section 3.3, we provide measurement results of this type diffuser.

3.1. ‘A’ Type Diffuser

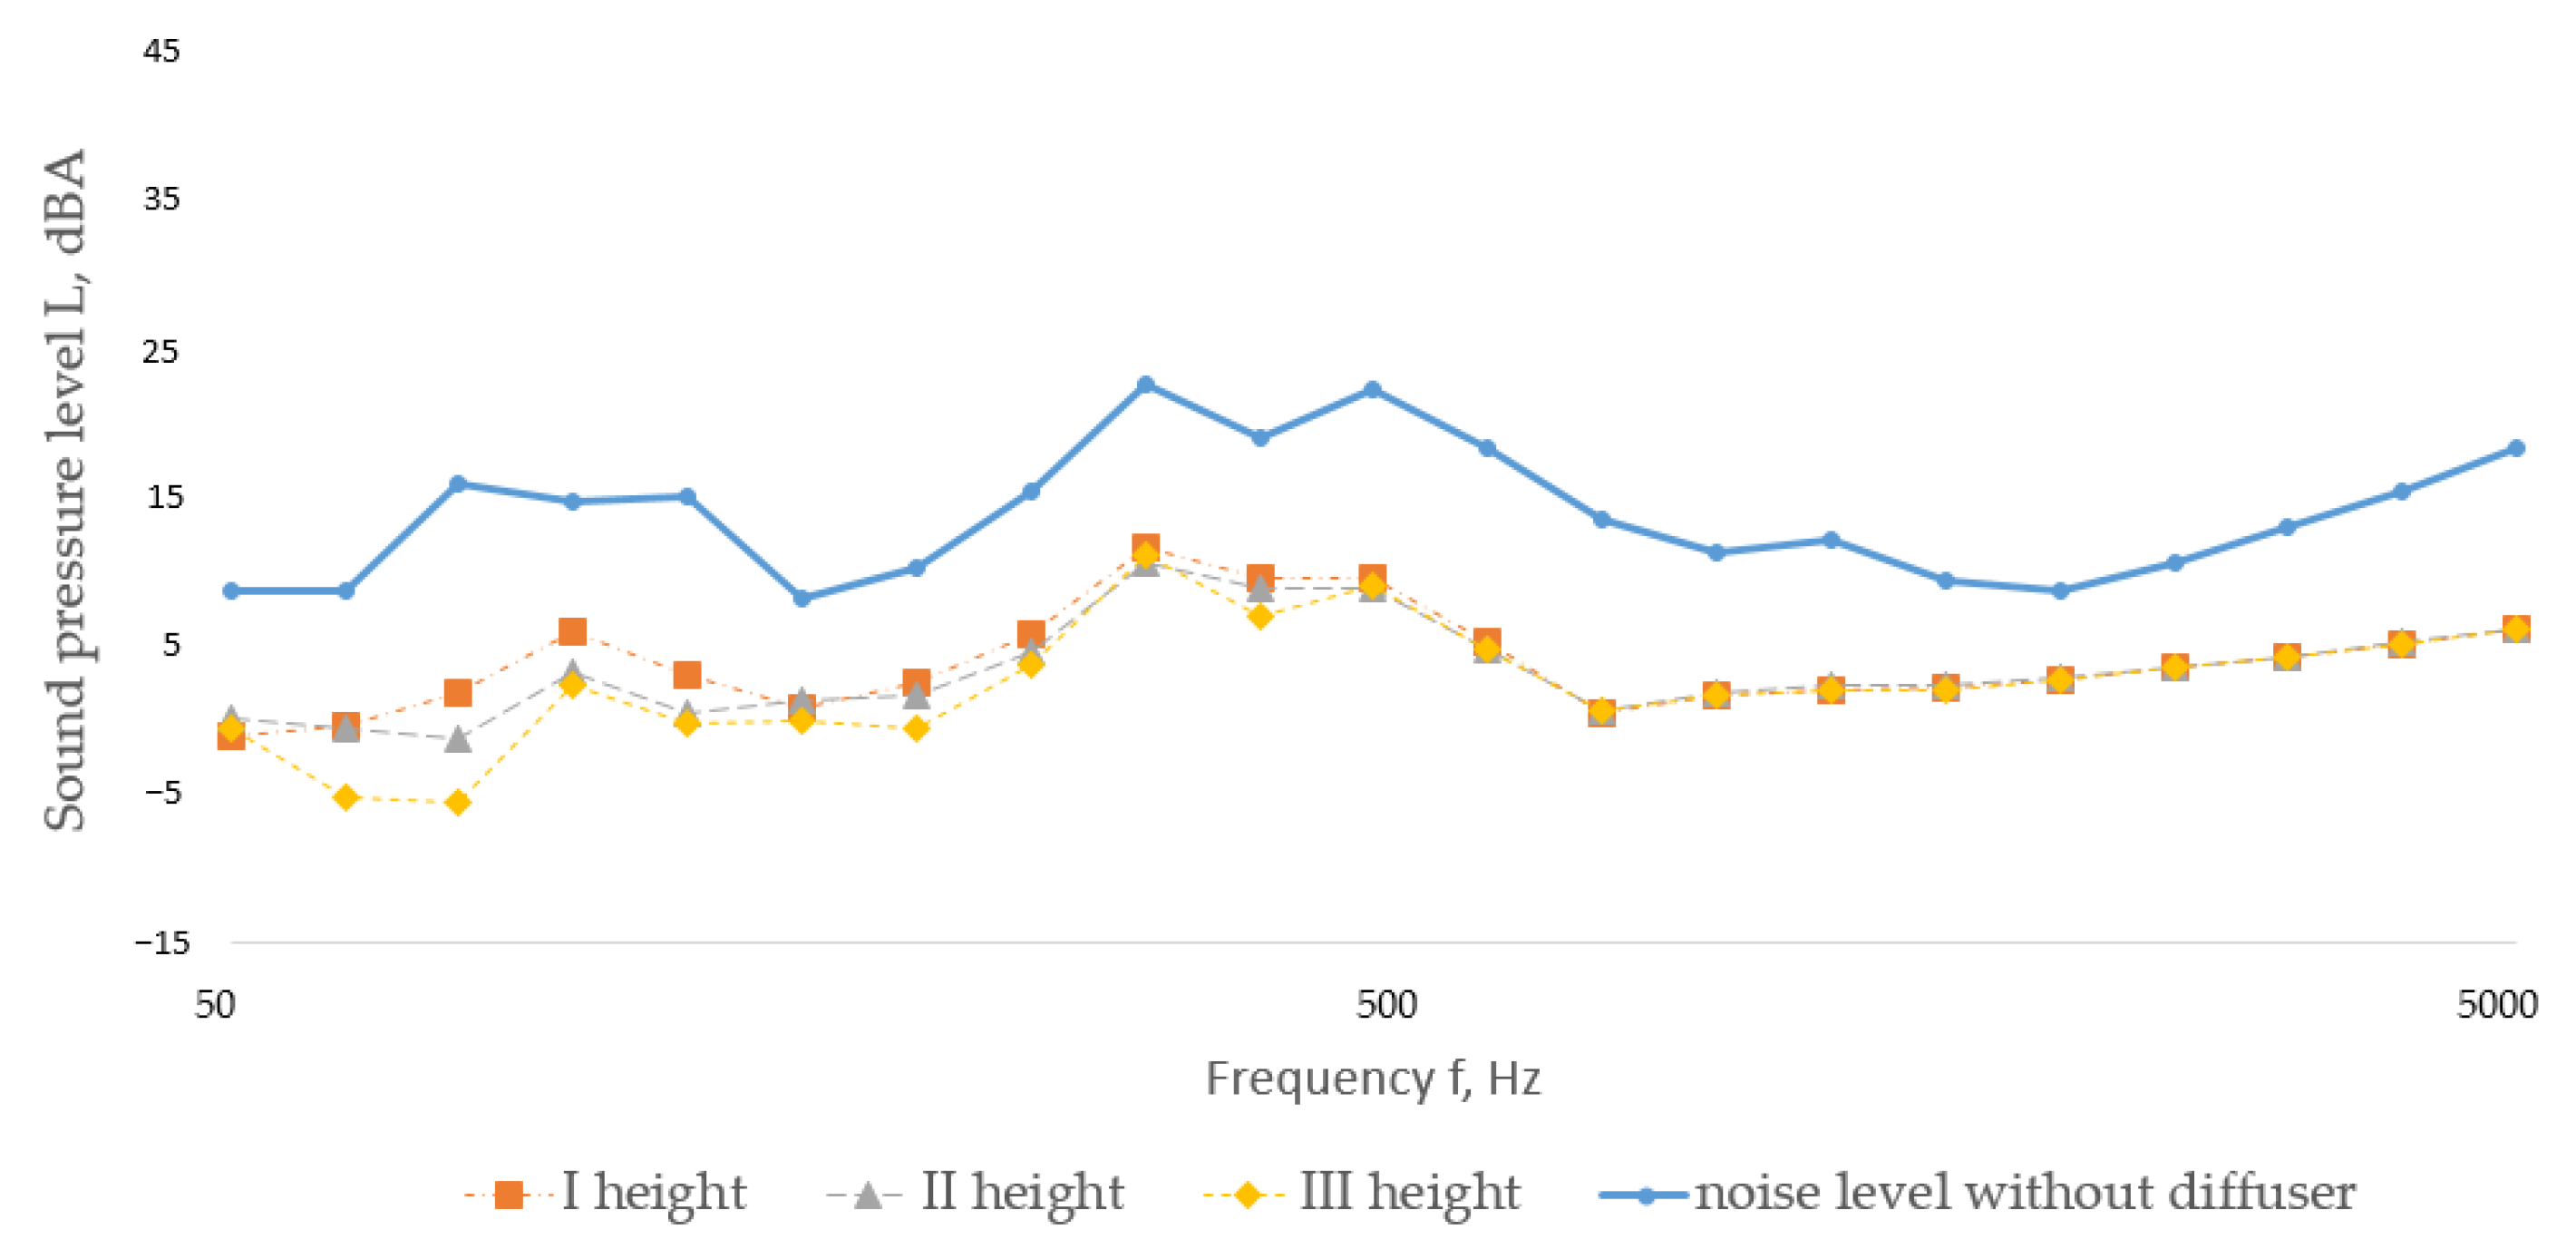
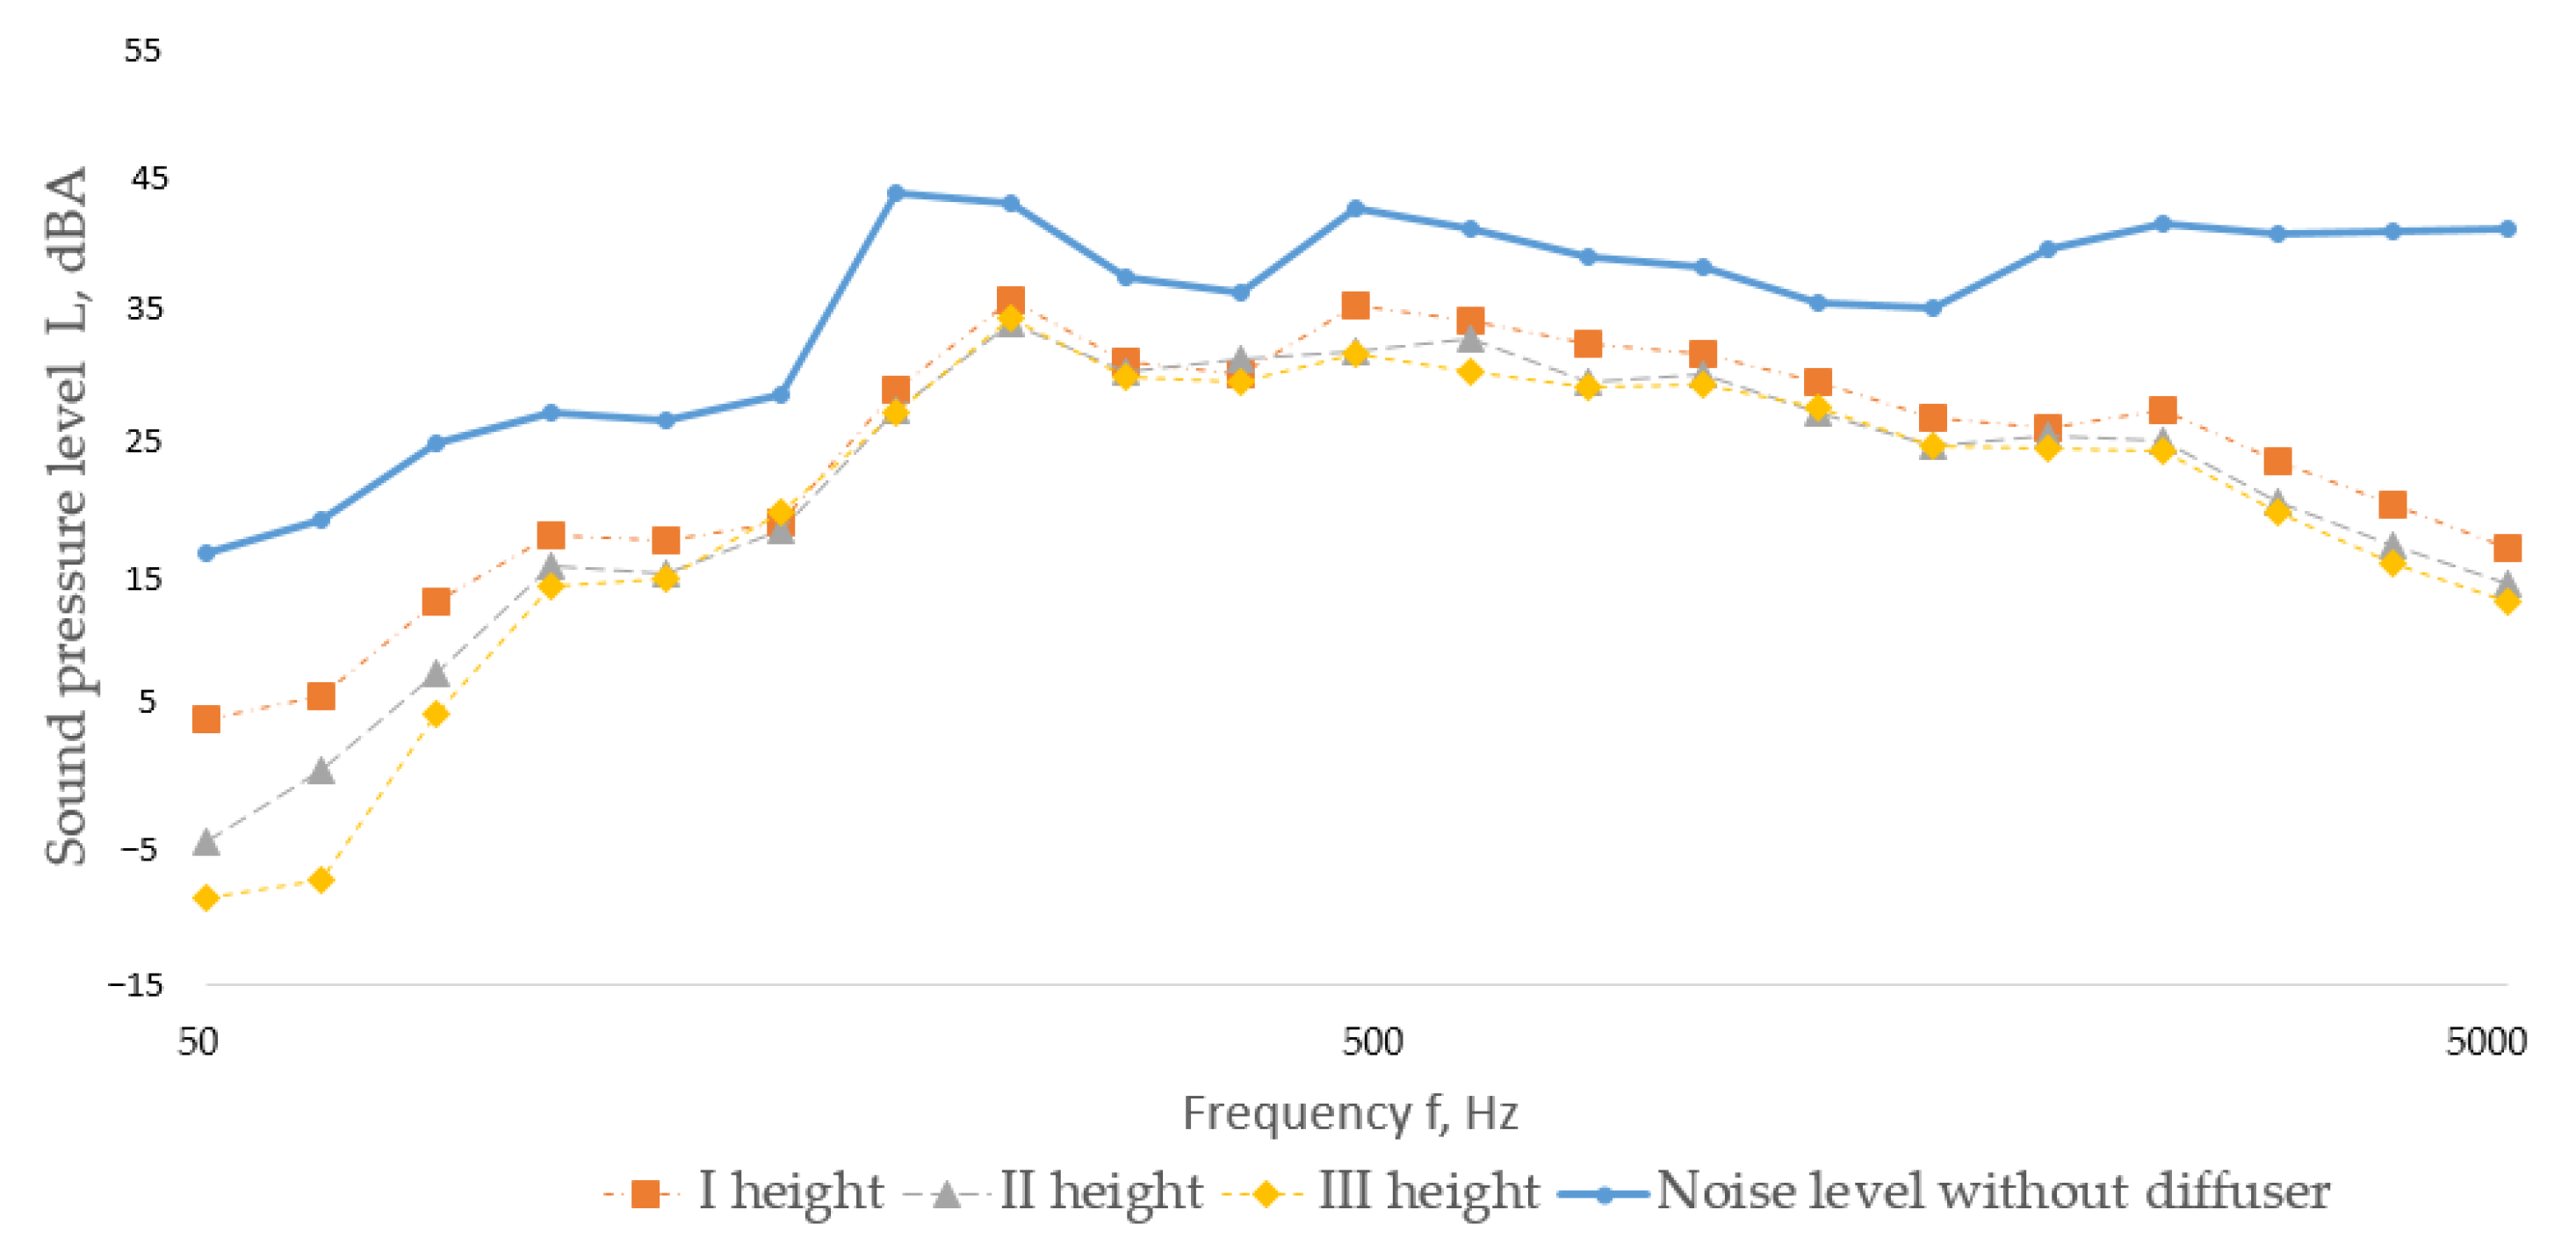
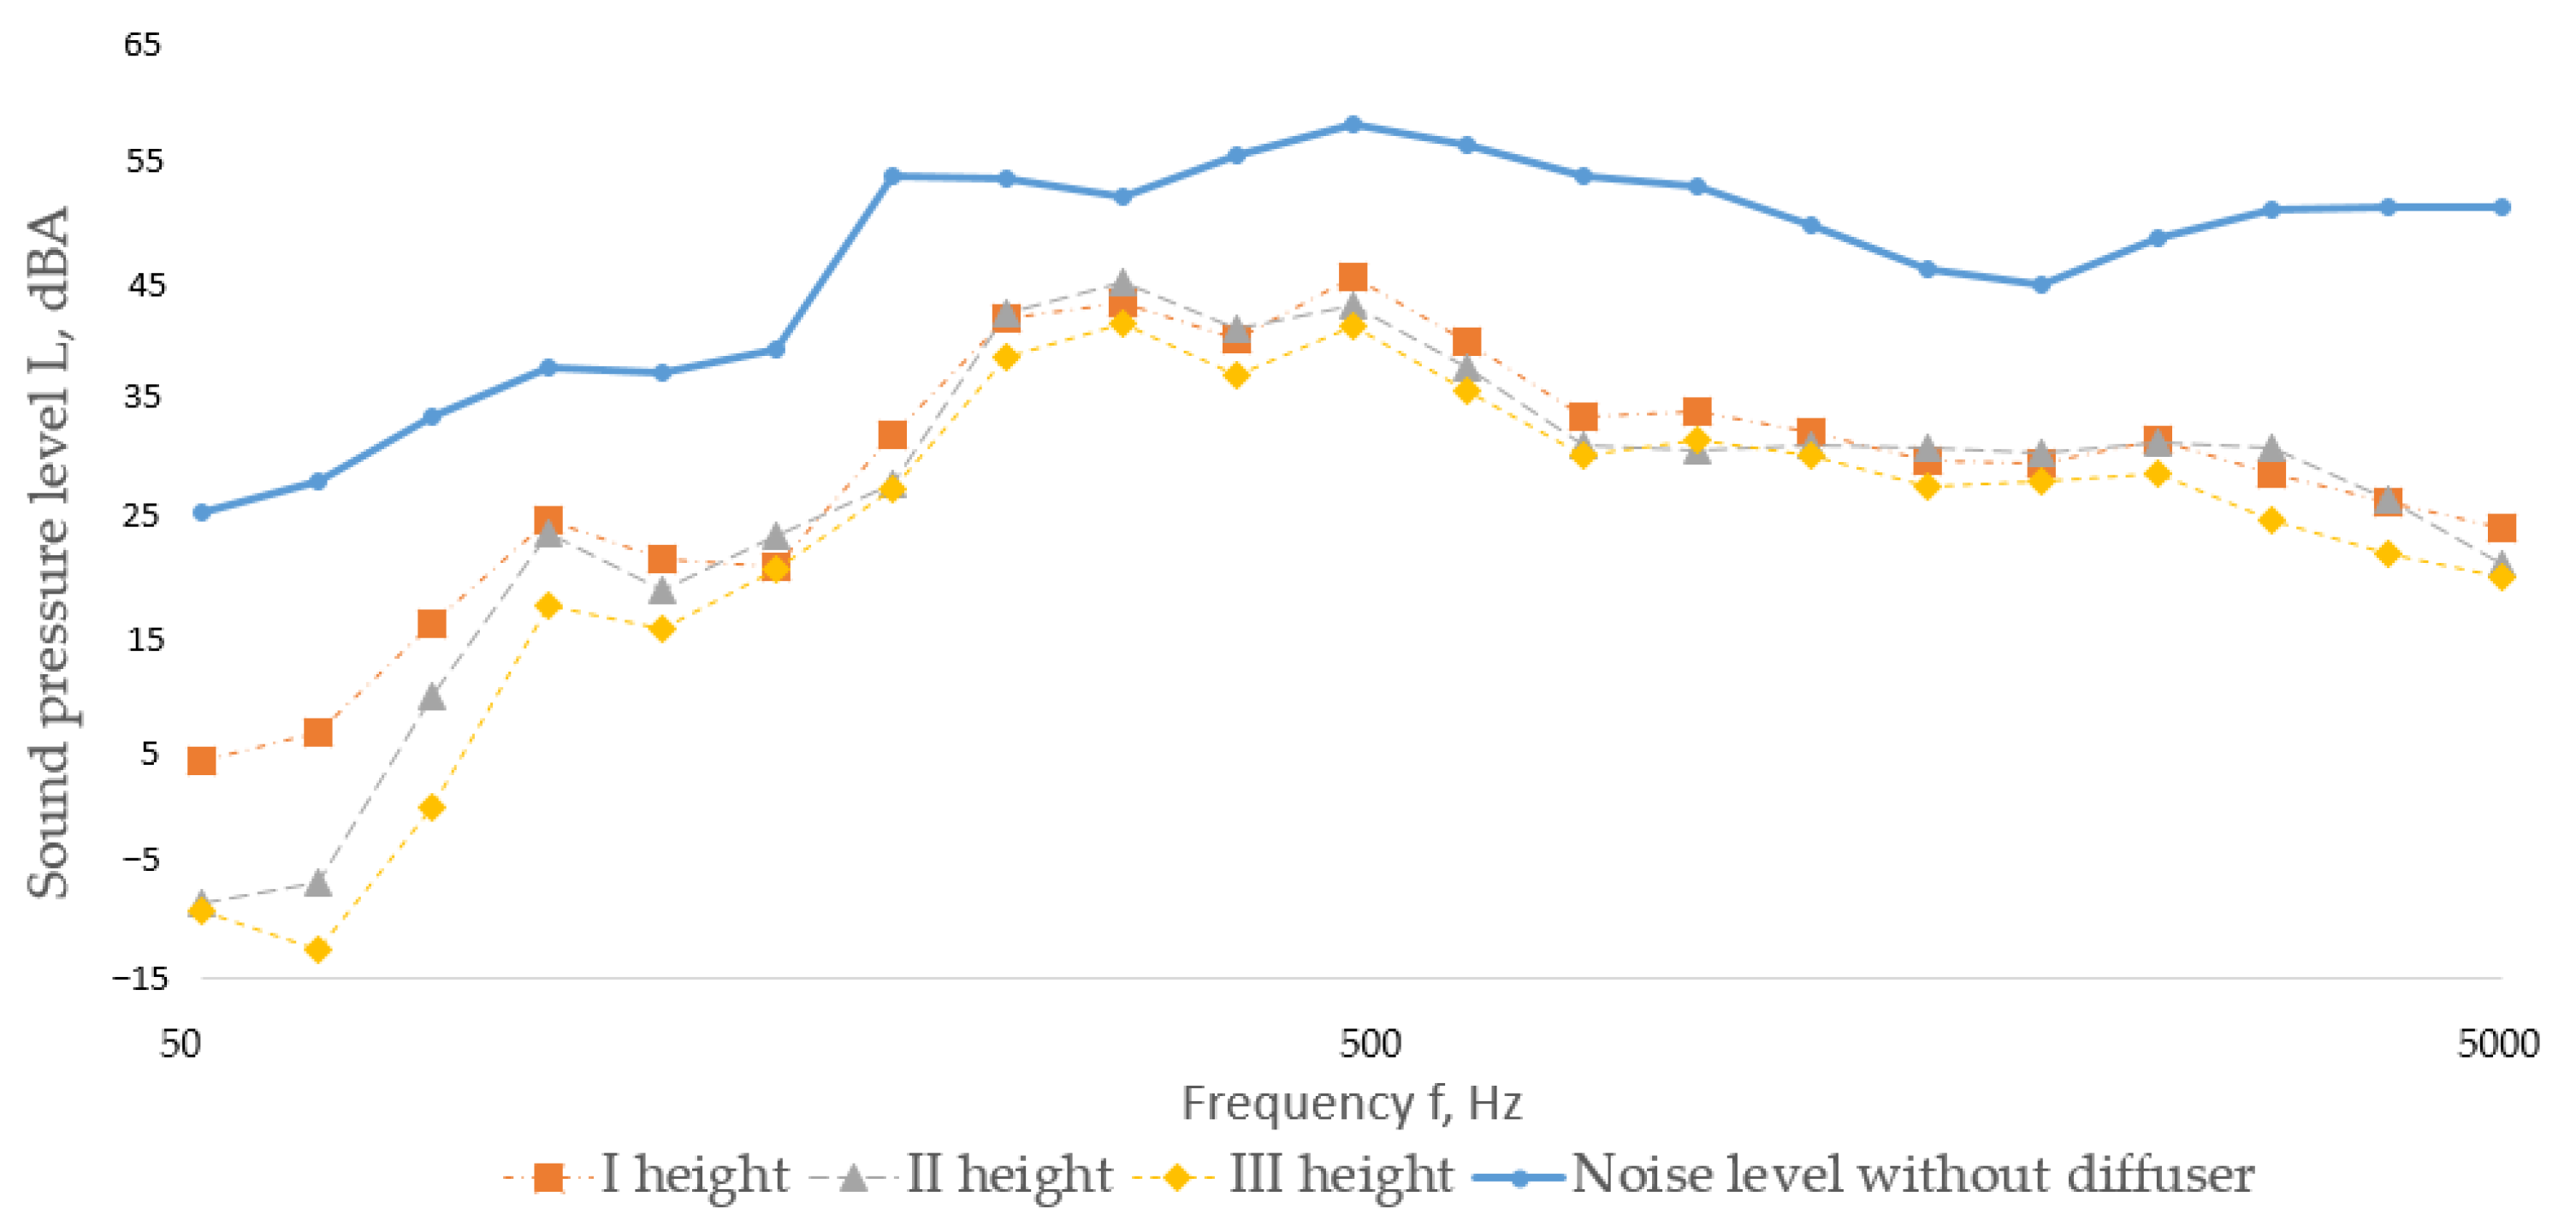
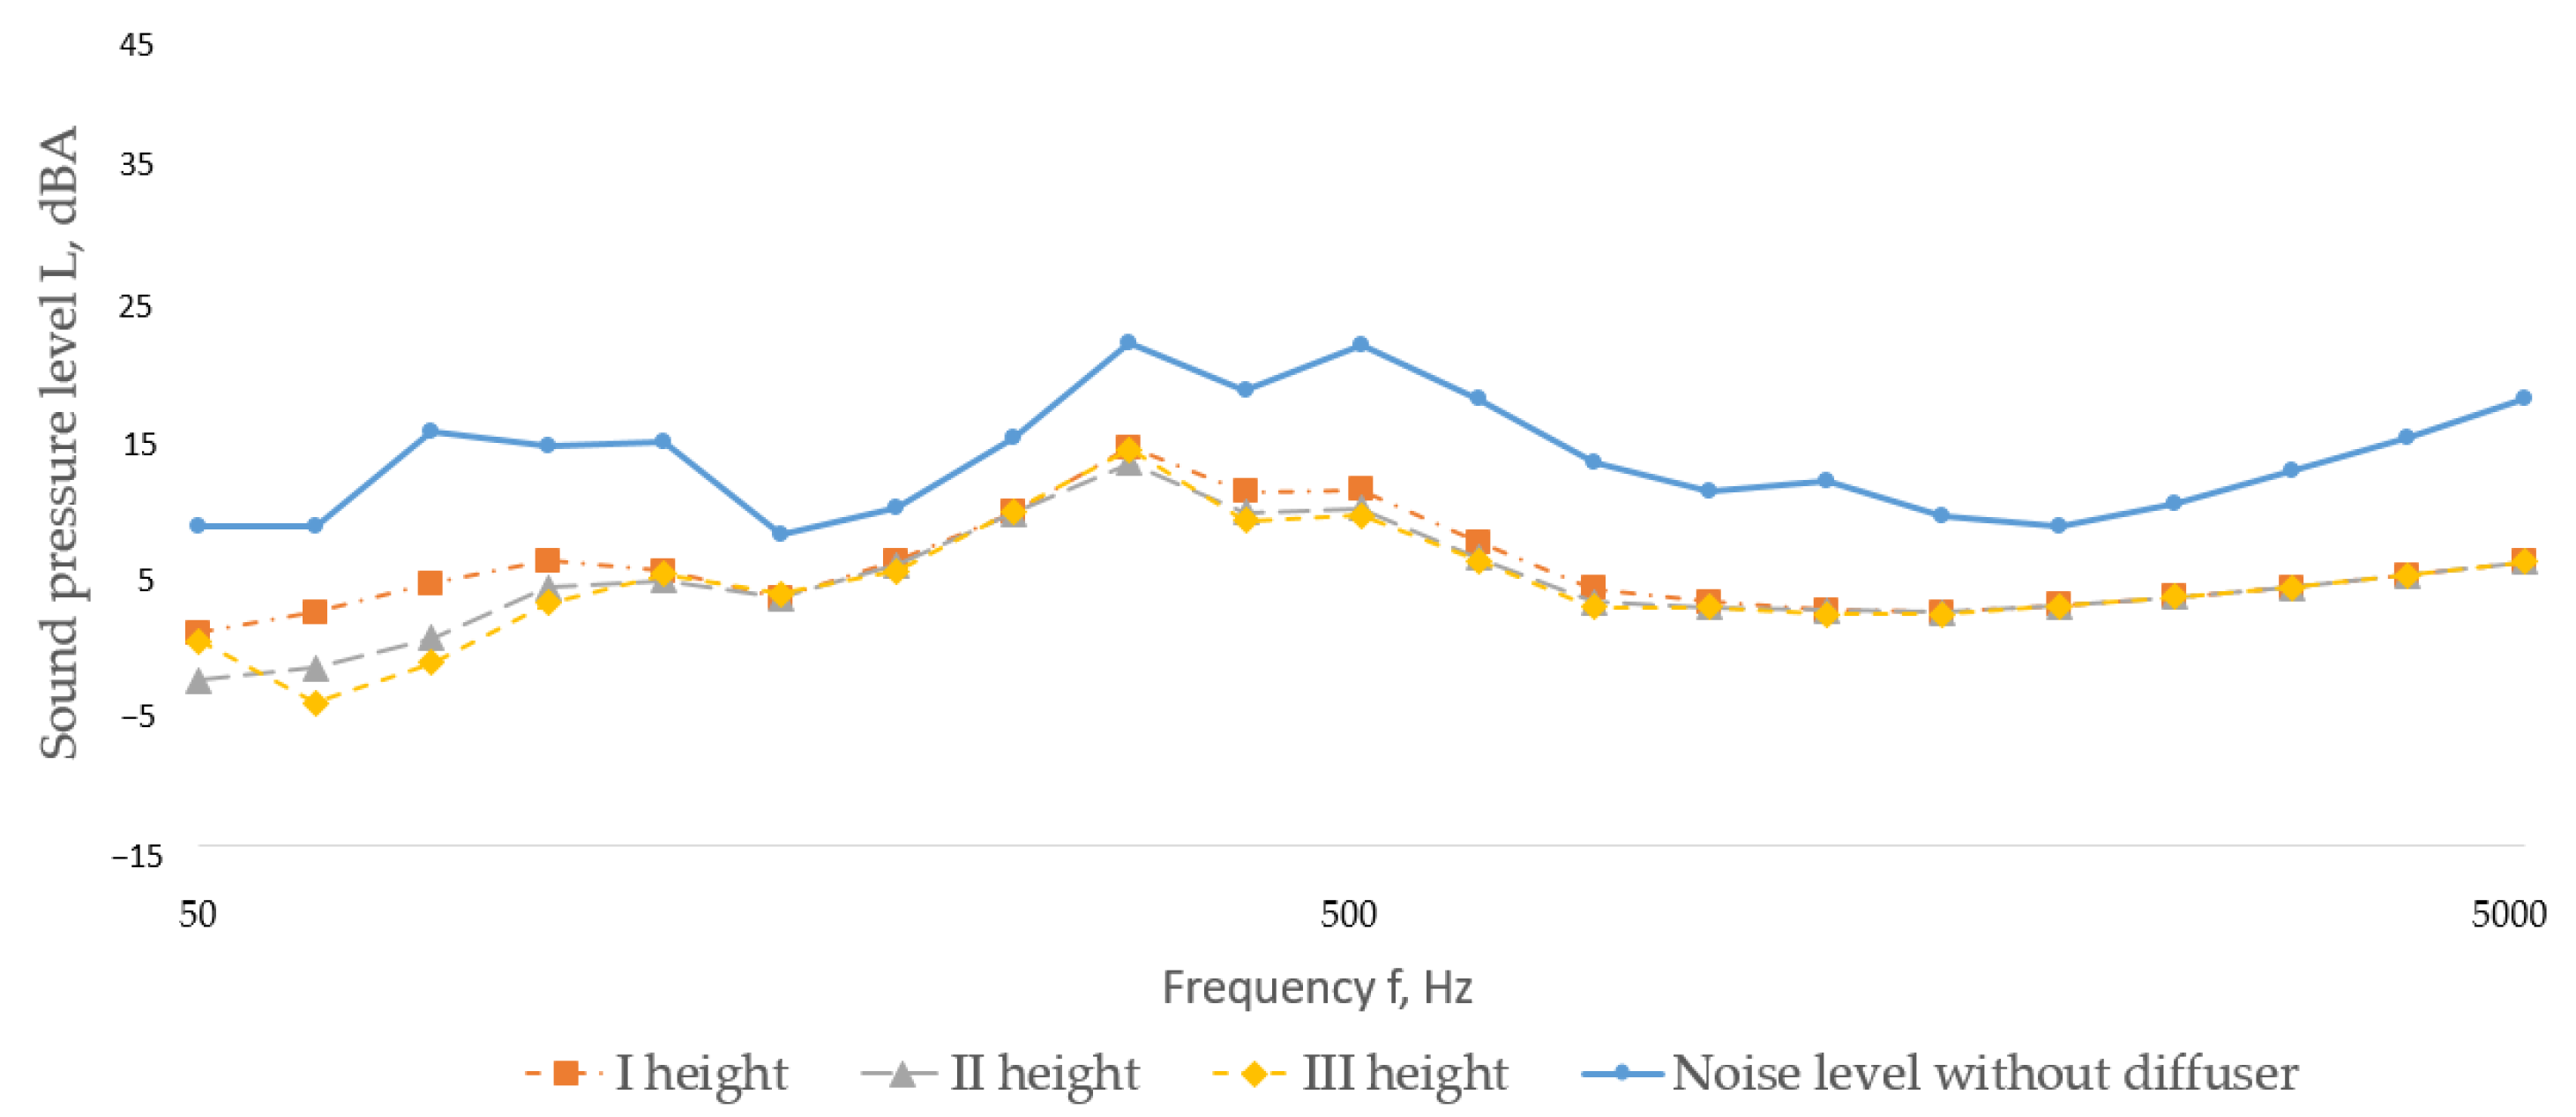
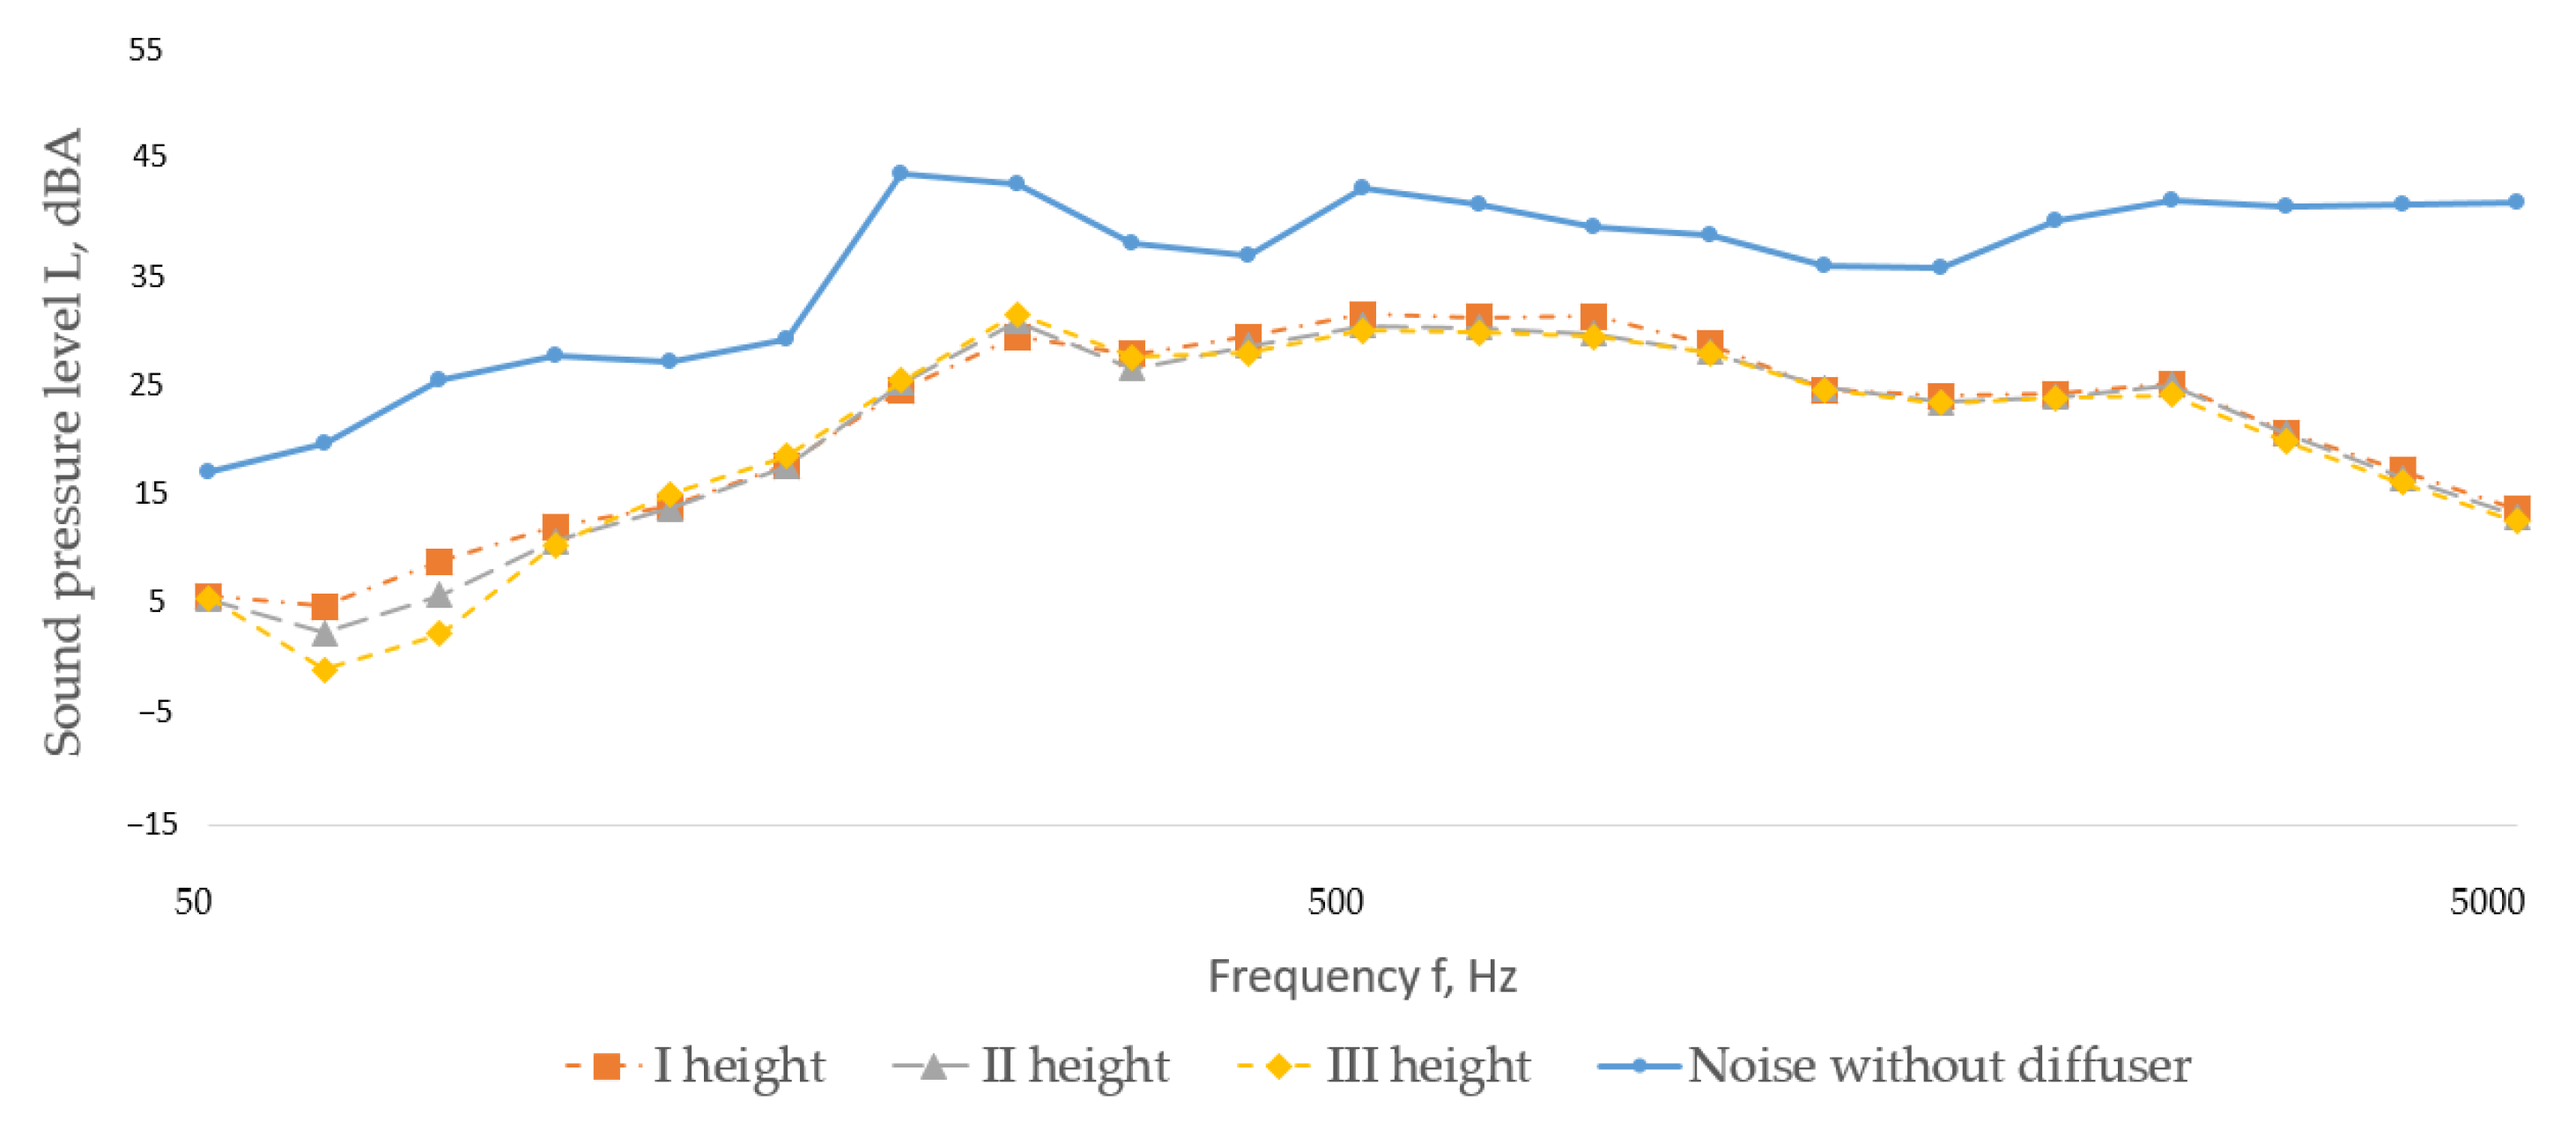
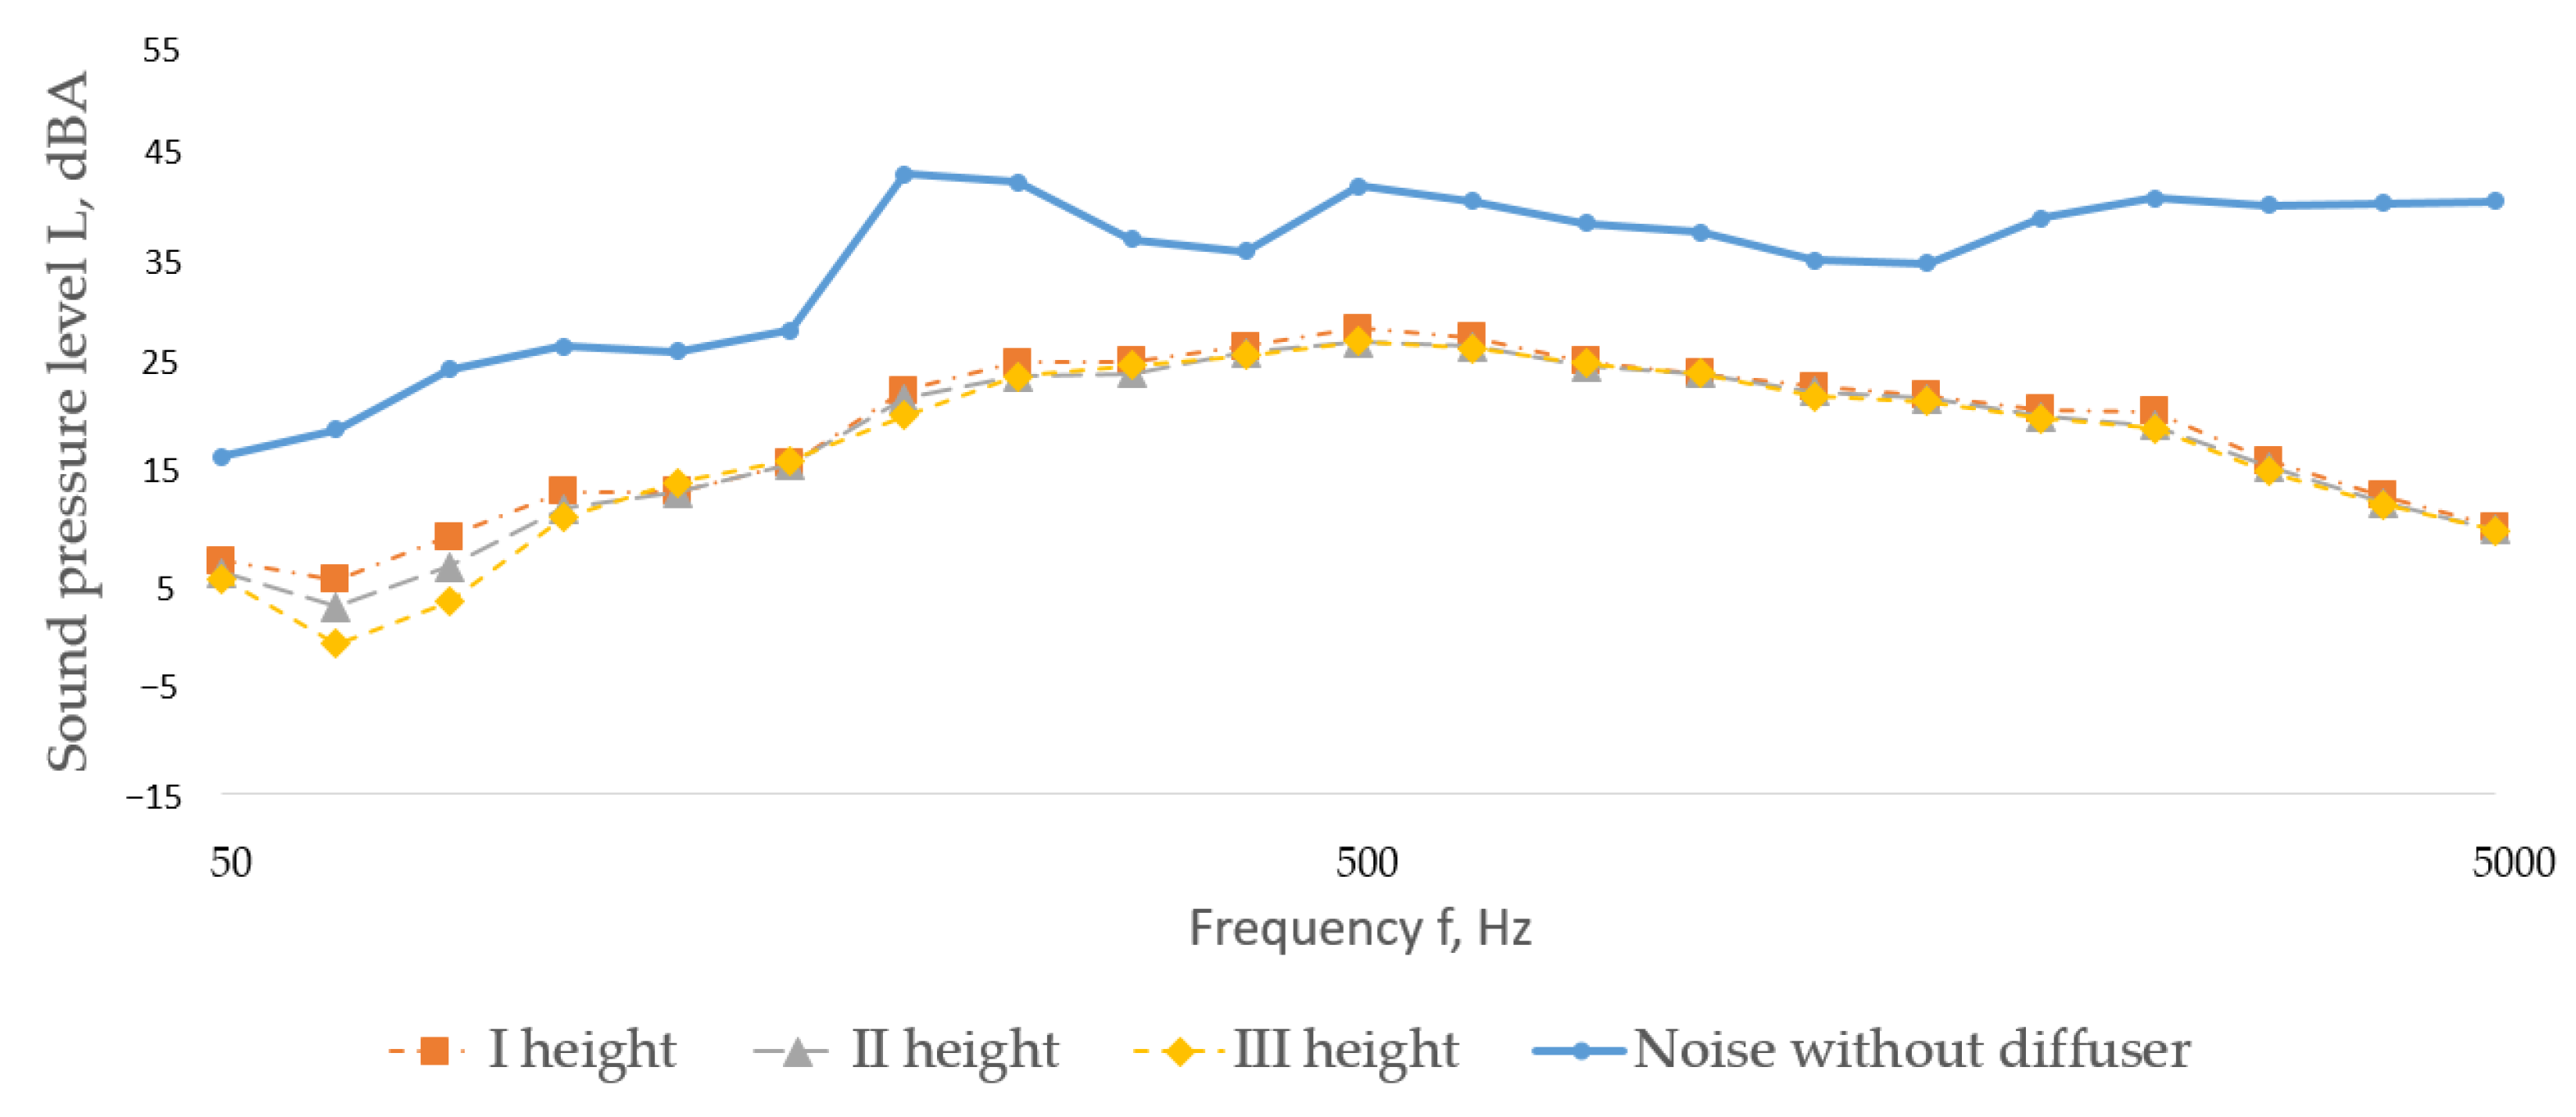
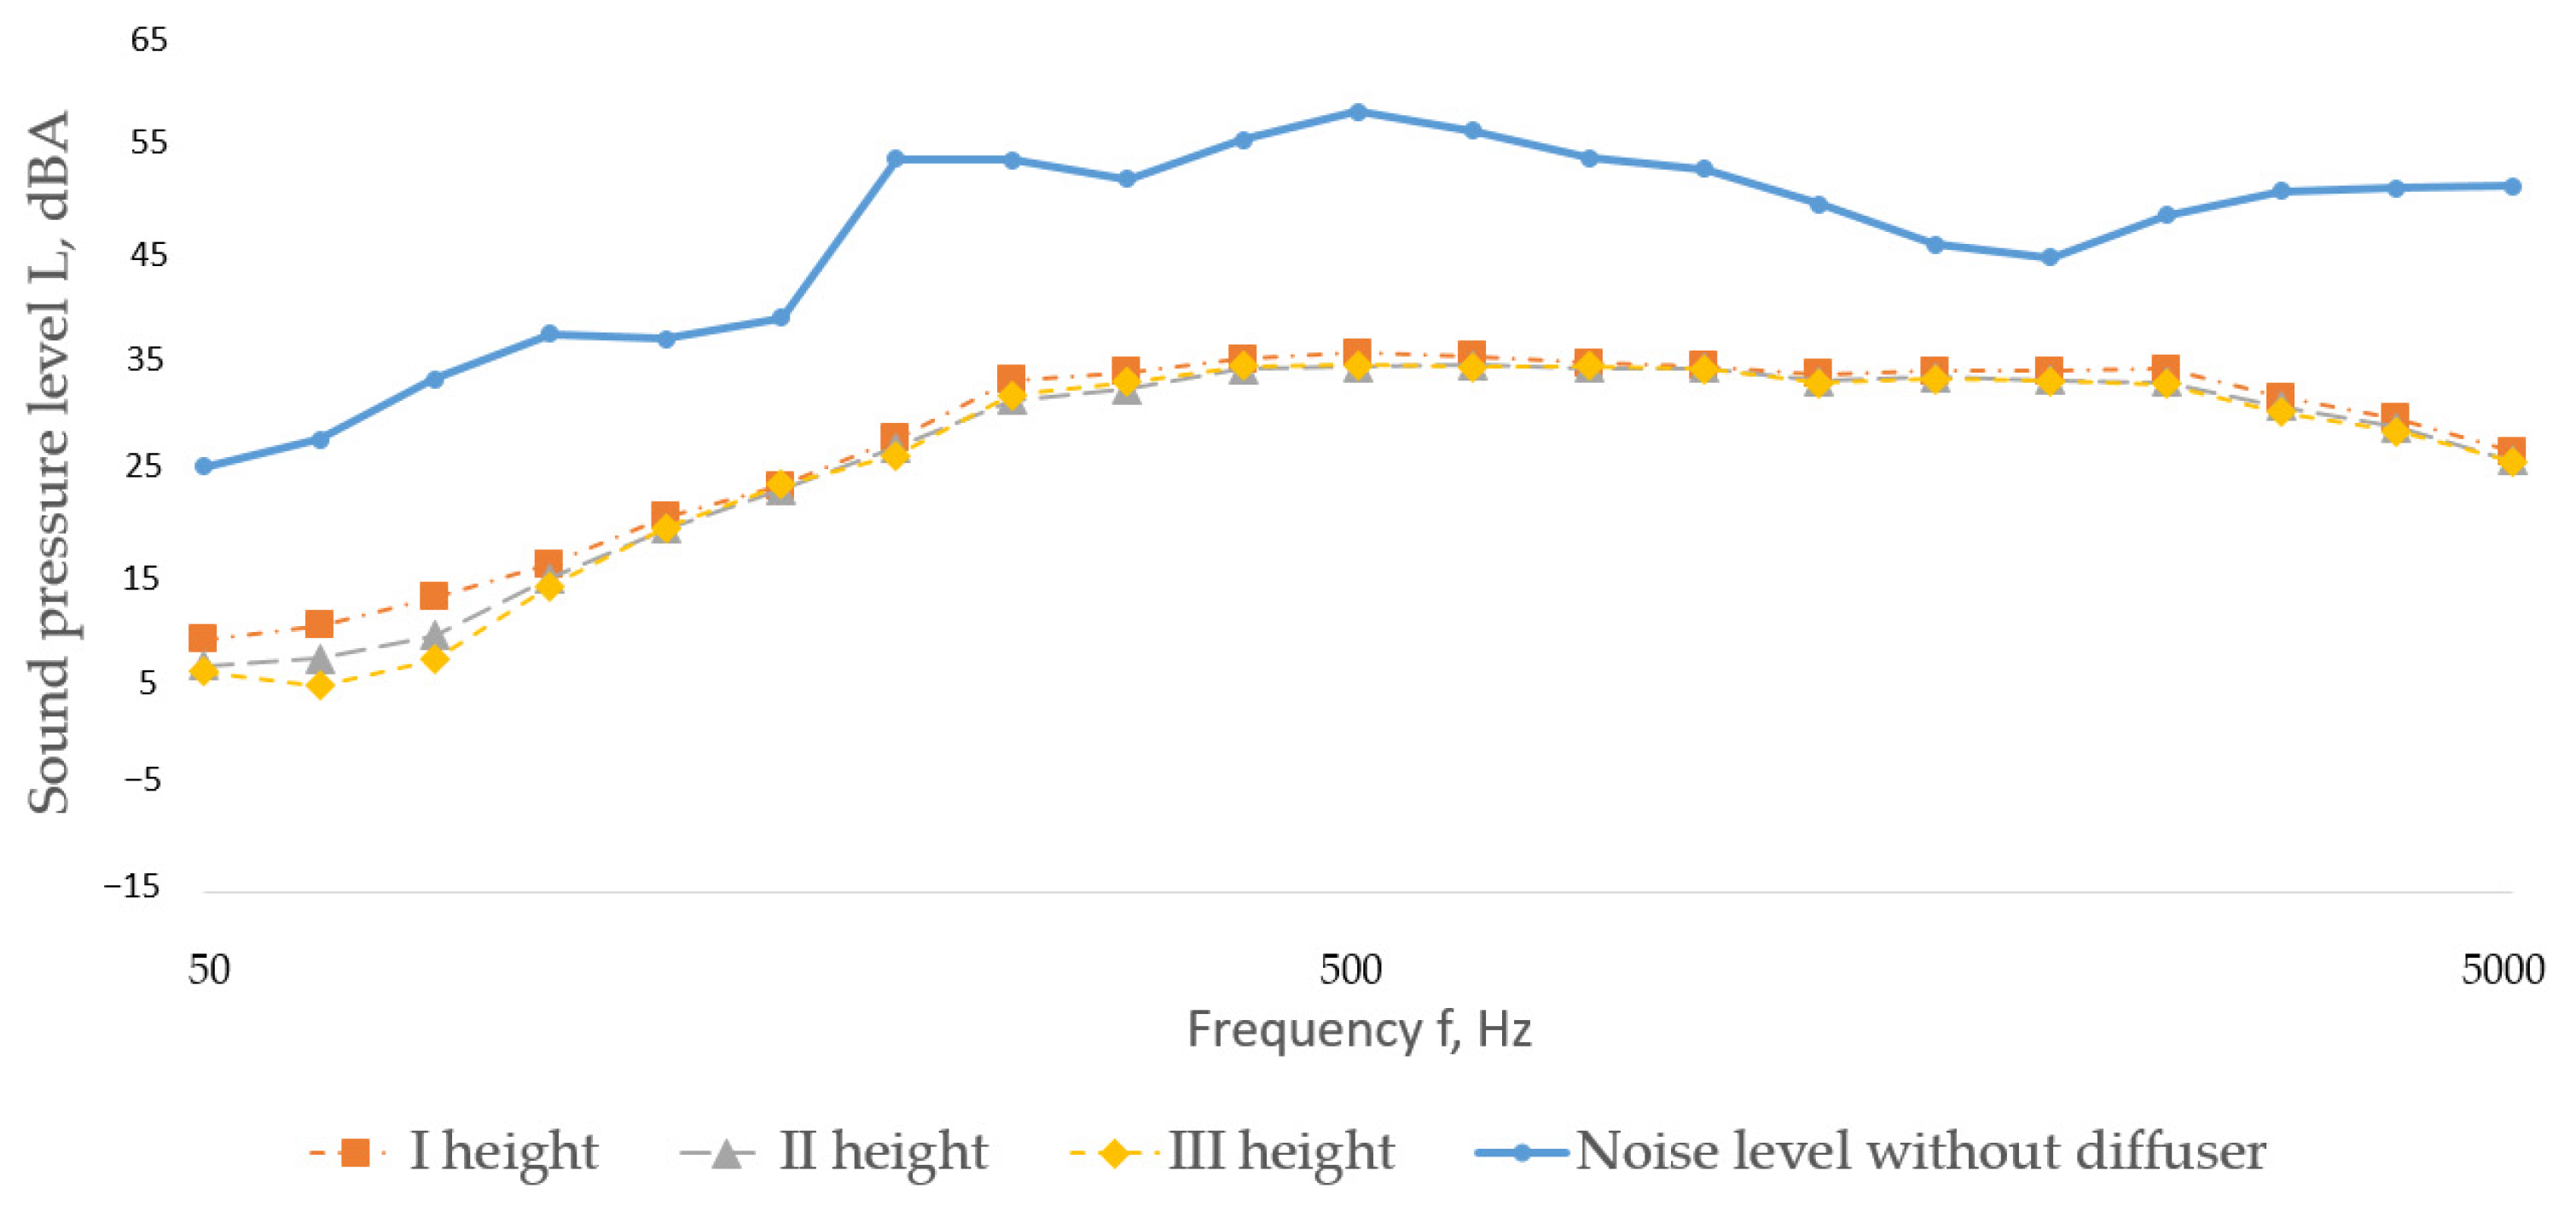
In Figure 8, Figure 9 and Figure 10, we provide sound pressure levels in 1/3 octave bands at flow rates 1000 m3/h, 1200 m3/h, 1400 m3/h for the ‘A’ type diffuser.
From Figure 8, Figure 9 and Figure 10, we can see that the sound level curves character is the same in the frequency band 50–500 Hz it increases, while at the 500–800 Hz level a small decrease is noticed, but from 800 up to 5000 Hz it again increases. When the air flow is 1000m3/h, the level does not exceed 10 dBA. By increasing the flow to 1200 m3/h (Figure 9), the sound level more significantly increases (>10 dBA) compared with levels with an air flow of 1200 m3/h, but it does not exceed the limit of 35 dBA. Increasing the flow to 1400 m3/h, the sound level (Figure 10) increases by an average of 10 dBA within the limit of 45 dBA in the whole frequency range. It can be observed that as the airflow is 1000 m3/h, the diffuser effectively attenuates noise, maintaining a sound level below 15 dBA. However, when the airflow is further increased to 1200 m3/h and 1400 m3/h, its effectiveness decreases. The textile fabric, perforation is not capable of effectively attenuating the large noise levels due to its thin layer of fabric and lightness. At higher air flow levels, the fabric vibrates more and emits more noise. In particular, it is seen in middle frequency range (160–800 Hz). This is the critical vibration frequency of diffuser.

3.2. ‘B’ Type Diffuser

In Figure 11, Figure 12 and Figure 13, we provide sound pressure levels in 1/3 octave bands at flow rates of 1000 m3/h, 1200 m3/h, 1400 m3/h of the ‘B’ type diffuser.
From Figure 11, Figure 12 and Figure 13 we could see that when the air flow is 1000 m3/h, the level does not exceed 10 dBA. By increasing the flow to 1200 m3/h (Figure 12), the sound level more significantly increases (>10 dBA) compared with levels with air flow 1200 m3/h, but does not exceed the limit of 25 dBA. Increasing the flow to 1400 m3/h, the sound level (Figure 13) increases by an average of 10 dBA within the limit of 35 dBA in the whole frequency range. It can be observed that as airflow is 1000 m3/h, the diffuser effectively attenuates noise, maintaining a sound level below 15 dBA. However, when the airflow is further increased to 1200 m3/h and 1400 m3/h, its effectiveness decreases the same as ‘A’ type diffuser. The sound level of the type ‘B’ diffuser in the frequency band 250–1000 Hz is approximately 5 dBA lower than that of the type ‘A’ diffuser at the same flow. As the flow increases to 1400 m3/h, the character of the curve changes to become more uniform than at lower flows in the frequency range studied and is different from that of a type ‘A’ diffuser, which retains a stepped shape. The sound level emitted by this type of diffuser is more equal than that of the type ‘A’ diffuser and is 5–10 dBA lower in the 250–630 Hz frequency band but higher in the 800–5000 Hz frequency bands. The results show that the B’ type diffuser attenuates noise well also as ‘A’ diffuser—level is below 15dBA. When increasing flow up to 1200 m3/h and 1400 m3/h, respectively, its effectiveness also decreases, as in the ‘A’ type diffuser. It means that changed air supply direction does not significantly change acoustic parameters as the geometry and dimensions of diffusers are the same—rectangular (1200 × 600mm). The air supply direction changes only influences the curves character.

3.3. ‘C’ Type Diffuser

In Figure 14, Figure 15 and Figure 16, we provide sound pressure levels in 1/3 octave bands at flow rates of 1000 m3/h, 1200 m3/h, and 1400 m3/h of the ‘C’ type diffuser.
The results of the Type ‘C’ diffuser showed (Figure 14), similar to the ‘A’ and ‘B’ type diffusers; when the air flow is 1000 m3/h, the sound level in the analyzed frequency bands does not exceed 15 dBA. When the flow is increased to 1200 m3/h, the sound level (Figure 15) increases, but does not exceed the limit of 30 dBA as in the case of type ‘B’ diffuser in the frequency band 100–5000 Hz. At frequencies <100 Hz, the change (increase) is smaller (<10 dBA) as with type ‘A’ and ‘B’ type diffusers. Increasing the flow to 1400 m3/h increases the sound level (Figure 16) (on average 10 dBA) but does not exceed the limit of 35 dBA in the whole frequency range studied. As the flow increases, the character of the curve changes, as in the case of ‘B’ type diffuser—it also becomes smoother than at lower flow rates in the frequency range studied and different from that of the type ‘A’ diffuser, which retains a stepped shape. The type ‘C’ diffuser, like the type ‘B’, has a 5 to 10 dBA lower sound level in the 1000 to 5000 Hz frequency band compared to the type ‘A’ diffuser. The sound level of the type ‘C’ diffuser at maximum flow is 5 dBA lower than in the type ‘B’ medium and high frequency bands.

3.4. Discussion

The ‘C’ type diffuser is different form it is square while ‘A’ and ‘B’ type is rectangular chape diffusers. Also ‘C’ type diffuser lower area is two times less than ‘A’ and ‘B’ type diffusers. These geometrical differences influence the results and emitted noise levels. From this, we could say that larger bottoms are, the better. In lower frequencies (below 100Hz) as we could see from Figure 8, Figure 9, Figure 10, Figure 11, Figure 12, Figure 13, Figure 14, Figure 15 and Figure 16, we have fluctuations of levels in three measurements heights. This means that in these frequencies, measurements results are not so reliable due to small volume and geometric parameters (length and width are the same) of climatic chamber. It can be observed that when air flow is 1000 m3/h, the ‘C’ type diffuser attenuates noise, though not as effectively as the ‘A’ and ‘B’ type diffusers—the sound level remains below 15 dBA. However, when the airflow increases to 1200 m3/h and 1400 m3/h, its effectiveness decreases similarly to that of the ‘A’ and ‘B’ type diffusers. At higher airflow rates, the fabric tends to vibrate more intensely, which results in increased noise emission. This effect is particularly noticeable in the mid-frequency range (160–800 Hz) for the ‘A’ type diffuser, although it is not so expressed when the airflow reaches 1200–1400 m3/h, the range of vibration increasement extends up to 2500 Hz. This behavior corresponds to the critical vibration frequency of the diffuser and is caused by the larger surface area of the diffusers.
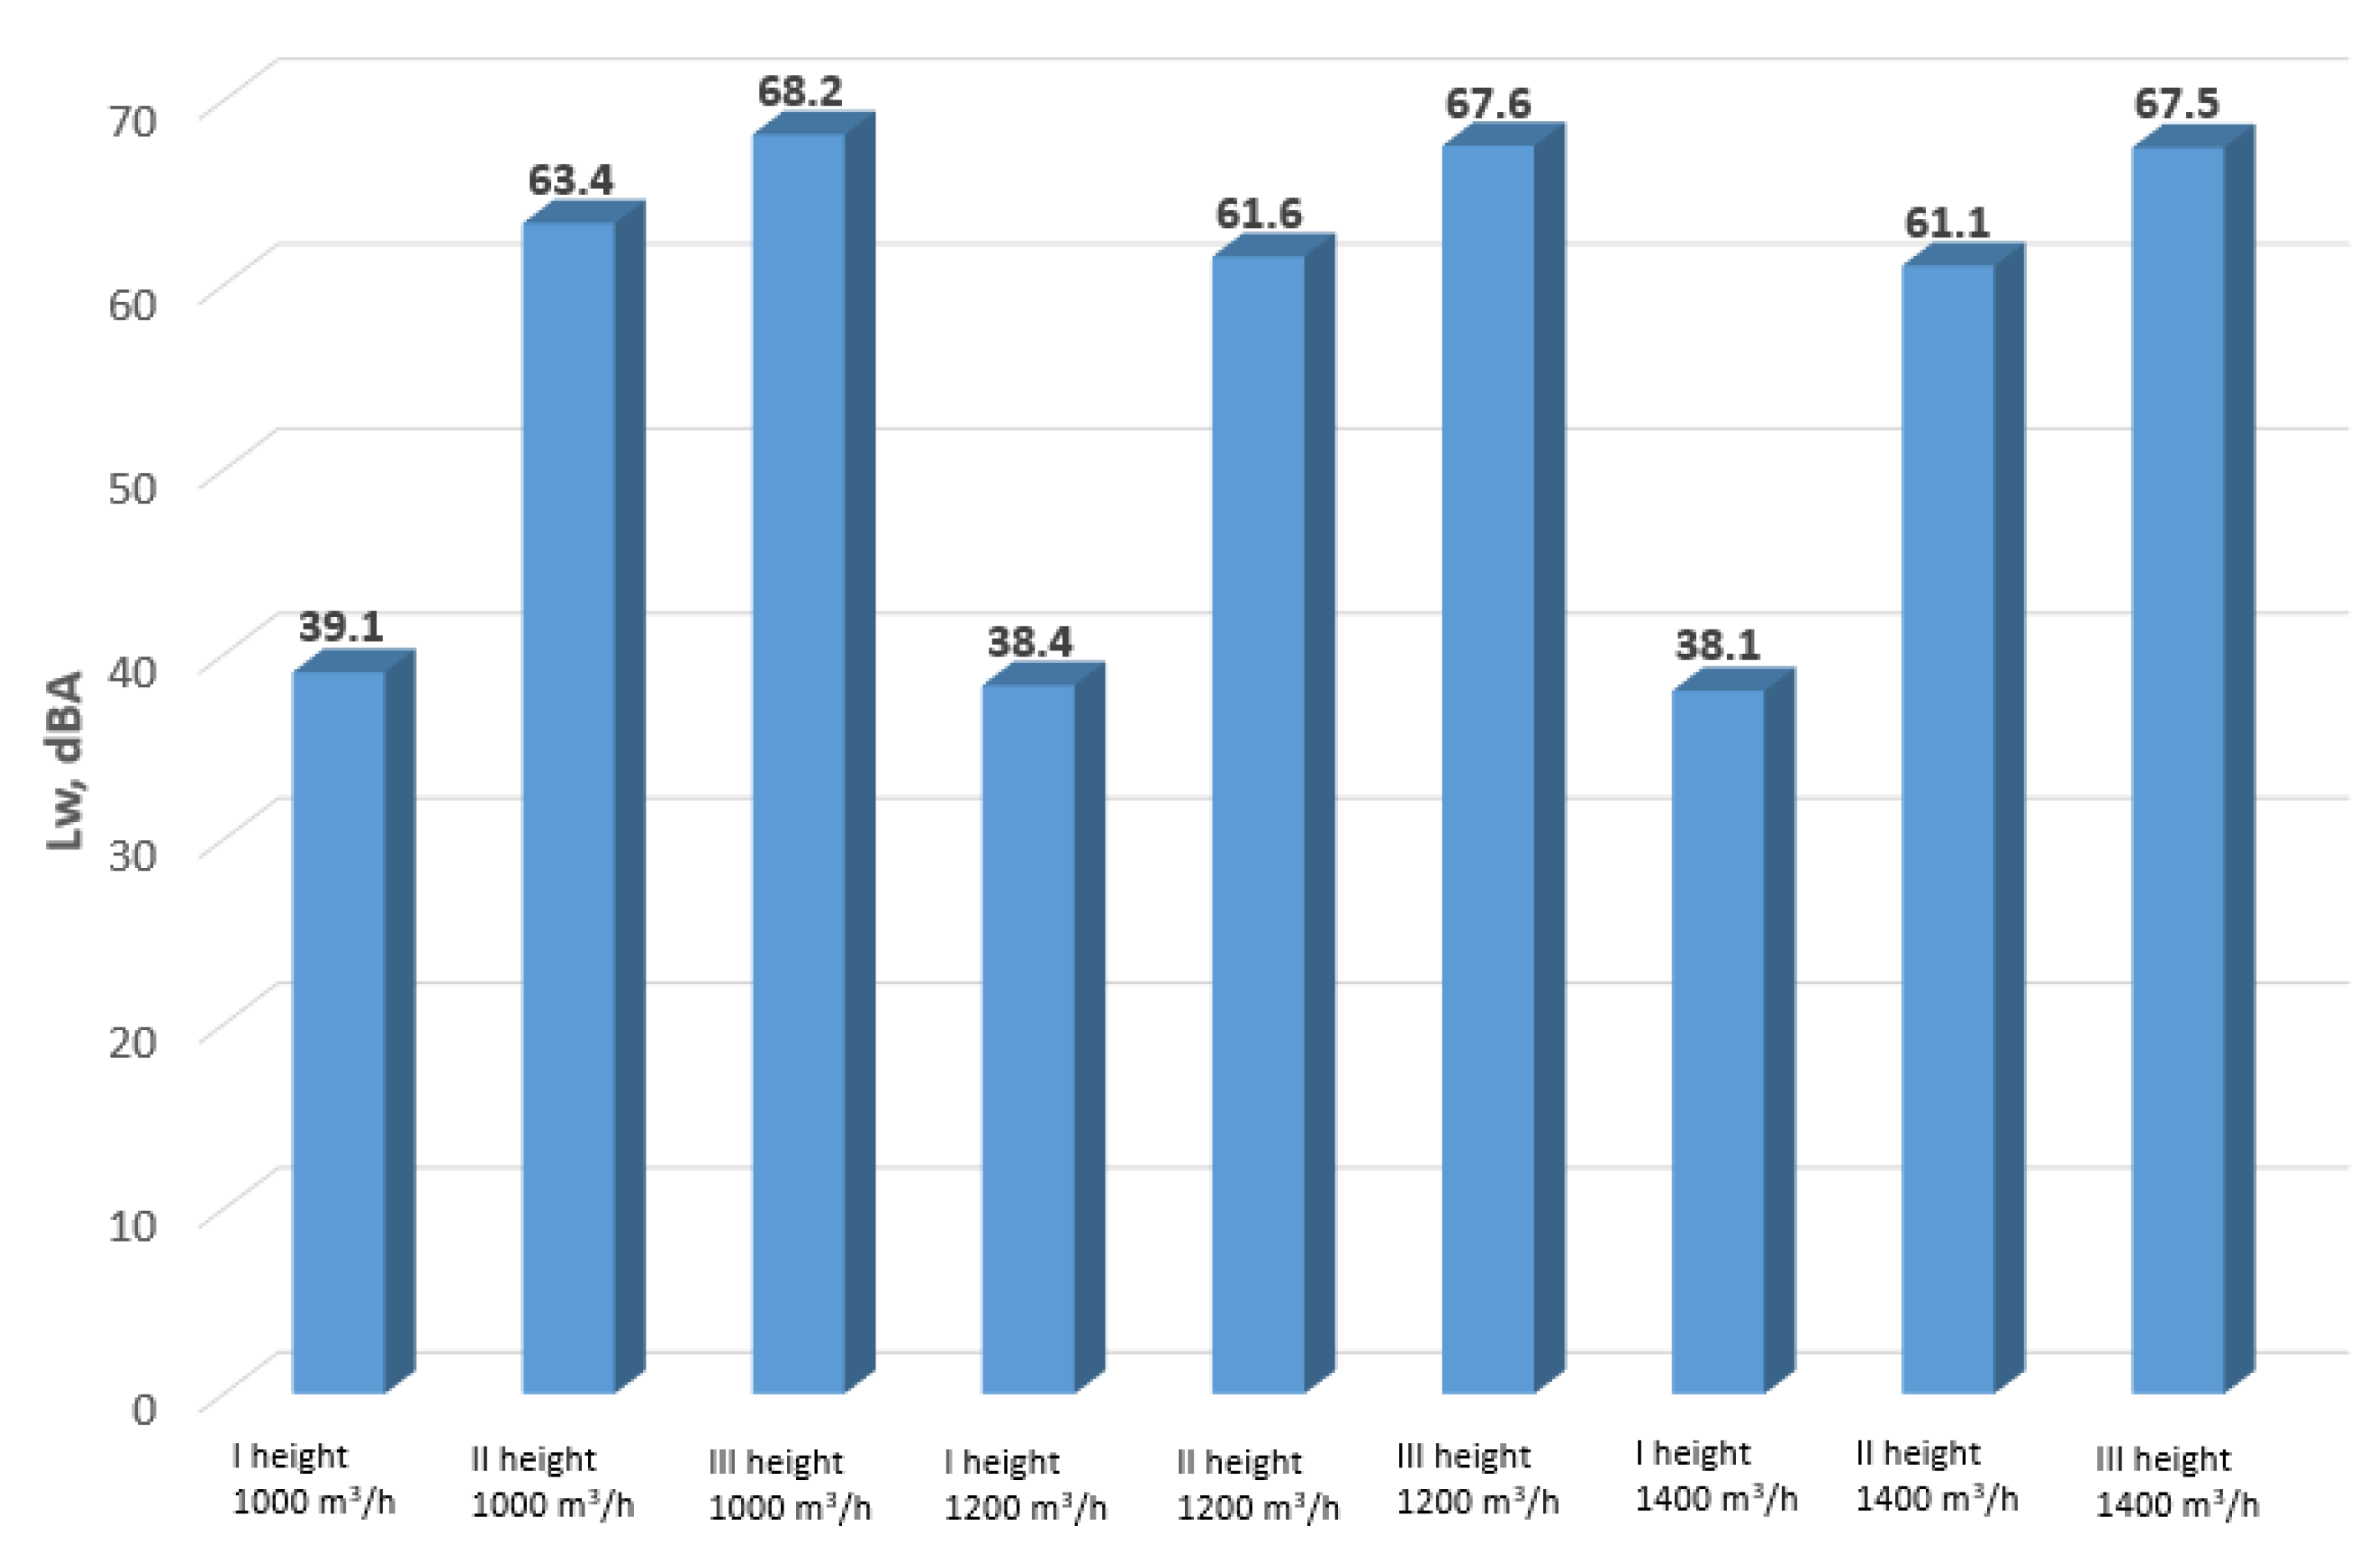
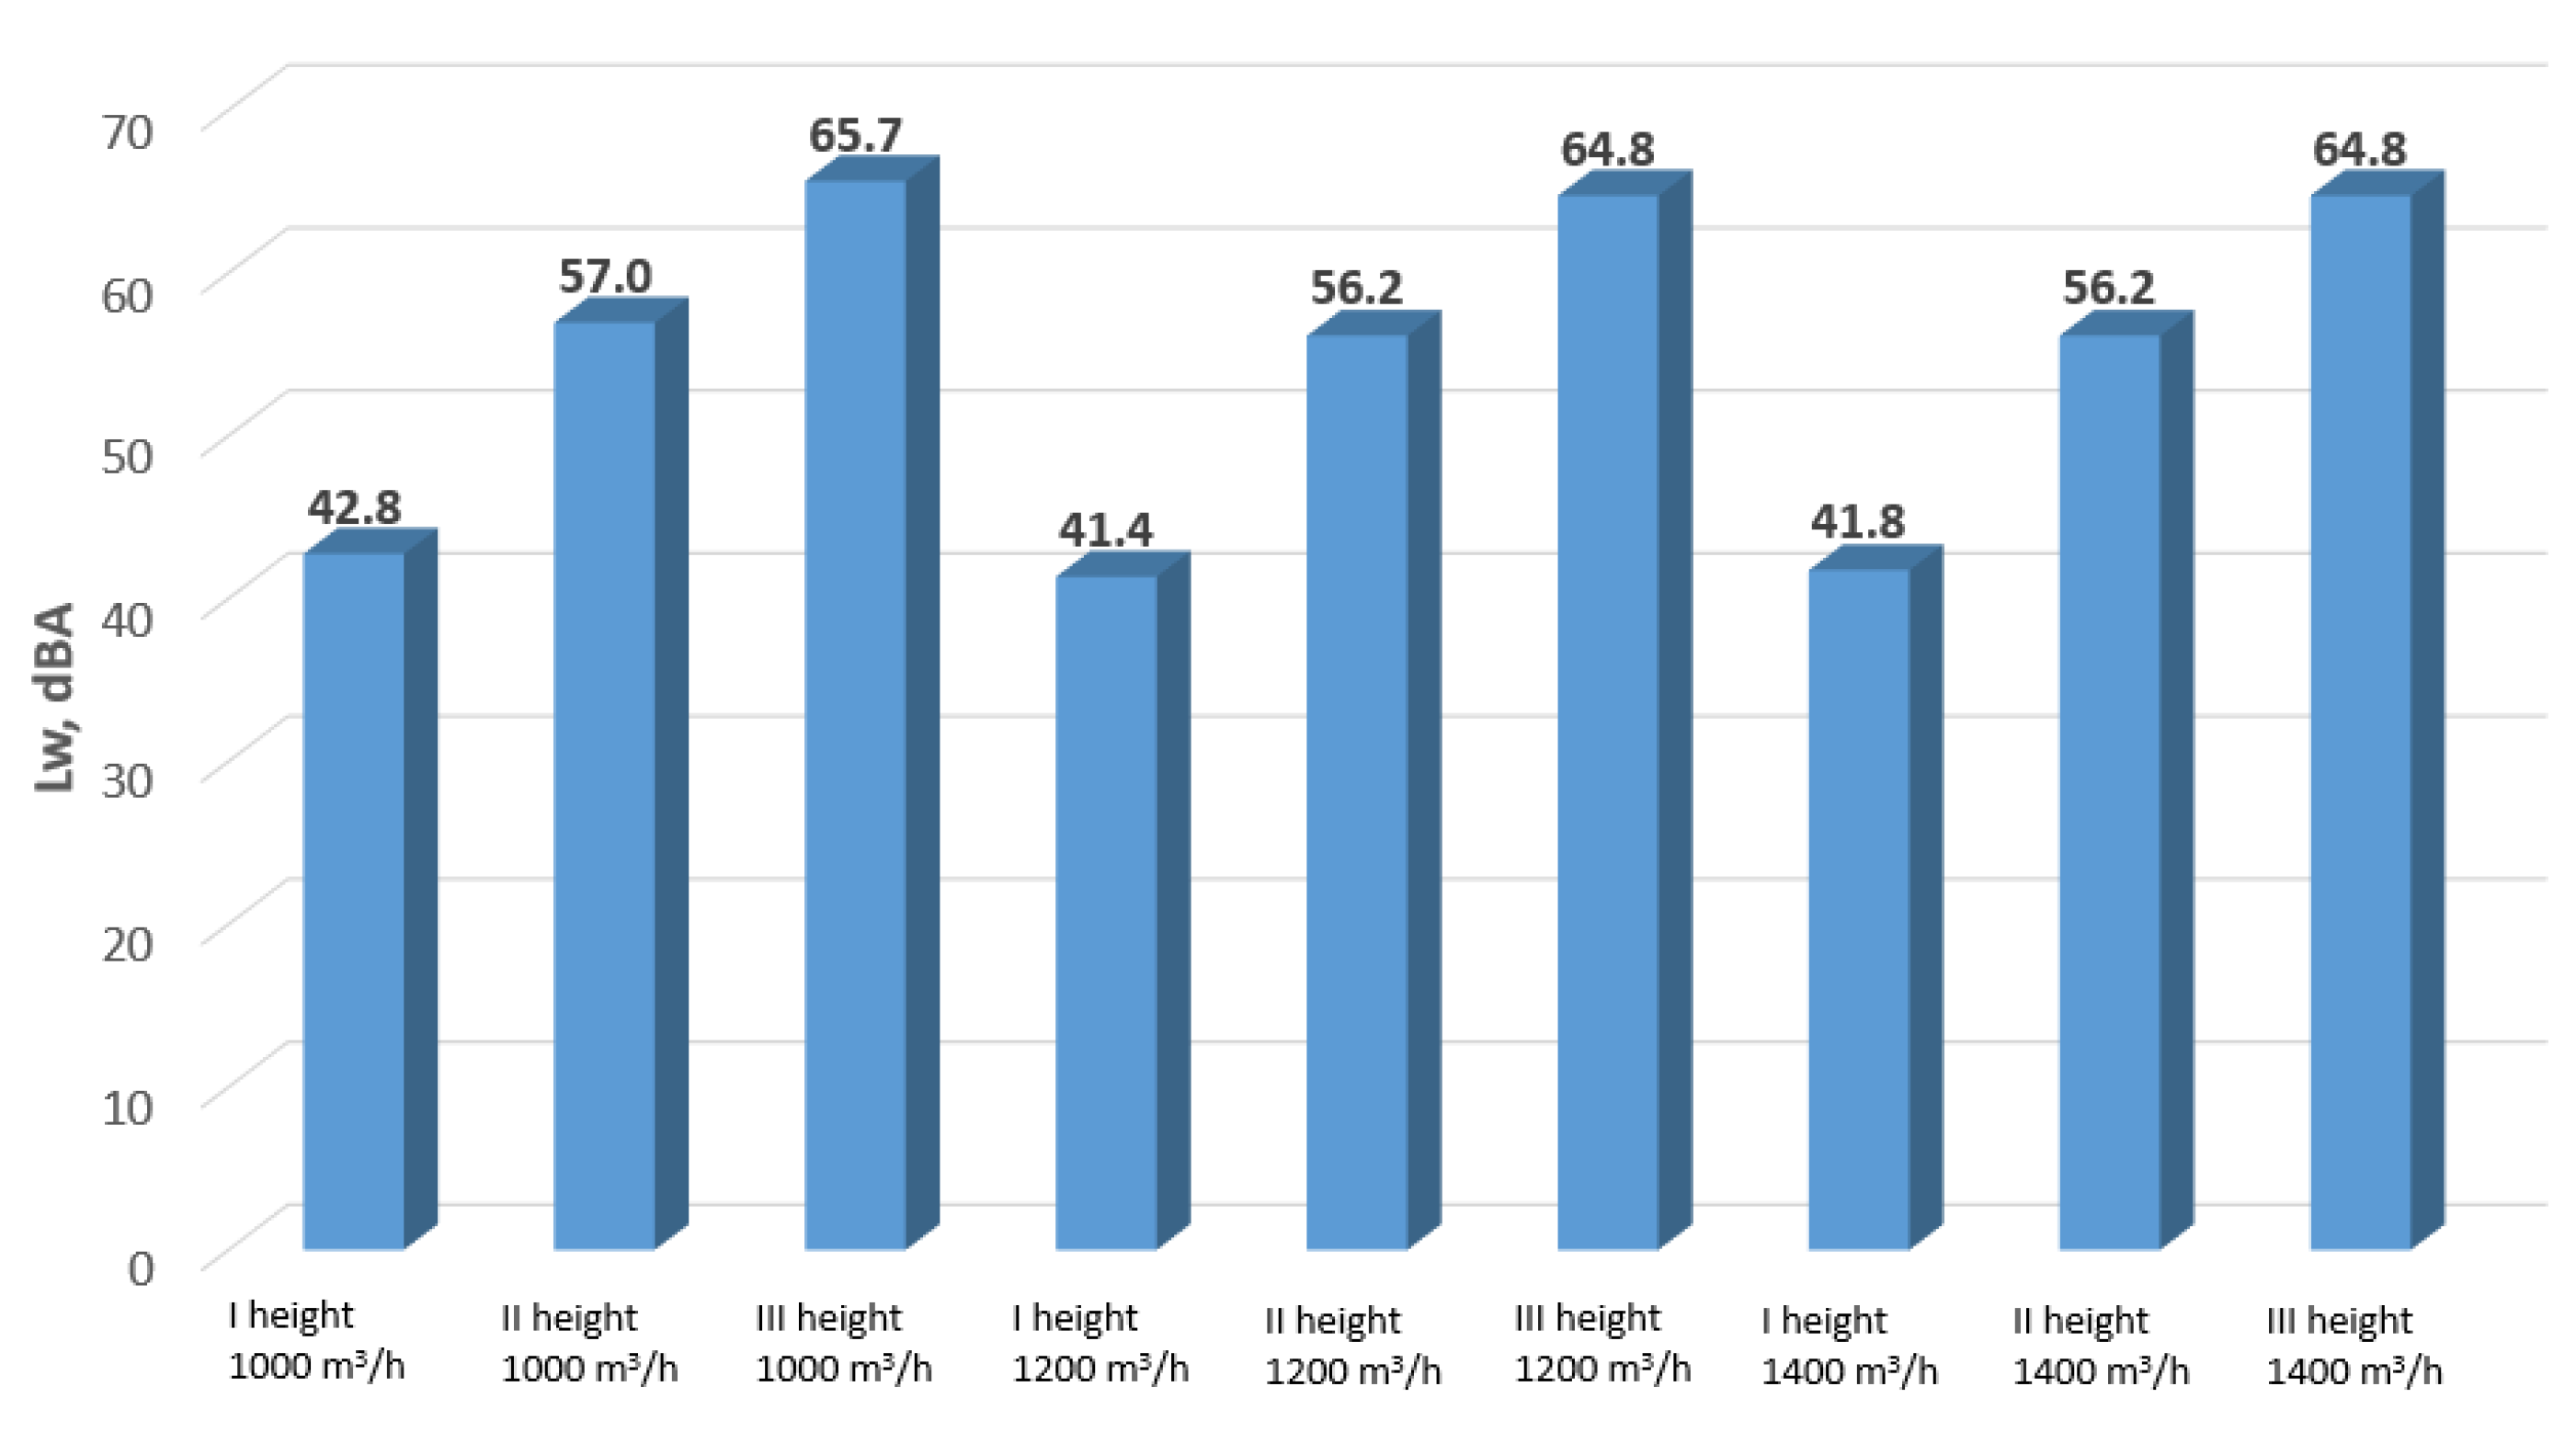
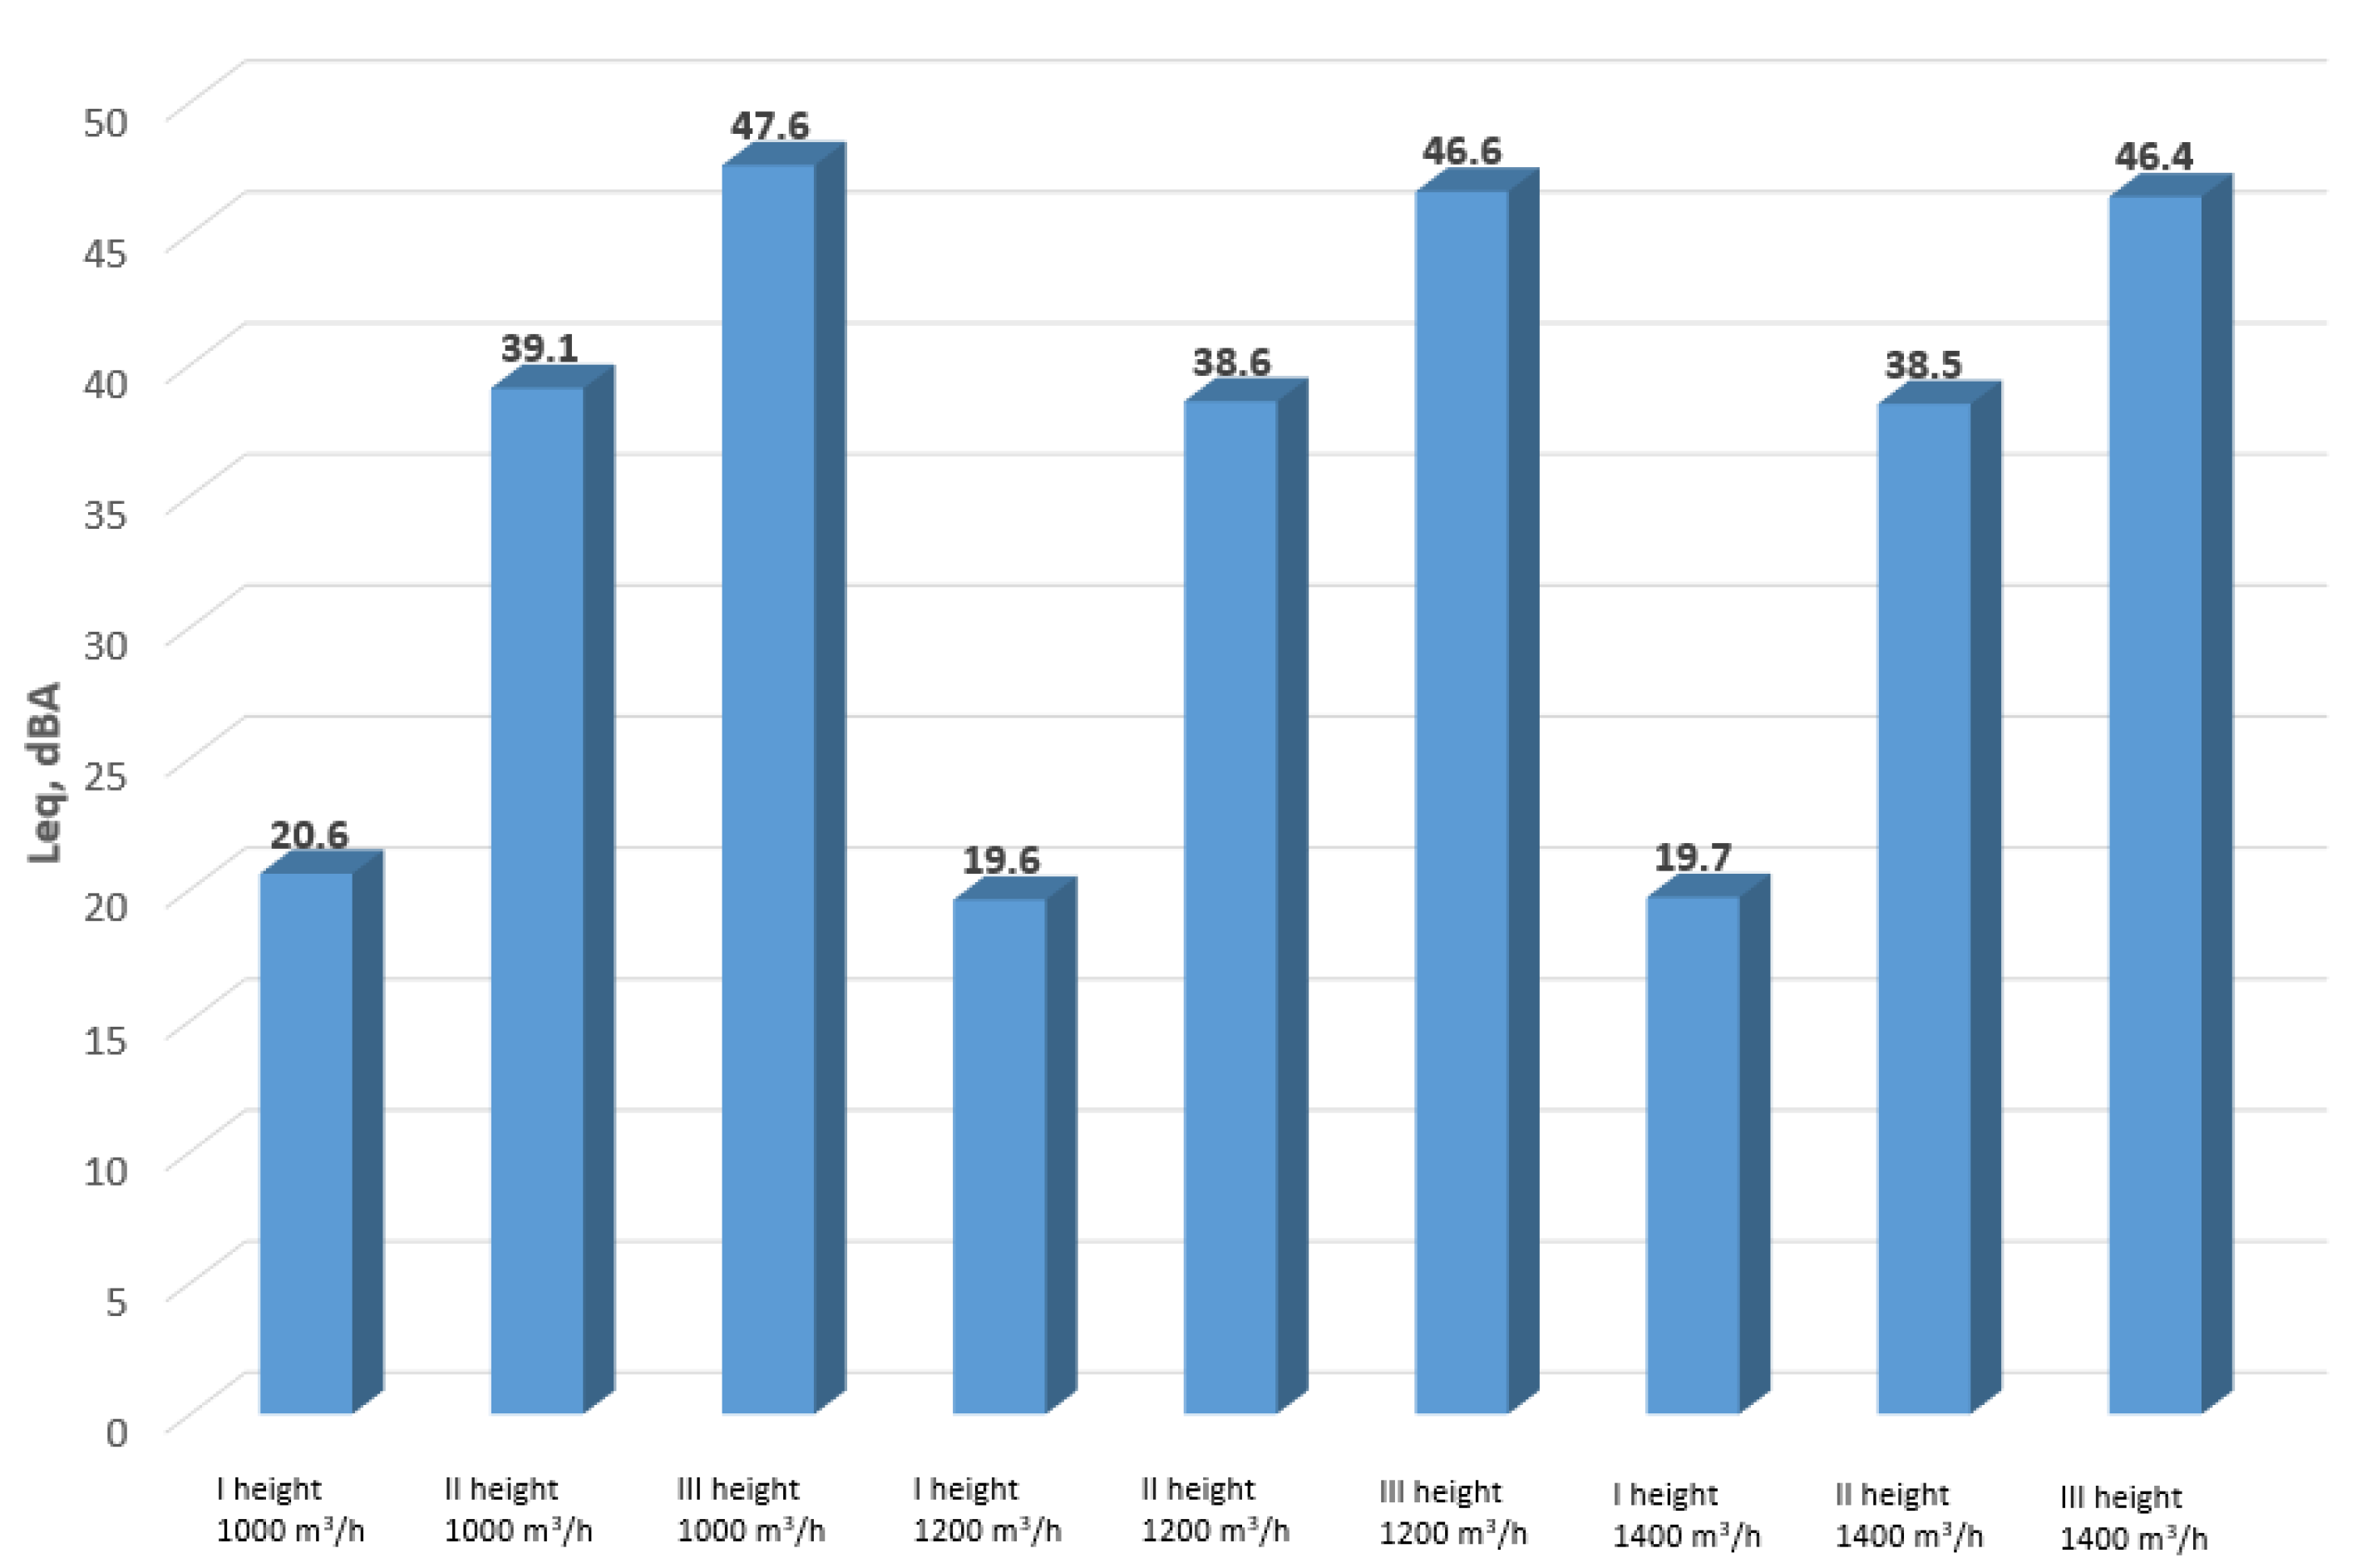
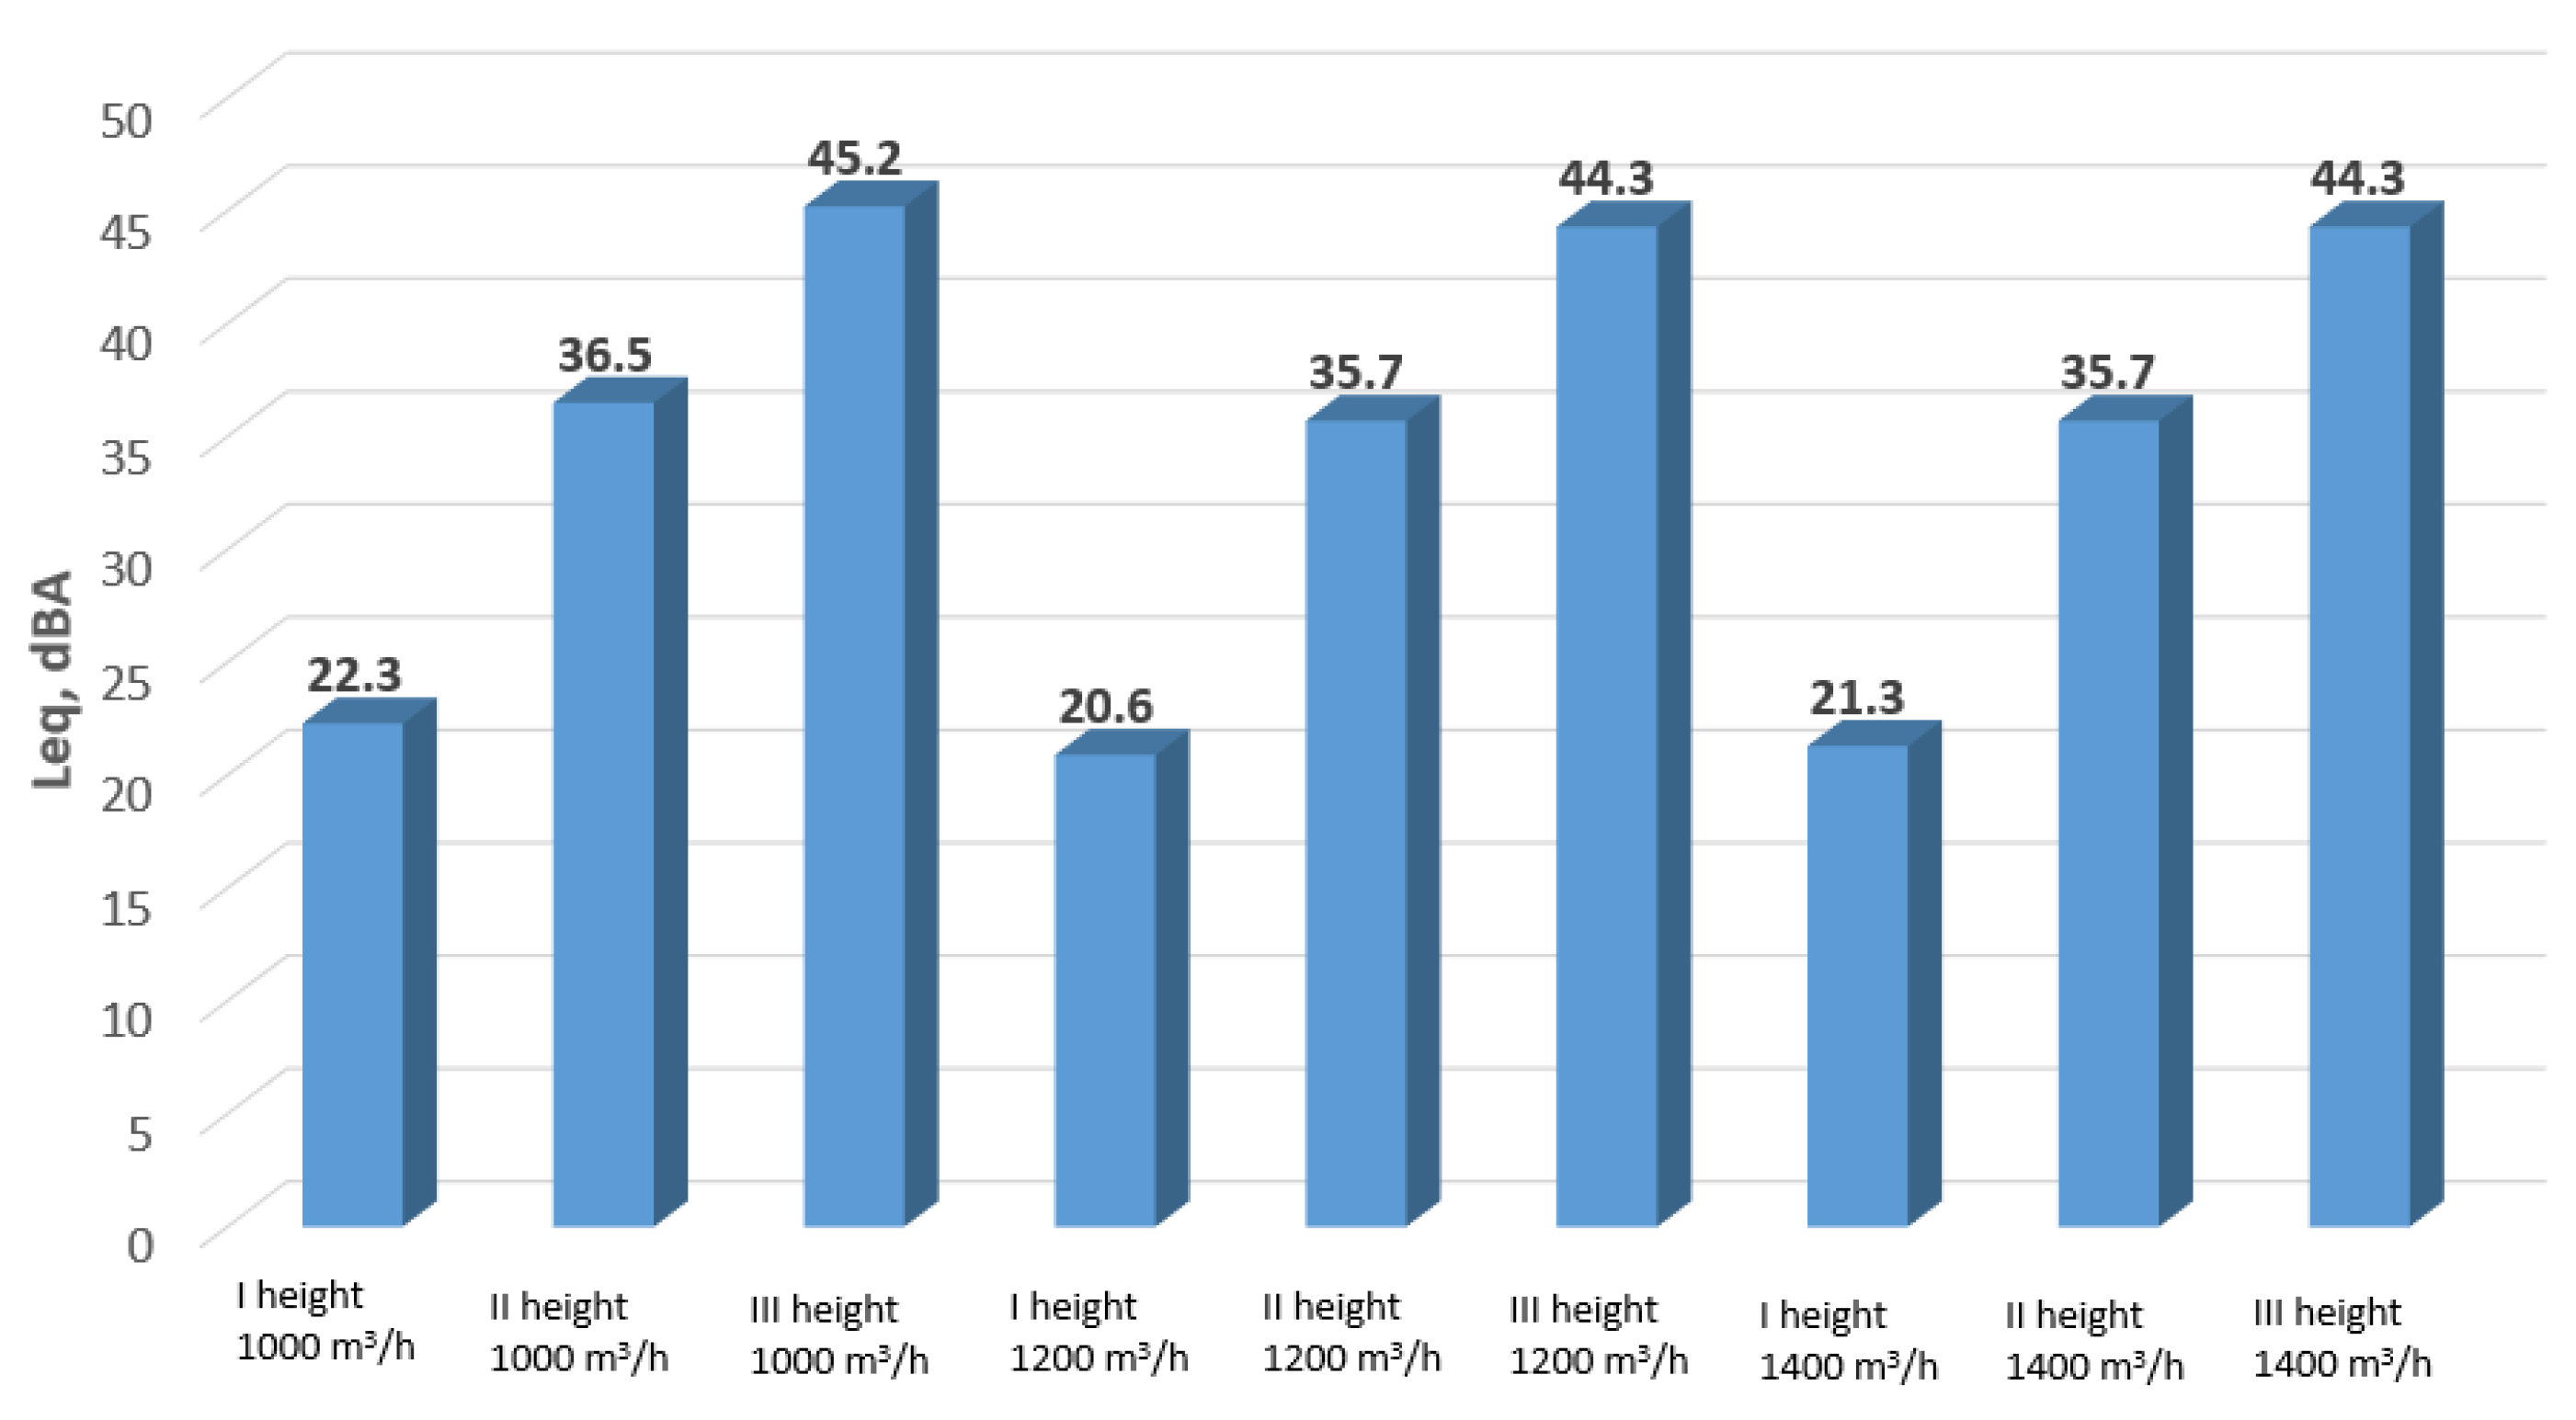
From the measured sound pressure levels were calculated single parameters—sound power level (Lw) (Figure 17, Figure 18 and Figure 19 and Table 1) and equivalent sound level (Leq) (Figure 20, Figure 21 and Figure 22 and Table 2). Using these parameters, it is easier to compare different diffusers and their performance with norms requirements (hygiene standards).
Comparing the sound power levels of all diffusers (Figure 17, Figure 18 and Figure 19 and Table 1), we can conclude that these diffusers’ emitted sound power levels are all very similar—rectangular and square. The sound power level of all diffusers varies in the range from 38.1 dBA to 68.2 dBA (Table 1). We can see that by increasing the distance from the diffuser, the level decreases.
Sound levels of all diffusers varies in the range from 17.6 dBA to 47.7 dBA (Table 1). When comparing the noise levels emitted by all diffusers (Figure 20, Figure 21 and Figure 22 and Table 2) with the normative requirements [35] in Lithuania, it can be concluded that these diffusers comply (fulfill requirements) with the standards for public buildings, as the measured noise levels are below the permissible level range of LAeq,T = 45 dBA. Furthermore, the diffusers meet the requirements for residential buildings, where the allowable noise levels range from LAeq,T = 35–45 dBA, except in the case of an airflow of 1400 m3/h for the “A” and “B” type diffusers.

4. Conclusions

In the research, we designed and tested experimental noise reducing diffusers of three types that are light (weight is 1.7 kg and 2.8 kg, respectively, of square and rectangular shape), simple geometry (easy to change form from square and rectangular) and design (textile could be various colors), easily installed into suspended ceilings, have simple connections to the ventilation duct (this could be performed without any tools) and effortless removal for maintenance (this could be performed without any tools), and made from recycled materials. Comparing the sound power levels of all three type diffusers, we can conclude that these diffusers emit sound power levels that are very similar and do not depend on the shape of the diffuser; the noise only depends on the air flow rate, and it varies, respectively, from 42 dB to 68 dB with changing airflow rates from 1000 to 1400 m3/h. When comparing the noise levels emitted by all three type diffusers with the normative requirements, it can be concluded that these diffusers comply with the standards for public buildings, as the measured noise levels are below the permissible range of LAeq,T = 45–80 dBA. Furthermore, the diffusers meet the requirements for residential buildings, where the allowable noise levels range from LAeq,T = 35–45 dBA, except in the case of an airflow of 1400 m3/h for the “A” and “B” type diffusers.

Author Contributions

Conceptualization, K.M. and M.Ž.; methodology, K.M. and M.Ž.; validation, K.M., M.Ž. and M.J.; formal analysis, K.M.; investigation, K.M. and M.Ž.; resources, K.M.; data curation, K.M., M.J. and V.D.; writing—original draft preparation, K.M., M.J. and V.D.; writing—review and editing, K.M., M.Ž. M.J. and V.D.; project administration, V.D. All authors have read and agreed to the published version of the manuscript.

Funding

This research received no external funding.

Data Availability Statement

The original contributions presented in this study are included in the article. Further inquiries can be directed to the corresponding author.

Conflicts of Interest

The authors declare no conflict of interest.

References

  1. Mateus, N.M.; da Graça, G.C. Simulated and measured performance of displacement ventilation systems in large rotoms. Build. Environ. 2017, 114, 470–482. [Google Scholar] [CrossRef]
  2. Jing, G.; Cai, W.; Zhang, X.; Cui, C.; Liu, H.; Wang, C. An energy-saving control strategy for multi-zone demand controlled ventilation system with data-driven model and air balancing control. Energy 2020, 199, 117328. [Google Scholar] [CrossRef]
  3. Benabed, A.; Boulbair, A. Numerical analysis of thermal comfort and air freshness generated by a multi-cone diffuser with and without lobed inserts. J. Build. Eng. 2022, 54, 104632. [Google Scholar] [CrossRef]
  4. Szczepanik-Ścisło, N.; Flaga-Maryańczyk, A. Measurements and simulation of co2 concentration in a bedroom of a passive house. Technol. Trans. 2018, 9, 163–180. [Google Scholar]
  5. He, X.; Wen, Y.; Li, N.; Zou, Q.; Yang, S.; Wan, M.P.; Tang, C. Optimal fresh air distribution control strategy for multi-zone variable air volume air conditioning systems. Appl. Therm. Eng. 2025, 279 Pt C, 127696. [Google Scholar] [CrossRef]
  6. Ostmann, P.; Kremer, M.; Müller, D. Identifying and optimizing the aeroacoustic source regions of a slot air diffuser. Appl. Acoust. 2025, 241, 111002. [Google Scholar] [CrossRef]
  7. Guyot, G.; Shermanc, M.H.; Walker, I.S. Smart ventilation energy and indoor air quality performance in residential buildings: A review. Energy Build. 2018, 165, 416–430. [Google Scholar] [CrossRef]
  8. Polverini, D. Energy efficient ventilation units: The role of the Ecodesign and Energy Labelling regulations. Energy Build. 2018, 175, 141–147. [Google Scholar] [CrossRef]
  9. Canha, N.; Lage, J.; Candeias, S.; Alves, C.; Marta, S. Almeida Indoor air quality during sleep under different ventilation patterns. Atmos. Pollut. Res. 2017, 8, 1132–1142. [Google Scholar] [CrossRef]
  10. Hernandez, G.; Borge, R.; Blanchon, D.; Berry, T.A. Impact of positive pressure ventilation systems on indoor air quality in residential settings. Build. Environ. 2025, 283, 113323. [Google Scholar] [CrossRef]
  11. Krusaa, M.R.; Hviid, A.C. Combining suspended radiant ceiling with diffuse ventilation—Numerical performance analysis of low-energy office space in a temperate climate. J. Build. Eng. 2021, 38, 102161. [Google Scholar] [CrossRef]
  12. Saad, M.; William, M.A.; Hassan, A.A.; Hanafy, A.A. Influence of air ceiling diffusers in enclosed spaces: An experimental and numerical investigation. Energy Rep. 2023, 9, 59–71. [Google Scholar] [CrossRef]
  13. Jaszczur, M.; Madejski, P.; Borowski, M.; Karch, M. Experimental Analysis of the Air Stream Generated by Square Ceiling Diffusers to Reduce Energy Consumption and Improve Thermal Comfort. Heat Transfer Eng. 2022, 43, 463–473. [Google Scholar] [CrossRef]
  14. Chen, F.; Hou, Y.; Yuan, X.; Fang, Z.; Cheng, W.; Wang, J.; Xie, T.; Yin, Z.; Du, Z. Characteristics of airflow under stratum ventilation induced by fabric air dispersion system with orifices. J. Build. Eng. 2025, 102, 111936. [Google Scholar] [CrossRef]
  15. Hekal, M.; El-Maghlany, W.M.; Eldrainy, Y.A.; El-Adawy, M. Hydro-thermal performance of fabric air duct (FAD): Experimental and CFD simulation assessments. Case Stud. Therm. Eng. 2023, 47, 103107. [Google Scholar] [CrossRef]
  16. Nielsen, P.V.; Topp, C.; Sønnichsen, M.; Andersen, H. Air distribution in rooms generated by a textile terminal-comparison with mixing and displacement ventilation. In Proceedings of the Winter Meeting of the American-Society-of-Heating, Refrigerating and Air-Conditioning Engineers, Orlando, FL, USA, 5–9 February 2005; American Society of Heating, Refrigeration and Air Conditioning Engineers: Atlanta, GA, USA, 2005. [Google Scholar]
  17. Fontanini, A.; Olsen, M.G.; Ganapathysubramanian, B. Thermal comparison between ceiling diffusers and fabric ductwork diffusers for green buildings. Energy Build. 2011, 43, 2973–2987. [Google Scholar] [CrossRef]
  18. Aziz, M.A.; Gad, I.A.M.; Mohammed, E.S.F.A.; Mohammed, R.H. Experimental and numerical study of influence of air ceiling diffusers on room air flow characteristics. Energy Build. 2012, 55, 738–746. [Google Scholar] [CrossRef]
  19. Awwada, A.; Mohameda, M.H.; Fatouh, M. Optimal design of a louver face ceiling diffuser using CFD to improve occupant’s thermal comfort. J. Build. Eng. 2017, 11, 134–157. [Google Scholar] [CrossRef]
  20. Srebric, J.; Chen, Q. Simplifiednumericalmodels for complex air supplydiffusers. HVAC R Res. 2002, 8, 277–294. [Google Scholar] [CrossRef]
  21. Okochi, G.S.; Yao, Y. A review of recent developments and technological advancements of variable-air-volume (VAV) air-conditioning systems. Renew. Sustain. Energy Rev. 2016, 59, 784–817. [Google Scholar] [CrossRef]
  22. Awwad, A.; Abdelsamie, A.; Mohamed, M.H.; Fatouh, M. A new generation of a ceiling air outlet using multi-objective optimization technique. Energy 2023, 278, 127827. [Google Scholar] [CrossRef]
  23. Pieren, R.; Schäffer, B.; Schoenwald, S.; Eggenschwiler, K. Sound absorption of textile curtains—Theoretical models and validations by experiments and simulations. Text. Res. J. 2016, 88, 36–48. [Google Scholar] [CrossRef]
  24. Prasetiyo, I.; Muqowi, E.; Putra, A.; Novenbrianty, M.; Desendra, G.; Adhika, D.R. Modelling sound absorption of tunable double layer woven fabrics. Appl. Acoust. 2020, 157, 107008. [Google Scholar] [CrossRef]
  25. Thilagavathi, G.; Krishnan, S.N.; Muthukumar, N. Investigations on Sound Absorption Properties of Luffa Fibrous. Mats. J. Nat. Fibers 2017, 15, 445–451. [Google Scholar] [CrossRef]
  26. Koruk, H.; Ozcan, A.C.; Genc, G.; Sanliturk, K.Y. Jute and Luffa Fiber-Reinforced Biocomposites: Effects of Sample Thickness and Fiber/Resin Ratio on Sound Absorption and Transmission Loss Performance. J. Nat. Fibers 2022, 19, 6239–6254. [Google Scholar] [CrossRef]
  27. Chen, F.; Chen, H.; Xie, J.; Shu, Z.; Mao, J. Air distribution in room ventilated by fabric air dispersion system. Build. Environ. 2011, 46, 2121–2129. [Google Scholar] [CrossRef]
  28. Raphe, P.; Fellouah, H.; Poncet, S.; Ameur, M. Ventilation effectiveness of uniform and non-uniform perforated duct diffusers at office room. Build. Environ. 2021, 204, 108118. [Google Scholar] [CrossRef]
  29. Chen, F.; Chen, H.; Wang, H.; Wang, S.; Wang, J.; Wang, X.; Qian, Z. Parametrical analysis on characteristics of airflow generated by fabric air dispersion system in penetration mode. Energy Build. 2013, 67, 365–373. [Google Scholar] [CrossRef]
  30. Wang, X.; Li, A. Airflow characteristics generated by fabric air dispersion ventilation. Indoor Built Environ. 2015, 24, 1059–1068. [Google Scholar] [CrossRef]
  31. Chen, F.-J.; Wu, Q.-Y.; Huang, D.-D.; Wang, H. Indoor air flow motions caused by the fabric air dispersion system: A simplified method for CFD simulations. Indoor Built Environ. 2015, 26, 841–854. [Google Scholar] [CrossRef]
  32. ISO 3741:2010; Determination of Sound Power Levels and Sound Energy Levels of Noise Sources Using Sound Pressure—Precision Methods for Reverberation Test Rooms. International Organization for Standardization: Geneva, Switzerland, 2010.
  33. ISO 5135:2020; Determination of Sound Power Levels of Noise From Air-Terminal Devices, Air-Terminal Units, Dampers and Valves by Measurement in a Reverberation Test Room. International Organization for Standardization: Geneva, Switzerland, 2020.
  34. ISO 3382-2:2008; Acoustics—Measurement of Room Acoustic Parameters—Part 2: Reverberation Time in Ordinary Rooms. International Organization for Standardization: Geneva, Switzerland, 2008.
  35. Lithuanian Hygiene Standards HN 33:2011; Noise Limit Values in Residential and Public Buildings and Their Surroundings. Ministry of Health of the Republic of Lithuania: Vilnius, Lithuania, 2011.
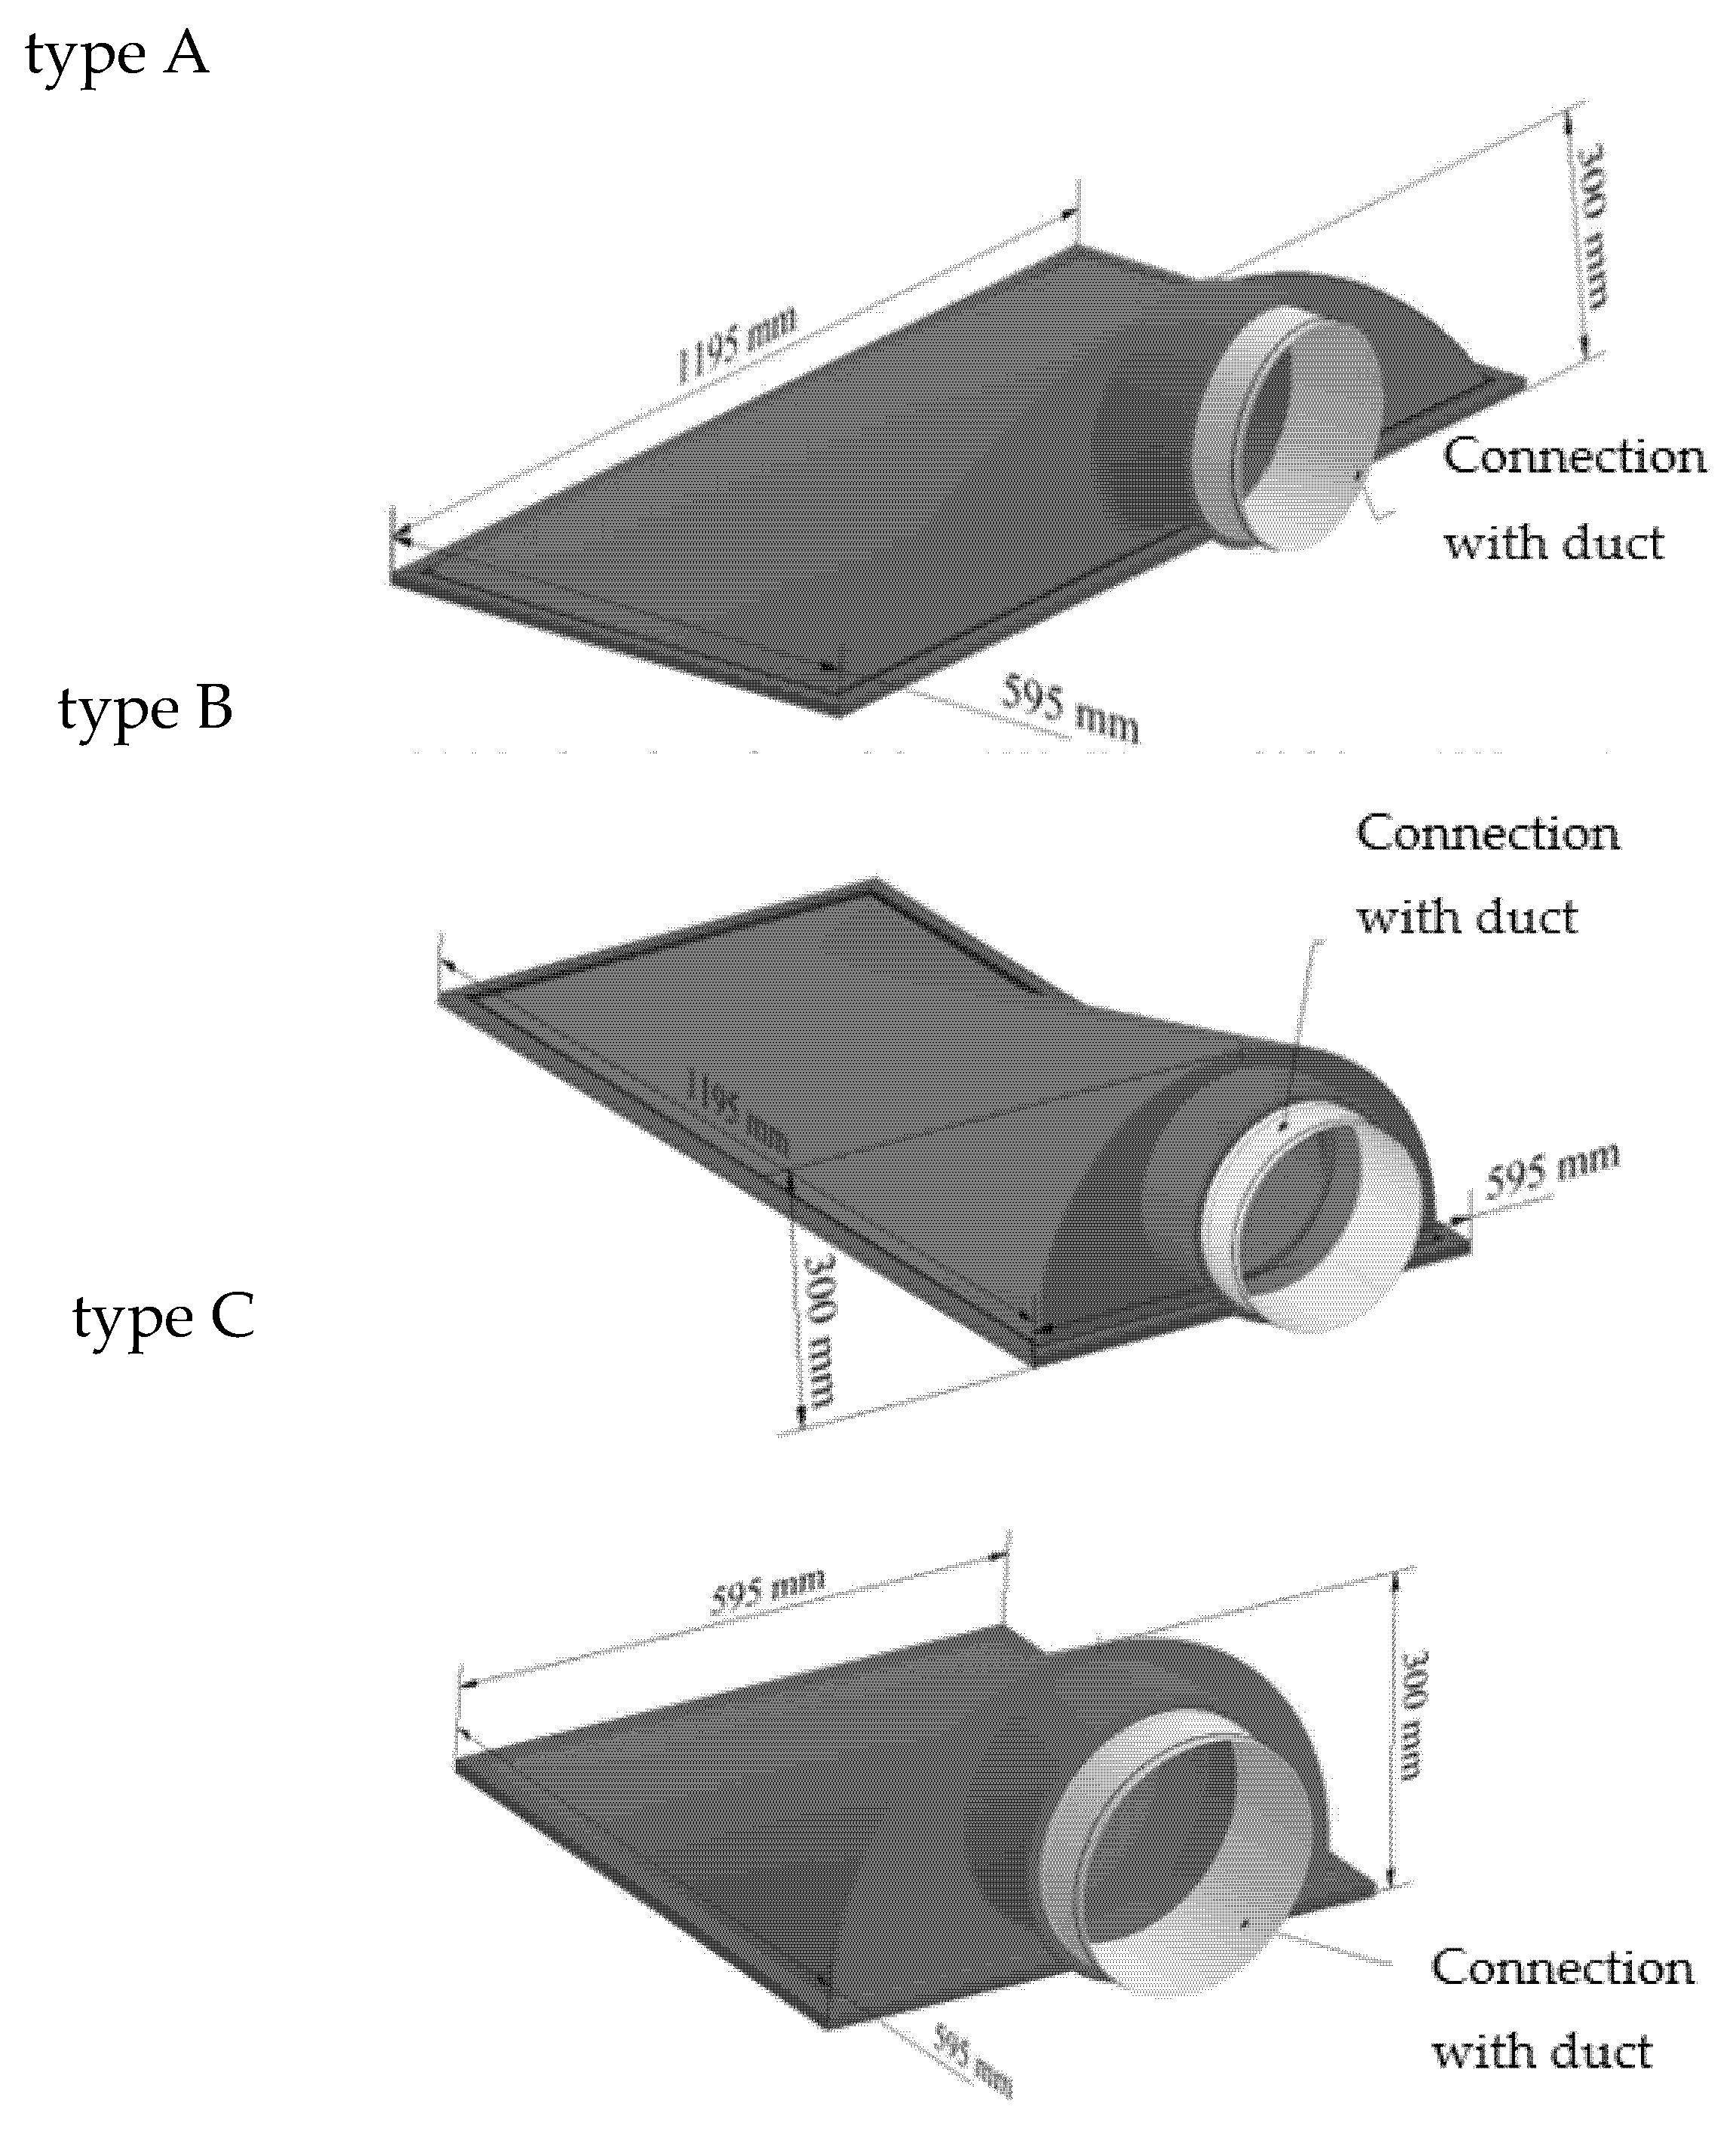
Figure 1. Types of diffusers.
Buildings 15 03775 g001
Figure 2. The principal scheme of the diffuser. 1—outside layer of airtight textile; 2—insulation mat for noise reduction; 3—inside layer of airtight textile; 4—silicone sealing; 5—aluminum frame; 6—bottom side with micro perforation; 7—connection with duct from airtight textile.
Buildings 15 03775 g002
Figure 3. The view of the lower side of the diffuser. (A)—“C” type diffuser; (B)—“A” and “B” type diffusers.
Buildings 15 03775 g003
Figure 4. Climate research chamber location plan.
Buildings 15 03775 g004
Figure 5. Isometric view of the climatic chamber.
Buildings 15 03775 g005
Figure 6. Diffuser orientation schemes (room ceiling plan).
Buildings 15 03775 g006
Figure 7. The noise level measurement grid on the chamber floor.
Buildings 15 03775 g007
Figure 8. Frequency dependence of the sound pressure level for the ‘A’ type diffuser (at a flow of 1000 m3/h).
Buildings 15 03775 g008
Figure 9. Frequency dependence of the sound pressure level for the ‘A’ type diffuser (at a flow of 1200 m3/h).
Buildings 15 03775 g009
Figure 10. Frequency dependence of the sound pressure level for the ‘A’ type diffuser (at a flow of 1400 m3/h).
Buildings 15 03775 g010
Figure 11. Frequency dependence of the sound pressure level for the ‘B’ type diffuser (at a flow of 1000 m3/h).
Buildings 15 03775 g011
Figure 12. Frequency dependence of the sound pressure level for the ‘B’ type diffuser (at a flow of 1200 m3/h).
Buildings 15 03775 g012
Figure 13. Frequency dependence of the sound pressure level for the ‘B’ type diffuser (at a flow of 1400 m3/h).
Buildings 15 03775 g013
Figure 14. Frequency dependence of the sound pressure level for the ‘C’ type diffuser (at a flow of 1000 m3/h).
Buildings 15 03775 g014
Figure 15. Frequency dependence of the sound pressure level for the ‘C’ type diffuser (at a flow of 1200 m3/h).
Buildings 15 03775 g015
Figure 16. Frequency dependence of the sound pressure level for the ‘C’ type diffuser (at a flow of 1400 m3/h).
Buildings 15 03775 g016
Figure 17. Sound power with the Type “A” diffuser.
Buildings 15 03775 g017
Figure 18. Sound power with the Type “B” diffuser.
Buildings 15 03775 g018
Figure 19. Sound power with the Type “C” diffuser.
Buildings 15 03775 g019
Figure 20. Noise level measurements with the Type “A” diffuser.
Buildings 15 03775 g020
Figure 21. Noise level measurements with the Type “B” diffuser.
Buildings 15 03775 g021
Figure 22. Noise level measurements with the Type “C” diffuser.
Buildings 15 03775 g022
Table 1. Sound power levels of diffusers (dBA).
Flow m3/h100012001400
Diffuser/HeightIIIIIIIIIIIIIIIIII
A39.163.468.238.461.667.638.161.667.5
B41.159.668.140.159.167.140.259.066.9
C42.857.065.741.456.264.841.856.264.8
Table 2. Noise levels of diffusers (dBA).
Flow m3/h100012001400
Diffuser/HeightIIIIIIIIIIIIIIIIII
A18.642.947.717.941.147.117.640.647.0
B20.639.147.619.638.646.619.738.546.4
C22.336.545.220.935.744.321.335.744.3
Disclaimer/Publisher’s Note: The statements, opinions and data contained in all publications are solely those of the individual author(s) and contributor(s) and not of MDPI and/or the editor(s). MDPI and/or the editor(s) disclaim responsibility for any injury to people or property resulting from any ideas, methods, instructions or products referred to in the content.