Article

Integrating PC Splitting Design and Construction Organization Through Multi-Agent Simulation for Prefabricated Buildings

1
Shanghai Jianke Engineering Consulting Co., Ltd., Shanghai 200032, China
2
School of Management, Shanghai University of Engineering Science, Shanghai 201620, China
*
Author to whom correspondence should be addressed.
Buildings 2025, 15(20), 3773; https://doi.org/10.3390/buildings15203773
Submission received: 16 September 2025 / Revised: 8 October 2025 / Accepted: 14 October 2025 / Published: 19 October 2025
(This article belongs to the Special Issue Advanced Research on Intelligent Building Construction and Management)

Abstract

Prefabricated building projects represent industrialized and intelligent construction through factory production, standardized design, and mechanized assembly. This study presents a multi-agent simulation approach to model the prefabricated construction process, allowing for the concurrent optimization of the prefabricated component (PC) splitting design and the construction organization plan through iterative simulation. (1) Employing a questionnaire survey, it identifies critical factors affecting schedule and cost from a design–construction coordination perspective. (2) Based on these findings, an agent-based model was developed incorporating PC installation, crane operations, and storage yard spatial constraints, along with interaction rules governing these agents. (3) Data interoperability was achieved among Revit, NetLogo3D and Navisworks. This integrated environment offers project managers digital management of design and construction plans, simulation support, and visualization tools. Simulation results confirm that a hybrid resource allocation strategy utilizing both tower cranes and mobile cranes enhances resource leveling, accelerates schedule performance, and improves cost efficiency.

1. Introduction

1.1. Background

By the end of 2020, the cumulative floor area of prefabricated buildings mandated at the land conveyance stage in Shanghai totaled approximately 150 million square meters. In 2020, newly started prefabricated construction comprised approximately 91.7% of the total above-ground floor area of all new building projects in Shanghai [1]. Prefabricated construction significantly shortens project timelines by enabling factory production of components to occur concurrently with on-site foundation work. This parallel process, coupled with rapid on-site assembly, reduces overall duration by up to 30%. Furthermore, it drastically cuts labor needs by shifting skilled work to controlled factory settings, minimizing on-site manpower and enhancing safety, thus alleviating reliance on scarce skilled labor. Despite numerous advantages, prefabricated construction is often perceived as less cost-effective compared to conventional cast-in-place construction. One of the main reasons for this perception is the lack of coordination among various distinct operations, such as production, transportation, and on-site assembly of prefabricated components [2].

1.2. Problem Statement

Buildings where part or all of the components are prefabricated in a factory, then transported to the construction site and assembled through reliable connections, are called prefabricated buildings. The precast components are composed of structural elements like prefabricated beams, slabs, columns, and walls, as well as larger prefabricated units like stairs, balconies, air conditioning panels, integrated bathrooms, and integrated kitchens. The prefabricated construction process typically begins with an architectural design institute producing building drawings. Subsequently, the factory splits the components and units in the design drawings based on constraints related to production, construction, and transportation, ensuring they are producible, transportable, and constructible. Finally, the construction unit assembles the prefabricated components and units provided by the factory on-site, ensuring the completed building meets the design requirements. Therefore, reducing deviations within the closed-loop collaboration formed by design, production, and construction is a crucial issue for enhancing the quality of prefabricated construction.

1.3. Research Objectives

The prefabricated construction process places higher demands on data sharing and collaboration among design, production, and construction parties. Envision a smart project management system capable of digitally storing design drawings from the design team and production drawings from the factory, while simulating the entire assembly and construction process for the builders. If the simulation reveals component processing errors that fail to meet construction constraints, feedback can be promptly provided to the factory. When the simulation flags progress or cost performance below expectations, the design, production, and construction teams must synchronize their efforts to optimize their plans. Thus, intelligent engineering project management serves as the key link connecting standardized design, industrialized production, and prefabricated construction. By simulating the prefabricated construction process and resource allocation scenarios, potential issues surface early and can be addressed proactively. Digitally and intelligently coordinating management across design, production, and construction stakeholders from the owner’s perspective represents an essential embodiment of China’s construction industry modernization.

2. Literature Review

2.1. Multi-Agent Simulation Technology in Construction Project Management

The applications of multi-agent systems (MAS) are considered to be among the most promising paradigms for detailed investigations and reliable problem-solving methods, and MAS applications make it possible for researchers and practitioners to better understand complex systems [3]. With its unique capacity to simulate dynamic, bottom-up interactions, the MAS provides innovative solutions to numerous challenges in construction project management practice [4].
The MAS can simulate the complete construction supply chain, from precast manufacturing to on-site installation. By modeling supply chain participants (e.g., modeling suppliers, transporters) and prefabricated modules as agents, project managers can assess logistics strategies to decrease delays, reduce costs, and refine just-in-time delivery systems [5]. Through agent-based modeling, it can simulate the construction environment to determine the relationship between crew size and unit duration changes [6]. The MAS is developed to orchestrate the sequence of inter-group construction activities, addressing factors such as site congestion, worker movements, and material consumption [7]. The MAS can additionally study the general emergence of results through the adjustment of agent attributes and serves as a reliable tool to predict the impact of construction measures for on-site managers [8]. The multi-agent-based simulation system can help managers to test and quantify the impact of different construction strategies so as to choose the most effective one to execute [9].
The building information modeling (BIM) and agent-based modeling (ABM) integration method highlighted benefits to construction projects, reduced construction costs, and enhanced productivity [10]. The integration of reinforcement learning and agent-based simulation approaches can be used to optimize project duration under resource constraints and support construction practitioners in project planning decision-making [11]. The integration of expert knowledge with sophisticated simulation tools offers significant value, providing managers with a powerful resource to navigate project complexities, enhance strategic planning, and ultimately improve the likelihood of successful project execution and completion [12].
Multi-Agent Systems (MAS) decompose a system into a large number of ‘agents’ with diverse attributes and behavioral rules. This approach naturally simulates the interactions and adaptations between individuals, thereby effectively demonstrating macroscopic emergent behavior in a bottom-up manner. In contrast, traditional macro-level models like System Dynamics typically rely on averages or assumed aggregation rules for top-down modeling, making it difficult to capture the complex emergent phenomena arising from individual heterogeneity and local interactions.
Regarding the simulation mechanism, MAS is more flexible, as it can adopt either event-driven or time-stepped approaches, with its core focus being the modeling of synchronous or asynchronous interactions among agents. Discrete Event Simulation (DES), on the other hand, strictly adheres to an event-triggered clock advancement mechanism and is more suitable for scenarios centered around discrete processes, such as queuing systems.
Appropriate multi-agent decision-making can effectively coordinate and integrate the needs or expectations of all stakeholders, which can reduce conflicts, improve the success probability of the project, maximize the overall returns on interest, and contribute to the project’s sustainability [13]. On the other hand, The MAS can model the ripple effects of a design change, simulating its impact on various agents (e.g., designers, contractors, suppliers) and processes. This capability enables a more comprehensive assessment of potential cost and schedule implications prior to formal change approval.

2.2. Digital Solutions for Prefabricated Building Projects

Modular construction requires detailed and comprehensive planning, high initial costs, and navigating transportation and design constraints [14]. Integrated statistical and mathematical techniques (including distribution fitting) were utilized to develop a predictive model that computes the associated cost savings and growth [15]. The digitalized workflow can significantly reduce task duration, improve project cost assessment and evaluate the financial feasibility of semi-automation in off-site construction projects [16].
Considering the interaction between resource allocation conditions and other uncertain factors, the construction time is mainly affected by the supply of materials and weather conditions, while the familiarity level of work affects the construction time and cost [17]. The performance of precast construction is highly dependent on the effectiveness of production planning for the precast components. The multi-agent-based precast production planning model synchronizes production scheduling with resource allocation [18]. The hybrid approach that combines MAS with deep learning provides scenario-based estimations of CO2 emissions, costs, and schedule performance for Modular-integrated construction (MIC) [19].
Recently, the construction industry has benefited from the increased application of smart construction led by the core technologies of the fourth industrial revolution, such as modular construction, BIM, AI, and AR/VR, which enhance productivity and work efficiency.

2.3. The Methods of Multi-Tower Crane Operation Management

The growing adoption of off-site construction methods has increased the critical role of cranes within the construction sector. By integrating 3D site modeling, BIM, and crane simulations within the Unity game engine, the Construction Digital Twin (CDT) overcomes the limitations of conventional 2D-based planning by providing a three-dimensional representation of site conditions [20]. The onsite crane operation management includes BIM-based multi-crane lift animation, scheduling and cost analyses, motion controlling in the BIM environment, safety monitoring and clash detection, and spatiotemporal site analyses [21]. Effective crane management is imperative to ensure that construction projects are completed on time, within budget, and with a high degree of safety [22].
Multiple tower crane layout planning (MTCLP) is a complex combinatorial problem controlled by a number of variables, such as site configuration, building layout, material storage positions, and workload [23]. The collaborative planning for stacking and installation of prefabricated building components (CPSIP) aims to minimize construction duration by preventing collisions among tower cranes operating simultaneously in overlapping areas [24]. The agent-based simulation (ABS) model has the superiority of quantitatively assessing the effect of conflict on the overall time and costs of tower crane operations. It is capable of simulating tower crane operations and interactions between different agents of the model [25]. The ABM applies a dynamic supply selection system and tests numerous scenarios to ensure the most efficient linkage between tasks, cranes, and supply locations [26]. By clarifying the transfer relationship between the component material supply point, the component initial positioning point, and the tower crane optional positioning point, as well as the cooperative relationship between each positioning point and the tower crane operation, the tower crane positioning optimization model is used to automatically calculate and generate the best positioning layout method of the tower crane on the project site [27].
In project management, progress, cost, and safety are regarded as primary objectives. There has been extensive research on the MTCLP problem, most of which, however, adopts the perspective of construction planning. Relatively less attention has been paid to the influence of design schemes, particularly prefabricated component splitting schemes, on MTCLP.

3. Methods

While prefabricated buildings can be categorized by structural materials (concrete, steel, timber, hybrid) and functional use (residential, commercial, mixed-use), this research specifically investigates projects involving prefabricated concrete residential buildings. As shown in Figure 1, a hybrid online and offline questionnaire was administered to practitioners in the prefabricated construction industry to identify key factors influencing the interaction between PC splitting designs and construction organization plans. The empirical data gathered, combined with a comprehensive literature review, served as the foundation for developing the multi-agent simulation (MAS) model, which represents the prefabricated construction process and its internal interactions. The validity of the MAS model was then assessed through a case study using the NetLogo 3D platform. Finally, data interoperability among Revit, NetLogo 3D, and Navisworks was achieved, enabling the implementation of BIM 5D in engineering practice.

3.1. Questionnaire Survey

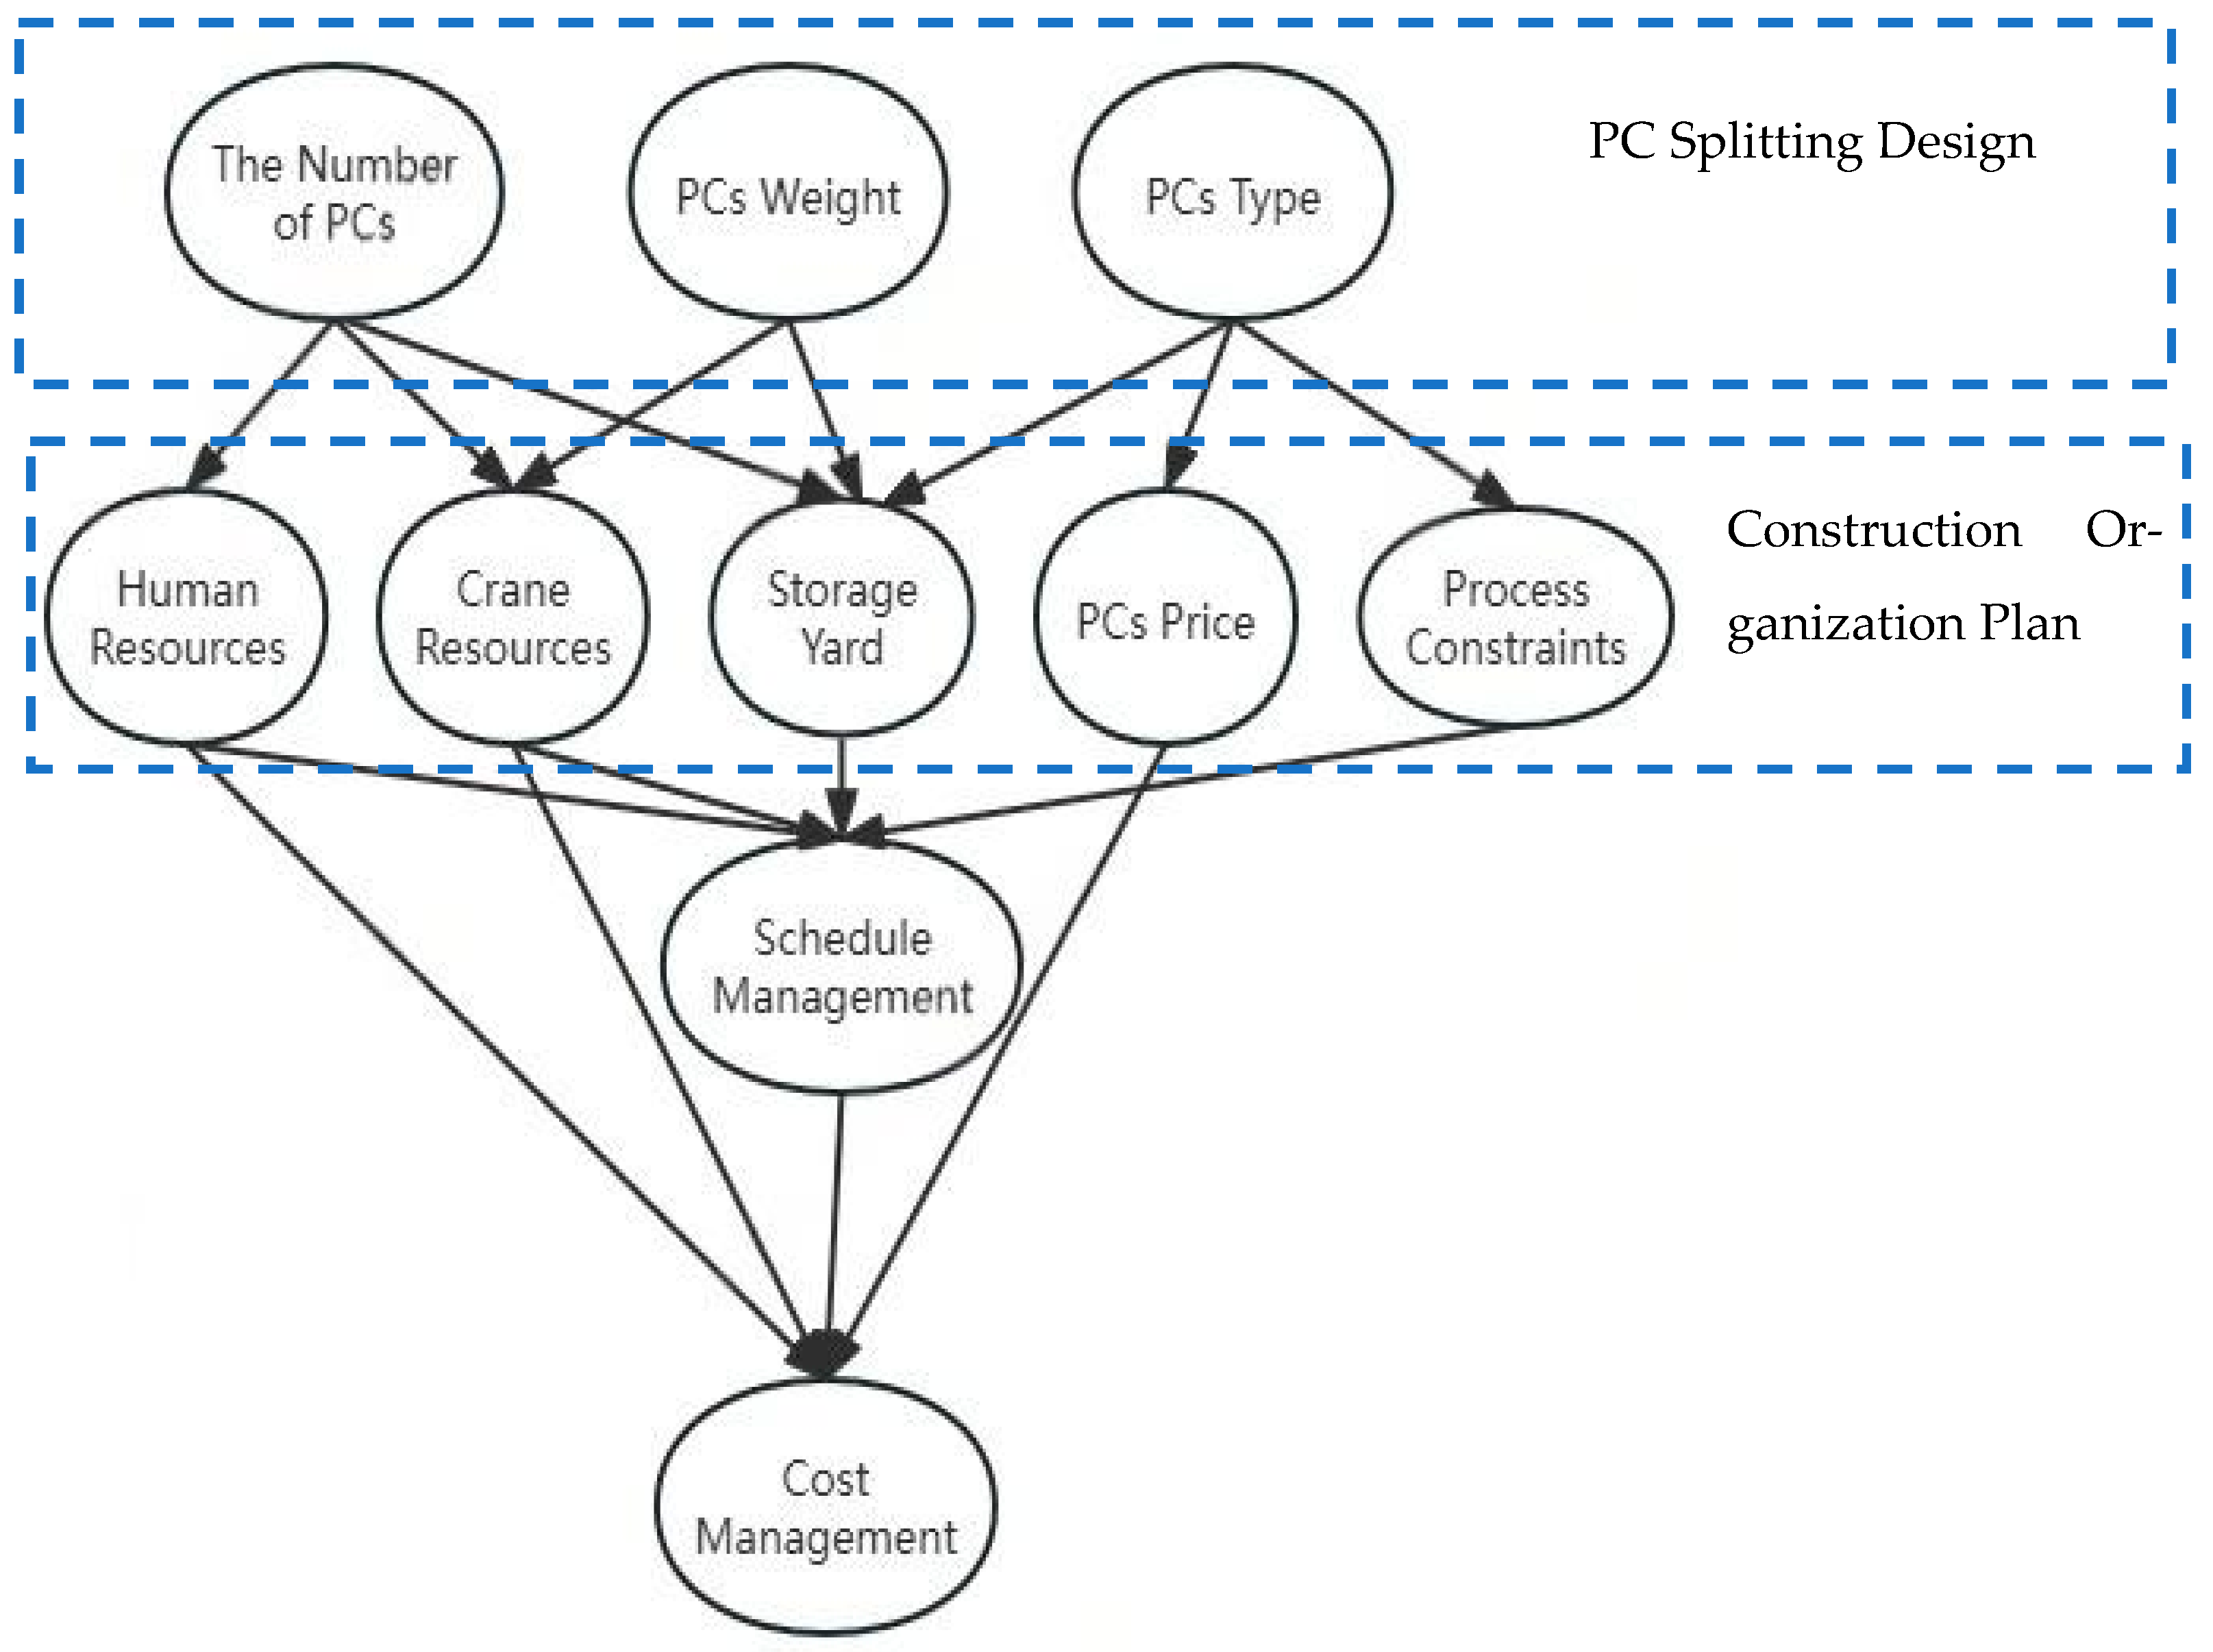
The questionnaire was distributed to 75 industry practitioners in Shanghai, yielding 60 valid responses and an 80% response rate (respondent details are provided in Table 1). This study investigates the interplay between PC splitting designs and construction organization plans from a project management perspective, utilizing a Bayesian Belief Network (BBN) model. As a foundational step, a structural relationship diagram of the influencing factors was developed (see Figure 2).
Data analysis of the survey results yielded the following conclusions: (1) In designing PC splitting plans, horizontal components (e.g., slabs and stairs) should be split preferentially; (2) The most highly utilized resources on construction sites are installation labor, lifting equipment, and storage yard space; (3) The most critical factor affecting construction organization management is the number of prefabricated component types, indicating that greater variety significantly increases project management complexity.

3.2. Developing the Prefabricated Construction Simulation

3.2.1. Assumptions

The simulation process for prefabricated construction is simplified into the following steps: (1) PCs arrive at the site and are stored in the stacking area, subject to space constraints; (2) Cranes (e.g., tower cranes or mobile cranes) transport the PCs from the stacking area to their designated installation positions; (3) Once all components on the current floor are installed, a waiting period is imposed until the cast-in-place concrete attains the required design strength, after which assembly of the subsequent floor may proceed; (4) The assembly task is deemed complete when no further components arrive and no components remain in the stacking area.
The analysis focuses solely on internal site constraints affecting the prefabricated construction process, with external supply factors excluded for the time being. Based on the simulation process, the following assumptions are adopted: (1) The PC plant is assumed to possess sufficient materials and machinery, ensuring timely responses to delivery demands; (2) Each crane operation is assumed to carry only one PC, with direct installation and no secondary handling; (3) In accordance with on-site construction requirements, PC lifting and installation are permitted only after the completion of foundation works and certain main structural works. Thus, it is assumed that these sub-projects are finished and all necessary preparatory work is in place prior to simulation initiation.

3.2.2. Interaction Rules

  • PC Assembly Rules
First, determine the floor where the PC is located based on the Z-value range of its installation elevation, with those on lower floors taking precedence over those on higher floors. Then, determine the installation sequence for PCs on the same floor, where vertical components take precedence over horizontal components. Finally, for PCs on the same floor with the same attributes, the installation sequence is determined based on the set priority value, where a smaller value indicates a higher priority. The entire process of PC installation includes arrival on site, hoisting, and assembly into the designated position.
2.
Multi-Tower Crane Avoidance Rules
The following avoidance rules are established for the multi-crane construction scenario:
(1)
Lower cranes yield to higher cranes: Higher cranes are typically positioned in central locations and handle more intensive workloads. Lower cranes must evaluate the movement patterns of higher cranes prior to operation.
(2)
Later-arriving cranes yield to earlier-arriving cranes: In overlapping work zones, cranes entering the area subsequently must yield to those that arrived earlier.
(3)
Moving cranes yield to stationary cranes: Mobile cranes must yield to any stationary crane within shared operational zones.
(4)
Unloaded cranes yield to loaded cranes: During simultaneous operations, unloaded cranes must yield right-of-way to loaded cranes.
(5)
Guest cranes yield to host cranes: Cranes entering another crane’s designated primary work zone must yield to the host crane operating in that zone.
(6)
Synchronized operations: All cranes must coordinate lifting and lowering operations according to specified timeframes.
3.
Crane Operation Rules
Tower cranes initially process PCs assigned to their designated building units. They select the highest-priority task from the pending queue and execute tasks sequentially until completion. When a crane serves more than one building unit, PCs from different building units may be handled by various cranes, necessitating collision checks based on each crane’s horizontal coordinates and maximum boom length. Each tower crane is constrained to serve a maximum of two building units.
Mobile cranes are automatically allocated to building units with the slowest assembly progress. Both mobile and tower cranes can operate simultaneously on the same building and floor, with no collision detection modeled between these heterogeneous crane types. To mitigate collision risks, a maximum of two mobile cranes is permitted to operate concurrently on a building unit.
4.
Site Layout Rules
Storage areas are constrained to tower crane working ranges to avoid double-handling and cross-interference. PCs are zoned by installation sequence, specs, type, and building.
The maximum storage yard volume must be less than the cumulative total volume of PCs arriving per day. If this condition is satisfied, the storage layout agent imposes no constraints on the assembly construction simulation process; otherwise, constraints are applied. These constraints can be alleviated through two methods: modifying the site layout to expand the storage volume or increasing the waiting time for new PC arrivals to allow space release.

3.2.3. Multi-Agent Model

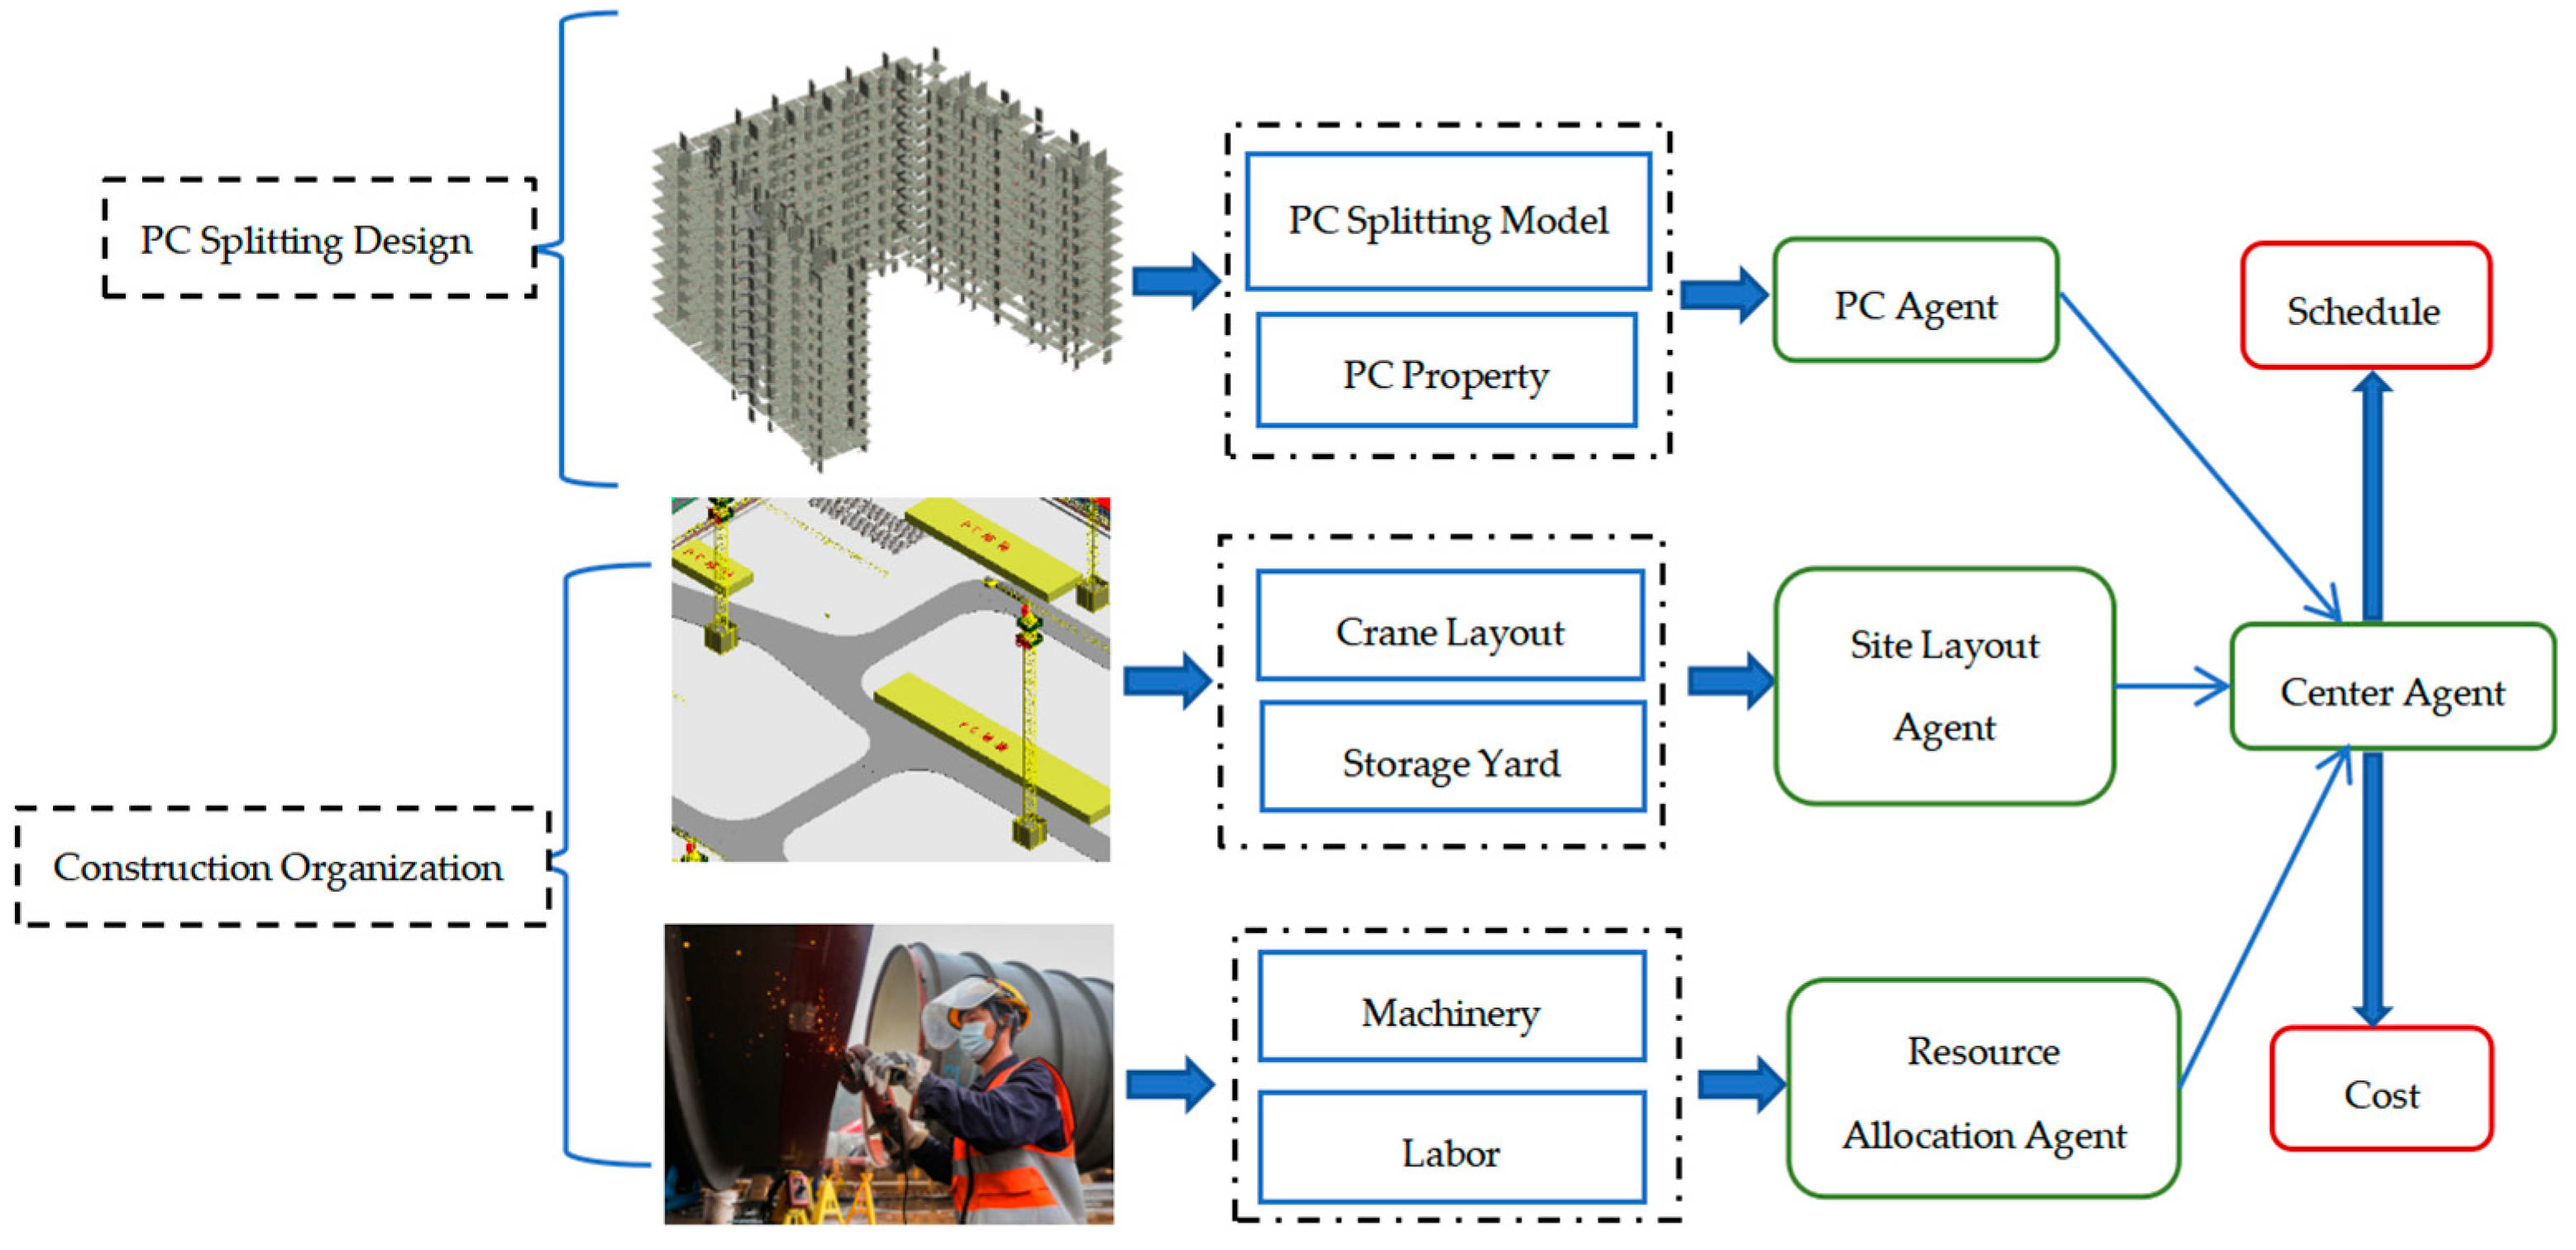
Workspace, project duration, allocation of workforce, materials and machinery are the critical resources for construction projects. Project managers need to expend time and effort reviewing, comprehending, and coordinating these resources [28]. Based on questionnaire surveys and literature analysis, the agents involved in prefabricated construction and their interaction processes are constructed from a project management perspective. As shown in Figure 3, once the main agent receives a PC assembly task issued by the PC agent, it activates the site layout agent, and the resource agent allocates resources from its resource pool.
Different prefabricated building BIM models correspond to different PC splitting designs, while different site layout BIM models and resource allocations correspond to different construction organization plans. When the same PC splitting design is simulated with different construction organization plans, an optimal construction organization plan can be identified through comparative analysis. Conversely, an optimal PC splitting design can be obtained by applying different PC splitting plans under the same construction organization plan.
The simulation process is constructed based on the agents and interaction rules:
(1)
The PC Agent is composed of the PC Splitting Model Agent and the PC Property Agent. The list of PCs pending assembly is generated based on PC assembly rules.
(2)
The Site Layout Agent consists of the Crane Layout Agent and the Storage Yard Agent. The Crane Layout Agent undertakes assembly tasks initiated by the PC Agent based on crane avoidance and operational rules. The Storage Yard Agent continuously monitors whether the storage capacity limit is reached according to the site layout rules and promptly reports to the Main Agent if the limit is exceeded.
(3)
The Resource Allocation Agent, composed of the Mechanical Equipment Agent and the Workforce Agent, is activated by the PC Agent. A higher task load triggers greater deployment of mechanical equipment, which in turn requires increased allocation of labor.
(4)
The Center Agent acts as a play maker or a control room that interacts with other agents and directs the process. When simulation results (e.g., schedule or cost) deviate from preset values, the Center Agent will adjust the resource allocation plan and relaunch the simulation.
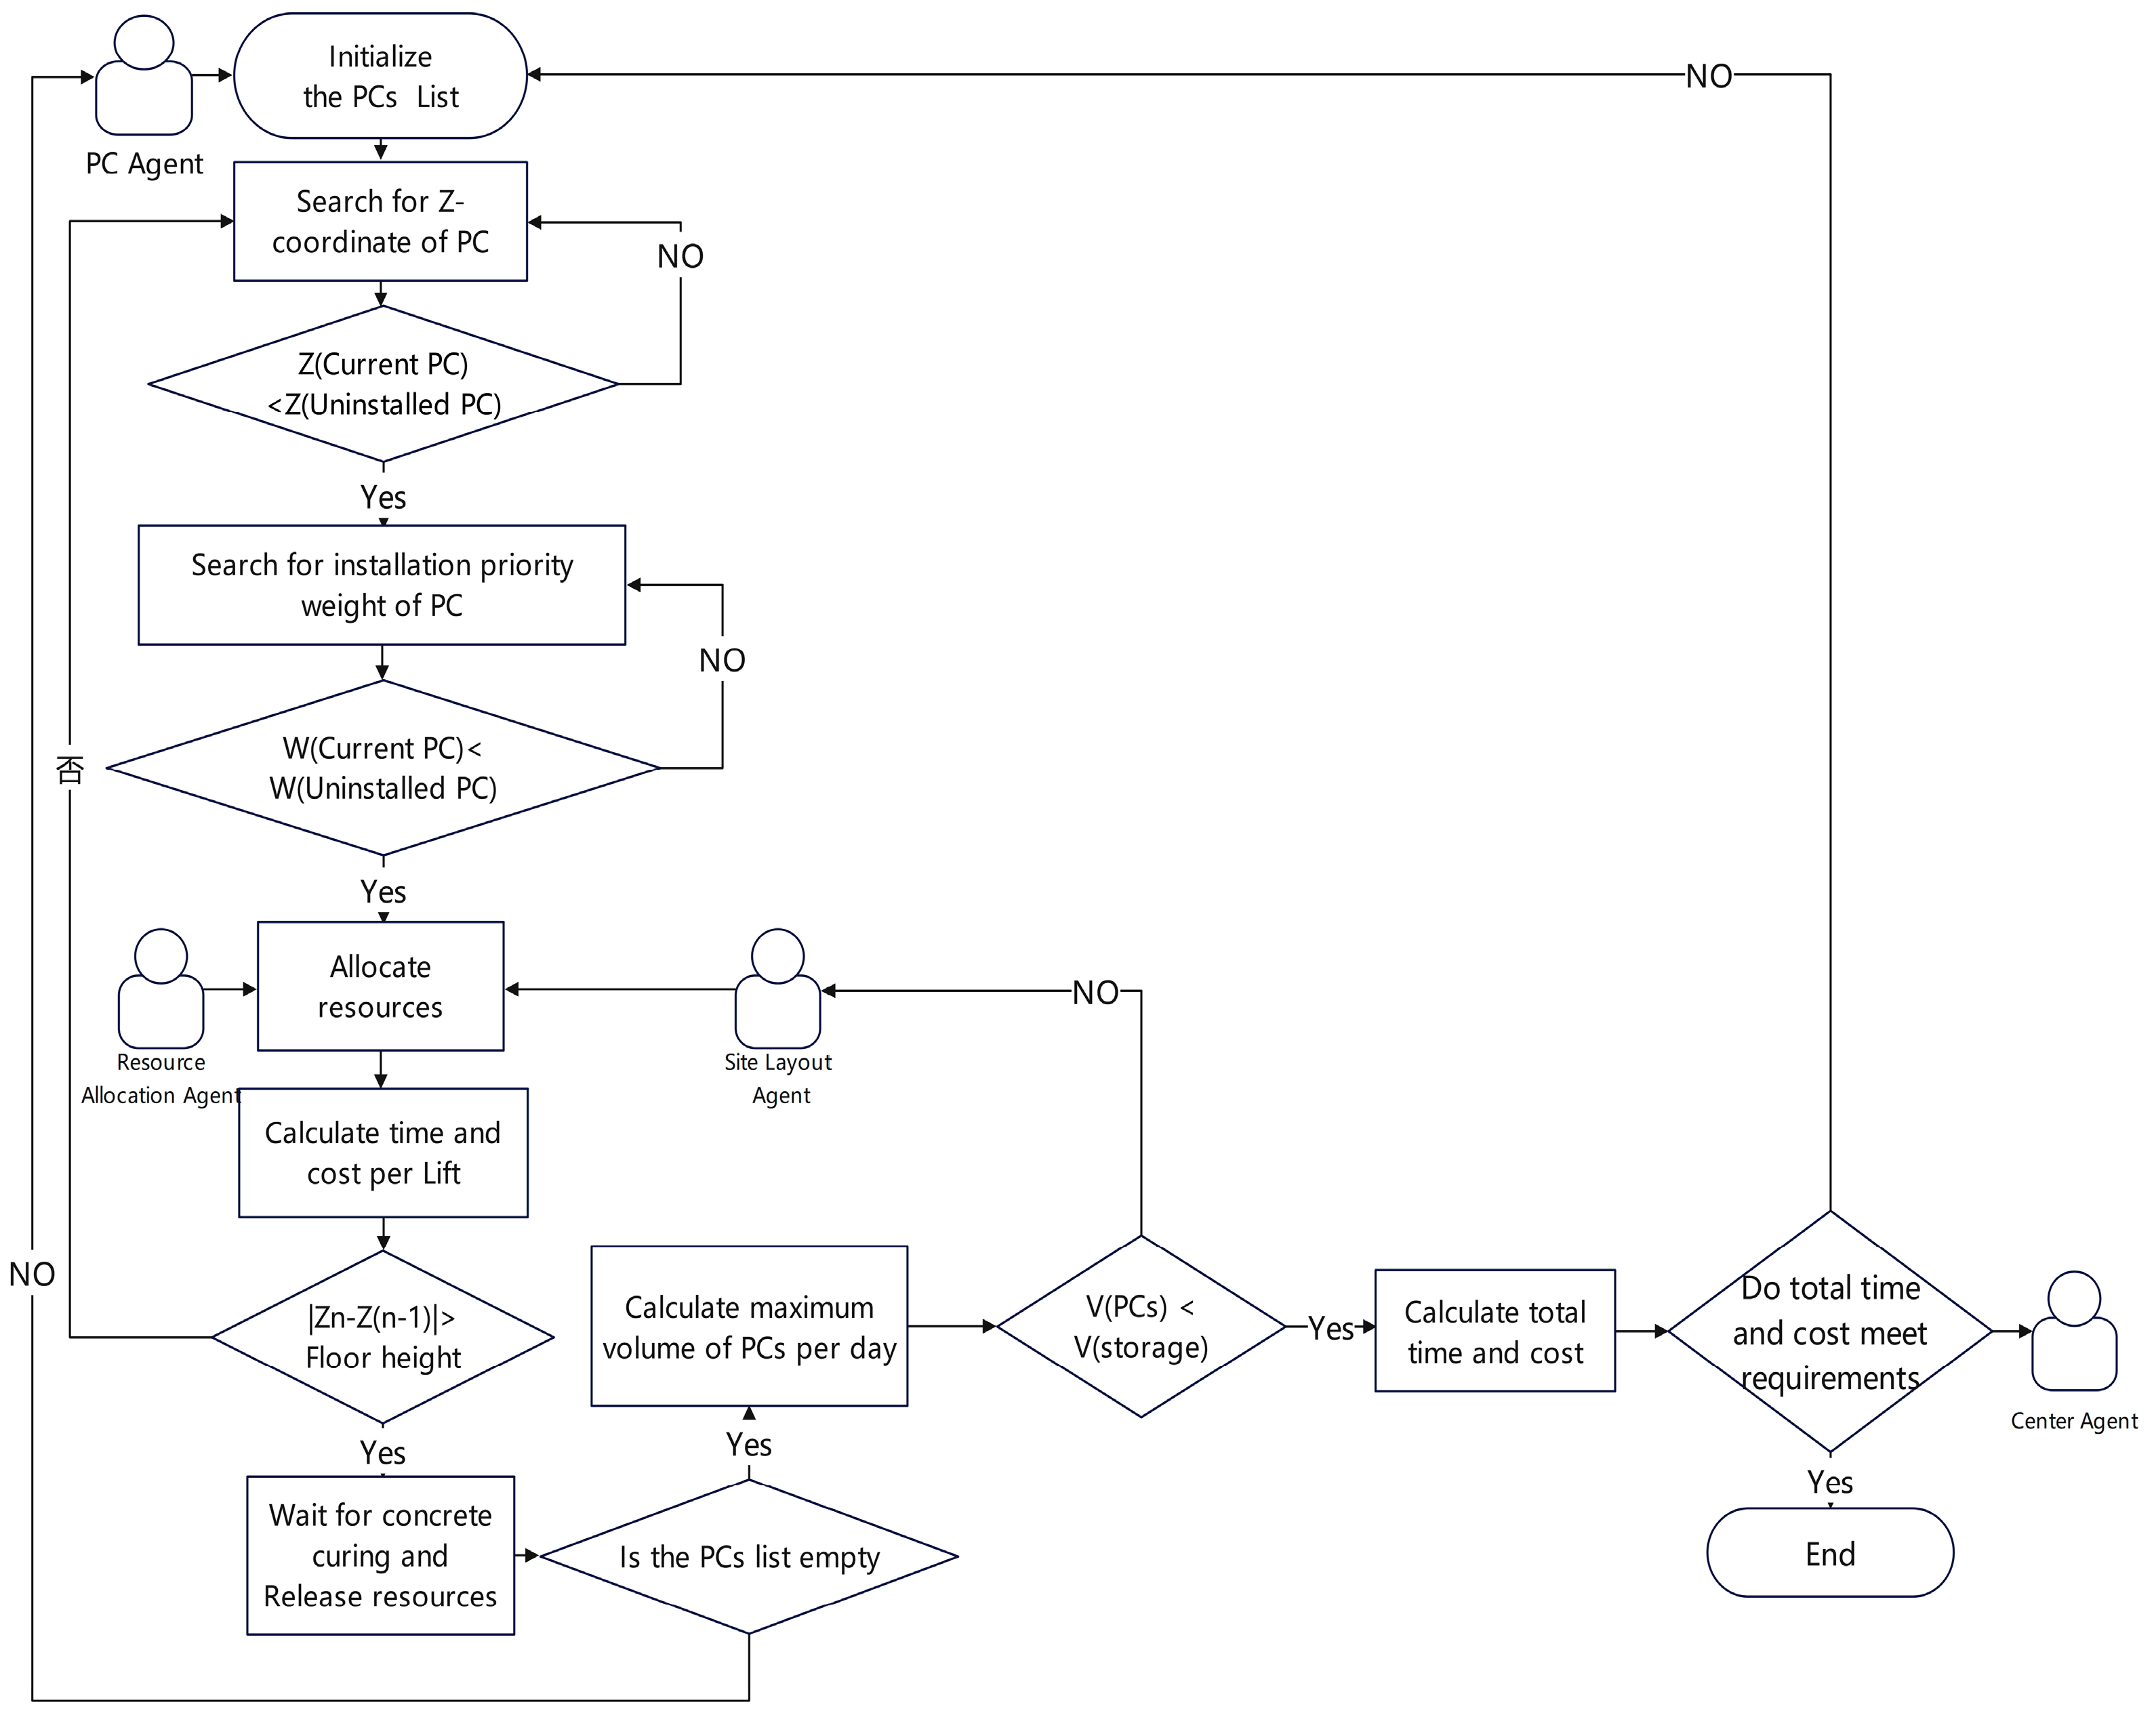
As illustrated in Figure 4, the PC Agent automatically generates an initial PC list, initiates PC assembly tasks based on the floor, orientation attributes, and installation priority values of the PCs, and simultaneously activates the Resource Allocation Agent and the Site Layout Agent. The Resource Allocation Agent releases machinery resources, which in turn automatically allocate labor resources and calculate the direct cost incurred upon the completion of each assembly task. Concurrently, the Site Layout Agent continuously evaluates whether the available storage space can accommodate the daily concentrated delivery of PCs by monitoring real-time spatial volume. The system determines whether to initiate a work pause for cast-in-place concrete to attain its design strength by detecting a change in floor level, which is indicated by a difference in the Z-coordinates between successive assembly tasks. Once the list is exhausted, the direct costs from all assembly tasks are aggregated to compute the total project duration and total cost. These outcomes are then evaluated against predefined benchmarks. If the results are unsatisfactory, modifications are implemented either to the PC splitting design—prompting the PC Agent to regenerate the list—or to the construction organization plan—leading the Resource Allocation Agent to re-allocate resources.

3.2.4. Mobile Crane Scheduling Model Under Process Constraints

A buffer of mobile cranes is reserved to enhance scheduling flexibility, ensuring construction progress remains unaffected by transportation constraints.
m = [ i = 1 n q i / Q ] + 1
In Equation (1), m represents the total number of mobile cranes participating in transportation simultaneously, Q denotes the standard load capacity, qi represents the load capacity of the i-th transportation task, and [] denotes the integer function. The parameter values lie within the interval (0, 1). Typically, as the number of resource constraints increases, the number of mobile cranes involved in transportation also increases, leading to a smaller parameter value .
A single construction process may be split into multiple transportation tasks, multiple construction processes may be merged into a single transportation task, there may be a one-to-one correspondence between processes and tasks, or certain construction processes may have no associated transportation tasks. Suppose the time window for transportation task i is [ E T i , L T i ] . If transportation task 1 is not subject to process constraints, its time window spans the entire duration of the transportation plan. If transportation task 2 is simultaneously constrained by processes B, C, and D, its time window is defined as E T 2 = min { E T B , E T C , E T D } , L T 2 = max { L T B , L T C , L T D } . If both transportation task 3 and task 4 are constrained by process E, their time windows are set to E T 3 = E T 4 = E T E , L T 3 = L T 4 = L T E .
If the earliest start time of transportation task i is earlier than the earliest start time within the corresponding construction process, meaning mobile cranes arrive at the construction site prematurely, it may occupy limited on-site resources and disrupt construction activities. If the latest finish time of transportation task i is later than the latest finish time within the corresponding construction process, it will inevitably delay the construction progress. Therefore, soft time constraints are adopted, with distinct penalty costs P(t) assigned for both early and late arrivals, as specified in Equation (2). The a is the penalty coefficient for excessively early initiation of transportation activities, while the b is the penalty coefficient for excessively late completion.
P ( t ) = a ( E T i t ) ,   t < E T i 0 ,   E T i t L T i b ( t L T i ) ,   t > L T i
The objective of process-constrained scheduling is to optimally deploy mobile cranes in coordination with the construction schedule, ensuring their operation within the time windows defined by the construction process constraints.
m i n C L = i = 0 n ( m i c k t i k + P ( t i ) ) , k = 1,2 . . . m s . t . m i = q i k / Q k , m i Z q i k / Q k + 1 , m i Z q i k Q k t i = max ( t i 1 , t i 2 . . . t i m i ) E T i t i L T i
In Equation (3), CL represents the total transportation cost, ck denotes the daily cost generated by mobile crane k, tik indicates the time during which mobile crane k is occupied by transportation task i, mi is the number of mobile cranes k allocated to transportation task i, ti signifies the duration of transportation task i, qik and Qk represent the actual load transported by mobile crane k in task i and the standard load capacity of mobile crane k, respectively.
Therefore, the load transported by each mobile crane per task must not exceed its standard load capacity, and the duration of each transportation task must be constrained by both the maximum transport time of the corresponding crane and the time window of its associated construction process. When these constraints are satisfied, the crane scheduling scheme achieves the minimal total transportation cost, indicating that the crane allocation and transport time have been optimized under construction process constraints.

3.3. Selecting the Simulation Method

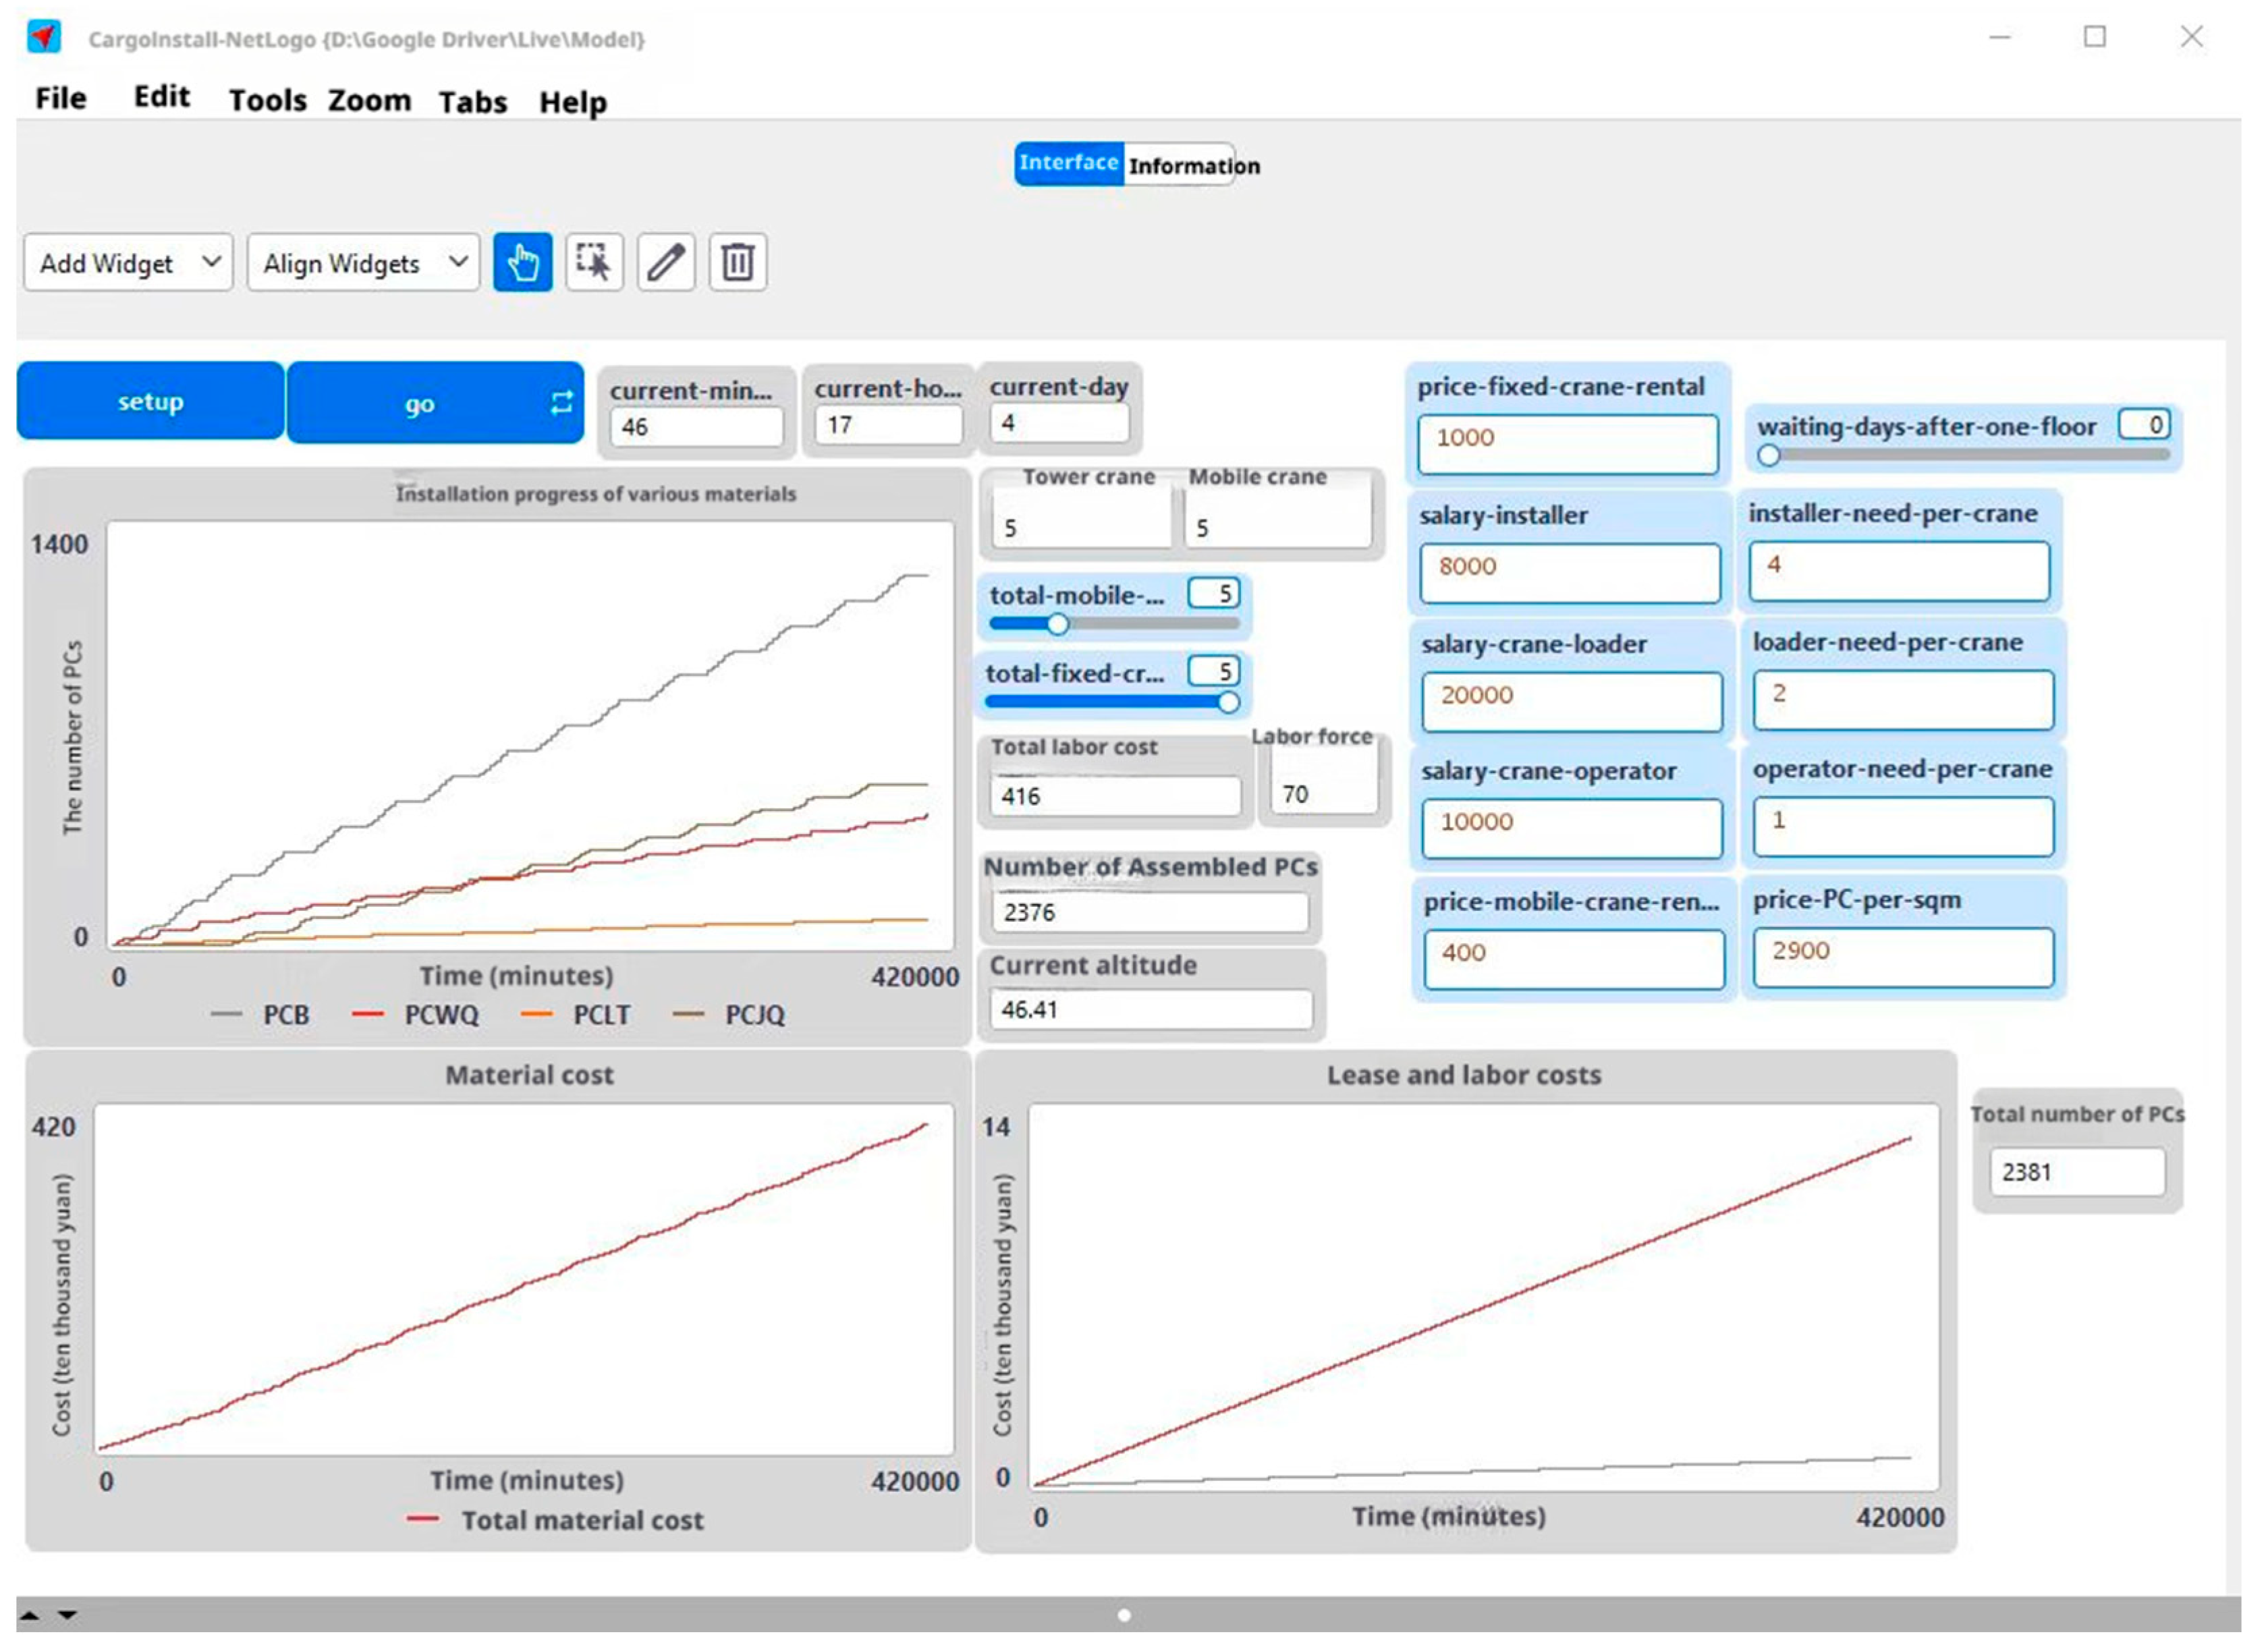
NetLogo 3D 7.0.0 is a multi-agent programmable modeling software that can be used to study the interaction between multiple heterogeneous agents and the phenomenon of their interaction over time [4]. As shown in Figure 5, based on the multi-agent simulation structure and interaction protocol for prefabricated construction, the simulation test was conducted on the NetLogo 3D 7.0.0 platform using case data from a prefabricated building project.

4. Case Study Project

A case study of a prefabricated building project, shown in Figure 6, was conducted to implement and validate the proposed multi-agent simulation model. The project site comprises eight prefabricated building units (designated #1 to #8) with heights between 13 and 18 stories and a total area of 77,961.81 square meters.

4.1. Developing the PC Agent

4.1.1. Developing the PC Splitting Model Agent

The PC Splitting Agent delineates which PCs are present after splitting and their respective installation positions. Consequently, as summarized in Table 2, key attributes—including PC family name, unique ID, dimensional properties, volume, and three-dimensional coordinates—were extracted from the project’s BIM dataset using a dedicated plugin for Revit 2018. The case study project involved a total of 14,249 PCs. Owing to the extensive volume of data, Table 2 presents only a representative subset. In this context, the length, width, and height of the PCs refer to the volumetric dimensions in the BIM model. Detailed graphical explanations are provided in Appendix A.

4.1.2. Developing the PC Property Agent

The PC Property Agent captures key installation attributes including orientation, priority, time, and material cost. As shown in Table 3, the priority value (where 1 indicates the highest priority) defines the recommended installation sequence within the same floor. As the Project Manager enters this data, various construction projects can adapt their parameters with flexibility.

4.2. Developing the Site Layout Agent

4.2.1. Developing the Crane Layout Agent

As shown in Table 4, the maximum boom length of the tower crane, 3D positional data, and rotation angle are also extracted from the BIM site layout model using a Revit 2018 software plugin. However, the codes corresponding to the prefabricated buildings for different tower cranes are input by the Project Manager.

4.2.2. Developing the Storage Yard Agent

As shown in Table 5, the storage yard type, 3D positional data, and area are also extracted from the BIM site layout model using a Revit 2018 software plugin. And the maximum stacking height is entered by the Project Manager.

4.3. Developing the Resource Allocation Agent

The data for Resource Allocation Agents are all entered by the Project Manager.

4.3.1. Developing the Machinery Resource Agent

As illustrated in Table 6, the mechanical equipment used in the case project comprises tower cranes, mobile cranes, and grouting machines. The machinery Agent includes the machinery model, type, operational parameters, mobilization cost, and rental cost. Mobilization cost encompasses one-time expenses such as installation, dismantling, and other associated activities.

4.3.2. Developing the Labor Resource Agent

Labor resources are allocated based on the quantity of equipment mobilized by the Machinery Resource Agent. As shown in Table 7, the Labor Resource Agent is configured by trade type and its corresponding labor costs.

5. Results and Discussion

5.1. Simulation Results from Various Resource Allocation Schemes

Resource allocation is a critical component of construction planning. For this case project, three distinct resource allocation schemes were devised based on its scale. These schemes adhered to the typical principle that the number of tower cranes does not exceed the number of building units, and mobile cranes do not outnumber tower cranes. Consequently, a comprehensive data analysis was conducted on the simulation results derived from each scheme.
(1)
Scheme 1 (4C0M): The first scheme deploys 4 tower cranes, each with the capacity to serve two building units simultaneously. This scheme involves no mobile cranes and is hereafter referred to as the 4C0M scheme.
(2)
Scheme 2 (4C2M): The second scheme also utilizes 4 tower cranes (each serving two units), which are supplemented by 2 mobile cranes. This is denoted as the 4C2M scheme.
(3)
Scheme 3 (8C2M): The third scheme entails the use of 8 tower cranes, with each crane dedicated to a single building unit, in conjunction with 2 mobile cranes. This is abbreviated as the 8C2M scheme.

5.1.1. Simulation Results Under the 4C0M Resource Allocation Scheme

When the 4C0M resource allocation scheme was applied to the construction simulation of the case project, the direct total cost was RMB 53,312,240 and the project duration was 305 days, as shown in the simulation results in Table 8.
Simulation data reveals that Tower Crane C3 prematurely withdrew from lifting operations and remained idle during the later phase, while Tower Crane C2 was the last to complete its lifting tasks. Since Building Unit 2# associated with Crane C2 contained the largest quantity of PCs, its assembly duration was the longest, consequently exerting the most significant impact on the overall project timeline. In accordance with multi-agent interaction rules, mobile cranes are programmed to automatically detect and assist the tower crane experiencing the highest workload pressure. Thus, subsequent simulation tests will incorporate two mobile cranes to mitigate the imbalance in tower crane resource utilization.

5.1.2. Simulation Results Under the 4C2M Resource Allocation Scheme

When the 4C2M resource allocation scheme was applied to the construction simulation of the case project, the direct total cost reached RMB 59,723,560 and the project duration was 181 days, as detailed in the simulation results presented in Table 9.
The introduction of two mobile cranes in this simulation test series resulted in a significant reduction in the total project duration. Considering the substantial volume of lifting operations required for the assembly of the case project and the need to facilitate on-site construction management, the most conventional resource allocation scheme will be adopted, which assigns one tower crane per building unit. Consequently, four additional tower cranes will be included in the third simulation test series.

5.1.3. Simulation Results Under the 8C2M Resource Allocation Scheme

The application of the 8C2M resource allocation scheme to the case project simulation yielded a direct total cost of RMB 70,971,360 and a project duration of 168 days, as shown in Table 10. Notably, despite the substantial cost increase resulting from the addition of four tower cranes, the corresponding reduction in project duration was marginal.

5.2. Comparison of Simulation Results from Various Resource Allocation Schemes

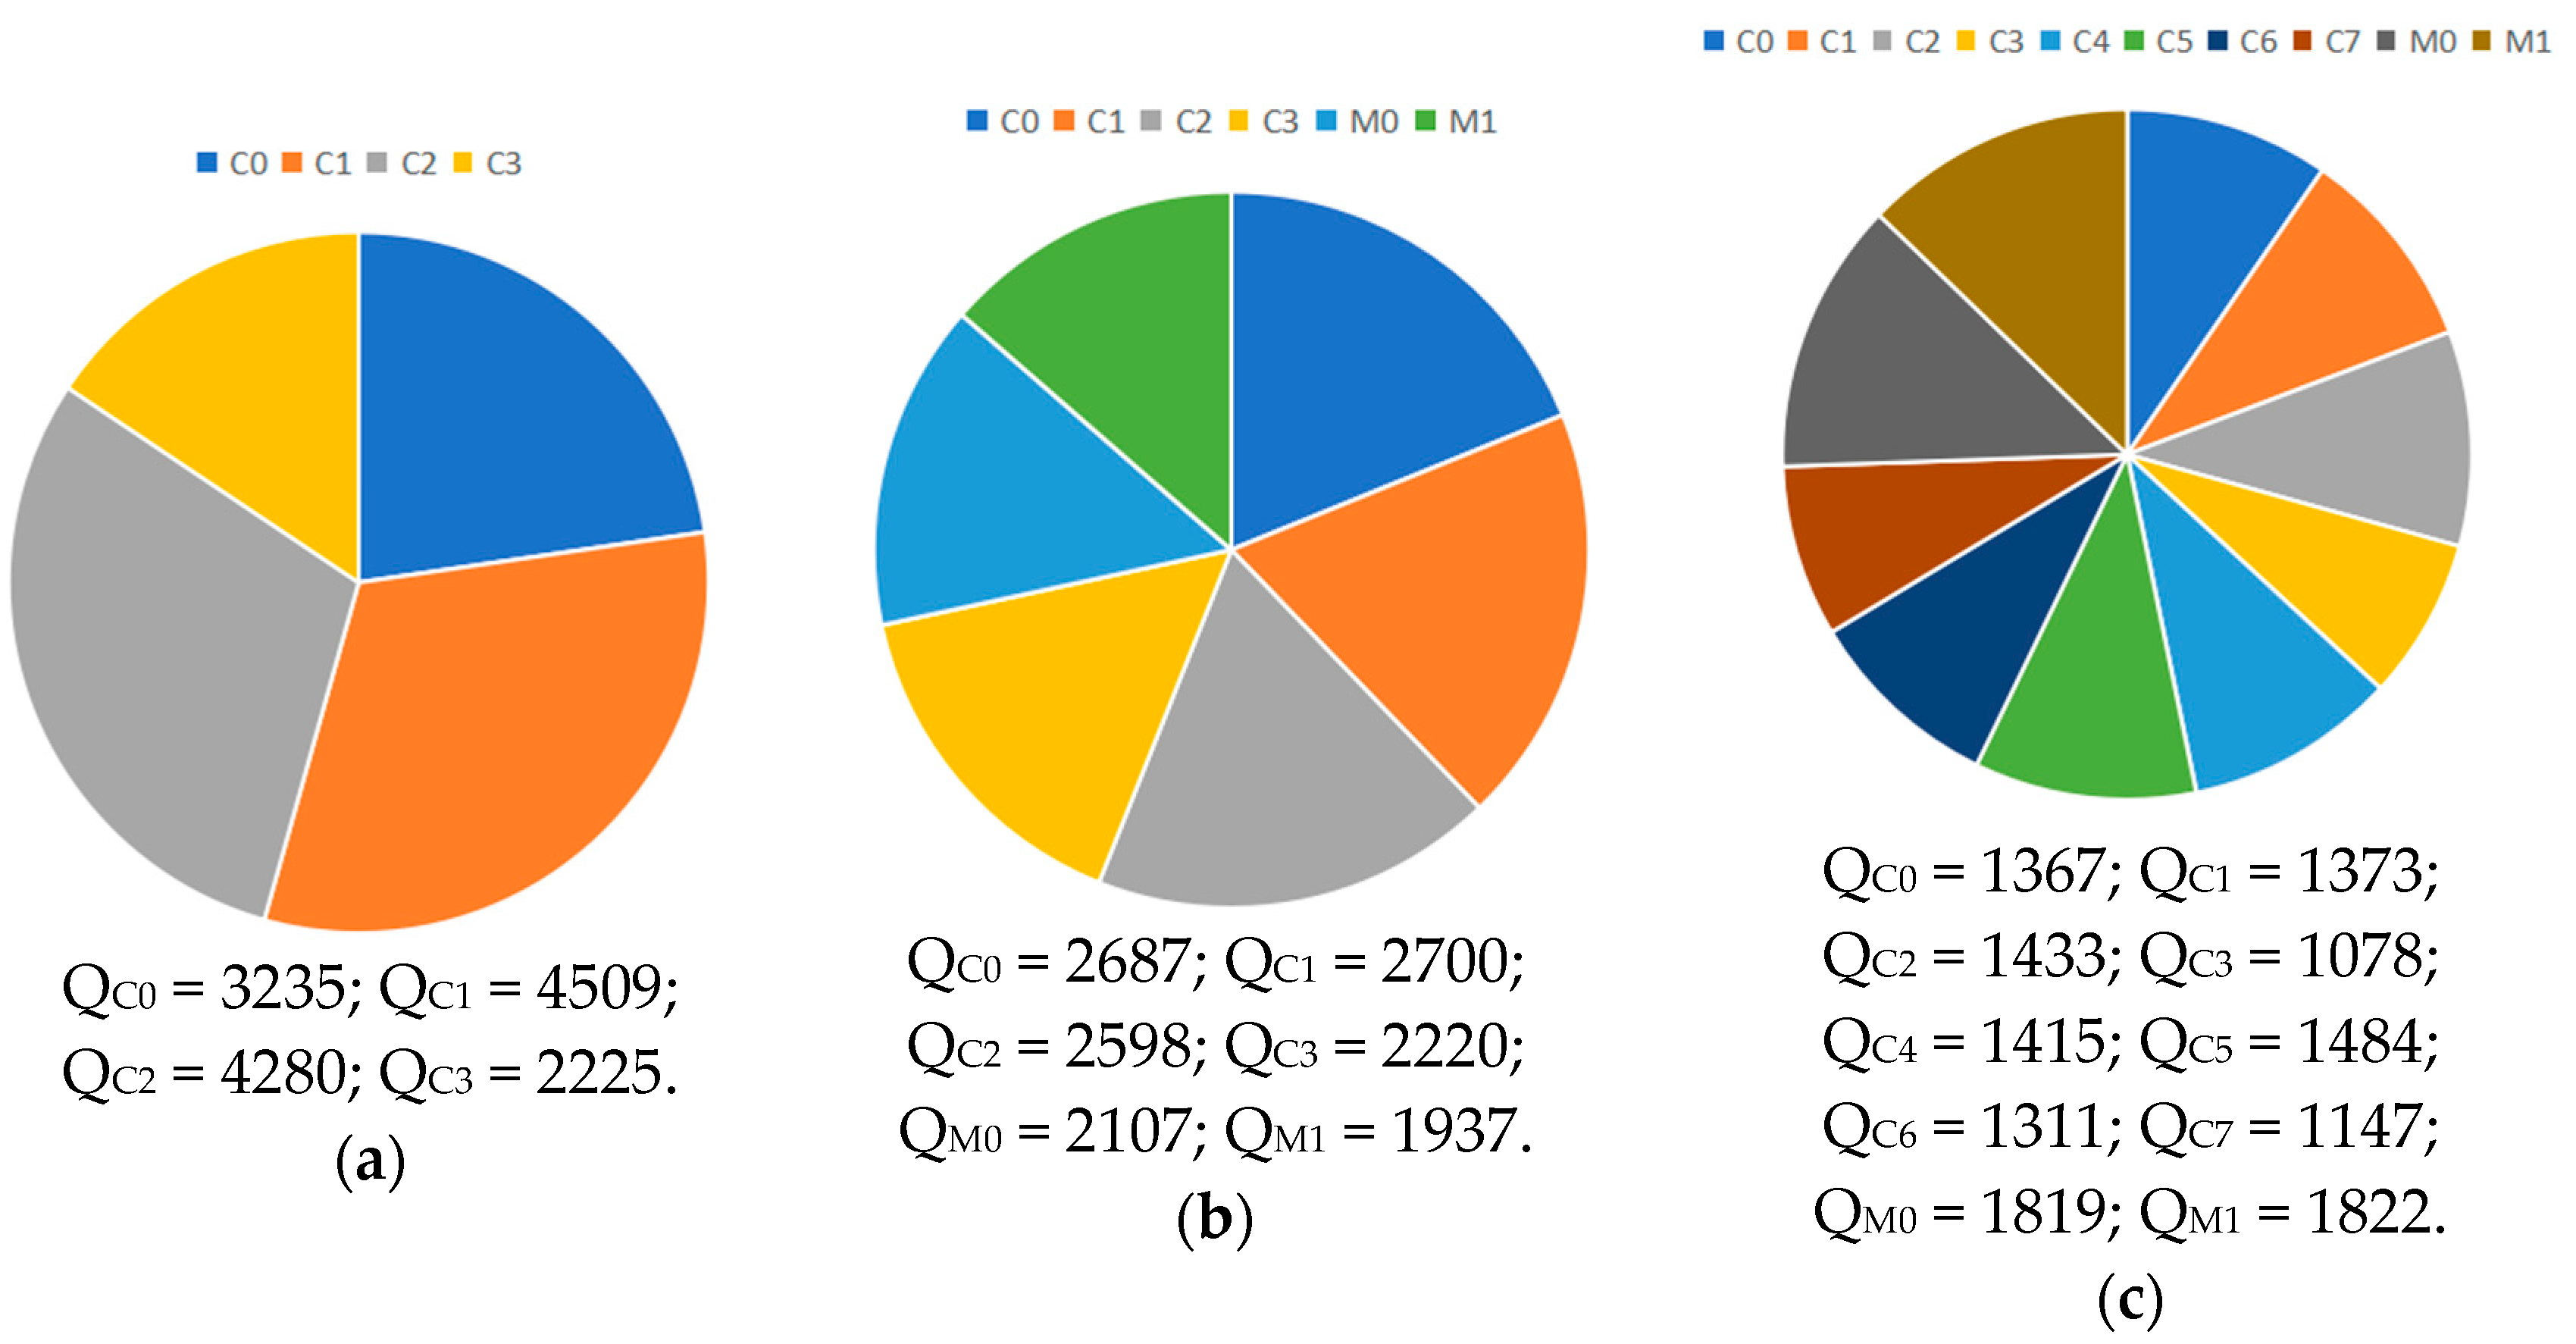
Typically, multiple tower cranes are deployed and removed from the site simultaneously. Uneven utilization of tower crane resources can lead to idleness and consequent resource waste. As illustrated in Figure 7, a comparative analysis of PC assembly volumes per crane across the three simulation scenarios demonstrates that collaboration between mobile cranes and tower cranes results in more balanced PC lifting distributions and significantly reduced idle time among tower cranes.
A Gantt chart illustrating the project schedule was developed from simulation results of the three resource allocation schemes. As demonstrated in Figure 8, increasingly balanced resource allocation corresponds to higher synchronization of construction progress among individual building units.
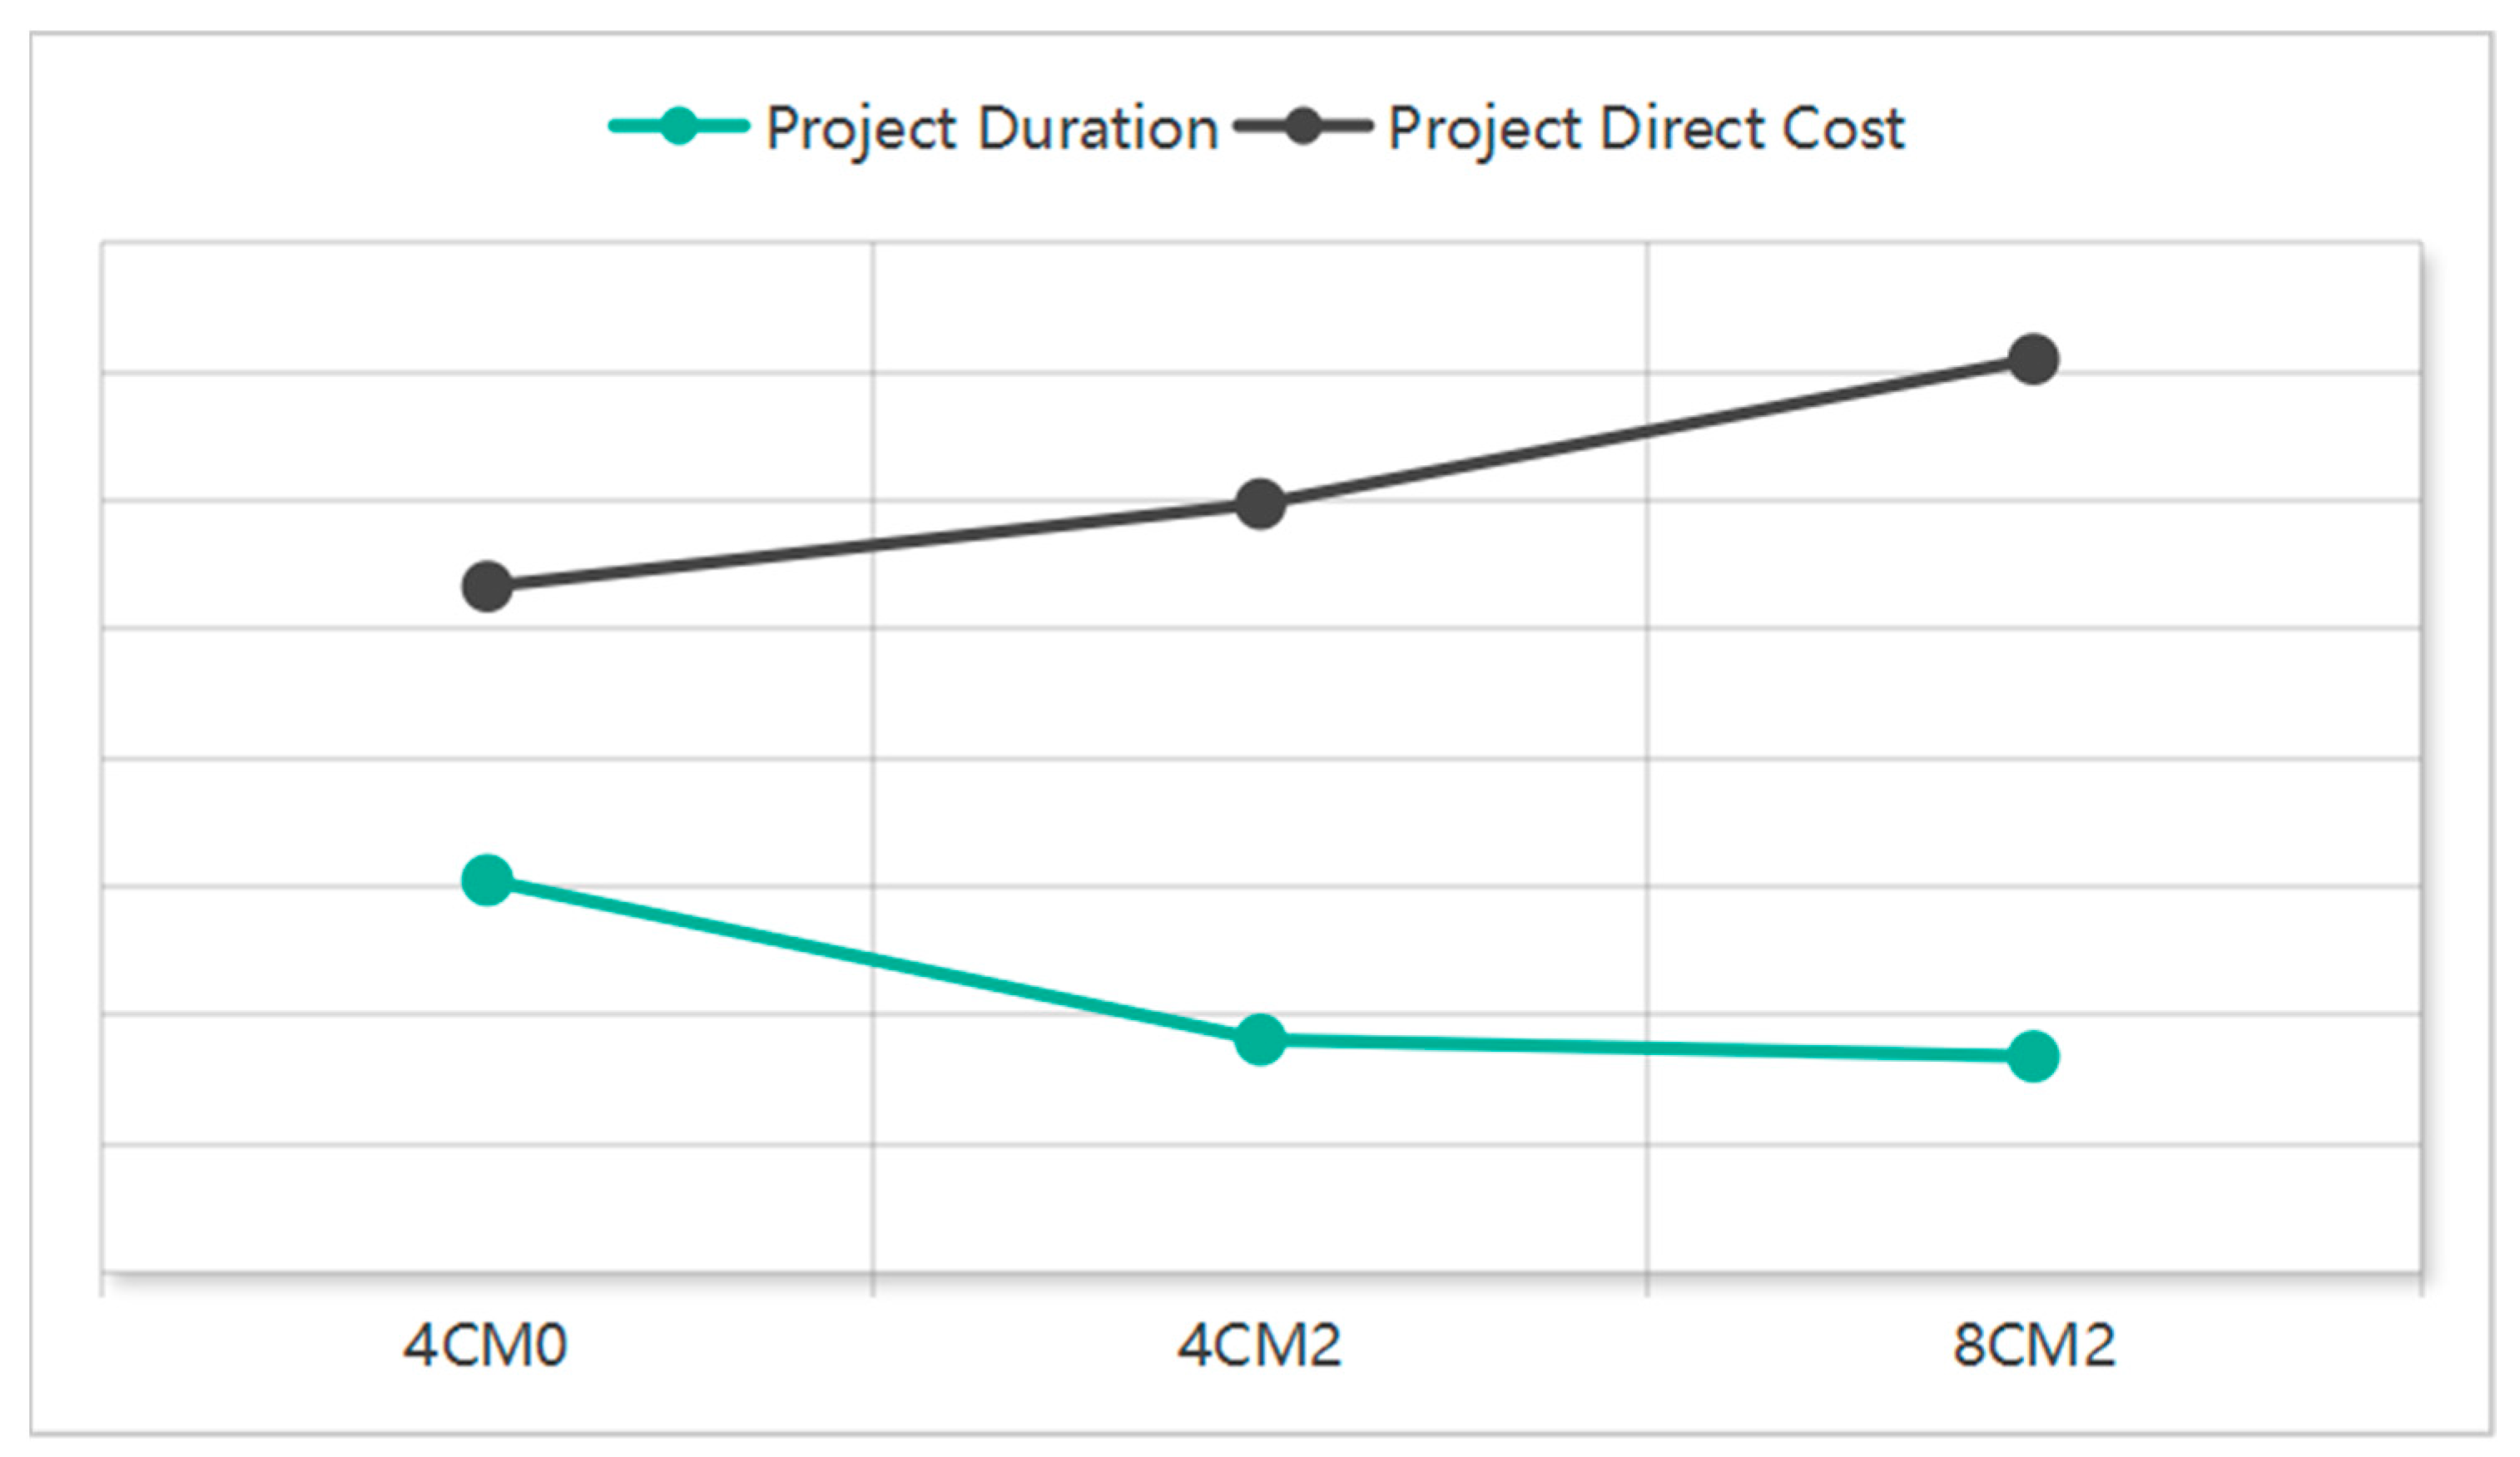
The case study, utilizing the same prefabricated building project and PC splitting design, compares three resource configurations: 4C0M (¥53,312,240; 305 days), 4C2M (¥59,723,560; 181 days), and 8C2M (¥70,971,360; 168 days). Comparing 4C0M and 4C2M shows that adding two mobile cranes increased cost by 12.03% but cut duration by 40.66%. In contrast, adding four tower cranes (4C2M vs. 8C2M) resulted in a further 18.83% cost increase for only a marginal 7.18% reduction in duration. Consequently, as shown in Figure 9, the 4C2M scheme demonstrates superior economic efficiency by achieving significant time savings at a relatively moderate cost.
Reducing the project duration often requires additional resource allocation, which consequently increases construction costs. The simulations can be used to identify the point at which the cost of an additional mobile crane outweighs the benefit of a shorter duration. As shown in Table 11, a comparison of the resource allocation schemes (4C1M, 4C2M, 4C3M) against the 4C0M baseline demonstrates that the 4C1M scheme is the most economically efficient. This is due to the higher operating cost of mobile cranes compared to tower cranes. Therefore, the optimal strategy is not to maximize their number, but to deploy them in a way that effectively complements the tower cranes and addresses temporary shortfalls in lifting capacity.

5.3. BIM-5D Visualization of Simulation Results

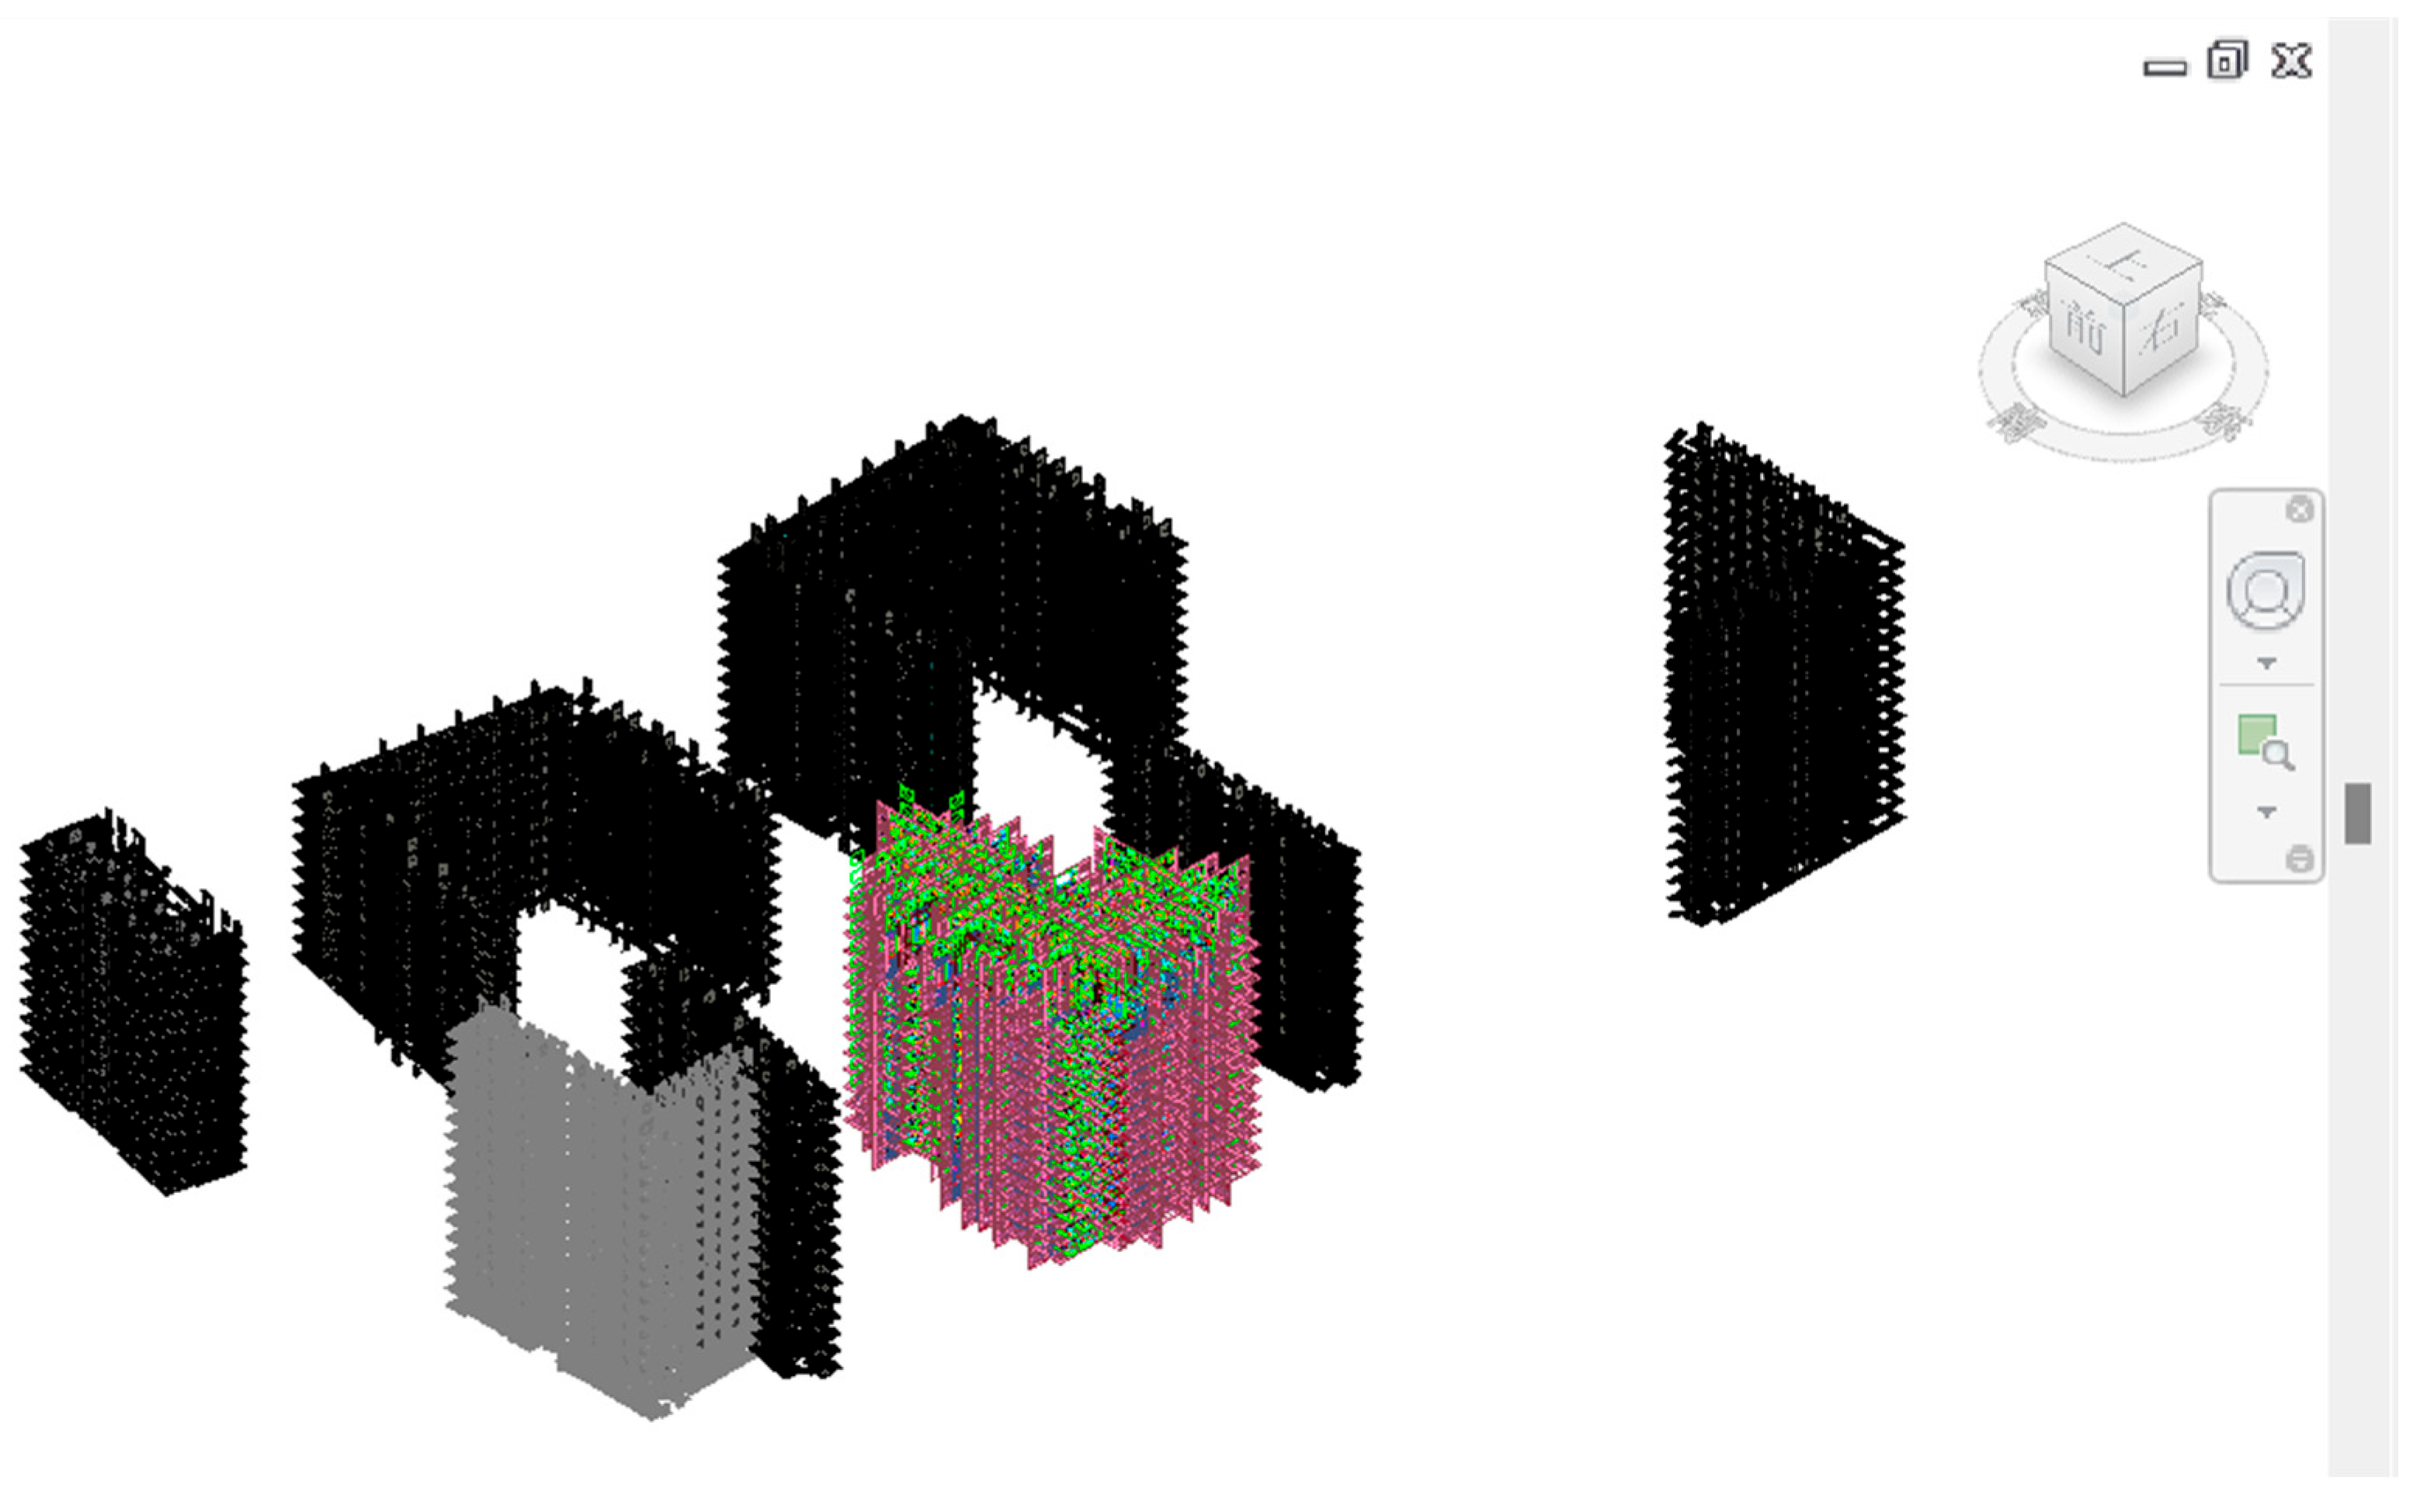
Navisworks, developed by Autodesk, is a professional 3D model review software primarily used for data integration, clash detection, and visual simulation in BIM projects. To comply with the data import specifications of Navisworks 2018, simulation results are exported in CSV format. As illustrated in Figure 10, the data pertaining to building units, tower cranes, and site layout are exported via a plug-in of Revit 2018, after which the project manager supplements the resource allocation data. The aforementioned data are imported into NetLogo 3D 7.0.0 to perform construction process simulation. The resulting simulation data are then imported into Navisworks 2018 to generate the BIM-5D animated visualization. To ensure the interoperability of BIM models, Revit and Navisworks must be on the same version. However, any version of Revit can interface with any version of NetLogo3D, provided its database data can be exported.
This interoperability facilitates rapid dynamic visualization of planned schedules and direct costs, which enables more efficient 5D BIM (integrating 3D models, time, and cost) management for prefabricated construction projects on site.
This study has several limitations. First, it specifically investigated prefabricated concrete residential buildings in Shanghai. Consequently, the findings may not be directly generalizable to other regions or construction types. Second, the simulation model operated under simplifying assumptions, such as uninterrupted material supply. While this facilitated a clearer analysis of internal site logistics, these assumptions may not fully capture real-world uncertainties, potentially affecting the accuracy of resource utilization estimates.

6. Conclusions

This study establishes integrated data linkages between the PC splitting plan from the detailed design phase and the construction organization plan from the construction preparation phase to develop a multi-agent simulation model with associated interaction rules. The approach enables granular simulation of the prefabricated construction process by modeling the hoisting and transportation of each individual PC. By decomposing the complexity of prefabricated construction into agent-based elements and reassembling them through rule-based interactions, the method offers a simplified yet systematic representation of the construction workflow. Finally, case projects were simulated using NetLogo 3D 7.0.0, with output results subsequently imported into Navisworks 2018 for BIM-5D visualization applications.
Furthermore, the paper makes two key algorithmic contributions. First, it introduces a novel backward calculation approach to tackle storage yard space constraints, a limitation often overlooked in existing studies. This method determines the maximum daily volume of PCs that can be delivered to the site, thereby optimizing the balance between storage capacity and on-site resource allocation. Second, the paper develops a mobile crane scheduling model that explicitly incorporates process constraints. This model enhances crane operational efficiency, which is critical for accelerating project timelines.
In the case study, with four tower cranes, introducing a single mobile crane (the 4C1M scheme) increased costs by a mere 3.43% over the 4C0M scheme, while reducing project duration by 36.72%. These results indicate that an optimal crane configuration can yield significant economic benefits. In contrast, with two mobile cranes, doubling the tower cranes to eight (the 8C2M scheme) increased costs by 18.83% for a limited duration reduction of only 7.18%. This comparison clearly demonstrates that adding mobile cranes is a far more cost-effective strategy for reducing duration than adding tower cranes. Despite this lower cost-effectiveness, the 8C2M scheme offers compensatory operational simplicity, as the one-to-one pairing of cranes to building units streamlines on-site coordination.

6.1. Practical Applications

The NetLogo 3D 7.0.0 platform was employed for simulation tasks, as it is better suited for single-building analyses, whereas its performance for building clusters is significantly slower. For the management aspects of the project, the full-process management software for prefabricated construction was independently developed within the Visual Studio 2022 development environment, utilizing SQL Server 2022 as the database management tool. Users can import agent data into the software interface, input parameters such as the project start date, expected project completion duration, expected project investment cost, and the maximum number of buildings served by each tower crane, then initiate the simulation by clicking the “Start Simulation” button. After approximately three minutes of processing, the simulation results are displayed on the interface, with an option to download more detailed data. The output primarily includes the start time, end time, and direct costs for each PC assembly task, floor level, building and project. Direct costs comprise expenses for PC materials, equipment usage and labor. The software has been tested during both the design and construction phases of two large-scale projects. Test results demonstrate that both the accuracy and computational speed of the simulation meet the requirements for practical application in real-world prefabricated construction projects.
A distinctive strength of this research lies in its close alignment with practical project management requirements, emphasizing both seamless multi-platform data integration and adaptability to diverse application scenarios. (1) During the design phase, the BIM model of the PC splitting design (provided by the detailing unit) is loaded and simulated under standardized construction organization plans. This process allows for the rapid screening of different design options against contractual cost and schedule targets. (2) During the construction preparation phase, with the PC splitting design finalized, the contractor’s construction organization plan is simulated and analyzed for deviations from contracted cost and schedule. This process facilitates plan optimization and enables construction execution supported by BIM-5D simulations. (3) During the construction phase, the project’s status is monitored by comparing simulation data with actual progress to identify schedule and cost deviations. By establishing deviation thresholds, the system provides early warnings to facilitate proactive control.

6.2. Recommendations for Future Research

The data collection for this study was initially confined to Shanghai, which limits the generalizability of the findings. To address this, applying the proposed methodology to diverse geographic regions is a crucial direction for future work. Furthermore, while the current research focused on residential buildings, the framework shows significant promise for adaptation to other project types, such as infrastructure projects (e.g., bridges and tunnels) and industrial facilities. Future studies should validate its efficacy in these contexts.
The perspective of prefabricated construction management will gradually extend from “project management” to “whole-life asset management.” The comprehensive digital assets (including BIM models and construction process data) accumulated during the construction phase can be seamlessly delivered to the operation and maintenance phase, supporting smart facility operations, space management, and energy consumption analysis. This approach maximizes asset value, demonstrating that prefabricated construction is not only a transformation in building methodology but also a cornerstone for future smart cities and digital asset management.

Author Contributions

Conceptualization, Y.S. and J.W.; methodology, Y.S., J.W. and G.-H.J.; software, J.W. and G.-H.J.; validation, Y.S., J.W. and G.-H.J.; investigation, J.W. and G.-H.J.; resources, Y.S. and J.W.; data curation, J.W. and G.-H.J.; writing—original draft preparation, J.W. and G.-H.J.; writing—review and editing, Y.S. and J.W.; visualization, J.W.; supervision, Y.S.; project administration, Y.S. and G.-H.J.; funding acquisition, Y.S. All authors have read and agreed to the published version of the manuscript.

Funding

This research was funded by Scientific Research and Innovation Projects of Shanghai Jianke Consulting Group Co., Ltd., grant number KY10000249.2023003.

Data Availability Statement

Data are contained within the article.

Conflicts of Interest

Authors Yi Shen and Guan-Hang Jin were employed by the company Shanghai Jianke Engineering Consulting Co., Ltd. The remaining author declares that the research was conducted in the absence of any commercial or financial relationships that could be construed as a potential conflict of interest.

Appendix A

The main types of PCs comprise load-bearing walls, non-load-bearing exterior envelopes, slabs, stairs, columns, beams, and interior finishing components. In contrast, the case study project incorporates only the first four types, whose volumetric dimensions are detailed in Appendix A.
Figure A1. Dimension Callouts for PC BIM Model. (a) Shear Wall or Slab Dimension Callout; (b) Non-Load-Bearing Wall Dimension Callout; (c) Stair Dimension Callout; (d) Dimension Callout on Stair Plan.
Buildings 15 03773 g0a1

References

  1. “14th Five-Year” Plan for Prefabricated Buildings in Shanghai. Available online: https://zjw.sh.gov.cn/ghjh/20211109/f5ed3fe865b447b7b064fc695cae1351.html (accessed on 3 November 2021).
  2. Yin, J.; Huang, R.; Sun, H.; Cai, S. Multi-Objective Optimization for Coordinated Production and Transportation in Prefabricated Construction with on-Site Lifting Requirements. Comput. Ind. Eng. 2024, 189, 110017. [Google Scholar] [CrossRef]
  3. Xiang, L.; Tan, Y.; Shen, G.; Jin, X. Applications of Multi-Agent Systems from the Perspective of Construction Management: A Literature Review. Eng. Constr. Archit. Manag. 2022, 29, 3288–3310. [Google Scholar] [CrossRef]
  4. Feng, J.; Liu, B.; Tang, J.; Wang, Q. The Emergence of the Contractor’s Innovation Capability at Project Level: An Agent-Based Modeling Approach. Buildings 2023, 13, 2941. [Google Scholar] [CrossRef]
  5. Attajer, A.; Mecheri, B. Multi-Agent Simulation Approach for Modular Integrated Construction Supply Chain. Appl. Sci. 2024, 14, 5286. [Google Scholar] [CrossRef]
  6. Zhang, C.; Zhang, F.; Yin, S.; Fu, Y.; Liu, J.; Duan, P. Study on the Optimization of Duration for Repetitive Projects Considering Spatial Interference Effects in Operations. J. Asian Archit. Build. Eng. 2025, 1–26. [Google Scholar] [CrossRef]
  7. Jiang, S.; Yang, B.; Liu, B. Precast Components On-Site Construction Planning and Scheduling Method Based on a Novel Deep Learning Integrated Multi-Agent System. J. Build. Eng. 2025, 102, 111907. [Google Scholar] [CrossRef]
  8. Liu, B.; Yang, B.; Zhang, B.; Dong, M.; Jiang, S.; Xiao, J. Spatio-Temporal Deduction of Floor Construction Based on the Agent Modeling of Construction Actors. Autom. Constr. 2022, 142, 104487. [Google Scholar] [CrossRef]
  9. Liu, B.D.; Yang, B.; Han, Y.; Xiao, J.Z.; Dong, M.S. Establishment and Application of Multi-Agent Simulation System Based on On-Site Construction Performers. In Proceedings of the 17th East Asian-Pacific Conference on Structural Engineering and Construction, 2022, EASEC-17, Singapore, 14 March 2023. [Google Scholar] [CrossRef]
  10. Kim, K.; Faust, K.M.; Leite, F. Simulation Modeling Efforts in the Construction Industry: Integrated Application of BIM and Agent-Based Modeling. In Proceedings of the Computing in Civil Engineering 2023, Corvallis, OR, USA, 25 January 2024. [Google Scholar] [CrossRef]
  11. Kedir, N.S.; Somi, S.; Fayek, A.R.; Nguyen, P.H.D. Hybridization of Reinforcement Learning and Agent-Based Modeling to Optimize Construction Planning and Scheduling. Autom. Constr. 2022, 142, 104498. [Google Scholar] [CrossRef]
  12. Pourrahimian, E.; Salhab, D.; Hamzeh, F.; AbouRizk, S. A Decision Support System for Evaluating Construction Project Recovery Plans. Can. J. Civ. Eng. 2025, 52, 1336–1354. [Google Scholar] [CrossRef]
  13. Hu, Y.; Wu, L.; Li, N.; Zhao, T. Multi-Agent Decision-Making in Construction Engineering and Management: A Systematic Review. Sustainability 2024, 16, 7132. [Google Scholar] [CrossRef]
  14. Zohourian, M.; Pamidimukkala, A.; Kermanshachi, S.; Almaskati, D. Modular Construction: A Comprehensive Review. Buildings 2025, 15, 2020. [Google Scholar] [CrossRef]
  15. Abdul Nabi, M.; El-adaway, I.H. Risk-based approach to predict the cost performance of modularization in construction projects. J. Constr. Eng. Manag. 2021, 147, 04021133. [Google Scholar] [CrossRef]
  16. Mehdipoor, A.; Iordanova, I.; Al-Hussein, M. Enhancing the Manufacturing Process in Light-Gauge Steel Off-Site Construction Using Semiautomation. J. Constr. Eng. Manag. 2025, 151, 04025055. [Google Scholar] [CrossRef]
  17. Yuan, Z.; Man, Q.; Guan, Z.; Yi, C.; Zheng, M.; Chang, Y.; Li, H.X. Simulation and Optimization of Prefabricated Building Construction Considering Multiple Objectives and Uncertain Factors. J. Build. Eng. 2024, 86, 108830. [Google Scholar] [CrossRef]
  18. Wang, Z.; Hu, H.; Gong, J.; Ma, X. Synchronizing Production Scheduling with Resources Allocation for Precast Components in a Multi-Agent System Environment. J. Manuf. Syst. 2018, 49, 131–142. [Google Scholar] [CrossRef]
  19. Attajer, A.; Mecheri, B.; Hadbi, I.; Amoo, S.N.; Bouchnita, A. Sustainable Supply Chain Strategies for Modular-Integrated Construction Using a Hybrid Multi-Agent-Deep Learning Approach. Sustainability 2025, 17, 5434. [Google Scholar] [CrossRef]
  20. Jang, D.-H.; Roh, G.-T.; Jeon, C.-H. Simulation-Based Optimization of Crane Lifting Position and Capacity Using a Construction Digital Twin for Prefabricated Bridge Deck Assembly. Buildings 2025, 15, 475. [Google Scholar] [CrossRef]
  21. Tak, A.N.; Taghaddos, H.; Mousaei, A.; Bolourani, A.; Hermann, U. BIM-Based 4D Mobile Crane Simulation and Onsite Operation Management. Autom. Constr. 2021, 128, 103766. [Google Scholar] [CrossRef]
  22. Khodabandelu, A.; Park, J.; Arteaga, C. Improving Multitower Crane Layout Planning by Leveraging Operational Flexibility Related to Motion Paths. J. Manag. Eng. 2023, 39, 04023035. [Google Scholar] [CrossRef]
  23. Huang, C.; Wang, Z.K.; Li, B.; Wang, C.; Xu, L.S.; Jiang, K.; Liu, M.; Guo, C.X.; Zhao, X.F.; Yang, H. Discretized Cell Modeling for Optimal Layout of Multiple Tower Cranes. J. Constr. Eng. Manag. 2023, 149, 04023068. [Google Scholar] [CrossRef]
  24. Zhang, W.; Zhang, H.; Yu, L. Collaborative Planning for Stacking and Installation of Prefabricated Building Components Regarding Crane-Collision Avoidance. J. Constr. Eng. Manag. 2023, 149, 04023029. [Google Scholar] [CrossRef]
  25. Younes, A.; Marzouk, M. Tower Cranes Layout Planning Using Agent-Based Simulation Considering Activity Conflicts. Autom. Constr. 2018, 93, 348–360. [Google Scholar] [CrossRef]
  26. Khodabandelu, A.; Park, J.; Arteaga, C. Crane Operation Planning in Overlapping Areas Through Dynamic Supply Selection. Autom. Constr. 2020, 117, 103253. [Google Scholar] [CrossRef]
  27. Liu, C.; Zhang, F.; Han, X.; Ye, H.; Shi, Z.; Zhang, J.; Wang, T.; She, J.; Zhang, T. Intelligent Optimization of Tower Crane Location and Layout Based on Firefly Algorithm. Comput. Intell. Neurosci. 2022, 2022, 6810649. [Google Scholar] [CrossRef] [PubMed]
  28. He, C.; Liu, M.; Zhang, Y.; Wang, Z.; Hsiang, S.M.; Chen, G.; Li, W.; Dai, G. Space–Time–Workforce Visualization and Conditional Capacity Synthesis in Uncertainty. J. Manag. Eng. 2023, 39, 15. [Google Scholar] [CrossRef]
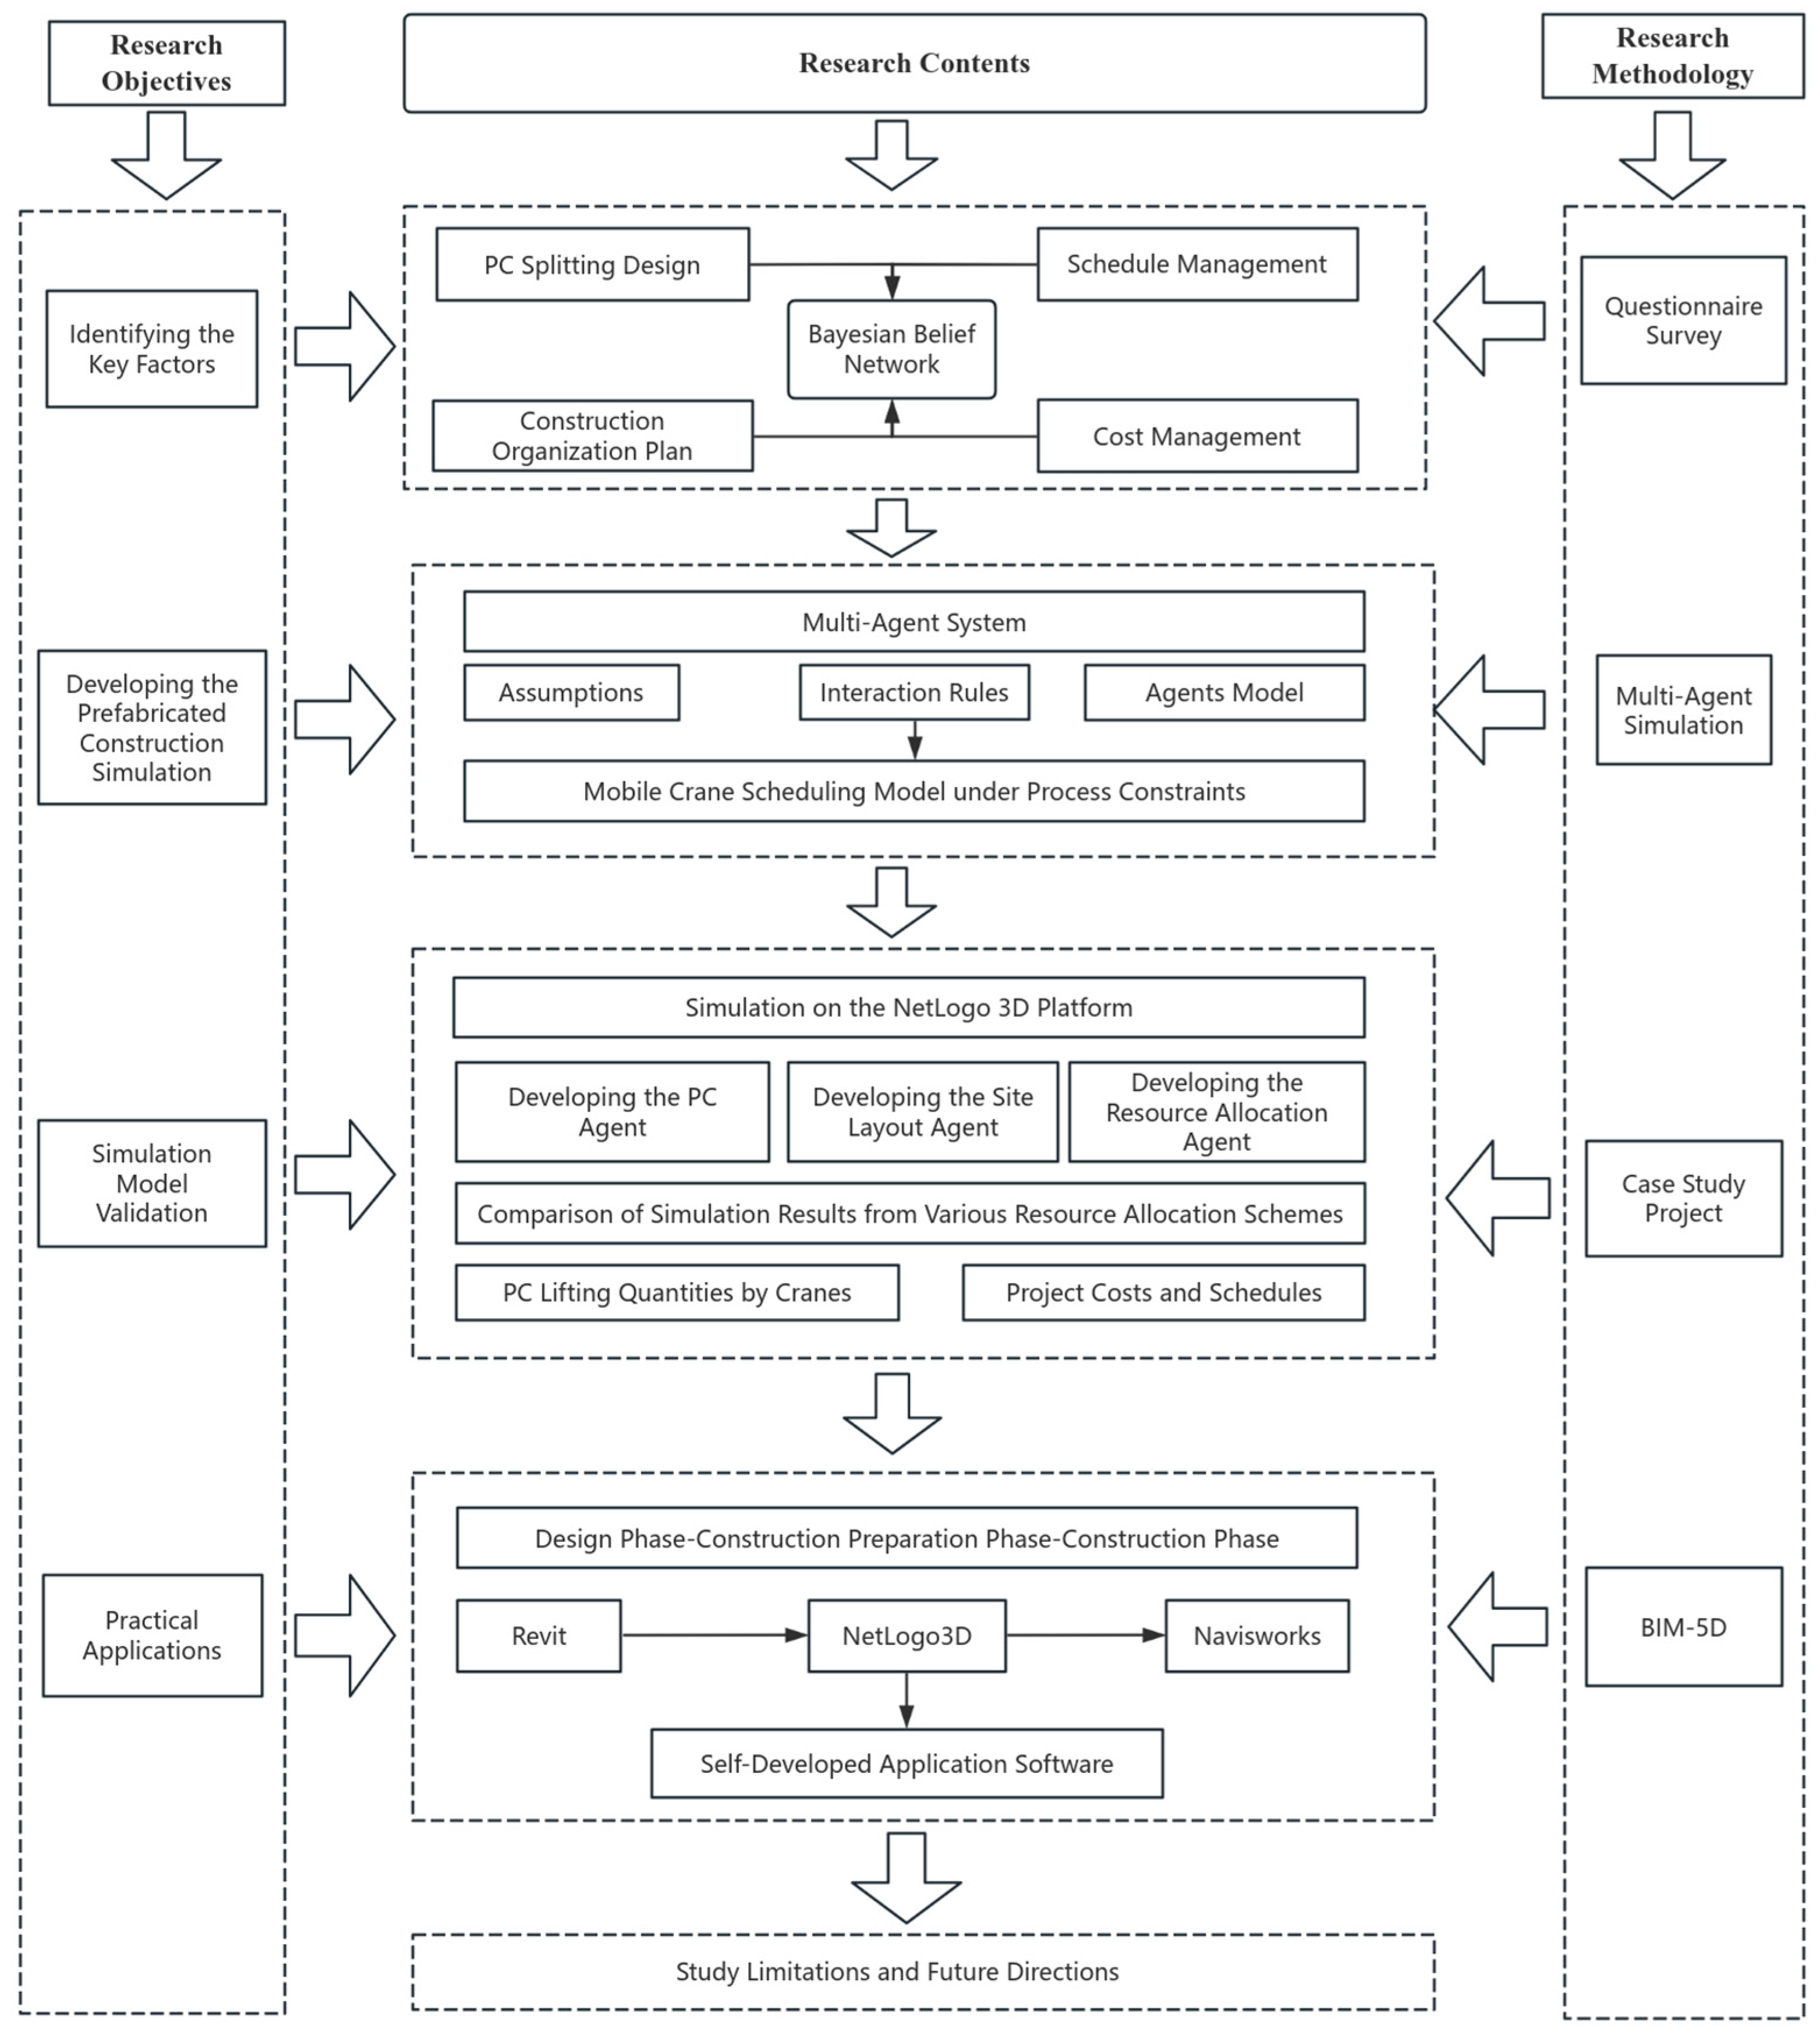
Figure 1. Research Roadmap.
Buildings 15 03773 g001
Figure 2. The Structural Relationship Diagram of the Influencing Factors.
Buildings 15 03773 g002
Figure 3. Multi-Agent Simulation Architecture for Prefabricated Construction.
Buildings 15 03773 g003
Figure 4. Multi-Agent Simulation Process for Prefabricated Construction.
Buildings 15 03773 g004
Figure 5. User Interface of NetLogo 3D 7.0.0 for Multi-Agent Simulation Testing in Prefabricated Construction.
Buildings 15 03773 g005
Figure 6. BIM Model of the Prefabricated Building Cluster for the Case Project.
Buildings 15 03773 g006
Figure 7. Comparison of PC Lifting Quantities by Cranes under Different Resource Allocation Schemes. (a) PC Lifting Quantities by Cranes in the 4C0M Resource Allocation Scheme; (b) PC Lifting Quantities by Cranes in the 4C2M Resource Allocation Scheme; (c) PC Lifting Quantities by Cranes in the 8C2M Resource Allocation Scheme.
Buildings 15 03773 g007
Figure 8. Comparison of Project Schedules under Different Resource Allocation Schemes. (a) Project Schedule Gantt Chart in the 4C0M Resource Allocation Scheme; (b) Project Schedule Gantt Chart in the 4C2M Resource Allocation Scheme; (c) Project Schedule Gantt Chart in the 8C2M Resource Allocation Scheme.
Buildings 15 03773 g008
Figure 9. Comparison of Project Duration and Cost under Different Resource Allocation Schemes.
Buildings 15 03773 g009
Figure 10. Revit 2018, NetLogo3D 7.0.0 and Navisworks 2018 Interfaces for Prefabricated Construction. (a) Revit 2018 3D Model Display; (b) NetLogo 3D 7.0.0 Simulation Output; (c) Navisworks 2018 BIM 5D Presentation.
Buildings 15 03773 g010
Table 1. Demographic Profile of Survey Respondent.
Demographic ProfileCategoryNumber of RespondentsPercentage
Work ExperienceBelow 5 years2745%
5–10 years1830%
Over 10 years1525%
Work RoleDesign610%
Production35%
Construction1525%
Consulting2135%
Supervision610%
Client915%
Table 2. The Case Data of PC Splitting Model Agent.
Family NamePC Unit IDLength (m)Width (m)Height
(m)
Volume
(m3)
Coordinate X (m)Coordinate Y (m)Coordinate Z (m)
PCJQ-01010-01-003-00011.9500.2502.6021.261119.885233.31010.490
PCQ-01010-01-002-00011.2500.2002.1100.203118.435233.7104.490
PCB-01010-01-001-00013.0951.2700.0600.239123.070233.9004.265
PCLT-01010-01-004-00013.0801.2450.1800.842117.195226.8302.770
……
Table 3. The Case Data of PC Property Agent.
Family Type *Vertical/HorizontalInstallation Priority WeightInstallation Operation Time (Per PC)PC Material Cost (Per Cubic Meter)
PCJQVertical130 min¥4647
PCQVertical235 min¥4414
PCBHorizontal335 min¥4292
PCLTVertical435 min¥4051
* Family types refer to the structural types of PCs, such as PCJQ for precast shear walls, PCQ for precast walls, PCB for precast slabs, and PCLT for precast staircases.
Table 4. The Case Data of Crane Layout Agent.
Tower Crane IDMax Boom Length * (m) Coordinate X (m)Coordinate Y (m)Coordinate Z (m)Rotation AngleCorresponding Building ID
C15033.29511.9110.00076.57#
C250106.232−8.8270.000346.28#
C350124.48639.6090.000346.26#
C45056.59574.8670.000346.25#
C550116.53793.1930.000346.24#
C650121.809139.9530.000356.13#
C75061.992135.0920.000346.22#
C85049.565212.5520.000346.21#
* When multiple tower cranes operate at the same height, the maximum boom length is a critical parameter for determining whether a collision may occur between the tower cranes.
Table 5. The Case Data of Storage Yard Agent.
Yard IDYard TypeCoordinate X (m)Coordinate Y (m)Coordinate Z (m)Yard Area (m2)Yard Height Limit (m)
S1PC44.234238.589−1.950426.924
S2PC124.225238.788−1.950211.714
S3PC95.904188.420−1.950635.124
S4PC180.919162.914−1.950211.714
S5PC214.912244.844−1.950211.714
S6PC8.176192.013−1.950142.104
S7PC78.019106.955−1.950211.714
S8PC42.36166.443−1.950211.714
S9PC42.74635.028−1.950211.714
S10PC96.8339.415−1.950211.714
S11PC111.36435.028−1.950379.754
S12PC101.45966.398−1.950419.664
S13PC194.53667.691−1.950379.754
S14PC189.02935.255−1.950378.954
Table 6. The Case Data of Machinery Resource Agent.
Machinery ModelMachinery TypeOperational ParametersMobilization Cost Rental Cost (Per Equipment Shift *)
QTZ250tower cranePreparation time: 10 min/operation
Lowering speed: 40 m/min
Lifting speed: 20 m/min
¥125,000¥1444.89
QY50BMobile CranePreparation time: 8 min/operation
Lowering speed: 30 m/min
Lifting speed: 15 m/min
¥250,000¥1191.33
NL-415Grouting MachineNone¥0¥30.9
* An 8 h operation of a single machine is defined as one equipment shift.
Table 7. The Case Data of Labor Resource Agent.
Trade TypeLabor Cost
(Per Man-Day *)
Number of Workers Allocated Per Machine
PC Worker¥265Tower Crane: 1
Mobile Crane: 1
Surveyor¥218Tower Crane: 2
Rigger¥500Tower Crane: 1
Mobile Crane: 1
Helper¥218Tower Crane: 1
Mobile Crane: 1
Grouting Machine: 4
* An 8 h work period by one worker is defined as one man-day.
Table 8. Simulation Results under the 4C0M Resource Allocation Scheme for the Case Project.
Building Unit IDStart DateEnd DateDirect CostCrane IDPC Units Hoisted
1#1 December 202422 July 2025¥7,846,820C12092
2#1 December 20242 October 2025¥12,650,060C22956
3#1 December 202416 April 2025¥3,456,630C31078
4#1 December 202422 April 2025¥4,950,630C01472
5#10 December 202420 August 2025¥8,540,120C12417
6#8 December 202423 May 2025¥460,772C21324
7#6 December 20241 May 2025¥4,148,790C31147
8#8 December 20241 July 2025¥7,111,470C01763
TotalThe project duration: 305 days¥53,312,2404C0M14,249
Table 9. Simulation Results under the 4C2M Resource Allocation Scheme for the Case Project.
Building Unit IDStart DateEnd DateDirect Cost Crane IDPC Units Hoisted
1#1 December 202427 May 2025¥11,097,810C11392
M0439
M1261
2#1 December 20246 May 2025¥11,911,350C21307
M0802
M1847
3#1 December 202411 April 2025¥3,894,440C31073
M02
M13
4#1 December 20246 May 2025¥5,557,370C01297
M083
M192
5#3 December 20246 May 2025¥8,844,580C11308
M0578
M1531
6#3 December 202415 May 2025¥5,418,280C21291
M017
M116
7#6 December 20241 May 2025¥4,622,270C31147
8#8 December 202431 May 2025¥8,377,460C01390
M0186
M1187
TotalThe project duration: 181 days¥59,723,5604C2M14,249
Table 10. Simulation Results under the 8C2M Resource Allocation Scheme for the Case Project.
Building Unit IDStart DateEnd DateDirect Cost Crane IDPC Units Hoisted
1#1 December 202418 May 2025¥10,827,630C11373
M0311
M1408
2#1 December 202418 May 2025¥15,047,220C21433
M0797
M1726
3#1 December 202416 April 2025¥5,048,880C31078
4#1 December 202417 May 2025¥7,142,030C41415
M028
M129
5#1 December 202418 May 2025¥11,436,920C51484
M0448
M1485
6#1 December 202414 May 2025¥6,586,830C61311
M06
M17
7#1 December 202425 April 2025¥5,656,560C71147
8#1 December 202418 May 2025¥9,225,290C01367
M0229
M1167
TotalThe project duration: 168 days¥70,971,3608C2M14,249
Table 11. Data Analysis on the Marginal Effect of Mobile Cranes.
Resource Allocation SchemeThe Project Direct CostThe Project DurationCost IncreaseSchedule Reduction
4CM0¥53,312,240305 days//
4CM1¥55,142,440193 days3.43%36.72%
4CM2¥59,723,560181 days12.03%40.66%
4CM3¥62,286,190155 days16.83%49.18%
Disclaimer/Publisher’s Note: The statements, opinions and data contained in all publications are solely those of the individual author(s) and contributor(s) and not of MDPI and/or the editor(s). MDPI and/or the editor(s) disclaim responsibility for any injury to people or property resulting from any ideas, methods, instructions or products referred to in the content.