1. Introduction
University students currently face increasing pressures from academics, daily life, and social interactions, leading to more pronounced mental and physical health issues [
1,
2,
3]. According to restorative environment theory, restorative settings can alleviate mental fatigue and promote both psychological and physiological recovery [
4,
5]. In this study, university campus teaching zones refer specifically to the outdoor public spaces adjacent to teaching buildings, while indoor spaces are used for teaching activities. These outdoor areas are closely connected to students’ daily learning and recovery. However, empirical studies on the influencing factors and mechanisms of soundscape restoration in teaching areas remain limited. To address this gap, the present study integrates field surveys with psychological and physiological experiments to systematically investigate these mechanisms, aiming to improve campus environmental quality and promote student recovery.
Previous research shows that natural environments facilitate stress recovery [
6,
7], and natural landscapes such as green landscapes and waterscapes significantly enhance environmental restorative effects [
8]. Previous studies in urban public spaces [
9]—including streets [
10], community parks [
11], and squares [
12]—have shown that incorporating natural landscape elements can not only improve restorative effects but also reduce the negative impacts of urban noise [
13]. These findings suggest that a higher degree of naturalness consistently enhances restorative outcomes, which may also be relevant in campus teaching environments.
The restorative qualities of university campus environments have also gained increasing attention. Existing studies have explored the restorative effects of school visual and indoor landscapes [
11], thus showing that green landscapes and waterscapes can reduce the influence of urban noise and help students regulate their psychological states and stress levels. In addition to providing an environment for psychological relaxation, natural landscape elements can improve air quality, foster social interaction, and enhance the restorative capacity of campus environments [
14]. Indoor plants in classrooms have been found to improve students’ attention and alleviate stress [
15,
16]. Research on classroom window views indicates that windows with high-quality views can effectively reduce stress, and views containing green landscapes or waterscapes are particularly effective in alleviating mental and physical fatigue [
15]. These findings demonstrate that natural landscape elements can significantly ease student stress.
With the deepening of research on restorative environments, the quality of campus acoustic environments has also received more attention. Earlier studies examined the adverse effects of traffic noise on human health and learning efficiency, showing that excessive exposure can significantly impair students’ concentration and academic performance [
17,
18]. Although some campuses have established quiet zones to alleviate these impacts, planning constraints and early-stage development have led to certain teaching areas being adjacent to external traffic roads, in which traffic noise continues to affect the acoustic environment and students’ restorative experiences. Previous studies have focused on mitigating the negative impacts of traffic noise through methods such as reducing the equivalent continuous A-weighted sound pressure level (LAeq, dB(A)) [
11,
19]. However, soundscape research shows that simply lowering environmental LAeq values does not necessarily improve acoustic quality [
8]. As an important environmental factor influencing cognitive experiences, the sound environment affects both the comfort of learning spaces and emotional and psychological regulation through perceptual mechanisms [
20,
21]. Appropriate sound environments can enhance the comfort of learning spaces and prevent cognitive fatigue caused by noise-induced interference [
8]. Moreover, natural sounds such as Birdsong and Fountain Sound can trigger relaxation mechanisms in the brain, alleviate stress, and promote psychological restoration [
20]. Soundscape studies have also revealed that natural sounds can reduce physiological stress responses—for instance, by activating the parasympathetic nervous system, lowering the heart rate, and decreasing skin conductance—thereby relieving stress, enhancing concentration, improving comfort, and increasing environmental satisfaction [
22,
23].
In addition, soundscape restoration is influenced by the visual environment. The naturalness and diversity of visual landscapes can enhance restorative soundscape experiences, and in environments with green landscapes, the coordination of visual and auditory stimuli can enhance overall restorative outcomes [
14]. Environmental LAeq levels and sound source composition also affect soundscape restoration: higher LAeq values often reduce restoration, while the addition of natural sounds such as fountain sound or birdsong can mitigate these negative effects [
24]. Research finds that the signal-to-noise ratio (SNR) between fountain sound and traffic noise significantly influences soundscape restorativeness, and increasing the SNR of restorative sounds effectively reduces the negative impact of traffic noise [
25]. In recent years, studies on university campus soundscapes have increased, revealing that anthropogenic sounds such as traffic noise can reduce learning efficiency and evoke negative emotions [
26], whereas natural sound sources in campuses can improve emotional states and enhance concentration and cognitive performance [
27]. Particularly in learning areas and leisure spaces, high-quality soundscapes can promote students’ psychological restoration [
28]. However, research on the factors influencing the soundscape in teaching areas remains lacking.
In summary, soundscapes in university campus teaching areas are closely related to students’ learning activities and can facilitate their mental and physical recovery. However, research on campus teaching area soundscapes remains insufficient, and studies on the factors and mechanisms influencing soundscape restorativeness are relatively scarce. Therefore, based on restorative soundscape theory, this study integrates field surveys and psychological and physiological experiments to examine the characteristics and current status of soundscape restorativeness in university campus teaching areas. It further explores how spatial visual environments, sound source types, and the SNR—under the interaction of visual and auditory factors—affect the degree and patterns of soundscape restoration, providing insights for improving spatial environmental quality and promoting students’ mental and physical recovery.
2. Current Status Survey of Soundscape Restoration
2.1. Survey Methods
To investigate the characteristics of soundscape restorativeness, three universities were selected as survey sites: Qilu University of Technology, Shandong Jiaotong University, and Shandong Jianzhu University. The rationale for this selection is based on representativeness, environmental diversity, and research feasibility. Specifically, Shandong Jianzhu University represents a compact urban campus, while both Shandong Jiaotong University and Qilu University of Technology are dispersed green campuses. This distinction provides a robust basis for a comparative analysis of soundscape characteristics across varied spatial contexts. In addition, parts of the main teaching areas in these universities are located adjacent to major urban roads, which makes them suitable for examining the influence of external traffic noise. As all three campuses are non-open campuses, their soundscapes are primarily shaped by internal activities and nearby traffic, ensuring the comparability and reliability of the results. A research team of eight graduate students from Shandong Jianzhu University conducted on-site surveys of spatial features, landscape characteristics, acoustic characteristics, and soundscape restorativeness in the teaching areas.
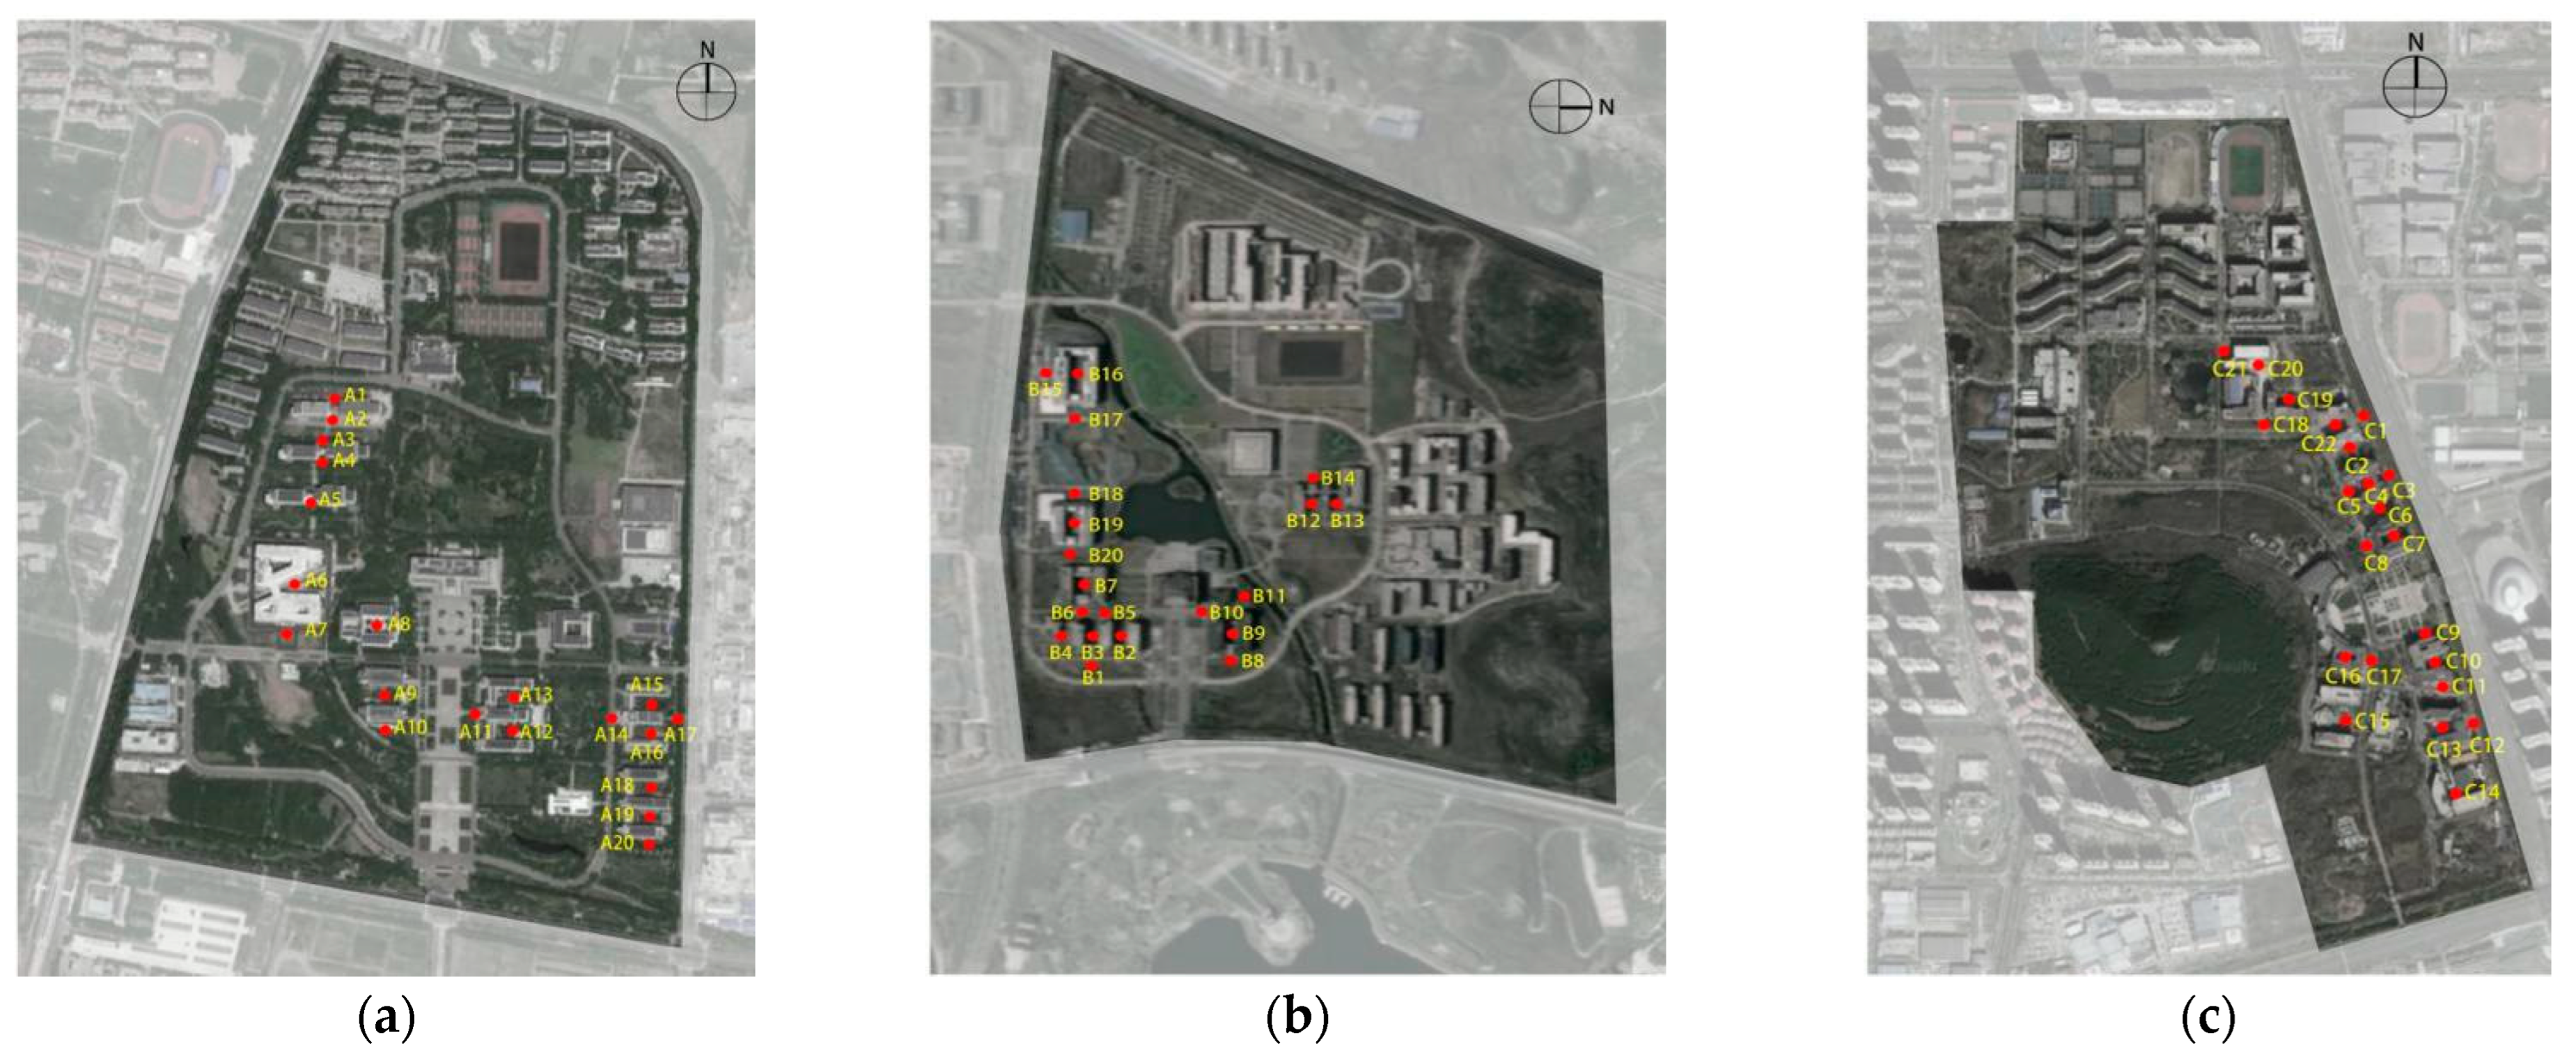
A total of 62 measurement points were selected for this survey and distributed across Qilu University of Technology (20 points: A1–A20), Shandong Jiaotong University (20 points: B1–B20), and Shandong Jianzhu University (22 points: C1–C22). The layout of measurement points is shown in
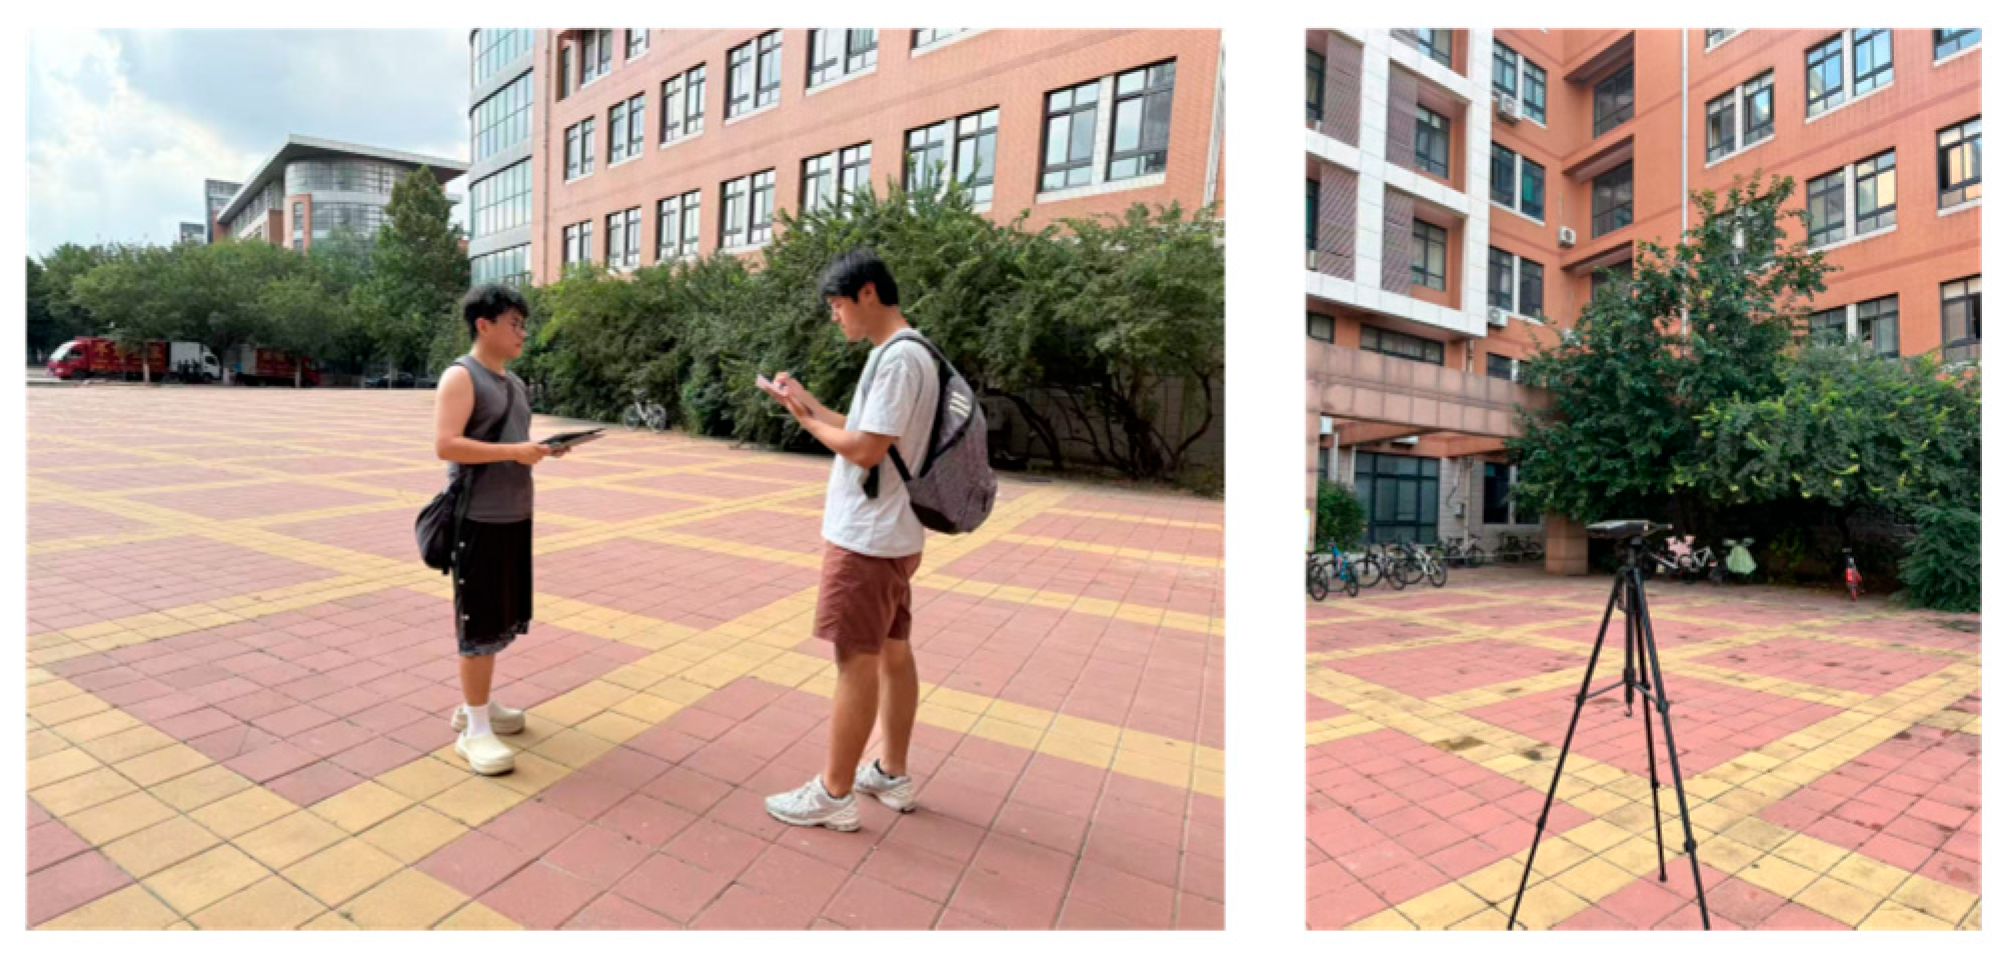
Figure 1. The survey was conducted on weekdays under sunny weather conditions, without rain or strong wind, from 9:00 to 11:00 A.M., under wind speeds below 5 m/s, using both on-site measurements and questionnaire surveys. Photographs of the measurement and questionnaire processes are shown in
Figure 2.
The measurement process strictly adheres to ISO 1996-1:2016 [
29] and ISO 1996-2:2017 [
30] standards, employing a B&K 2260 sound level analyzer compliant with Class 1 accuracy to record LAeq. A Roland high-precision recorder captured environmental sounds, while a SONY video camera recorded environmental videos and photographs. Measurements of LAeq and sound spectra were conducted at a height of 1.5 m above the ground. For each measurement point, three non-continuous recordings were taken within each measurement period, each lasting three minutes, with an interval of approximately 15 min between recordings. The measurements were carried out during the daytime period (07:00–19:00), encompassing class sessions, break times, and peak traffic hours. The average of the three LAeq measurements at each point was calculated as the representative LAeq value, and the composition of sound sources was documented. Simultaneously, environmental sounds were recorded, and photographs were obtained.
Soundscape research places significant emphasis on individuals’ subjective perceptions. Two methods—on-site surveys and soundscape walks—were employed to collect data on soundscape restorativeness in teaching areas. A 5-point Likert scale was adopted for quantitative evaluation, and the questionnaire was divided into two sections.
The first section was the Outdoor Environment Restorative Quality Questionnaire (see
Table 1), which collected data on students’ subjective satisfaction with, and restorative needs for, the teaching area environment through fixed-point surveys. The questionnaire was developed based on Kaplan’s restorative environment theory [
31,
32] and prior studies on urban green landscapes and campus public spaces, thus making it suitable for investigating environmental perception and satisfaction in campus teaching areas.
The second section comprised the Soundscape Perception Evaluation Scale (see
Table 2) and the Perceived Restorative Soundscape Scale (PRSS) (see
Table 3). At each typical measurement point, the research team conducted a five-minute soundscape walk, after which participants completed the scales to collect data on soundscape perception and restorativeness. The Soundscape Perception Evaluation Scale comprised four indicators—comfort, diversity, naturalness, and audiovisual coordination—assessed from both the visual and auditory dimensions. The PRSS has been widely applied in soundscape studies and provides a comprehensive assessment of individuals’ psychological restorativeness under different soundscape conditions.
Together, these two sections allowed for a systematic evaluation of students’ subjective perceptions of the campus teaching area environment, encompassing both visual and auditory factors affecting soundscape restorativeness.
2.2. Visual Environmental Characteristics
The survey results also categorized spatial forms into four types (see
Table 4), a single-sided enclosure, double-sided enclosure, three-sided enclosure, and four-sided enclosure, with the three-sided enclosure being the most common. The enclosing buildings are mostly four to six stories tall, with façades finished with paint, tiles, or glass. Landscape elements mainly include Hardscape paving, vegetation, and waterscape features. Different combinations of these elements form three types of ground interfaces:
Green landscapes dominated by vegetation with a minor proportion of Hardscape paving.
Hardscapes dominated by paved surfaces with limited groundcover plants.
Waterscapes dominated by water features, supplemented by vegetation and a minor proportion of Hardscape paving.
2.3. Acoustic Environment Characteristics
A survey of seven representative teaching areas—A1, A8 (Qilu University of Technology), B13, B15, B20 (Shandong Jiaotong University), C19, and C22 (Shandong Jianzhu University)—was conducted to assess the current audiovisual environment (see
Figure 3). LAeq measurements were conducted from 7:00 to 19:00, thus corresponding to the daily teaching schedule. Within this period, we divided the time into two-hour intervals according to class timetables and selected representative monitoring points based on the results of the preliminary survey. At each measurement point, three repeated measurements were conducted, each lasting three minutes, and the average value was used for the subsequent analysis. Background LAeq levels during class time ranged from 40.8 to 56.2 dB(A), whereas LAeq levels during class breaks with pedestrian activity ranged from 55.4 to 64.5 dB(A). Variations in LAeq levels over time closely corresponded to fluctuations in pedestrian and vehicle traffic, consistent with class schedules and urban traffic patterns. The frequency spectrum of the typical sound environment exhibited a characteristic dominance of low- and mid-frequency components.
To identify typical sound source types and their perceived frequency in the teaching areas, all audible sources at each measurement point were recorded (see
Figure 4). Among these sources, Birdsong was the most frequently perceived, followed by Traffic Noise. The recorded sound sources were categorized as follows:
Natural sounds: Birdsong, Rustling Leaves, Wind Sound, and Insect Sounds.
Human activity sounds: Footsteps, Lecturing Voice, and Crowd Noise.
Artificial sounds: Traffic Noise, Light Rail Noise, Machine Noise, Air Conditioning Unit Noise, Renovation Noise, Class Bell Sound, and Broadcast Sound.
2.4. Soundscape Perception and Restorative Potential
A reliability analysis of the survey data yielded a Cronbach’s Alpha of 0.907 and a Kaiser–Meyer–Olkin (KMO) test value of 0.894, thus indicating high data reliability. The soundscape evaluation results for the seven representative measurement points are presented in
Table 5, and a correlation analysis between soundscape perception and restorativeness is presented in
Table 6. The findings indicate that correlation coefficients exceeded 0.9 for the following pairs: VCD and VDD; SND and SCD; SVHD and SCD; SVHD and SND; PRSS and SCD; PRSS and SND; and PRSS and SVHD. These results confirm that soundscape restorativeness is influenced by both acoustic and visual environments and that these factors interact with each other.
A total of 98 questionnaires assessing the restorative quality of the outdoor environment were distributed, with 53% male and 47% female respondents. In the scoring system, a 5-point Likert scale was applied, where 3 was defined as the neutral reference point. Scores greater than 3 were interpreted as positive evaluations (“satisfied”/“reasonable”) and scores lower than 3 as negative evaluations (“dissatisfied”/“unreasonable”), and a score of 3 indicated neutrality. The results indicate that 53.4% of students were satisfied with the visual environment in teaching areas, whereas only 45.6% were satisfied with the acoustic environment. Only 12.2% considered the plant configuration reasonable, and merely 10% considered the acoustic environment reasonable. These findings suggest that the environment, plant configuration, and acoustic conditions of teaching areas require improvement to enhance student satisfaction.
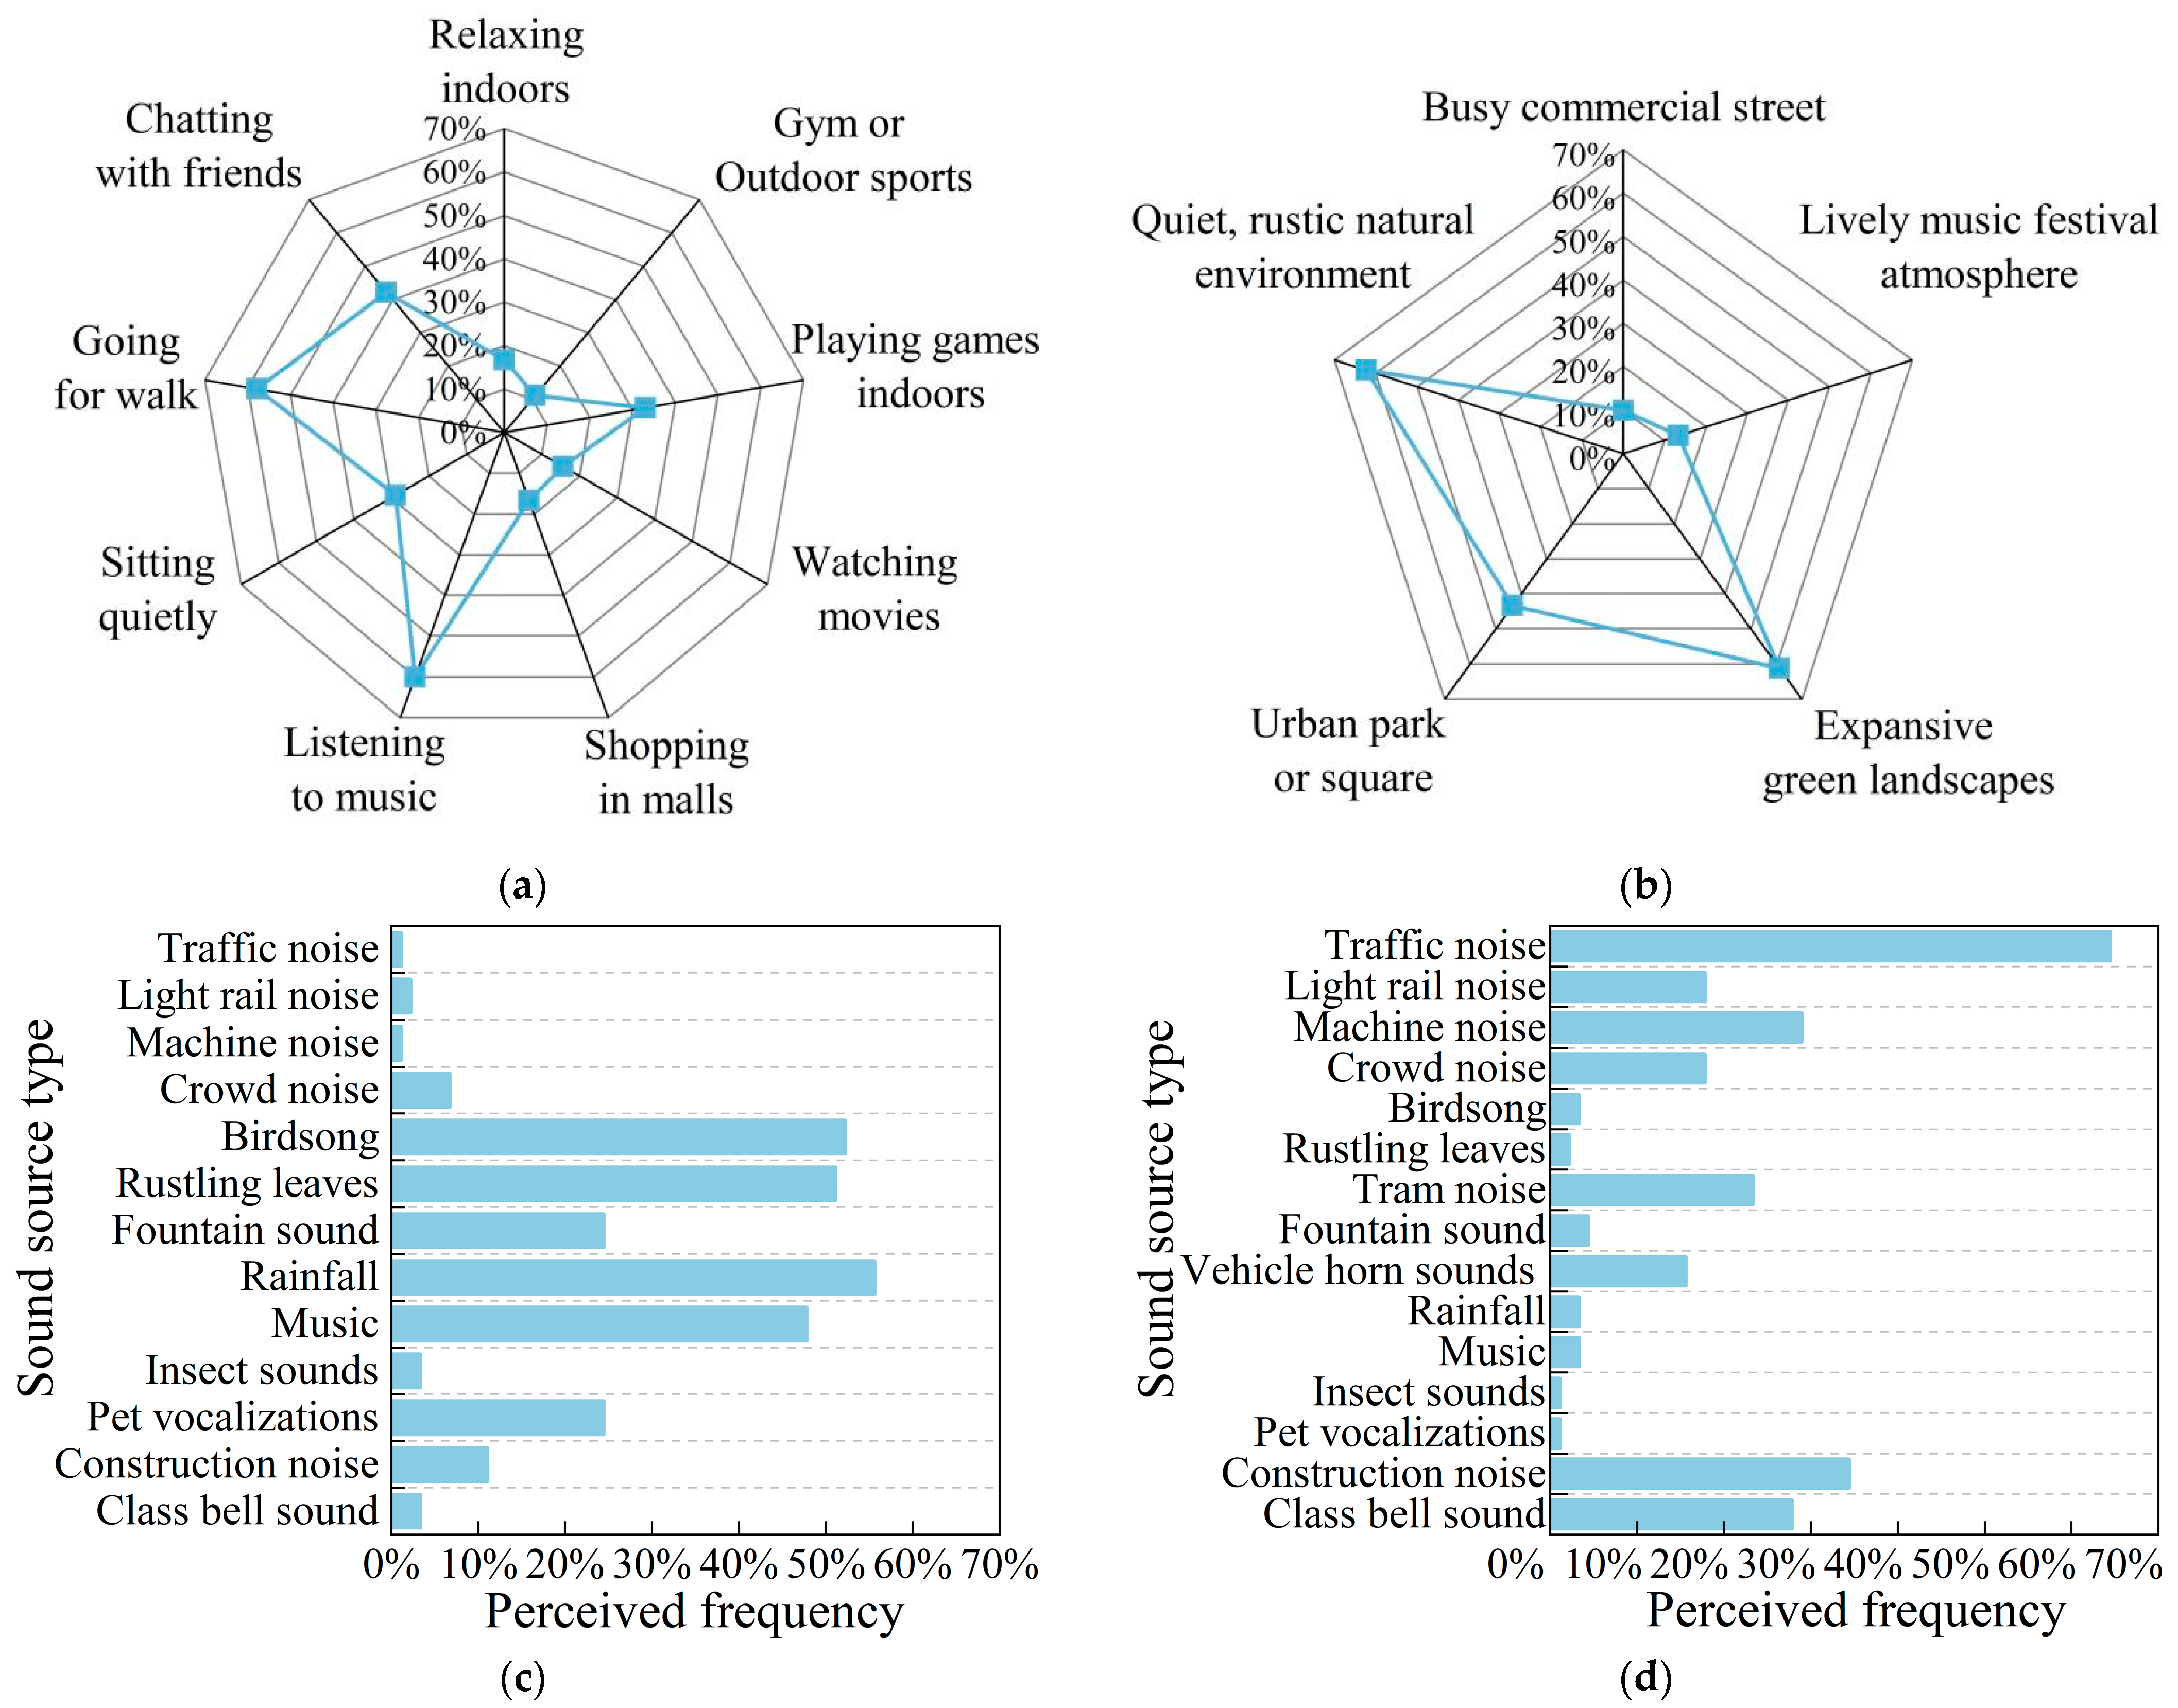
Statistics on restorative needs (see
Figure 5) revealed that listening to music was particularly important for relieving stress among college students (61.2%). The highest recognition of restorative value was attributed to quiet, rustic environments (62.2%). Among disruptive sound sources in teaching areas, Traffic Noise ranked the highest (64.4%), followed by construction noise (34.4%) and machinery noise (28.9%). Students expressed a preference for natural sounds such as Rainfall, Birdsong, and Rustling Leaves, and they tended to avoid artificial noises including machinery and Traffic Noise.
3. Results
3.1. Acoustic Environment Simulation
To further examine the negative impacts of traffic noise on the acoustic environment of teaching zones, a simulation was conducted using Cadna/A software 3.1 based on the field survey results. The specific parameter settings are shown in
Table 7. As shown in
Figure 6, the influence of on-campus traffic on the acoustic environment was relatively minor compared with that of off-campus traffic. Nevertheless, off-campus traffic noise dominated the overall acoustic environment and exerted a pronounced adverse effect on the teaching zones.
3.2. Experimental Methods
Previous research has demonstrated that factors such as spatial form, visual landscape characteristics [
33,
34,
35,
36,
37,
38,
39], sound source type, and the SNR [
40,
41,
42,
43,
44,
45,
46,
47,
48,
49,
50] can significantly influence the restorative effects of soundscapes. Building upon these findings, this study adopted a combination of psychological and physiological experiments to systematically examine how the visual environment, sound source types, and SNR affect the restorative potential of soundscapes in university campus teaching areas.
3.2.1. Spatial Model
Based on the survey results, an experimental model representative of restorative soundscapes in teaching areas was developed. The most prevalent spatial configuration—a three-sided enclosure—was selected as the prototype. The side boundaries consisted of six-story teaching building façades, which were finished with glass windows and brick-red painted walls. The ground surfaces included Hardscape paving, green landscapes, and waterscape features. Three distinct visual spatial models were produced using SketchUp 2023 and rendered into high-resolution videos via D5 2.6 software. These served as the visual stimuli for the experiments (see
Figure 7).
3.2.2. Sound Source Signals
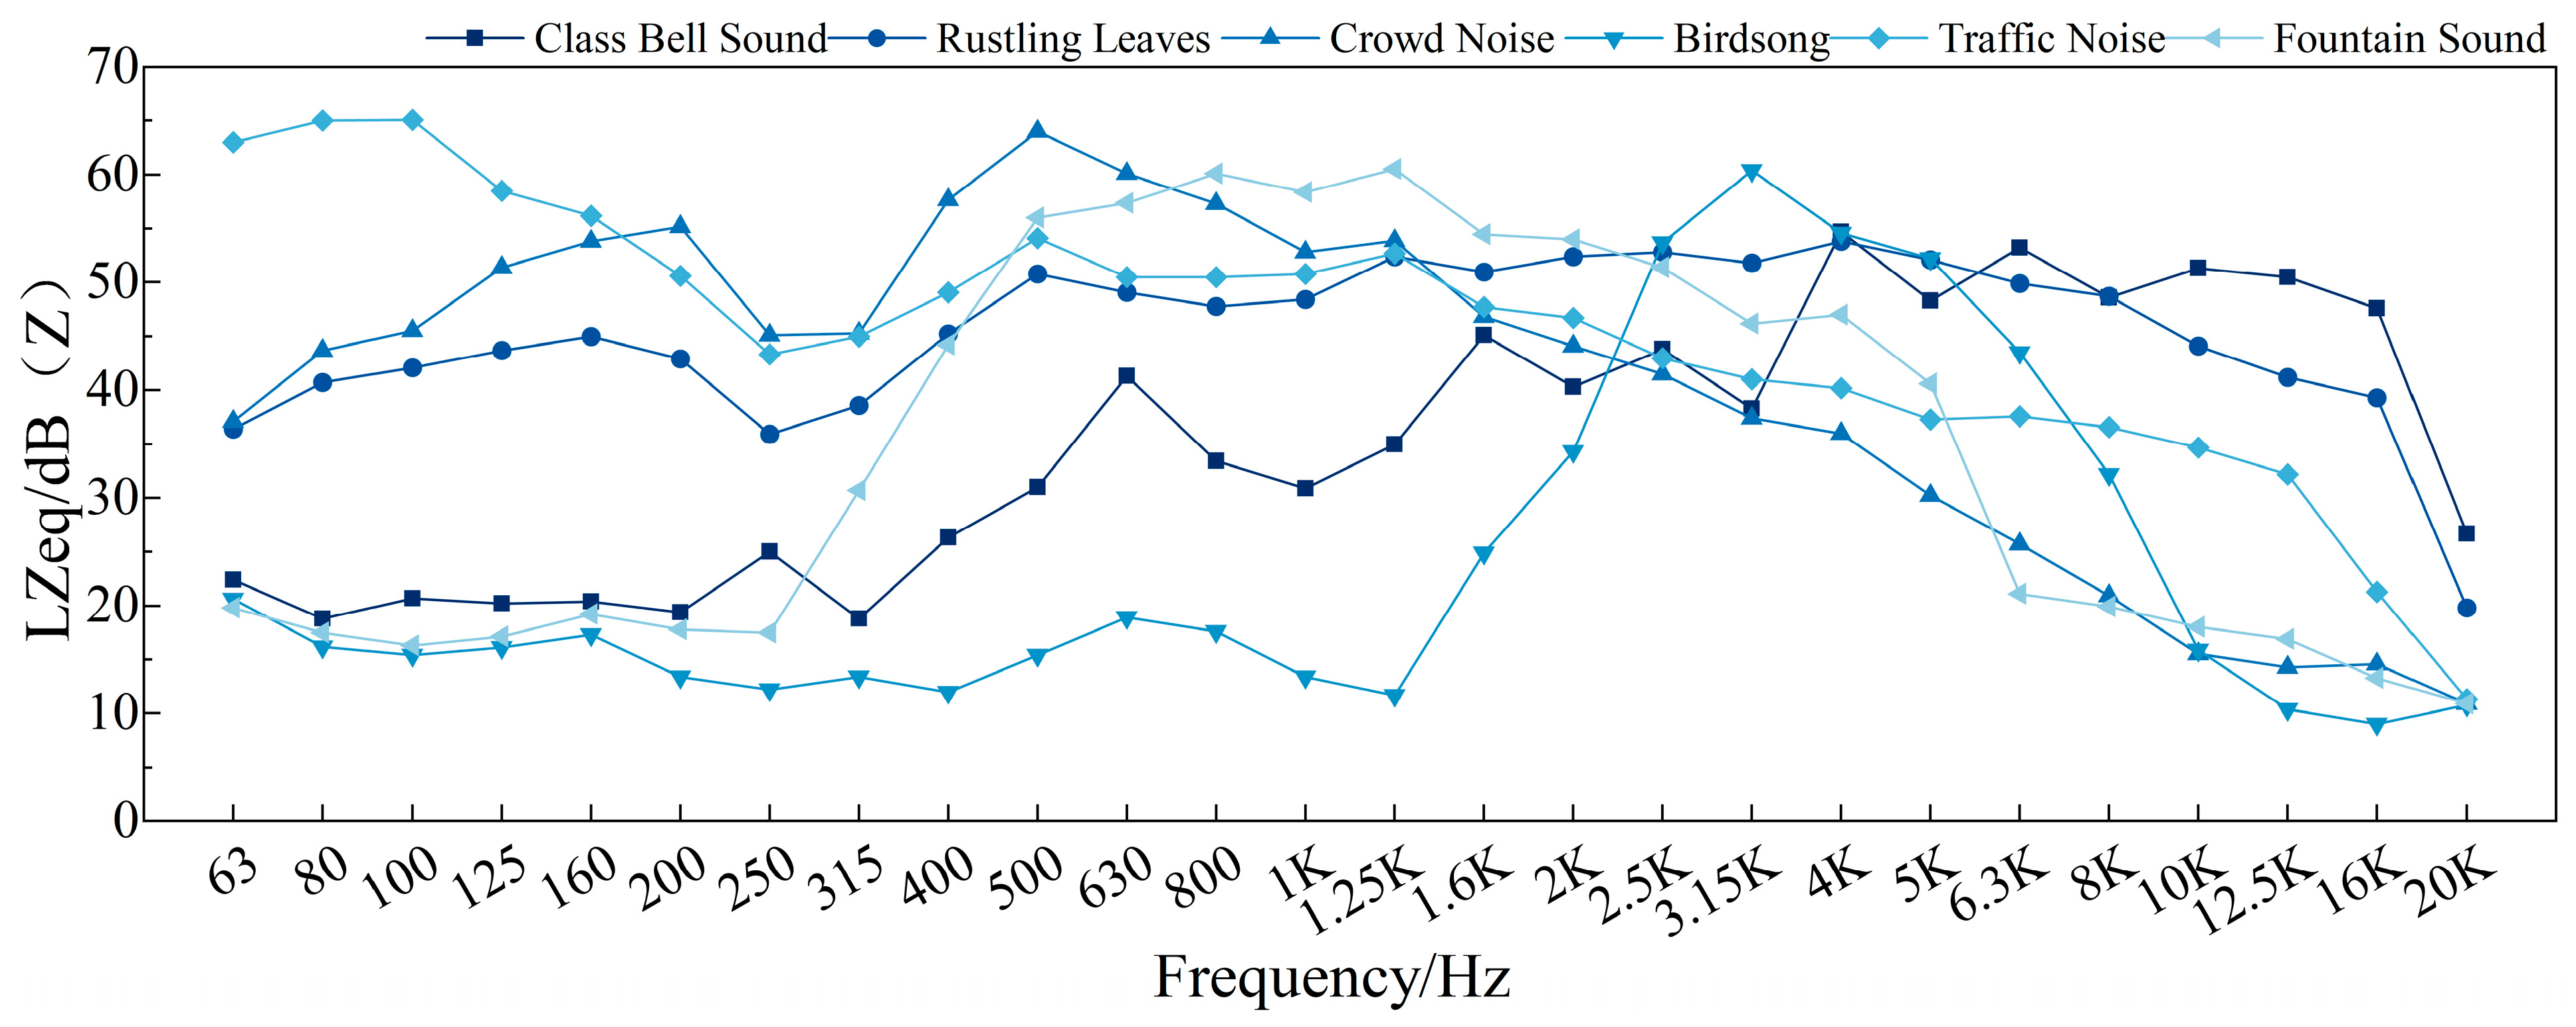
Based on field surveys, Fountain Sound, Birdsong, Rustling Leaves, Traffic Noise, Crowd Noise, and Class Bell Sound were selected as experimental sound sources. To avoid interference from other factors, all sound signals were calibrated to the 50 dB(A). The spectrograms of each sound source are shown in
Figure 8.
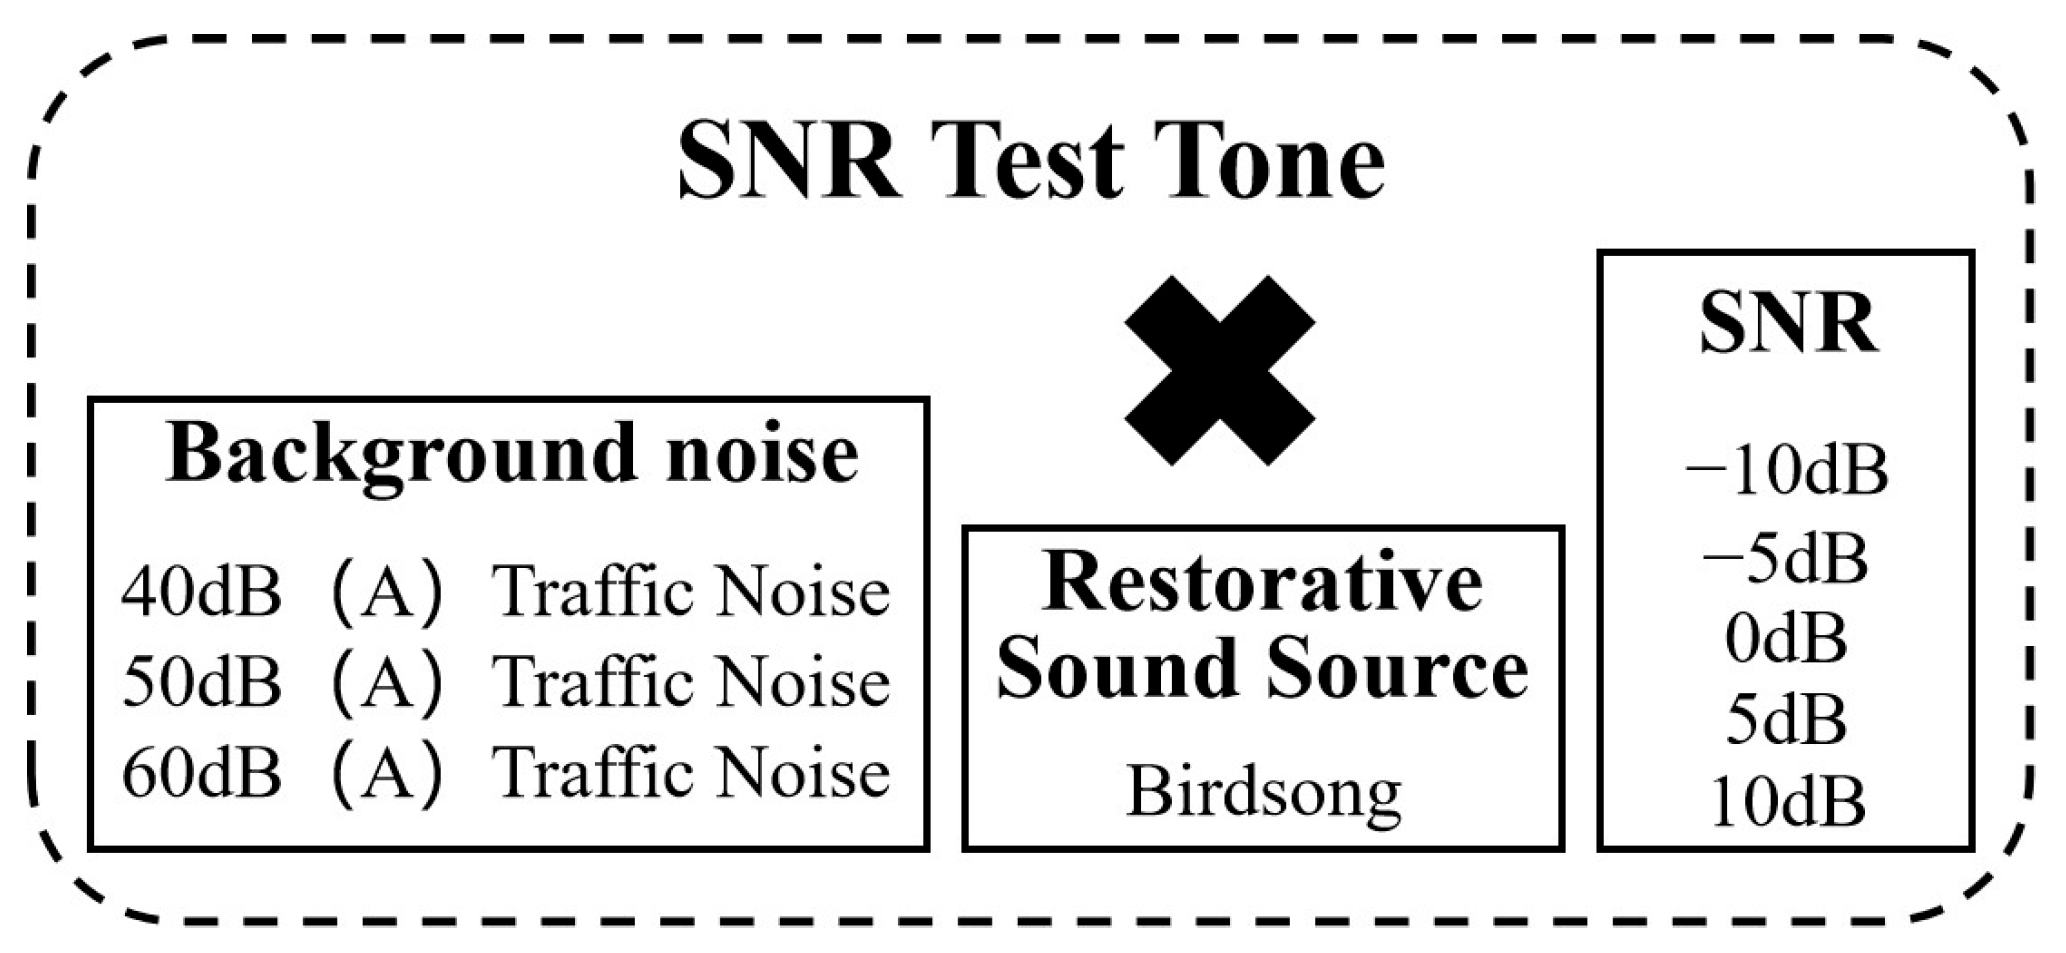
The experiments revealed that Fountain Sound and Birdsong possess significant restorative potential. However, field and online surveys indicate that fountain installations are rare in teaching areas, thus making their introduction challenging. Conversely, with increased campus greening, Birdsong has become a more common and readily implementable restorative sound source. Therefore, Birdsong was selected as the restorative sound source for the signal-to-noise ratio experiment, while Traffic Noise at 40 dB(A), 50 dB(A), and 60 dB(A) served as background noise. This resulted in SNRs of −10 dB, −5 dB, 0 dB, 5 dB, and 10 dB (see
Figure 9 for the combination method). Additionally, a control group was established, using only traffic noise as the stimulus sound source.
3.2.3. Experimental Procedure
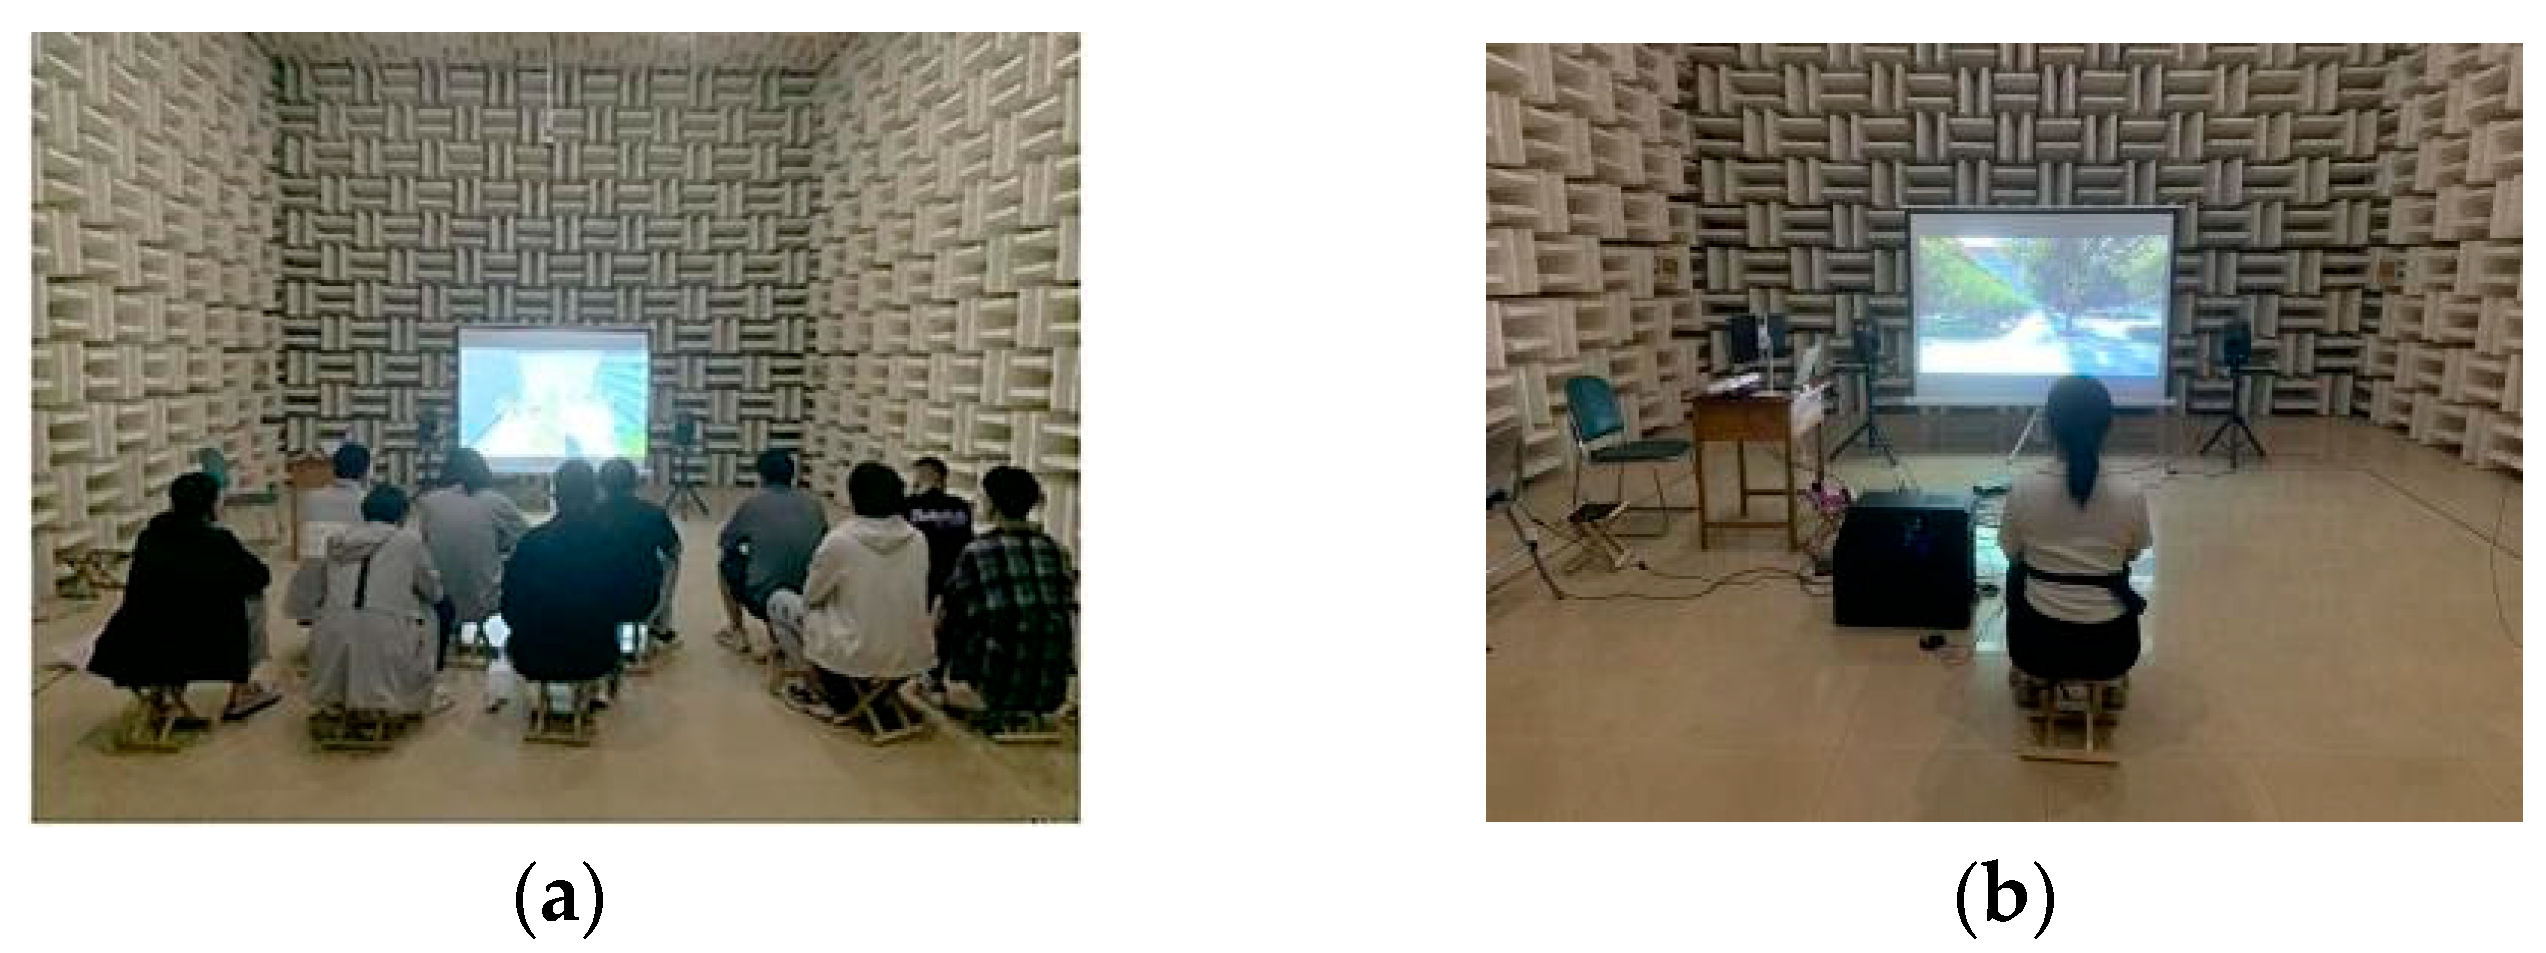
The experiments on soundscape restorativeness were conducted in the semi-anechoic chamber of Shandong Jianzhu University, adopting an audiovisual experimental design that included both psychological and physiological components. Visual scenarios of campus teaching zones were projected onto a large screen, while the corresponding sound signals were presented synchronously through Genelec stereo speakers, with LAeq levels controlled by a BK2260 analyzer.
Psychological experiments: A total of 163 architecture students (95 male, 68 female) participated. Visual scenarios were projected onto a large screen, and the corresponding sound signals were presented through Genelec stereo speakers, with LAeq levels controlled by a BK2260 analyzer. After each audiovisual stimulus, participants were asked to complete the PRSS questionnaire (see
Table 3). Each session lasted approximately 90 s and was followed by a two-minute break before the next stimulus.
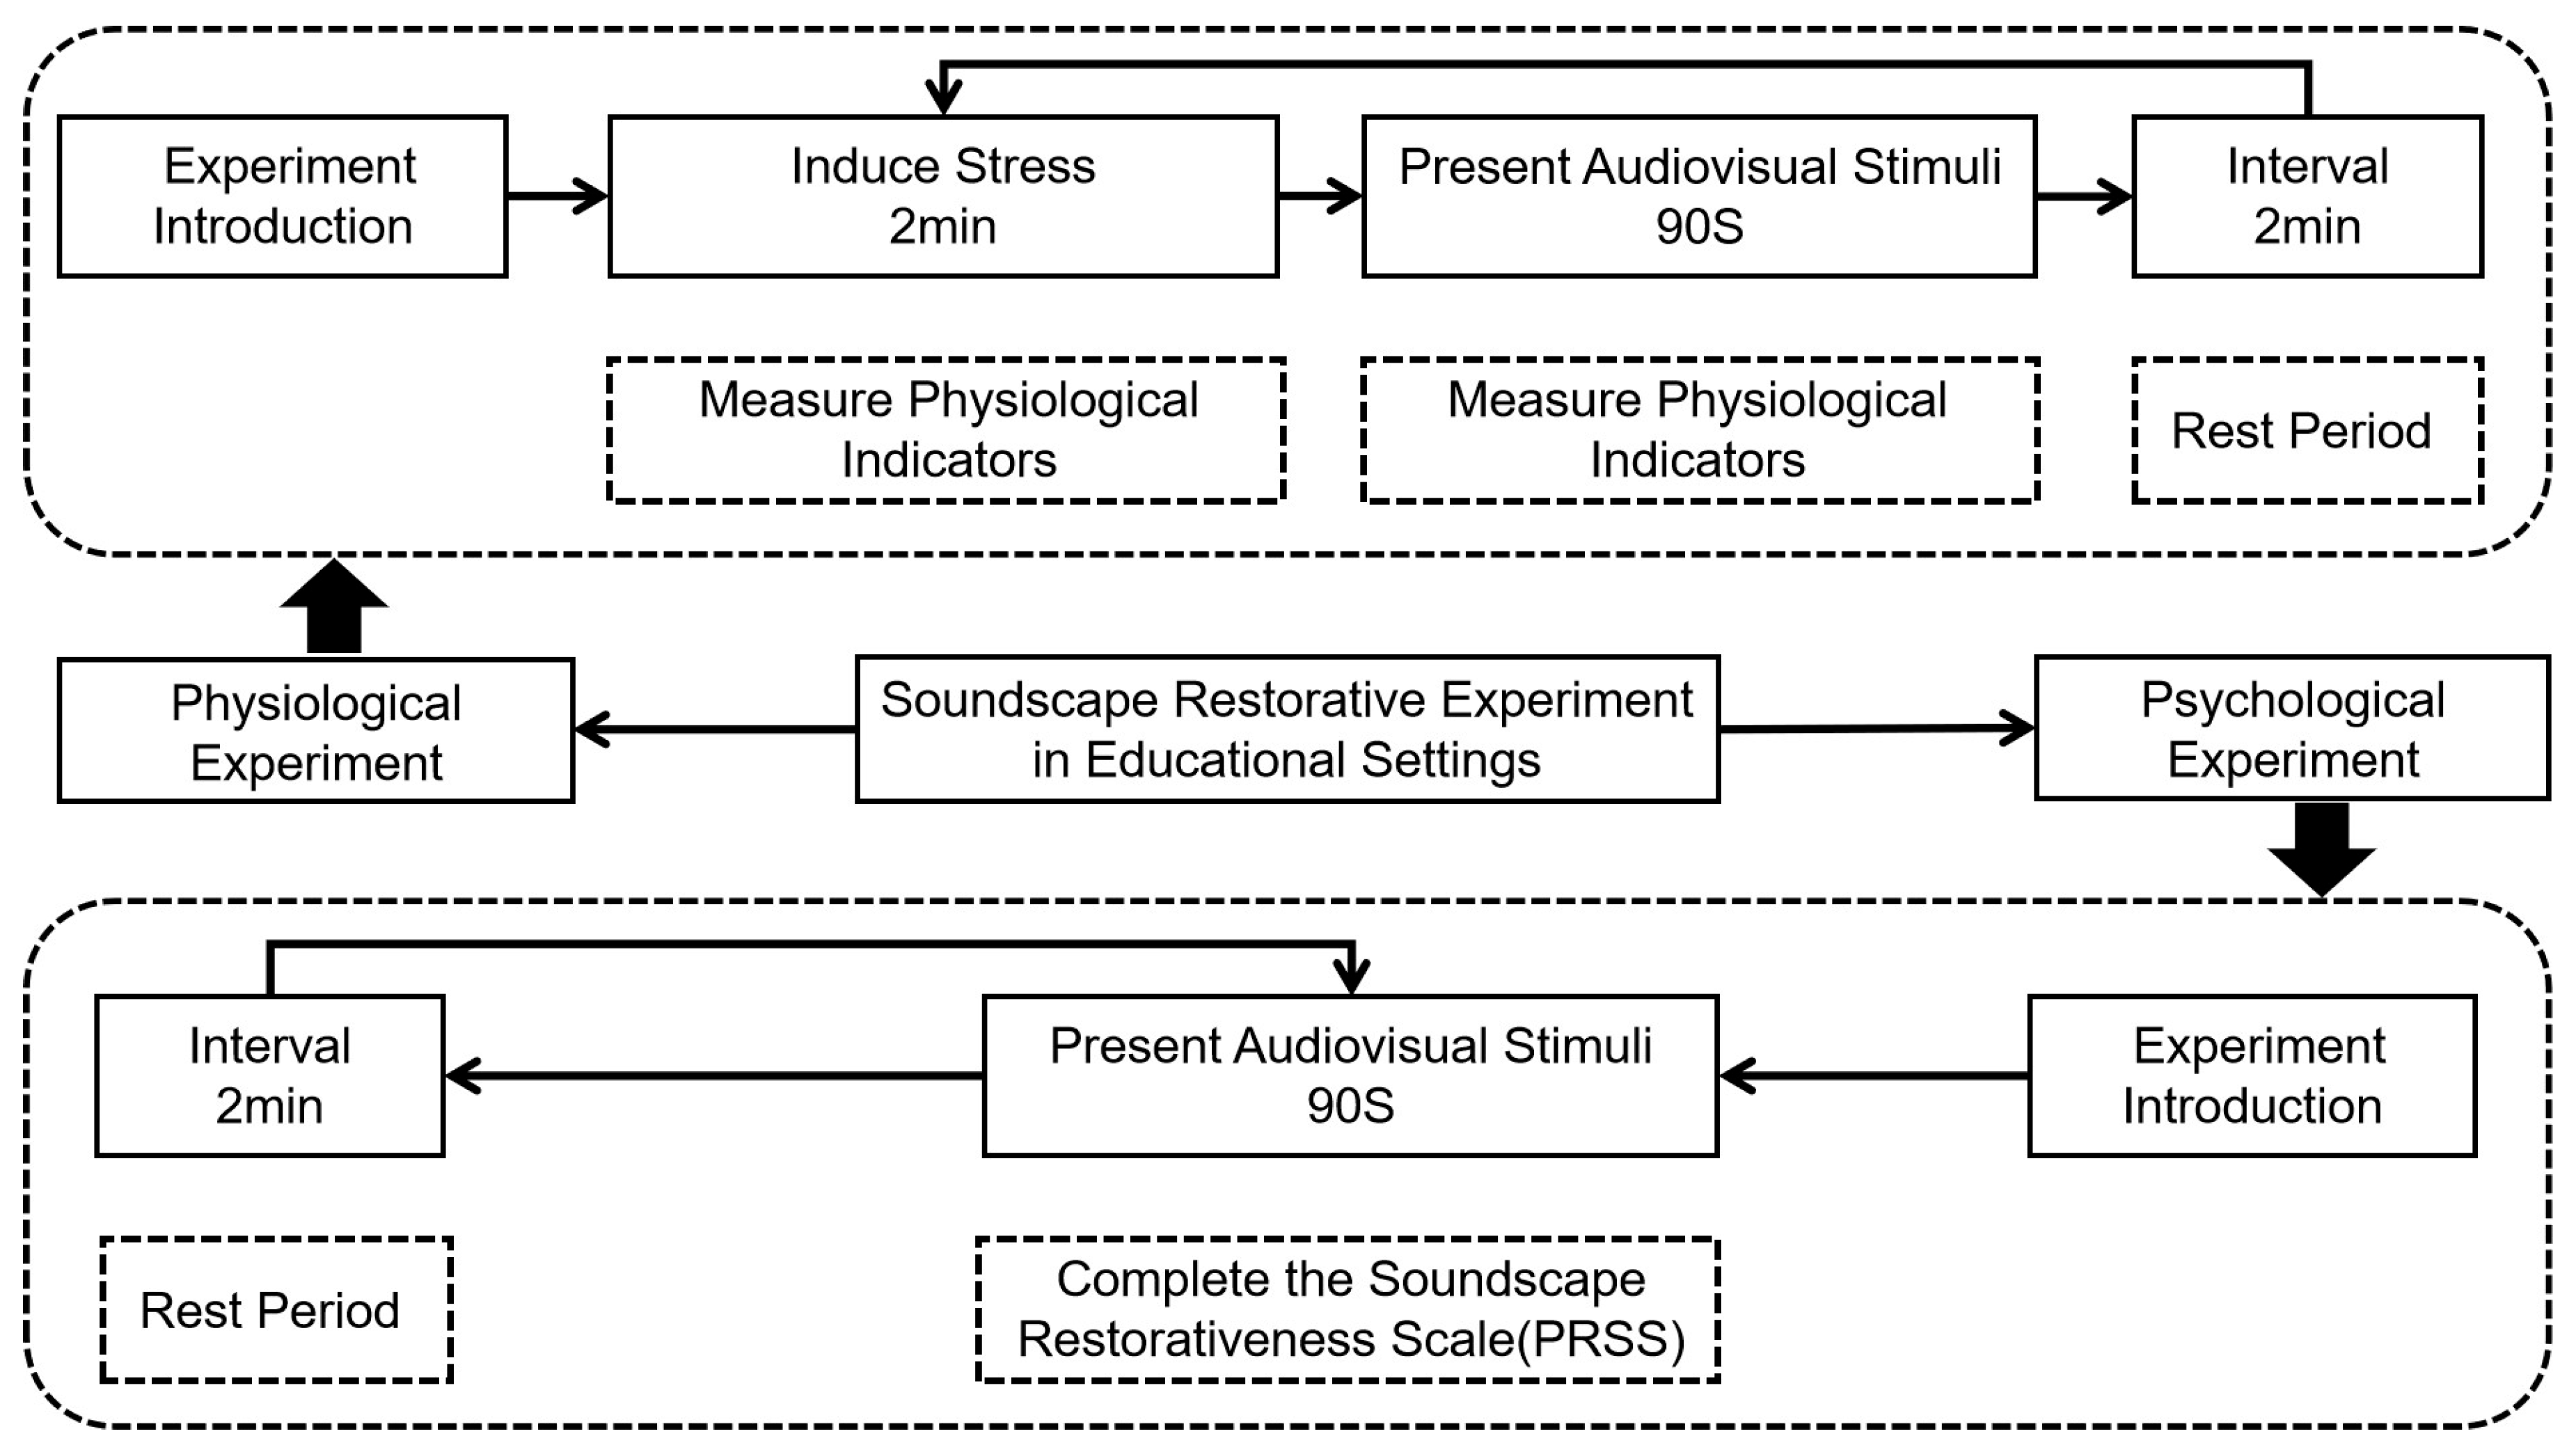
Physiological experiments: A total of 18 students (6 male, 12 female) participated individually. Physiological indicators—including skin conductance activity (EDA), heart rate (HR), respiratory rate (RR), and heart rate variability (HRV)—were continuously recorded using the HRT Human Research System. Before the experiment, participants sat quietly for two minutes to stabilize physiological indicators, which was followed by a two-minute mental arithmetic stress task. The audiovisual stimuli were subsequently presented while physiological data were collected for 90 s [
51,
52]. The experimental flowchart and setup are shown in
Figure 10 and
Figure 11.
3.3. Dimensions of Soundscape Restorativeness
SPSS 27.0 was used to analyze the data and examine the factors influencing soundscape restorativeness in university campus teaching areas. A total of 3588 valid questionnaires were ultimately obtained during the psychological experiments. The Cronbach’s Alpha coefficient was 0.930 (p < 0.001), and the KMO value was 0.950, thus indicating excellent levels of internal consistency and reliability, thereby confirming that the data were well-suited for factor analysis.
Principal component analysis with varimax rotation was applied to 19 items, thus resulting in the extraction of three restorative dimensions (see
Table 8). Factor loadings of each variable were obtained usingthe varimax-related method, and items with loadings below 0.7 were excluded, resultingin 18 retained items. Attractiveness (comprising Charm, Staying Away–From, and Compatibility), Being Away (aligned with Continuity), and Coherence (corresponding to Staying Away–Leaving). Attractiveness accounted for 52.64% of the total variance—substantially higher than Being Away (11.79%) and Coherence (9.58%)—highlighting its primary role in the restorative potential of soundscape within teaching areas.
Attractiveness reflects the capacity of the campus teaching area soundscape to redirect attention from highly focused tasks, stimulate involuntary attention, alleviate cognitive fatigue, and reduce psychological stress. Being Away denotes the ability of the soundscape to guide individuals from a state of fatigue to one of physical and mental relaxation. Coherence describes the degree of harmony between auditory and visual elements, whereby greater congruence enhances soundscape restorativeness. Accordingly, the restorative potential of soundscapes in campus teaching areas should be evaluated across these three dimensions.
3.4. Effects of the Visual Environment
To examine the influence of the visual environment on the restorative potential of the soundscape in teaching areas, data were analyzed for three types of ground surfaces: green landscapes, waterscapes, and Hardscape. The KMO value was 0.821, with χ
2 = 2074.166 (
p = 0.000), thus indicating that the dataset was suitable for the subsequent factor analysis. The Kruskal–Wallis test results for the restorative qualities and restorative dimensions of soundscapes across three types of teaching areas revealed significant differences in the attractiveness and repellency of traffic noise, crowd noise, and class bell sounds. However, no significant differences were found in the restorative qualities or dimensions of other sound sources. Multiple comparisons were conducted on the restorative dimensions showing significant differences, with the results presented in
Table 9.
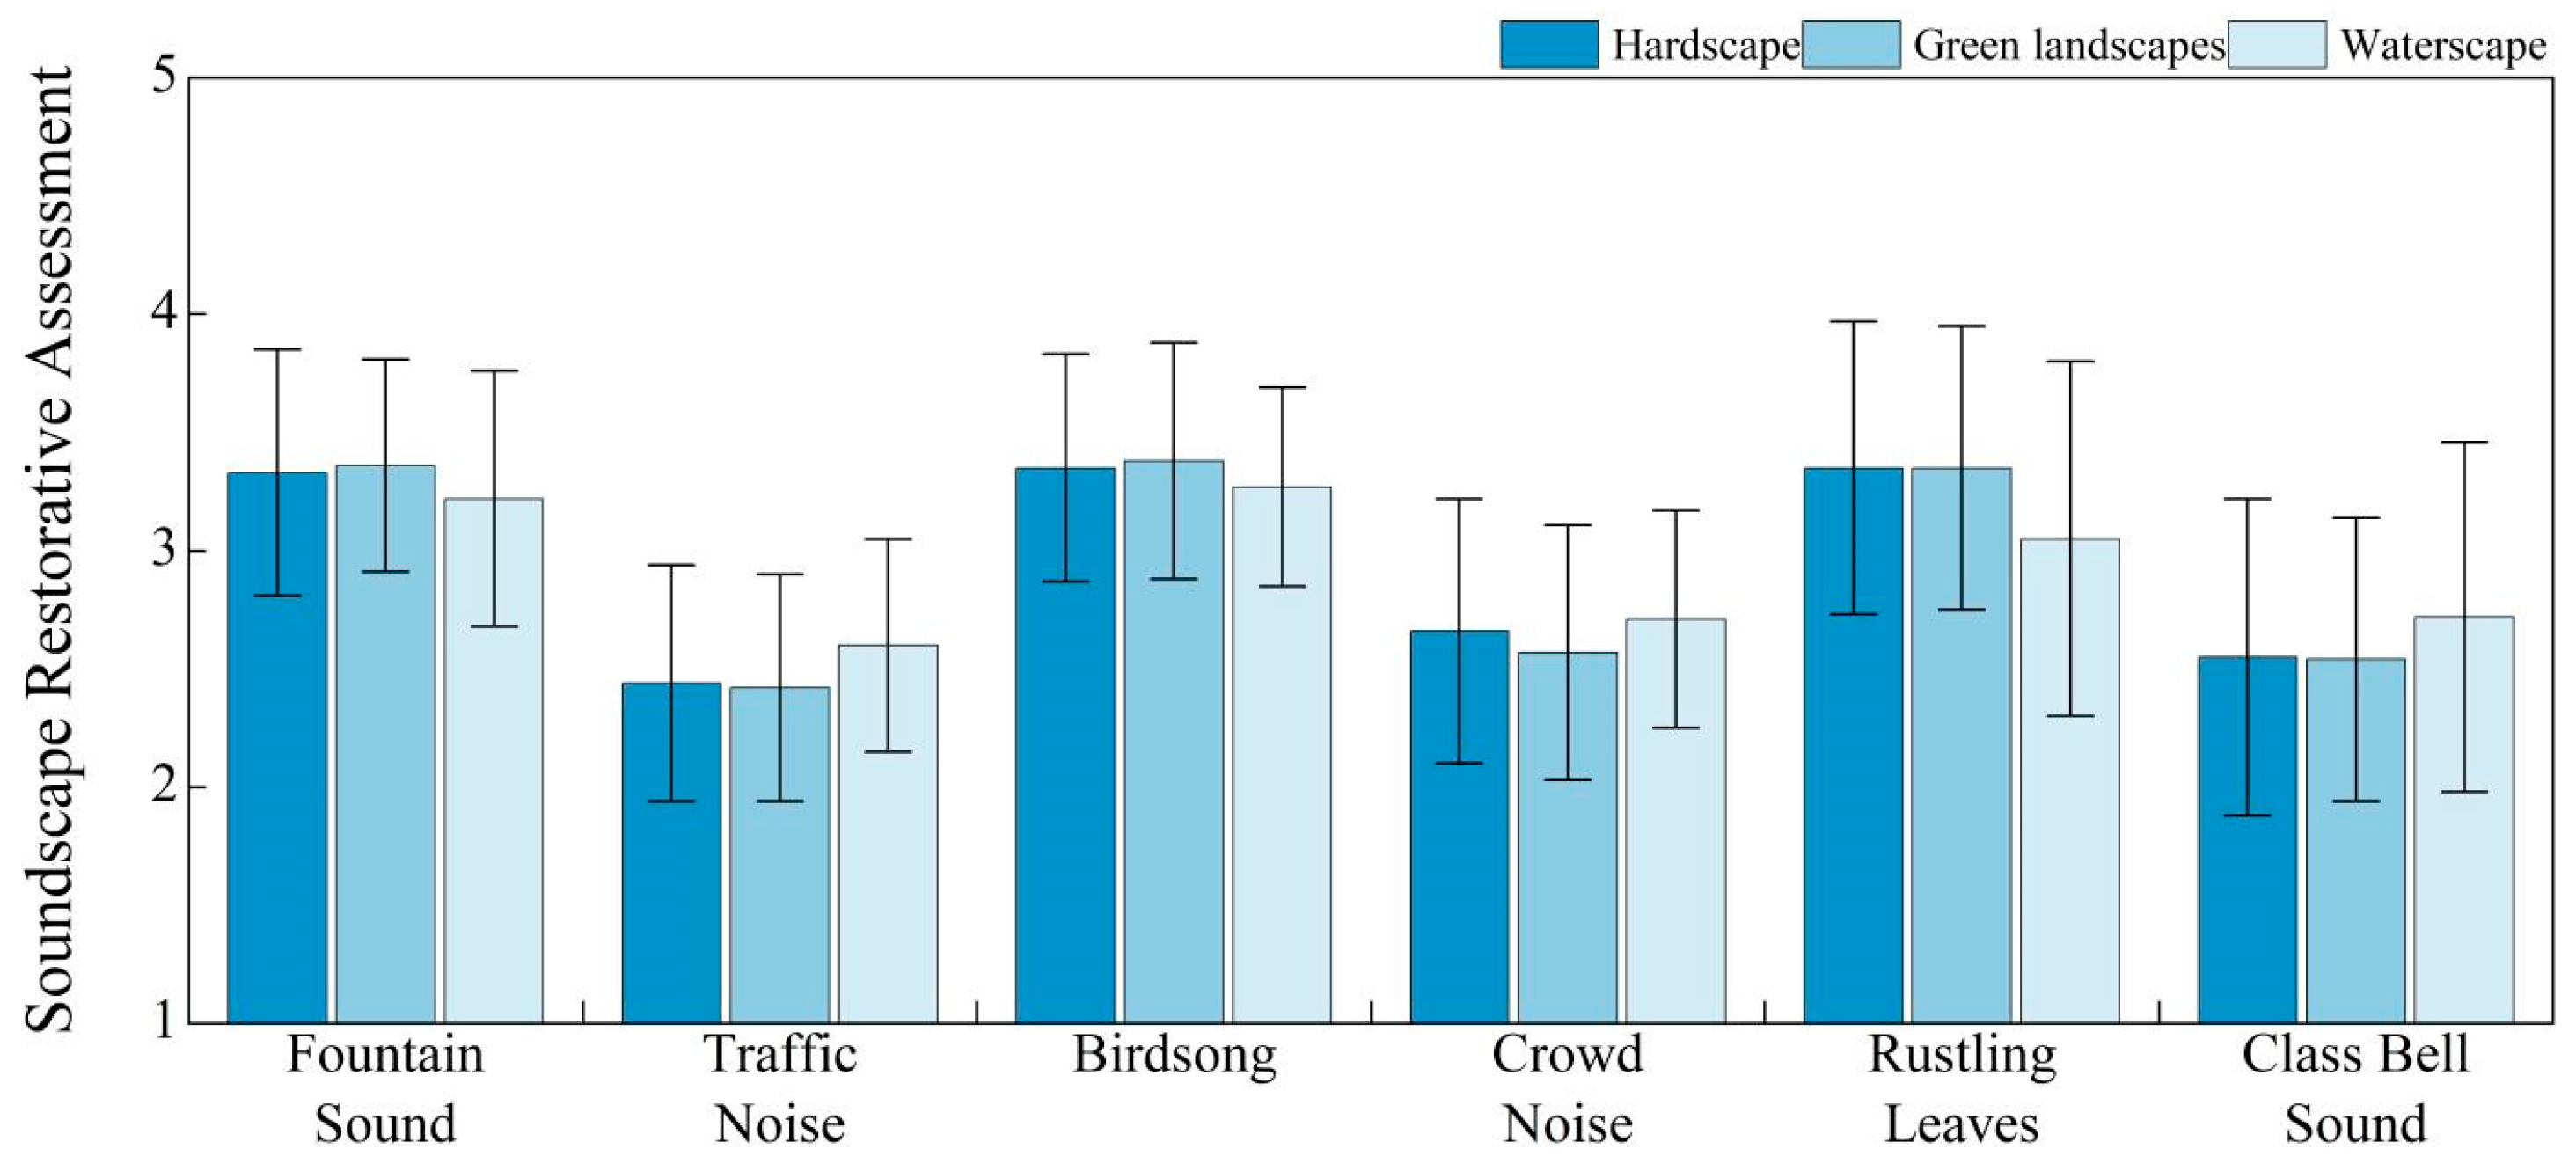
First, the effect of spatial boundaries on overall soundscape restorativeness was evaluated (see
Figure 12). The results showed that restorative ratings for natural sounds—such as Fountain Sound, Birdsong, and Rustling Leaves—were significantly higher in green landscapes and waterscape settings than those in Hardscape environments. Specifically, Fountain Sound achieved the highest soundscape restorativeness score in waterscape settings (3.41), Birdsong scored the highest in green landscapes (3.37), and Rustling Leaves also attained higher soundscape restorativeness in green landscapes and waterscapes than in Hardscape settings. These findings suggest that natural visual elements enhance the restorative potential of the soundscape associated with natural sounds. In contrast, artificial sounds—such as Traffic Noise, Class Bell Sound, and Crowd Noise—scored below 3.00 in all environments but achieved slightly higher soundscape restorativeness in Hardscape settings than in green landscapes or waterscape settings.
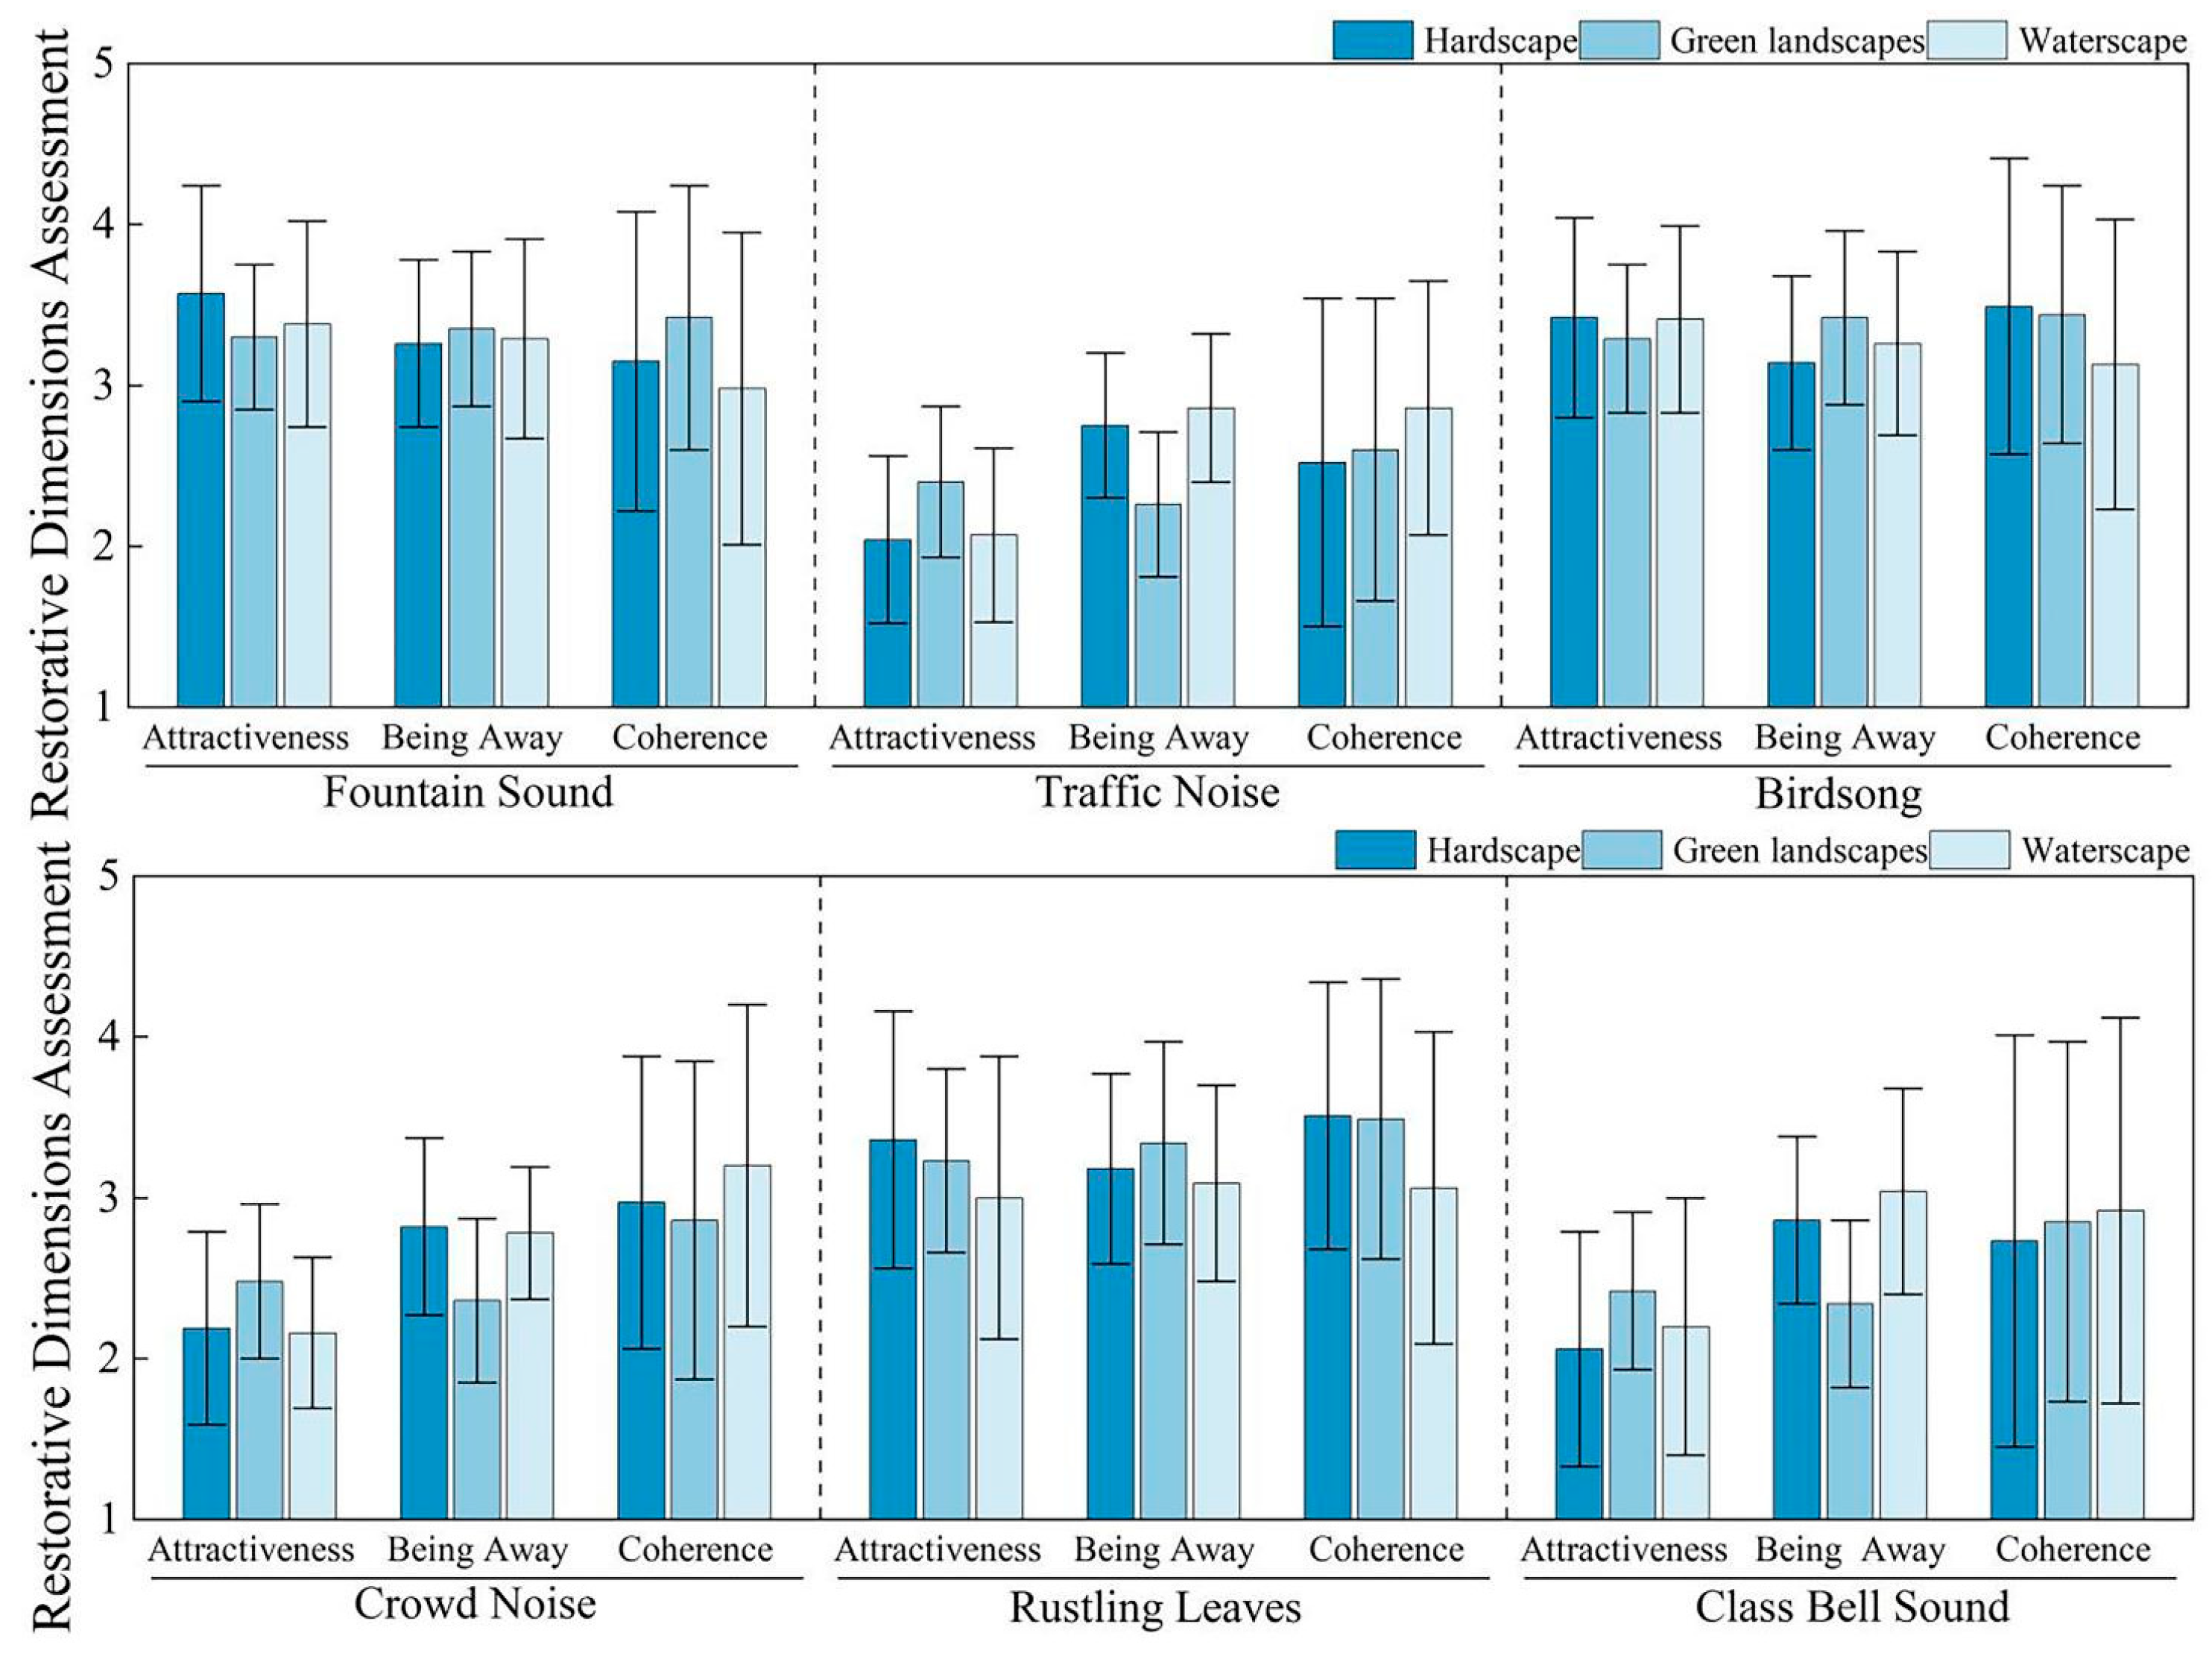
A further analysis of the influence of spatial boundaries on the three restorative dimensions of soundscapes (see
Figure 13) revealed that Fountain Sound recorded the highest Attractiveness in green landscapes (3.57), whereas Being Away and Coherence reached their peak values in waterscape settings (3.35 and 3.42, respectively). This indicates a strong synergistic effect between waterscape environments and Fountain Sound in promoting the restorative effects of the soundscape. Birdsong exhibited high Coherence in both green landscapes (3.49) and waterscapes (3.44), with the highest Attractiveness occurring in green landscapes (3.42). Rustling Leaves achieved its highest Coherence in green landscapes (3.51), reflecting its strong audiovisual coherence with natural visual contexts. By contrast, artificial sounds generally scored lower across all dimensions of soundscape restorativeness. For instance, Traffic Noise, Class Bell Sound, and Crowd Noise obtained their highest Attractiveness scores in waterscape settings (2.40, 2.48, and 2.42, respectively), but their Being Away and Coherence ratings were higher in Hardscape environments—suggesting that visually congruent settings may partially mitigate negative perceptions and improve the restorative effects of the soundscape of artificial sounds.
Overall, natural visual environments—such as green landscapes and waterscapes—not only enhance the restorative potential of natural sounds across all dimensions but may also improve the perceived Attractiveness of artificial sounds to some extent. While Hardscape environments tend to reduce the restorative effects of the soundscape of natural sounds, they may enhance the restorative ratings of artificial sounds through stronger audiovisual congruence. These results underscore the pivotal role of audiovisual synergy in shaping soundscape restorativeness in campus environments.
3.5. Effects of Sound Source Types
To further examine the effects of different sound source types on soundscape restorativeness in academic districts, both psychological and physiological experiments were conducted.
3.5.1. Psychological Experiment
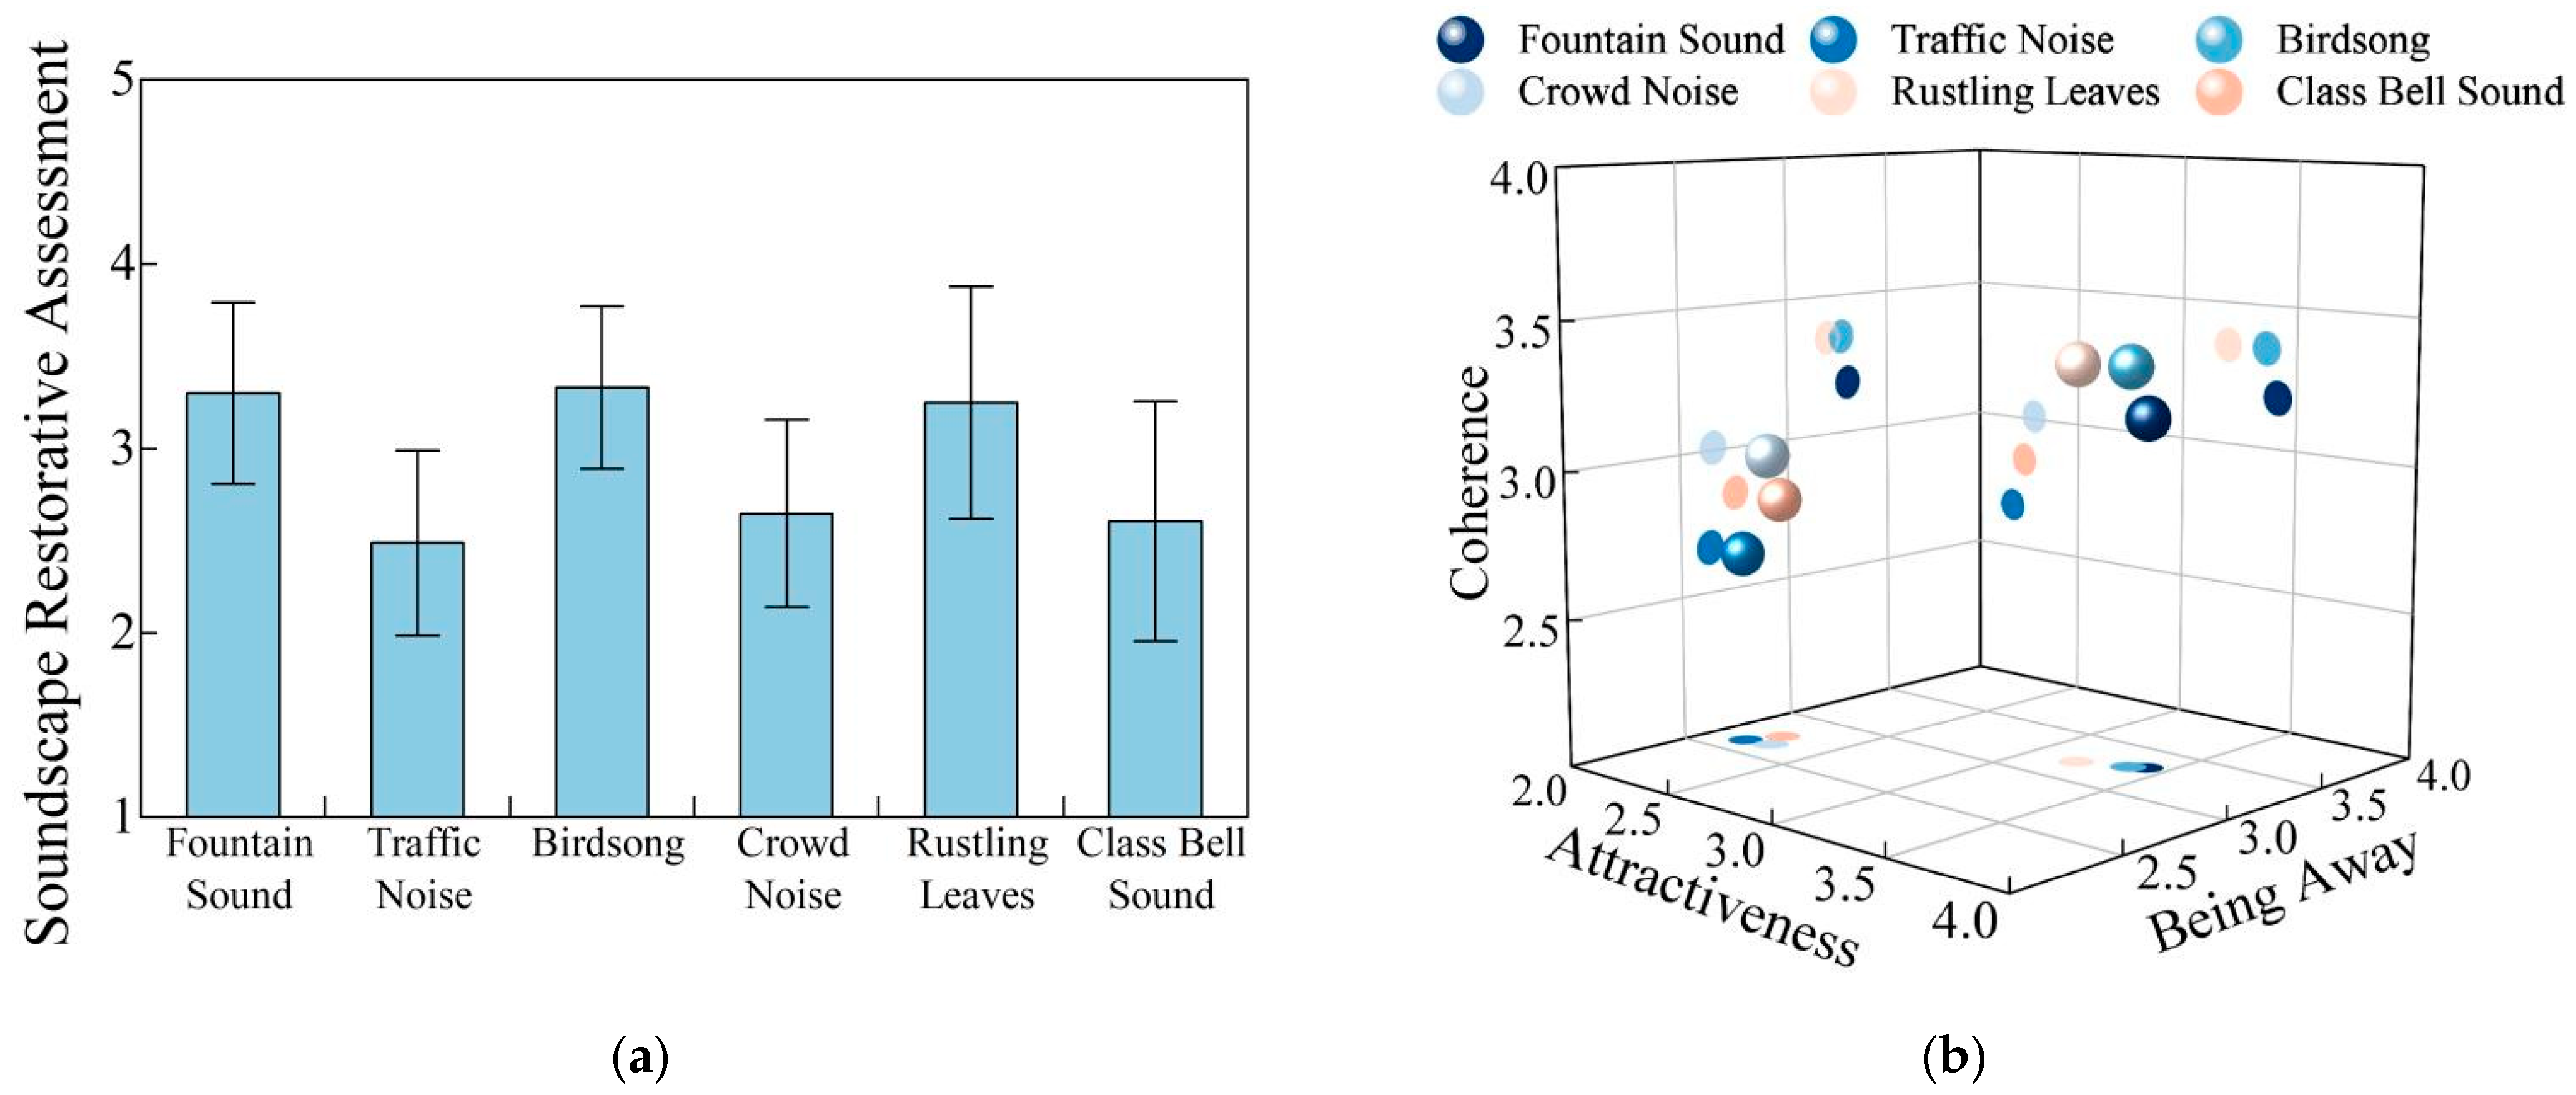
The results in
Figure 14a represent the average scores across the 19 items listed in
Table 3. An overall analysis of the restorative ratings for different sound sources across all spatial interfaces revealed that Birdsong, Fountain Sound, and Rustling Leaves exhibited the strongest restorative effects of the soundscape. Birdsong achieved the highest overall restorative score (3.36), followed by Fountain Sound (3.34) and Rustling Leaves (3.25). In contrast, Traffic Noise, Crowd Noise, and Class Bell Sound all scored below 3.00, thus indicating a negative restorative effect, with Traffic Noise recording the lowest score (2.49).
Across the three perceptual restoration dimensions (see
Figure 14b), Fountain Sound obtained the highest ratings in Attractiveness (3.42) and Being Away (3.30). Birdsong and Rustling Leaves achieved the highest Coherence scores (both 3.54).
By contrast, Traffic Noise consistently produced the lowest ratings across all dimensions, thus confirming its detrimental impact on the perception of soundscape restorativeness in the academic district.
3.5.2. Physiological Experiment
The restorative effects of the soundscape produced by the six sound sources were further assessed using a waterscape interface as the experimental setting. Four physiological indicators were measured, electrodermal activity (EDA), respiratory rate (RR), heart rate (HR), and heart rate variability (HRV), all of which reflect stress responses.
Restoration rates were calculated as the percentage change between the stress-state value and the post-sound exposure value, relative to the stress-state baseline.
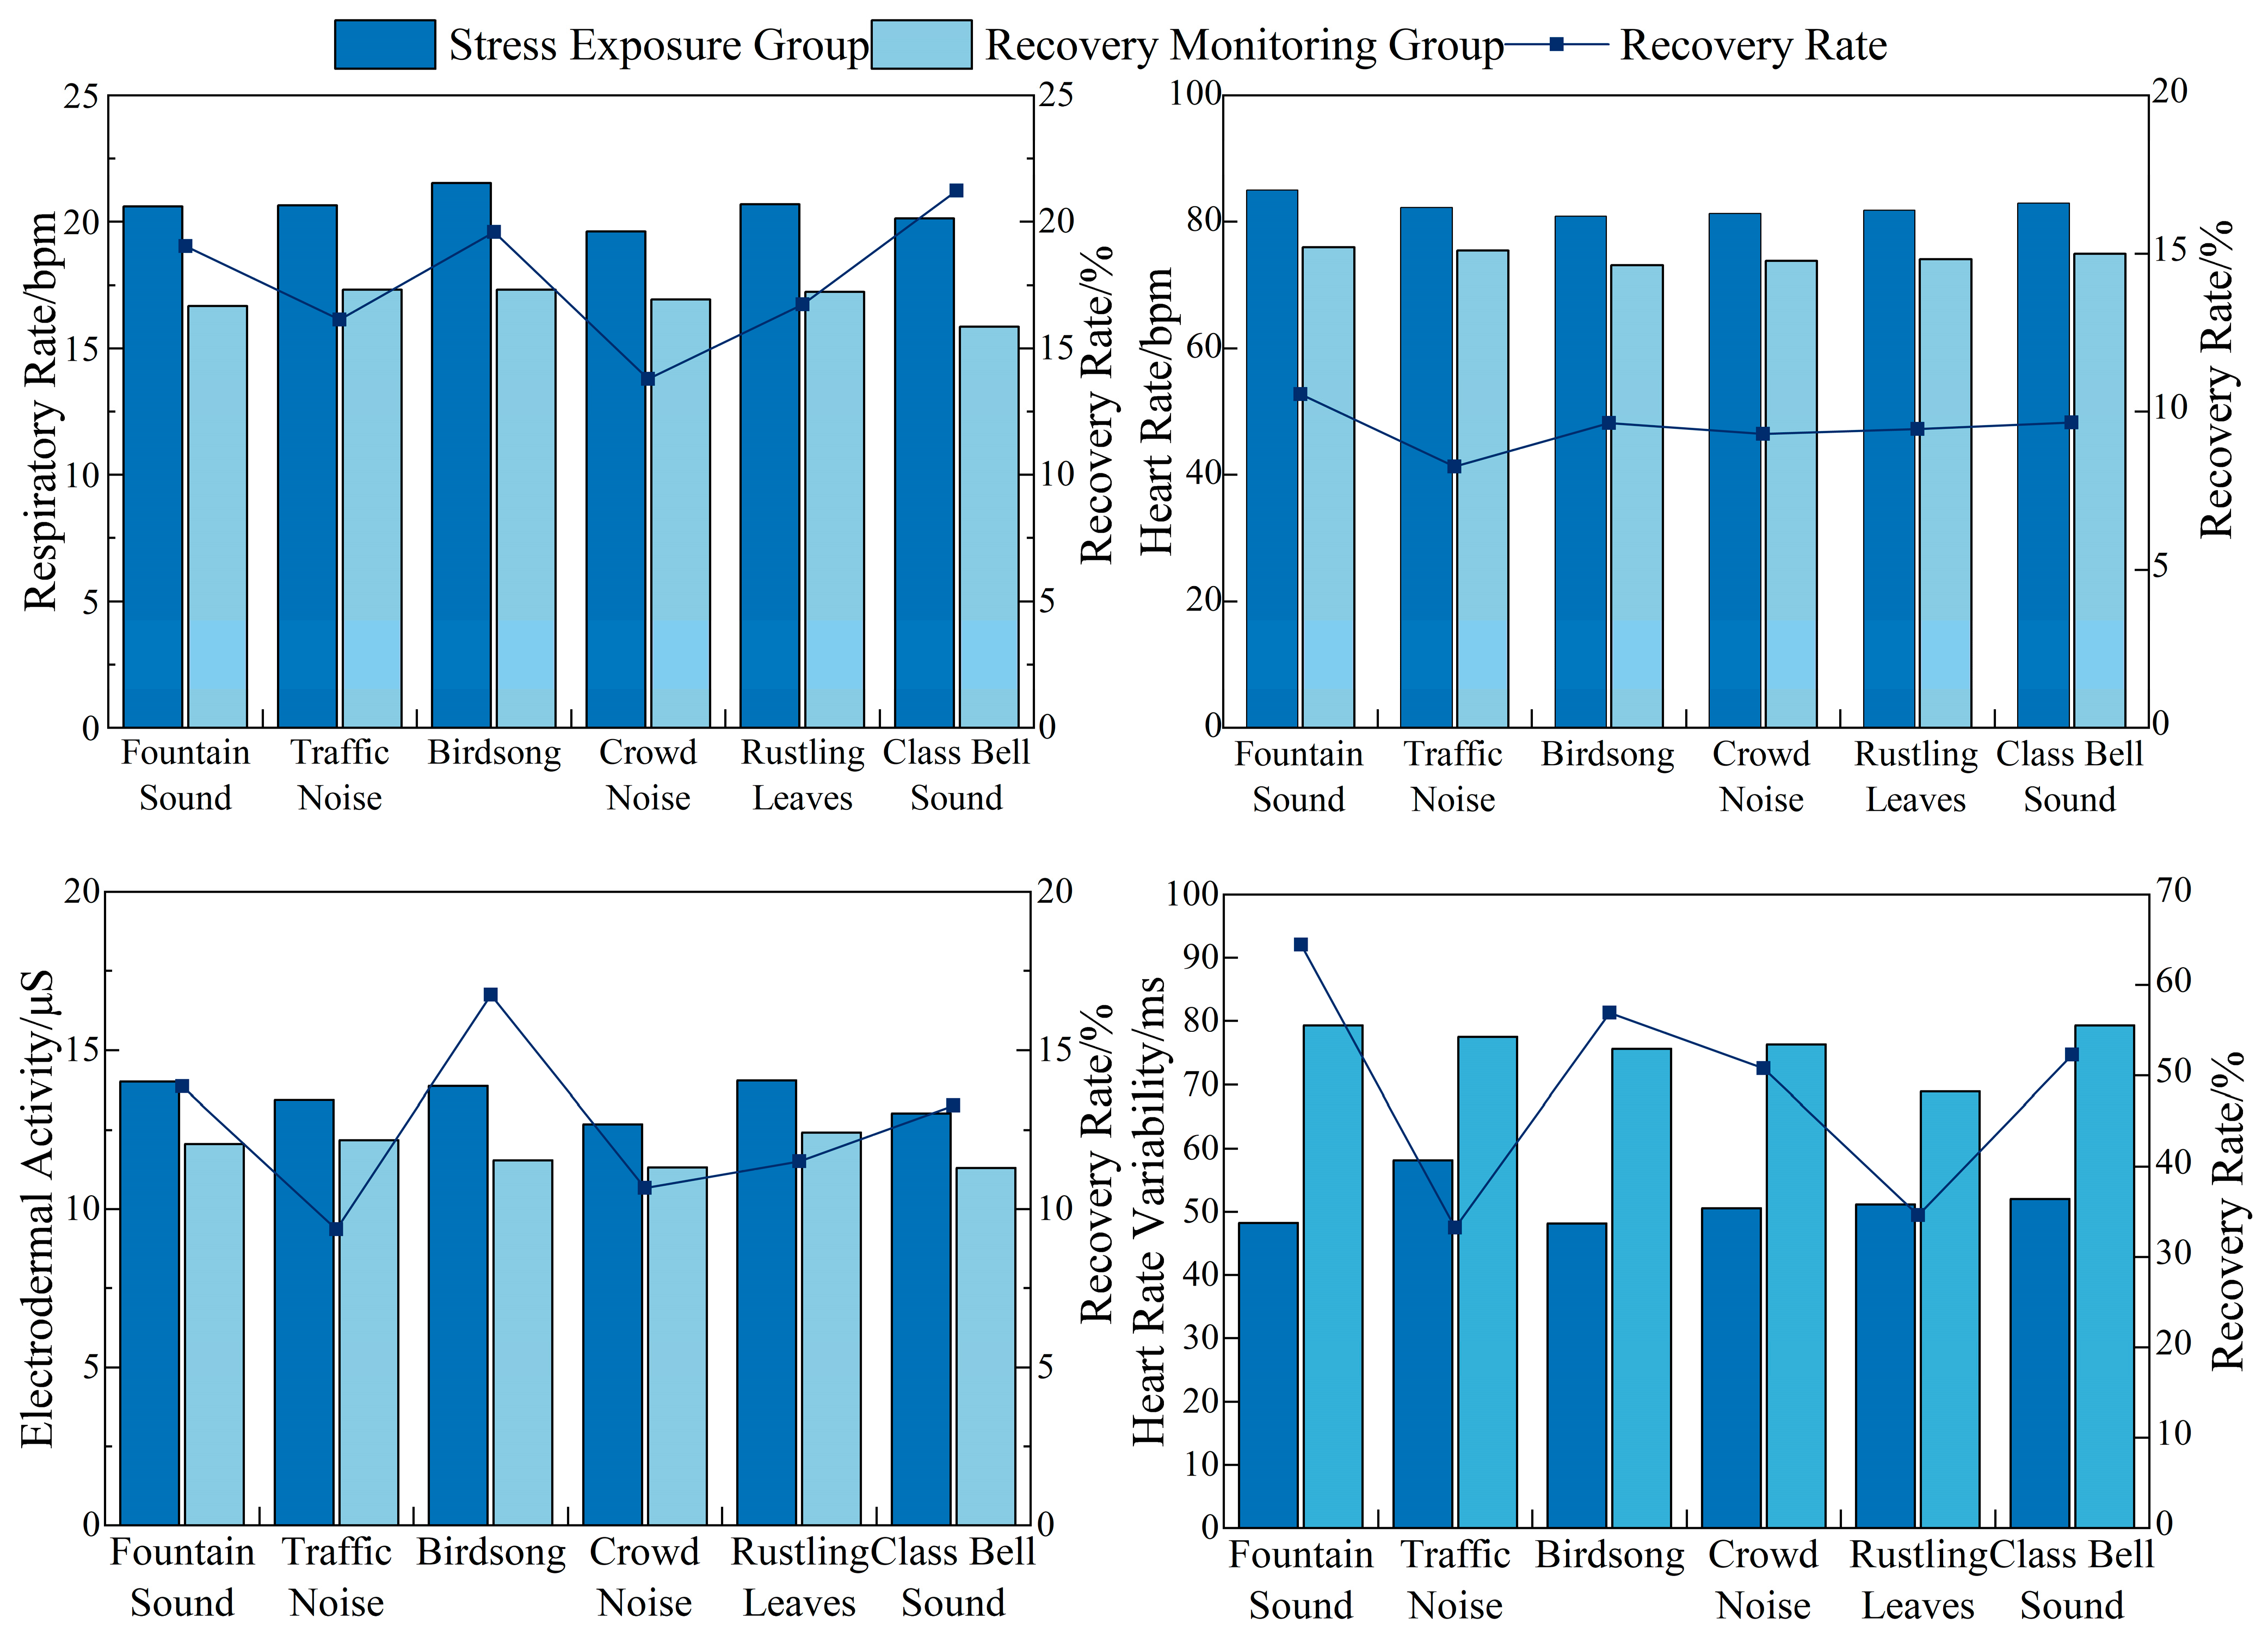
Prior to analysis, individual differences in stress-state physiological baselines were examined and found to be non-significant, allowing for valid cross-participant comparisons. Kruskal–Wallis tests were then conducted to determine differences between the stress and restoration conditions (see
Table 10 and
Figure 15). In addition to test statistics and
p-values, approximate effect sizes (η
2) were calculated from the Kruskal–Wallis results, thus indicating that several sound sources exerted medium-to-large effects on physiological restoration.
Respiratory Rate (RR): The RR is a widely recognized physiological marker of stress, with lower rates indicating greater relaxation [
53]. Significant differences in the RR were observed for all six sound sources (see
Table 10), with Class Bell Sound producing the largest effect (H = 9.947,
p < 0.01). The class bell sound effectively helps students relax and reduces their breathing rate. Restoration rates ranked as follows: Class Bell Sound (21.23%) > Birdsong (19.61%) > Fountain Sound (19.04%) > Rustling Leaves (16.73%) > Traffic Noise (16.14%) > Crowd Noise (13.80%).
Heart Rate (HR): HR typically decreases as stress is alleviated [
53]. All sound sources except Traffic Noise showed significant HR differences between stress and restoration states (see
Table 10), with Fountain Sound producing the largest effect (H = 5.88,
p < 0.05). Restoration rates ranked as follows: Fountain Sound (10.54%) > Class Bell Sound (9.65%) > Birdsong (9.64%) > Rustling Leaves (9.45%) > Crowd Noise (9.29%) > Traffic Noise (8.27%).
Electrodermal Activity (EDA): Lower EDA values indicate greater relaxation [
54]. Significant reductions in EDA were found for Fountain Sound, Birdsong, and Class Bell Sound (see
Table 10), with Birdsong showing the largest effect (H = 5.686,
p < 0.05). Restoration rates ranked as follows: Birdsong (16.74%) > Fountain Sound (13.86%) > Class Bell Sound (13.26%) > Rustling Leaves (11.52%) > Crowd Noise (10.67%) > Traffic Noise (9.36%).
Heart Rate Variability (HRV): HRV tends to increase in relaxed states due to greater parasympathetic activity [
55]. Only Fountain Sound showed significant HRV differences (H = 3.883,
p < 0.05) (see
Table 10). Restoration rates ranked as follows: Fountain Sound (64.43%) > Birdsong (56.94%) > Class Bell Sound (52.26%) > Crowd Noise (50.78%) > Rustling Leaves (34.66%) > Traffic Noise (33.23%).
3.6. Influence of Signal-to-Noise Ratio
In real-world environments, background noise such as traffic noise can mask other sound sources, thereby influencing the restorative potential of the soundscape. To investigate how the SNR affects soundscape restorativeness, an SNR experiment was conducted. The SNR is defined as the difference in the LAeq between the target signal and the background noise, which reflects the perceptual prominence of the signal within a noisy environment.
Birdsong, which demonstrated the relatively high restorative potential of the soundscape in previous experiments, was selected as the target signal. Three LAeq levels of Traffic Noise—40 dB(A), 50 dB(A), and 60 dB(A)—were employed as background noise. Experimental samples were constructed by combining Birdsong and Traffic Noise at SNRs of −10 dB, −5 dB, 0 dB, 5 dB, and 10 dB. Evaluations of soundscape restorativeness were then conducted under these conditions. The Kaiser–Meyer–Olkin (KMO) test indicated that the dataset was suitable for further analysis (KMO = 0.863; χ
2 = 1806.374;
p = 0.000). The results of the Kruskal–Wallis test for soundscape restorativeness and its dimensions across different signal-to-noise ratios in the teaching area are shown in
Table 11. The results indicate that in teaching areas with traffic noise at 40 dB(A), 50 dB(A), and 60 dB(A) as background noise, significant differences exist in soundscape restorativeness, Attractiveness, and Coherence across all signal-to-noise ratios. Multiple comparisons were further conducted on the significantly differing soundscape restorativeness and restorative dimensions, with the results presented in
Table 12.
To assess the relationship between the SNR and soundscape restorativeness, Pearson’s correlation analysis was performed for each Traffic Noise LAeq condition (see
Table 13). The results indicated a significant positive correlation between the SNR and ratings of soundscape restorativeness, with the strongest correlation observed under the 40 dB(A) background noise condition (r = 0.945,
p < 0.01). Correlation coefficients decreased as the background noise LAeq increased, thus suggesting that the SNR exerts a stronger influence on soundscape restorativeness under lower background noise levels.
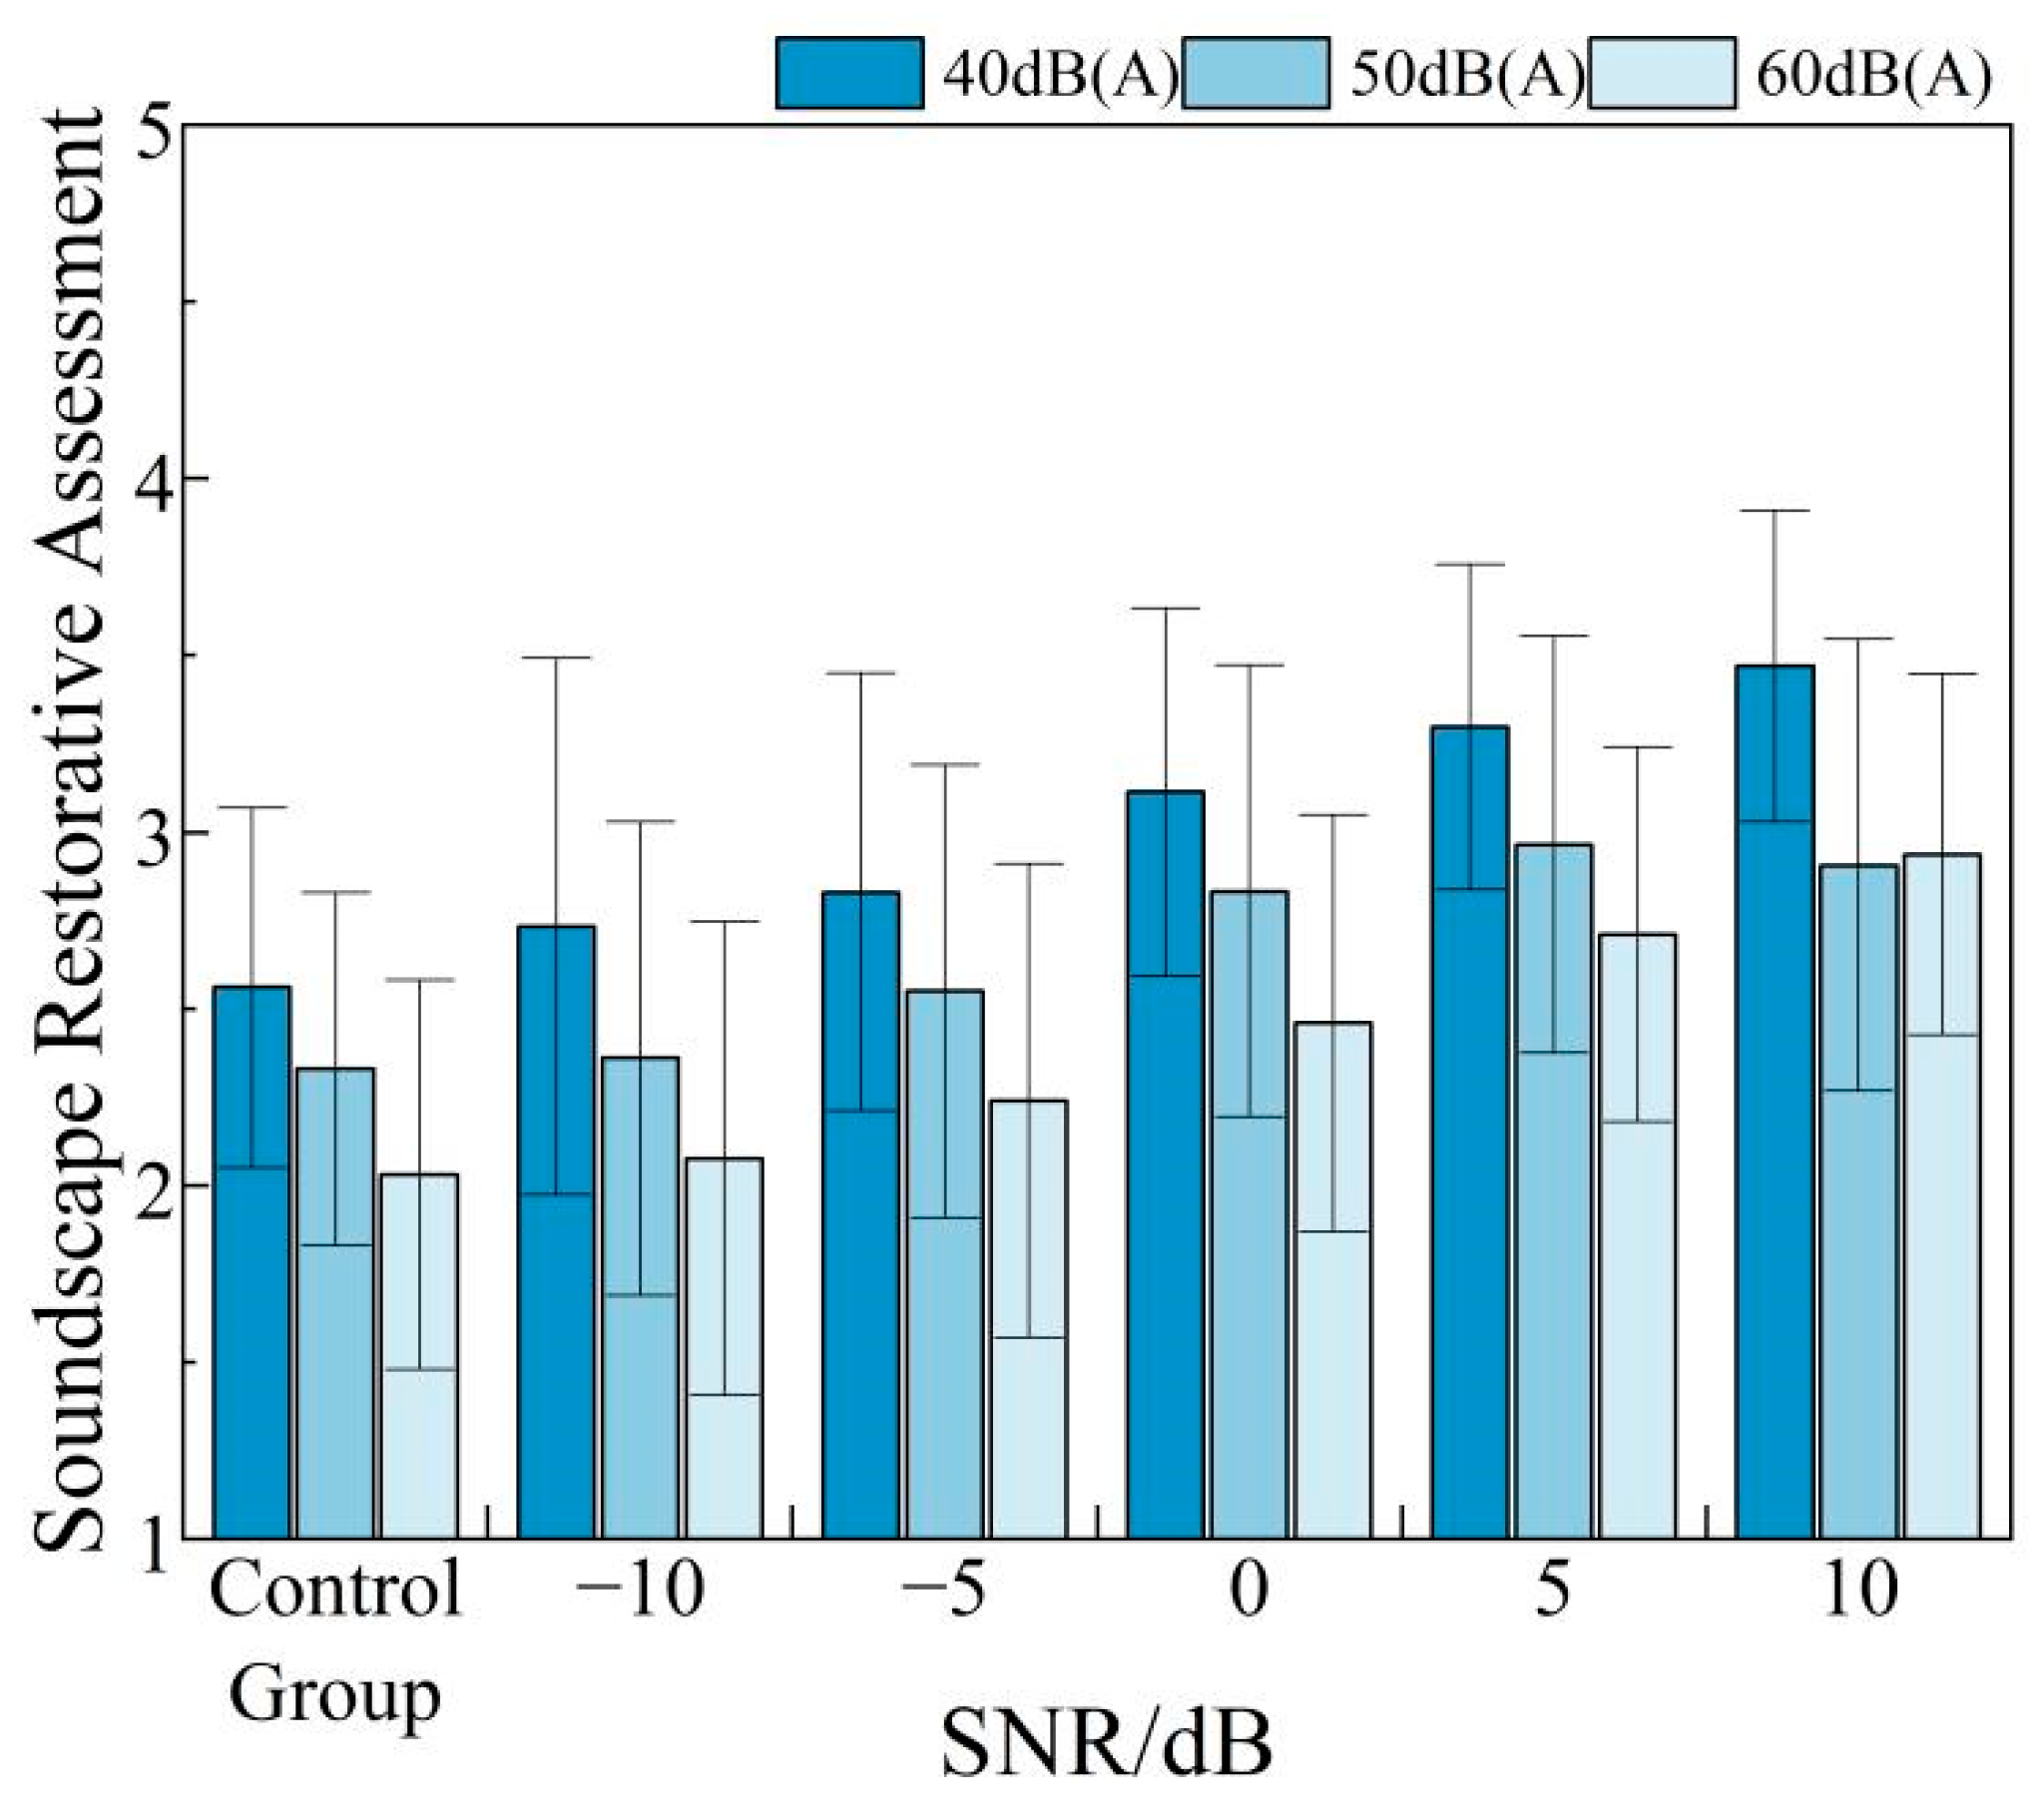
As shown in
Figure 16, across all three Traffic Noise levels, the addition of Birdsong significantly enhanced restorative ratings, with a general trend of a higher SNR corresponding to stronger restorative effects of the soundscape. Under the 40 dB(A) Traffic Noise condition, an SNR of 10 dB yielded the highest overall soundscape restorativeness score (3.47). Furthermore, at a constant SNR, a higher background Traffic Noise LAeq was associated with lower ratings of soundscape restorativeness.
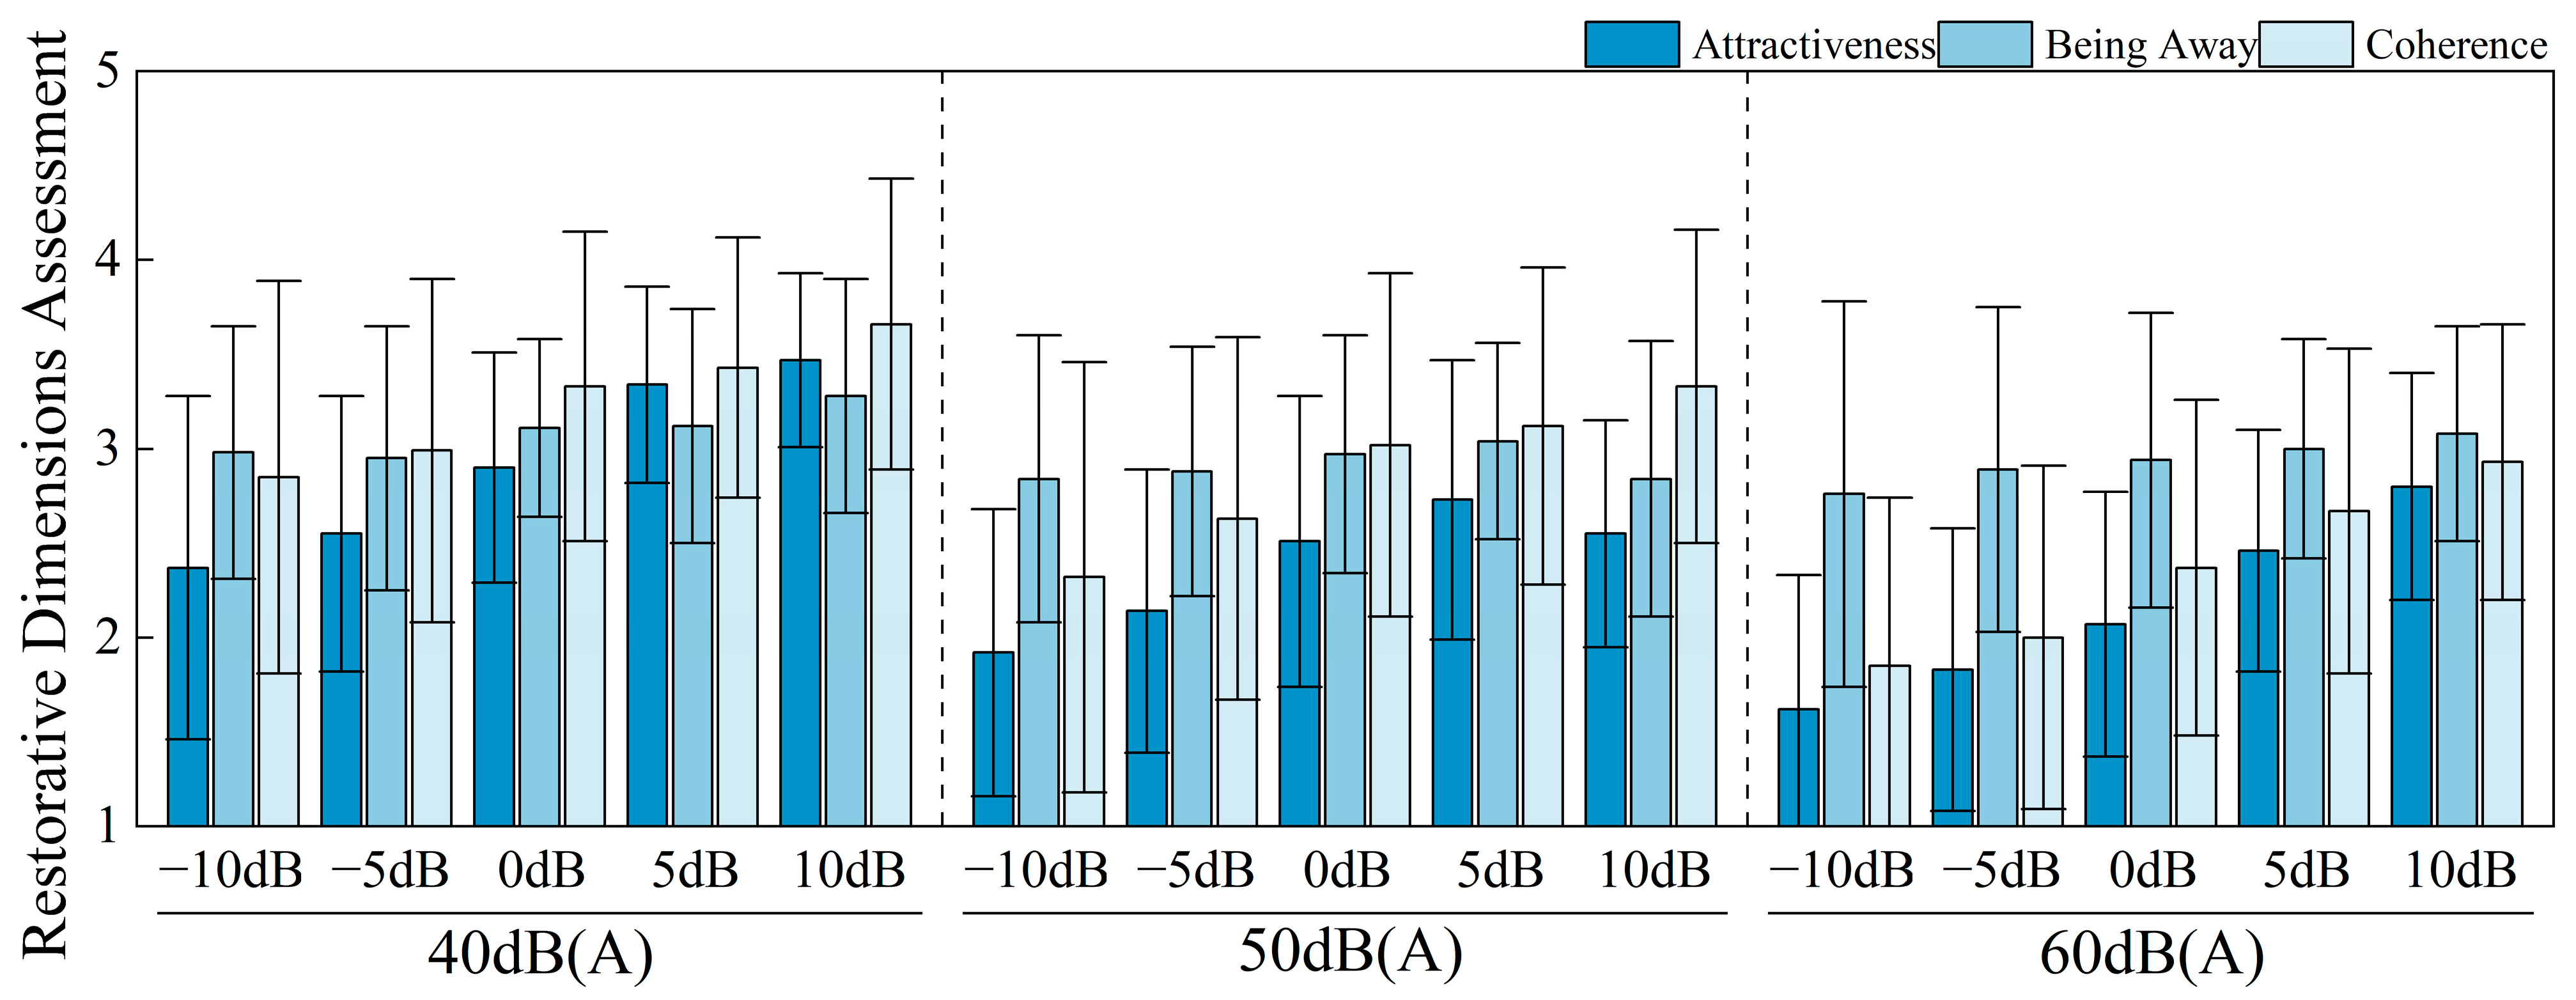
A further analysis of the three perceptual dimensions—Attractiveness, Being Away, and Compatibility—under different Traffic Noise LAeq conditions (see
Figure 17) revealed that an increasing SNR consistently produced positive effects across all dimensions. The only exception occurred under the 50 dB(A) Traffic Noise condition, where the highest Attractiveness (2.73) and Being Away (3.04) scores were recorded at an SNR of 5 dB. However, these values were only slightly higher than those observed at 10 dB SNR (2.55 and 2.84, respectively). Under all other conditions, the maximum scores for each dimension were observed at the 10 dB SNR, indicating that, within the tested range, a higher SNR generally results in greater soundscape restorativeness across all perceptual dimensions.
4. Discussion
4.1. The Influence of the Visual Environment
Focusing on the teaching zones of university campuses as a distinct functional context, this study demonstrates that visual environmental characteristics exert a significant influence on soundscape restorativeness, thereby reinforcing the critical role of the “audiovisual interaction” mechanism in shaping soundscape restorativeness. Consistent with previous findings in public spaces such as parks and squares, natural visual elements enhance both the perception and the restorative effects of natural sounds. Specifically, natural sounds such as Fountain Sound, Birdsong, and Rustling Leaves received higher ratings of soundscape restorativeness in green landscapes and waterscape settings compared with Hardscape environments. This aligns with the findings of Shao et al. [
33] and Xu et al. [
34], who emphasized the importance of natural visual elements in enhancing the restorative potential of the soundscape associated with natural sound sources.
Further analysis revealed that when the semantic characteristics of natural visual landscapes align with those of the sound source, soundscape restorativeness is amplified. For example, Fountain Sound achieved higher ratings of soundscape restorativeness in waterscape settings, whereas Birdsong and Rustling Leaves were rated more restorative in green landscapes. Recent studies by Lam et al. [
35] and Yang et al. [
36] have shown that when anthropogenic sound sources exhibit high congruence with visual environmental features, their negative effects can be partially mitigated, thereby improving subjective acceptability. The present experimental results support this conclusion: anthropogenic sounds such as Traffic Noise, Crowd Noise, and Class Bell Sound received higher ratings of soundscape restorativeness in Hardscape settings than in natural visual contexts. Recent VR-based experiments also confirm that audiovisual congruence strongly modulates both perceived restorativeness and physiological responses, thus reinforcing the multisensory basis of restoration [
37].
Taken together, the patterns observed for both natural and anthropogenic sounds across different spatial interfaces support the view that soundscape restorativeness is determined not only by the attributes of the sound source but also by the moderating role of the visual environment, underscoring the notion that restoration is a multisensory, integrated experience. This finding is consistent with the empirical results of Guo et al. [
38] in urban parks, in which soundscape pleasantness was strongly dependent on audiovisual coherence. Moreover, previous research has demonstrated that natural visual elements (e.g., vegetation and water bodies) can enhance the overall perceived environmental quality and buffer the effects of background noise through a “compensatory effect” [
39,
40,
41,
42]. Therefore, optimizing the visual interfaces of teaching areas can strengthen the restorative effects of the soundscape of natural sound sources and serve as a key moderator of soundscape restorativeness.
4.2. Influence of Sound Source Types
The findings indicate that different sound source types exert significantly different effects on soundscape restorativeness in university teaching zones, with psychological and physiological measurements showing highly consistent patterns. Natural sounds—such as Birdsong, Fountain Sound, and Rustling Leaves—significantly outperformed anthropogenic sounds across the dimensions of Attractiveness, Being Away, and Coherence, thus resulting in higher overall restorative ratings. Physiologically, natural sounds significantly improved key indicators, including respiratory rate, electrodermal activity, heart rate, and heart rate variability, thereby demonstrating effective stress reduction. Unlike previous studies that primarily examined urban green spaces and public parks, this research is the first to focus specifically on the highly functionalized teaching zones of university campuses, linking sound source types to both subjective perceptions and physiological responses in students and thereby revealing the unique role of natural sounds in supporting cognitive restoration and emotional regulation.
In addition to confirming the widely acknowledged restorative benefits of natural sounds [
43,
44], this study further clarifies the differences in how various sound types influence distinct dimensions of soundscape restorativeness. Notably, anthropogenic sounds such as Traffic Noise, Crowd Noise, and Class Bell Sound all received ratings of soundscape restorativeness below 3.00, indicating their potential to hinder psychological recovery. This is consistent with Fei et al. [
45], who found similar negative impacts in urban green spaces. Notably, Class Bell Sound may evoke negative associations and cause emotional disturbance among students. It is noteworthy that although psychological ratings indicated that Class Bell Sound had relatively low restorative potential compared with natural sounds, physiological indicators (e.g., RR and HR) showed comparatively high recovery rates. This discrepancy may reflect conditioned responses or short-term physiological adaptation, thus suggesting that subjective evaluations and physiological outcomes do not always align. Further investigation is needed to clarify the mechanisms underlying this divergence. The results of this study extend these findings by considering the high cognitive load and sustained learning pressures present in teaching zones, suggesting that the disruptive effects of anthropogenic sounds may be amplified in this specific context and thereby exert a greater influence on psychological states and emotional regulation. This underscores the interaction between sound source type and environmental function, highlighting the necessity of the targeted management of functional anthropogenic sounds in optimizing campus soundscapes.
Recent research increasingly emphasizes the pivotal role of sound source characteristics in assessments of soundscape restorativeness. For instance, in large-scale greenway experiments, Zhang et al. [
46] demonstrated that sound source type not only influences subjective comfort but also mediates multisensory synergies. This suggests that sound sources do not act in isolation but interact with visual, cognitive, and emotional processes to collectively shape soundscape restorativeness.
4.3. Influence of Signal-to-Noise Ratio (SNR)
This study further examined the effect of the SNR on soundscape restorativeness in teaching zones. Compared with scenarios containing Traffic Noise alone, the addition of Birdsong significantly enhanced perceived soundscape restorativeness. This finding aligns with De Coensel et al. [
47], who reported that introducing natural sounds such as Fountain Sound or Birdsong into Traffic Noise-dominated urban environments can substantially reduce the perceived intensity of Traffic Noise and improve the overall soundscape experience.
The analysis revealed a significant positive correlation between the SNR and soundscape restorativeness, indicating that higher signal source salience leads to stronger restorative experiences. This trend has been consistently observed in related studies. For example, using virtual reality experiments in urban green spaces, Jiang et al. [
48] identified sound source recognizability as a key factor in enhancing subjective restoration, particularly in multisensory immersive environments. Similarly, in research with children, Shu et al. [
49] found that higher SNRs for natural sounds in noisy contexts more effectively directed attention and elicited restorative emotional responses. In field studies near arterial roads, Han et al. [
50] also reported that increasing the relative LAeq level of restorative sounds significantly improved perceived comfort and restoration.
In the present study, multidimensional analyses of restorative experiences further confirmed that increasing the SNR can help relieve stress and foster a more relaxing learning environment. Moreover, the correlation between the SNR and soundscape restorativeness was stronger under lower background noise levels. Although the correlation remained significant at higher noise levels, the coefficient declined as the background noise LAeq increased. This suggests that excessive background noise can diminish the perceptual advantages and restorative effects of the soundscape of natural sounds, thereby undermining the overall soundscape experience.
Overall, the SNR not only influences the perceptibility of sound sources but also shapes soundscape restorativeness by modulating attention allocation and emotional states. This reinforces the understanding that soundscape restorativeness arises from the interaction of acoustic and environmental characteristics, thus requiring a holistic approach to environmental design to achieve optimal multisensory outcomes.
4.4. Influence of Teaching Zone Soundscape Restorativeness on University Students
University students in teaching zones are often exposed to high-pressure conditions. Focusing on this specific population and the distinct functional setting of the teaching zone, this study examined the influence of soundscape restorativeness on both the psychological and physiological states of students and further analyzed its implications for their mental health. On one hand, the restorative effects of the soundscape can alleviate mental fatigue during learning, thereby enhancing environmental satisfaction and study concentration. On the other hand, soundscape restorativeness was found to be significantly correlated with students’ physiological stress levels, thus indicating that a favorable acoustic environment can effectively reduce physiological load.
It is also noteworthy that the use of teaching zone spaces follows a highly regular pattern, with substantial differences in students’ activity characteristics across different times of day. During peak hours in the morning and evening, Traffic Noise exposure levels are relatively high, suggesting that campus soundscape optimization should account for temporal dynamics. In critical time periods, improving soundscape quality may be achieved by regulating background noise levels or introducing natural sounds to enhance soundscape restorativeness.
4.5. Limitations
This study focused on the soundscape restorativeness of university teaching zones. Future research could expand the scope to include other functional areas of the campus, enabling a more holistic understanding of campus-wide soundscape restorativeness. Additionally, as all participants were university students, future studies could examine cross-cultural differences in sound perception to further improve the generalizability of the findings.
5. Conclusions
Drawing on real-world scenarios in university teaching zones, this study constructed spatial models and integrated psychological and physiological experimental methods to systematically examine the effects of the visual environment, sound source types, and signal-to-noise ratio (SNR) on soundscape restorativeness. The findings provide a theoretical foundation for the design and optimization of soundscapes in university teaching areas. The main conclusions are as follows:
1. Natural interfaces—such as green landscapes and waterscapes—enhance the restorative effects of the soundscape of natural sound sources, whereas the higher congruence between Hardscape interfaces and anthropogenic sounds can, to some extent, mitigate their negative impacts. Therefore, soundscape design should not only reinforce natural visual elements but also ensure audiovisual coherence between visual and auditory components.
2. Sound source type exerts a significant influence on soundscape restorativeness. Both the psychological and physiological results consistently showed that natural sounds (e.g., Birdsong, Fountain Sound, and Rustling Leaves) are markedly more restorative than anthropogenic sounds (e.g., Traffic Noise and Class Bell Sound) and that they produce substantial physiological benefits by effectively reducing stress.
3. The SNR is a key factor in modulating soundscape restorativeness. In Traffic Noise contexts, adding Birdsong and increasing the SNR substantially enhanced the restorative effects of the soundscape. Reducing background noise also significantly improved soundscape restorativeness, thus indicating that careful sound source combination and background noise control can maximize restorative outcomes.
4. This study provides a systematic theoretical basis for and a practical approach to the design and optimization of campus teaching zone soundscapes. From a visual design perspective, incorporating natural elements such as vegetation and water bodies while ensuring audiovisual coherence is essential. From an acoustic perspective, restorative natural sounds should be prioritized, with background noise managed and the SNR optimized to strengthen the perceptual advantages and restorative effects of the soundscape of positive sounds. Such strategies can create healthy, restorative teaching environments that are audiovisually coherent, perceptually pleasant, and psychologically beneficial, thereby enhancing students’ soundscape restorativeness and overall environmental satisfaction.






 : Building;
  : Outdoor Space


