Article

Macro–Micro Quantitative Model for Deformation Prediction of Artificial Structural Loess

1
Shaanxi Key Laboratory of Safety and Durability of Concrete Structures, Xijing University, Xi’an 710123, China
2
Key Laboratory of Geotechnical Mechanics and Engineering, Ministry of Water Resources, Yangtze River Scientific Research Institute, Wuhan 430010, China
3
Northwest Engineering Corporation Limited, Xi’an 710065, China
4
School of Water Resources and Hydropower, Xi’an University of Technology, Xi’an 710048, China
*
Authors to whom correspondence should be addressed.
Buildings 2025, 15(20), 3714; https://doi.org/10.3390/buildings15203714
Submission received: 10 September 2025 / Revised: 12 October 2025 / Accepted: 13 October 2025 / Published: 15 October 2025

Abstract

To overcome the limitations imposed by the anisotropy and heterogeneity of natural loess, this study establishes a novel quantitative macro–micro correlation framework for investigating the deformation mechanisms of artificial structural loess (ASL). ASL samples were prepared by mixing remolded loess with cement (0–4%) and NaCl (0–16%), followed by static compaction (95% degree) and 28-day curing (20 ± 2 °C, >90% RH) to replicate the structural properties of natural loess under controlled conditions. An integrated experimental methodology was employed, incorporating consolidation/collapsibility tests, particle size analysis, X-ray diffraction (XRD), and mercury intrusion porosimetry (MIP). A three-dimensional nonlinear model was proposed. The findings show that intergranular cementation, particle size distribution, and pore architecture are the main factors influencing loess’s compressibility and collapsibility. A critical transition from medium to low compressibility was observed at cement content ≥1% and moisture content ≤16%. A strong correlation (Pearson |r| > 0.96) was identified between the mesopore volume ratio and the collapsibility coefficient. The innovation of this study lies in the establishment of a three-dimensional nonlinear model that quantitatively correlates key microstructural parameters (fractal dimension value (D), clay mineral ratio (C), and large and medium porosity (n)) with macroscopic deformation indicators (porosity ratio (e) and collapsibility coefficient (δs)). The measured data and the model’s output agree quite well, with a determination coefficient (R2) of 0.893 for porosity and 0.746 for collapsibility, verifying the reliability of the model. This study provides a novel quantitative tool for loess deformation prediction, offering significant value for engineering settlement assessment in controlled cementation and moisture conditions, though its application to natural loess requires further validation.

1. Introduction

A Quaternary sediment that is extensively found in northwest, northern, and northeastern China [1,2,3,4,5,6], loess is distinguished by its collapsibility, high porosity, and metastable structure. These intrinsic properties make it highly susceptible to geological disasters such as ground subsidence, slope failure, and foundation collapse upon triggering by water immersion, seismic activity, or excessive loading, posing significant risks to infrastructure and human safety [7,8,9]. The mechanical behavior of loess is governed by a complex interplay of intrinsic factors (e.g., composition and structure) and external stimuli (e.g., stress and hydromechanical conditions), which are often coupled and interact in a nonlinear manner, thereby complicating the accurate prediction of its deformation [10].
To overcome the inherent anisotropy and heterogeneity of natural loess, the artificial preparation of structured soils has emerged as a powerful methodology. By incorporating cementitious agents (e.g., cement, salts, and calcium oxide) into remolded soil, researchers can reproducibly fabricate samples with controlled structural properties [9,11,12,13,14,15,16]. For instance, Sun et al. [17] produced homogeneous structured soil using kaolinite, cement, and salt particles. Zhang et al. [18] simulated collapsible loess behavior using industrial salt, CaO, and gypsum. The strength and microstructural development of artificial sandy soft soil under freeze–thaw cycles were recorded by Kong et al. [19], who also observed an increase in fractal dimension. Konstantinou et al. [20] employed MICP to fabricate artificially cemented soil, and Chen et al. [21] enhanced loess strength through CaO addition. These studies collectively underscore the efficacy of artificial preparation in replicating soil structural characteristics.
Beyond material composition, environmental factors—particularly water and temperature—play a decisive role in triggering loess deformation. According to recent studies by Liu et al. [22], rainfall infiltration significantly changes the soil–water characteristic curve and reduces shear strength because of increased saturation, which has an immediate effect on slope stability. Simultaneously, Bai et al. [23] revealed that freeze–thaw cycles induce complex thermo-hydro-mechanical coupling effects, leading to moisture redistribution, frost heave, thaw settlement, and even wetting collapse. These findings highlight that environmental interactions can profoundly destabilize loess structure, yet they primarily focus on natural loess under field conditions.
The compressibility of loess, reflecting its capacity to reduce pore volume under load, is similarly influenced by its composition, structure, and stress history [24,25,26,27]. Wu et al. [28] analyzed seismic-induced displacement responses in loess slopes. Yang et al. [29] reported increased compression deformation with rising moisture content, while Cai et al. [30] observed microstructural transformation from large to medium pores with increasing dry density. Furthermore, scholars have endeavored to bridge microstructural attributes with macroscopic mechanical properties. Xie et al. [31] proposed a constitutive model linking soil structure to strength. Li et al. [32] investigated the influence of particle size distribution and shape on loess mechanical properties through CT-based microstructure analysis and DEM simulations. Luo et al. [33] introduced a macro–micro scheme to study cohesive soils under wet–dry cycles, showing linear evolution of mechanical properties with microstructural state parameters.
In summary, while progress has been made in understanding macroscopic deformation and microstructural evolution of loess—including recent advances in environmental triggering mechanisms [22,23]—a systematic and quantitative integration of these aspects for artificial structured loess remains limited. Existing studies on natural loess often face challenges in controlling variables and isolating specific mechanisms due to field complexity. Moreover, for artificially prepared loess, research on the quantitative correlation between microstructure evolution and macroscopic compression/collapse deformation under controlled cementation and moisture conditions is still insufficient. There is a pronounced lack of predictive models that incorporate key microstructural parameters to reliably estimate deformation behavior.
In light of this, the contribution of this present study lies in establishing a quantitative macro–micro correlation framework for artificially structured loess under systematically controlled conditions. An integrated experimental methodology was employed, utilizing artificially structured loess samples sourced from Xi’an, China. A series of consolidation and collapsibility tests, combined with particle size analysis, X-ray diffraction (XRD), and mercury intrusion porosimetry (MIP), were conducted to quantitatively assess deformation behavior and structural evolution across varying moisture and cementation levels. In order to aid in the prediction of macroscopic deformation indicators, a three-dimensional nonlinear model was also created and verified. This model incorporates important microstructural factors such as the fraction of big and medium pores, clay mineral ratio, and particle size. This model offers a reliable analytical tool for evaluating engineering deformation in loess regions and provides new insights into the deformation mechanisms of artificially structured loess.

2. Materials and Methods

2.1. Test Materials

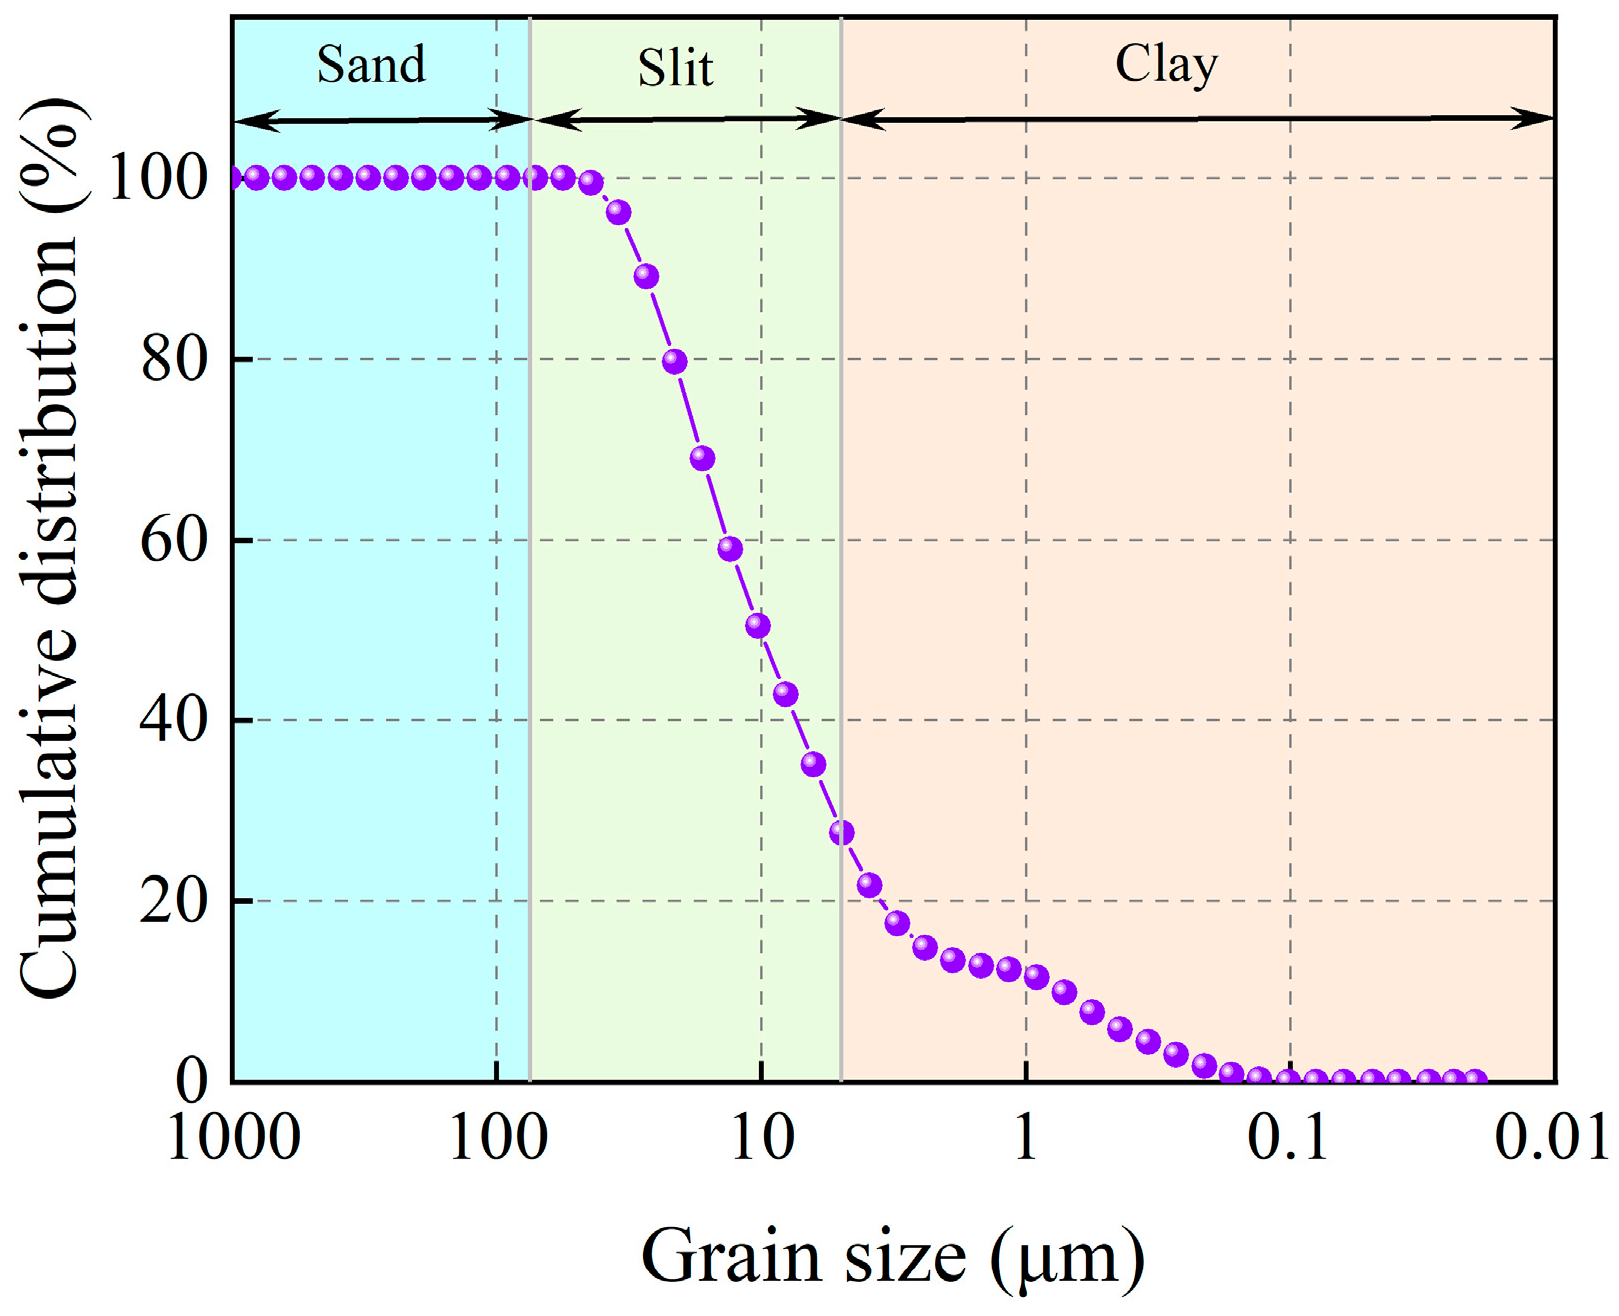
The loess sample, which had soil depths ranging from 2.0 to 3.0 m, was collected from Chang’an District in Xi’an City, Shaanxi Province. As seen in Figure 1, the soil had a homogeneous texture and a yellow-brown tint. Basic physical indicators of soil samples, primarily natural water content (w0), dry density (ρd), and Plasticity Limit (wp), were examined in compliance with the GB/T 50123-2019 standard for geotechnical testing techniques [34]. Table 1 displays the findings. Figure 2 displays the soil’s particle size distribution.
NaCl, the primary ingredient of the salt employed in the experiment, is readily soluble in glycerol or water and is made up of white cubic crystals or fine crystal powders. Controlling the porosity of structured soil is its primary purpose. The experiment made use of P.O 52.5 quick-setting cement, which has the advantages of high compressive strength, early setting time, and good plasticity.

2.2. Sample Preparation

The following standardized process was strictly followed to guarantee homogeneity and consistency in the preparation of the artificial structural loess samples. After being collected from Chang’an, Xi’an, the undisturbed natural loess was manually ground, allowed to air dry, and then sieved through a 0.5 mm screen to produce an evenly graded soil matrix. Different proportions of cement (P.O 52.5) and NaCl, as specified in Table 2, were then added to the soil and dry-mixed for 10 min to achieve initial homogeneity. Deionized water was introduced to attain the target moisture contents (ranging from 8% to 24%), followed by wet mixing at 200 rpm for 15 min to ensure uniform distribution of cementitious materials.
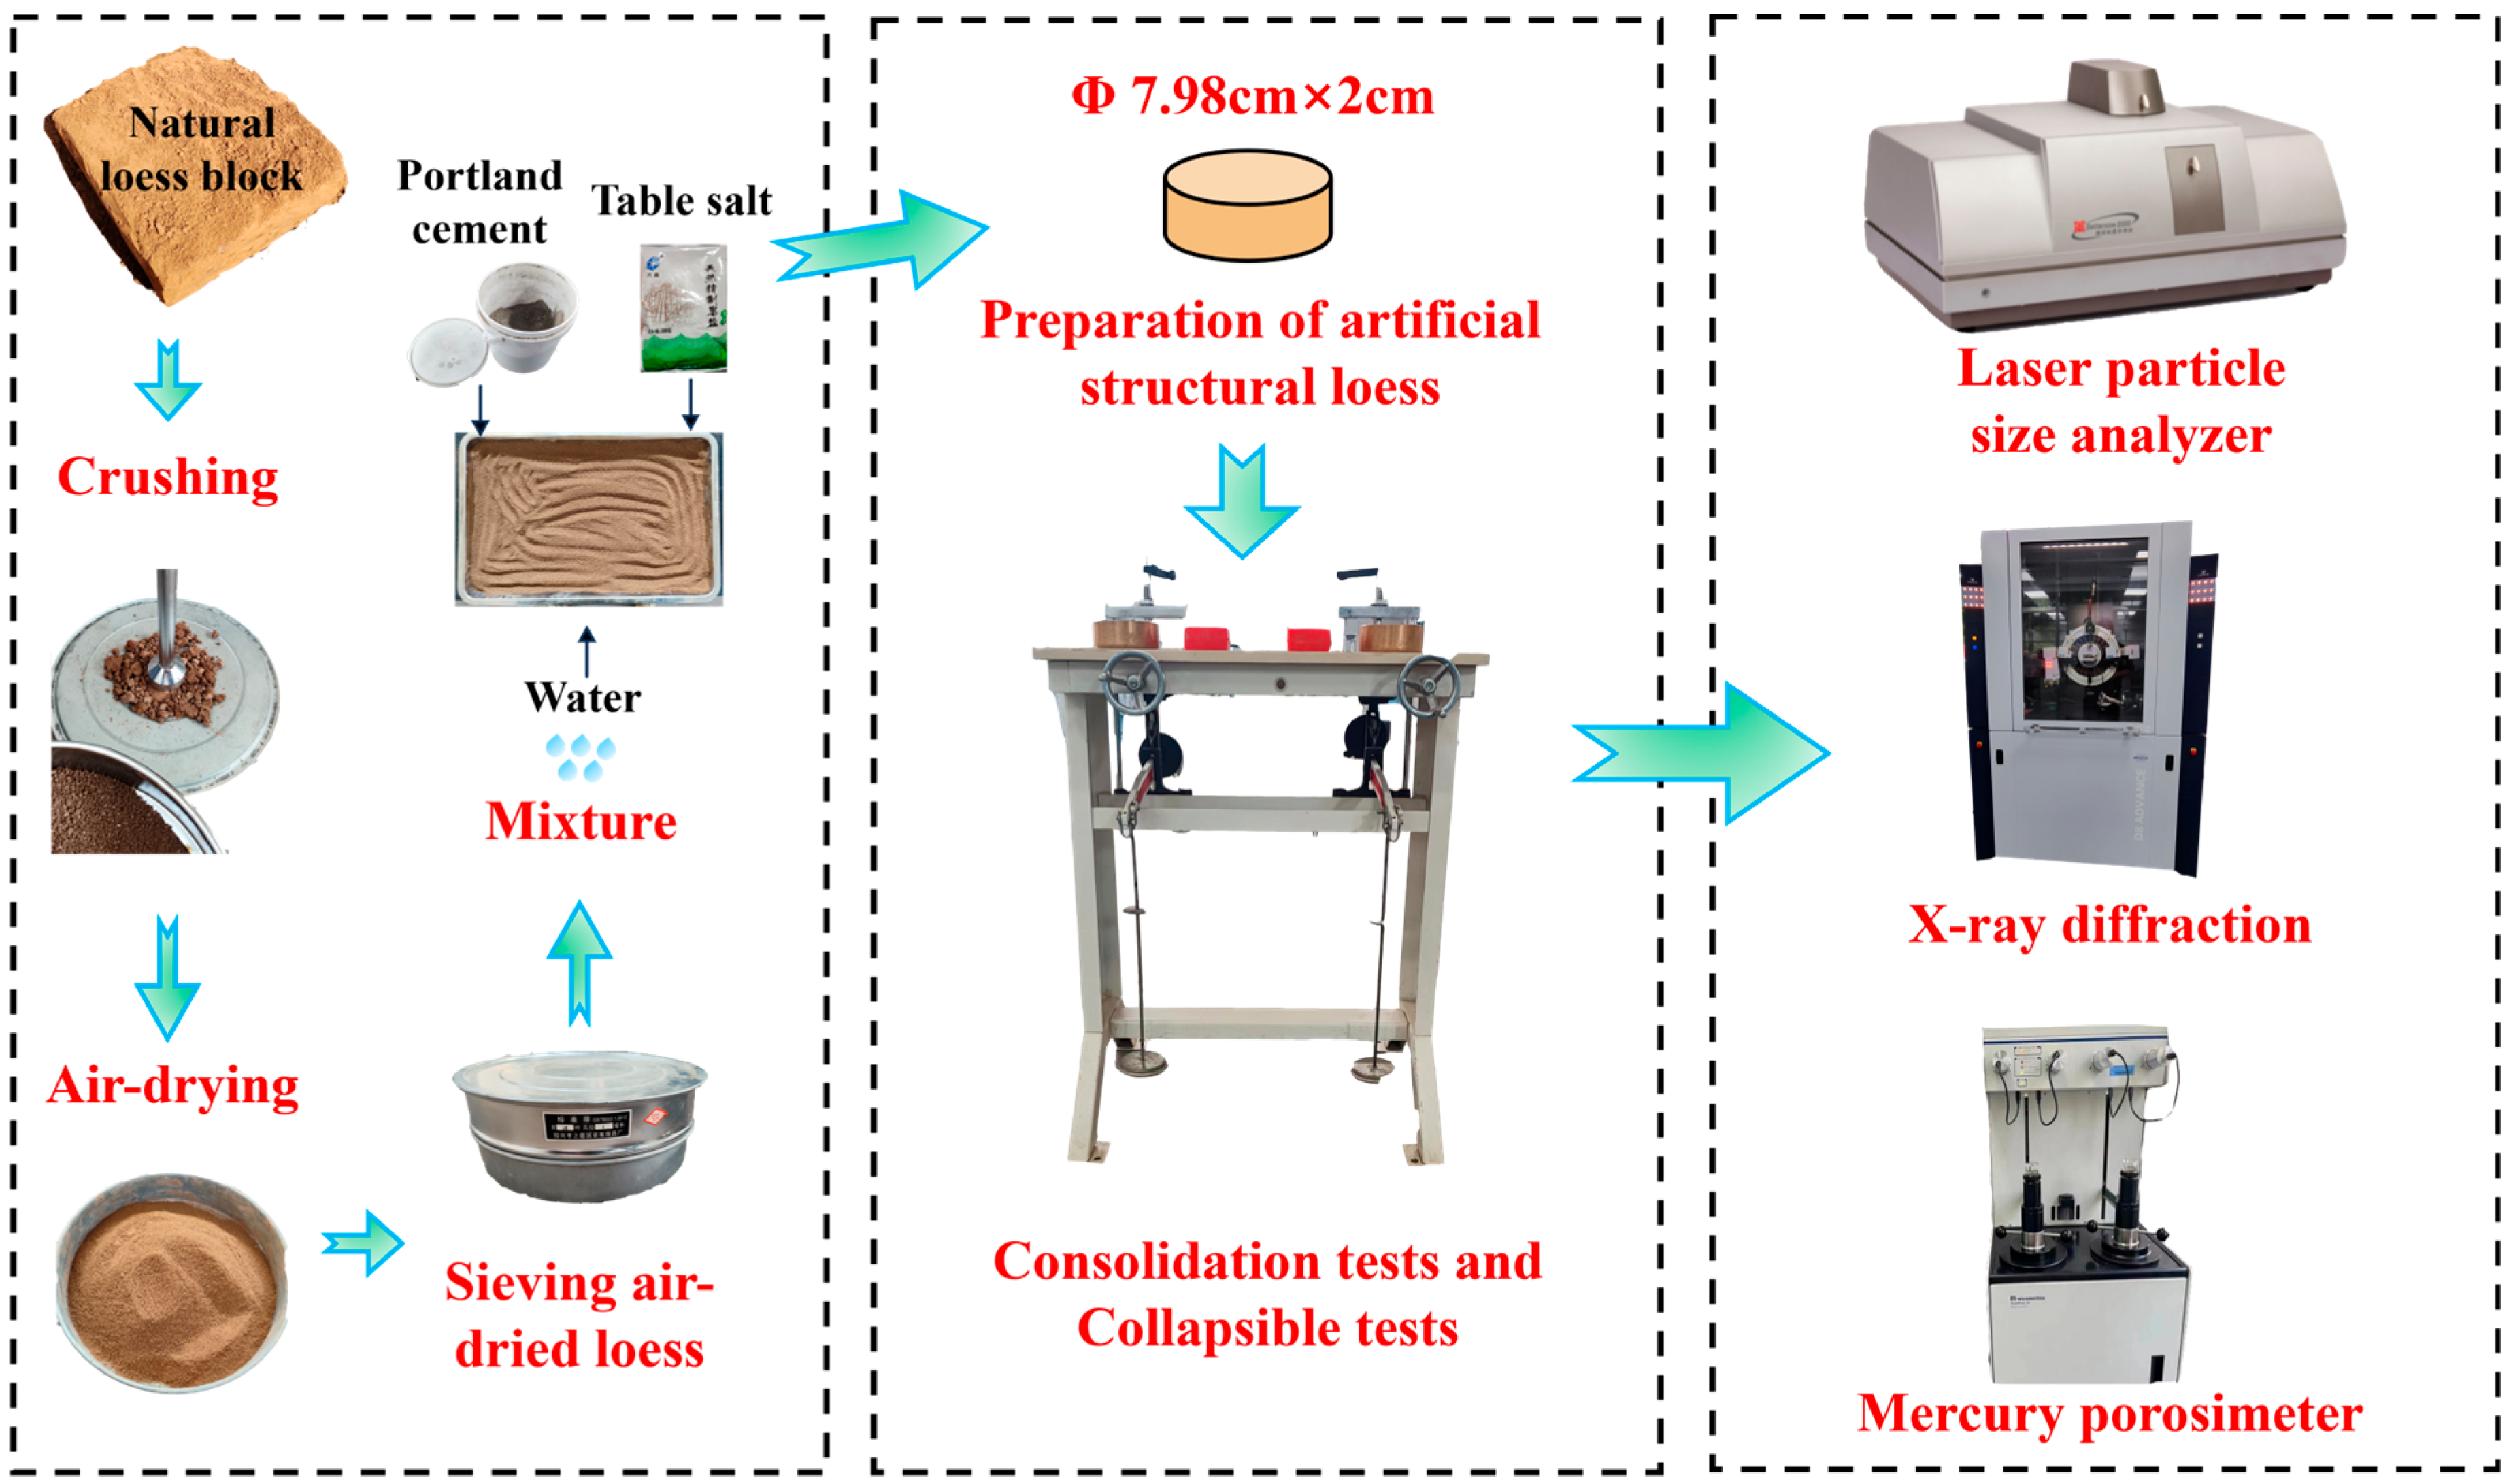
The static pressure method was employed for sample formation under controlled conditions. Specifically, uniaxial compaction was applied at a pressure of 300 kPa to fabricate specimens with dimensions of φ79.8 mm × 20 mm, simulating natural stress-induced anisotropy. A compaction degree of 95% relative to the maximum dry density was consistently maintained to ensure uniform compactness. Following compaction, the specimens were sealed in polyethylene bags and cured for 28 days under controlled conditions of 20 ± 2 °C and >90% relative humidity to facilitate cement hydration and structural development. In order to ensure that the initial specimen conditions were accurate, the soil sample was remolded, and if a significant difference in the preparation results was found, the previously indicated steps were repeated. The overall experimental workflow and detailed testing scheme are further illustrated in Figure 3 and Table 2, respectively.

2.3. Test Method

2.3.1. Consolidation, Compression, and Collapsibility Test

A WG-type single lever consolidation instrument is used to perform consolidation compression tests on structural loess specimens in compliance with the standard procedure for geotechnical engineering testing (GB/T 50123-2019) [34]. To stop the moisture in the sample from evaporating throughout the procedure, wet towels are wrapped around the pressure transmission plate. Before testing, the sample’s pre-vertical stress was 1 kPa. Then, vertical stresses of 12.5 kPa, 25.0 kPa, 50.0 kPa, 100.0 kPa, 200.0 kPa, 400.0 kPa, and 800.0 kPa are applied to the sample in sequence. The vertical deformation at the specified time point is recorded. When the deformation of the sample is less than 0.01 mm per hour, the readings before and after the deformation are recorded, and the load is gradually increased until the test is completed. When conducting a collapsible test, determine the required levels of pressure to be applied. Measure the deformation values hourly until the soil sample deformation stabilizes after the initial pressure level is applied.

2.3.2. Microscopic Test

Particle analysis tests were performed on several structural loess samples using the Bettersize2000 laser particle size analyzer, which is produced by Dandong Baite Instrument Co., Ltd. in Dandong, China, in accordance with the standard technique for geotechnical engineering testing (GB/T 50123-2019) [34]. After the air-dried loess sample was ground to 200 mesh, roughly 0.5 g of the representative sample was added to a dispersant (like sodium hexametaphosphate solution) and sonicated for five minutes to guarantee adequate dispersion in order to ascertain the variation in particle size distribution between structural loess with various added materials. Subsequently, inject the suspension into the instrument sample pool, set the refractive index to 1.52 (typical value of loess) and the absorption rate to 0.1, select the measurement range of 0.02–2000 μm, and start the dynamic light scattering and static light scattering composite testing mode. The final result was the average of the three tests performed on each sample. The volume particle size distribution curve, D10, D50, D90, and other characteristic parameters were automatically calculated using the instrument’s supporting software (Bettersize8.0). During the testing process, maintain an ambient temperature of 25 ± 1 °C and a humidity of ≤60% to reduce interference. The impact of adding salt and cement on the distribution of particle sizes during the deformation process was next examined.
The XRD instrument of D/MAX2500, made by Rigaku Corporation (headquartered in Tokyo, Japan), was used to perform XRD tests on various structural loess samples in accordance with the standard technique for geotechnical engineering testing (GB/T 50123-2019) [34]. An agate mortar was used to grind various structural loess samples to 200 mesh. The ground powder was then pressed into a sample rack for testing to determine the variations in mineral composition between structural loess with different added materials. The samples were then continuously dried at 105 °C for 24 h. The testing conditions and parameters are as follows: Cu target, K α radiation, graphite monochromator filtering, tube voltage of 40 kV, tube current of 200 mA, slit of DS/SS1°, RS/RSM of 0.3 mm, scanning speed of 4°/min, and scanning range of 5°~75°. Next, using quantitative analysis of different structural loess samples, the effect of cement and salt addition on mineral phase shift was investigated.
In compliance with the established procedure for geotechnical engineering testing [34], the MIP test was conducted using the fully automatic mercury intrusion porosimeter of Pore Master GT, produced by Quantachrome Instruments (headquartered in Boynton Beach, FL, United States). In order to separate the sample’s big, medium, small, and micropore sizes, various loess formations were allowed to air dry naturally before being cut into cylindrical rods that were ten millimeters in diameter and height. Mercury intrusion porosimetry was used to examine the pore properties of the trimmed sample in its initial form. Mercury was injected at low and high pressures into trimmed samples to quantitatively examine the effects of cement and salt addition on the pore distribution properties and evolution laws of structural loess under pressure during the deformation process. Data on how the amount of mercury injected changed with pressure was continuously monitored and recorded. Large and certain medium-sized pores’ pore characteristics were primarily measured during the experiment’s low-pressure stage, which is between 0.1 and 50 kPa; small and micropores’ pore characteristics were primarily measured during the high-pressure stage, which is between 50 and 200 MPa.
Afterwards, the connection between the deformation index and pore structure was established, and combined with microscopic experimental analysis, to clarify the influence of micro parameter evolution of soil samples on macroscopic deformation performance.

2.3.3. Construction of Multivariate Nonlinear Models

The proposed 3D nonlinear model correlating microstructural parameters with macroscopic deformation indices was derived based on the following fundamental principles and methodological steps.
The model is grounded in the micromechanical theory of structured soils [17,35], which attributes the deformation of loess to the evolution of its cementation bonds, particle rearrangement, and pore collapse [36,37].
Key microstructural parameters were selected based on their physical significance and statistical correlation with macroscopic behavior. The particle size fractal dimension (D) can intuitively reflect the grading of soil particles and further has a direct relationship with the quality of the arrangement and combination of soil particles or soil particle aggregates. The percentage of large and medium-sized pore volume (n) actually reflects the size of the maximum compression space of loess and is a characterization of the potential for loess to collapse or settle. The reason is that the large and medium-sized pores, mainly supported by salt crystal cementation, can effectively respond to external forces, while the small and micro pores (intergranular pores) have no significant changes. The clay mineral ratio (C) represents the content and properties of active bonding phases in loess, directly controlling the bonding force between soil particles.
Consider the mechanism of the link between the macroscopic deformation of loess and its microstructure (e.g., D reflects the uniformity of particle size distribution and has a negative correlation with e) [5]. C affects the bonding strength and has a favorable correlation with δs [38]. The degree of pore development is indicated by n, which has a positive correlation with e [39]). D, C, and n are selected as independent variables to construct a multivariate nonlinear model to describe their relationship with the dependent variables (e, δs) [40,41,42]. The model form is as follows:
e = a 1 D 2 + a 2 D + a 3 C 2 + a 4 C + a 5 n 2 + a 6 n + a 7
δ s = b 1 D 2 + b 2 D + b 3 C 2 + b 4 C + b 5 n 2 + b 6 n + b 7
Here, a1a7, b1b7 are the model parameters.
Using the Least Squares (LS) method to estimate parameters, the objective function is to minimize the Residual Sum of Squares (RSS):
RSS = i = 1 N ( y i y ^ i ) 2
In the formula, yi is the measured value of the i-th sample, y ^ i is the predicted value of the model, and N is the sample size.
To eliminate the influence of dimensional differences (such as C being a percentage and D being dimensionless) on parameter estimation, input variables are standardized (Z-score):
x std = x μ σ
In the formula, x is the original variable, μ is the mean of the variable, and σ is the standard deviation of the variable. The standardized data is used for model training, and after parameter estimation is completed, the final equation is obtained by inverse normalization.

2.3.4. Model Validation and Generalization Ability Evaluation

Stratified random sampling is used to separate the dataset into a 70% training set and a 30% testing set. The model parameters are fitted using the training set, and the model’s predictive ability on unseen data is evaluated using the testing set to avoid overfitting and gauge the model’s capacity for generalization. Further use k-fold cross validation (k-fold CV) to verify the stability of the model: divide the training set into k non overlapping subsets, take turns training the model with k-1 subsets, validate with 1 subset, and repeat k times to calculate the average performance index. Quantify model performance using the following metrics.
The coefficient of determination (R2) reflects the proportion of data variability explained by the model, and the calculation formula is
R 2 = 1 i = 1 N ( y i y ^ i ) 2 i = 1 N ( y i y ¯ ) 2
Here, y ¯ is the mean of the measured values, and the closer the R2 is to 1, the better the model fitting effect.
The average absolute variation between predicted and observed values is represented by the Mean Absolute Error (MAE), which is computed using the formula below:
MAE = 1 N i = 1 N y i y ^ i
Root mean square error (RMSE) reflects the root mean square deviation between predicted and measured values, calculated using the following formula:
RMSE = 1 N i = 1 N ( y i y ^ i ) 2
Overall, the smaller the MAE and RMSE, the more accurately the model predicts.

3. Results and Analysis

3.1. Mechanical Test Results and Analysis

3.1.1. Compression Curve

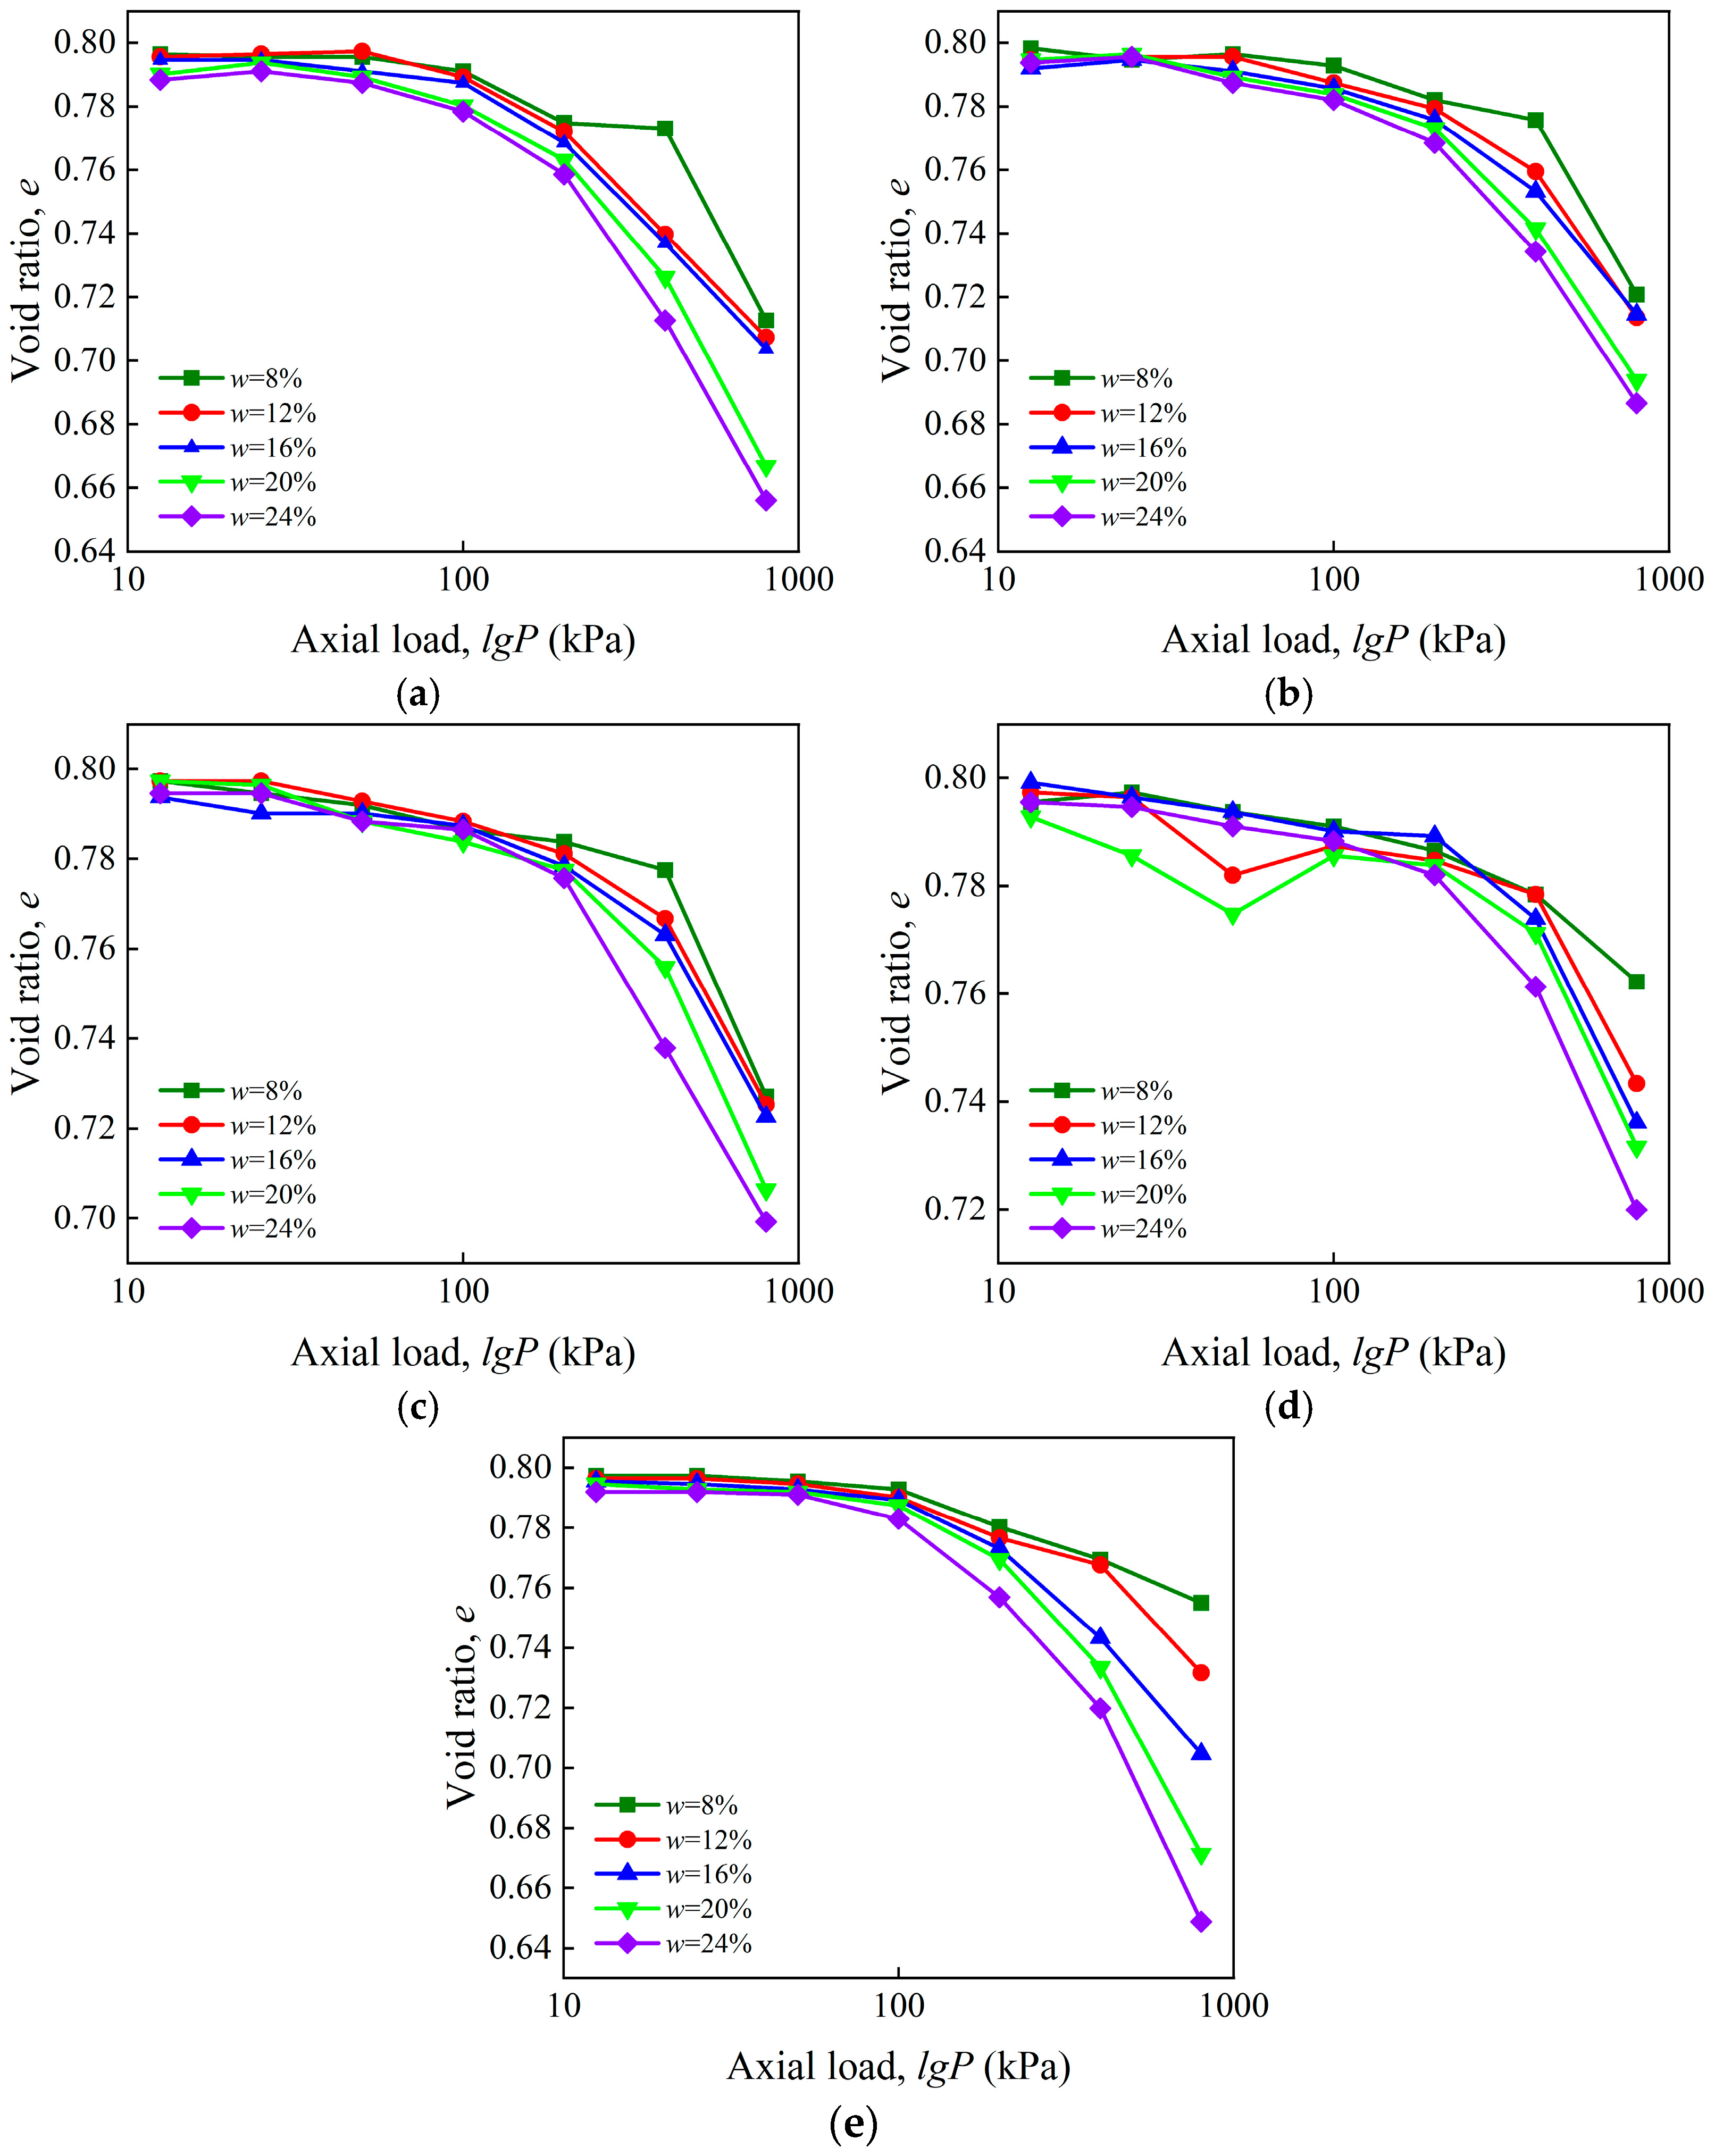
The porosity ratio e of artificial structural loess under varying cement contents (c) as a function of vertical load lgP is plotted in Figure 4. The porosity ratio (e) exhibits a fluctuating pattern of initially steadily declining and then rapidly declining under the impact of vertical force. Here, when the water content (w) is 8%, the structural loess (Figure 4a) has a significant compressive effect due to cementation. After compression at 100 kPa, the porosity ratio is still relatively high (e ≈ 0.79). The substantial spaces between the particles show that the soil sample’s structural stability is still high. The load values with notable porosity changes decrease when the moisture content rises to 24%. This suggests that water infiltration causes cement to dissolve and lose its properties, aggregates to break down into tiny particles, and pores to fill, all of which result in a significant porosity decrease of 0.02. At this stage, structural damage mainly comes from the weakening of cement strength [43,44]. When the c rises, the e rises considerably under the same w conditions. The addition of cement generates a large amount of cement, which increases the bonding strength between particles, makes it difficult to compact pores, enhances the internal structural strength of the soil sample, and also indicates that the remaining pore space of the soil sample can be compressed more [45,46,47]. In the case of loess reshaping (Figure 4e), the artificial preparation process caused the structural bonding bonds to break and the large pores to collapse prematurely; a higher porosity results from denser pores at low water content. The bonding strength fails and the skeleton of the soil sample becomes unstable as the water content rises to 24% as a result of immersion and external load mixed. This causes the soil particles to rearrange, further reducing the pore ratio and increasing compressibility [48,49,50].

3.1.2. Compression Coefficient and Compression Modulus

The changes in the modulus of compression and the compression coefficient of structural and remolded loess with varied water contents under various cement dosages are depicted in Figure 5a,b. The compression coefficient (a) represents the soil compressibility under load, while the compression modulus (Es) represents the stiffness characteristics. The compression coefficient is negatively correlated with the compression modulus, indicating that as the compression coefficient increases, the stiffness decreases. Due to space limitations, this article focuses on discussing compression coefficients. In structural loess with the same w = 16%, as the c increases, the compression coefficient decreases from 0.126 to 0.072, indicating that cement establishes a cement soil network structure by adsorbing and encapsulating soil particles, significantly reducing the pores between particles and giving loess low compressibility characteristics that meet the requirements of roadbed filling standards [51]. The compression coefficient increases further when the w is greater than sixteen percent at the same cement concentration. The main water infiltration causes the dissolution of the cement between particles, weakens the strength of the particle structure, and makes it easier to slip under load, increasing deformation [44]. For remolded loess, the overall a increase from 0.126 MPa−1 to 0.189 MPa−1. Compared to structured loess, the compression coefficient of remolded soil is often greater than that of structured soil, mainly because the remolding process has destroyed the natural bonding structure, and particles are more prone to slip. The increase in a makes up 57% of the total when the w rises to 16%. However, as the water content increases, the increase in compression coefficient decreases, indicating that the increase in w is smaller than that of structural loess, indicating that the particle arrangement gradually tends to stabilize. Because the natural bonding connection was disrupted during the reshaping, the soil sample’s deformation is primarily determined by the particle arrangement, with bonding having a negligible impact. The structure of the soil sample progressively stabilizes following the damage as the water content rises [52].

3.1.3. Collapsibility Coefficient

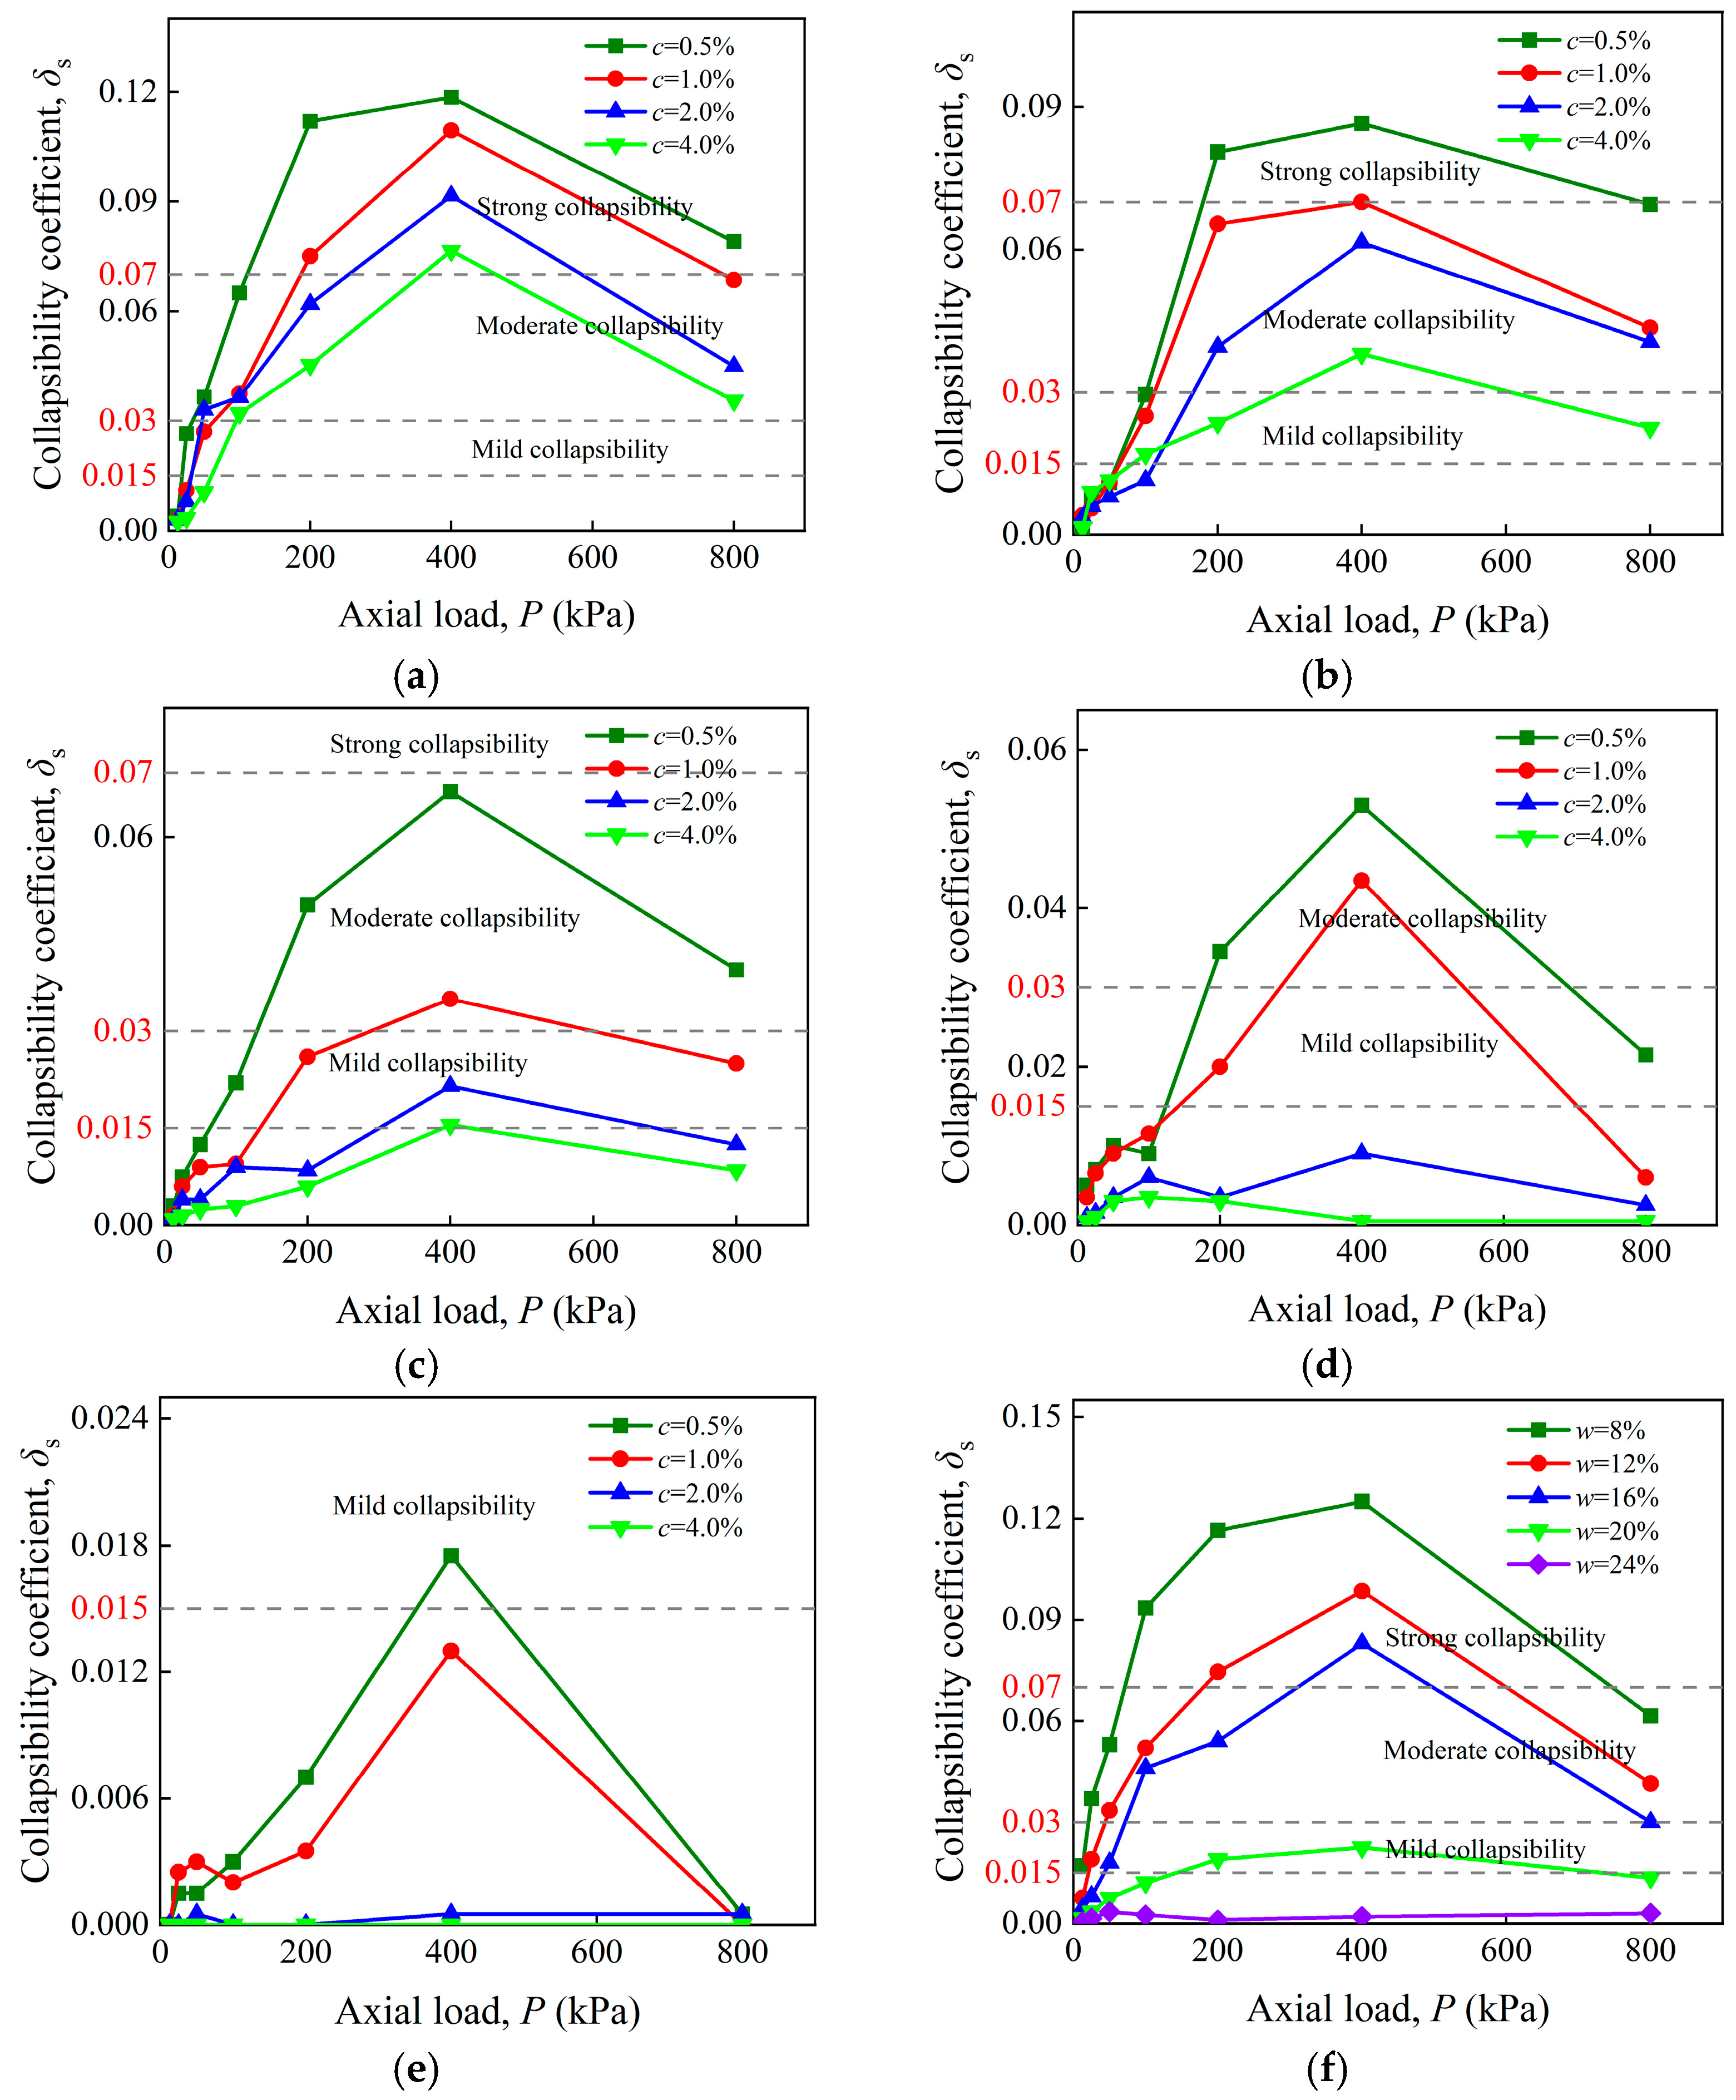
The artificial structural loess’s δs-P curves at various water contents are displayed in Figure 6. The δs of the soil sample exhibits a trend of initially rising and then falling with increasing vertical load, independent of w. Here, when the w is 8% and the c is 0.5%, the soil sample has a larger coefficient of collapsibility (p = 400 kPa, δs ≈ 0.12), indicating that the natural bonding structure has weaker resistance to water immersion deformation. The collapsibility coefficient under similar load dramatically drops as the cement content rises, primarily because the hydration reaction produces a lot of cement to fill and wrap the pores, and the particles shift from point contact to surface contact, improving the structural integrity overall. Secondly, the compression deformation during the consolidation stage has already decreased, so the soil sample is less likely to deform after immersion in water. Furthermore, while the relative slip between soil particles is completed earlier during the compression stage, the soil structure tends to be dense before immersion, the cementitious material softens or partially dissolves, the pores fill with water, and the surface water film of particles thickens as the water content increases. After immersion, the pore volume available for compression further decreases [51,52]. In particular, the soil sample with a c of 0.5% slowly loses its collapsibility when the w rises to 24%. Under the same stress (p = 400 kPa), the soil sample’s collapsibility coefficient drops from 0.12 to 0.014.

3.2. Microstructure and Material Composition Test Results and Analysis

3.2.1. Particle Analysis Test Results

The particle size of various structured loess soil samples does not change substantially under varying loads, as seen in Figure 7b,d,f; however, Figure 7a,c,e still show some variance. Compared to structural loess, vertical loading makes it easier for large particles to break and a small number of small particles to increase inside the reshaped loess. Mainly because the reshaping process has destroyed the natural bonding structure, particles are more prone to slip [53]. In particular, the overall content of medium silt particles (5–40 μm) in the soil sample decreased, indicating a more substantial trend of curve modification, whereas the quantity of clay particles (<5 μm) increased. Secondly, the particle size distribution of loess is relatively uniform, which usually means that there is a certain proportion of large pores in its pore structure. This structure may cause the reshaped loess to be more prone to deformation and collapse under stress. The interval distribution curve (Figure 7c) exhibits a smaller particle distribution as the cement concentration increases in comparison to remolded loess. This is notably demonstrated by an overall rise in the content of medium powder particles (5–40 μm) in comparison to remolded soil samples. Large particles may break under load, but the effect is negligible. Meanwhile, the load increases the content of small particles (less than 5 μm), primarily because of the adsorption and encapsulation of a lot of cement, which strengthens the bond between particles and increases the soil’s overall strength and resistance to deformation [45,46]. Secondly, the concentration of particle distribution aids in improving the compactness of the soil and further reduces deformation. The addition of salt may generate some pores, which may reduce the compactness of the soil sample and increase deformation [54,55]. In summary, the reshaping of loess is mainly based on a silt–clay skeleton, with a high porosity and loose structure. A skeleton foundation for the ensuing densification of pore structure is provided by the change in particle size distribution towards fine-grained enrichment following the addition of cement.

3.2.2. XRD Test Results

The physical hydration reaction between soil and cement hydrates involves physical adsorption and hydration attachment, irreversibly absorbing cement hydrolysis products. In soil containing coarse sand particles, the interaction between cement hydration products and the surface of quartz sand takes a long time. The hydration reaction equation is as follows:
C a O H 2 + S i O 2 + n H 2 O C a o S i O 2 n + 1 H 2 O C a O H 2 + A l 2 O 3 + n H 2 O C a o A l 2 O 3 n + 1 H 2 O C a O H 2 + F e 2 O 3 + n H 2 O C a o F e 2 O 3 n + 1 H 2 O
The particle size distribution determines the initial skeleton structure of the soil, and the stability of the skeleton is further controlled by the mineral bonding state. Figure 8 shows the XRD patterns of different structured loess soil samples, and the diffraction peak characteristics at 20.92°, 26.7°, 28.02°, 36.58°, 39.5°, and 50.18° are similar to those of quartz (SiO2) [40]. The diffraction peak characteristics at 29.42° and 31.74° are similar to those of calcite (CaCO3) and salt (NaCl) [38]. It is evident that although the diffraction spectrum curves of loess with various morphologies are comparatively similar, the diffraction peaks’ sizes still vary somewhat. Here, as the cement content increases to 4%, the diffraction intensity at 26.7° (the main characteristic peak of quartz) decreases from 3924 to 3816, and the diffraction intensity at 29.42° (the main characteristic peak of calcite) increases from 709 to 873, mostly because of the cement’s hydration reaction, which produces a lot of cementing material, which interferes with the diffraction path, the proportion of clay minerals (TCCM) in the soil sample increases to 29.5%, and the hydration reaction also generates calcite (accounting for 12.3%), which blocks the micropores with secondary crystals and suppresses pore deformation. At the same time, the hydration reaction consumes some quartz (SiO2), causing the particle size distribution to shift towards finer particles (see Figure 7b), directly resulting in a reduction in the soil particle skeleton’s rigidity [56,57]. A decrease of 5.6% in plagioclase will promote the hydration of cement to form binders (TCCM increased from 23.5% to 29.5%), compensating for the loss of skeleton. The mineral content of loess with different structural types is shown in Table 3. This series of changes determines the bonding strength, which in turn affects pore stability.

3.2.3. Mercury Intrusion Porosimetry Results

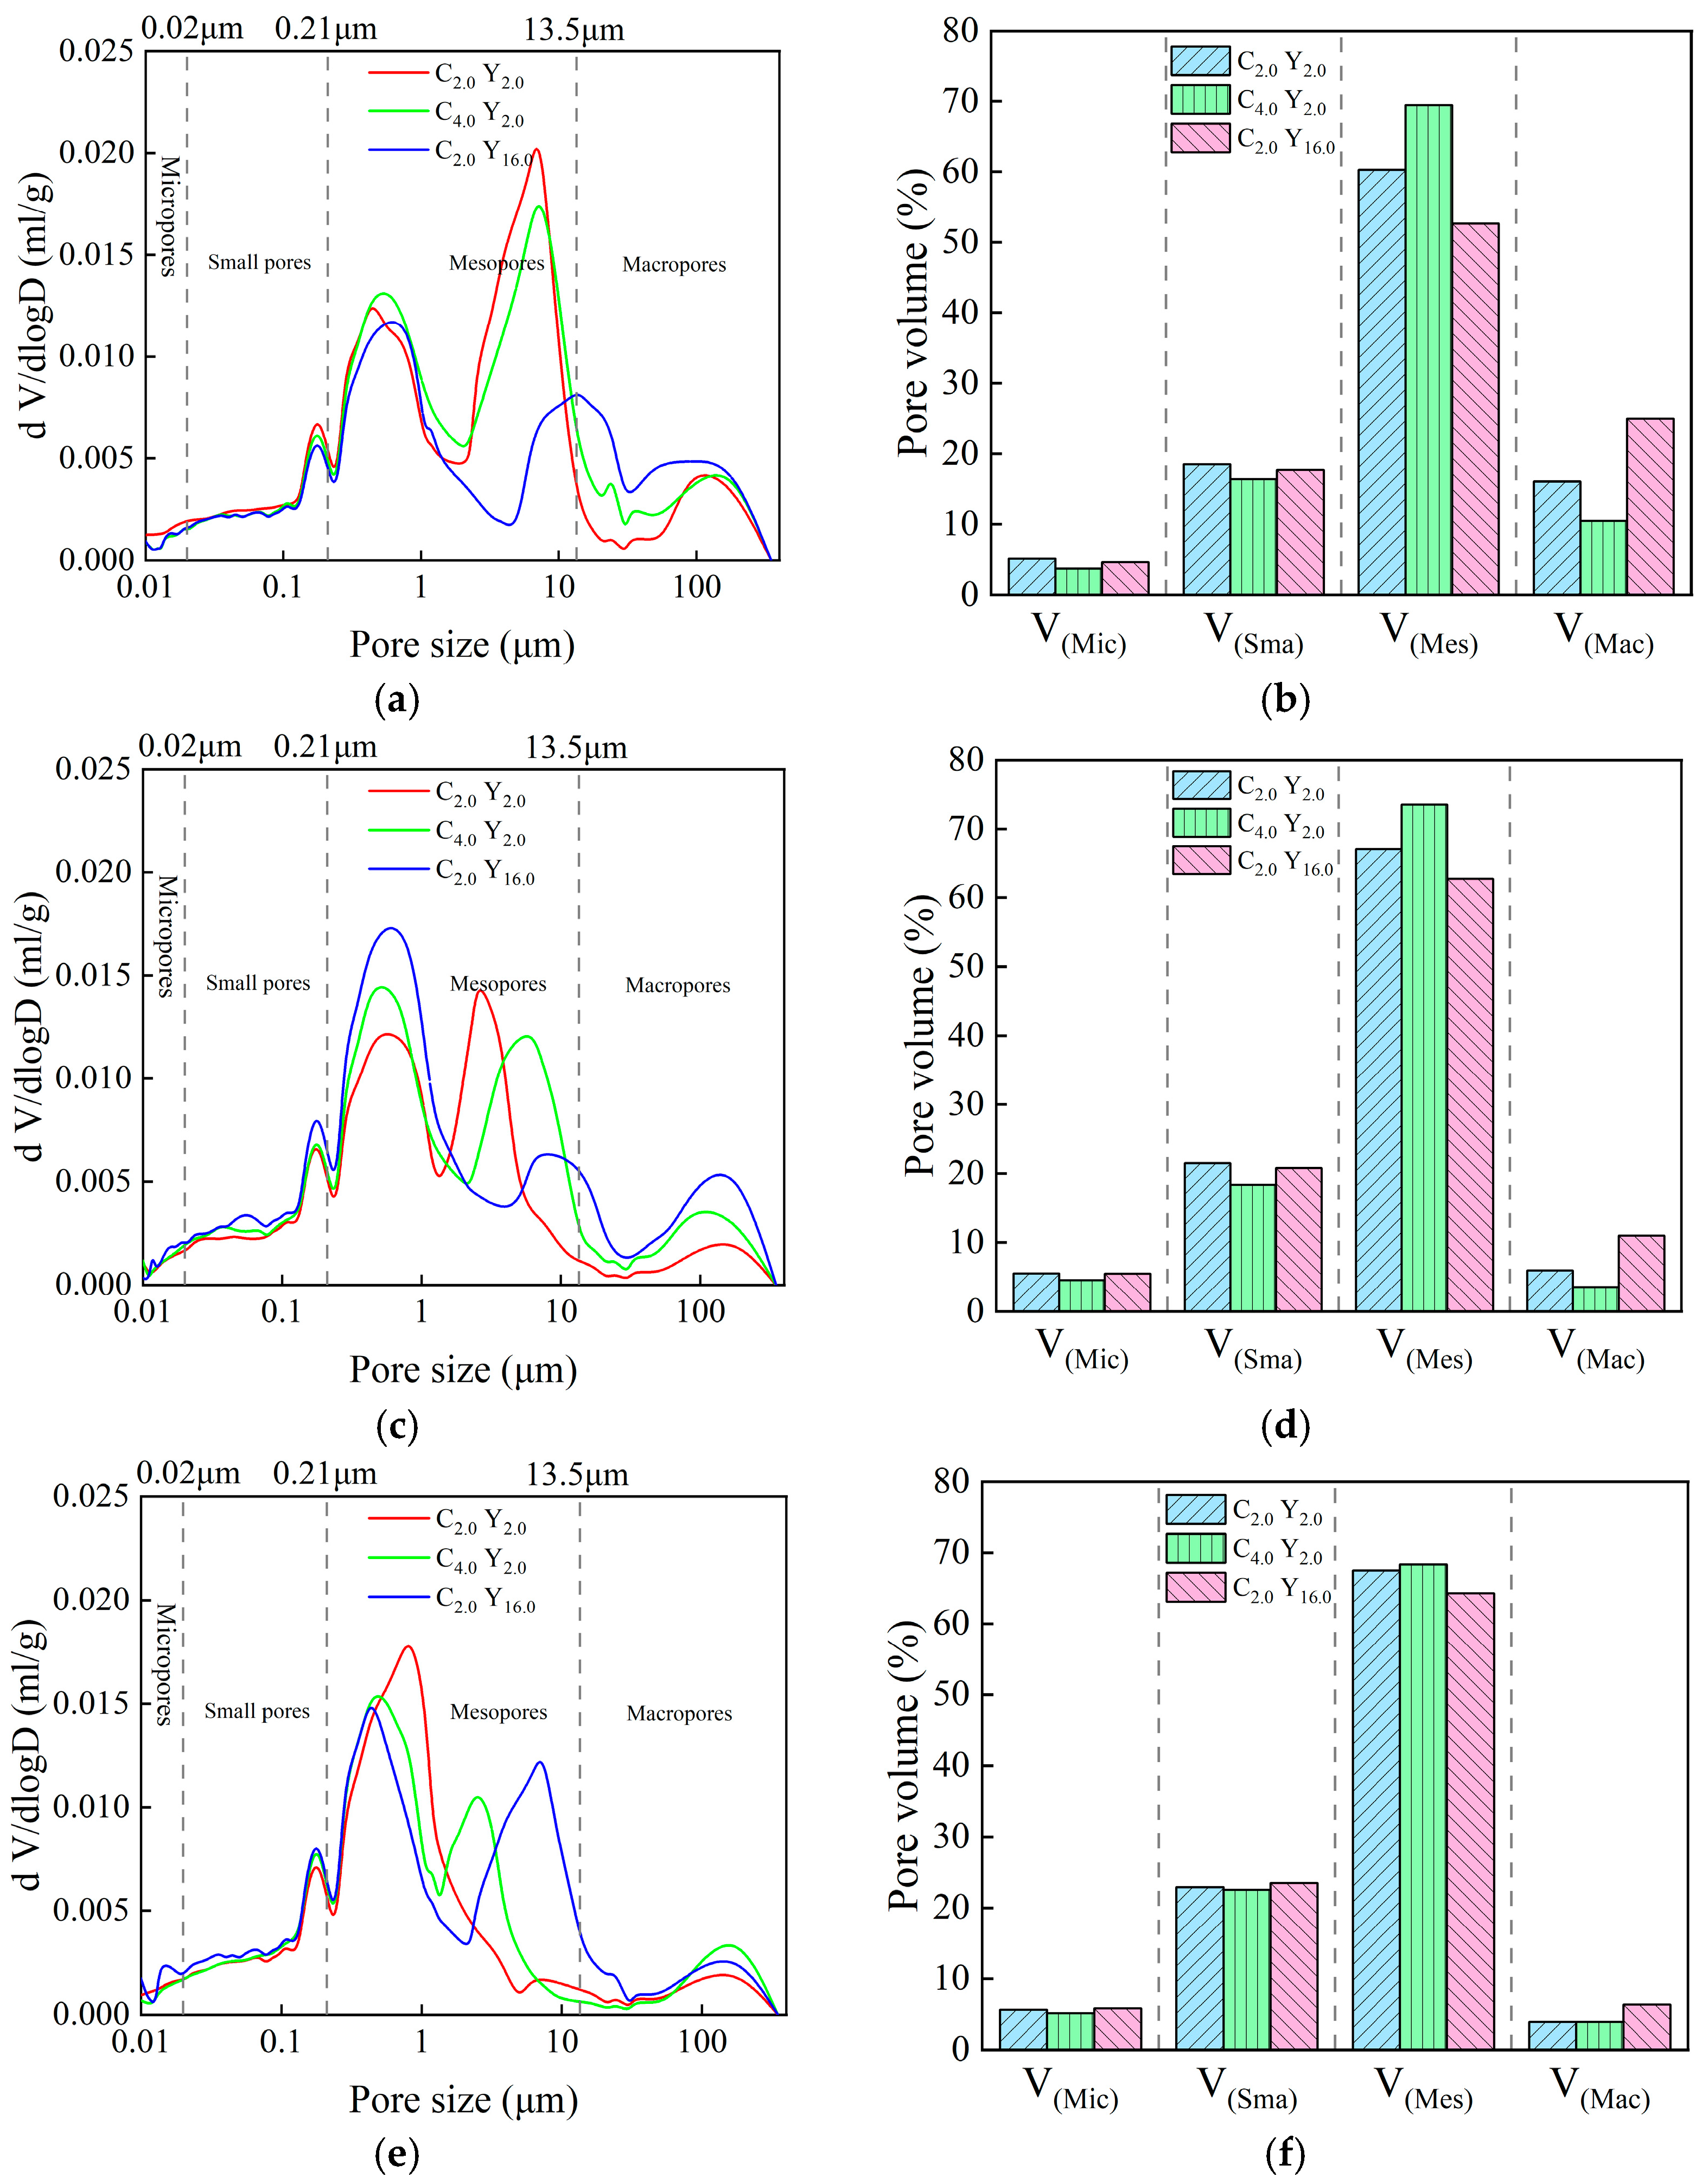
To learn more about how the mechanical behavior of soil samples is impacted by the structural pore structure of loess, fractal geometry theory and methods can be used to quantitatively describe the complex multi-level distribution of pores in loess. Using a volume fractal model, namely V (d < D)/Vt ∞ DkV (d < D) (where V (d < D) indicates the total pore volume of the soil sample, Vt is the cumulative volume of pores smaller than diameter D, and k is the linear fitting slope between lg (V (d < D)/Vt) and lgD), the connection between the cumulative percentage of pore volume smaller than a certain pore size (Y-axis) obtained from MIP testing and the pore diameter (X-axis) can be presented on a double logarithmic coordinate graph, which better depicts the fractal characteristics of pores in loess. Based on pore size, structural loess pores are classified into four groups based on the cumulative pore volume curve analysis: macropores with a diameter greater than 13.5 μm, mesopores with a diameter between 0.21 and 13.5 μm, micropores with a diameter between 0.02 and 0.21 μm, and micropores with a diameter less than 0.02 μm [39,40,42].
As illustrated in Figure 9, the pore structure of structural loess distribution samples under various vertical loads (P) and varying cement and salt contents under the same load were examined to examine the pore distribution of structural loess under various circumstances. The pore size distribution curves of structural loess under various P are displayed in Figure 9a,c,e. The pore size distribution density curve’s general tendency is comparatively stable. In line with the border pore size division of pores, the medium pores’ pore size distribution density changes to a large extent and dominates, followed by the large pores’ pore size distribution density, and lastly, the micro and small pores’ pore size distribution density. Among these, the most likely pore size of all soil samples was compressed from 5–8 μm to 0.3–0.8 μm as the P increased from 200 kPa to 800 kPa. This suggests that the load destroyed the internal structure of the soil samples, causing large pores to collapse quickly after the structure yielded and the pores to gradually change from mesopores to small pores and micropores. When P = 200kPa, a secondary peak (macropore) of 30–50 μm appeared in the soil sample of Y16.0 (16% salt); at 400 kPa, the peak significantly decreased and gradually disappeared at 800 kPa. However, the C2.0 (2% cement) and C4.0 (4% cement) soil samples showed a bimodal distribution within the mesopore range at 200 kPa, showing that the pores were filled with cement-produced cementitious materials, which inhibited the creation of big pores by enhancing the soil’s structural strength samples and facilitating the aggregation of certain particles under load. Meanwhile, the development of certain mesopores was further inhibited by the rise in cement concentration [46]. The curve of the 16% saline soil sample has the highest main peak and the narrowest peak width at 400 kPa, showing that a lot of homogeneous large and medium-sized pores are formed by some salt crystals, but the bonding is weak and brittle collapse happens under high pressure. The soil sample’s internal structure is disturbed, resulting in a redistribution of pore size. Some large and medium-sized pores mainly transform into mesopores, while others transform into macropores [54]. Figure 9b,d,f display the structural loess’s pore volume distribution under various vertical loads (P). The pore volume of every soil sample reduces as the vertical stress (P) increases, indicating that the pore structure becomes denser under high load (P). Here, the C2.0 (2% cement) and C4.0 (4% cement) curves show a trend of gradually decreasing pore volume with increasing cement content, especially in the larger pore size range. This suggests that cement can efficiently fill soil pores and increase the soil’s structural strength, thereby reducing compressibility. The Y16.0 (16% salt) curve shows a relatively high pore volume within a larger pore size range, but rapidly decreases under high confining pressure. The addition of salt generates some large pores, but the bonding strength is not high. Under external loads, the structure will quickly break down, causing the volume of large pores to be compressed, resulting in the transformation of some large pores into small and medium-sized pores.

3.3. Correlation Analysis and Calculation Between Macroscopic Deformation Indicators and Microscopic Structural Parameters

3.3.1. Linear Correlation Analysis

The possible relationship between the contributing elements and the mechanical properties of various loess structures under vertical loads is investigated in this work using Pearson correlation analysis. As demonstrated in Figure 10, under all conditions, there is a significant positive correlation between e and n. This implies that a higher porosity will result in a higher volume ratio of big pores, which will impact the soil sample’s compressibility and structural strength. The e and the micropore volume ratio have a strong inverse relationship, indicating that as the e decreases, the pore structure in structural loess may undergo adjustments such as pore merging, segmentation, or rearrangement. The original large pores may be divided into smaller and micro pores, thereby increasing the volume ratio of these pores. In addition, smaller pore sizes may limit the flow of water, thereby reducing permeability. This change may affect the water migration and distribution of soil under different environmental conditions, thereby adversely affecting its deformation characteristics. Meanwhile, the δs is positively correlated with the volume ratio of mesopores, micropores, and micropores. This result indicates that mesopores (i.e., hollow pores) are the main factor causing loess subsidence [41]. The increase in mesopores may lead to more water entering the interior of the soil, increasing pore water pressure and promoting the occurrence of collapsibility. The soil’s specific surface area may also rise as a result of the growth of tiny and micropores, enhancing its contact with water, which may affect the compressibility characteristics of the soil [58]. In addition, there are differences in pore stability in loess, with poorly stable support pores and highly stable intergranular pores and pores within the cement. Under lower loads, unstable pores are prone to damage, while more stable pores can be preserved, resulting in a low correlation between e and δs. In the above process, as the external load increases, the fraction of medium, small, and micro pores increases as the large pores progressively change into medium, tiny, and micro pores; all of these pores exhibit a strong negative connection. Here, the soil’s internal structure is improved, and the relationship between porosity and pore volume ratio is further strengthened, as the increased cement content produces a significant amount of cementitious material to fill and encapsulate particles. The relationship between the proportion of large and moderately sized pore volumes is strengthened by the rise in salt concentration, indicating that the addition of salt generates some large pores, but the bonding strength is not high. Under external loads, the structure will quickly break down, causing the volume of large pores to be compressed. As seen in Figure 9b,d,f, this causes certain large holes to change into small and medium-sized pores.

3.3.2. Quantitative Calculation of Loess Deformation Based on Macro–Micro Correlation

The benefits and drawbacks of the configuration and mixture of dirt fragments or soil particle aggregates are described by the particle size potential of the soil. The unevenness (gradation) of soil particles has a direct bearing on this characteristic. Particles of uneven soil are more closely packed together and can be compacted more effectively. Particles of homogeneous soil are not closely packed together and have larger and more numerous pores. According to fractal theory, the fractal dimension value (D) of particle size provides a quantitative representation of the soil’s particle size distribution. The following is the definition of the fractal dimension value:
N f = 1 r D = r D
Here, D is the fractal dimension, r is a certain scale of particles, and Nf is the quantity at that scale.
When studying the fractal dimension of loess particles, the Weibull distribution is used to represent it; that is
m < r m 0 = 1 exp r r 0 b
Here, m (<r) is the total mass of all particles with a diameter less than r; m0 is the total mass of the sample; r0 is the average particle size of the particles; and the power exponent b is a constant.
The fractal dimension value D of loess is then calculated using the particle analysis data. The y-axis represents the percentage of particle mass smaller than a specific particle size r to the total mass, and the x-axis is the particle size r. In three-dimensional Euclidean space, the range of fractal structure D is 2–3; that is, the value of b is in the range of 0–1. Outside this range, fractal structure does not have practical physical significance [59,60]. As shown in Table 4, the microstructure parameters of the particles were obtained through particle analysis, XRD experiments, and MIP experiments. The link between external loads (P), δs, e, D, n, and C was represented by a three-dimensional model.
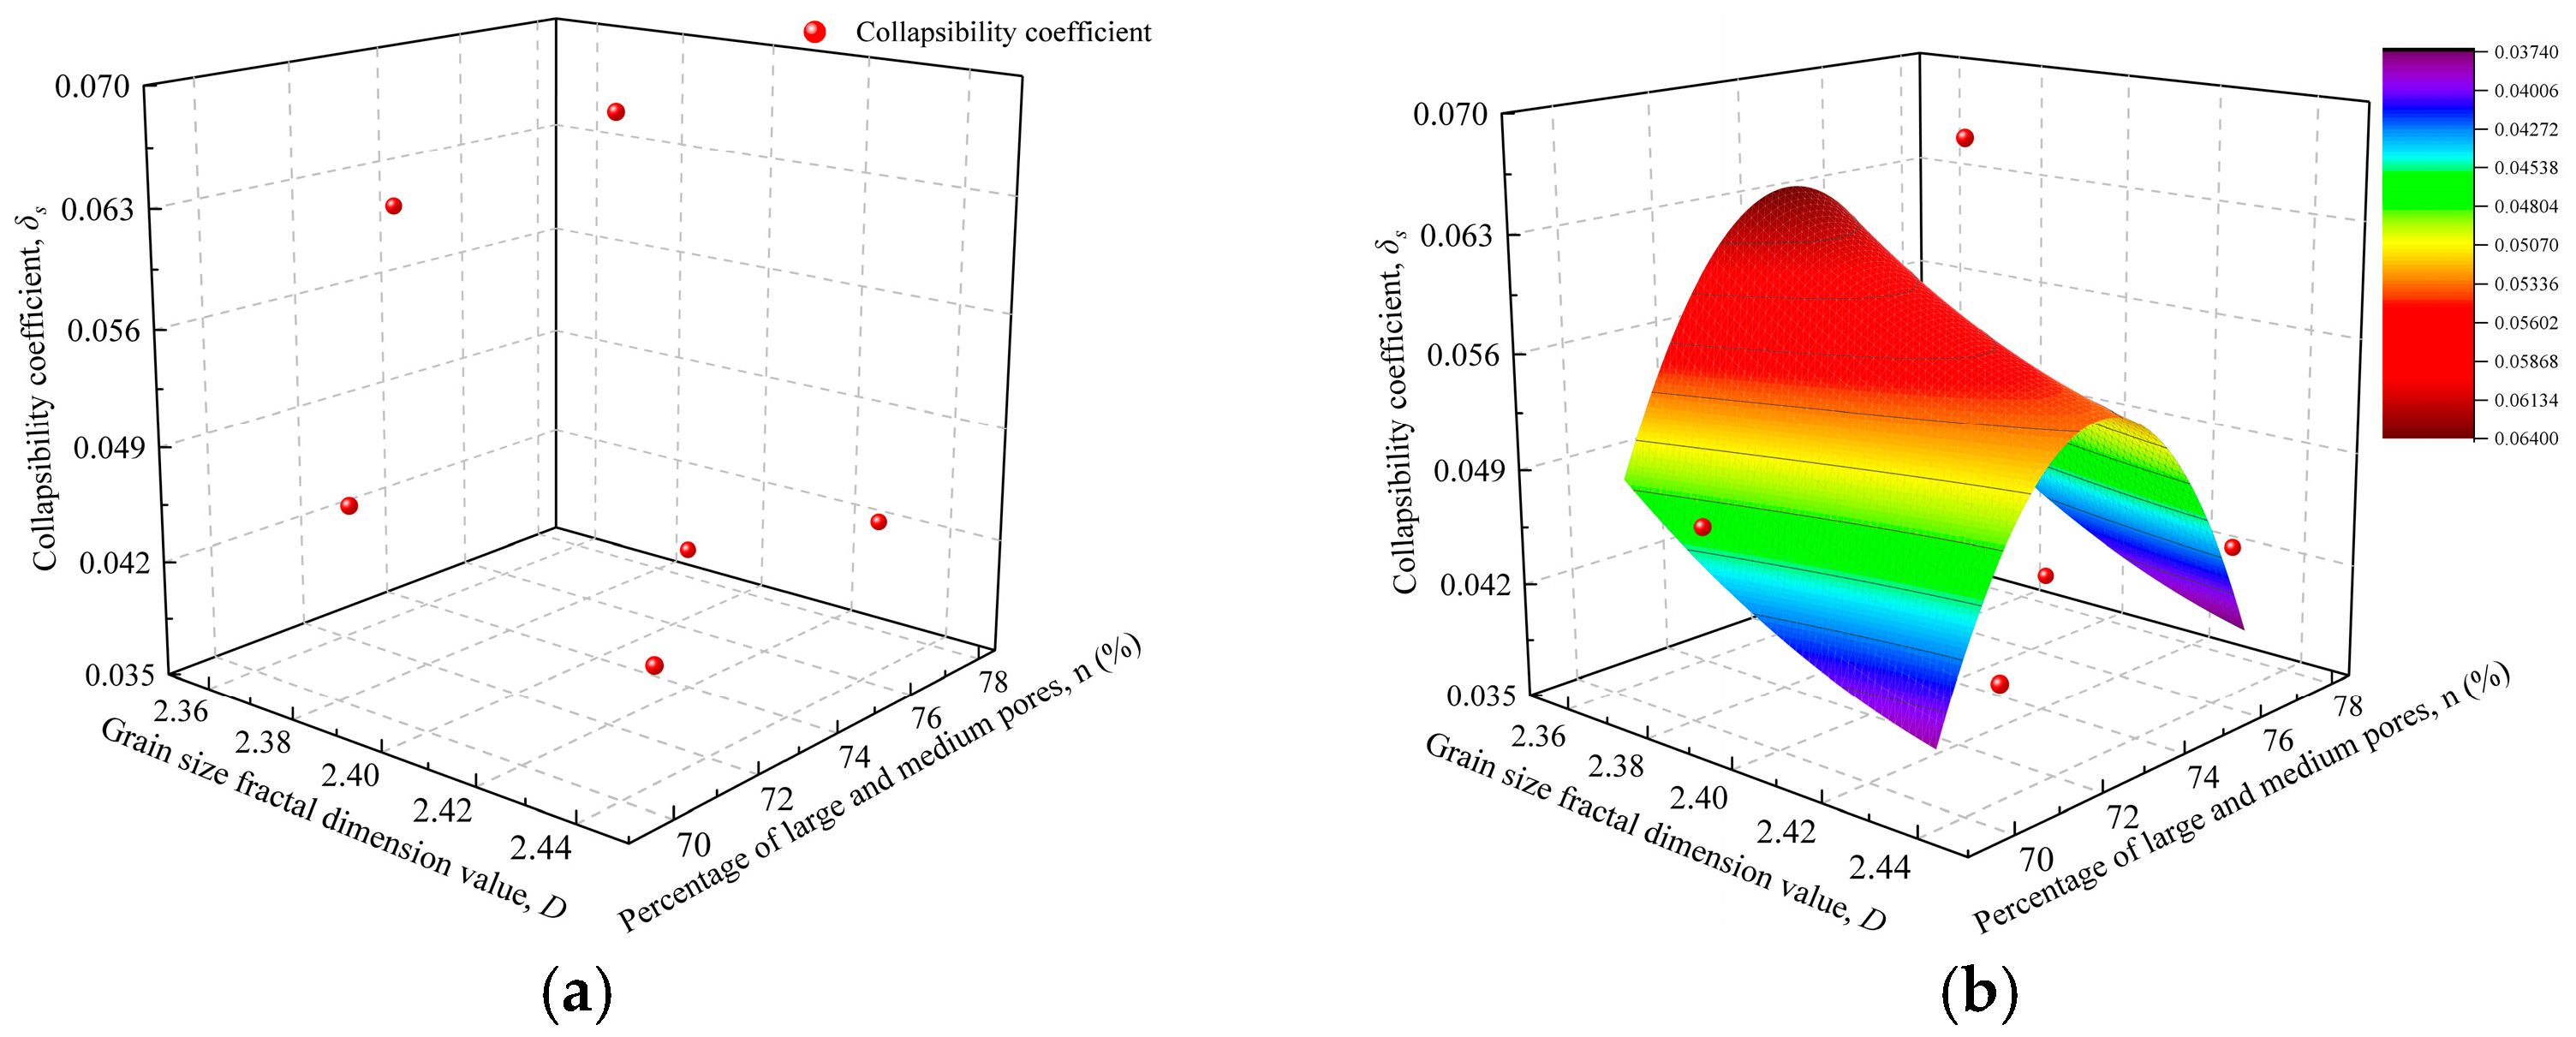
Figure 11 shows the nonlinear relationship model between particle size dimension, proportion of large and medium pores, and the collapsibility coefficient. The fitting factor R02 is 0.54223, and the quantitative relationship equation is:
δ s = 1.13181 D 2 5.5773 D 0.00109 n 2 + 0.16054 n + 1
A “saddle shape” is shown by the three-dimensional surface model of loess with D, n, and δs. With the Z-axis as the study focus, the model’s color scale changes from purple to red as δs rises, suggesting a tendency toward progressively declining D. δs has a trend of initially growing and then dropping when n gradually declines. This is in accordance with engineering practice and is consistent with the fluctuation pattern in Figure 6. Combining the expression of Formula (11), taking the non-linear influence dominated by D as an example, the D value characterizes the complexity and irregularity of soil particle size distribution. The coefficient of the D2 term is positive and the coefficient of the D term is negative, indicating that δs exhibits a nonlinear relationship of decreasing first and then increasing with the increase in D (parabolic curve with an upward opening). The initial decrease is due to the moderate D value, indicating good gradation, where small particles can effectively fill large pores, making the structure denser and enhancing its resistance to collapse. The latter increase may be due to the excessive complexity of the particle system and the high content of fine particles when D is too high. When it comes into contact with water, particle rearrangement and cement softening are prone to occur, which actually exacerbates structural instability and collapsibility. This indicates the existence of an optimal range of granularity dimension values that can minimize the collapsibility of loess.
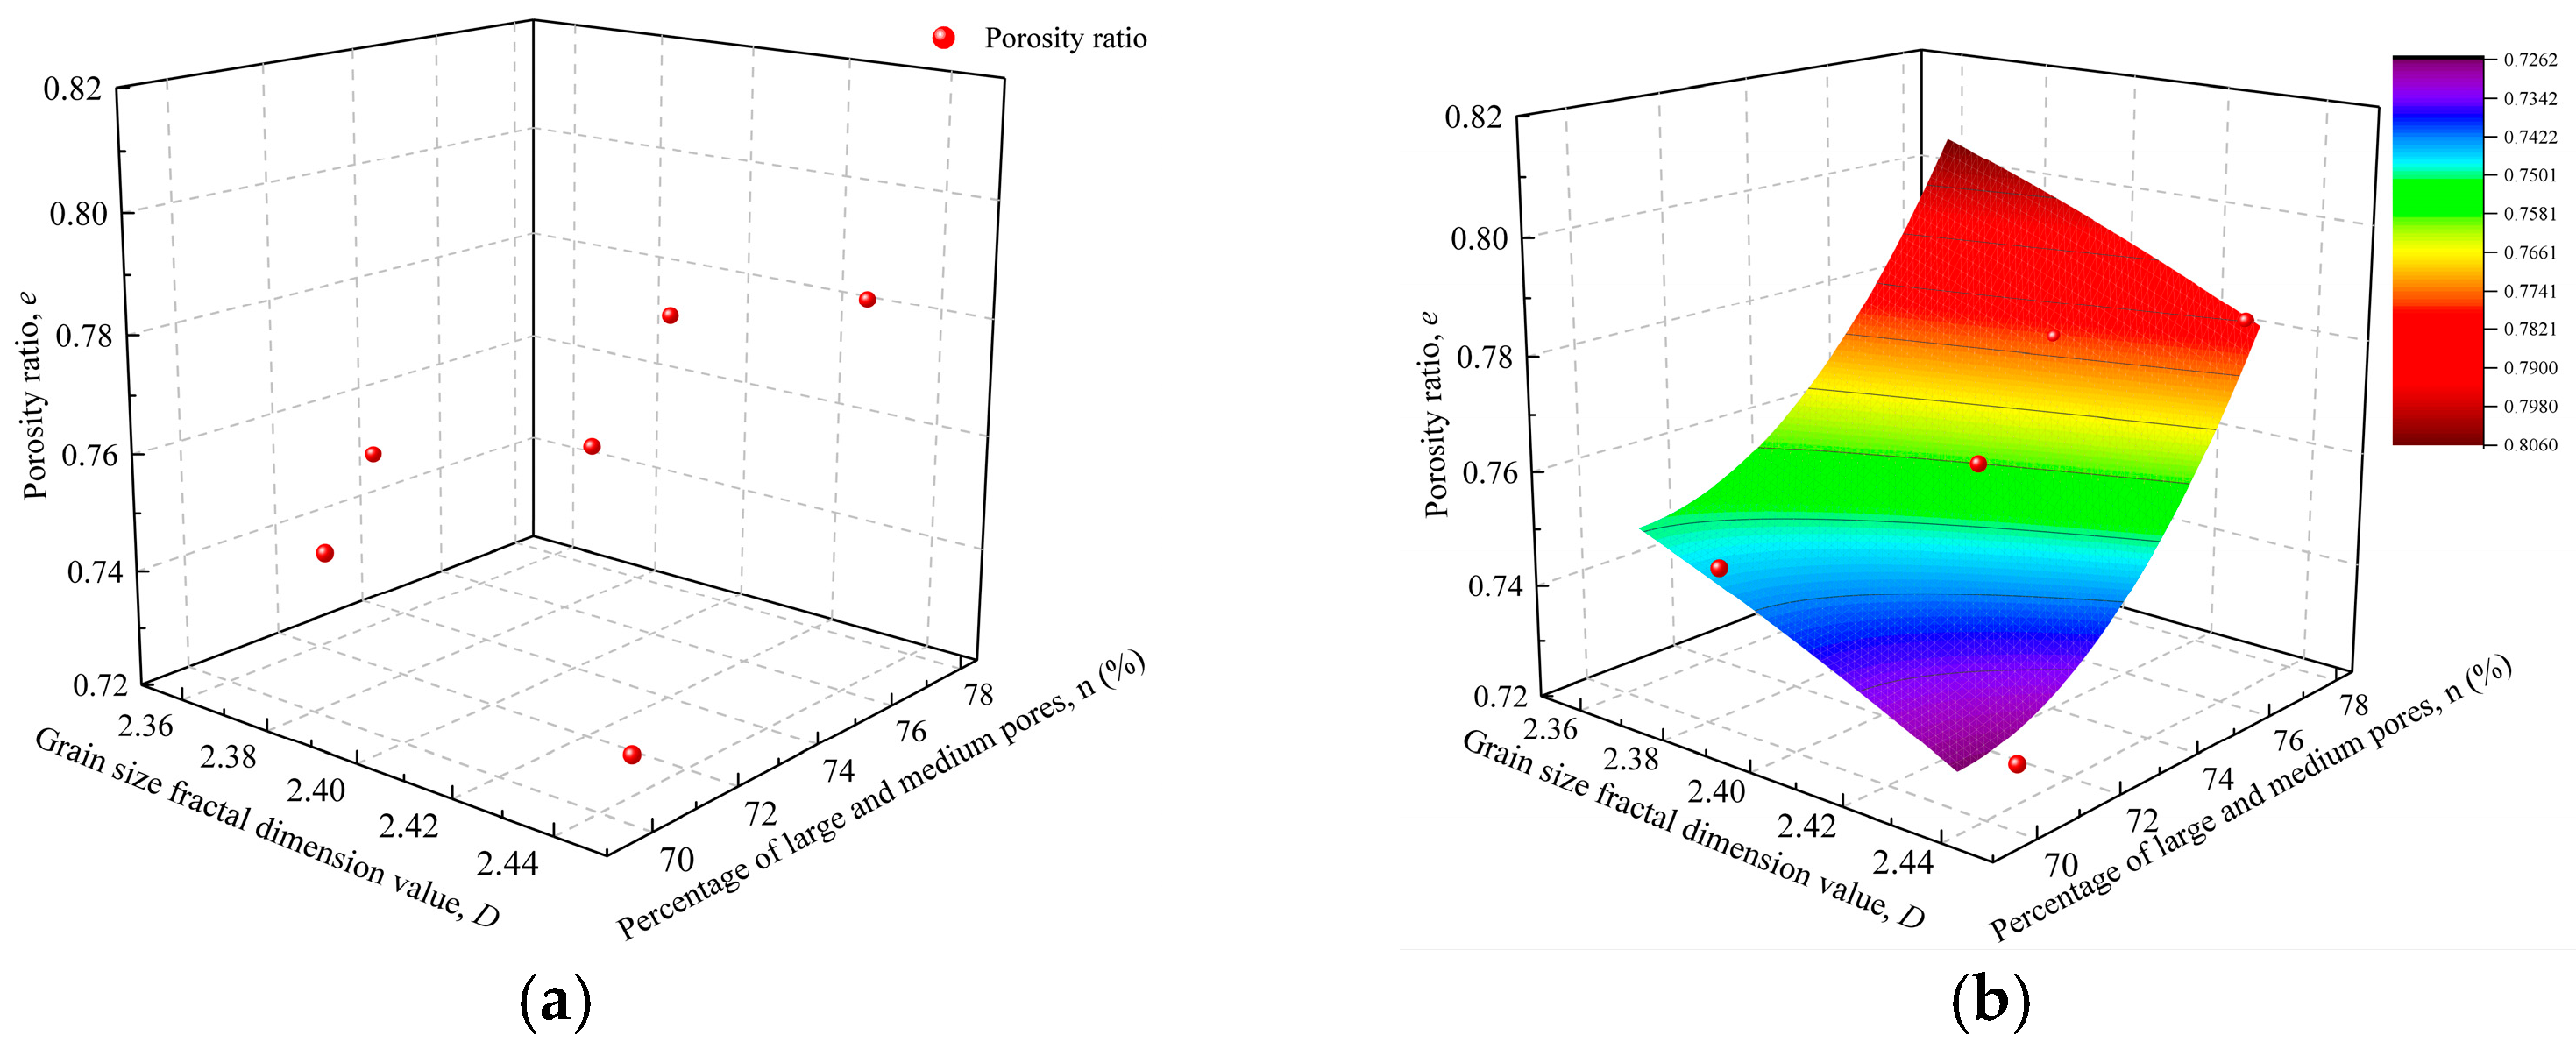
The nonlinear relationship model between the porosity ratio, the percentage of big and medium pores, and the particle size dimension is displayed in Figure 12. The fitting factor R02 is 0.91464, and the quantitative relationship equation is
e = 0.87821 D 2 + 3.86703 D + 0.0009178 n 2 0.1283 n + 1
A “curved and angular” shape is presented by the three-dimensional surface model of loess with D, n, and e. With an emphasis on the Z-axis, the model’s color scale changes from purple to red as e rises, suggesting a slow decline in the values of D. e shows a pattern of initially rapidly reducing and then progressively declining as n gradually declines. This is in accordance with engineering practice and the change pattern shown in Figure 4. Combining the expression of Formula (12), taking the linear influence dominated by D as an example, the D value characterizes the complexity and irregularity of soil particle size distribution. The coefficient of the D2 term is negative, while the coefficient of the D term is positive, indicating a nonlinear relationship of e increasing first and then decreasing with the increase in D (parabolic curve with downward opening). The initial rise is the result of a higher D value, which indicates a higher fine particle content. These fine particles support the skeleton to a certain extent, forming more small pores, resulting in an increase in the total porosity ratio. The latter decrease may be because when D increases to a certain extent (well graded), fine particles fill the pores between large particles, making the particle arrangement more compact and significantly reducing the porosity. This reflects the positive impact of particle size distribution optimization on compaction effectiveness.
The nonlinear relationship model between the collapsibility coefficient, the percentage of big and medium-sized pores, and the percentage of clay mineral content is displayed in Figure 13. The fitting factor R02 is 0.87378, and the quantitative relationship equation is:
δ s = 0.01864 C 2 0.91567 C 0.0019 n 2 + 0.27943 n + 1
A “saddle shape” is depicted in the three-dimensional surface model of loess clay with C, n, and e. With an emphasis on the Z-axis, the model’s color scale changes from purple to red as δs rises, signifying a slow decline in the amount of clay minerals. δs has a trend of initially growing and then dropping when n gradually declines. This is in accordance with engineering practice and is consistent with the fluctuation pattern in Figure 6. Taking the non-linear influence dominated by C as an example, combined with the expression of Formula (13), the C value reflects the bonding ability of the soil. The coefficient of the C2 term is positive, while the coefficient of the C term is negative, displaying a nonlinear relationship in which, as C grows, δs first falls and then rises. (parabolic curve with an upward opening). The initial reduction is the dominant mechanism, among which clay minerals (such as montmorillonite and illite) are the main sources of cement hydration products and natural binders. The connecting force between particles is greatly increased by the rise in their content, forming a stable agglomeration structure, and greatly suppressing the collapse deformation. The potential increase in the later stage may mean that when C exceeds a certain threshold, the hydrophilic effect of water absorption, expansion, and softening begins to emerge, weakening the structural strength and, to some extent, offsetting the positive effect of cementation.
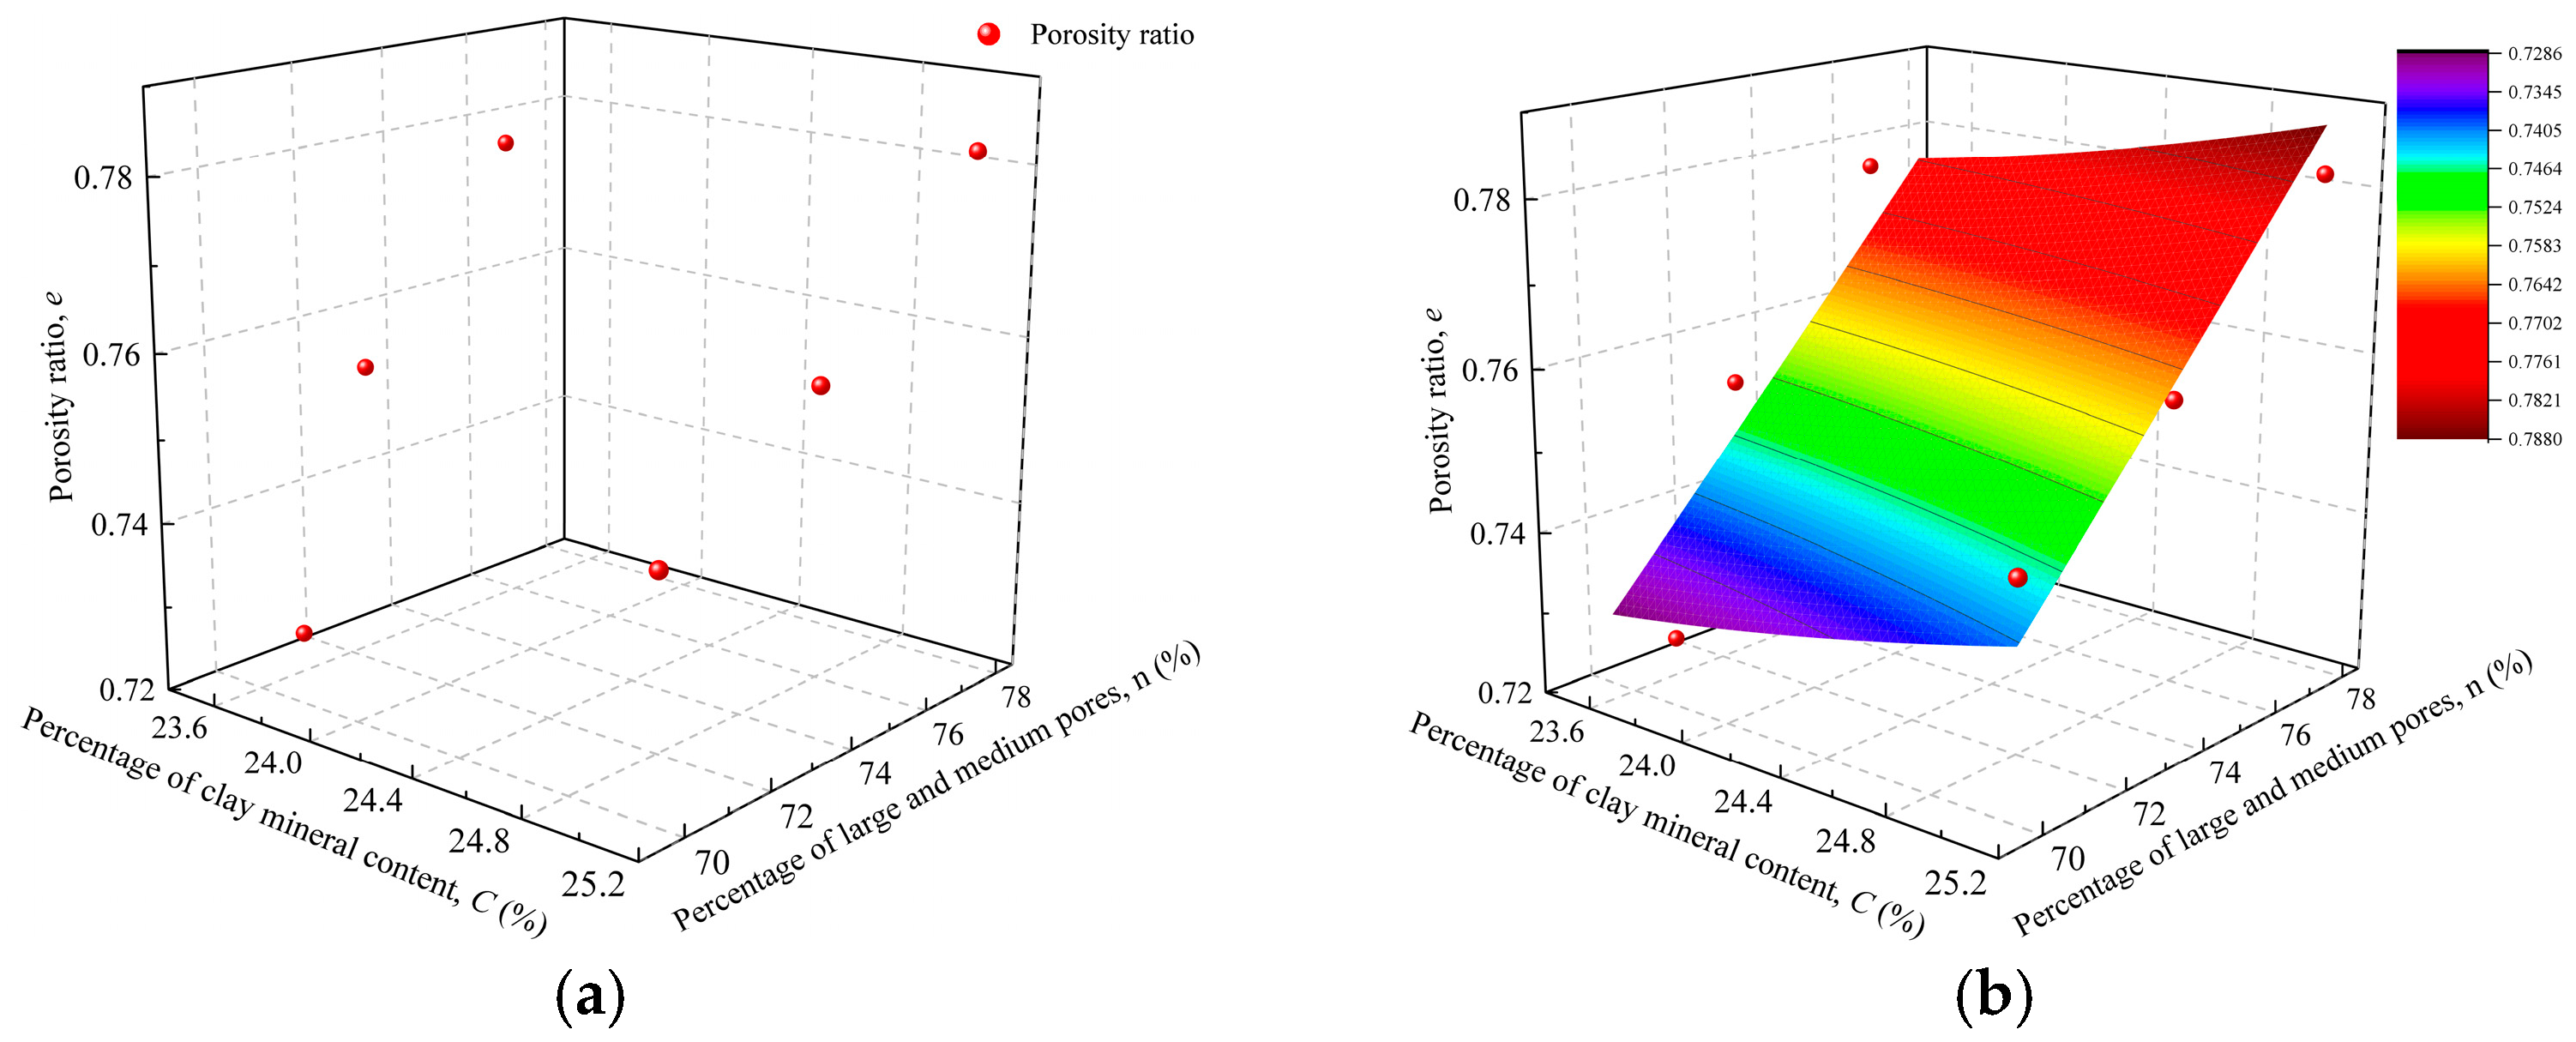
The nonlinear relationship model between the porosity ratio, the percentage of big and medium pores, and the percentage of clay mineral content is displayed in Figure 14. The fitting factor R02 is 0.81658, and the quantitative relationship equation is
e = 0.00134 C 2 0.0578 C + 0.0000163 n 2 + 0.00383 n + 1
A “curved edge shape” is displayed by the three-dimensional surface model of loess clay with C, n, and e. With an emphasis on the Z-axis, the model’s color scale changes from purple to red as e rises, signifying a slow rise in C. e shows a pattern of initially rapidly reducing and then progressively decreasing as n gradually declines. This is in accordance with engineering practice and the change pattern shown in Figure 4. Taking the non-linear influence dominated by C as an example, combined with the expression of Formula (14), the C value reflects the bonding ability of the soil. The coefficient of C2 is positive and the coefficient of C is negative, indicating that e has a modest trend of initially declining and then rising with the amount of C, but the overall trend is dominated by a linear decrease. Reduction is the dominant mechanism, among which C (such as montmorillonite and illite) are the main source of hydration products. Their cementation can fill some gaps, enclose and unite soil particles, and increase the density of the structure, all of which reduce porosity. A weak quadratic term may indicate that at high concentrations, the declining tendency of e may be slightly inhibited by the volume impact or the expansion of cementitious materials’ water absorption.
Formula (15) is a nonlinear relationship model between δs of various structured loess and D, n, and C. Formula (16) is a nonlinear relationship model between e and D, n, and C. These can be obtained by combining Formulas (11) and (13), as well as Formulas (12) and (14). δs and e of structural loess are found to be correlated with n, C, and D.
δ s = 0.56591 D 2 2.78865 D + 0.00932 C 2 0.45784 C 0.00150 n 2 + 0.21999 n + 1
e = 0.43911 D 2 + 1.93352 D + 0.00067 C 2 0.02890 C + 0.00047 n 2 0.06224 n + 1

3.3.3. Feasibility Verification of the Computational Model

This study establishes a quantitative model between the macroscopic deformation indicators of artificial structural loess (δs, e) and the microscopic structural parameters (D, C, and n), which profoundly reveals the macro–micro intrinsic mechanism of loess deformation behavior. The above model indicates that the macroscopic mechanical behavior of loess is not determined by a single microscopic factor, but rather the result of the coupling effect of particle distribution, cementation, and pore structure. The e model describes the state characteristics of loess under stress, while the δs model predicts the behavior response of soil under immersion in water. The two are closely coupled by sharing the three microscopic state variables D, C, and n, together describing how the evolution of the “particle cementation pore” system controls the macroscopic properties of loess. Any changes in internal or external factors will first cause changes in microstructural parameters, which in turn synchronously affect pore state and collapsibility.
The model’s dependability was then confirmed by comparing the measured and projected values. The engineering permitted error is met by the relative difference between the actual experimental values and the projected values of the macroscopic deformation indicators (e and δs), as indicated in Table 5. With a coefficient of determination (R2) of 0.893, the void ratio model specifically demonstrates strong predictive potential, accounting for 89.3% of the variance in the experimental data. The model’s high accuracy is further supported by the MAE of 0.0062 and the RMSE of 0.0087, both of which have errors that are well within allowable engineering bounds. Similarly, the collapsibility coefficient model achieves R2 = 0.746, indicating that 74.6% of the variance is captured, which is satisfactory given the complex water-induced structural degradation mechanisms influencing collapsibility. The MAE and RMSE values are 0.0051 and 0.0073, respectively, both of which meet the evaluation requirements for collapsible loess in engineering, indicating the practicality of the model in predicting the collapsible behavior of loess. These findings show that both nonlinear models are applicable and empirically validated, thereby affirming the correctness of their theoretical foundations and mathematical formulations.
This model system provides a theoretical tool for achieving from micro design to macro performance prediction. By precisely controlling micro parameters (such as increasing C, optimizing D, and reducing n), high-performance artificial structural loess with low porosity and low collapsibility can be directionally prepared. This provides crucial guidance for catastrophe prevention and engineering construction in loess locations.

4. Conclusions

This study employed an integrated experimental methodology utilizing artificially structured loess samples from Xi’an, China. A series of consolidation and collapsibility tests were conducted, complemented by particle size analysis, XRD, and MIP, to quantitatively assess deformation behavior and structural evolution under varying moisture and cementation conditions. Macro–micro influence mechanisms were summarized, and predictive models for void ratio and collapsibility coefficient were developed and validated. The following are the primary conclusions:
1.
The compressibility and collapsibility of artificial structured loess are governed by cement content and moisture conditions. Increased moisture reduces the porosity ratio but elevates compressibility due to the disintegration of cementitious bonds and the redistribution of fine particles. In contrast, higher cement content enhances void ratio and structural strength through improved particle bonding. The transition from point-to-surface contacts among particles, induced by cementation, reduces compressibility during consolidation and suppresses post-immersion collapse. Under high-moisture conditions, pre-filled pores further dimmish the collapse potential by facilitating particle rearrangement during compression.
2.
Microstructural analyses reveal that cementation fundamentally alters the mechanical behavior of loess through multiple mechanisms. Particle size analysis indicates that cement encapsulation enhances interparticle bonding and promotes gradation refinement, leading to the formation of a densified skeletal structure that improves deformation resistance. XRD results demonstrate that hydration generates cementitious materials, increasing clay mineral content to 29.5% and producing secondary calcite that effectively blocks micropores. Concurrent consumption of quartz contributes to particle refinement and reduced skeletal stiffness. MIP data confirm that applied loads cause structural yielding characterized by the collapse of large pores into smaller classes. While cement bonding strengthens the matrix and suppresses large-pore formation, salt crystallization creates weakly bonded medium–large pores susceptible to brittle collapse under pressure.
3.
Pearson correlation analysis shows the esopore volume ratio controls collapsibility (Pearson |r| > 0.96), while increased porosity raises macropore proportion and exacerbates compressibility. Small-pore variations indirectly regulate deformation by altering water migration paths.
4.
A three-dimensional nonlinear model was developed and validated, comprising a porosity ratio model and a collapsibility coefficient model. The model predictions demonstrate good agreement with experimental results, with the porosity ratio model yielding an R2 value of 0.893 and the collapsibility model achieving an R2 value of 0.746. These results indicate that the model can serve as a quantitative analytical tool for engineering deformation assessment and disaster prevention in loess regions.
5.
This study establishes a novel quantitative framework correlating microstructural evolution with macroscopic deformation in artificially structured loess, providing a reliable approach for deformation prediction under controlled cementation and moisture conditions. However, the research is limited to controlled laboratory conditions and static loading, without incorporating environmental cyclic processes such as wetting–drying or freeze–thaw actions. Future work should focus on validating the model under field conditions, extending it to incorporate coupled thermo-hydro-mechanical loading paths, and accounting for temporal changes in microstructure to enhance long-term predictive capability.

Author Contributions

Conceptualization, Y.Z. and Z.L.; methodology, P.G. and Y.Z.; writing—original draft preparation, C.Z. and H.Z.; writing—review and editing, X.F. and C.Z.; funding acquisition, Y.Z. All authors have read and agreed to the published version of the manuscript.

Funding

This study was supported by the Shaanxi Provincial Department of Education Service Local Special Research Program Project (22JE018, 23JE018, 23JE019), the Open Research Fund of the Yangtze River Academy of Sciences (CKWV20231170/KY), and the Young Talent Fund of Association for Science and Technology in Shaanxi (20220719).

Institutional Review Board Statement

Not applicable.

Informed Consent Statement

Not applicable.

Data Availability Statement

Data are contained within the article.

Conflicts of Interest

Authors Yao Zhang, Zufeng Li and Xinyu Fan are employed by the Northwest Engineering Corporation Limited. The remaining authors declare that the research was conducted in the absence of any commercial or financial relationships that could be construed as a potential conflict of interest.

References

  1. Yao, C.; Zhang, Q.; Wang, C.; Ren, J.; Li, H.; Wang, H.; Wu, F. Response of sediment transport capacity to soil properties and hydraulic parameters in the typical agricultural regions of the Loess Plateau. Sci. Total Environ. 2023, 879, 163090. [Google Scholar] [CrossRef] [PubMed]
  2. Crouvi, O.; Sun, J.; Rousseau, D.; Muhs, D.R.; Zárate, M.A.; Marx, S. Loess records. In Encyclopedia of Quaternary Science, 3rd ed.; Elsevier: Amsterdam, The Netherlands, 2025; Volume 3, pp. 505–528. [Google Scholar] [CrossRef]
  3. Wang, L.; Liu, Q.; Li, X.; Qin, B.; Hong, B.; Shi, J. Effect of nanosilica on the hydrological properties of loess and the microscopic mechanism. Sci. Rep. 2024, 14, 3420. [Google Scholar] [CrossRef] [PubMed]
  4. Li, G.; Yan, Z.; Song, Y.; Fitzsimmons, K.E.; Yi, S.; Kang, S.; E, C.; Stevens, T.; Lai, Z.; Dave, A.K.; et al. A comprehensive dataset of luminescence chronologies and environmental proxy indices of loess-paleosol deposits across Asia. npj Clim. Atmos. Sci. 2024, 7, 7. [Google Scholar] [CrossRef]
  5. Li, Y.; Wang, Y.; Aydin, A. Loess structure: Evolution and a scale-based classification. Earth-Sci. Rev. 2023, 249, 104665. [Google Scholar] [CrossRef]
  6. Schlüter, S.; Sammartino, S.; Koestel, J. Exploring the relationship between soil structure and soil functions via pore-scale imaging. Geoderma 2020, 370, 114370. [Google Scholar] [CrossRef]
  7. Cui, C.; Liang, Z.; Xu, C.; Xin, Y.; Wang, B. Analytical solution for horizontal vibration of end-bearing single pile in radially heterogeneous saturated soil. Appl. Math. Model. 2022, 116, 65–83. [Google Scholar] [CrossRef]
  8. Yang, J.; Li, X.; Li, L.; Jing, Z.; Wang, W. Formation mechanism of metastable internal support microstructure in Malan Loess and its implications for collapsibility. Eng. Geol. 2024, 346, 107892. [Google Scholar] [CrossRef]
  9. Filho, H.C.S.; Venson, G.I.; Centofante, R.; Festugato, L. Discussion of “Analysis and optimization of tensile strength for LOESs stabilized by calcium carbide residue”. J. Mater. Civ. Eng. 2024, 37, 06024004. [Google Scholar] [CrossRef]
  10. Zhang, J.; Jia, M.; Jiang, T.; Kato, S.; Sun, D.; Gao, Y.; Yang, Z. Dynamic deformation characteristics and microscopic analysis of xanthan gum-treated silty soil during wetting process. J. Rock Mech. Geotech. Eng. 2024, 17, 1149–1162. [Google Scholar] [CrossRef]
  11. Pei, Q.Q.; Wang, X.D.; Zhao, L.Y.; Zhang, B.; Guo, Q.L. A sticky rice paste preparation method for reinforcing earthen heritage sites. J. Cult. Herit. 2020, 44, 98–109. [Google Scholar] [CrossRef]
  12. Yang, X.; Hu, Z.; Li, H.; Wang, Y.; Zhang, Y.; She, H.; Wang, X. Effect of freeze-thaw cycles on mechanical properties and microstructure of artificially prepared site soil. Constr. Build. Mater. 2025, 485, 141878. [Google Scholar] [CrossRef]
  13. Xi, Y.; Sun, M.; Hua, X.; Zhang, Y.; Yuan, Y. Study on the dynamic Deformation Characteristics of artificial Structural Loess. Buildings 2025, 15, 1198. [Google Scholar] [CrossRef]
  14. Yu, H.; Liu, E. Cyclic properties of artificially cemented Gravel-Silty clay mixed soils. Exp. Tech. 2020, 44, 573–589. [Google Scholar] [CrossRef]
  15. Yan, X.; Xu, Q.; Deng, M.; Sun, Y.; He, X.; Dong, S.; Ma, L.; Hai, C.; Zhou, Y. Investigation on the solidification effect and mechanism of loess utilizing magnesium oxysulfate cement as a curing agent. Sci. Total Environ. 2024, 951, 175214. [Google Scholar] [CrossRef]
  16. Guo, S.; Zhang, H.; Bi, Y.; Zhang, J. Mechanical experiment and microstructural characteristics of water glass solidified loess. Bull. Eng. Geol. Environ. 2024, 83, 411. [Google Scholar] [CrossRef]
  17. Sun, Y.; Liu, E.; Wu, J.; Zhang, S. Mechanical Properties and Constitutive Model for Artificially Structured Soils under Undrained Conditions. Mathematics 2024, 12, 2226. [Google Scholar] [CrossRef]
  18. Zhang, Y.; Song, Z.; Chen, H.; Ruan, L.; He, S. Experimental study on collapsible and structural characteristics of artificially prepared loess material. Sci. Rep. 2023, 13, 4113. [Google Scholar] [CrossRef]
  19. Kong, B.; Yan, Y.; He, H.; Yu, J.; Zou, B.; Chen, Q. Strength and fractal characteristics of artificial Frozen–Thawed sandy soft soil. Fractal Fract. 2024, 8, 393. [Google Scholar] [CrossRef]
  20. Konstantinou, C.; Biscontin, G.; Jiang, N.; Soga, K. Application of microbially induced carbonate precipitation to form bio-cemented artificial sandstone. J. Rock Mech. Geotech. Eng. 2021, 13, 579–592. [Google Scholar] [CrossRef]
  21. Chen, H.; Li, H.; Jiang, Y.; Yu, Q.; Yao, M.; Shan, W. Feasibility study on artificial preparation of structured loess. Geosci. Lett. 2022, 9, 21. [Google Scholar] [CrossRef]
  22. Liu, W.; Bai, R.; Sun, X.; Yang, F.; Zhai, W.; Su, X. Rainfall- and Irrigation-Induced Landslide Mechanisms in Loess Slopes: An Experimental Investigation in Lanzhou, China. Atmosphere 2024, 15, 162. [Google Scholar] [CrossRef]
  23. Bai, R.; Lai, Y.; Zhang, M.; Jiang, H. Investigating the Thermo-Hydro-Mechanical Behavior of Loess Subjected to Freeze–Thaw Cycles. Acta Geotech. 2024, 19, 6305–6318. [Google Scholar] [CrossRef]
  24. Huang, X.; Horn, R.; Ren, T. Soil structure effects on deformation, pore water pressure, and consequences for air permeability during compaction and subsequent shearing. Geoderma 2021, 406, 115452. [Google Scholar] [CrossRef]
  25. Yu, Q.; Yan, X.; Wang, Q.; Yang, T.; Kong, Y.; Huang, X.; Mehmood, Q. X-ray computed tomography-based evaluation of the physical properties and compressibility of soil in a reclamation area. Geoderma 2020, 375, 114524. [Google Scholar] [CrossRef]
  26. Wang, H.; Cui, Y.; Zhang, F.; Liu, J. Effect of grain breakage on the compressibility of soils. Acta Geotech. 2021, 17, 769–778. [Google Scholar] [CrossRef]
  27. Jia, R.; Lei, H.; Li, K. Compressibility and Microstructure Evolution of Different Reconstituted Clays during 1D Compression. Int. J. Geomech. 2020, 20, 04020181. [Google Scholar] [CrossRef]
  28. Wu, Z.; Zhang, D.; Wang, S.; Liang, C.; Zhao, D. Dynamic-response characteristics and deformation evolution of loess slopes under seismic loads. Eng. Geol. 2020, 267, 105507. [Google Scholar] [CrossRef]
  29. Yang, J.; Niu, X.; Guo, Q.; Wen, Z.; Cao, H. Strength and deformation characteristics of compacted loess with different water content and compaction energy. Results Eng. 2023, 20, 101637. [Google Scholar] [CrossRef]
  30. Cai, G.; Han, B.; Wei, J.; Yang, R.; Li, J.; Cui, Y. Wetting-induced deformation characteristics of unsaturated compacted sandy loess. Acta Geotech. 2023, 19, 177–195. [Google Scholar] [CrossRef]
  31. Xie, D.Y.; Qi, J.L.; Zhang, Z.Z. A constitutive law considering soil structural properties. China Civ. Eng. J. 2000, 33, 35–41. [Google Scholar] [CrossRef]
  32. Li, X.; Sun, J.; Ren, H.; Lu, T.; Ren, Y.; Pang, T. The effect of particle size distribution and shape on the microscopic behaviour of loess via the DEM. Environ. Earth Sci. 2022, 81, 294. [Google Scholar] [CrossRef]
  33. Luo, F.; Zhang, G.; Yao, Y. Macro-micro tests of cohesive soil under varied normal and shear stresses subjected to drying-wetting cycles. J. Rock Mech. Geotech. Eng. 2024, 17, 5893–5905. [Google Scholar] [CrossRef]
  34. GB/T 50123-2019; Standard for Geotechnical Testing Method. Construction Ministry of PRC: Beijing, China, 2019.
  35. Li, Y.; Liu, E.; He, M. Mechanical properties of artificially structured soil and Binary-medium-based constitutive model under undrained conditions. PLoS ONE 2024, 19, e0296441. [Google Scholar] [CrossRef] [PubMed]
  36. Qin, B.; Li, X.; Wang, L.; Gao, R.; Chai, H. Model interpretation and microscopic characteristics of collapsibility evolution of compacted loess under dry-wet cycles. CATENA 2024, 246, 108413. [Google Scholar] [CrossRef]
  37. Liu, Q.; Xie, W.; Yang, H.; Yuan, K.; Zhang, S.; Li, X.; Qu, P.; Wu, Z.; Zhou, J.; Gao, X. Intrinsic Mechanisms of Differences in Wetting-Induced Deformation of Soils on Chinese Loess Plateau: Insights into Land Stability and Sustainable Management. Land 2025, 14, 312. [Google Scholar] [CrossRef]
  38. Shen, J.; Wang, Q.; Chen, Y.; Zhang, X.; Han, Y.; Liu, Y. Experimental investigation into the salinity effect on the physicomechanical properties of carbonate saline soil. J. Rock Mech. Geotech. Eng. 2023, 16, 1883–1895. [Google Scholar] [CrossRef]
  39. Zhao, X.; Cui, Y.; Zhang, R.; Tian, G.; Satyanaga, A.; Zhai, Q. Experimental investigation of the collapsibility of loess subjected to water invasion. Bull. Eng. Geol. Environ. 2023, 83, 33. [Google Scholar] [CrossRef]
  40. Wei, Y.; Fan, W.; Yu, B.; Deng, L.; Wei, T. Characterization and evolution of three-dimensional microstructure of Malan loess. CATENA 2020, 192, 104585. [Google Scholar] [CrossRef]
  41. Basham, M.R.; Cerato, A.B.; Tabet, W.E. Using fractal geometry theory to quantify pore structure evolution and particle morphology of stabilized kaolinite. J. Mater. Civ. Eng. 2024, 36, 04024247. [Google Scholar] [CrossRef]
  42. Yuan, K.; Wang, H.; Ni, W.; Ren, S.; Guo, Y. New insights into the dynamic changes of loess collapsibility under climate-induced wetting-drying cycles: A case study of the loess Plateau of China. CATENA 2025, 250, 108782. [Google Scholar] [CrossRef]
  43. Lavagna, L.; Nisticò, R. An Insight into the Chemistry of Cement—A Review. Appl. Sci. 2022, 13, 203. [Google Scholar] [CrossRef]
  44. Yan, R.; Zhang, L.; Zhang, J.; Peng, J.; Chen, L.; Zhang, Y. Pore characteristics and micro-structure change of undisturbed loess induced by acid corrosion. Eng. Geol. 2022, 310, 106880. [Google Scholar] [CrossRef]
  45. Yuan, K.; Liu, K.; Yi, G.; Yang, B. Mechanical properties and evolution of microstructure of cement stabilized loess. J. Renew. Mater. 2022, 10, 3611–3627. [Google Scholar] [CrossRef]
  46. Wu, J.; Liu, L.; Deng, Y.; Zhang, G.; Zhou, A.; Wang, Q. Distinguishing the effects of cementation versus density on the mechanical behavior of cement-based stabilized clays. Constr. Build. Mater. 2020, 271, 121571. [Google Scholar] [CrossRef]
  47. Zhao, Y.; Wang, Q.; Yuan, M.; Chen, X.; Xiao, Z.; Hao, X.; Zhang, J.; Tang, Q. The Effect of MICP on Physical and Mechanical Properties of Silt with Different Fine Particle Content and Pore Ratio. Appl. Sci. 2021, 12, 139. [Google Scholar] [CrossRef]
  48. Wei, Y.; Yao, Z.; Chong, X.; Zhang, J.; Zhang, J. Microstructure of unsaturated loess and its influence on strength characteristics. Sci. Rep. 2022, 12, 1502. [Google Scholar] [CrossRef]
  49. Zhang, L.; Yan, R.; Peng, J.; Shen, Y.; Zhang, J.; Zhang, Y. Microstructure damage characteristics and its mechanism of undisturbed loess suffering to weak acid leaching. Bull. Eng. Geol. Environ. 2023, 82, 71. [Google Scholar] [CrossRef]
  50. Feng, P.; Cao, P.; Ren, S.; Ren, J.; Dong, Y.; Wu, G.; Tang, R. The mechanical and hydrochemical properties of cemented calcareous soil under long-term soaking. Sci. Rep. 2024, 14, 24532. [Google Scholar] [CrossRef]
  51. Ulusoy, U. A review of particle shape effects on material properties for various engineering applications: From macro to nanoscale. Minerals 2023, 13, 91. [Google Scholar] [CrossRef]
  52. He, J.; Li, T.; Rui, Y. Discrete element method analyses of bond degradation evolutions for cemented soils. Fractal and Fractional 2024, 8, 119. [Google Scholar] [CrossRef]
  53. Li, Z.; Qi, Z.; Qi, S.; Zhang, L.; Hou, X. Microstructural changes and micro–macro-relationships of an intact, compacted and remolded loess for land-creation project from the Loess Plateau. Environ. Earth Sci. 2021, 80, 593. [Google Scholar] [CrossRef]
  54. Ying, Z.; Cui, Y.; Benahmed, N.; Duc, M. Salinity effect on the compaction behaviour, matric suction, stiffness and microstructure of a silty soil. J. Rock Mech. Geotech. Eng. 2021, 13, 855–863. [Google Scholar] [CrossRef]
  55. Yang, X.; Hu, Z.; Wang, Y.; Zhang, Y.; Wang, X.; Hou, B.; Wei, Y.; Liu, C. Mechanical properties and micro-mechanisms of geopolymer solidified salinized loess. Constr. Build. Mater. 2024, 455, 139211. [Google Scholar] [CrossRef]
  56. Ji, G.; Peng, X.; Wang, S.; Li, J.; Sun, K.; Chi, H. Influence of ground quartz sand finesses on the formation of poorly ordered calcium silicate hydrate prepared by dynamically hydrothermal synthesis. Case Stud. Constr. Mater. 2023, 20, e02746. [Google Scholar] [CrossRef]
  57. Ibrahim, M.A.; Jaafar, M.Z.; Yusof, M.A.M.; Shye, C.A.; Idris, A.K. Influence of size and surface charge on the adsorption behaviour of silicon dioxide nanoparticles on sand particles. Colloids Surf. A Physicochem. Eng. Asp. 2023, 674, 131943. [Google Scholar] [CrossRef]
  58. Ravindran, S.; Gratchev, I. Effect of Water Content on Apparent Cohesion of Soils from Landslide Sites. Geotechnics 2022, 2, 385–394. [Google Scholar] [CrossRef]
  59. Bunimovich, L.; Skums, P. Fractal networks: Topology, dimension, and complexity. Chaos Interdiscip. J. Nonlinear Sci. 2024, 34, 042101. [Google Scholar] [CrossRef] [PubMed]
  60. Datseris, G.; Kottlarz, I.; Braun, A.P.; Parlitz, U. Estimating fractal dimensions: A comparative review and open source implementations. Chaos Interdiscip. J. Nonlinear Sci. 2023, 33, 102101. [Google Scholar] [CrossRef]
Figure 1. Sample collection point.
Buildings 15 03714 g001
Figure 2. Grading curve of test samples.
Buildings 15 03714 g002
Figure 3. Flowchart of test scheme.
Buildings 15 03714 g003
Figure 4. e-lgp compression curves of loess with different structures: (a) c = 0.5%; (b) c = 1.0%; (c) c = 2.0%; (d) c = 4.0%; and (e) remolded soil.
Buildings 15 03714 g004
Figure 5. Relationship curve between compressibility index and water content: (a) compression coefficient; (b) compression modulus. (The dashed line represents the boundary between low and intermediate compressible soils.)
Buildings 15 03714 g005
Figure 6. δs-P compression curves of loess with different structures: (a) w = 8%; (b) w = 12%; (c) w = 16%; (d) w = 20%; (e) w = 24%; and (f) remolded soil. (The dashed lines represent the boundaries between different collapsibility grades.)
Buildings 15 03714 g006
Figure 7. Results of the particle size analysis test: (a) interval distribution curve of remolded soil; (b) particle size gradation curve of remolded soil; (c) interval distribution curve of C2.0; (d) particle size gradation curve of C2.0; (e) interval distribution curve of Y16.0; and (f) particle size gradation curve of Y16.0.
Buildings 15 03714 g007
Figure 8. XRD test results for the samples. (Note: B (remolded soil), C2.0 Y2.0 (cement 2% and salt 2%), and C4.0 Y2.0 (cement 4% and salt 2%).)
Buildings 15 03714 g008
Figure 9. Mercury intrusion porosimetry results: (a) 200 kPa pore size distribution curve; (b) 200 kPa pore volume distribution; (c) 400 kPa pore size distribution curve; (d) 400 kPa pore volume distribution; (e) 800 kPa pore size distribution curve; and (f) 800 kPa pore volume distribution. (Note: V(Mac) (macropore volume ratio), V(Mes) (mesopore volume ratio), V(Sma) (small pore volume ratio), and V(Mic) (micropore volume ratio).)
Buildings 15 03714 g009
Figure 10. Pearson correlation analysis between key factors: (a) C2.0 Y2.0; (b) C4.0 Y2.0; (c) C2.0 Y16.0.
Buildings 15 03714 g010
Figure 11. Three-dimensional models of particle size distribution, proportion of large and medium pores, and collapsibility coefficient of loess with different structural types: (a) 3D scatter plot of collapsibility coefficient; (b) 3D model of collapsibility coefficient.
Buildings 15 03714 g011
Figure 12. Three-dimensional models of particle size distribution, proportion of large and medium pores, and pore ratio of loess with different structural types: (a) 3D scatter plot of pore ratio; (b) 3D model of porosity ratio.
Buildings 15 03714 g012
Figure 13. Three-dimensional model of clay mineral content, proportion of large and medium pores, and collapsibility coefficient of loess with different structural types: (a) 3D scatter plot of collapsibility coefficient; (b) 3D model of collapsibility coefficient.
Buildings 15 03714 g013
Figure 14. Three-dimensional models of clay mineral content, proportion of large and medium pores, and pore ratio of loess with different structural types: (a) 3D scatter plot of pore ratio; (b) 3D model of porosity ratio.
Buildings 15 03714 g014
Table 1. Basic physical properties of the loess sample.
Specific Gravity
Gs
Natural Density
ρ (g/cm3)
Natural Water Content
w0 (%)
Dry Density
ρd (g/cm3)
Plasticity Limit wp (%)Liquid Limit wL (%)Natural Void Ratio
e0
2.691.7821.801.4621.0828.020.84
Table 2. Test scheme.
Test TypeResearch SubjectWater Content (%)Salt Content (%)Cement Content (%)Vertical Pressure (kPa)
ASLRL
Consolidation test8.00, 12.00, 16.00, 20.00, 24.002.000.50, 1.00, 2.00, 4.0012.5, 25.0, 50.0, 100.0, 200.0, 400.0, 800.0
Collapsibility test8.00, 12.00, 16.00, 20.00, 24.002.00, 4.00, 8.001.00, 2.00, 4.0012.5, 25.0, 50.0, 100.0, 200.0, 400.0, 800.0
Particle size analysis16.002.00, 16.002.00200.0, 400.0, 800.0
XRD16.002.002.00, 4.00400.0
MIP 16.002.00, 16.002.00, 4.00200.0, 400.0, 800.0
Note: ASL (artificial structural loess) and RL (remolded soil).
Table 3. Analysis of the mineral content of loess with different structures.
Sample NameQuartz (%)Potash Feldspar (%)Plagioclase (%)Calcite (%)Salt (%)Amphibolite (%)TCCM (%)
Remolded loess (B)42.402.2020.509.80/1.6023.50
Structural loess (C2.0 Y2.0)41.102.3017.2011.202.10/25.10
Structural loess (C4.0 Y2.0)38.502.5014.9012.302.30/29.50
Note: B (remolded soil), C2.0 Y2.0 (cement 2% and salt 2%), and C4.0 Y2.0 (cement 4% and salt 2%).
Table 4. Collapsibility coefficient, porosity ratio, and microstructure data of artificial structured loess under different conditions.
Load P (kPa)Void Ratio eCollapsibility Coefficient δsGranularity Fractal Dimension Value DProportion of Large and Medium-Sized Pores n (%)Proportion of Clay Minerals C (%)
2000.77660.03952.400076.3825.10
0.78200.04252.431077.6623.70
4000.75310.06152.364072.9625.10
0.76110.06852.406073.7123.70
8000.72260.04052.434071.4425.10
0.74780.04702.383070.0323.70
Table 5. Comparison table of experimental and predicted values of different structural loess collapsibility coefficients and porosity ratios.
Load P (kPa)Actual Measured ValuesFit Predicted ValuesAbsolute Error ΔRelative Error (%)
eδseδseδseδs
2000.76850.04950.76690.04890.00150.00050.211.12
0.77570.02600.78190.02860.00620.00260.8110.20
4000.73700.06700.73610.06400.00090.00290.124.45
0.75320.03500.75270.03980.00040.00480.0613.82
8000.70370.03950.69300.04280.01060.00331.518.45
0.71450.02500.73160.04140.01710.01642.4165.73
Note: The R2 of the pore ratio e fitting model is 0.8927, the MAE is 0.0062, and the RMSE is 0.0087; The R2 of the fitting model for the collapsible coefficient δ s is 0.7463, the MAE is 0.0051, and the RMSE is 0.0073; Absolute error Δ = |predicted value − measured value|; Relative error = |Δ/measured value| × 100%.
Disclaimer/Publisher’s Note: The statements, opinions and data contained in all publications are solely those of the individual author(s) and contributor(s) and not of MDPI and/or the editor(s). MDPI and/or the editor(s) disclaim responsibility for any injury to people or property resulting from any ideas, methods, instructions or products referred to in the content.