Article

Performance Evaluation of Electrochromic Windows in Cold-Region University Classrooms: A Multi-Scale Simulation Study

School of Art and Design, Xi’an University of Technology, Xi’an 710054, China
*
Author to whom correspondence should be addressed.
Buildings 2025, 15(20), 3712; https://doi.org/10.3390/buildings15203712
Submission received: 9 September 2025 / Revised: 2 October 2025 / Accepted: 6 October 2025 / Published: 15 October 2025
(This article belongs to the Section Building Energy, Physics, Environment, and Systems)

Abstract

Electrochromic windows (ECWs) are promising smart façade technologies that can enhance indoor comfort and reduce energy demands, yet their performance in university classrooms remains underexplored in cold regions. This study evaluates the applicability of ECWs in classrooms in Xi’an, a representative cold-climate city, through dynamic simulations of three classroom types. Three control strategies—based on outdoor temperature, illuminance, and solar radiation—were tested under different thresholds. The results show that compared with static windows, ECWs can increase the annual mean indoor temperature by up to 1.4 °C, extend thermal comfort time ratio by 4.5%, improve visual comfort duration by 6.3%, and reduce heating and cooling demands by 11.6 and 14.3 kWh/m2, respectively. These findings demonstrate both the feasibility and the differentiated benefits of ECWs in educational buildings, filling the research gap on their performance across different classroom types and offering practical guidance for sustainable classroom design and operation in cold climates.

1. Introduction

1.1. Motivation

Energy consumption and greenhouse gas emissions are the primary drivers of global climate change, with the building sector accounting for more than one-third of total global energy use [1]. In China, building energy consumption has been increasing rapidly, reaching 21.7% of the nation’s total energy use in 2018 and continuing to rise with the expansion of building stock [2]. Among the components of building energy use, the envelope—and windows in particular—plays a decisive role in shaping indoor thermal and daylighting conditions [3]. Previous studies have shown that window characteristics strongly affect both heating/cooling demands and daylighting performance [4,5,6]. Conventional glazing can provide daylight but often results in excessive solar heat gains and glare, thereby increasing cooling loads and reducing occupant comfort [7,8]. This problem is particularly critical in educational buildings [9]. Classrooms are the primary learning spaces where students spend much of their daily time; due to their large depth, multiple windows, high occupancy density, and long operating hours, classrooms have especially stringent requirements for thermal comfort, visual comfort, and energy performance [10,11,12]. Recent studies also emphasize that these requirements are more challenging to meet compared with other building types [13]. Nevertheless, most research and practice remain focused on office [14,15] and residential buildings [16,17,18], with relatively limited attention paid to the educational environment. Against this backdrop, smart window technologies have attracted increasing interest.
To address this gap in research, recent studies have begun to explore smart windows in classrooms. Xu et al. [19] proposed a multi-objective optimization framework for ECWs in Nanjing and found that optimized configurations could reduce annual total energy use by up to 254 kWh while increasing useful daylight illuminance by 65.4%. Similarly, a comparative analysis of a school building showed that electrochromic and thermochromic windows can improve thermal and visual comfort while reducing both energy consumption and pollutant emissions [20]. These studies demonstrate the potential of smart windows in educational settings, yet they primarily emphasize optimization methods or focus on warm and mixed climates. Building on these findings, ECWs are particularly notable because they can dynamically regulate two key parameters—visible transmittance (VT) and solar heat gain coefficient (SHGC)—which directly shape both energy performance and indoor comfort [21,22]. Several experimental and simulation studies have confirmed their ability to lower energy use and enhance comfort in different building types [23,24].
ECWs operate through ion intercalation and redox reactions, which alter light absorption and allow the dynamic regulation of visible and near-infrared transmittance [18,25]. This property enables ECWs to reduce solar heat gain and glare while maintaining daylight availability [26,27]. Yet, when transmittance decreases excessively, indoor illuminance may decrease, and reliance on artificial lighting can increase [28]. To balance these trade-offs, automated control strategies are required. Existing approaches are typically categorized as rule-based control—which relies on outdoor temperature, solar radiation, or illuminance [10,29]—and model-based predictive control—which incorporates forecasting and optimization and has exhibited substantial energy-saving potential (15–20% cooling reduction in commercial buildings) [30,31]. Importantly, the choice of control thresholds strongly influences ECW performance by determining heating/cooling demands, as well as thermal and visual comfort hours [32,33,34]. Recent studies further emphasize that threshold design is critical to annual comfort performance [35]. However, despite growing evidence from office and residential contexts, little is known about how threshold settings affect classrooms in cold climates, where large spans, multiple windows, and high occupancy render indoor environments especially sensitive to solar and thermal fluctuations [36,37].
Despite the progress in ECW research, several important gaps remain. First, the comparative performance of different control strategies is insufficiently understood, and no consensus exists on whether the outdoor temperature, illuminance, or incident solar radiation provides the most effective control. Second, the sensitivity of performance outcomes to threshold settings has not been systematically examined, particularly regarding their combined effects on heating/cooling demands, thermal comfort, and visual comfort. Third, research on educational buildings is still scarce, even though classrooms—with high density, long occupancy, and large window areas—are especially vulnerable to solar and thermal fluctuations.
Therefore, the problem this study addresses is the lack of systematic evidence on how ECWs perform across different control strategies and classroom types in cold-region educational buildings.
To address this problem, this study conducts dynamic simulations of typical university classrooms in Xi’an, systematically evaluating the combined effects of control strategies and threshold settings on thermal comfort, visual comfort, and heating/cooling energy use. By carrying out this study, we fill a critical research gap and provide evidence for supporting energy-efficient, comfort-oriented classroom design in cold climates.

1.2. Scientific Originality

First, while the existing literature has primarily focused on the application of electrochromic windows in office, commercial, and residential buildings, research on university classrooms remains scarce. This study helps by partially bridging this gap. Second, we introduce multiple control strategies based on outdoor temperatures, illu-minance, and incident solar radiation and systematically compare their performance under different threshold settings, thereby revealing the differentiated effects of each strategy on improving comfort and reducing energy consumption. Third, comparative simulations were conducted for three typical classroom sizes—large, medium, and small—demonstrating that spatial scale has a significant influence on the performance of electrochromic windows. Finally, this study proposes a comprehensive evaluation framework encompassing thermal comfort, visual comfort, and heating/cooling energy consumption, which provides a multidimensional assessment of the performance of electrochromic windows in cold-region university classrooms. Overall, this study not only extends the application scope of electrochromic windows to educational buildings but also provides new scientific evidence and methodological support for green design and energy optimization in cold-region university classrooms.

1.3. Targets of This Research

This research study aims to evaluate the impacts of ECWs on indoor thermal comfort, visual comfort, and energy performance in university classrooms located in Xi’an, a representative cold-region city. By applying dynamic simulation, we compare three control strategies—based on outdoor temperatures, illuminance, and incident solar radiation—under multiple threshold conditions. Furthermore, three typical classroom types (large, medium, and small) are analyzed to reveal scale-dependent effects on comfort enhancement and energy reduction. The ultimate goal is to identify optimal control approaches and provide practical insights for integrating ECWs into the sustainable design and operation of educational buildings in cold climates.

2. Methodology

To evaluate the applicability of electrochromic windows in cold regions, this study selected Xi’an as a representative city, adopted a specific type of electrochromic window as the research subject, and designed multiple control strategies with varying threshold conditions for comparative analysis. Xi’an was chosen not only because of its cold-region climate but also due to its large concentration of universities and the significant energy consumption of educational buildings, making it a representative case for cold-climate academic settings [38]. A typical university classroom [39] model was developed in Rhino [40] and Grasshopper [41], with building parameters determined according to relevant standards.
Three types of control strategies were implemented in the model based on outdoor temperatures, outdoor illuminance, and direct solar radiation on windows, each evaluated under different threshold levels. The electrochromic window in its fully transparent state (static window) was used as the baseline scenario. Energy simulation software was then employed to calculate key performance indicators, including heating and cooling energy use, annual average indoor temperatures, percentage of hours within thermal comfort, and percentage of hours within visual comfort.
Comparative analyses of the simulation results under different control strategies and thresholds were conducted to identify performance variations, determine the optimal strategy, and define the applicable range of its threshold values.

2.1. Study Building Specification

University educational buildings in China typically consist of 4–6 stories with a floor height of approximately 3.8 m, and the window-to-wall ratio is 0.4 [42]. Classrooms are usually arranged linearly along corridors and stacked vertically. To ensure both representativeness and simplicity, three typical classroom types were selected as case studies (Figure 1), representing different spatial scales. The three classroom types have the following geometric and functional characteristics: Type I (biggish terra classroom), 16.5 m × 11.7 m, typically used for large lectures with more than 100 students; Type II (biggish classroom), 12.0 m × 8.7 m, mainly used for regular courses with 50–70 students; Type III (smallish classroom), 7.2 m × 6.0 m, designed for seminars or small-group teaching, accommodating about 30 students. All classrooms were assumed to be equipped with desks, lighting, and air-conditioning systems, as well as large external windows to provide daylighting and natural ventilation.

2.2. Climatic Context of Xi’an

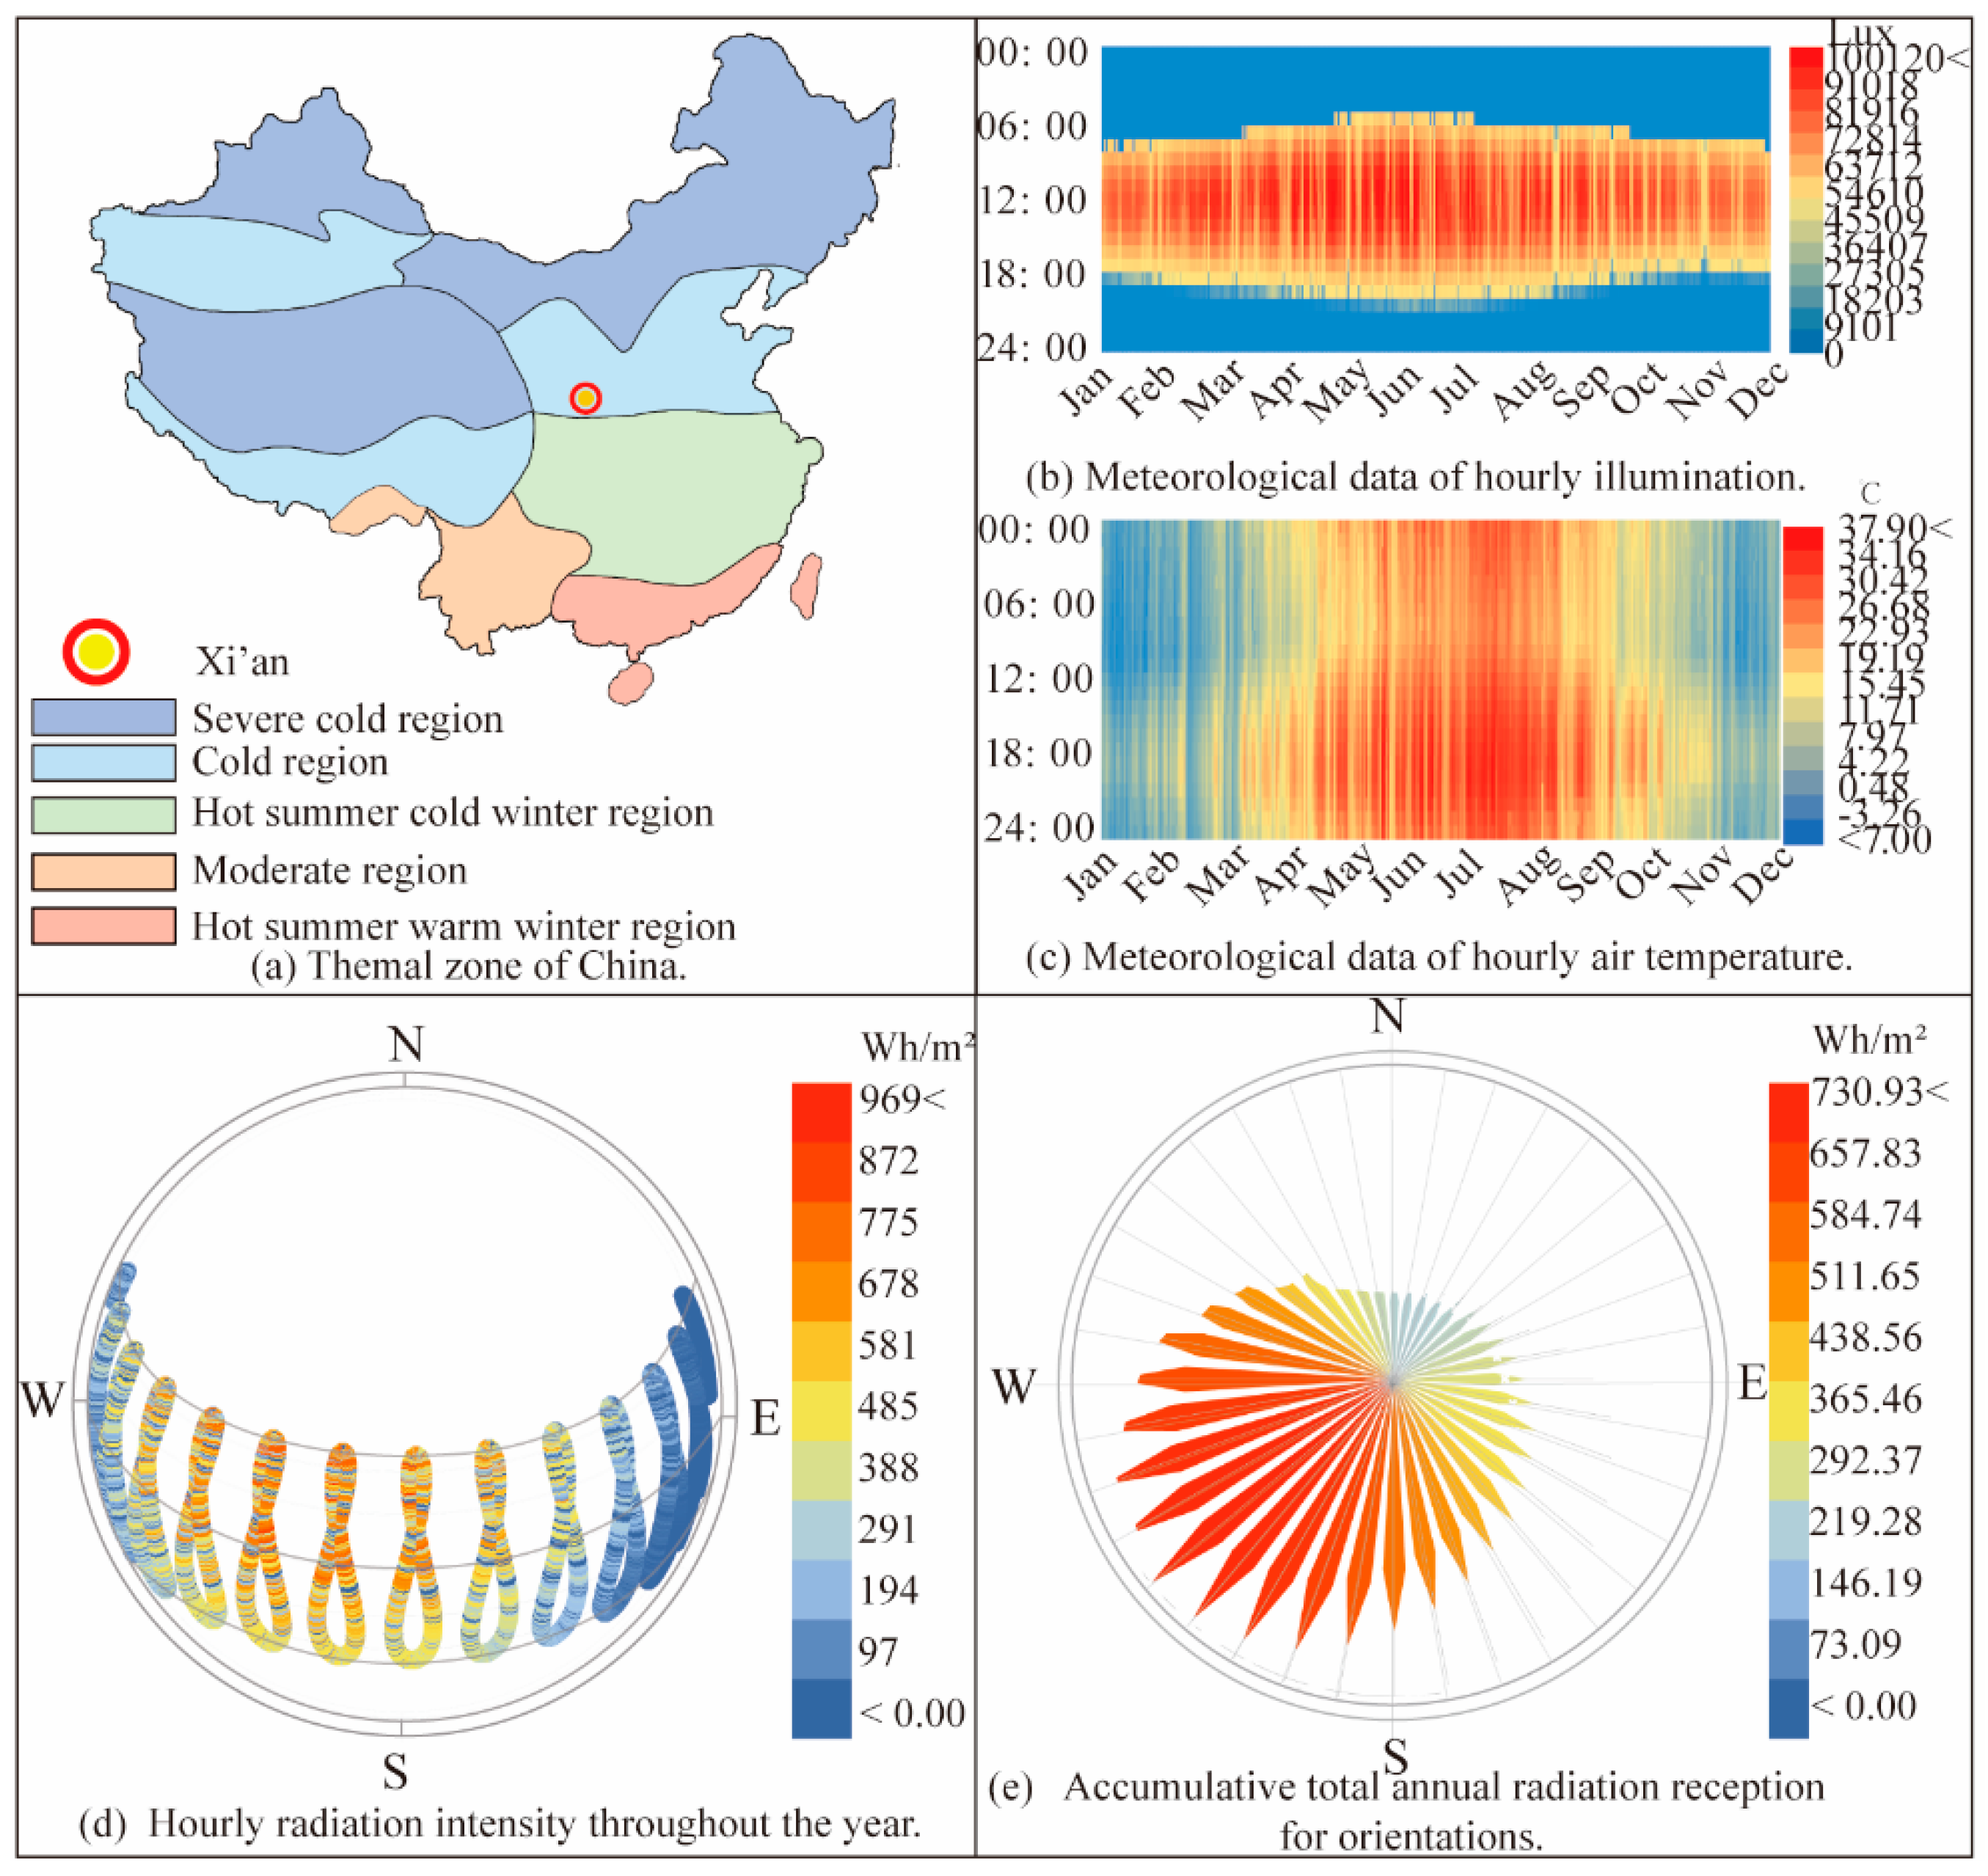
Xi’an is located in a cold region according to China’s building thermal zoning, characterized by cold and dry winters, hot summers, and abundant solar radiation (Figure 2a). The annual mean temperature is approximately 14.1 °C, with large seasonal variations: In July, daily maximum temperatures may reach 37 °C, while in January, daily minimum temperatures often drop below −5 °C (Figure 2c). The heating season typically extends from mid-November to mid-March, with substantial heating demands. In summer, cooling loads are high, particularly from June to August.
The hourly illuminance distribution (Figure 2b) indicates that Xi’an experiences high solar intensity from April to September, with midday irradiance often reaching 900–1000 W/m2. The annual cumulative radiation (Figure 2e) shows that south-facing façades receive more than 700 Wh/m2, while east- and west-facing façades also contribute significantly during morning and evening hours in summer. The city enjoys 2000–2200 sunshine hours per year, with a high proportion of sunny days in winter, creating favorable conditions for passive solar utilization.
The hourly radiation distribution (Figure 2d) further shows that in the winter, the low solar altitude allows south-facing windows to capture considerable direct solar gains, reducing heating demands. In the summer, however, the higher solar altitude broadens direct radiation coverage, thereby increasing the risks of overheating and glare. Under such climatic conditions, classrooms are prone to overheating and visual discomfort during summer, while in the winter, maximizing solar gains is essential to reduce heating loads. Adaptive glazing technologies such as electrochromic or thermochromic windows can dynamically modulate transmittance and SHGC: attenuating heat and glare under high-radiation conditions while enhancing daylighting and solar gains under low-radiation or cold conditions. This dynamic response provides a pathway for balancing thermal and visual comfort throughout the year and demonstrates considerable energy-saving potential in cold regions.

2.3. Performance Indicators

The performance of electrochromic windows was assessed using five key indicators, covering thermal comfort, visual comfort, indoor thermal environment, and energy consumption. These indicators and their corresponding evaluation methods are summarized in Table 1.

2.4. Control Strategies and Parameter Settings

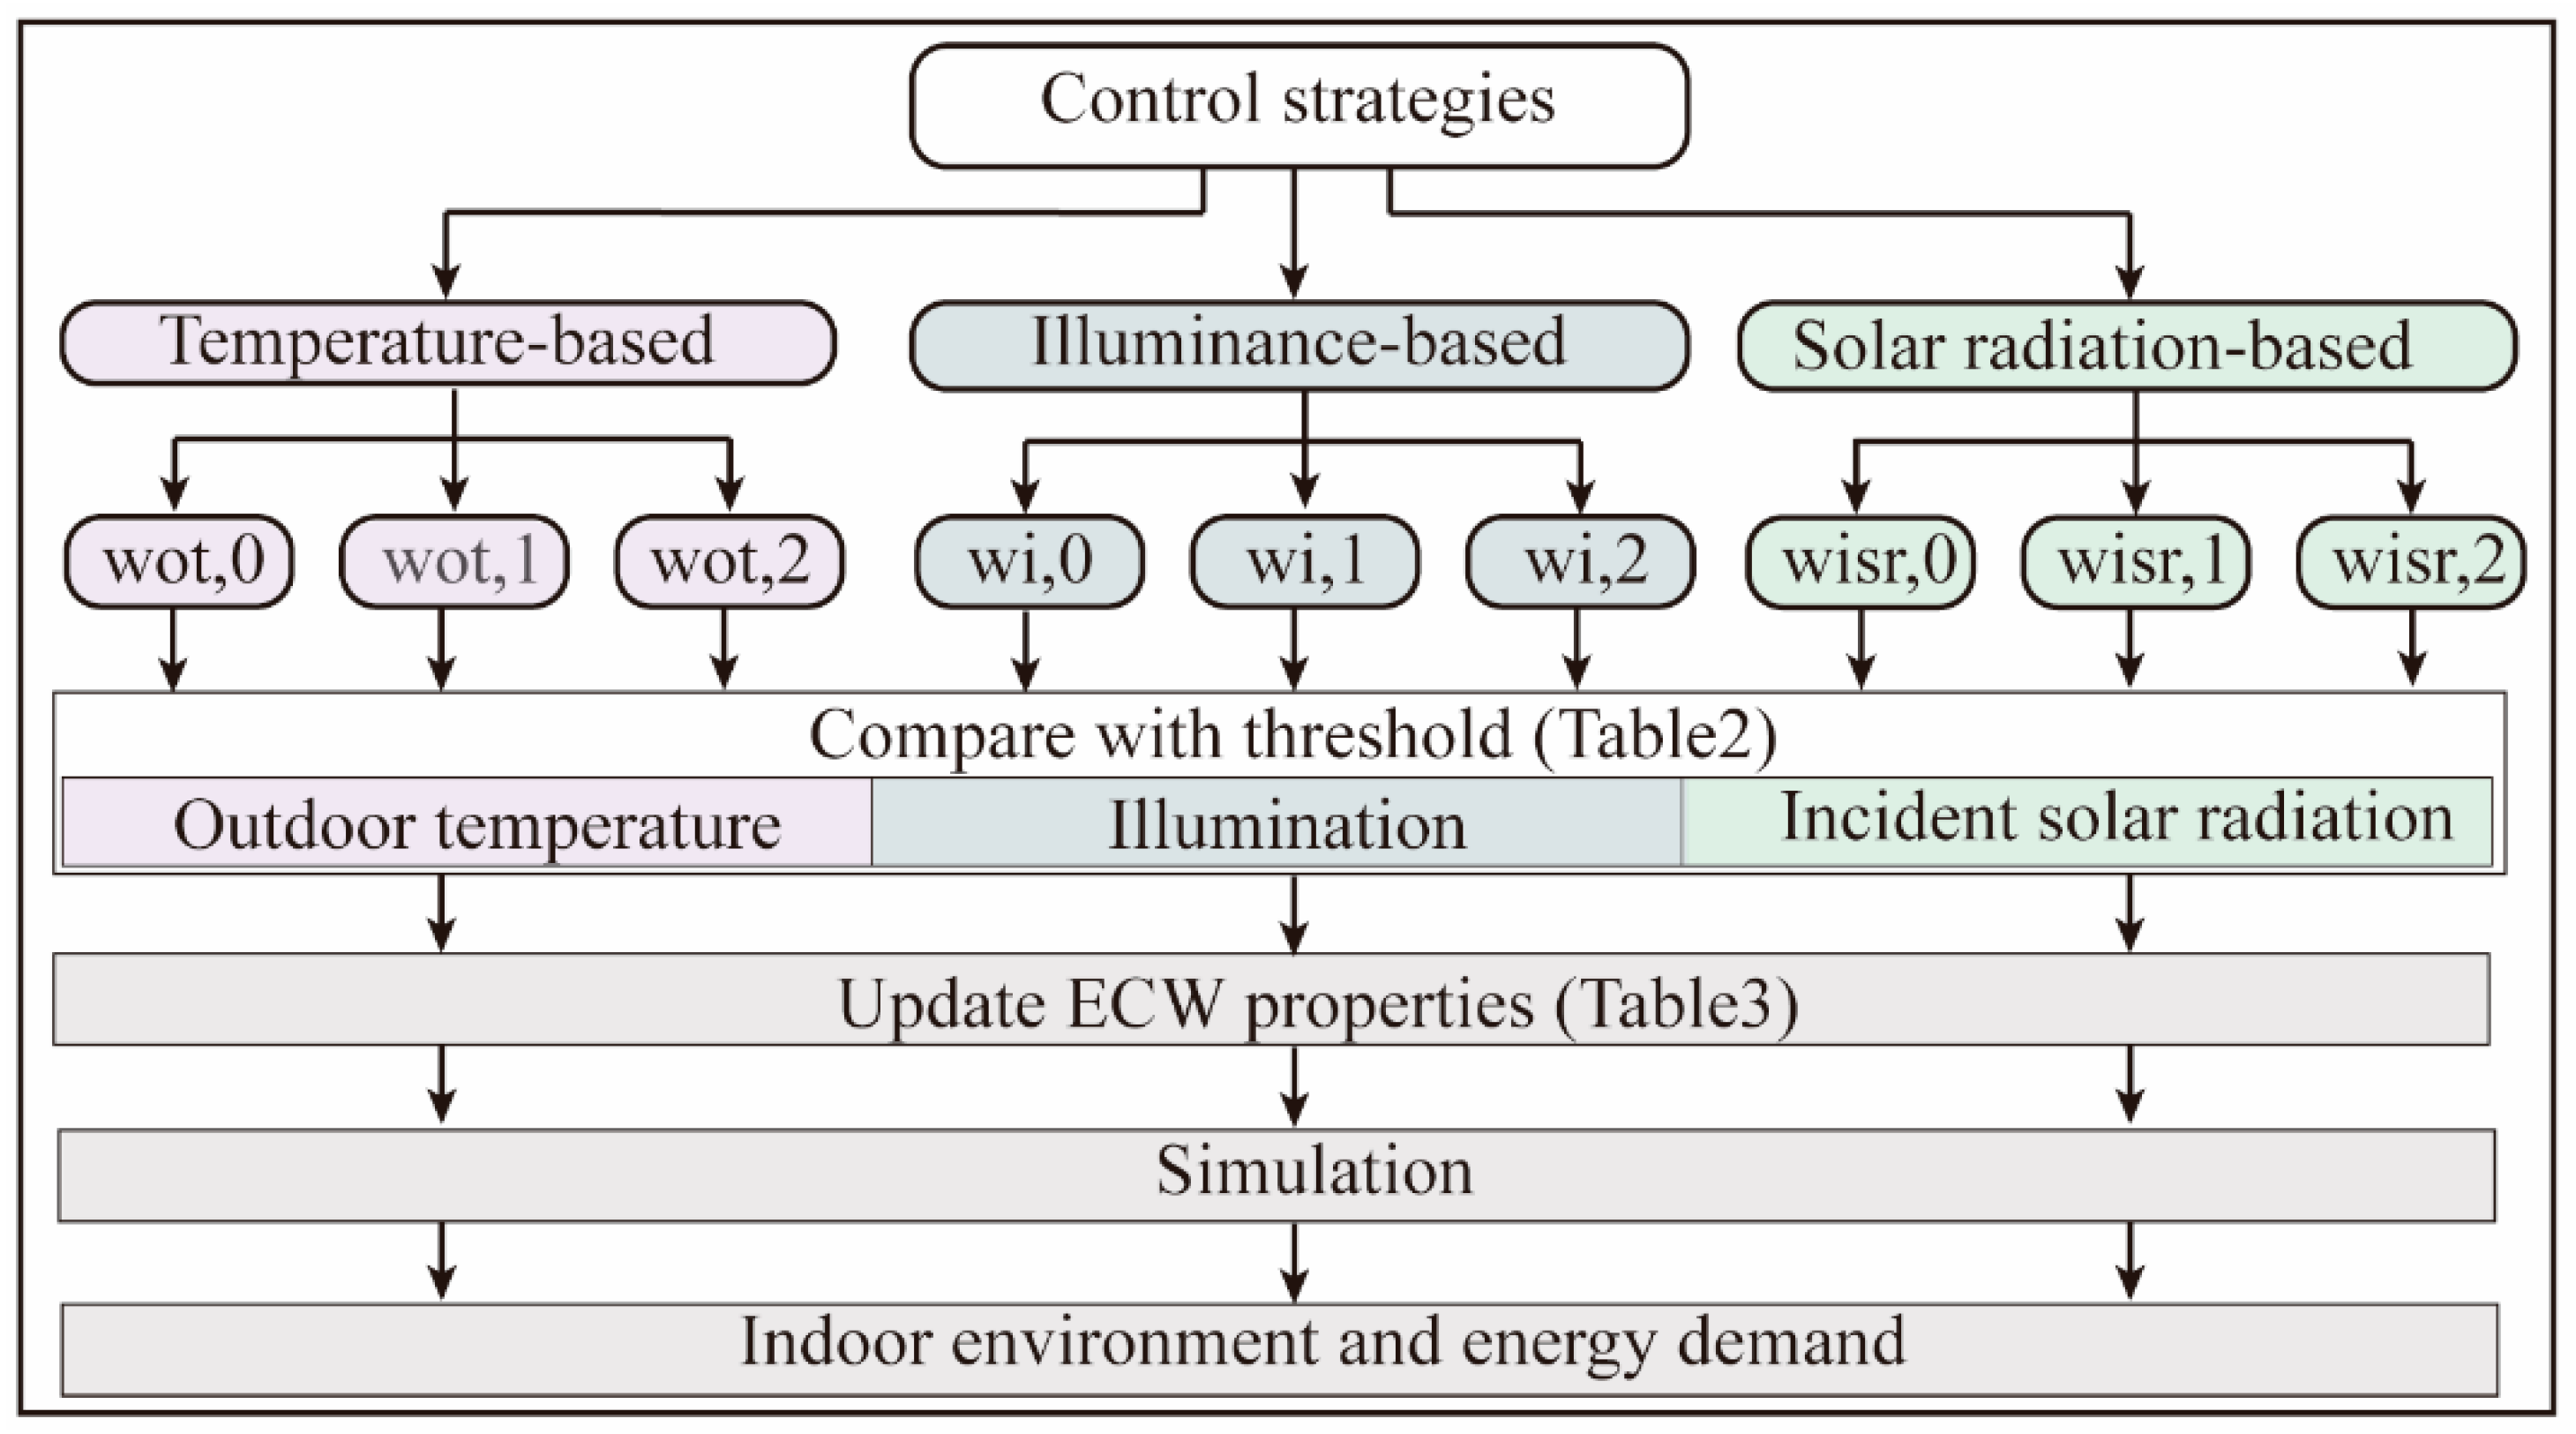
In this study, three types of ECW control strategies were designed, with their threshold conditions summarized in Table 2 and Table 3. The specific ranges of illuminance, incident solar radiation, and outdoor air temperatures used as control inputs were established with reference to threshold settings commonly adopted in previous studies [19,45]. The logic of ECW control strategies, including temperature-based, illuminance-based, and solar radiation-based modes, is illustrated in Figure 3.
  • Illuminance-based control strategy
Outdoor illuminance was used as the control input, as it directly determines indoor daylight quality. ECWs were assumed to operate in four states (S1–S4), with SHGC and VT gradually decreasing from S1 (transparent) to S4 (darkest). As outdoor illuminance increased, the window state progressively shifted from S1 to S4 to maintain indoor illuminance within a comfortable range.
  • Incident solar radiation-based control strategy
Incident solar radiation on the window surface was employed as the control signal, given its strong influence on indoor thermal conditions and cooling loads. Similarly to the illuminance-based mode, ECWs switched between four states (S1–S4) as incident radiation increased, thereby modulating solar heat transmission into the indoor environment.
  • Temperature-based control strategy
Outdoor air temperatures were used as control parameters to account for seasonal thermal variations and building energy demand. ECWs operated in four states (S1–S4), with SHGC and VT gradually decreasing as the temperature increased, effectively reducing excessive solar heat gain and avoiding overheating in warm conditions.

2.5. Simulation Tools and Boundary Conditions

In this study, Rhinoceros was employed as the 3D modeling platform, with the Grasshopper plugin used to flexibly adjust classroom geometric parameters. Climate data were processed through the Ladybug and Honeybee plugins, which also provided the interface for coupling with EnergyPlus for energy performance simulations and Radiance for daylighting analysis. These tools were selected because they enable an integrated workflow from parametric modeling to dynamic simulation, ensuring consistency between geometric changes, climate inputs, and performance evaluation.
The research object was a university teaching building. Since such buildings not only serve as the primary learning environment for students but also accommodate partial study and living functions during weekends and holidays, the classrooms were assumed to be occupied continuously (24 h/day, year-round) in the simulations. The target illuminance on the working plane was set to 300 lx at a sensor height of 1.2 m above the floor. Indoor load parameters, including lighting power density, occupancy density, and equipment power density, were specified according to local dormitory-related standards. Other boundary conditions used in the simulation tools are summarized in Table 4. To ensure that both the building design assumptions and energy simulation parameters were realistic and reliable, this study was conducted in collaboration with architects and energy engineers. The architects contributed expertise on classroom layout and façade design, while the energy engineers provided guidance on load assumptions, boundary conditions, and simulation setup.

3. Result and Analysis

3.1. Baseline Case Analysis

3.1.1. Visual Comfort in Three Classroom Types

Visual comfort was assessed for three classroom layouts, and the results are shown in Figure 4. Overall, all three classrooms exhibited a typical pattern of excessive daylighting near the window and insufficient daylighting in the rear zone. However, their performance levels varied considerably. The CTRV of Type I was 38.78%, with excessive illuminance near the window side and insufficient illuminance in the rear rows, resulting in a pronounced daylighting gradient and poor uniformity. Type II achieved the highest visual comfort, with an average CTRV of 39.93%. Its illuminance distribution was relatively uniform, as excessive brightness near the window was mitigated and rear-zone illuminance improved, resulting in overall better comfort than Type I. By contrast, Type III performed the worst, with an average CTRV of only 34.44%.

3.1.2. Thermal Comfort in Three Classroom Types

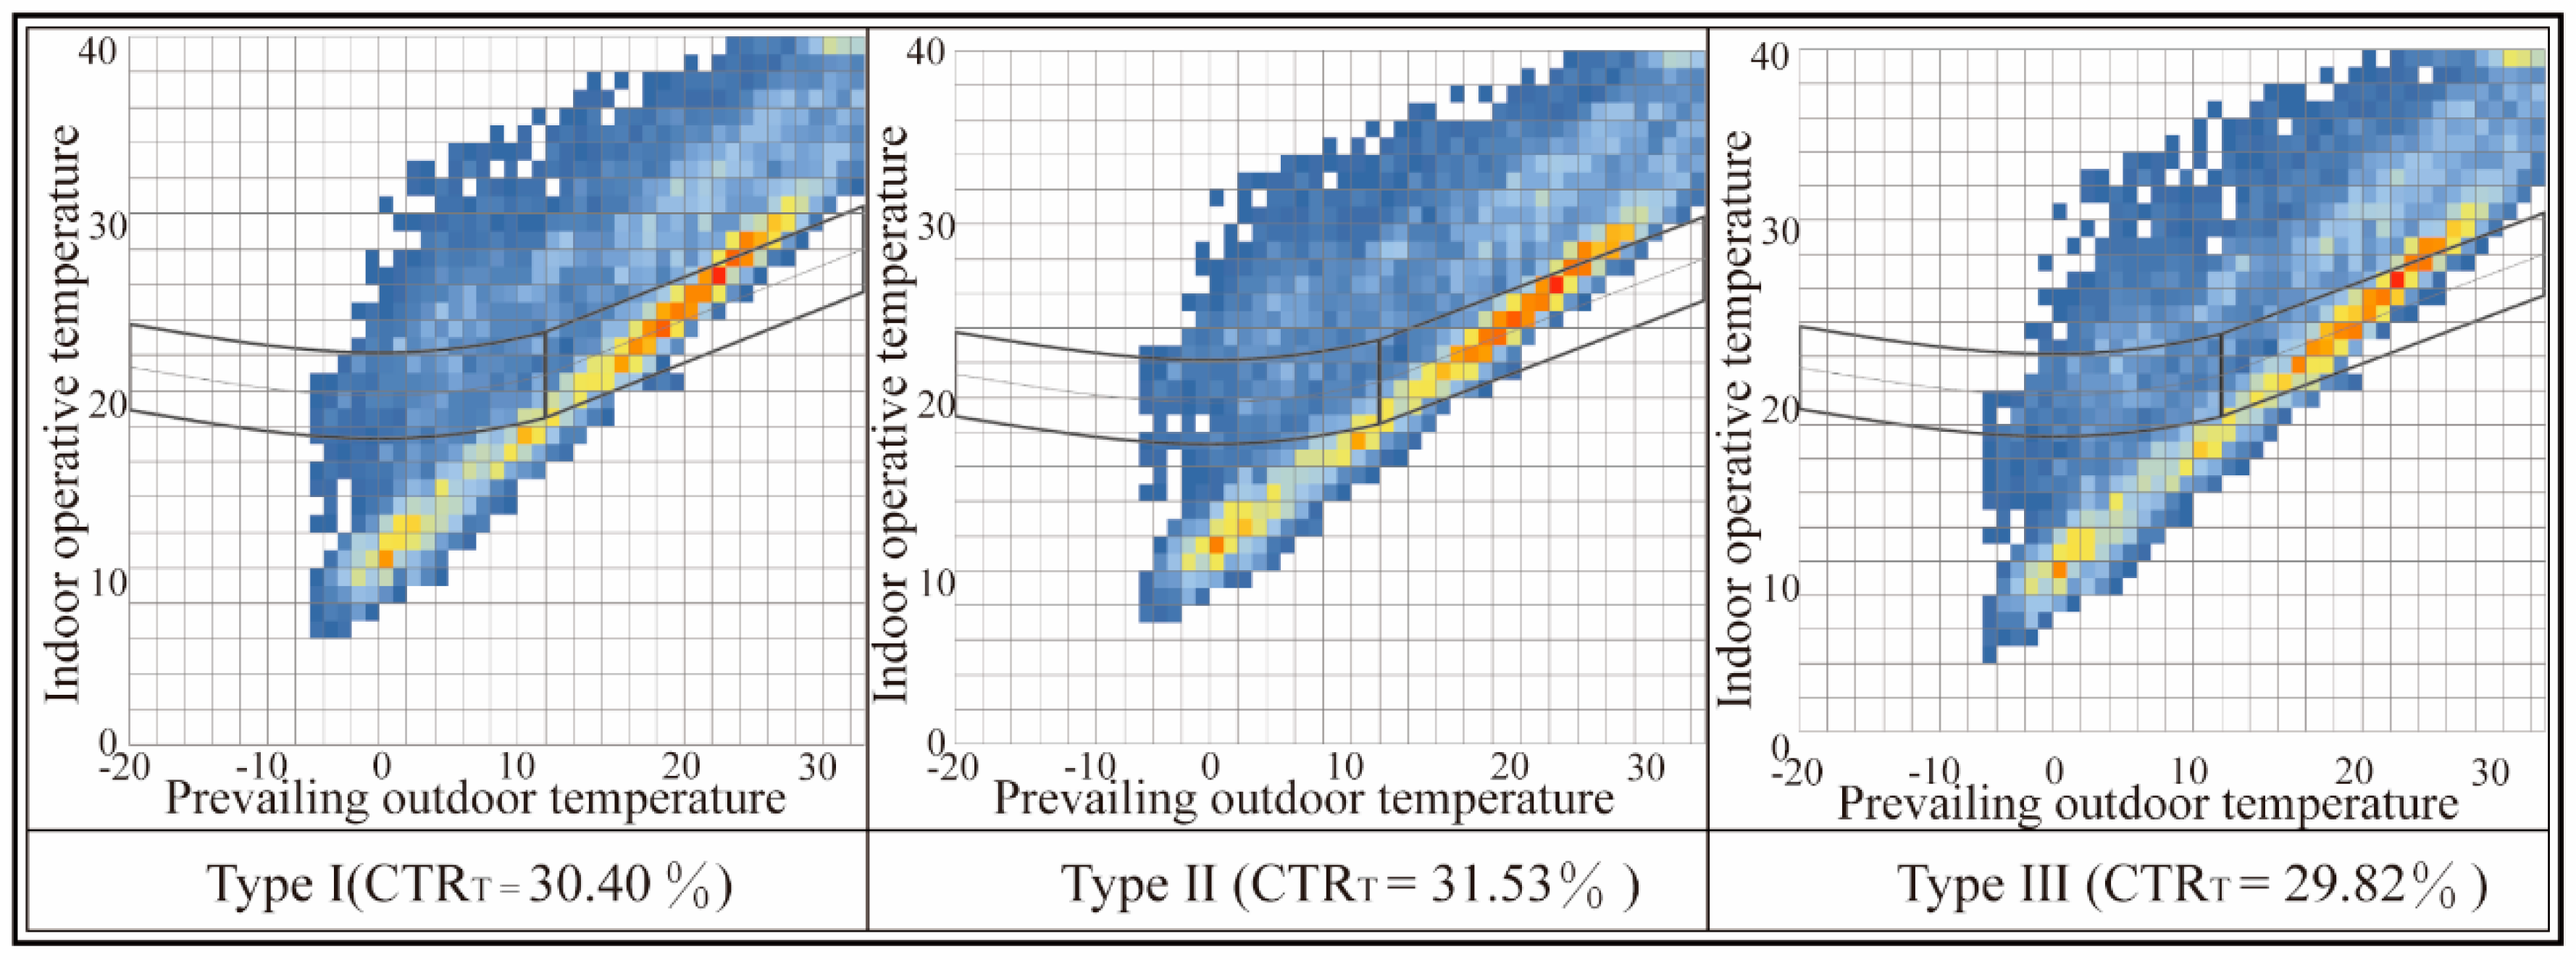
Thermal comfort was evaluated using the adaptive model, and the results are presented in Figure 5. Type I exhibited a CTRT of 30.40%, with most operative temperatures ranging from 20 to 30 °C. However, frequent overheating occurred during summer, indicating insufficient cooling capacity. Type II performed best, with a CTRT of 31.53%. Its operative temperature distribution was more concentrated during transitional seasons, with a slightly higher proportion of hours within the comfort zone compared with Types I and III. Type III had the lowest CTRT of 29.82%.

3.1.3. Annual Indoor Temperature Distribution in Three Classroom Types

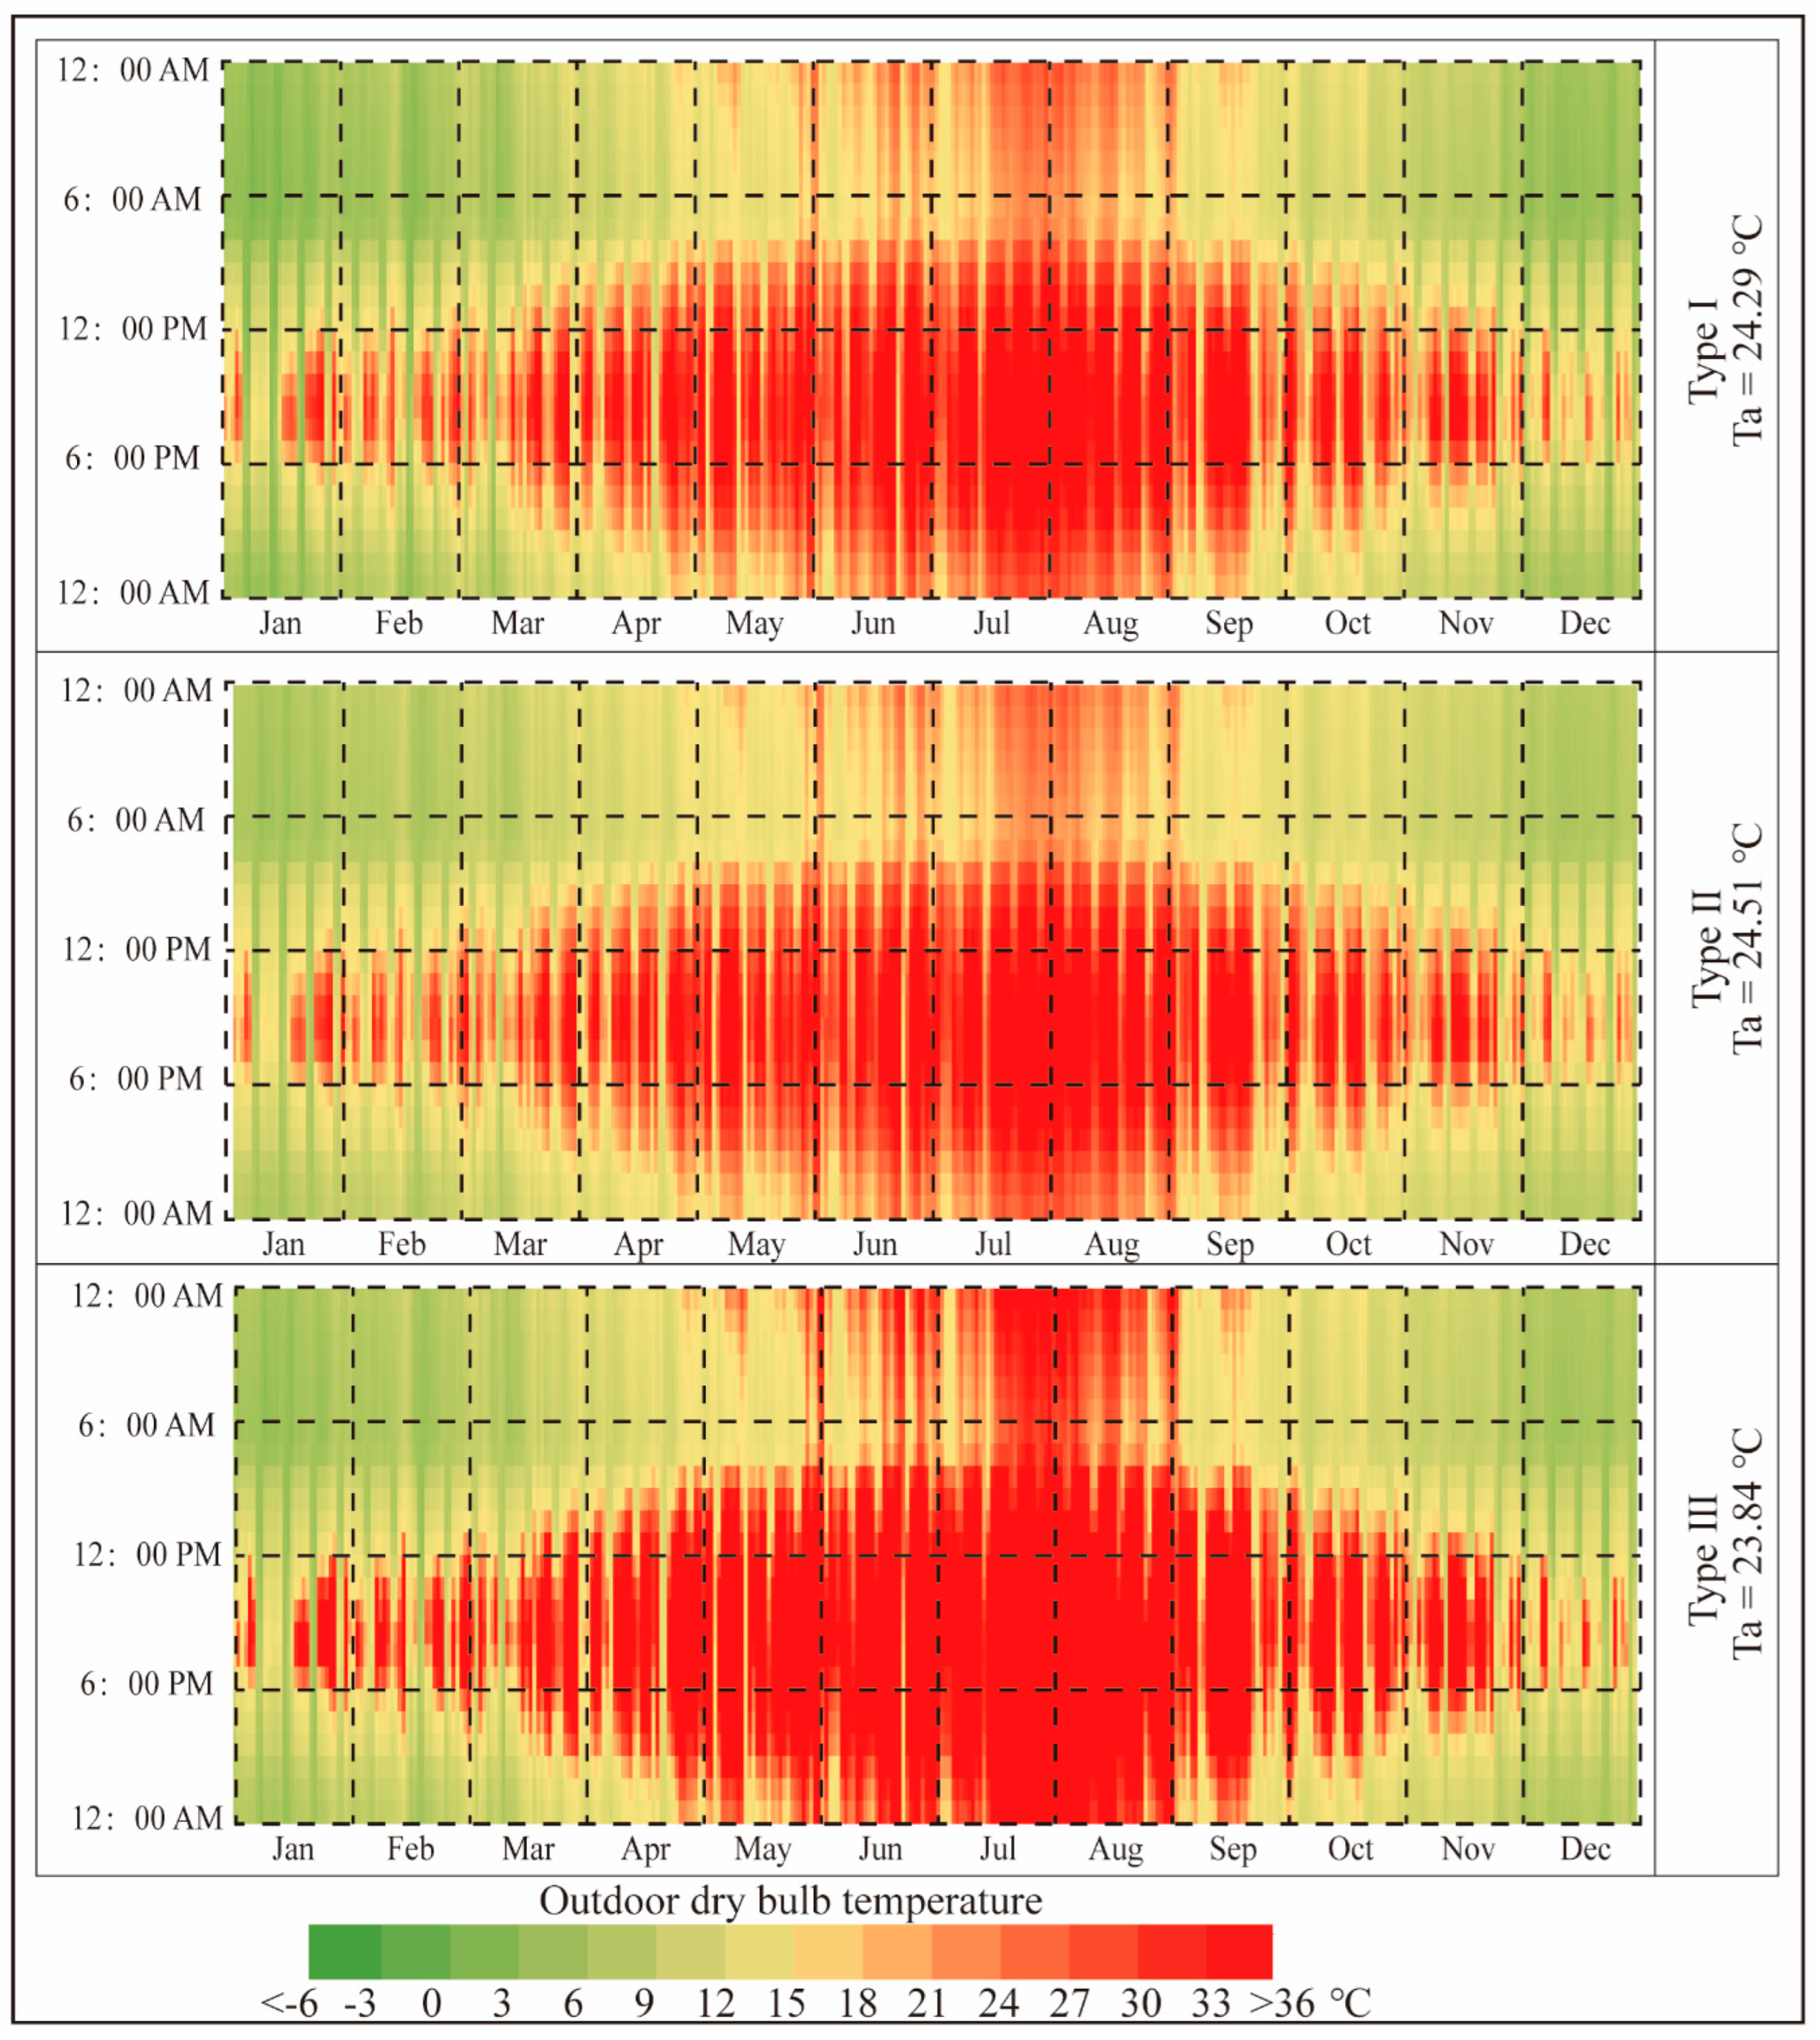
Figure 6 illustrates the hourly indoor temperature distribution of the three classrooms. In general, indoor temperature trends followed seasonal outdoor variations, yet differences in absolute values and ranges were evident. Type I had an annual mean indoor temperature of 24.29 °C. During the summer (June–September), temperatures frequently remained between 27 and 33 °C, indicating overheating risks, while in the winter (December–February), temperatures decreased to 6–12 °C, suggesting insufficient insulation. Type II showed a slightly higher annual mean indoor temperature of 24.51 °C. Although summer overheating was also observed, its winter temperature distribution was more concentrated in the range of 9–15 °C, demonstrating a buffering effect. Type III exhibited the lowest mean indoor temperature of 23.84 °C, with a polarized distribution: summer overheating (>30 °C) was evident, while in winter, prolonged low temperatures of 6–10 °C were dominant, resulting in inadequate thermal comfort.

3.1.4. Cooling Energy Consumption in Three Classroom Types

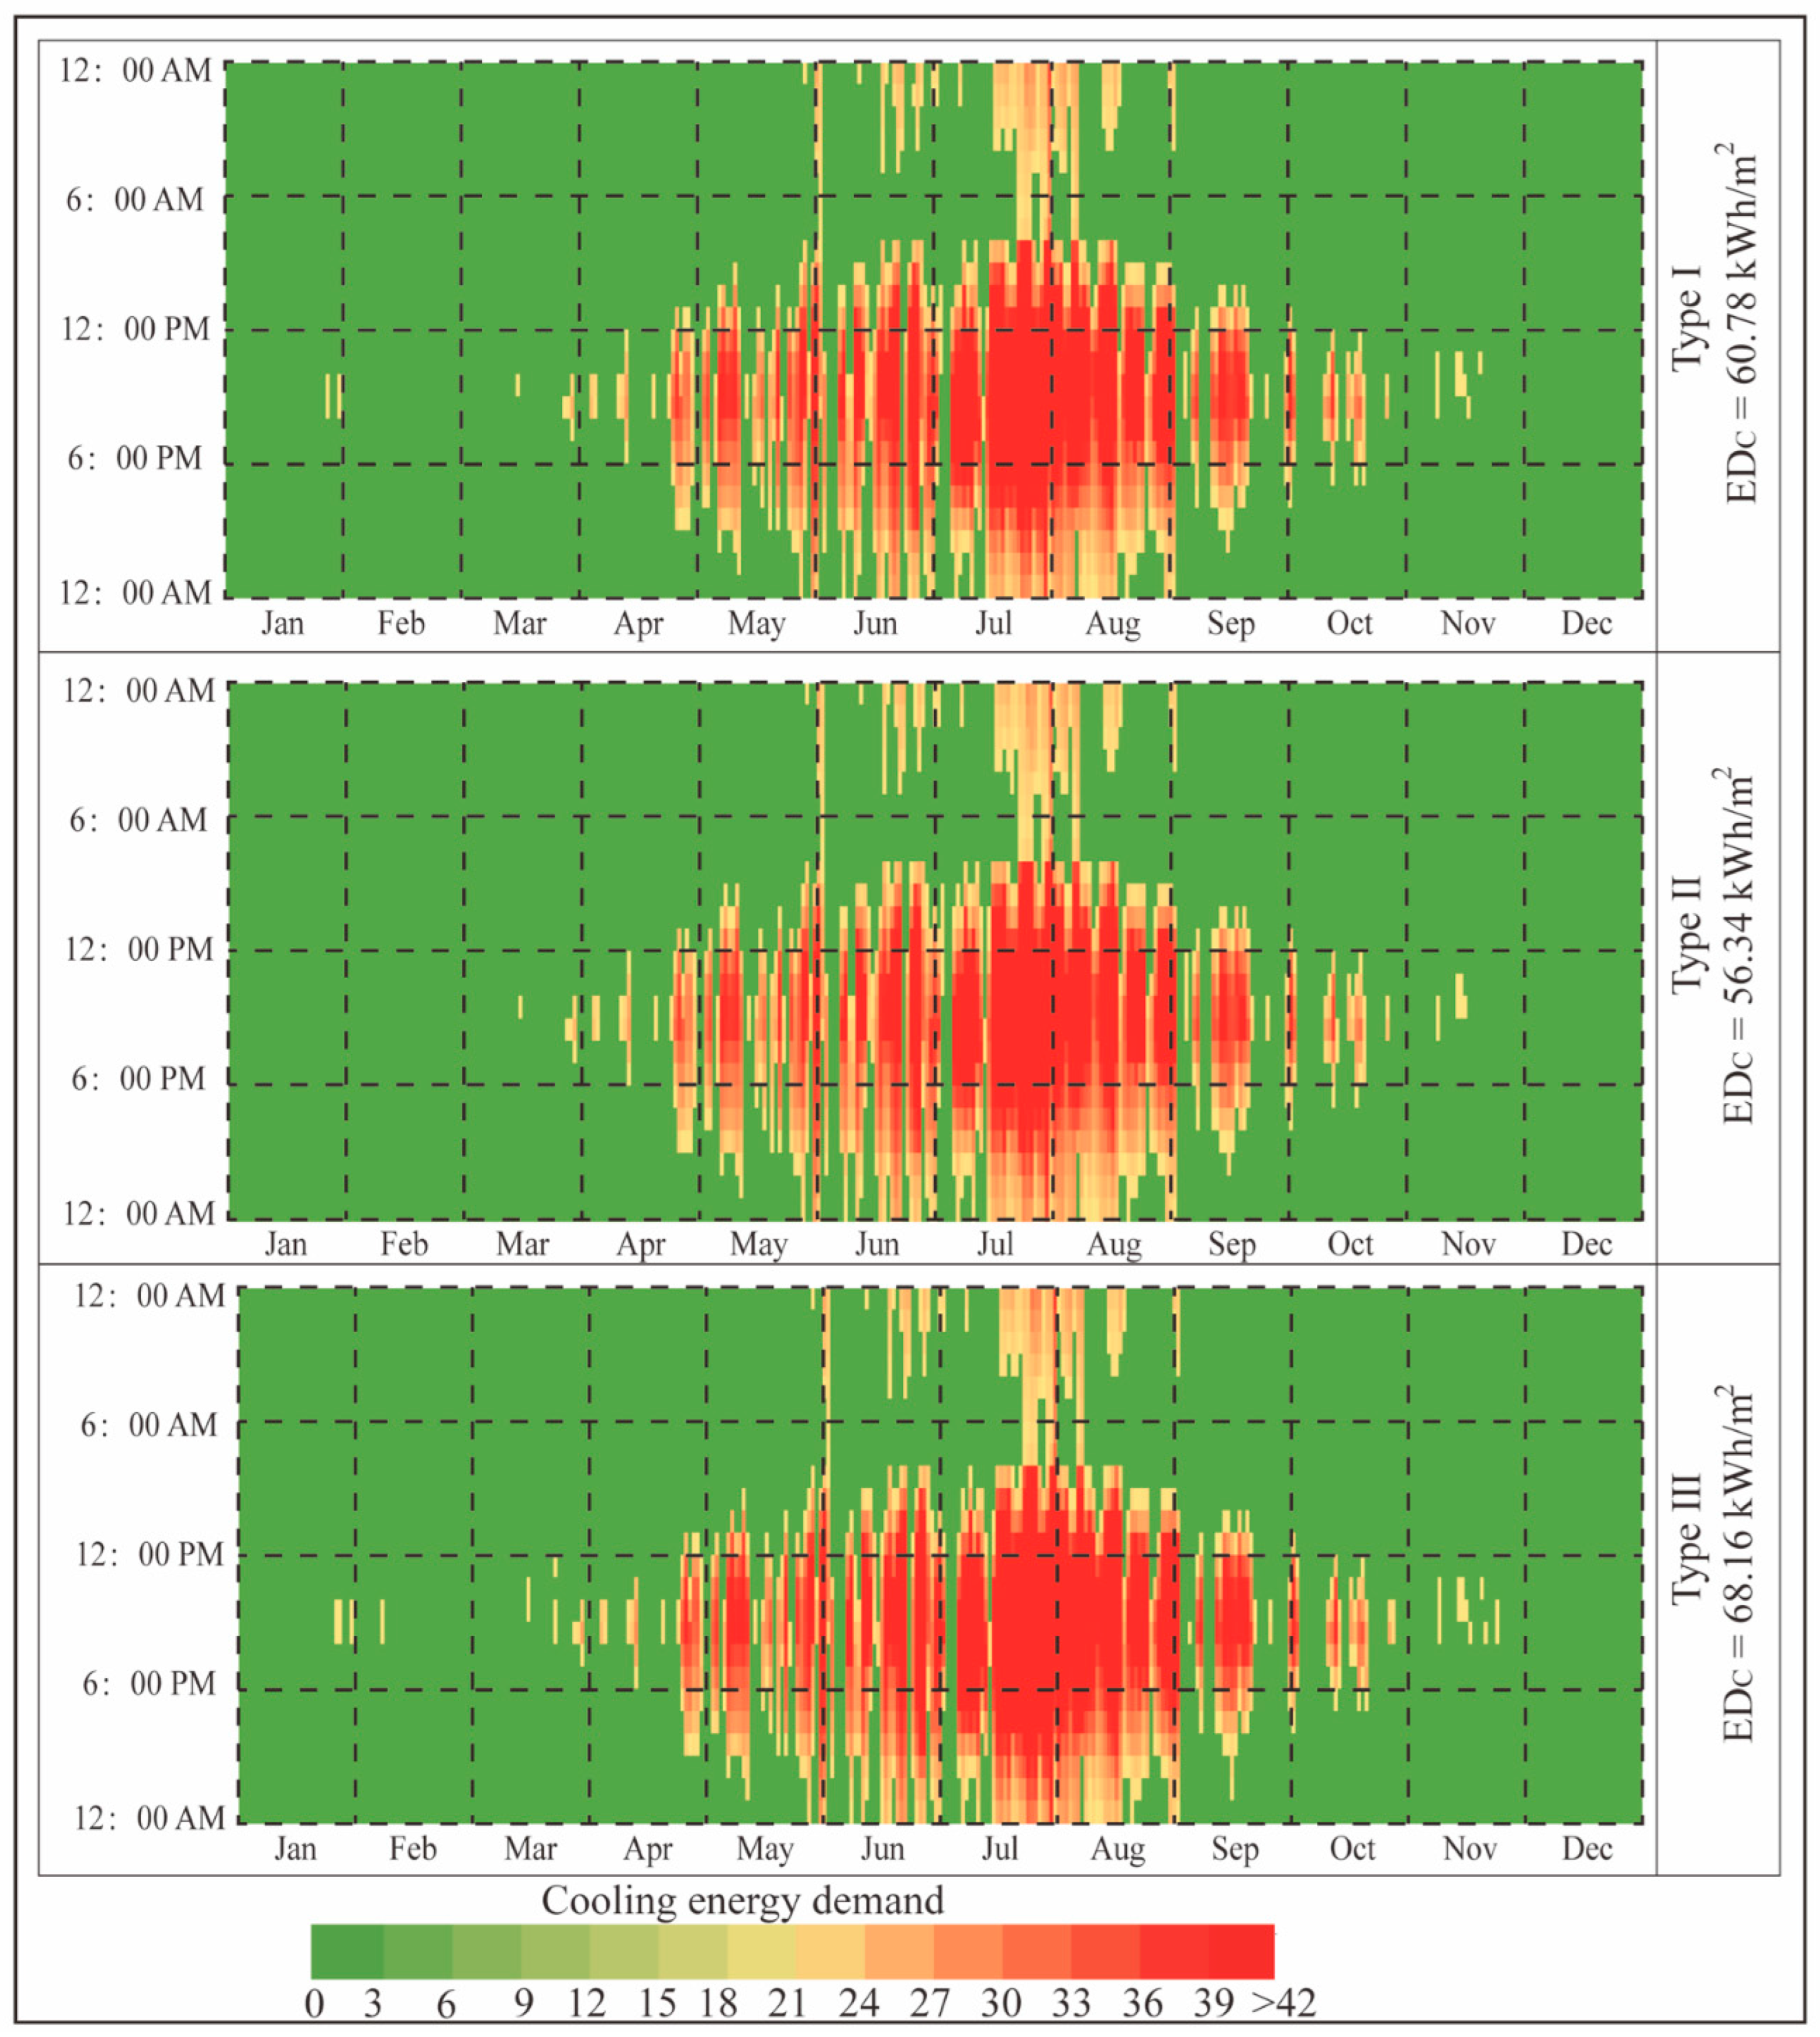
Figure 7 shows the annual cooling demand distribution. Cooling was concentrated in summer, with July and August contributing the highest loads. Type I had an EDC of 60.78 kWh/m2, with peak demands in July, indicating significant summer overheating. Type II again performed best, with the lowest cooling energy use of 56.34 kWh/m2. Although its seasonal pattern was similar to Type I, the overall level was lower, demonstrating greater effectiveness in reducing summer cooling loads. By contrast, Type III consumed the most cooling energy, with an annual intensity of 68.16 kWh/m2. Its cooling demand not only peaked in July–August but also extended over a longer duration, indicating severe overheating and the least favorable cooling performance.

3.1.5. Heating Energy Consumption in Three Classroom Types

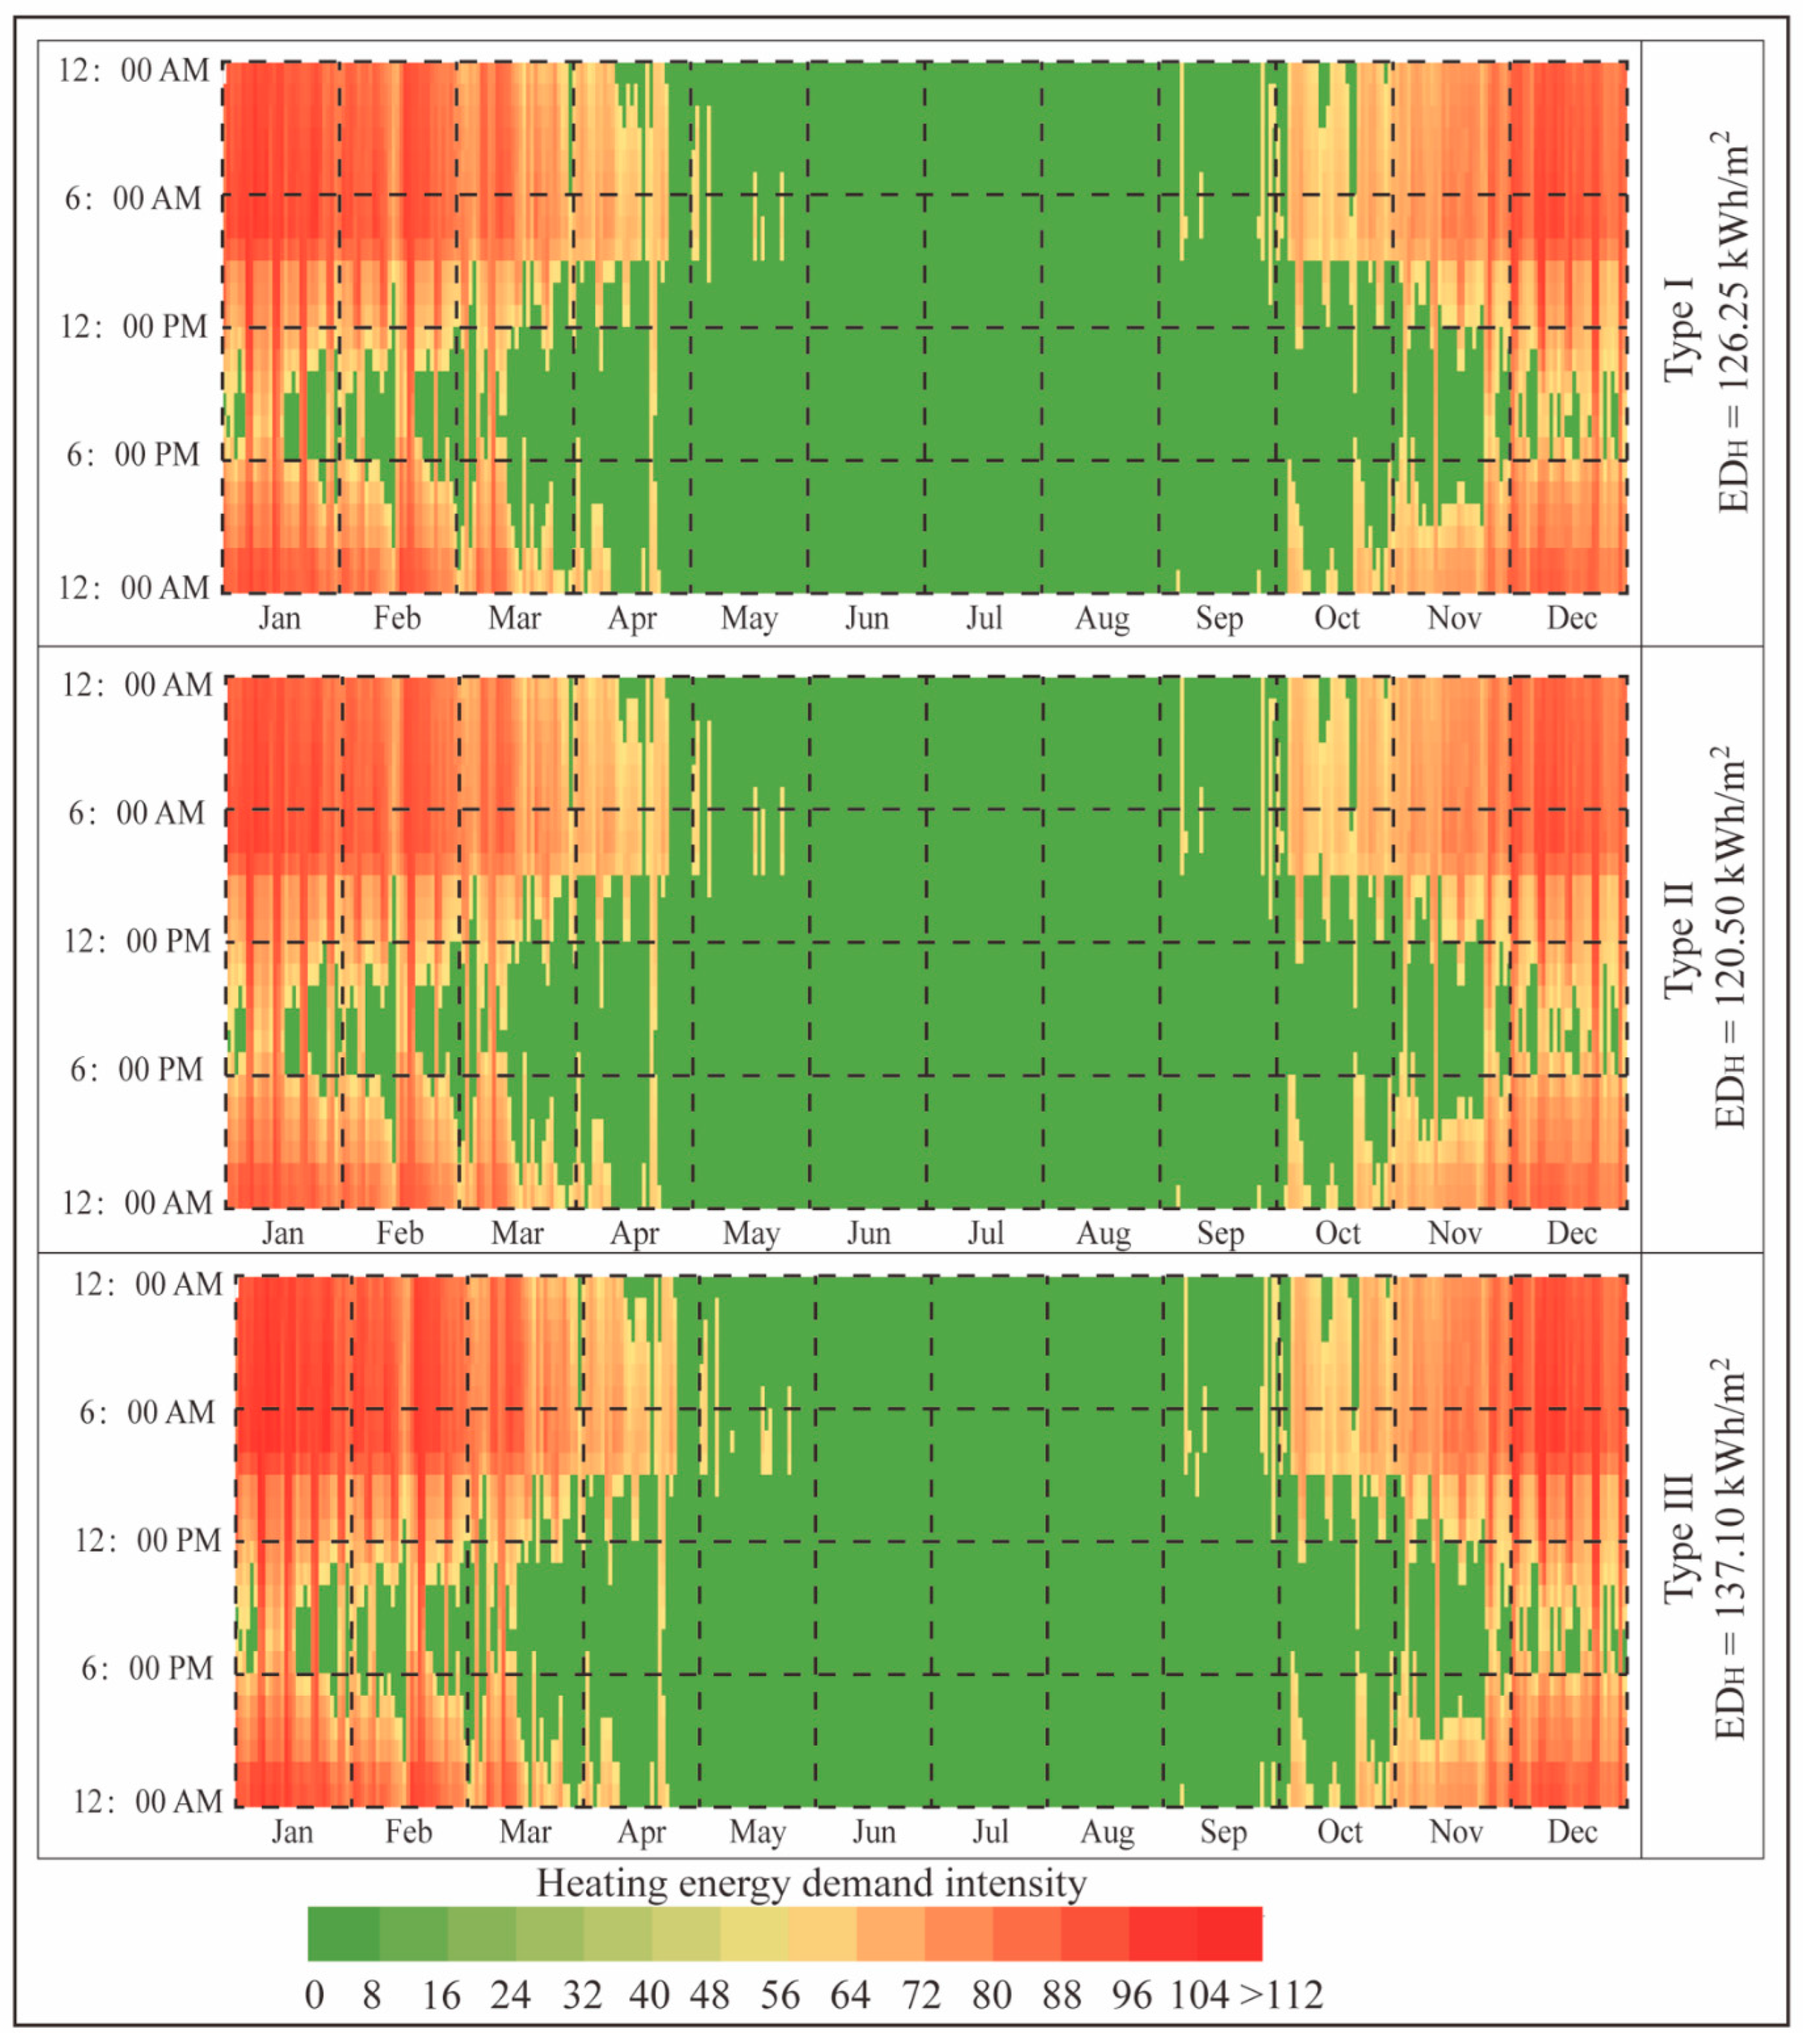
The annual heating demand of the three classrooms is shown in Figure 8. Heating was primarily required during the winter season, peaking in December and January, with negligible demands in the summer. Type I had an annual heating energy use intensity EDH of 126.25 kWh/m2, with particularly high loads in December and January, indicating a strong reliance on heating. Type II recorded the lowest heating energy use of 120.96 kWh/m2, following a similar seasonal pattern but at a slightly lower overall level, suggesting that its layout offers some advantage in reducing heating demands. Type III exhibited the highest heating energy use of 137.10 kWh/m2, with longer heating periods, especially from January to February, highlighting its poor thermal performance.

3.2. Performance Analysis with Electrochromic Windows

3.2.1. Type I Classroom

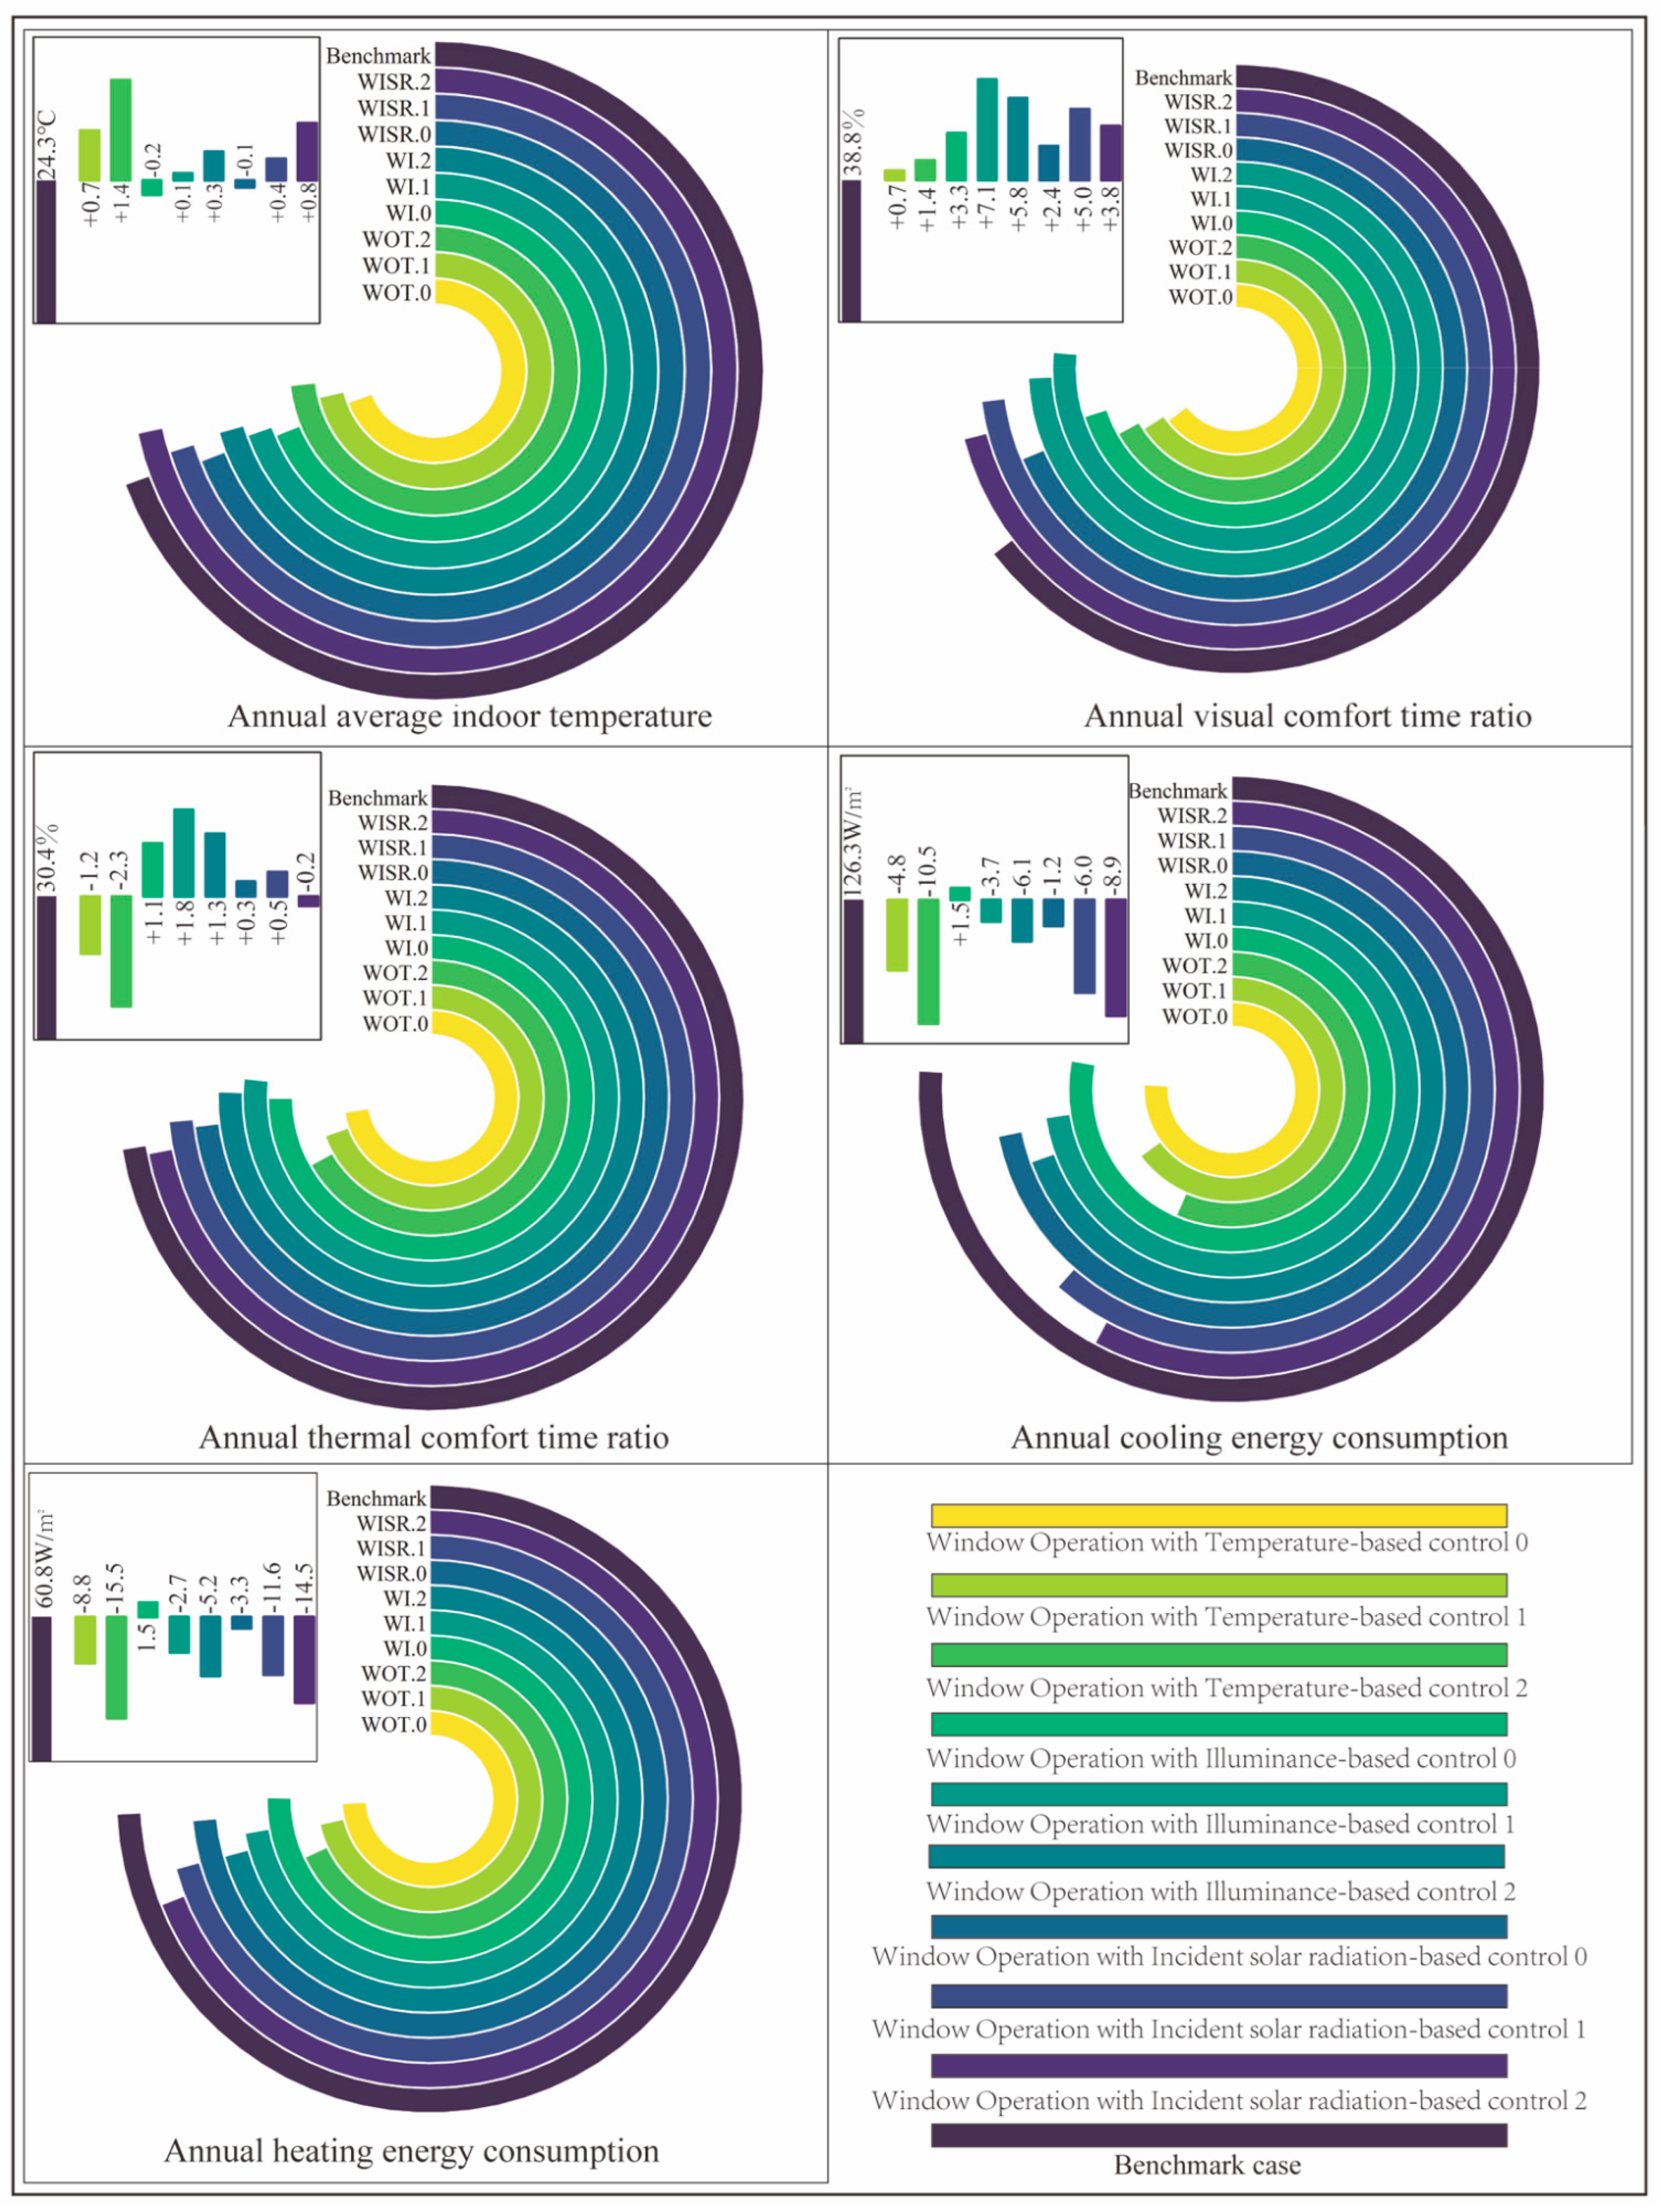
Figure 9 presents the five key performance indicators of the large classroom under the benchmark case and different ECW control strategies.
Under the benchmark case, the annual mean indoor temperature was 14.3 °C. With ECW control, indoor temperatures increased by +0.2 to +1.2 °C. Temperature-based strategies WOT.1 and WOT.2 performed the best, with increases of +1.0 and +1.2 °C, respectively, demonstrating their effectiveness in improving winter indoor thermal conditions.
The visual comfort time ratio was 38.8% in the benchmark case. All ECW strategies improved this indicator, with increases ranging from +0.7% to +5.8%. The illuminance-based controls WIL.1 and WIL.2 yielded the greatest improvements, indicating their ability to alleviate window-side glare and improve daylight uniformity.
The thermal comfort time ratio was 30.4% under the benchmark case. With ECW controls, it increased by +0.2% to +3.5%. Among all strategies, WOT.2 achieved the largest improvement, followed by WIL.2, highlighting their potential in mitigating seasonal overheating and underheating.
Regarding energy performance, the benchmark annual cooling energy use was 125.3 kWh/m2. ECW controls reduced cooling demands by −1.0% to −10.5%. The illuminance-based strategy WIL.2 achieved the greatest reduction, followed by WISR.2, both showing advantages in mitigating excessive summer solar gains. Annual heating energy use was 60.9 kWh/m2 under the benchmark case. All strategies reduced heating demands, with decreases of −3.2 to −11.6 kWh/m2. The temperature-based control WOT.0 achieved the best result, indicating its strong ability to enhance passive solar gains and reduce winter heating loads.

3.2.2. Type II Classroom

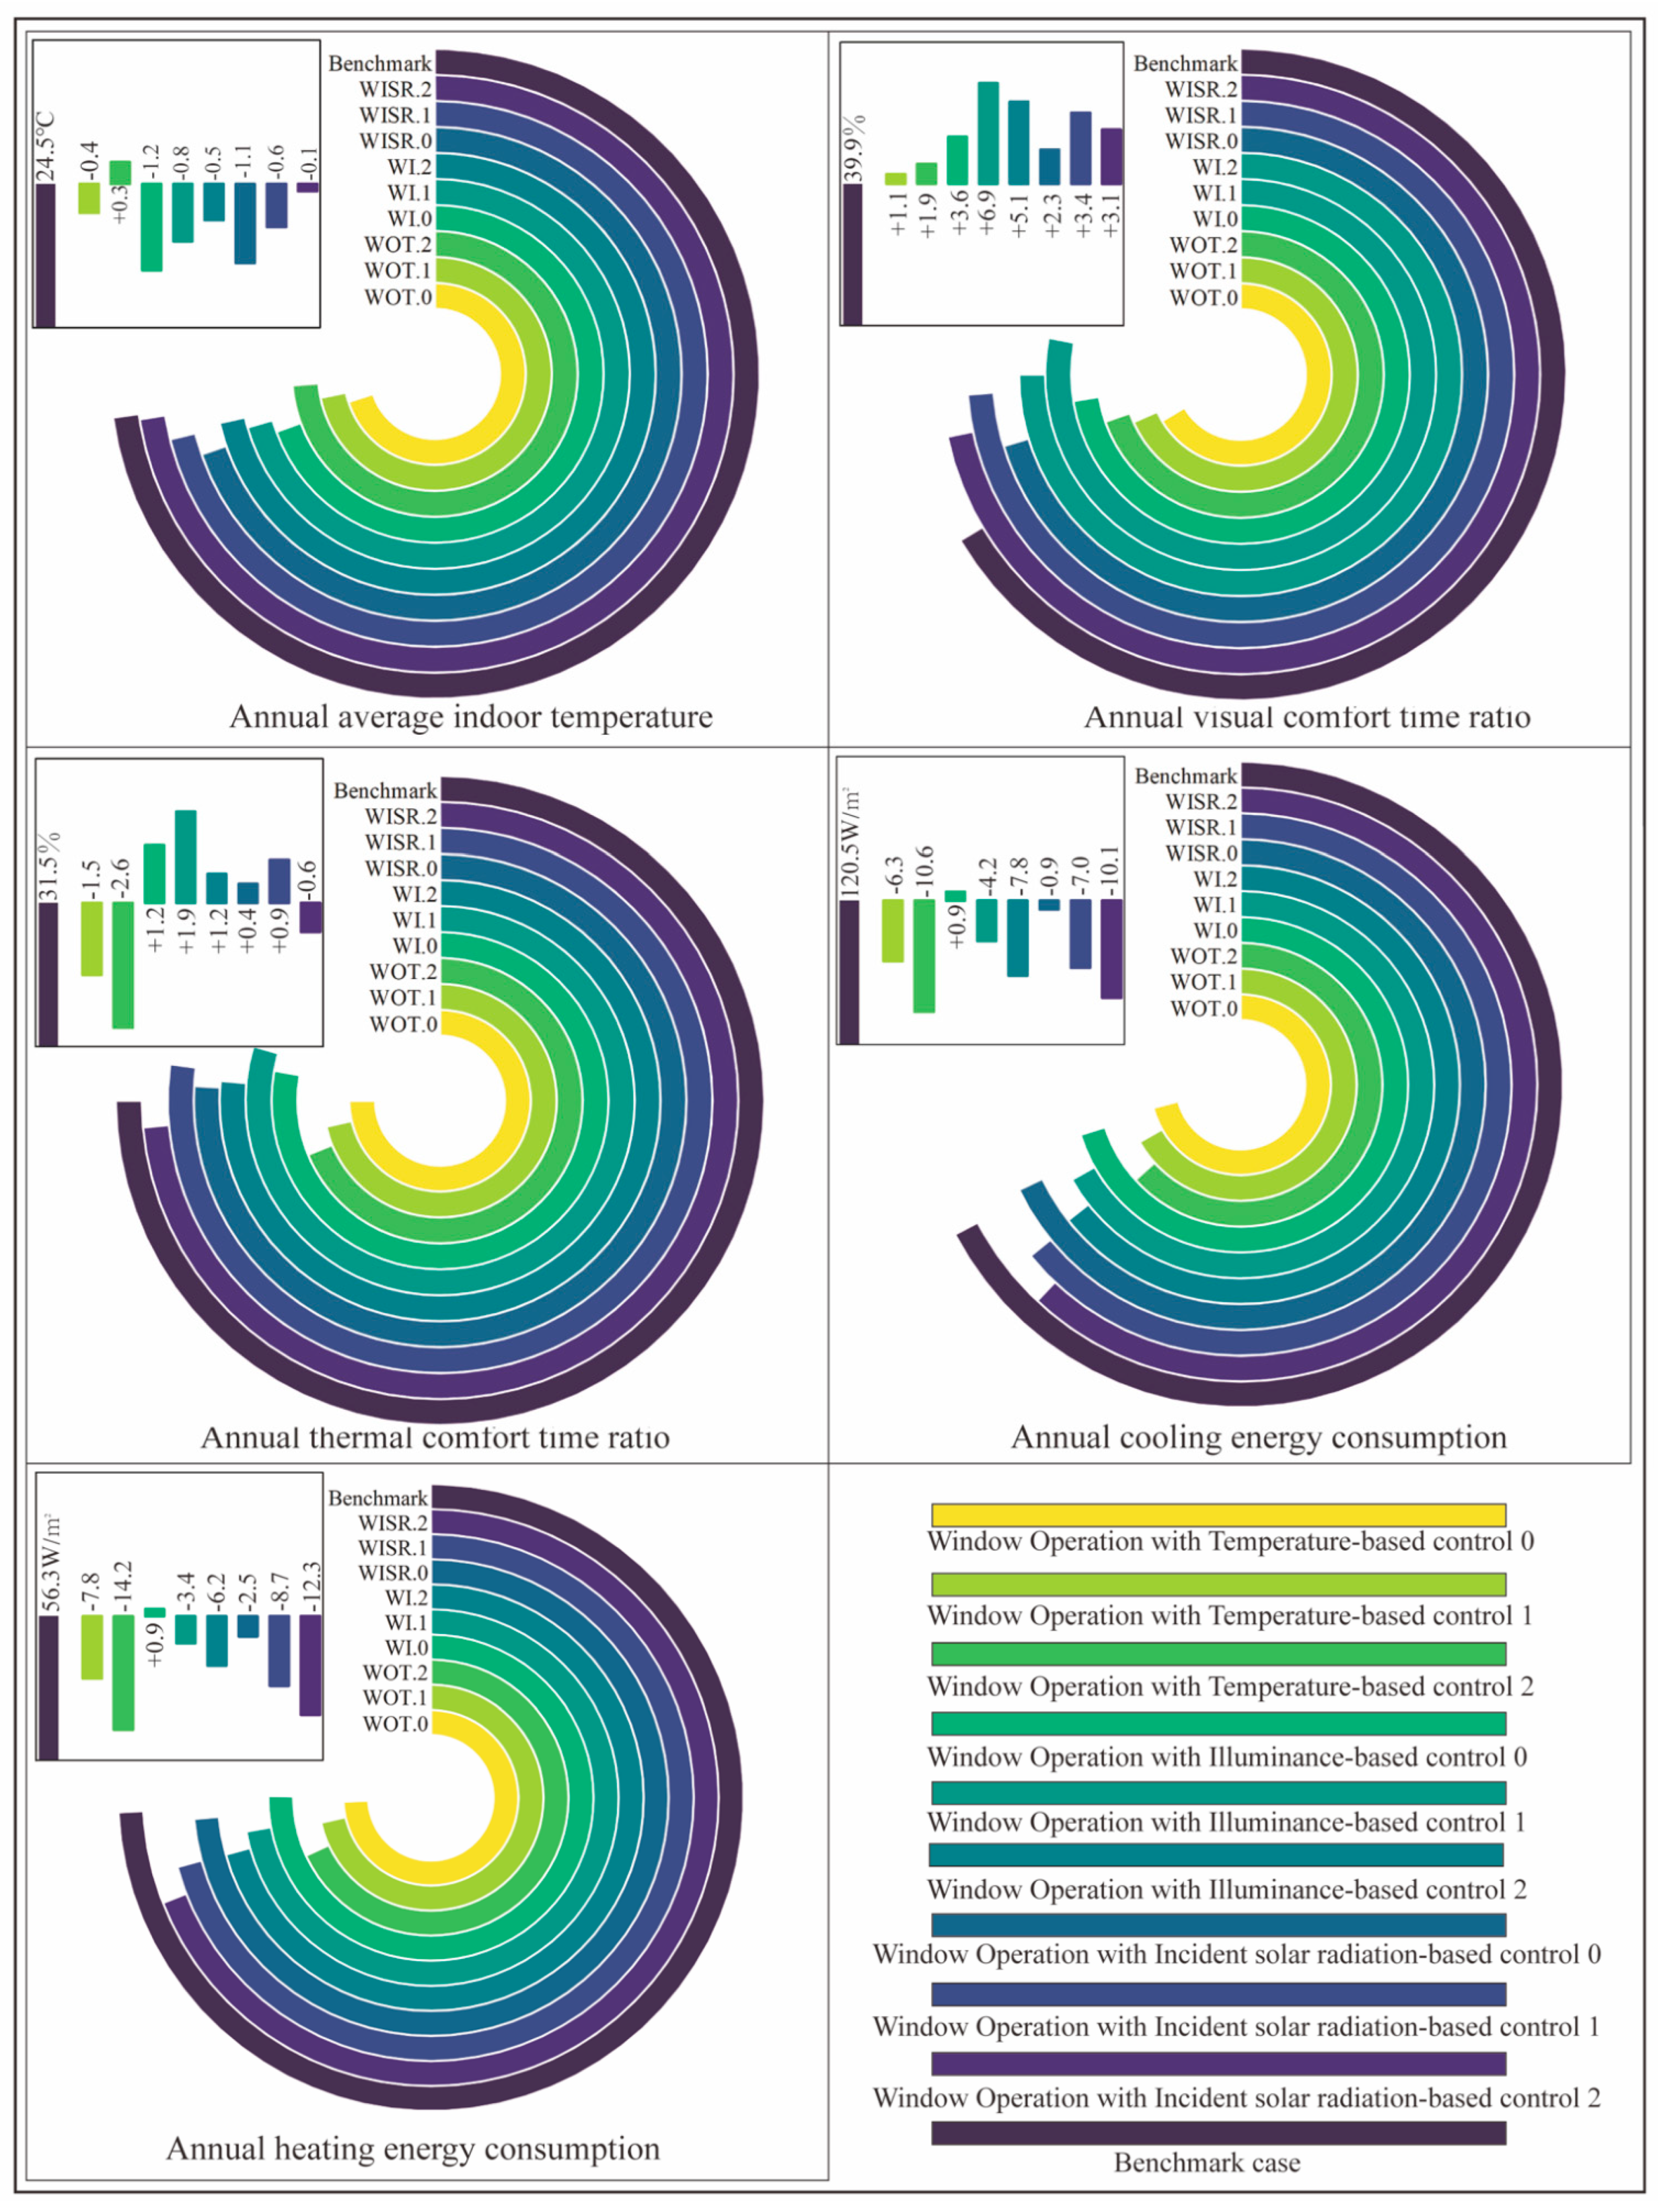
Figure 10 presents the five key performance indicators of the medium classroom under the benchmark case and different ECW control strategies. Compared with the large classroom, the medium classroom exhibited distinct characteristics in indoor environmental improvements and energy optimization.
Under the benchmark case, the annual mean indoor temperature was 15.3 °C. With ECW control strategies applied, indoor temperature increased by +0.6 to +1.4 °C. WOT.1 and WOT.2 exhibited the strongest improvements, with increases of +1.2 and +1.4 °C, respectively, indicating that temperature-sensitive control effectively enhanced winter indoor thermal conditions.
The visual comfort time ratio was 39.9% under the benchmark case. All strategies improved this metric, with increases ranging from +1.1% to +6.0%. WIL.1 and WIL.2 performed best, improving visual comfort by +6.0% and +5.8%, respectively, and significantly alleviating glare issues caused by uneven daylight distributions near side windows.
The annual thermal comfort time ratio was 31.5% in the benchmark case. Improvements across strategies ranged from +0.6% to +3.2%, with WOT.2 and WIL.2 showing the greatest potential for enhancing comfort, particularly in transitional seasons.
Regarding energy performance, the benchmark annual cooling energy use was 125.3 kWh/m2. With ECW control, cooling demands were reduced by −4.0% to −10.1%. WISR.2 and WIL.2 achieved the greatest reductions, highlighting their advantages in mitigating excessive solar gains during summer. Annual heating energy use was 55.3 kWh/m2 under the benchmark case. All strategies reduced heating demands, with decreases of −3.2 to −7.3 kWh/m2. WOT.0 and WOT.2 were the most effective, reducing heating demands by −7.3 and −6.6 kWh/m2, respectively, thus improving the utilization of passive solar heat in the winter.

3.2.3. Type III Classroom

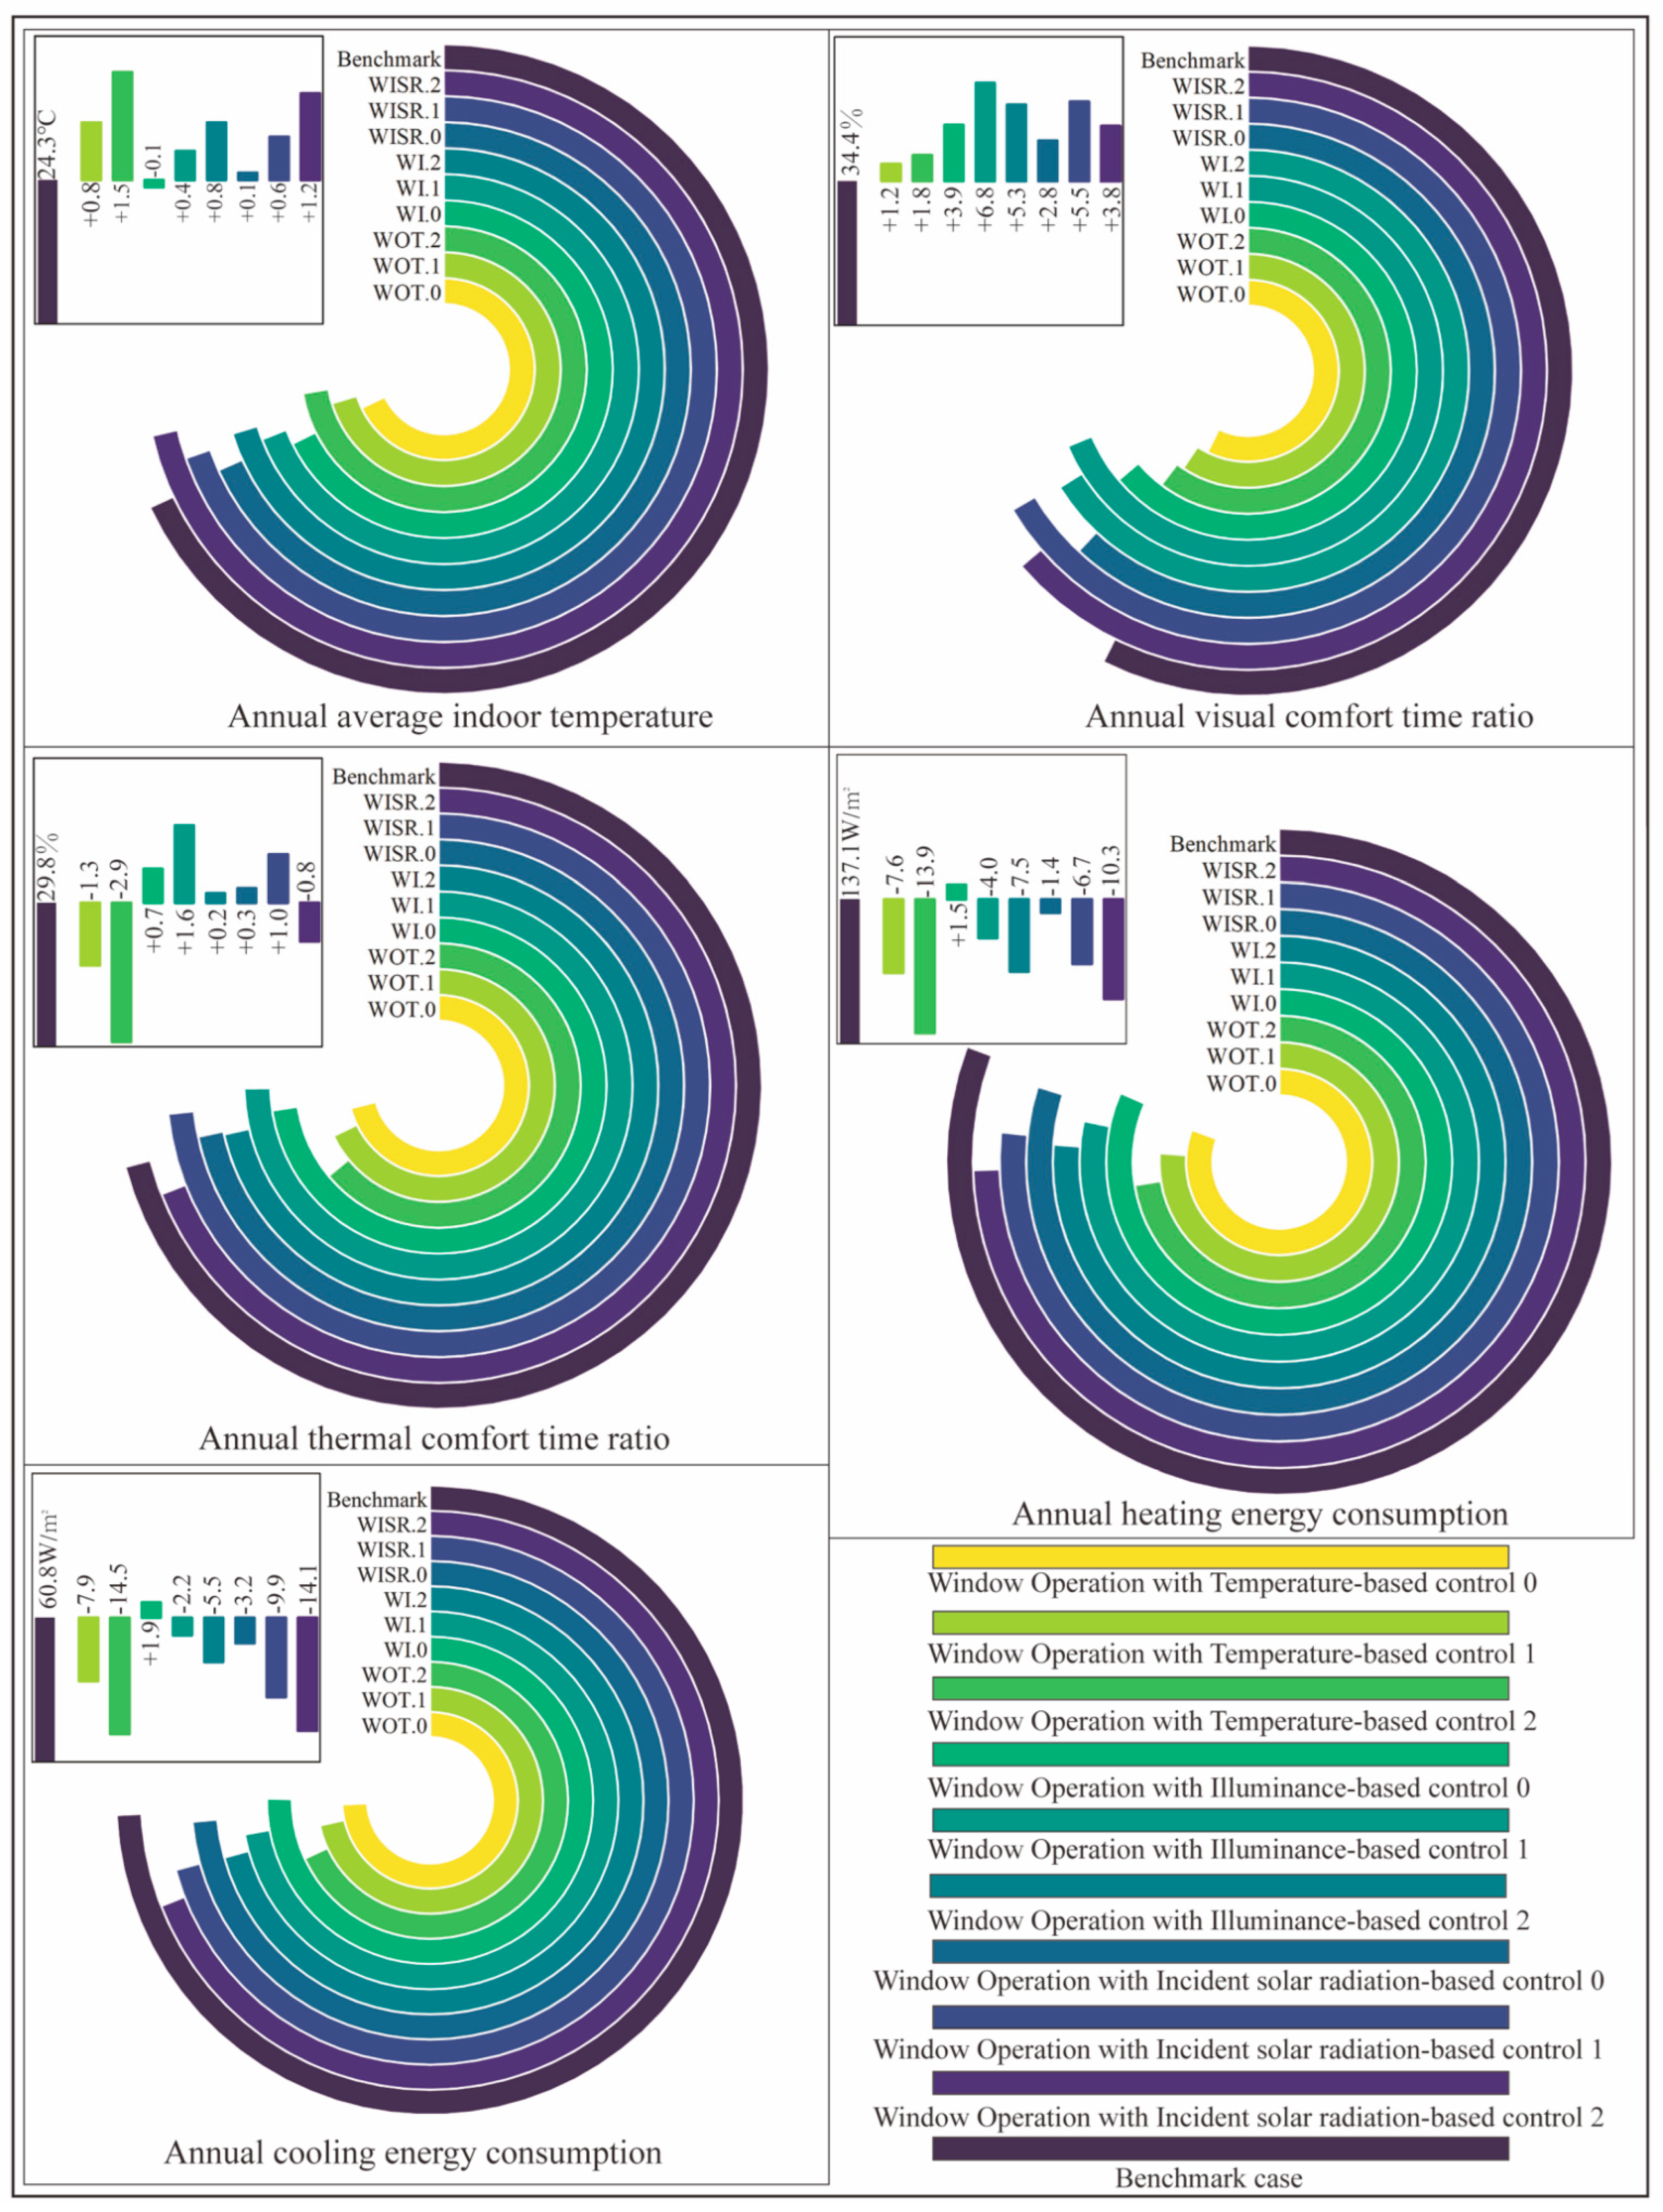
Figure 11 presents the five key performance indicators of the small classroom under the benchmark case and different ECW control strategies. Overall, compared with the large and medium classrooms, the small classroom demonstrated more pronounced improvements in indoor comfort and energy reduction, particularly in heating performance.
Under the benchmark case, the annual mean indoor temperature was 14.3 °C. With ECW controls, indoor temperatures increased by +0.4 to +1.0 °C. Temperature-based strategies WOT.1 and WOT.2 were most effective, increasing the mean temperature by +0.8 and +1.0 °C, respectively, indicating that temperature-sensitive control can significantly improve winter thermal conditions in small-scale spaces.
The visual comfort time ratio was only 34.4% in the benchmark case, the lowest among the three classrooms. With ECW controls, visual comfort improved by +1.2% to +6.3%. Illuminance-based strategies WIL.1 and WIL.2 achieved the greatest enhancements, effectively mitigating glare problems caused by excessive window-side illuminance. Notably, the relative improvement in visual comfort was greater than in the large and medium classrooms.
The thermal comfort time ratio was 28.9% in the benchmark case, which was also the lowest of the three classrooms. Under ECW controls, it increased by +0.8% to +4.5%. The temperature-based strategy WOT.2 performed the best, increasing thermal comfort by +4.5% and demonstrating strong potential to alleviate both winter underheating and summer overheating.
Regarding energy performance, annual cooling energy use was 60.8 kWh/m2 under the benchmark case. With ECWs, cooling demands decreased by −2.2 to −7.9 kWh/m2, with the incident solar radiation-based strategy WISR.2 being most effective, highlighting its advantage in reducing direct summer solar gains. Annual heating energy use, however, was 157.1 kWh/m2, significantly higher than the cooling demand. ECW controls consistently reduced heating demands by −4.7 to −10.3 kWh/m2. Temperature-based strategies WOT.0 and WOT.2 achieved the greatest reductions, showing that by enhancing passive solar gains in winter, heating loads can be substantially decreased.

4. Discussion

This study evaluated the performance of ECWs in university classrooms of different scales in a cold-region climate. The results show that ECWs can improve thermal and visual comfort and reduce heating and cooling energy use, although the extent of improvement varied by control strategy and classroom scale. These findings are generally consistent with previous studies.
Our findings are broadly consistent with previous research. Li et al. [46] reported 5–8% gains in visual comfort and 8–12% cooling energy savings in office buildings, similar to the +6.0–6.3% comfort improvements and −7.9 to −10.1 kWh/m2 cooling reductions observed in medium and small classrooms in this study. In contrast, the large classroom (Type I) achieved only modest comfort gains (max. +5.8%), likely due to its greater depth and thermal mass, which hinder daylight penetration and result in slow thermal response. This indicates that ECWs are less effective in deep-plan classrooms unless combined with complementary design measures. Cooling reductions in Xi’an were lower than those reported in warmer climates [47]. This difference reflects the climatic context: In cold regions, ECWs contribute more significantly to reducing heating loads than cooling. In fact, this study found heating demand reductions of up to −11.6 kWh/m2, consistent with results from Beijing [48] and Russia [49], where ECWs primarily alleviated winter heating demands. Building geometry also shaped performance. Medium and small classrooms, with higher window-to-wall ratios and shorter daylight paths, achieved larger relative benefits, echoing studies on high-WWR office buildings [50]. This suggests that ECWs are particularly effective in spaces with large façades relative to their volume. Finally, compared with recent advances, such as vacuum-structured ECWs with ultra-low U-values [51], the conventional ECWs tested here achieved moderate reductions. This underscores both their practical feasibility and the potential for future material innovations to enhance cold-climate performance.
This study has several limitations. First, the results are based on simulations and lack experimental validation. Second, the analysis was limited to three classroom types and three rule-based control strategies, which may not represent the full diversity of educational spaces or advanced control methods. Third, Xi’an was chosen as a single representative cold-climate city; thus, generalization to other regions should be carried out with caution.
Future research should explore multi-factor coupled control strategies, such as combined temperature–illuminance–occupancy control, to optimize both energy use and comfort. In addition, field measurements in real classrooms are needed to validate the simulation results and capture user behavior, lighting operation, and HVAC interactions that cannot be fully represented in models. Expanding the analysis to other cold-region cities with different solar and heating profiles would also strengthen the generalizability of the findings. Furthermore, testing advanced ECW technologies with lower U-values or hybrid glazing systems could provide insights into material innovations tailored for cold climates.

5. Conclusions

This study employed dynamic simulations to evaluate the impact of ECWs on indoor environments and building energy performance in university classrooms of varying scales in Xi’an, a representative cold-region city. The main findings are as follows:
  • Improved indoor comfort: With ECWs, annual mean indoor temperatures increased in all classrooms, thermal comfort time ratios improved by +0.6–4.5%, and visual comfort time ratios improved by +1.1–6.3%. The small classroom achieved the most significant improvements, highlighting that ECWs are particularly effective in compact high-density spaces.
  • Energy savings dependent on scale and strategy: ECWs effectively reduced both heating and cooling demands, with heating energy reductions of −3.2 to −11.6 kWh/m2 and cooling reductions of −4.0% to −14.3%. The greatest savings occurred in the small classroom, while improvements in the large classroom were comparatively limited, suggesting that ECWs’ effectiveness is scale-sensitive.
  • Strategy-specific advantages: Temperature-based control was most effective in improving thermal comfort and reducing heating demands; illuminance-based control excelled in enhancing visual comfort; solar-radiation-based control provided the greatest cooling load reduction. This demonstrates that no single control approach is universally optimal, and strategy selection should be tailored to design priorities.
  • Scale effects: The benefits of ECWs diminished with an increase in classroom size, implying that large spaces may require integration with supplementary systems such as artificial lighting or shading devices to achieve optimal performance.
In summary, this study provides evidence that ECWs offer significant potential for energy savings and comfort enhancement in cold-region educational buildings, especially in small-scale and medium-scale classrooms. The main contribution of this study lies in its cross-scale analysis, which reveals how classroom size and control strategies jointly shape ECW performance.

Author Contributions

F.G.: Conceptualization, Methodology, Software, Validation, Formal analysis, Investigation, Visualization, Writing—original draft. X.Y.: Funding acquisition, Conceptualization. Z.Q.: Methodology, Y.X.: Supervision, Resources, Conceptualization. All authors have read and agreed to the published version of the manuscript.

Funding

This work was supported by the China National Social Science Foundation (grant number 22BSH122); the Shaanxi Natural Science Basic Research Program (grant number 2025JC-YBMS-605); the Shaanxi Provincial Social Science Foundation (grant number 2024J011); the Key Project of Education and Teaching Reform of Xi’an University of Technology (grant number xjy2412); the National Art Fund Youth Art Creation Talent Support Project (Art Criticism: Value Inheritance and Regional Identity of National Industrial Heritage Cultural Memory Space); the Xi’an Science and Technology Bureau Project—2024 Xi’an Science and Technology Plan Project (grant number 24GXFW0065); and the Shaanxi Provincial Department of Science and Technology—Shaanxi Natural Science Basic Research Program (Youth Project, grant number 2025JC-YBQN-762).

Institutional Review Board Statement

Not applicable.

Informed Consent Statement

Not applicable.

Data Availability Statement

The original contributions presented in this study are included in the article. Further inquiries can be directed to the corresponding author.

Acknowledgments

The authors thank the professors and students at the University of Kitakyushu, for their generous help with the full paper from investigation to the checking process.

Conflicts of Interest

The authors declare no conflicts of interest.

References

  1. Ghulam, A.; Khalid, Z.; Shukui, T.; Tan, S.-k.; Faiza, S. Does energy consumption contribute to climate change? Evidence from major regions of the world. Renew. Sustain. Energy Rev. 2014. [Google Scholar] [CrossRef]
  2. Ma, M.; Cai, W.; Cai, W. Carbon abatement in China’s commercial building sector: A bottom-up measurement model based on Kaya–LMDI methods. Energy 2018, 165, 350–368. [Google Scholar] [CrossRef]
  3. Adriana, C.; Federica, R.; Jacopo, D.O.; Virgilio, C.; Marco, F.; Ferdinando, S. Multi-objective approach to the optimization of shape and envelope in building energy design. Appl. Energy 2020. [Google Scholar] [CrossRef]
  4. Fatima, H.; Farouk, F.; Pascal Henry, B. Passive design optimization of low energy buildings in different climates. Energy 2018, 165, 591–613. [Google Scholar] [CrossRef]
  5. Xu, Y.; Zhang, G.; Yang, C.; Wang, G.; Jiang, Y.; Zhang, K. A two-stage multi-objective optimization method for envelope and energy generation systems of primary and secondary school teaching buildings in China. Build. Environ. 2021, 204, 108142. [Google Scholar] [CrossRef]
  6. Meng, X. Influence of air-conditioning intermittent operation on the cooling load from opaque envelopes in residences. Case Stud. Therm. Eng. 2024, 58, 104393. [Google Scholar] [CrossRef]
  7. Ascione, F.; Bianco, N.; Mauro, G.M.; Napolitano, D.F. Building envelope design: Multi-objective optimization to minimize energy consumption, global cost and thermal discomfort. Application to different Italian climatic zones. Energy 2019, 174, 359–374. [Google Scholar] [CrossRef]
  8. Chi, F.; Xu, Y. Building performance optimization for university dormitory through integration of digital gene map into multi-objective genetic algorithm. Appl. Energy 2022, 307, 118211. [Google Scholar] [CrossRef]
  9. Baraa, J.A.-K.; Shouib Nouh, M.B. Improving visual comfort and energy efficiency in existing classrooms using passive daylighting techniques. Energy Procedia 2017, 136, 102–108. [Google Scholar] [CrossRef]
  10. Aburas, M.; Soebarto, V.; Williamson, T.; Liang, R.; Ebendorff-Heidepriem, H.; Wu, Y. Thermochromic smart window technologies for building application: A review. Appl. Energy 2019, 255, 113522. [Google Scholar] [CrossRef]
  11. Acosta-Acosta, D.F.; El-Rayes, K. Optimal design of classroom spaces in naturally ventilated buildings to maximize occupant satisfaction with human bioeffluents/body odor levels. Build. Environ. 2020, 169, 106543. [Google Scholar] [CrossRef]
  12. Bakmohammadi, P.; Noorzai, E. Optimization of the design of the primary school classrooms in terms of energy and daylight performance considering occupants’ thermal and visual comfort. Energy Rep. 2020, 6, 1590–1607. [Google Scholar] [CrossRef]
  13. Doulos, L.T.; Kontadakis, A.; Madias, E.N.; Sinou, M.; Tsangrassoulis, A. Minimizing energy consumption for artificial lighting in a typical classroom of a Hellenic public school aiming for near Zero Energy Building using LED DC luminaires and daylight harvesting systems. Energy Build. 2019, 194, 201–217. [Google Scholar] [CrossRef]
  14. Dussault, J.M.; Gosselin, L. Office buildings with electrochromic windows: A sensitivity analysis of design parameters on energy performance, and thermal and visual comfort. Energy Build. 2017, 153, 50–62. [Google Scholar] [CrossRef]
  15. Giouri, E.D.; Tenpierik, M.; Turrin, M. Zero energy potential of a high-rise office building in a Mediterranean climate: Using multi-objective optimization to understand the impact of design decisions towards zero-energy high-rise buildings. Energy Build. 2017, 209, 109666. [Google Scholar] [CrossRef]
  16. Zhao, J.; Du, Y. Multi-objective optimization design for windows and shading configuration considering energy consumption and thermal comfort: A case study for office building in different climatic regions of China. Sol. Energy 2020, 206, 997–1017. [Google Scholar] [CrossRef]
  17. Si, P.; Feng, Y.; Lv, Y.; Rong, X.; Pan, Y.; Liu, X.; Yan, J. An optimization method applied to active solar energy systems for buildings in cold plateau areas—The case of Lhasa. Appl. Energy 2017, 194, 487–498. [Google Scholar] [CrossRef]
  18. Teixeira, H.; Moret Rodrigues, A.; Aelenei, D.; Gomes, M.G. Simulation-based evaluation of the impact of an electrochromic glazing on the energy use and indoor comfort of an office room. Energies 2024, 17, 2110. [Google Scholar] [CrossRef]
  19. Xu, Y.; Yan, C.; Yan, S.; Liu, H.; Pan, Y.; Zhu, F.; Jiang, Y. A multi-objective optimization method based on an adaptive meta-model for classroom design with smart electrochromic windows. Energy 2021, 243, 122777. [Google Scholar] [CrossRef]
  20. Lashgari, S.; Jahangir, M.H. A comparative analysis of thermal comfort, energy consumption, pollutant emissions, and visual comfort in a school building utilizing electrochromic and thermochromic windows. Energy Strategy Rev. 2025, 60, 101772. [Google Scholar] [CrossRef]
  21. Fang, Y.; Eames, P.C.; Norton, B.; Hyde, T.; Huang, Y.; Hewitt, N. The thermal performance of an electrochromic vacuum glazing with selected low-emittance coatings. Thin Solid Film. 2008, 516, 1074–1081. [Google Scholar] [CrossRef]
  22. Lu, W. Dynamic shading and glazing technologies: Improve energy, visual, and thermal performance. Energy Built Environ. 2024, 5, 211–229. [Google Scholar] [CrossRef]
  23. Pittaluga, M. The electrochromic wall. Energy Build. 2013, 66, 49–56. [Google Scholar] [CrossRef]
  24. Wu, S.; Sun, H.; Duan, M.; Mao, H.; Wu, Y.; Zhao, H.; Lin, B. Applications of thermochromic and electrochromic smart windows: Materials to buildings. Cell Rep. Phys. Sci. 2023, 4, 101370. [Google Scholar] [CrossRef]
  25. Wu, X.; Zhang, W.; Xie, L.; Zhao, O.; Li, Z.; Li, J.; Zhong, J. Study on the impact of partition photovoltaic electrochromic windows on building lighting environment and energy saving. Energy Build. 2023, 280, 112722. [Google Scholar] [CrossRef]
  26. Isaia, F.; Fiorentini, M.; Serra, V.; Capozzoli, A. Enhancing energy efficiency and comfort in buildings through model predictive control for dynamic façades with electrochromic glazing. J. Build. Eng. 2021, 43, 102535. [Google Scholar] [CrossRef]
  27. Sun, Y.; Hao, Y.; Wang, D.; Wang, W.; Deng, S.; Qi, H.; Xue, P. A predictive control strategy for electrochromic glazing to balance the visual and thermal environmental requirements: Approach and energy-saving potential assessment. Renew. Energy 2022, 194, 334–348. [Google Scholar] [CrossRef]
  28. Li, W.; Shah, K.W.; Li, Y. Effects of electrochromic glass window on energy efficiency, thermal and visual performances under tropical climate. Energy Sustain. Dev. 2023, 76, 101300. [Google Scholar] [CrossRef]
  29. Wong, I.L. A review of daylighting design and implementation in buildings. Renew. Sustain. Energy Rev. 2017, 74, 959–968. [Google Scholar] [CrossRef]
  30. Marszal, A.J.; Heiselberg, P.; Bourrelle, J.S.; Musall, E.; Voss, K.; Sartori, I.; Napolitano, A. Zero Energy Building—A review of definitions and calculation methodologies. Energy Build. 2011, 43, 971–979. [Google Scholar] [CrossRef]
  31. Hamdy, M.; Nguyen, A.-T.; Hensen, J.L.M. A performance comparison of multi-objective optimization algorithms for solving nearly-zero-energy-building design problems. Energy Build. 2016, 121, 57–71. [Google Scholar] [CrossRef]
  32. Fernandes, L.L.; Lee, E.S.; Ward, G. Lighting energy savings potential of split-pane electrochromic windows controlled for daylighting with visual comfort. Energy Build. 2013, 61, 8–20. [Google Scholar] [CrossRef]
  33. Jain, S.; Karmann, C.; Wienold, J. Behind electrochromic glazing: Assessing user’s perception of glare from the sun in a controlled environment. Energy Build. 2022, 256, 111738. [Google Scholar] [CrossRef]
  34. Lee, J.H.; Jeong, J.; Chae, Y.T. Optimal control parameter for electrochromic glazing operation in commercial buildings under different climatic conditions. Appl. Energy 2020, 260, 114338. [Google Scholar] [CrossRef]
  35. Iastiaque Martins, G.; Secco, D.; Kazue Tokura, L.; Aparecido Bariccatti, R.; Dresch Dolci, B.; Ferreira Santos, R. Potential of tilapia oil and waste in biodiesel production. Renew. Sustain. Energy Rev. 2015, 42, 234–239. [Google Scholar] [CrossRef]
  36. Sandra Carolina, C.M.; Malcolm, C.; Andreas, W. Avoiding overheating in existing school buildings through optimized passive measures. Build. Res. Inf. 2019, 48, 349–363. [Google Scholar] [CrossRef]
  37. Scofield, J.H. Comment on the paper entitled, “A review of operating performance in green buildings: Energy use, indoor environmental quality and occupant satisfaction” by Geng et al. Energy Build. 2019, 194, 369–371. [Google Scholar] [CrossRef]
  38. Liu, Q.B.; Ren, J. Energy-Saving Design Methods for Existing University Buildings in Cold Climate Regions. In Sustainable Buildings and Structures; CRC Press: Boca Raton, FL, USA, 2015; pp. 123–138. [Google Scholar]
  39. Wang, L.; Wang, Y.; Fei, F.; Yao, W.; Sun, L. Study on winter thermal environment characteristics and thermal comfort of university classrooms in cold regions of China. Energy Build. 2023, 291, 113126. [Google Scholar] [CrossRef]
  40. Mo, W.; Yao, X.; Liu, Z.-A.; Chen, S.; Li, Q.; Jiang, J.; Zhang, G.; Dewancker, B.J. Towards sustainable living in high radiation cold climates: A two-phase genetic algorithm approach for residential building optimization. Build. Environ. 2024, 266, 112133. [Google Scholar] [CrossRef]
  41. Kera, L.; Jeff, N.; Christoph, R.; Christoph, F.R. Animated building performance simulation (ABPS)—Linking Rhinoceros/Grasshopper with Radiance/Daysim. In Proceedings of the Fourth National Conference of IBPSA-USA, New York, NY, USA, 11–13 August 2010. [Google Scholar]
  42. Song, Y.; Liu, J.; Zhang, W. Design Parameters Affecting Energy Consumption of University Educational Buildings in Hot Summer and Cold Winter Area of China. Buildings 2024, 14, 1697. [Google Scholar] [CrossRef]
  43. ANSI/ASHRAE Standard 55-2010; Thermal Environmental Conditions for Human Occupancy. American Society of Heating RaA-CE: Peachtree Corners, GA, USA, 2010.
  44. Development MoHaU-R. Standard for Lighting Design of Buildings. 2013. Available online: http://lancarver.com/UpFiles/pdf/2014-08-11/081112492125.pdf (accessed on 1 October 2025).
  45. Nocente, A.; Alessandro, N.; Grynning, S.; Steinar, G.; Gullbrekken, L.; Lars, G. Electrochromic Glass system in Norwegian Climate: Control strategies and Impact on the indoor thermal conditions. J. Phys. Conf. Ser. 2021, 2069, 012127. [Google Scholar] [CrossRef]
  46. Li, Z.; Wu, Z. A study on the impact of electrochromic glazing on indoor environment. J. Build. Eng. 2024, 86, 108684. [Google Scholar] [CrossRef]
  47. DeForest, N.; Shehabi, A.; O’Donnell, J.; Garcia, G.; Greenblatt, J.; Lee, E.S.; Selkowitz, S.; Milliron, D.J. United States energy and CO2 savings potential from deployment of near-infrared electrochromic window glazings. Build. Environ. 2015, 89, 107–117. [Google Scholar] [CrossRef]
  48. Sun, Y.; Li, Y.; Xu, W.; Wang, W.; Wei, W.; Zhang, C. A glare predictive control strategy for split-pane electrochromic windows: Visual comfort and energy-saving assessment. Renew. Energy 2023, 218, 119259. [Google Scholar] [CrossRef]
  49. Oh, M.; Jang, M.; Moon, J.; Roh, S. Evaluation of Building Energy and Daylight Performance of Electrochromic Glazing for Optimal Control in Three Different Climate Zones. Sustainability 2019, 11, 287. [Google Scholar] [CrossRef]
  50. Detsi, M.; Manolitsis, A.; Atsonios, I.; Mandilaras, I.; Founti, M. Energy Savings in an Office Building with High WWR Using Glazing Systems Combining Thermochromic and Electrochromic Layers. Energies 2020, 13, 3020. [Google Scholar] [CrossRef]
  51. Mi, W.; Pu, J.; Shen, C.; Chen, G.; Soteris, K.A. Vacuum-structured electrochromic glazing windows with ultra-low U-Values for building energy savings in all climatic zones. Energy 2025, 336, 138496. [Google Scholar] [CrossRef]
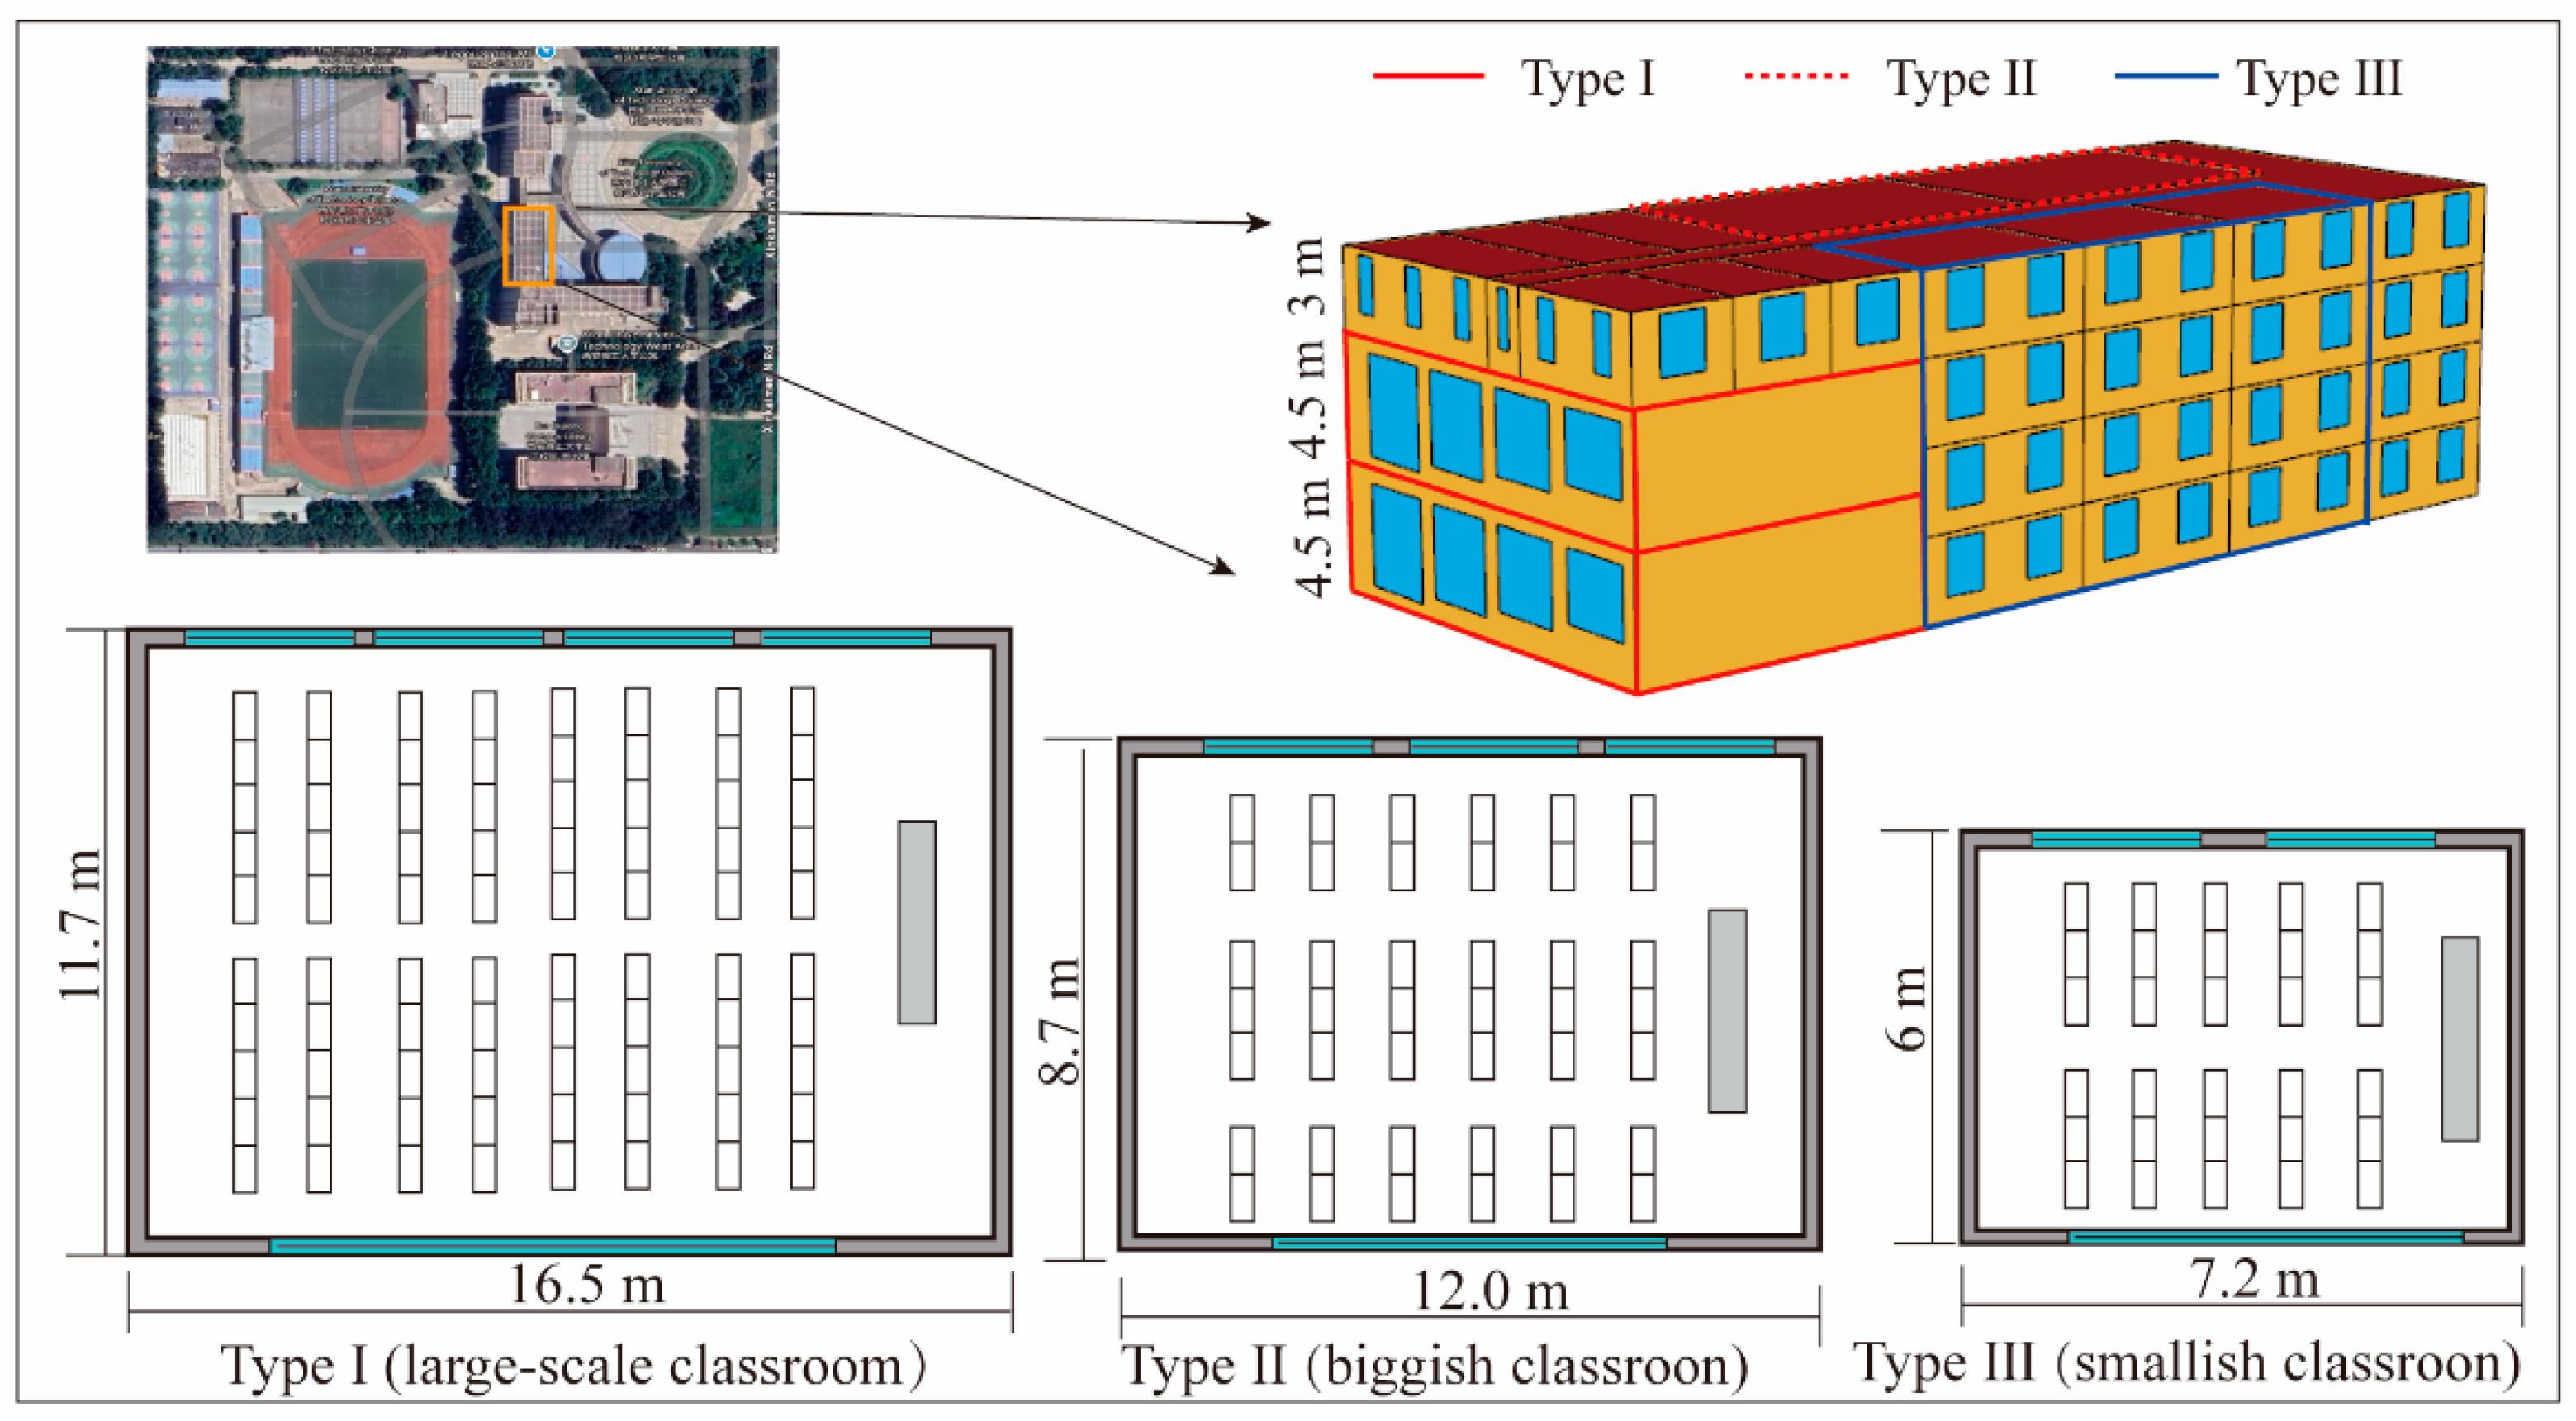
Figure 1. Geometric layouts and dimensions of three representative classroom types.
Buildings 15 03712 g001
Figure 2. Climatic conditions of Xi’an: (a) thermal zoning of China; (b) hourly illuminance distribution; (c) hourly air temperature distribution; (d) hourly radiation intensity; (e) cumulative annual solar radiation by orientation.
Buildings 15 03712 g002
Figure 3. Workflow of electrochromic window (ECW) control strategies.
Buildings 15 03712 g003
Figure 4. Illuminance distribution and visual comfort time ratio (CTRT) of the three classroom types under the benchmark case.
Buildings 15 03712 g004
Figure 5. Illuminance distribution and visual comfort time ratio (CTRT) of the three classroom types under the benchmark case.
Buildings 15 03712 g005
Figure 6. Annual indoor air temperature distributions of three classroom types under the benchmark case without HVAC operation.
Buildings 15 03712 g006
Figure 7. Annual hourly cooling energy demand distributions of the three classroom types under the benchmark case.
Buildings 15 03712 g007
Figure 8. Annual hourly heating energy demand distributions of the three classroom types under the benchmark case.
Buildings 15 03712 g008
Figure 9. Performance outcomes of Type I under the benchmark case and various electrochromic window control strategies.
Buildings 15 03712 g009
Figure 10. Performance outcomes of Type II under the benchmark case and various electrochromic window control strategies.
Buildings 15 03712 g010
Figure 11. Performance outcomes of Type III under the benchmark case and various electrochromic window control strategies.
Buildings 15 03712 g011
Table 1. Performance evaluation metrics.
IndicatorMethod/StandardUnit
Thermal comfortASHRAE Standard 55-2010. adaptive model (80% range) [43]; Tcom based on 7–30 day running mean outdoor temperature%
Visual comfortUseful daylight illuminance (UDI300–1000) [44]; 1 m grid, 1.2 m sensors%
Indoor temperatureHourly simulation average°C
Cooling energy useAnnual cooling demand; energy use intensitykWh/m2
Heating energy useAnnual heating demand; energy use intensitykWh/m2
Table 2. Threshold conditions for different control strategies.
Control Strategy State
Temperaturewot,0S1 (<20 °C); S2 (21–25 °C); S3 (26–30 °C); S4 (>30 °C);
wot,1 S1 (<20 °C); S2 (21–30 °C); S3 (31–40 °C); S4 (>40 °C);
wot,2 S1 (<20 °C); S2 (21–35 °C); S3 (36–50 °C); S4 (>50 °C);
Illuminancewi,0S1 (0–100 Lux); S2 (101–300 Lux); S3 (301–500 Lux); S4 (>500 Lux);
wi,1S1 (0–300 Lux); S2 (301–400 Lux); S3 (401–500 Lux); S4 (>500 Lux);
wi,2S1 (0–100 Lux); S2 (101–200 Lux); S3 (201–300 Lux); S4 (>300 Lux);
Incident solar radiationwisr,0S1 (0–60 W/m2); S2 (61–80W/m2); S3 (81–100 W/m2); S4 (>100 W/m2);
wisr,1S1 (0–60 W/m2); S2 (61–180 W/m2); S3 (181–300 W/m2); S4 (>300 W/m2);
wisr,2S1 (0–100 W/m2); S1 (101–20 W/m2); S1 (201–300 W/m2); S1 (>300 W/m2);
Table 3. Properties of electrochromic window glass states.
Electrochromic Window StatesU-Value [W/m2·K]SHGC [–]VT [%]
State 1 (S1, bleached)1.630.4762.1
State 2 (S2)1.630.1721.2
State 3 (S3)1.630.115.9
State 4 (S4, fully tinted)1.630.091.0
Table 4. Set-point of building models used in the experiment.
ParametersValues
Occupant density [person/m2]0.65
Fresh air per person [m3/h]30
Average illuminance setting of working face [lux]500
Cooling setpoint [°C]26
Heating setpoint [°C]18
Internal heat gainLighting: 8 W/m2; equipment: 5 W/m2
Thermal conductivity of external wall [W/m·K]0.9
Thickness of external wall [m]0.24
Thermal performance of internal wall [–]Adiabatic
Disclaimer/Publisher’s Note: The statements, opinions and data contained in all publications are solely those of the individual author(s) and contributor(s) and not of MDPI and/or the editor(s). MDPI and/or the editor(s) disclaim responsibility for any injury to people or property resulting from any ideas, methods, instructions or products referred to in the content.