
Seismic Performance and Flexural Capacity Analysis of Embedded Steel Plate Composite Shear Wall Structure with Fiber-Reinforced Concrete in the Plastic Hinge Zone


Abstract
1. Introduction
2. Verification of the ABAQUS Model
2.1. Material Constitutive Relation and Yield Condition
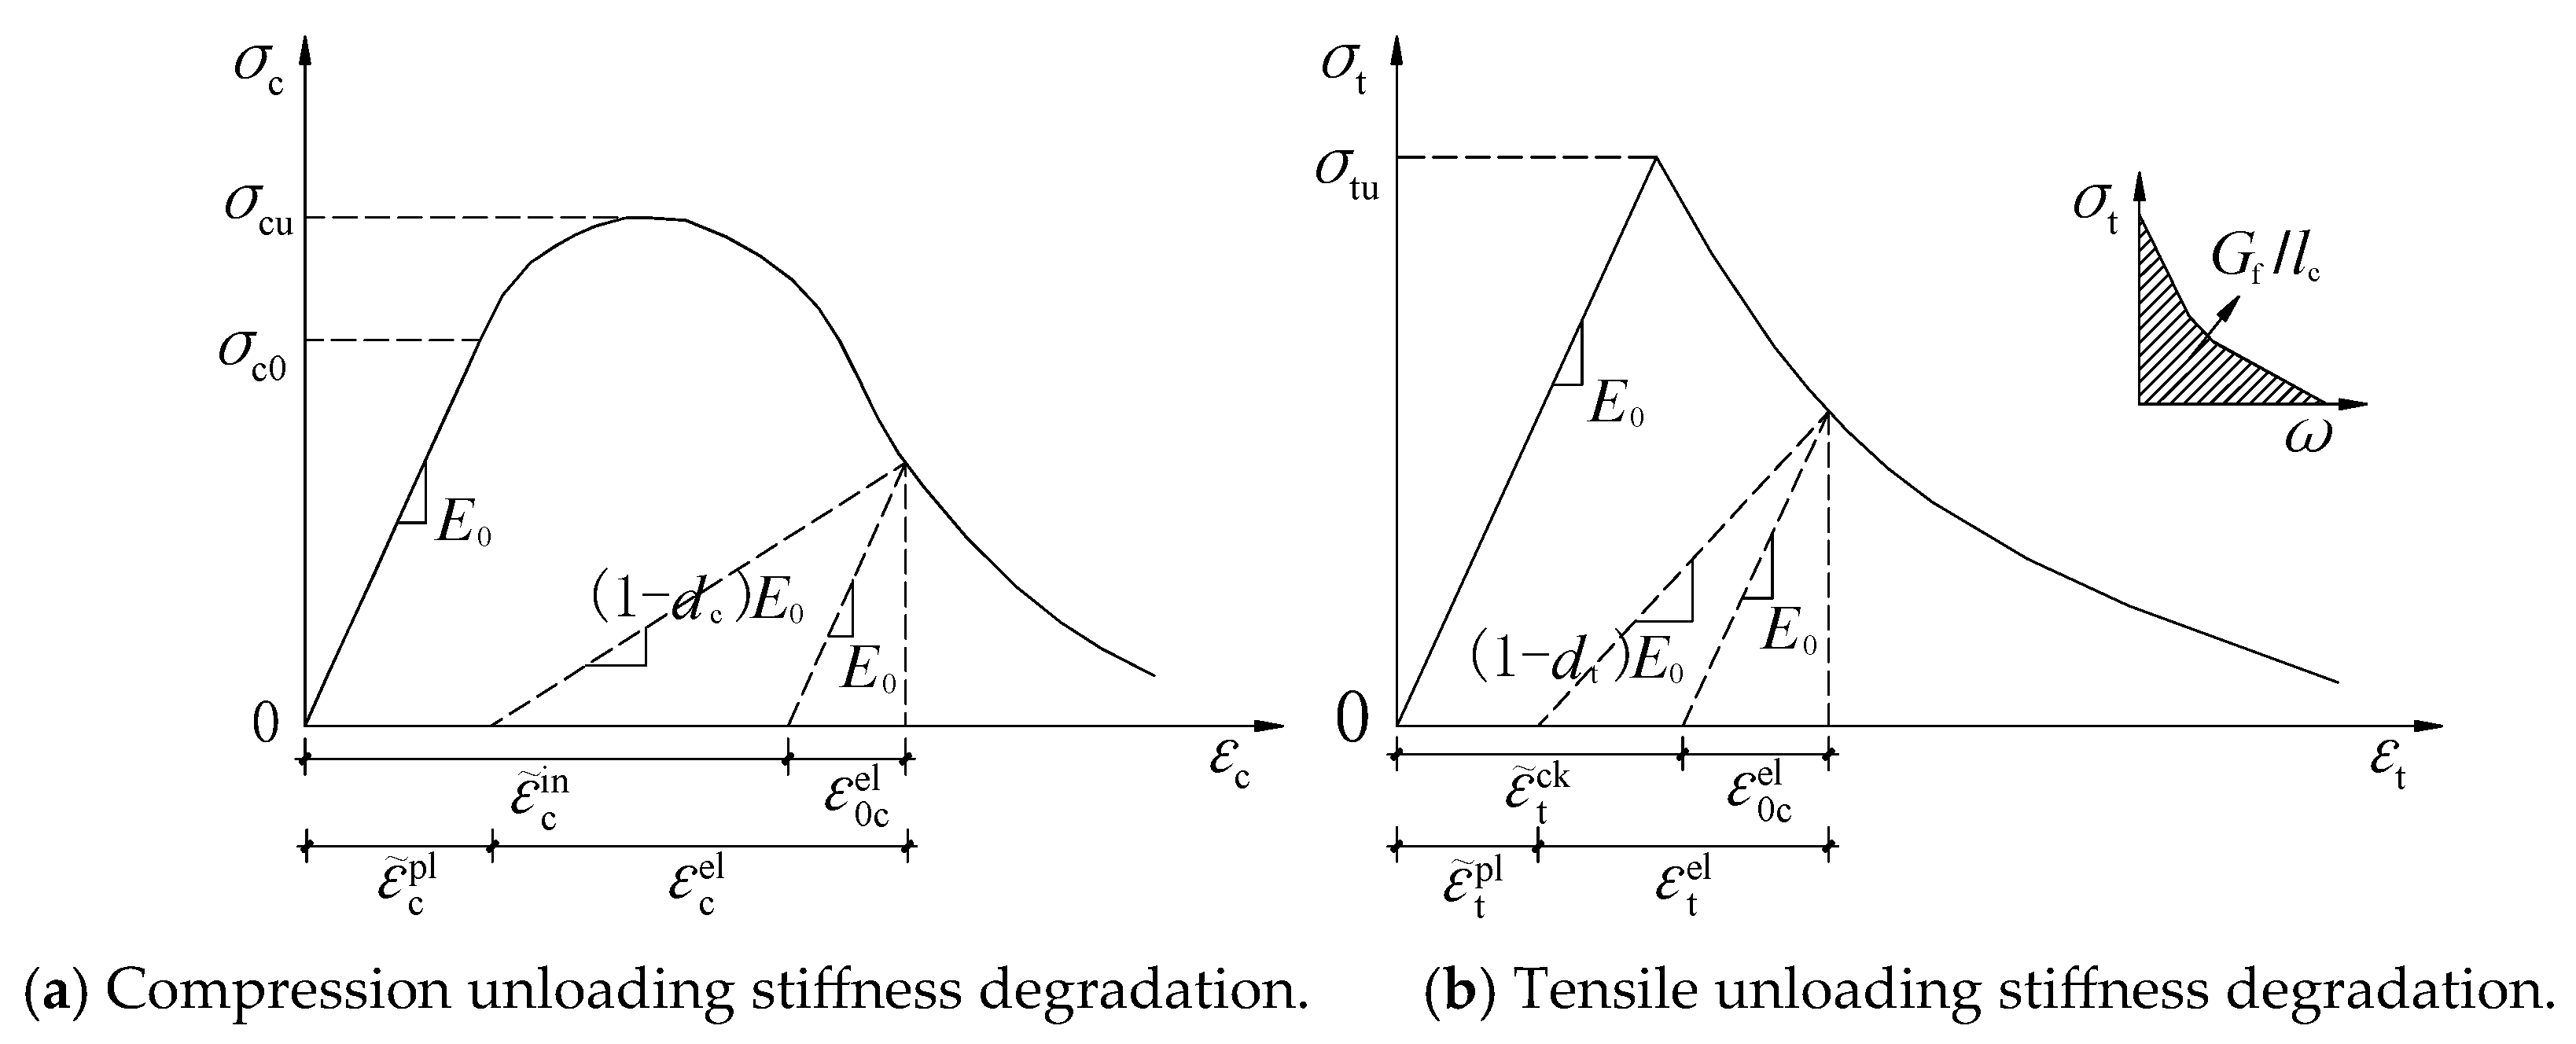
2.1.1. Constitutive Relation of Concrete
- (1)
- Constitutive relation of ordinary concrete
- (2)
- The constitutive relationship of FRC
2.1.2. Concrete Failure Criteria
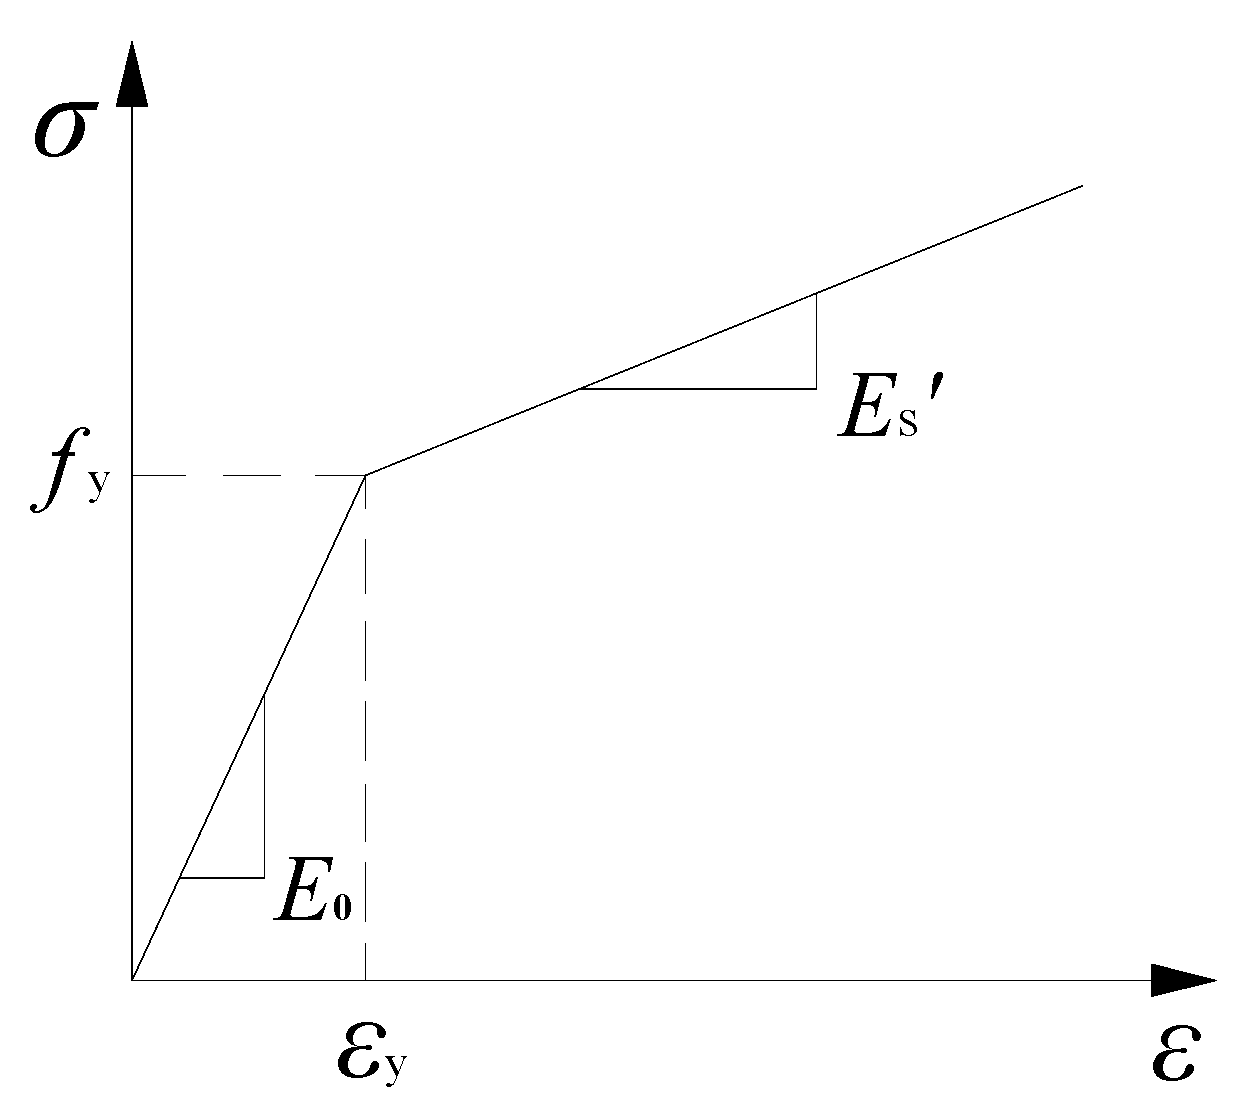
2.1.3. The Constitutive Relationship of Steel
2.1.4. Yield Criterion for Steel
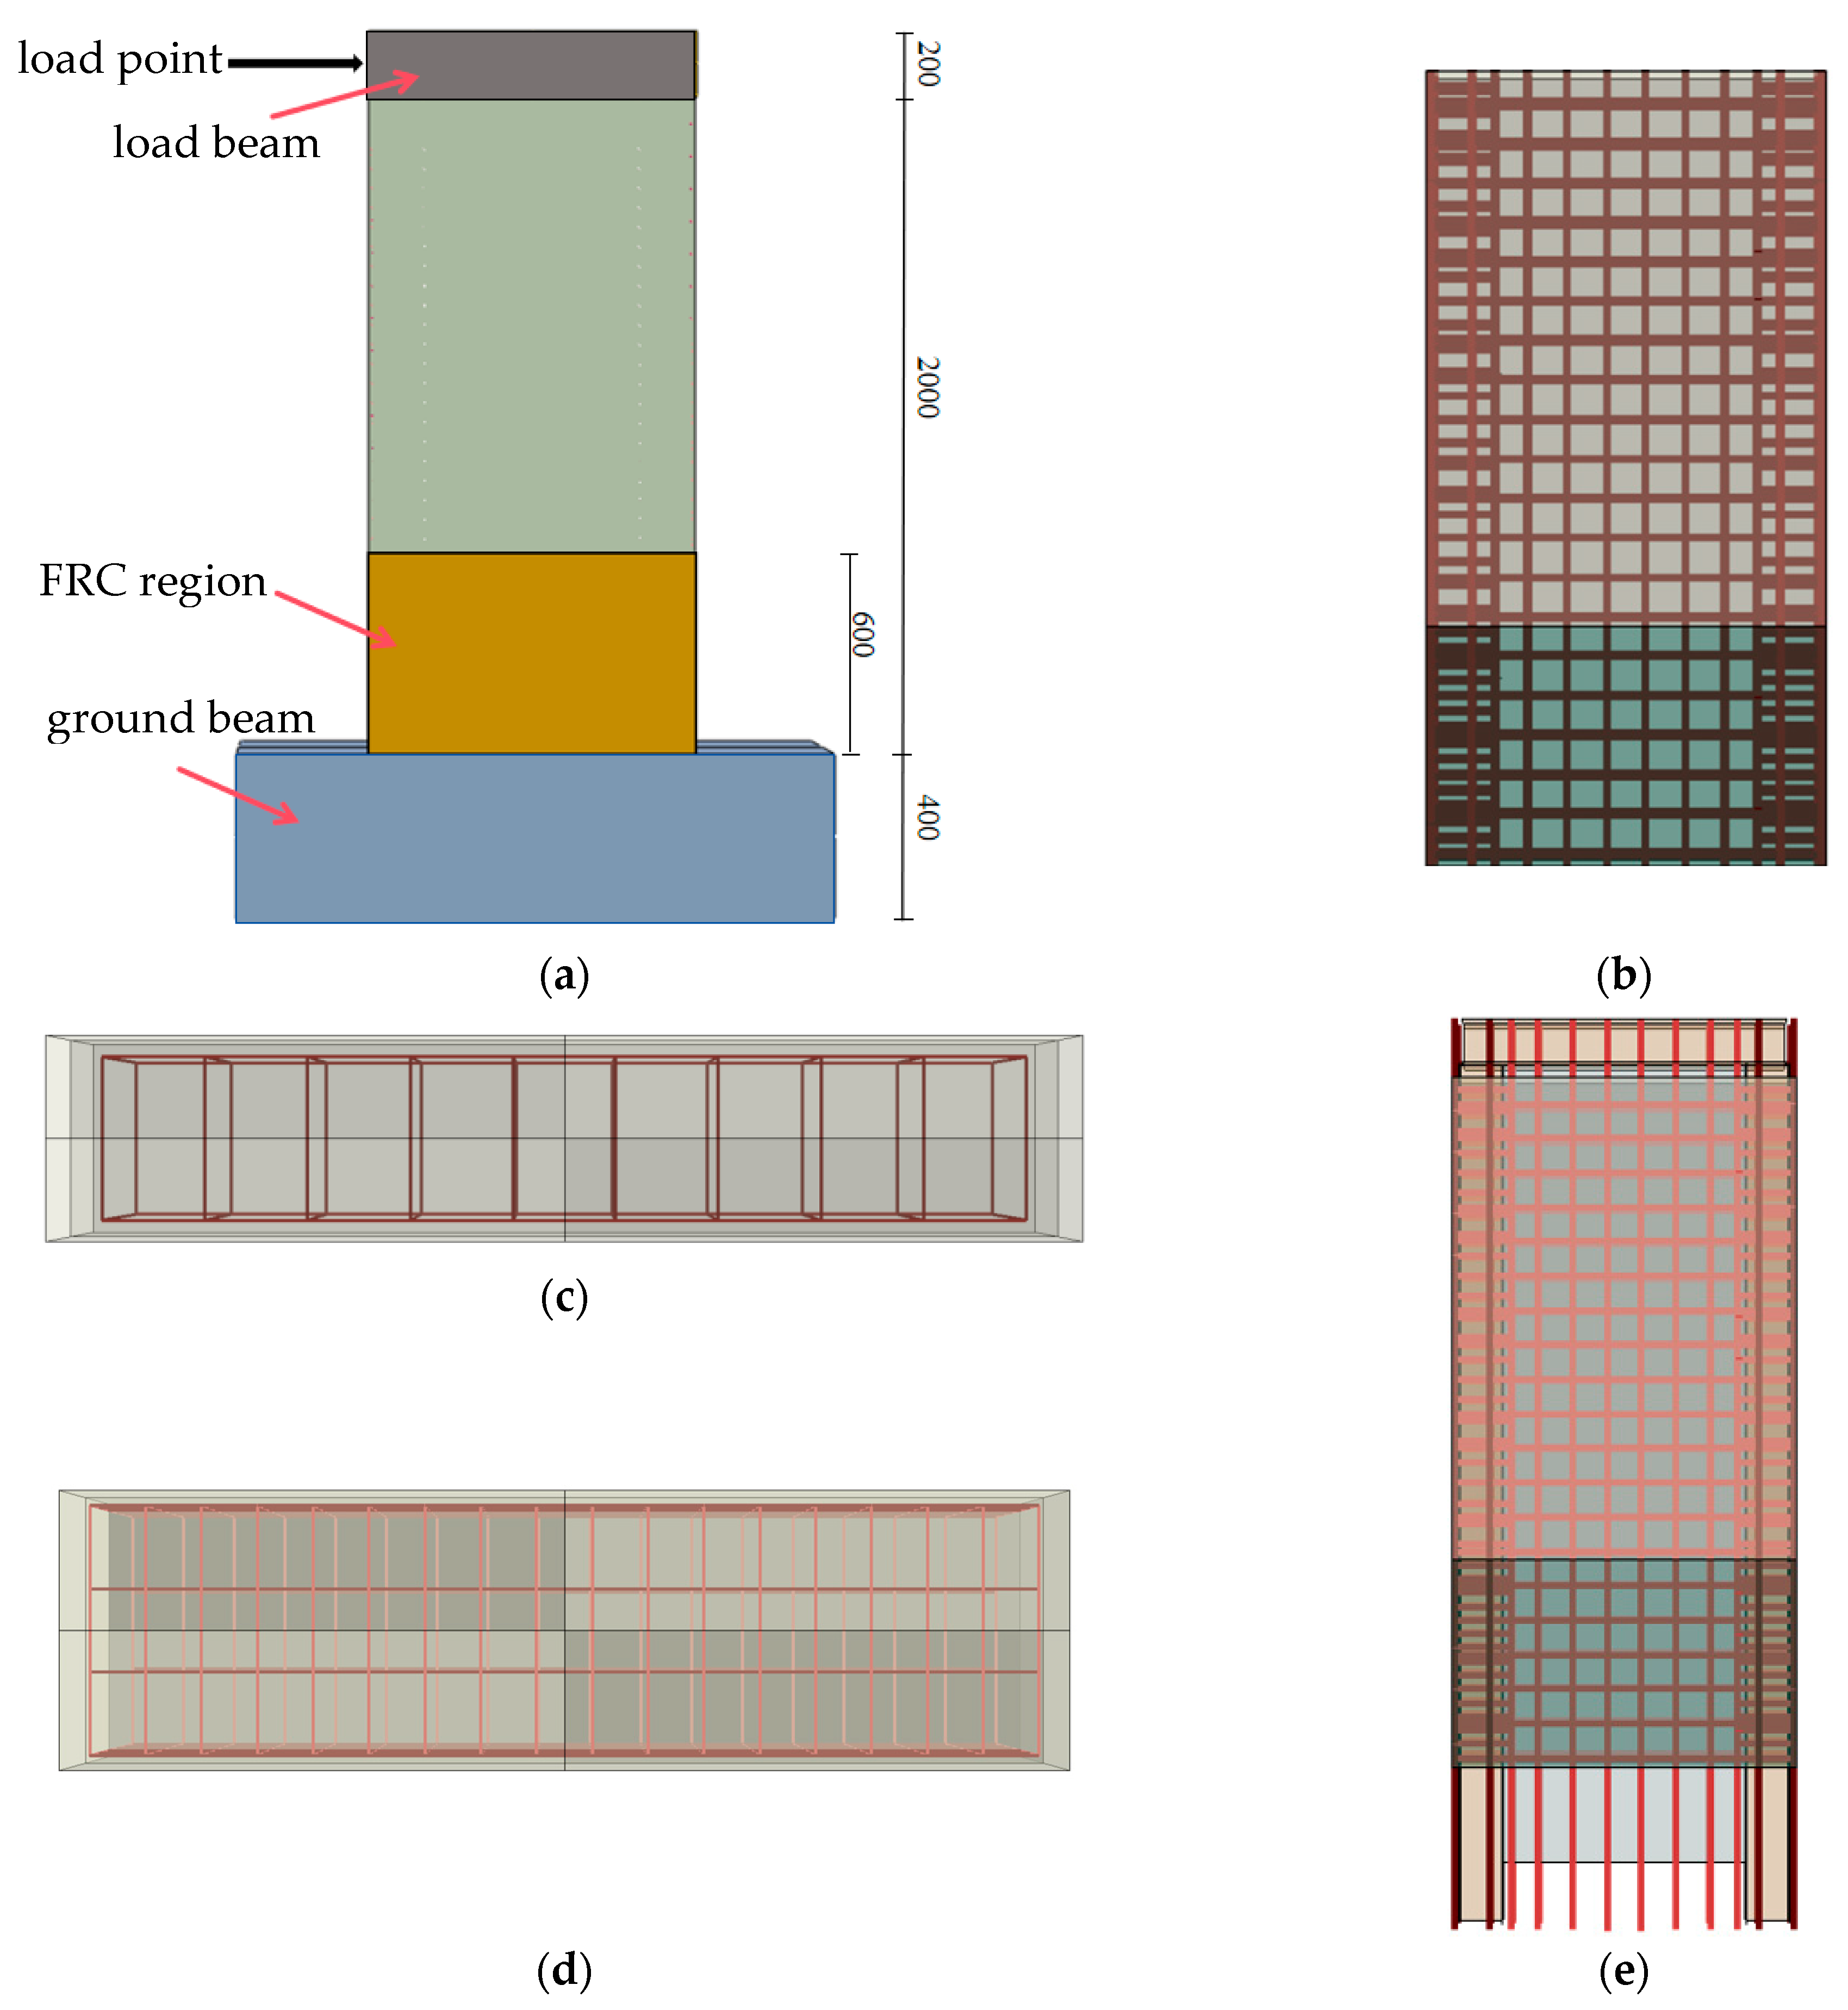
2.2. Establishment of the ABAQUS Model
2.2.1. Model Size and Material Parameters
- (1)
- Size and material parameters of shear wall model with FRC concrete in the plastic hinge zone.
- (2)
- Built-in steel plate concrete composite shear wall model size and specimen parameters
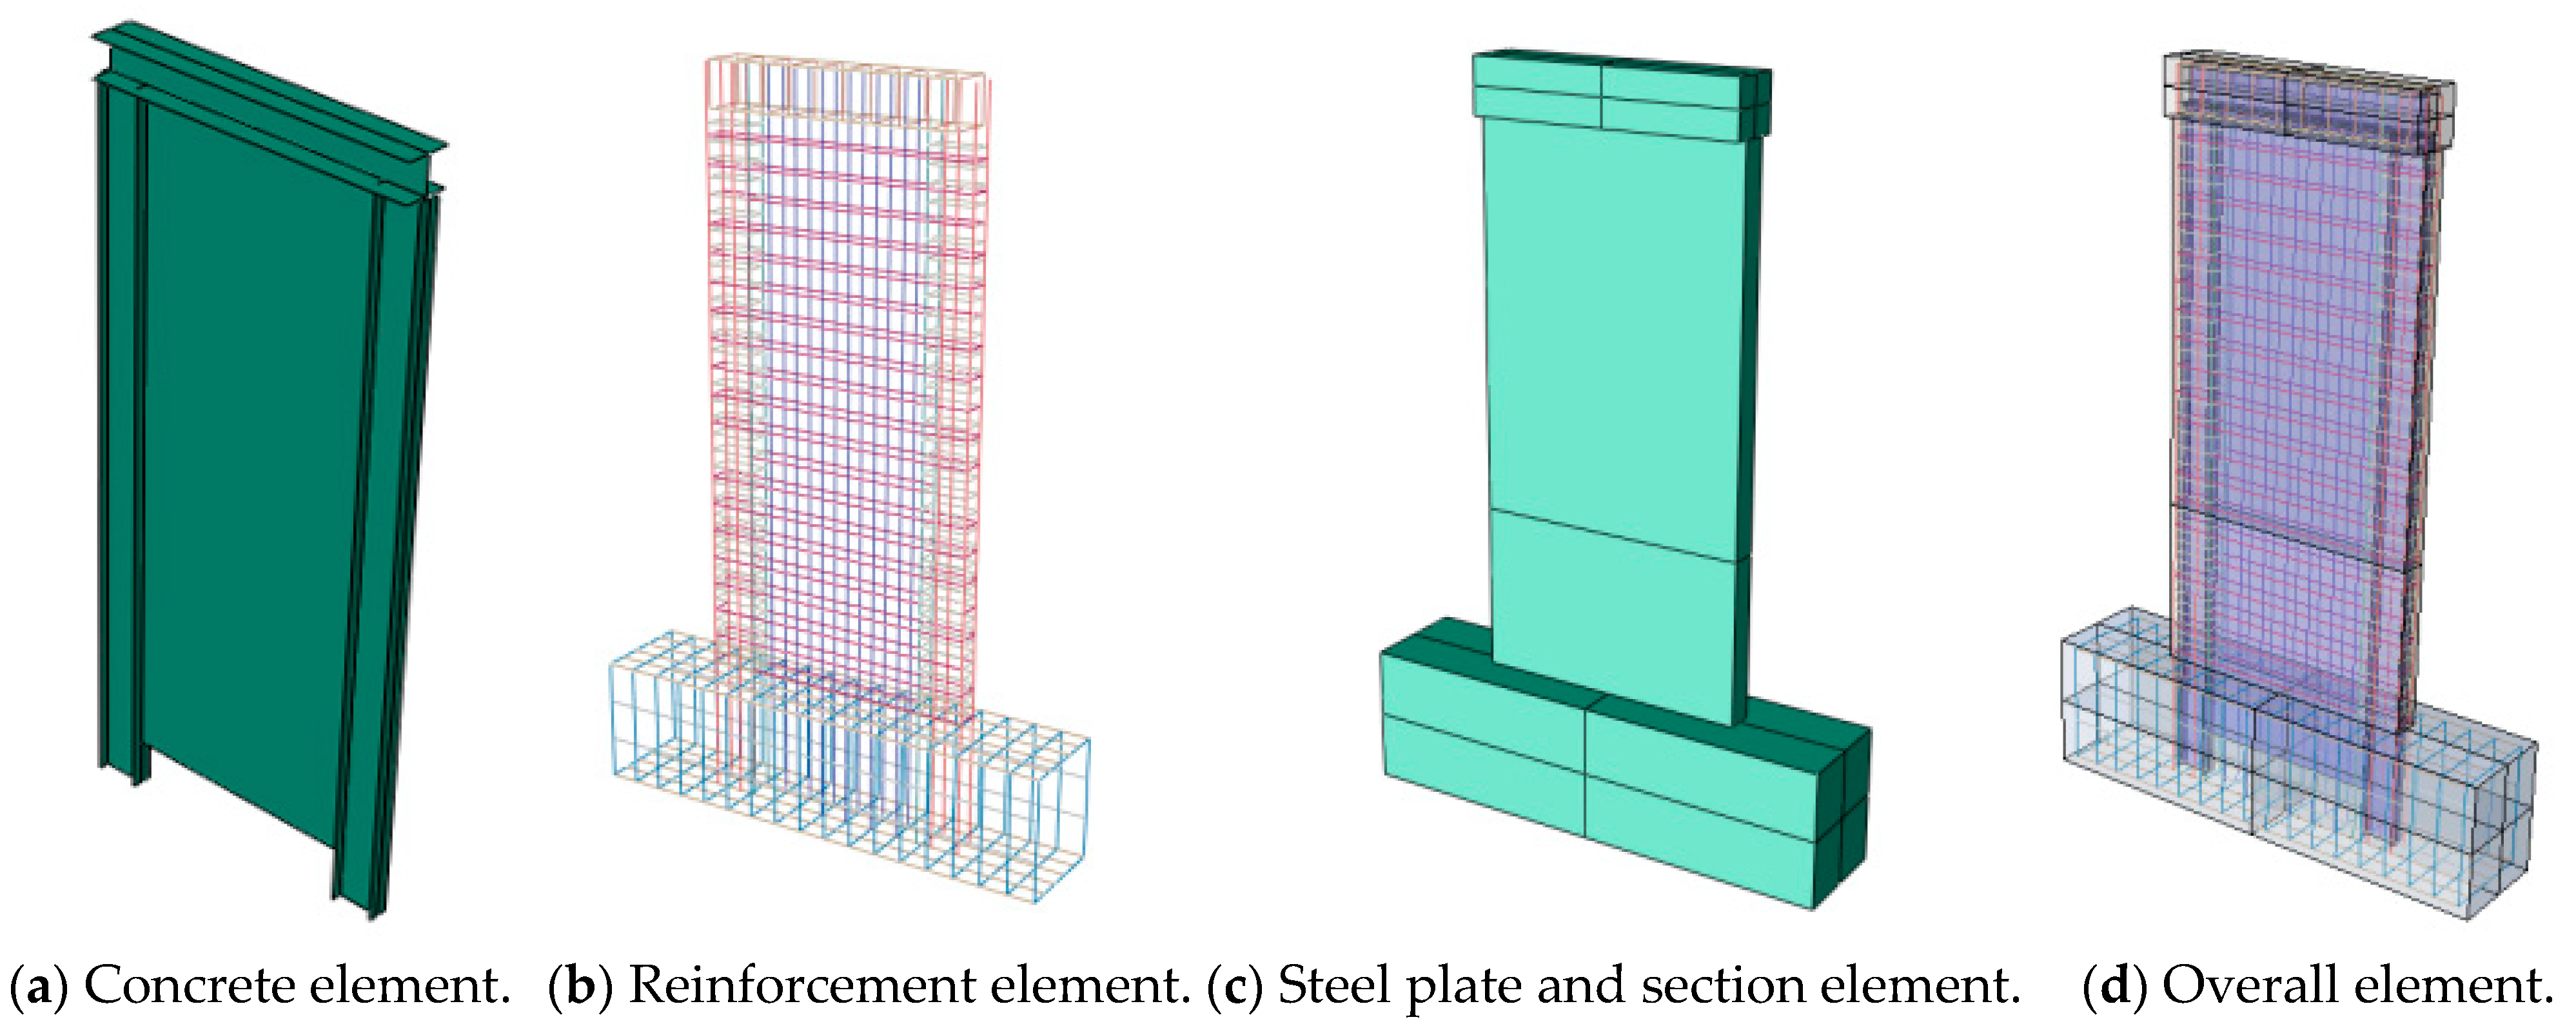
2.2.2. Element and Section Properties
- (1)
- Selection of concrete materials
- (2)
- Steel selection
2.2.3. Simulation of Boundary Conditions
2.2.4. Simulation of Loading and Loading Procedures
2.2.5. Mesh Discretization
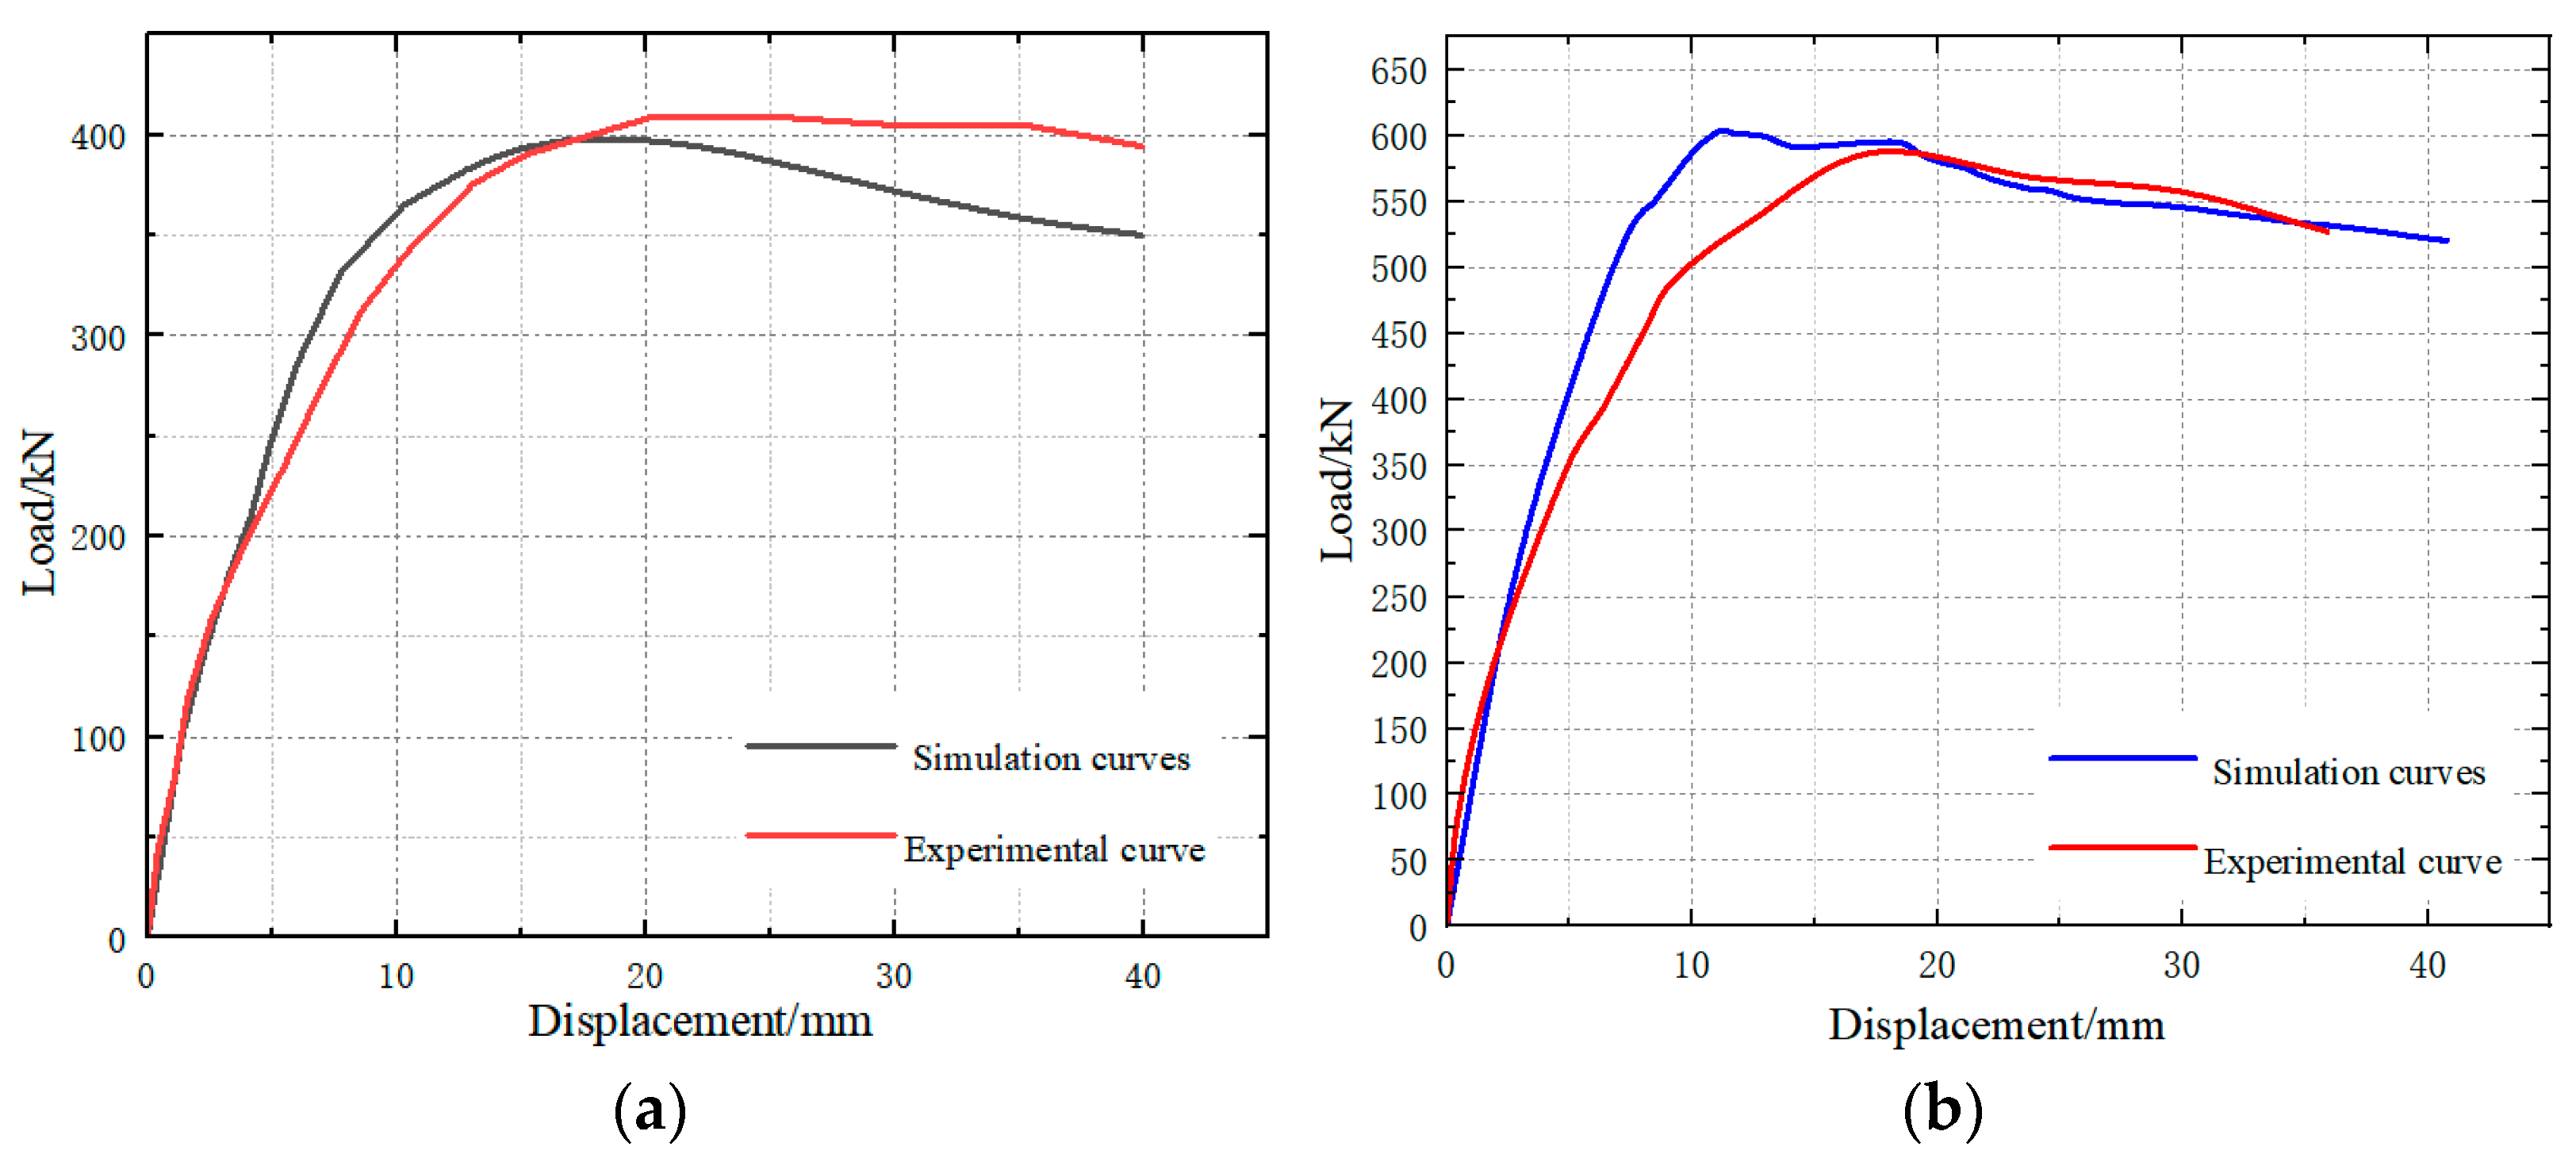
2.3. Comparison Between Computational and Experimental Results
- (1)
- Idealized boundary conditions were applied in the simulation. For example, the foundation beam was fully constrained in the simulation, whereas in the experiment, it was fixed with compression beams and shear bolts, which may loosen during cyclic loading.
- (2)
- The materials used in the experimental specimens (concrete and steel) inevitably contain defects, while in the simulation, they were treated as homogeneous, which does not accurately represent the material strengths observed in the experiment.
- (3)
- In the simulation, only monotonic horizontal displacement was applied, whereas the experiment involved low-cycle reversal loading with varying levels of damage at each stage. Consequently, the damage sustained by the specimen in the simulation and experiment at the same displacement differed.
- (4)
- Some relative slip between the reinforcement, steel plates, and concrete within the specimen is inevitable. However, in the finite element simulation, the interaction between steel and concrete was assumed to be embedded. Although shear bolts were placed at the top of the steel plates, the effect of this slip on the specimen’s strength cannot be neglected.
3. Different Parameter Analysis of the Embedded Steel Plate Composite Shear Wall Structure with FRC in the Plastic Hinge Zone
3.1. Simulation Specimen Scheme
3.2. Finite Element Simulation Analysis
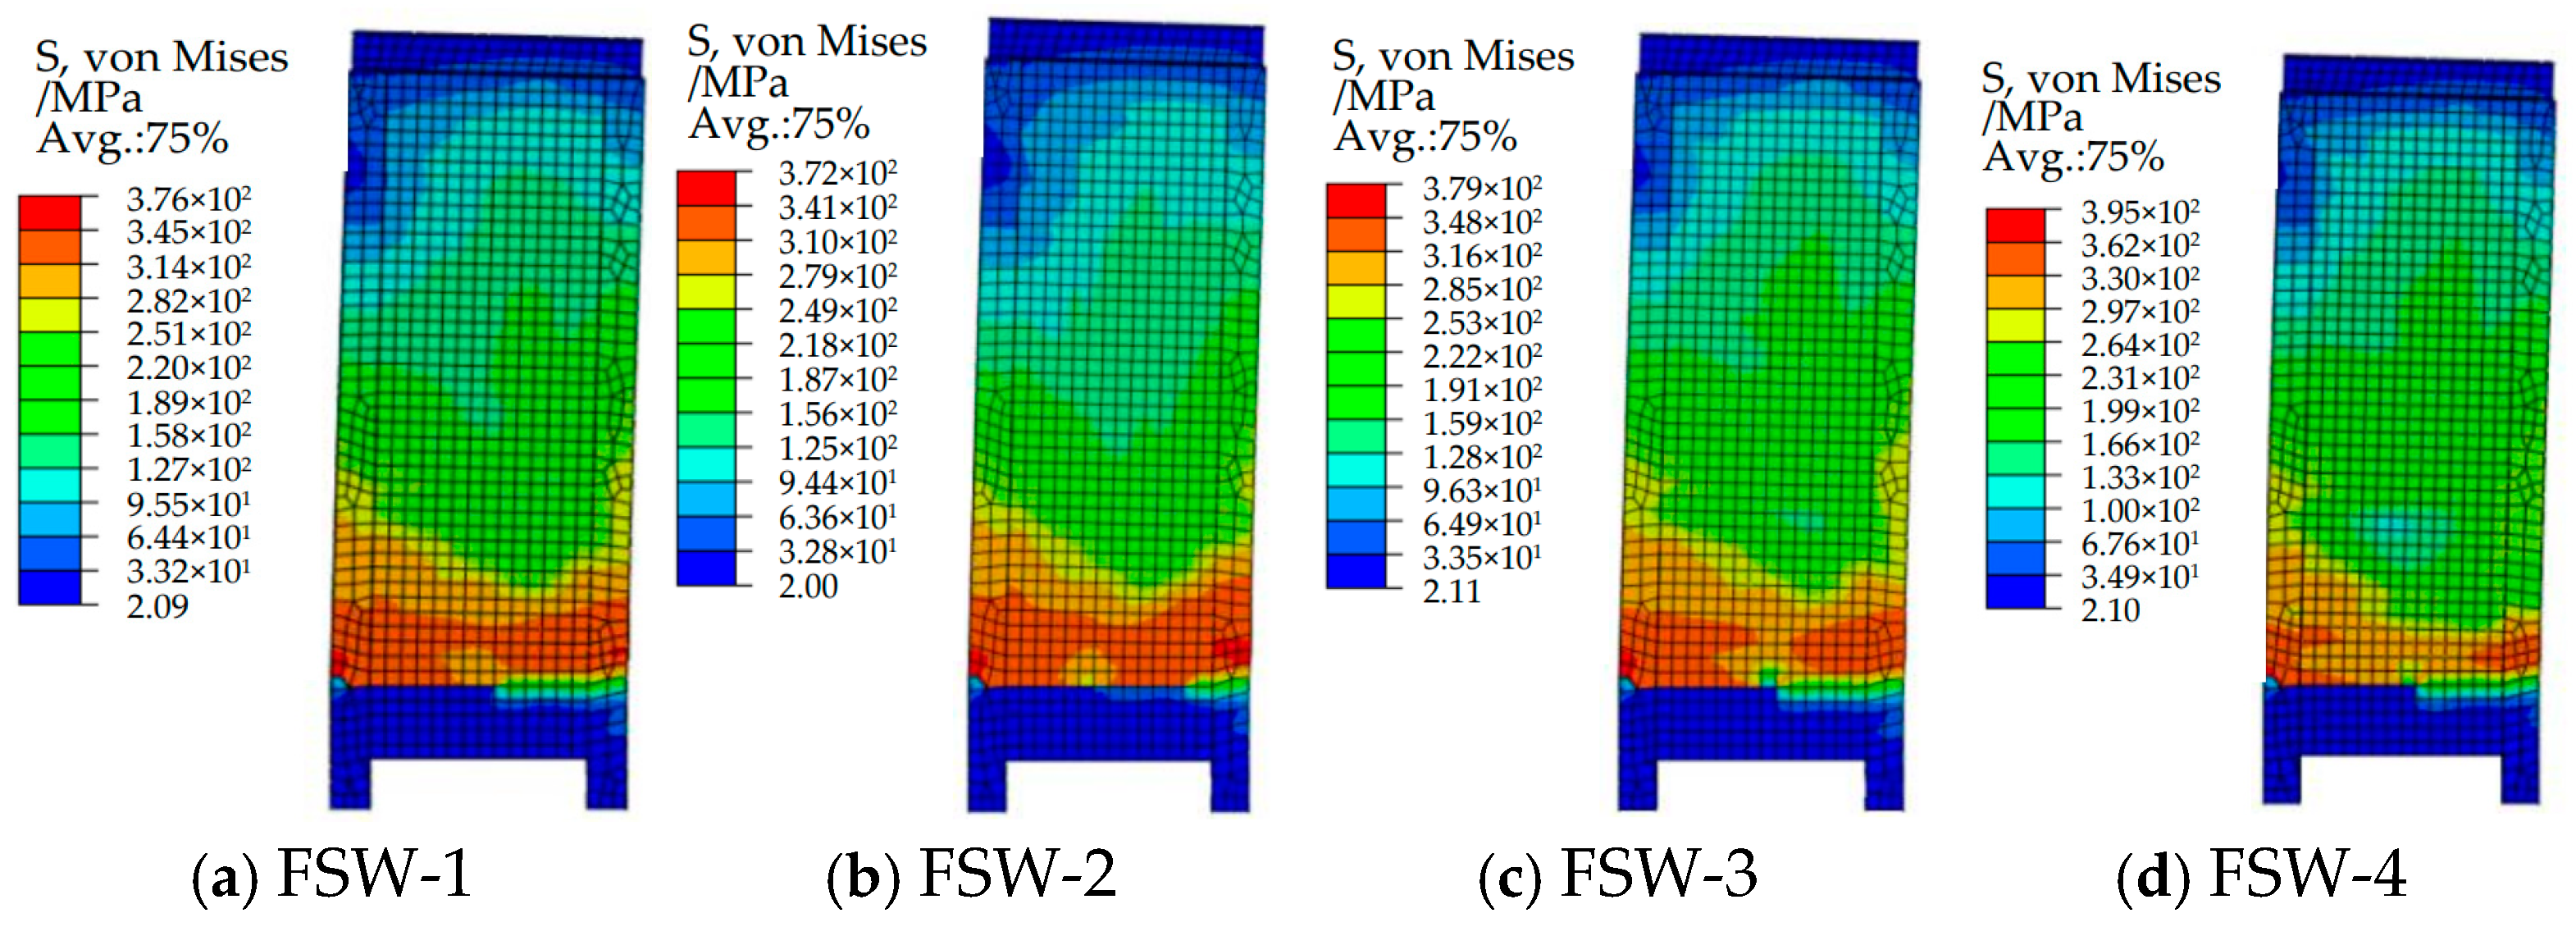
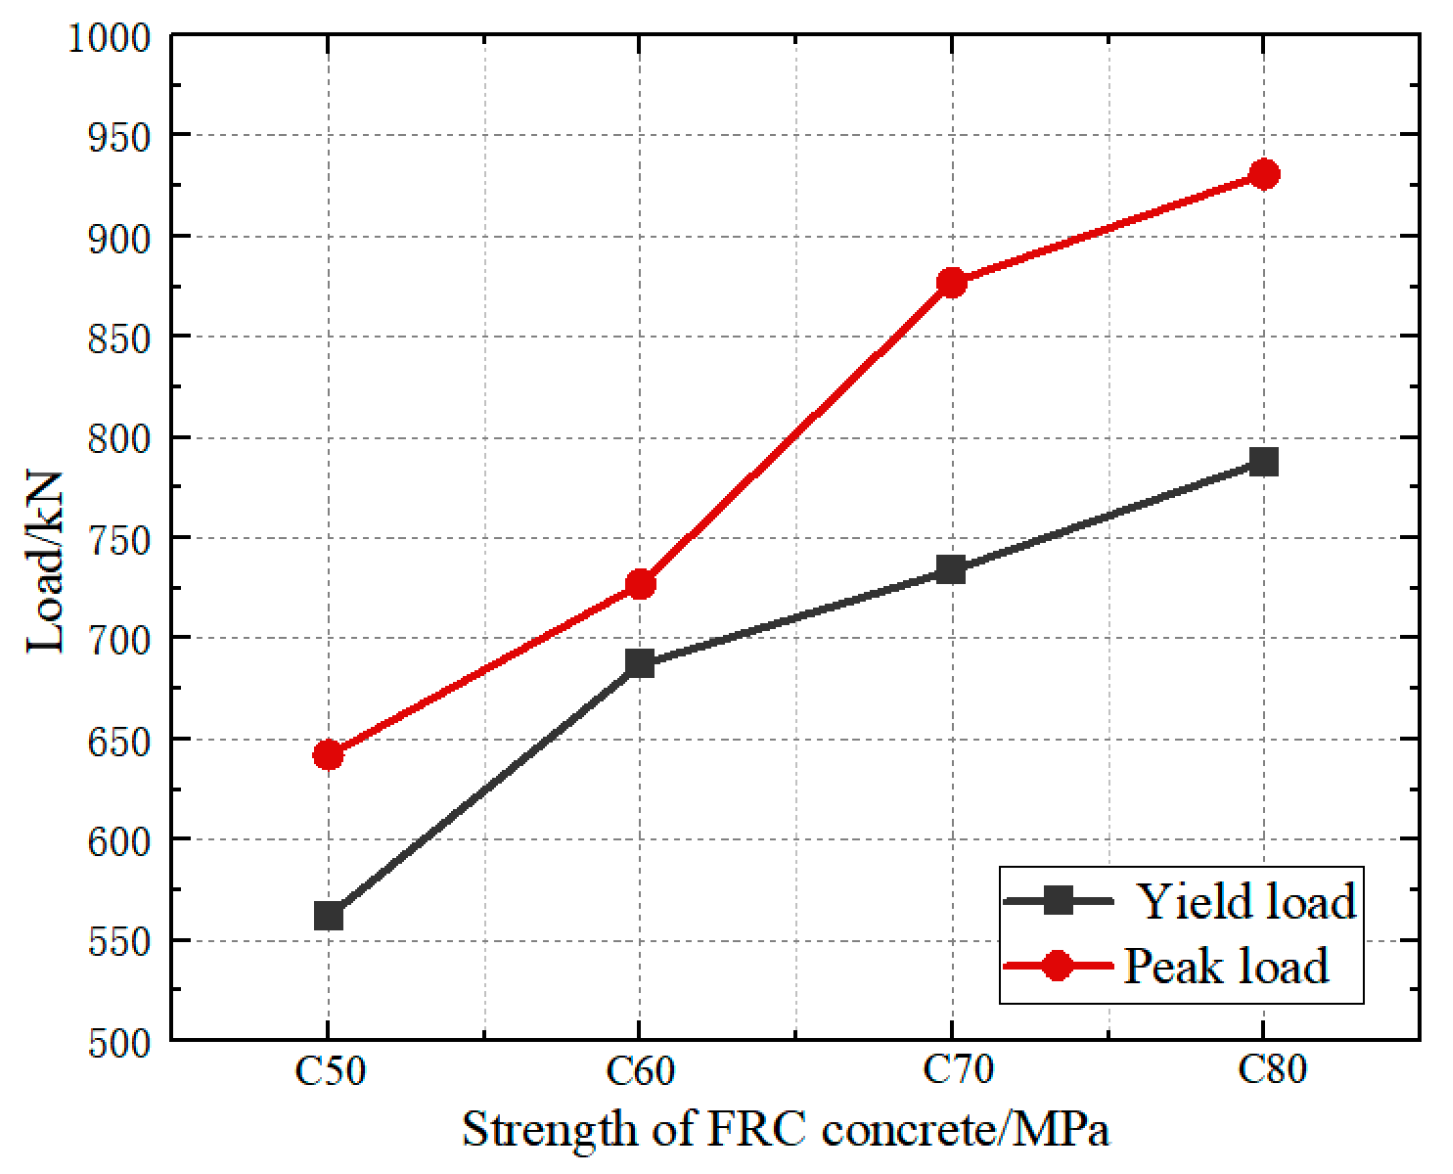
3.2.1. Comparative Analysis of Strength of FRC Concrete in the Plastic Hinge Zone
- (1)
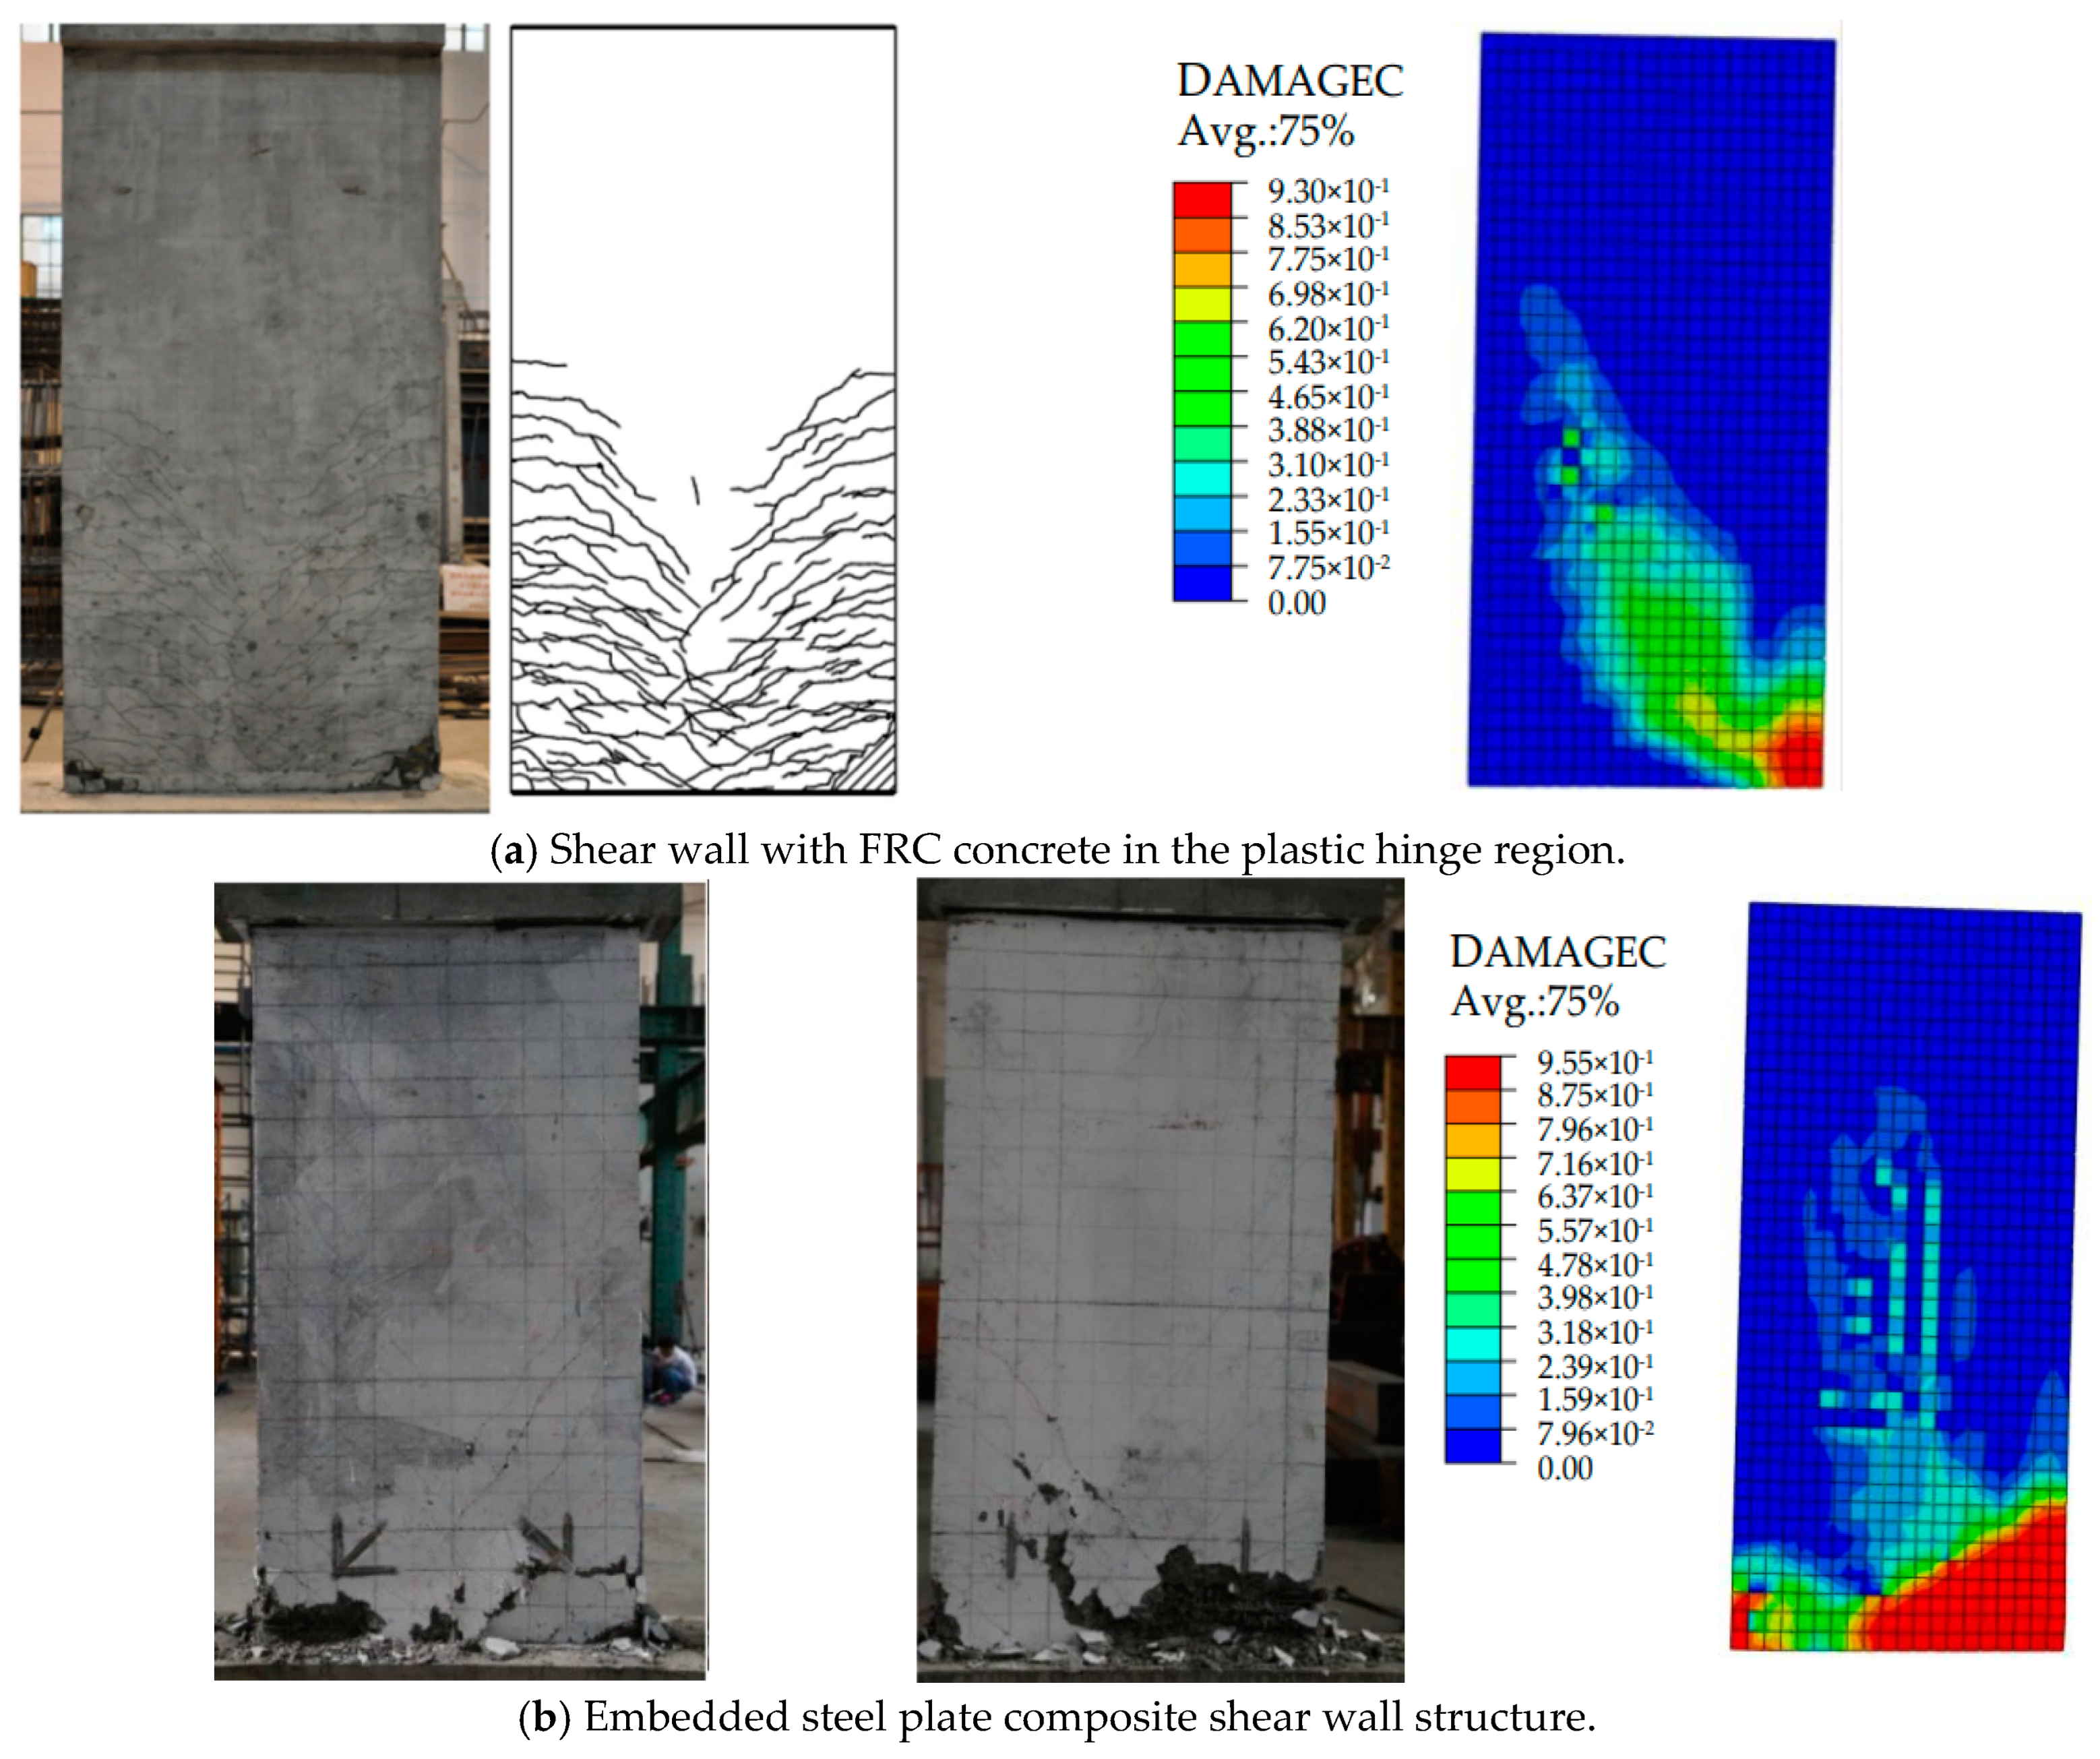
- Comparison of Simulated Failure Modes and Patterns
- (2)
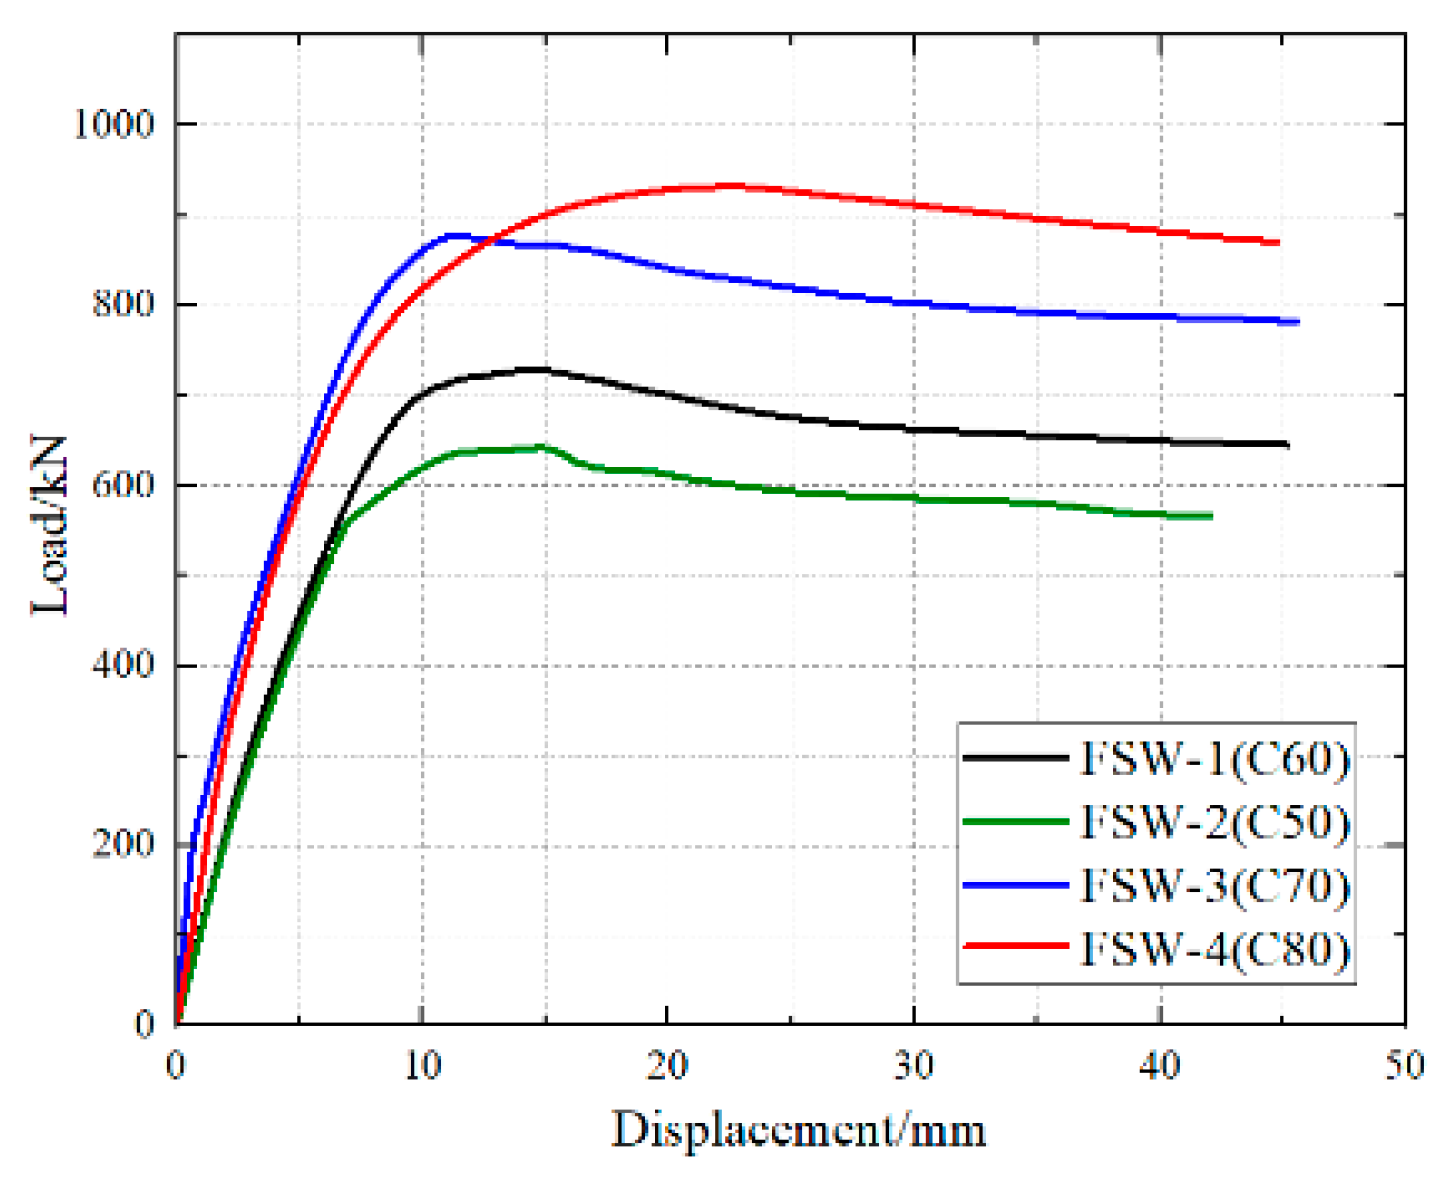
- Comparison of Load–Displacement Curves
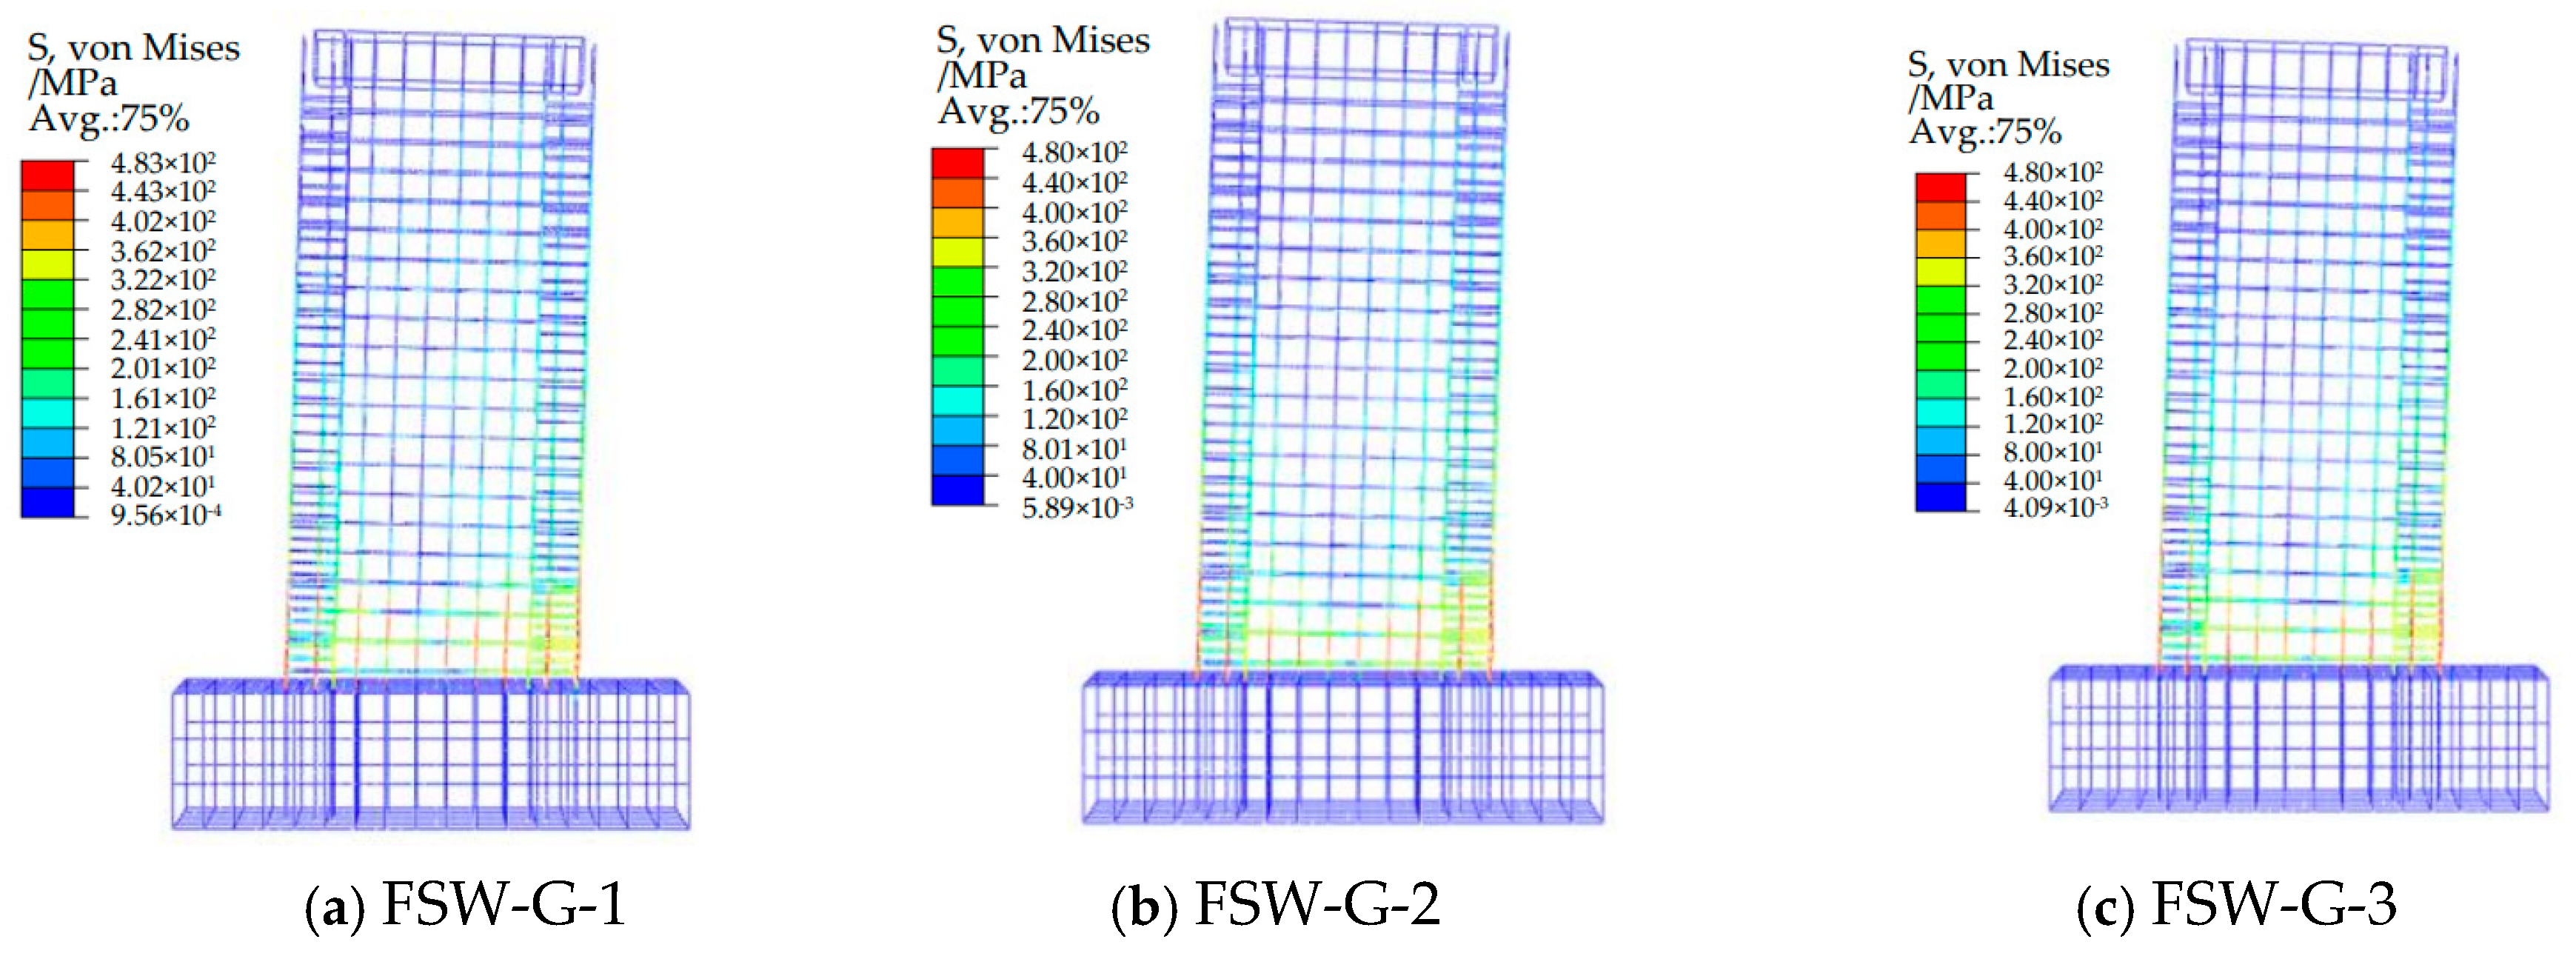
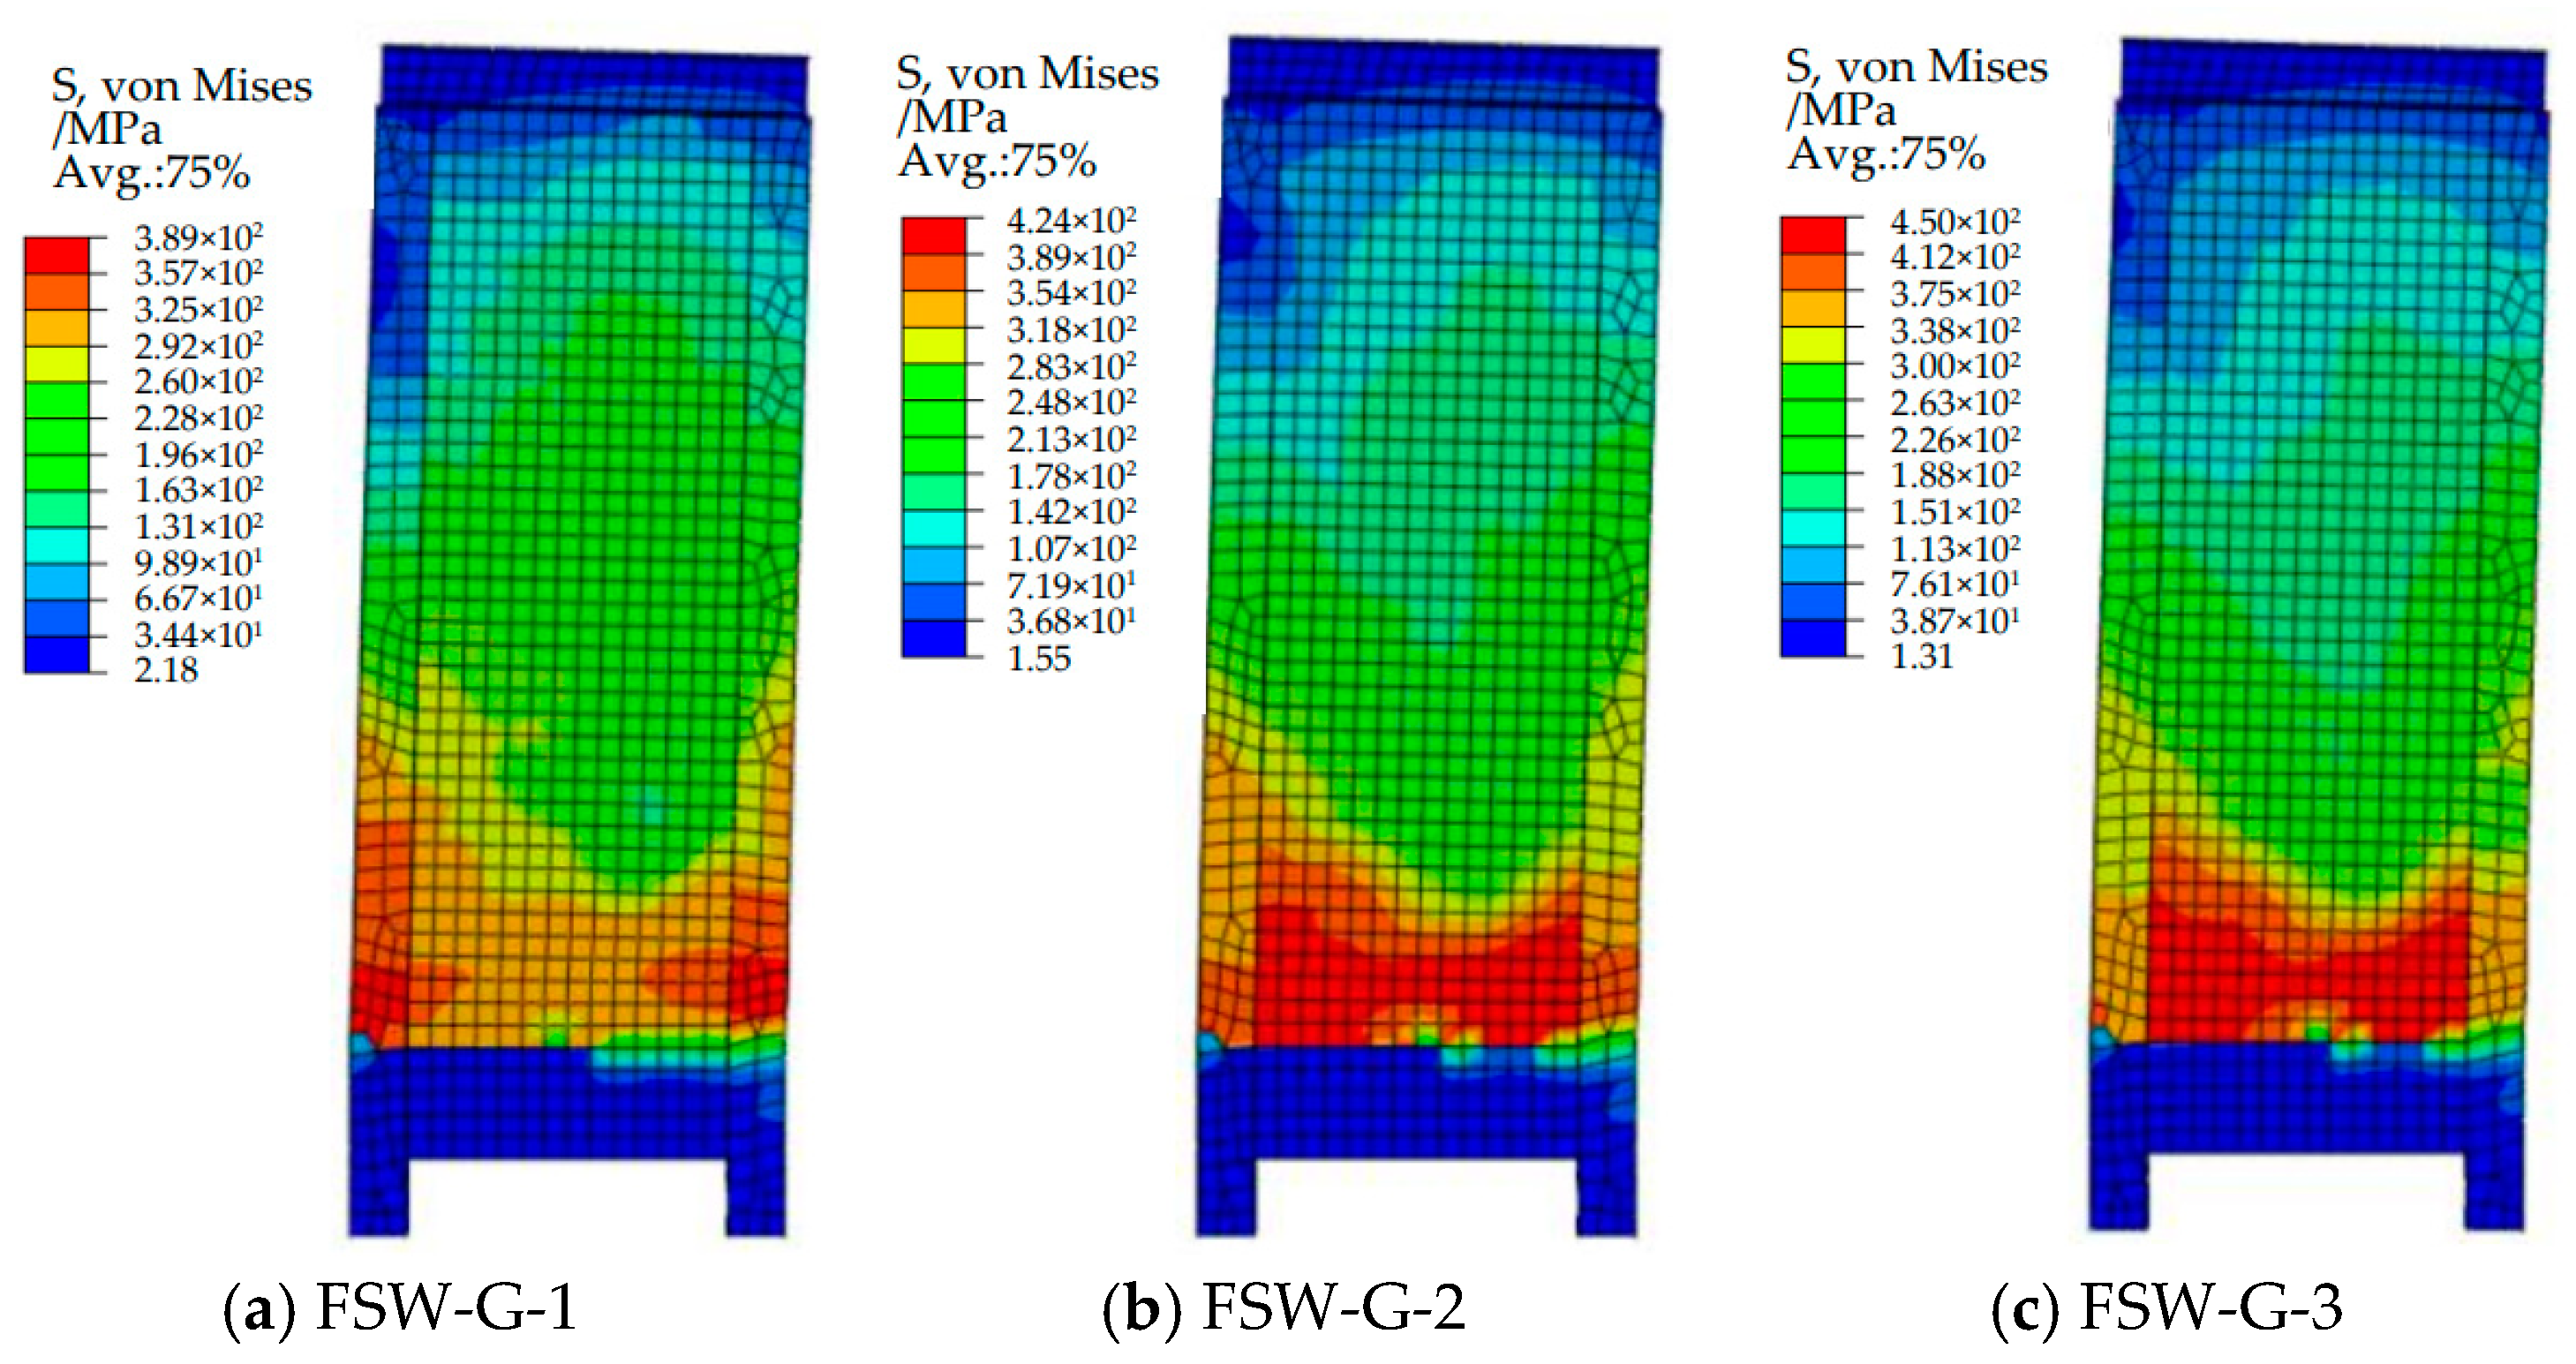
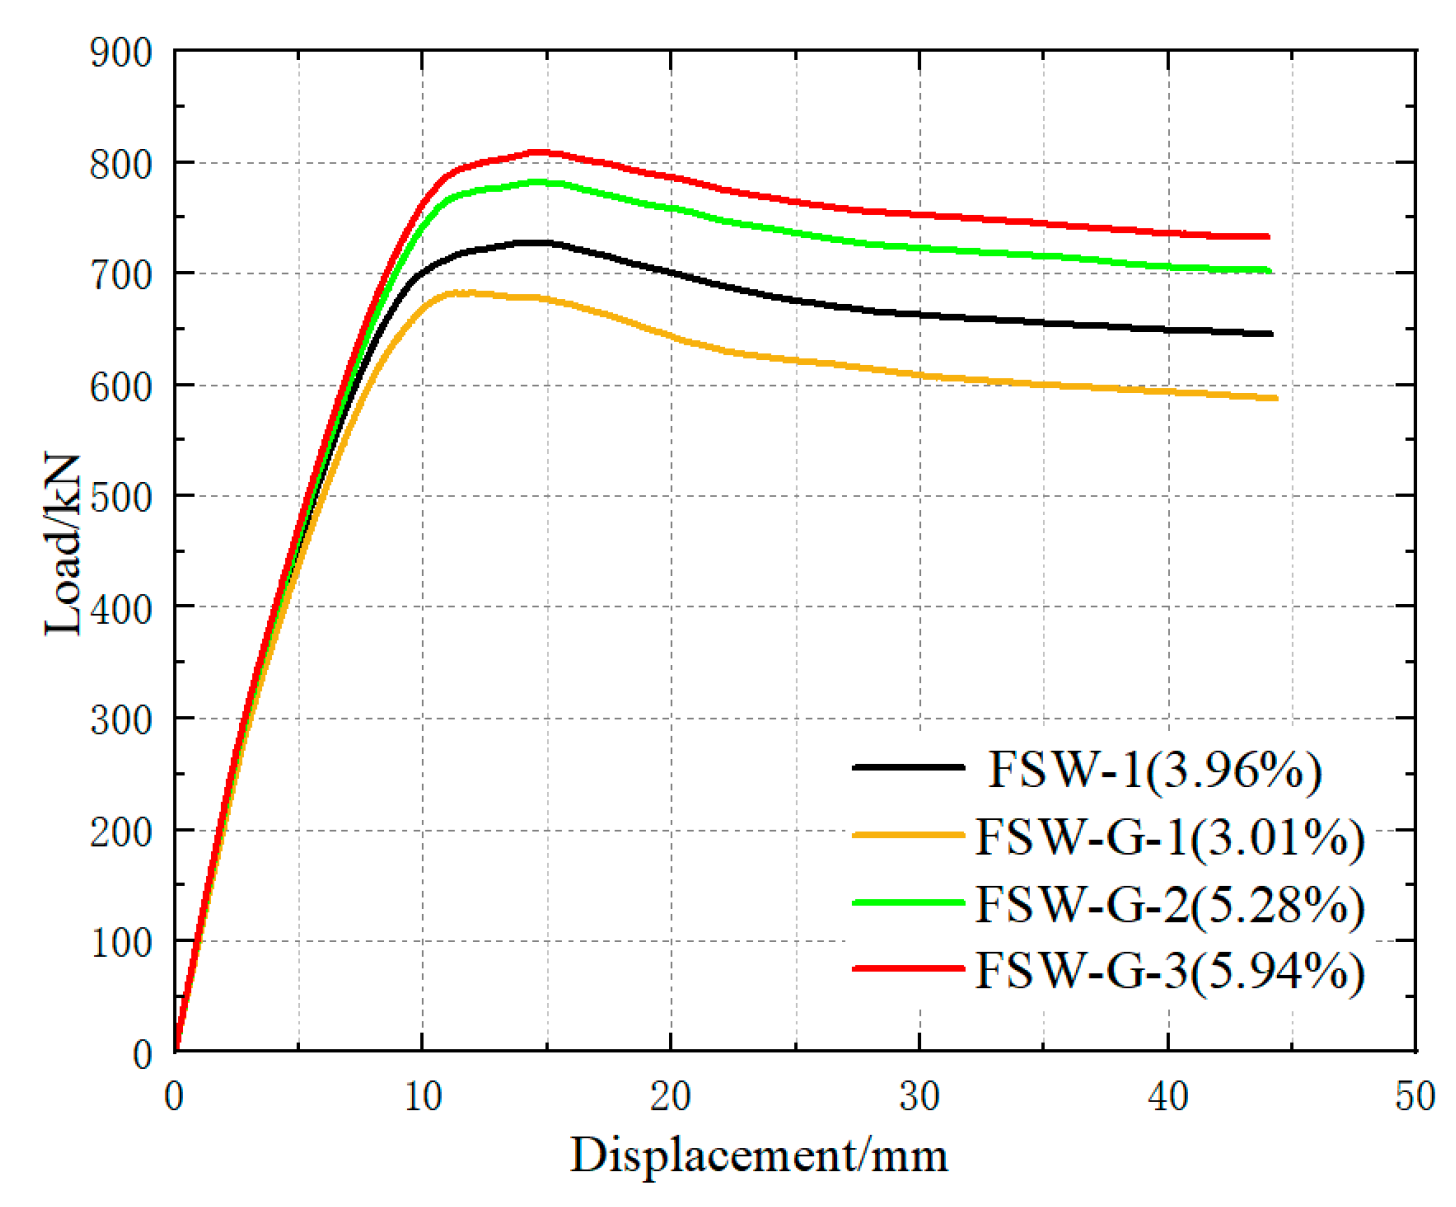
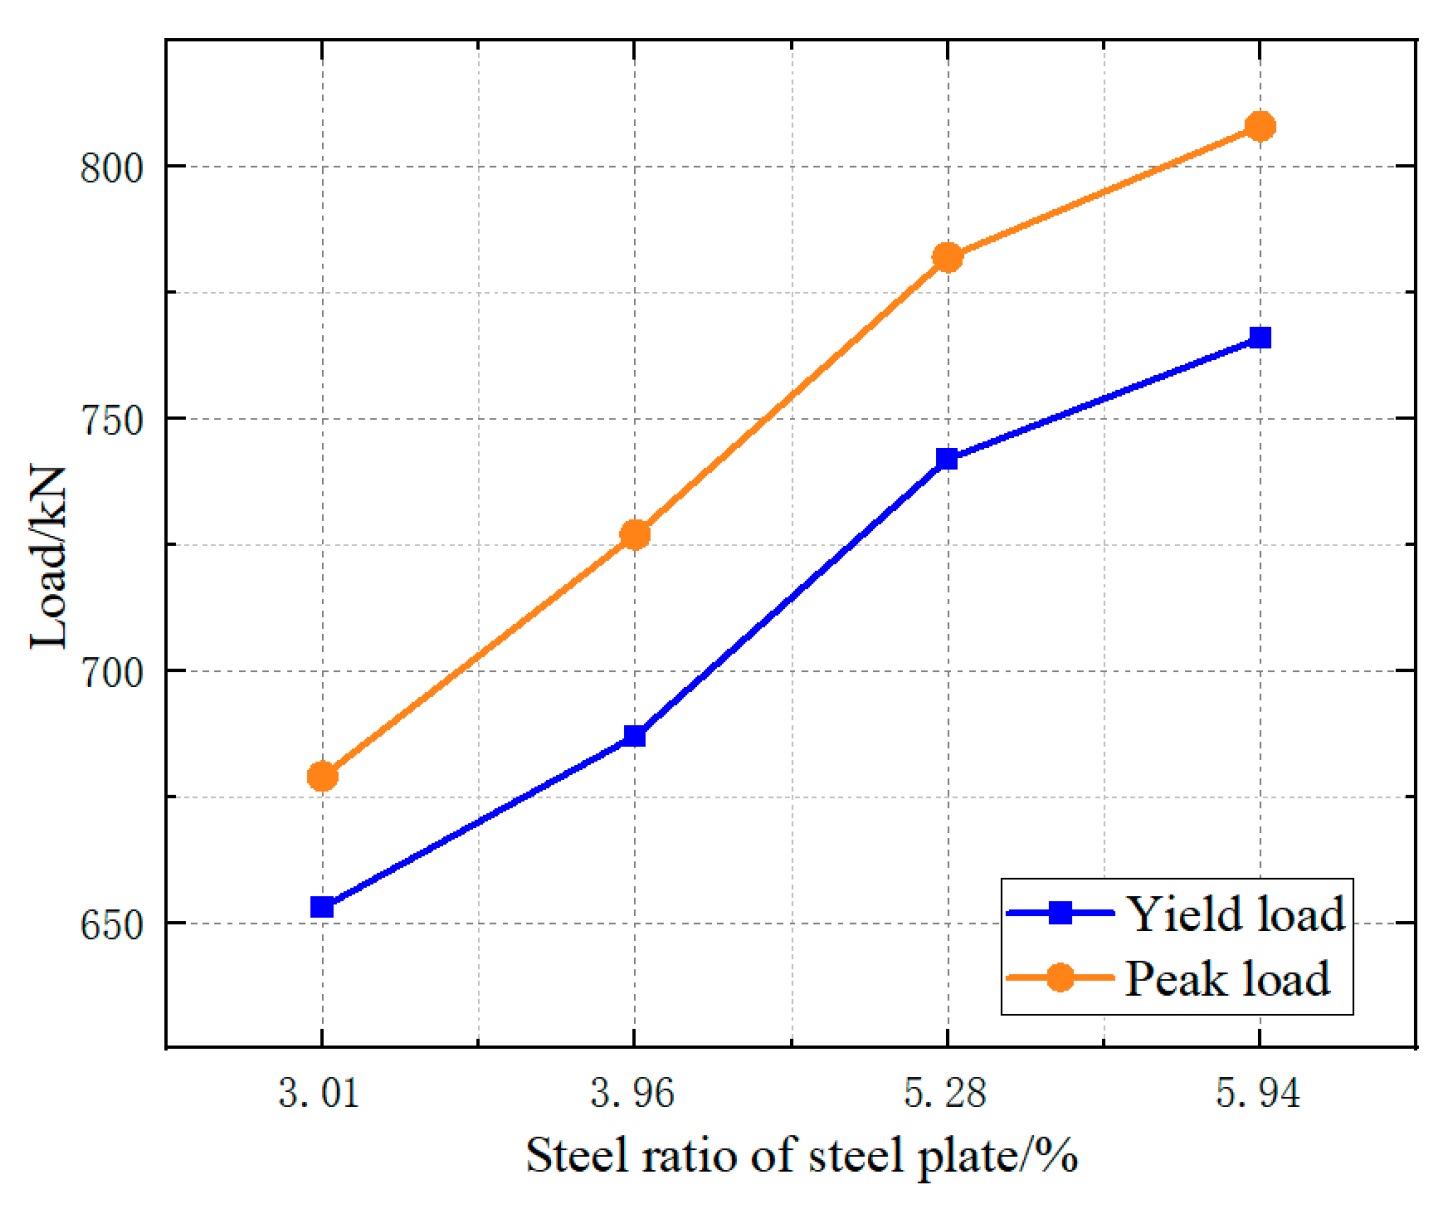
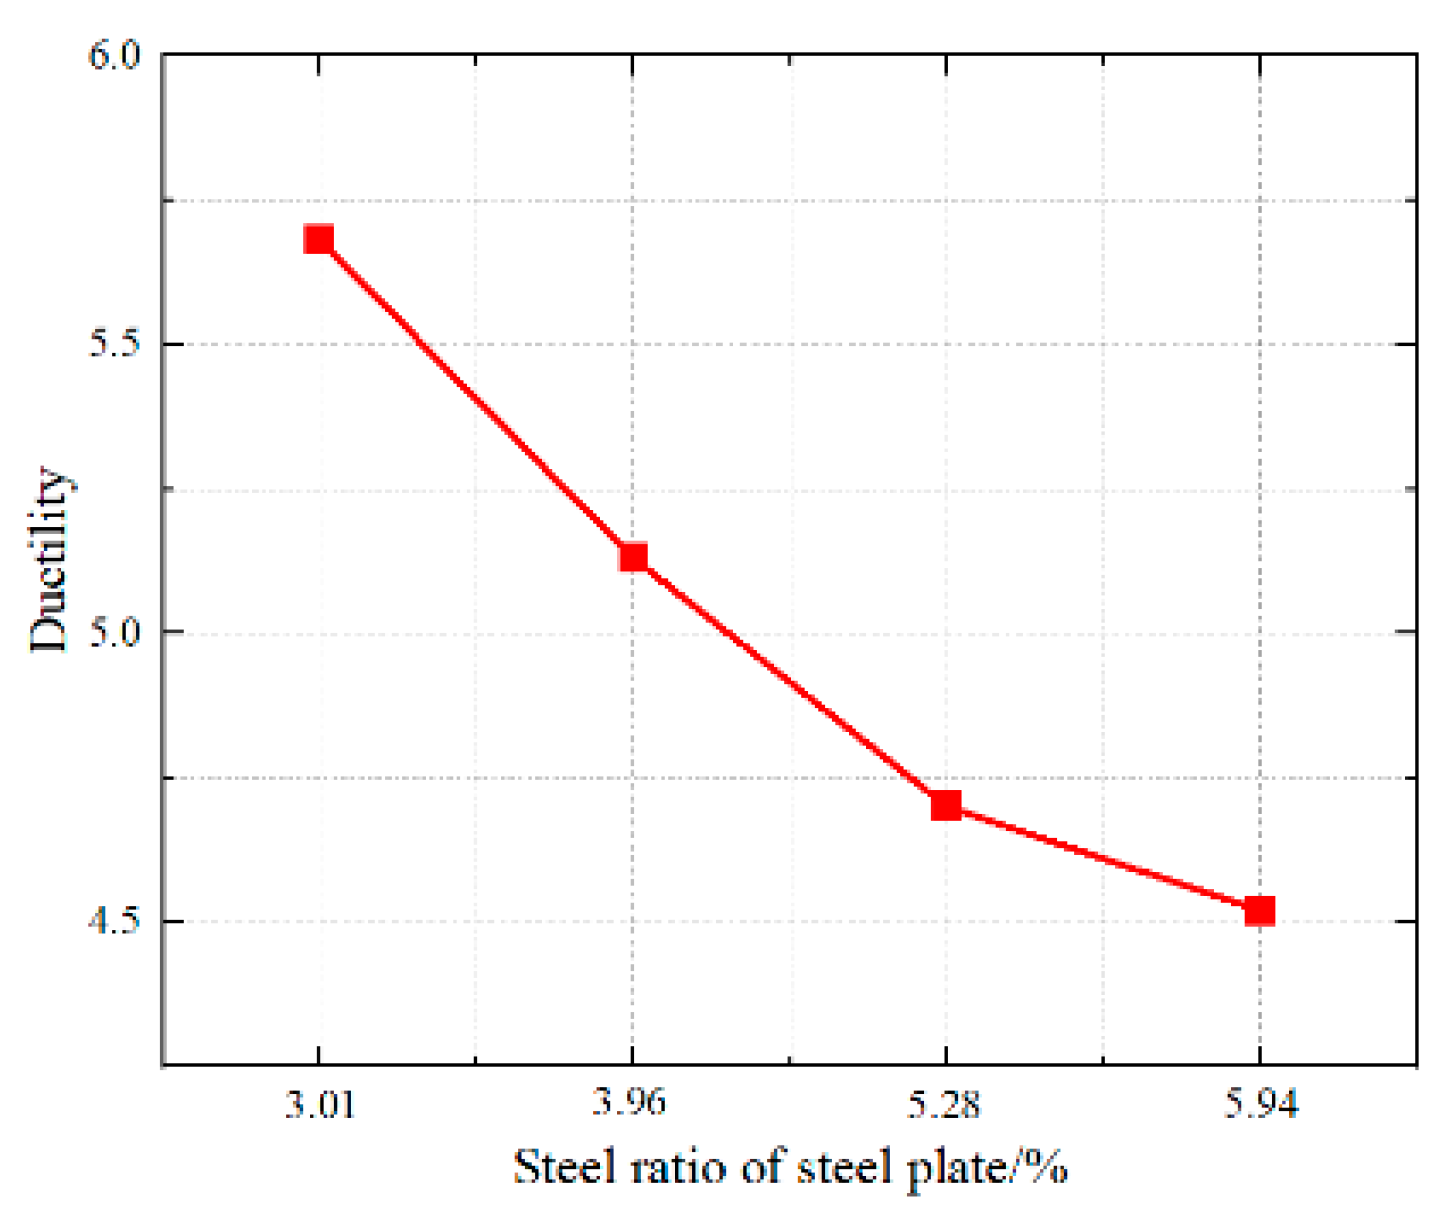
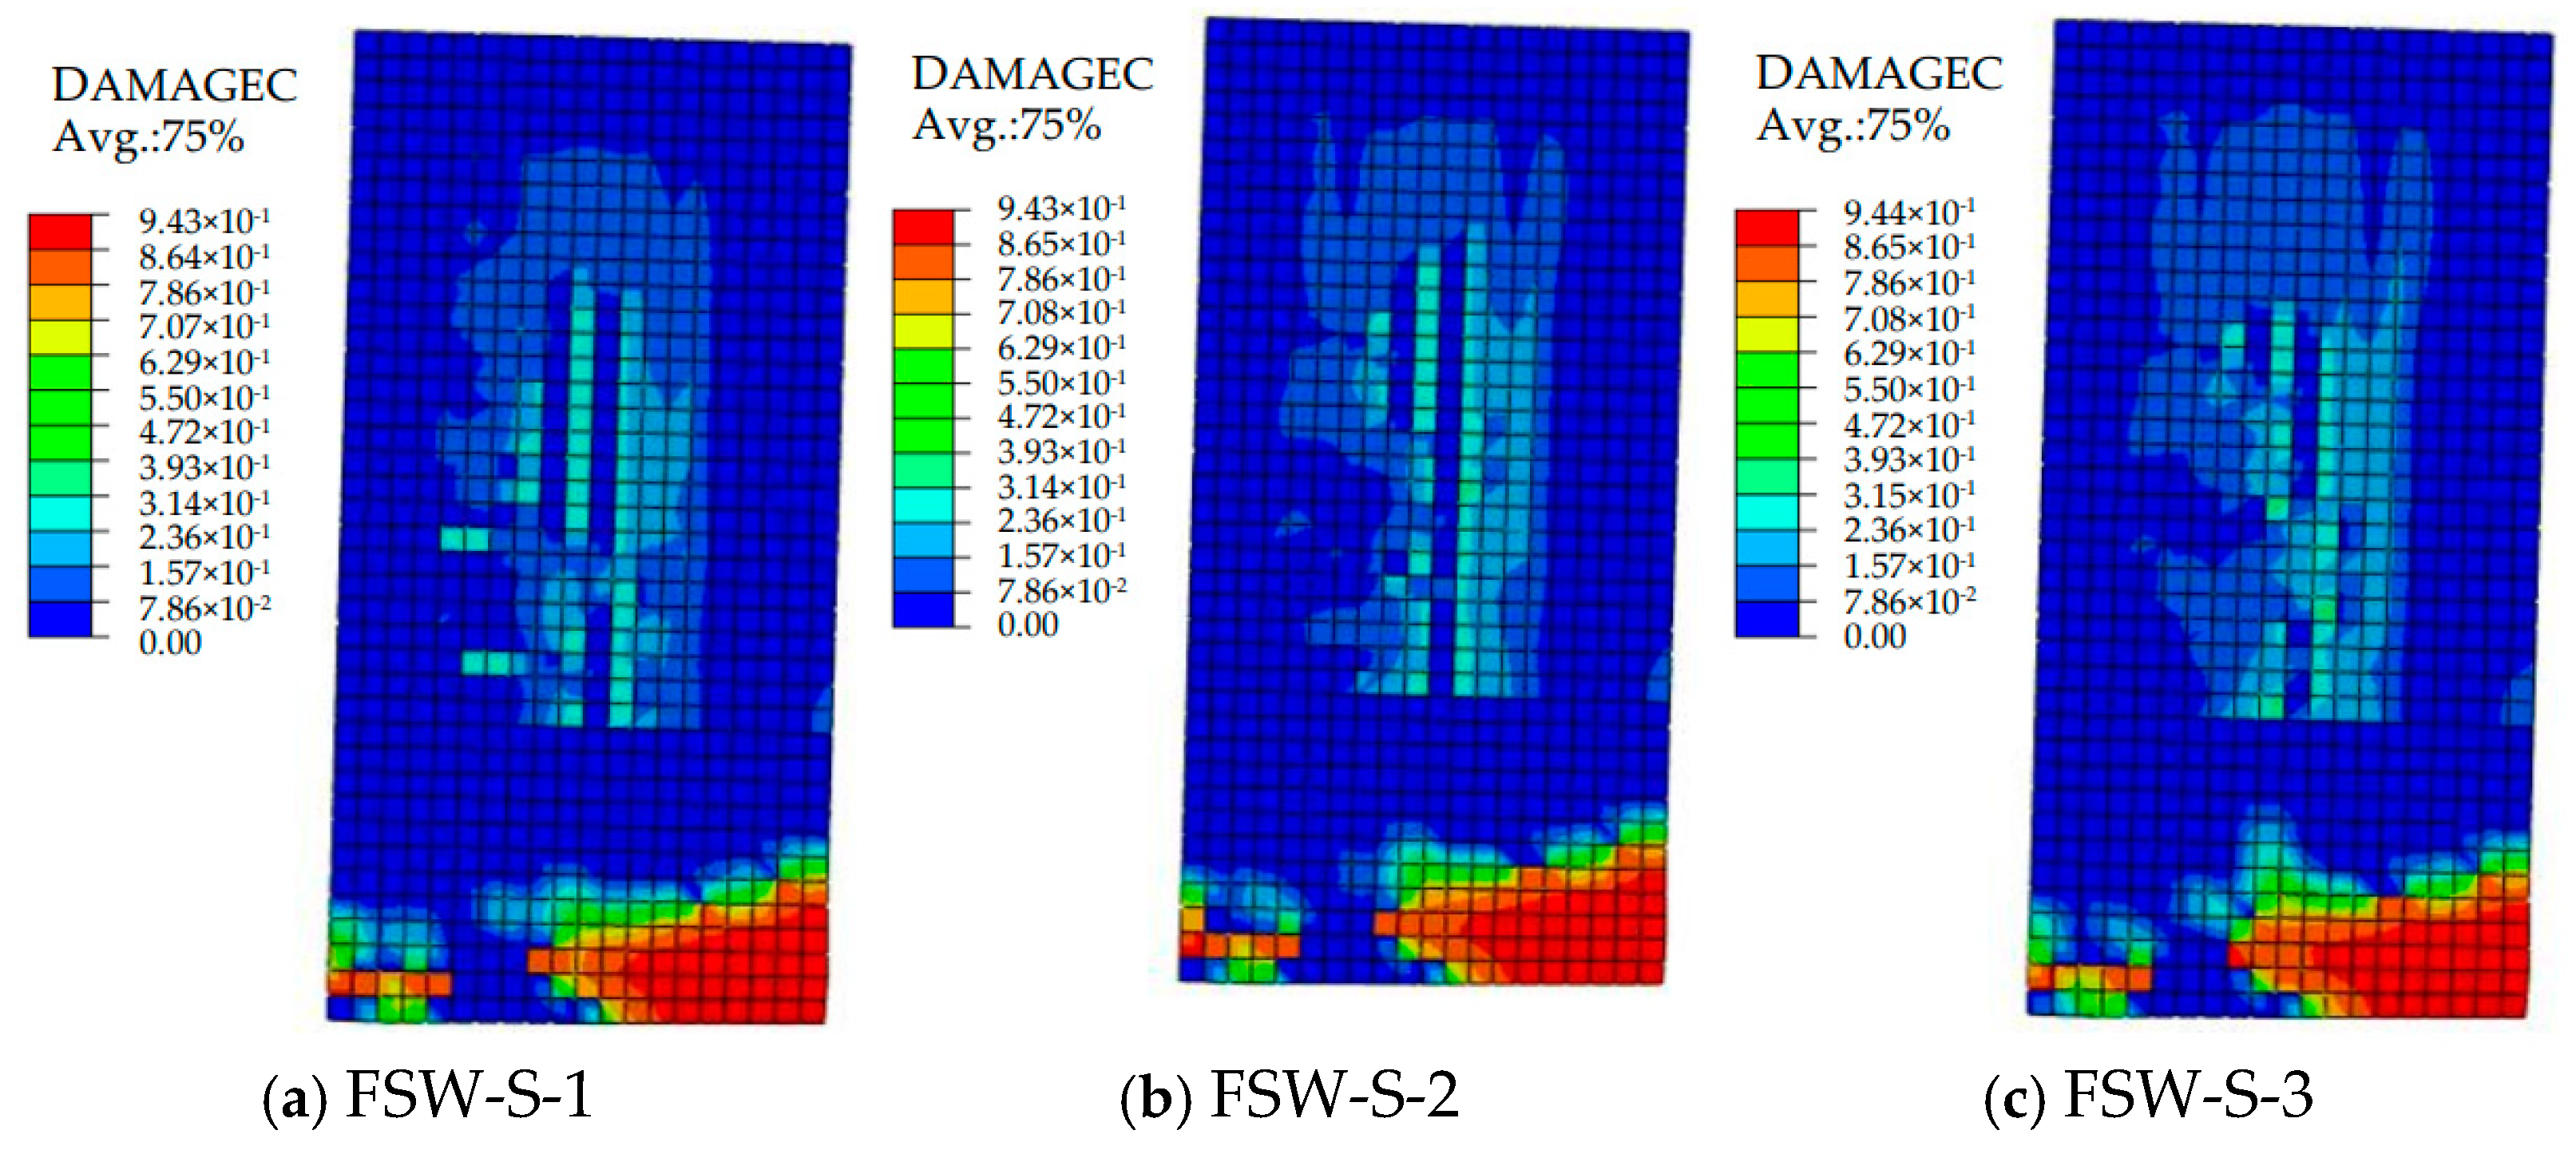
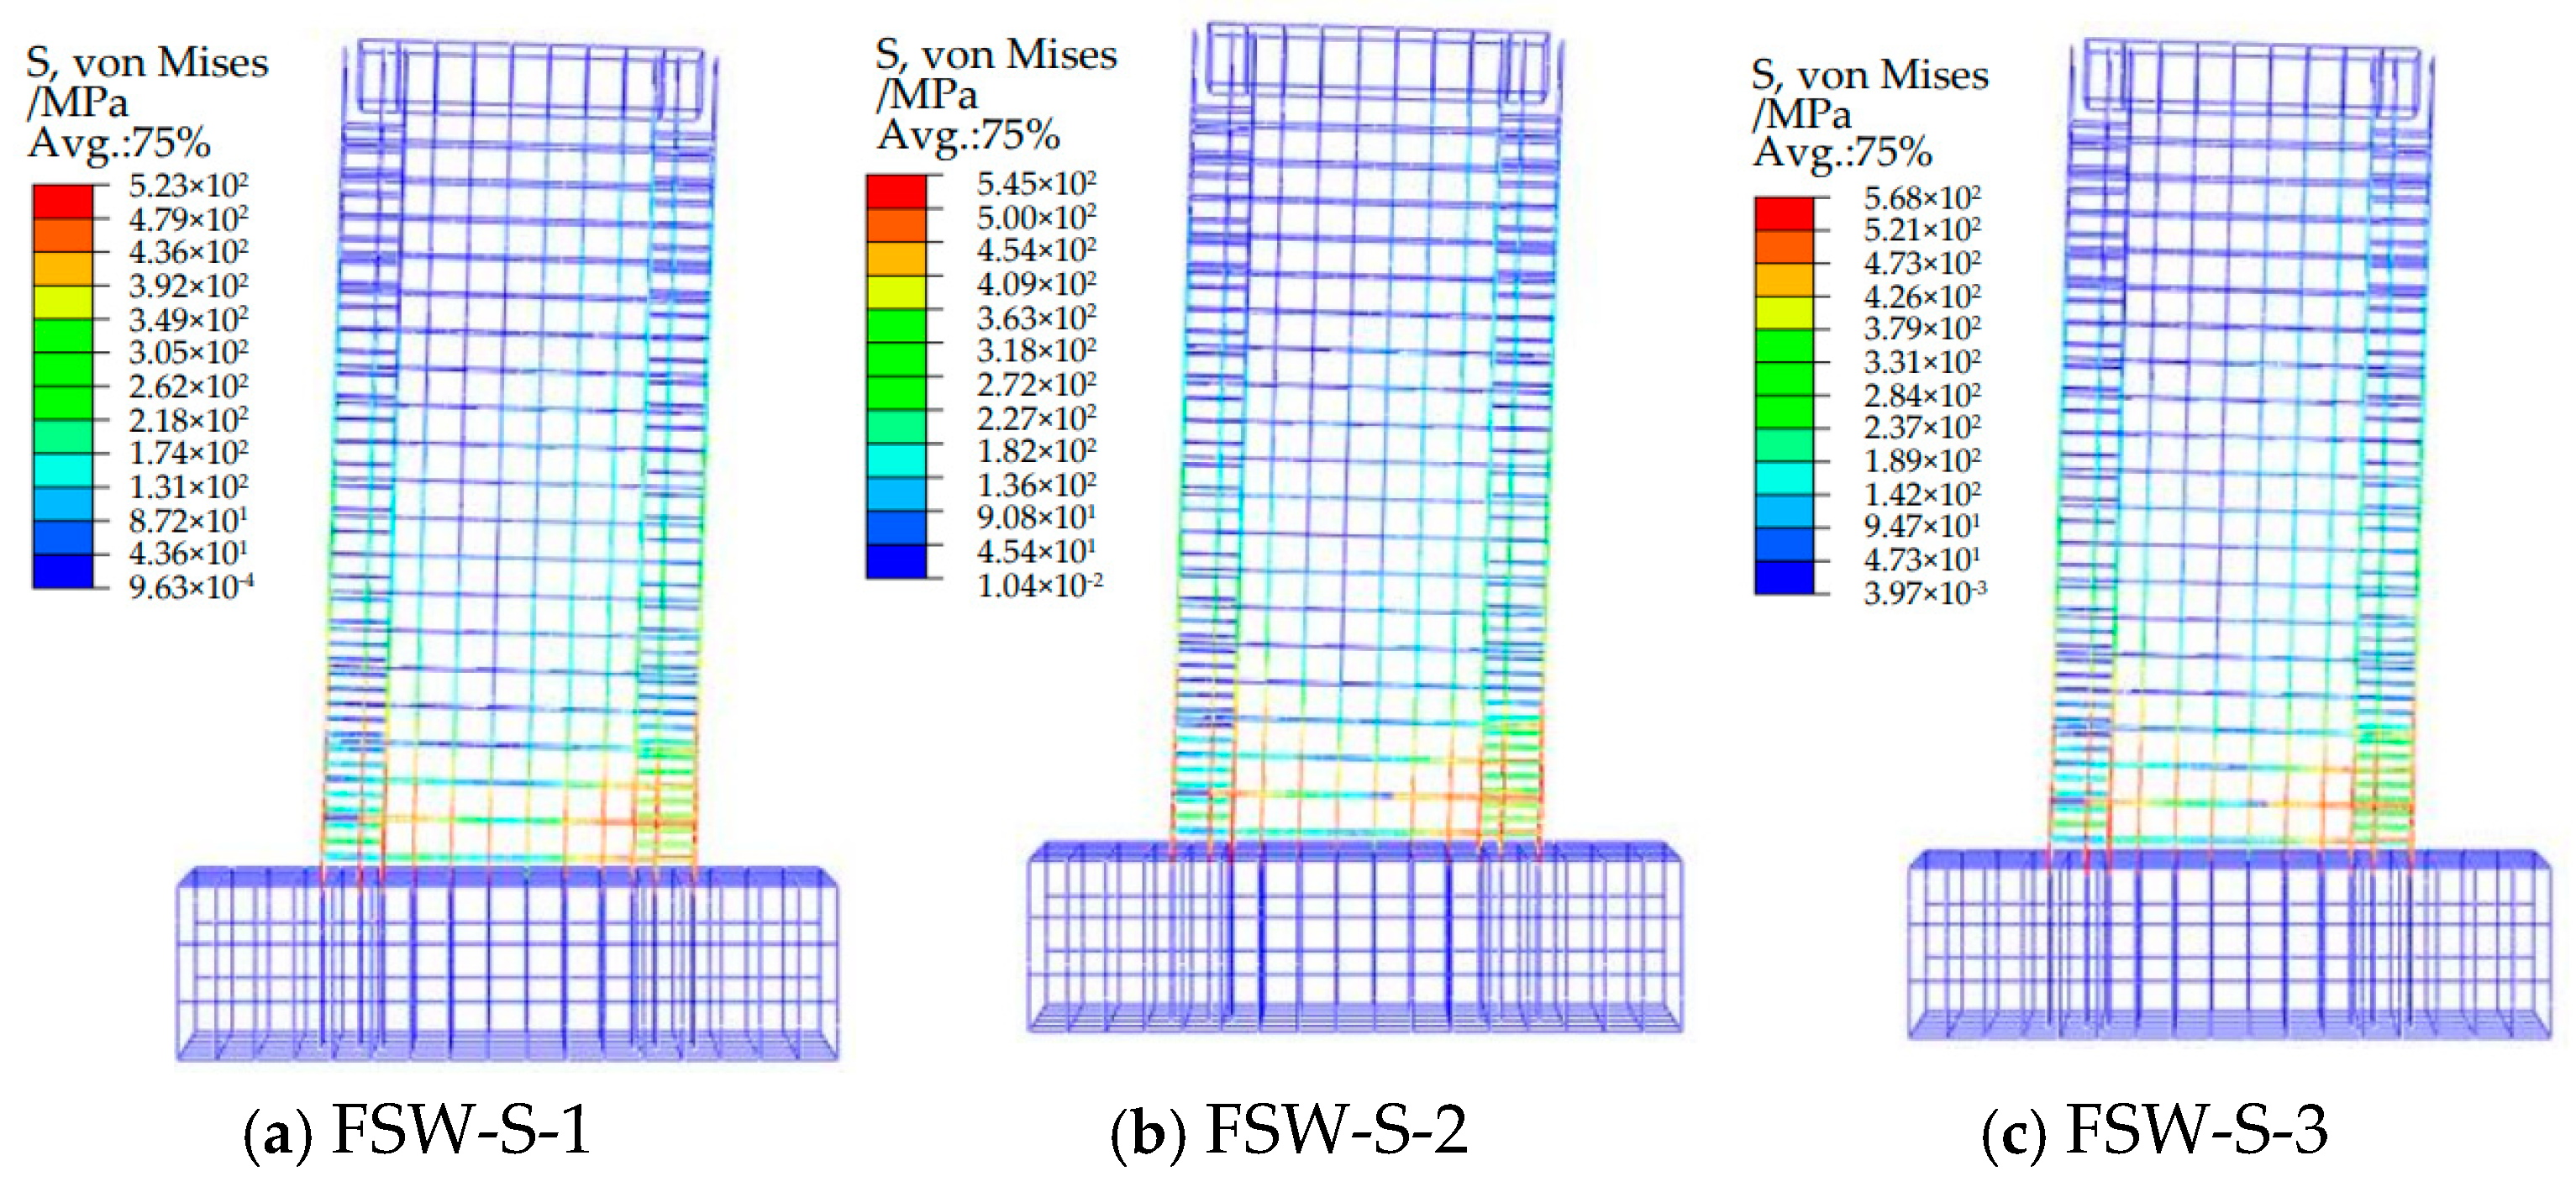
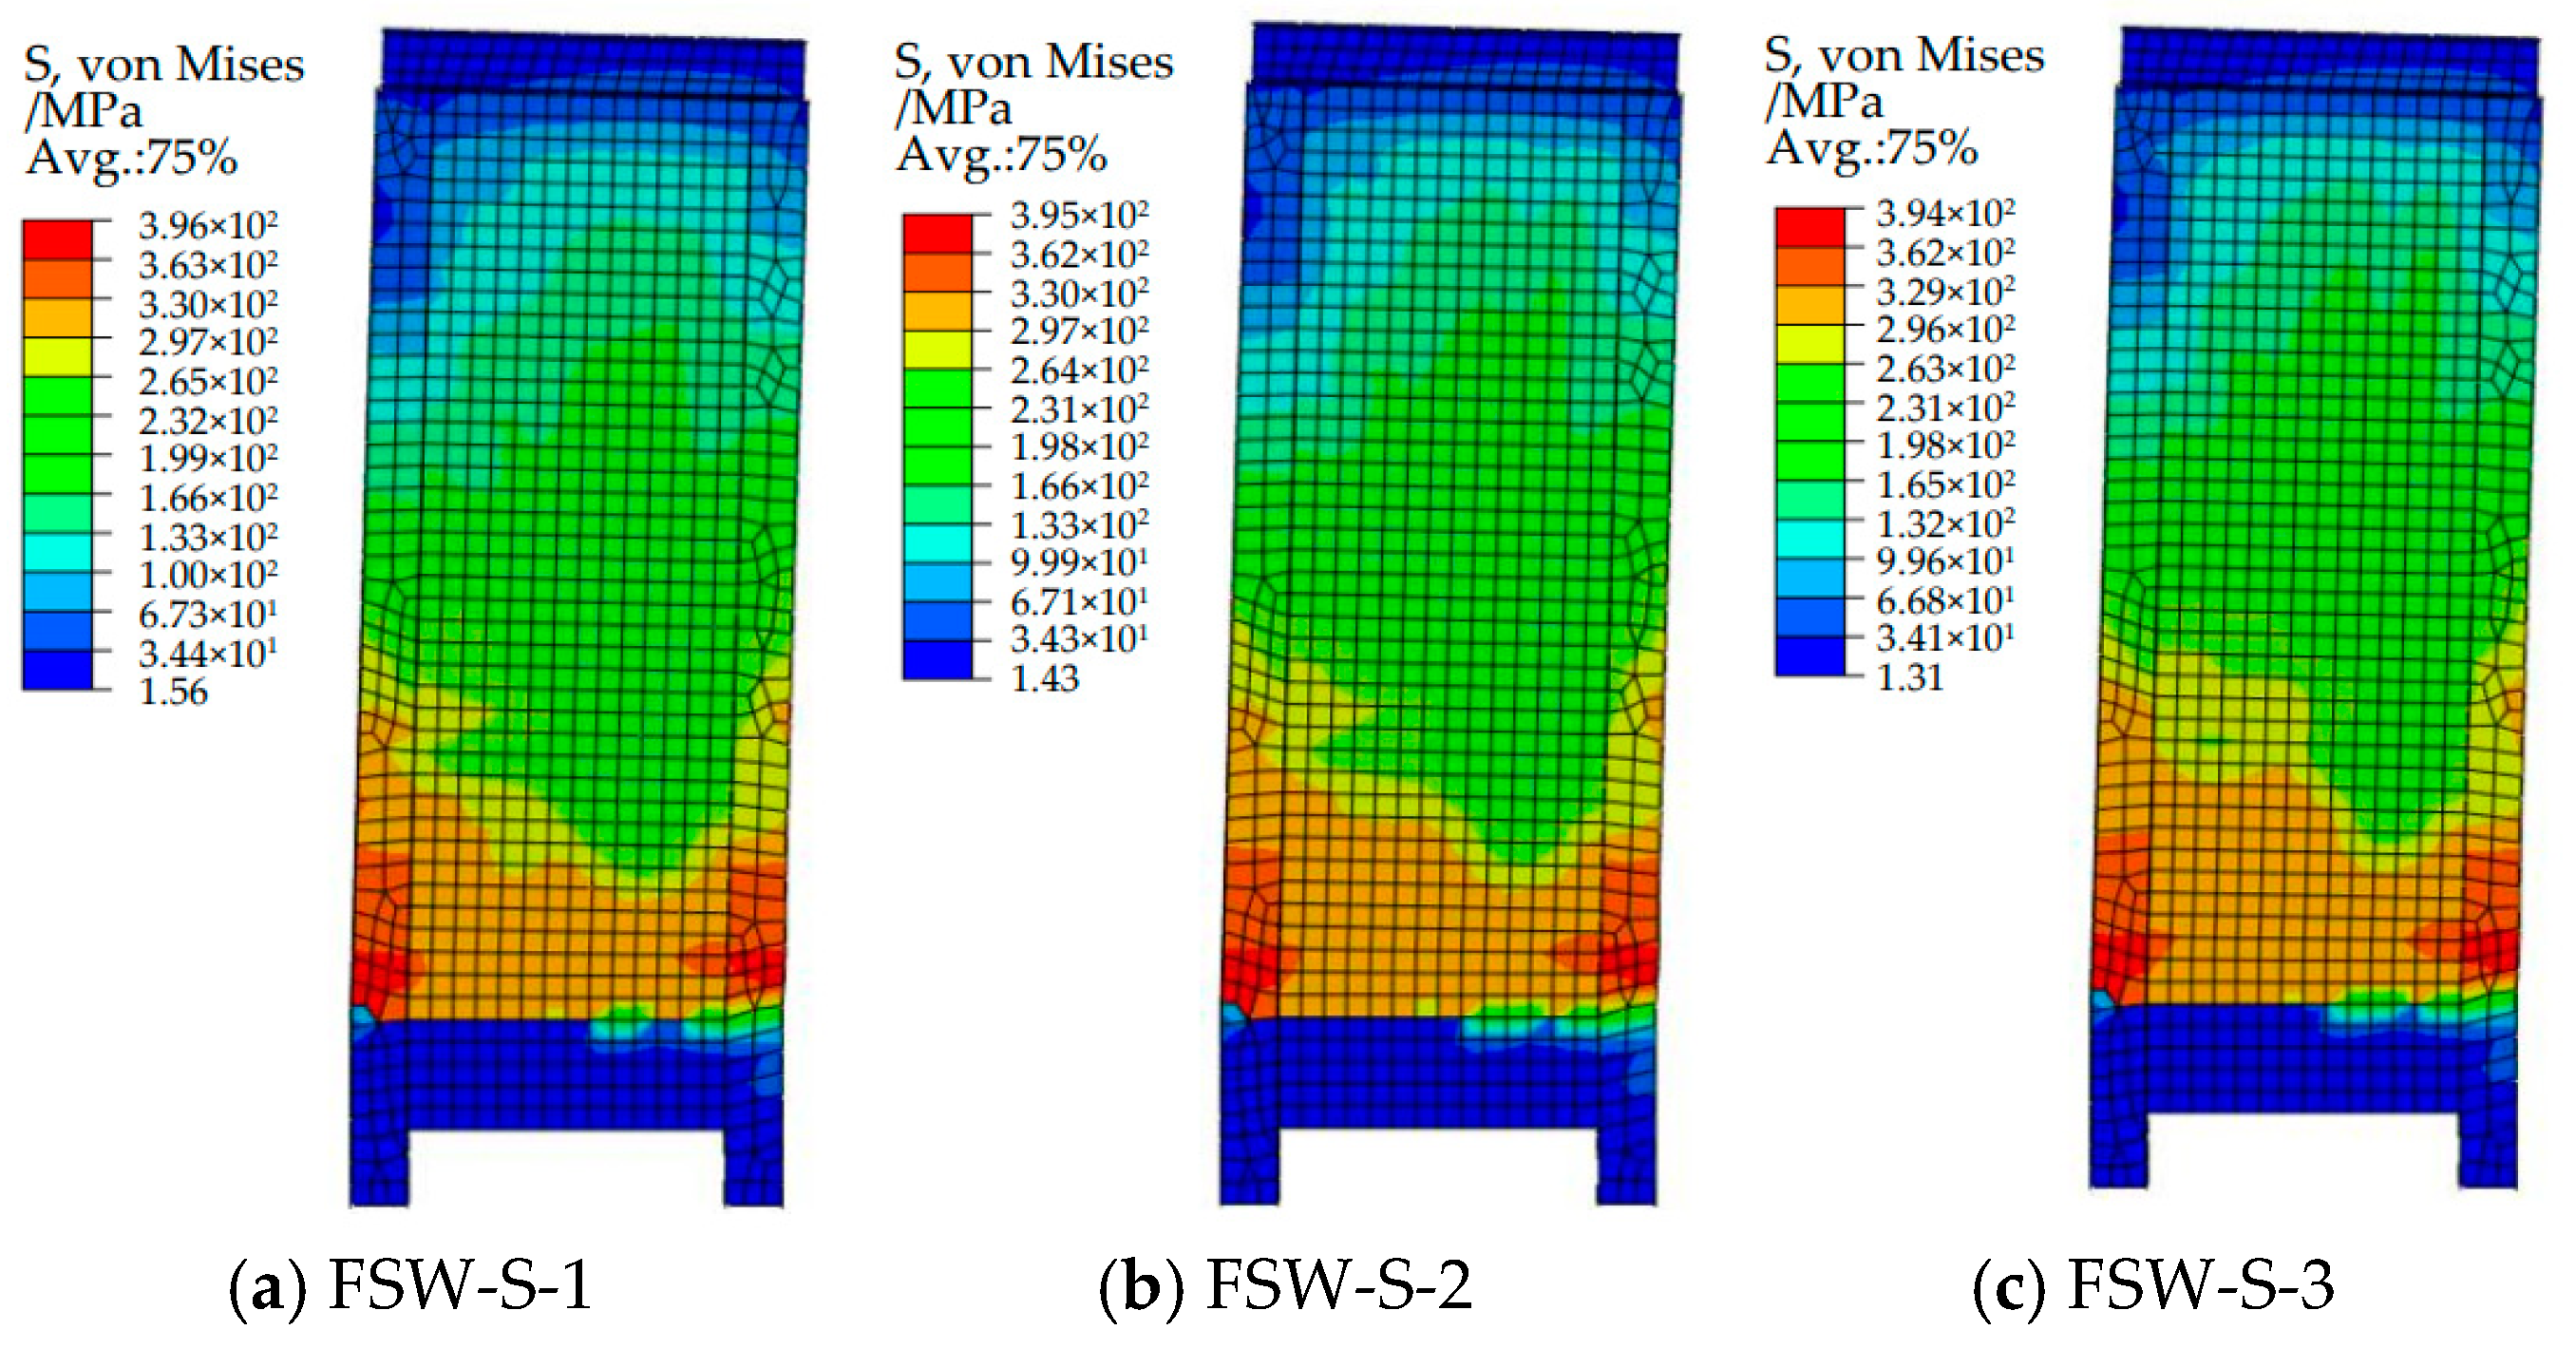
3.2.2. Comparative Analysis of Steel Ratio of Central Steel Plate
- (1)
- Comparison of Simulated Failure Modes and Patterns
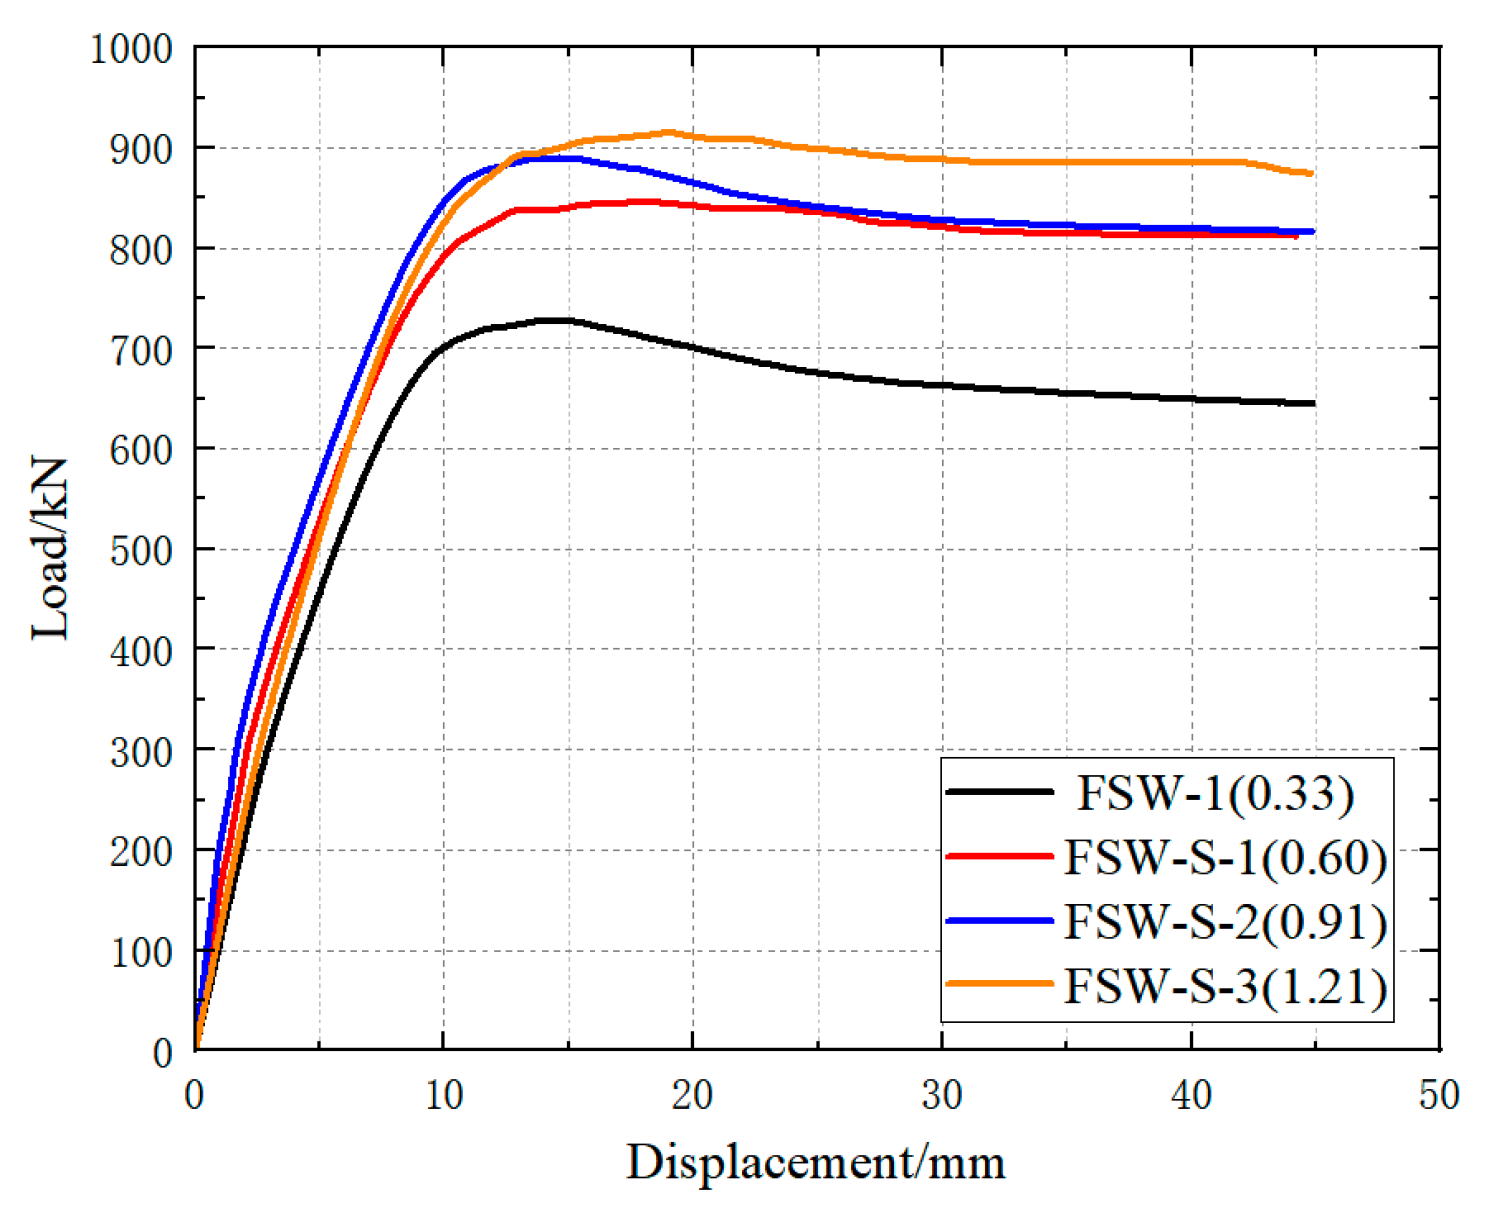
- (2)
- Comparison of Load–Displacement Curves
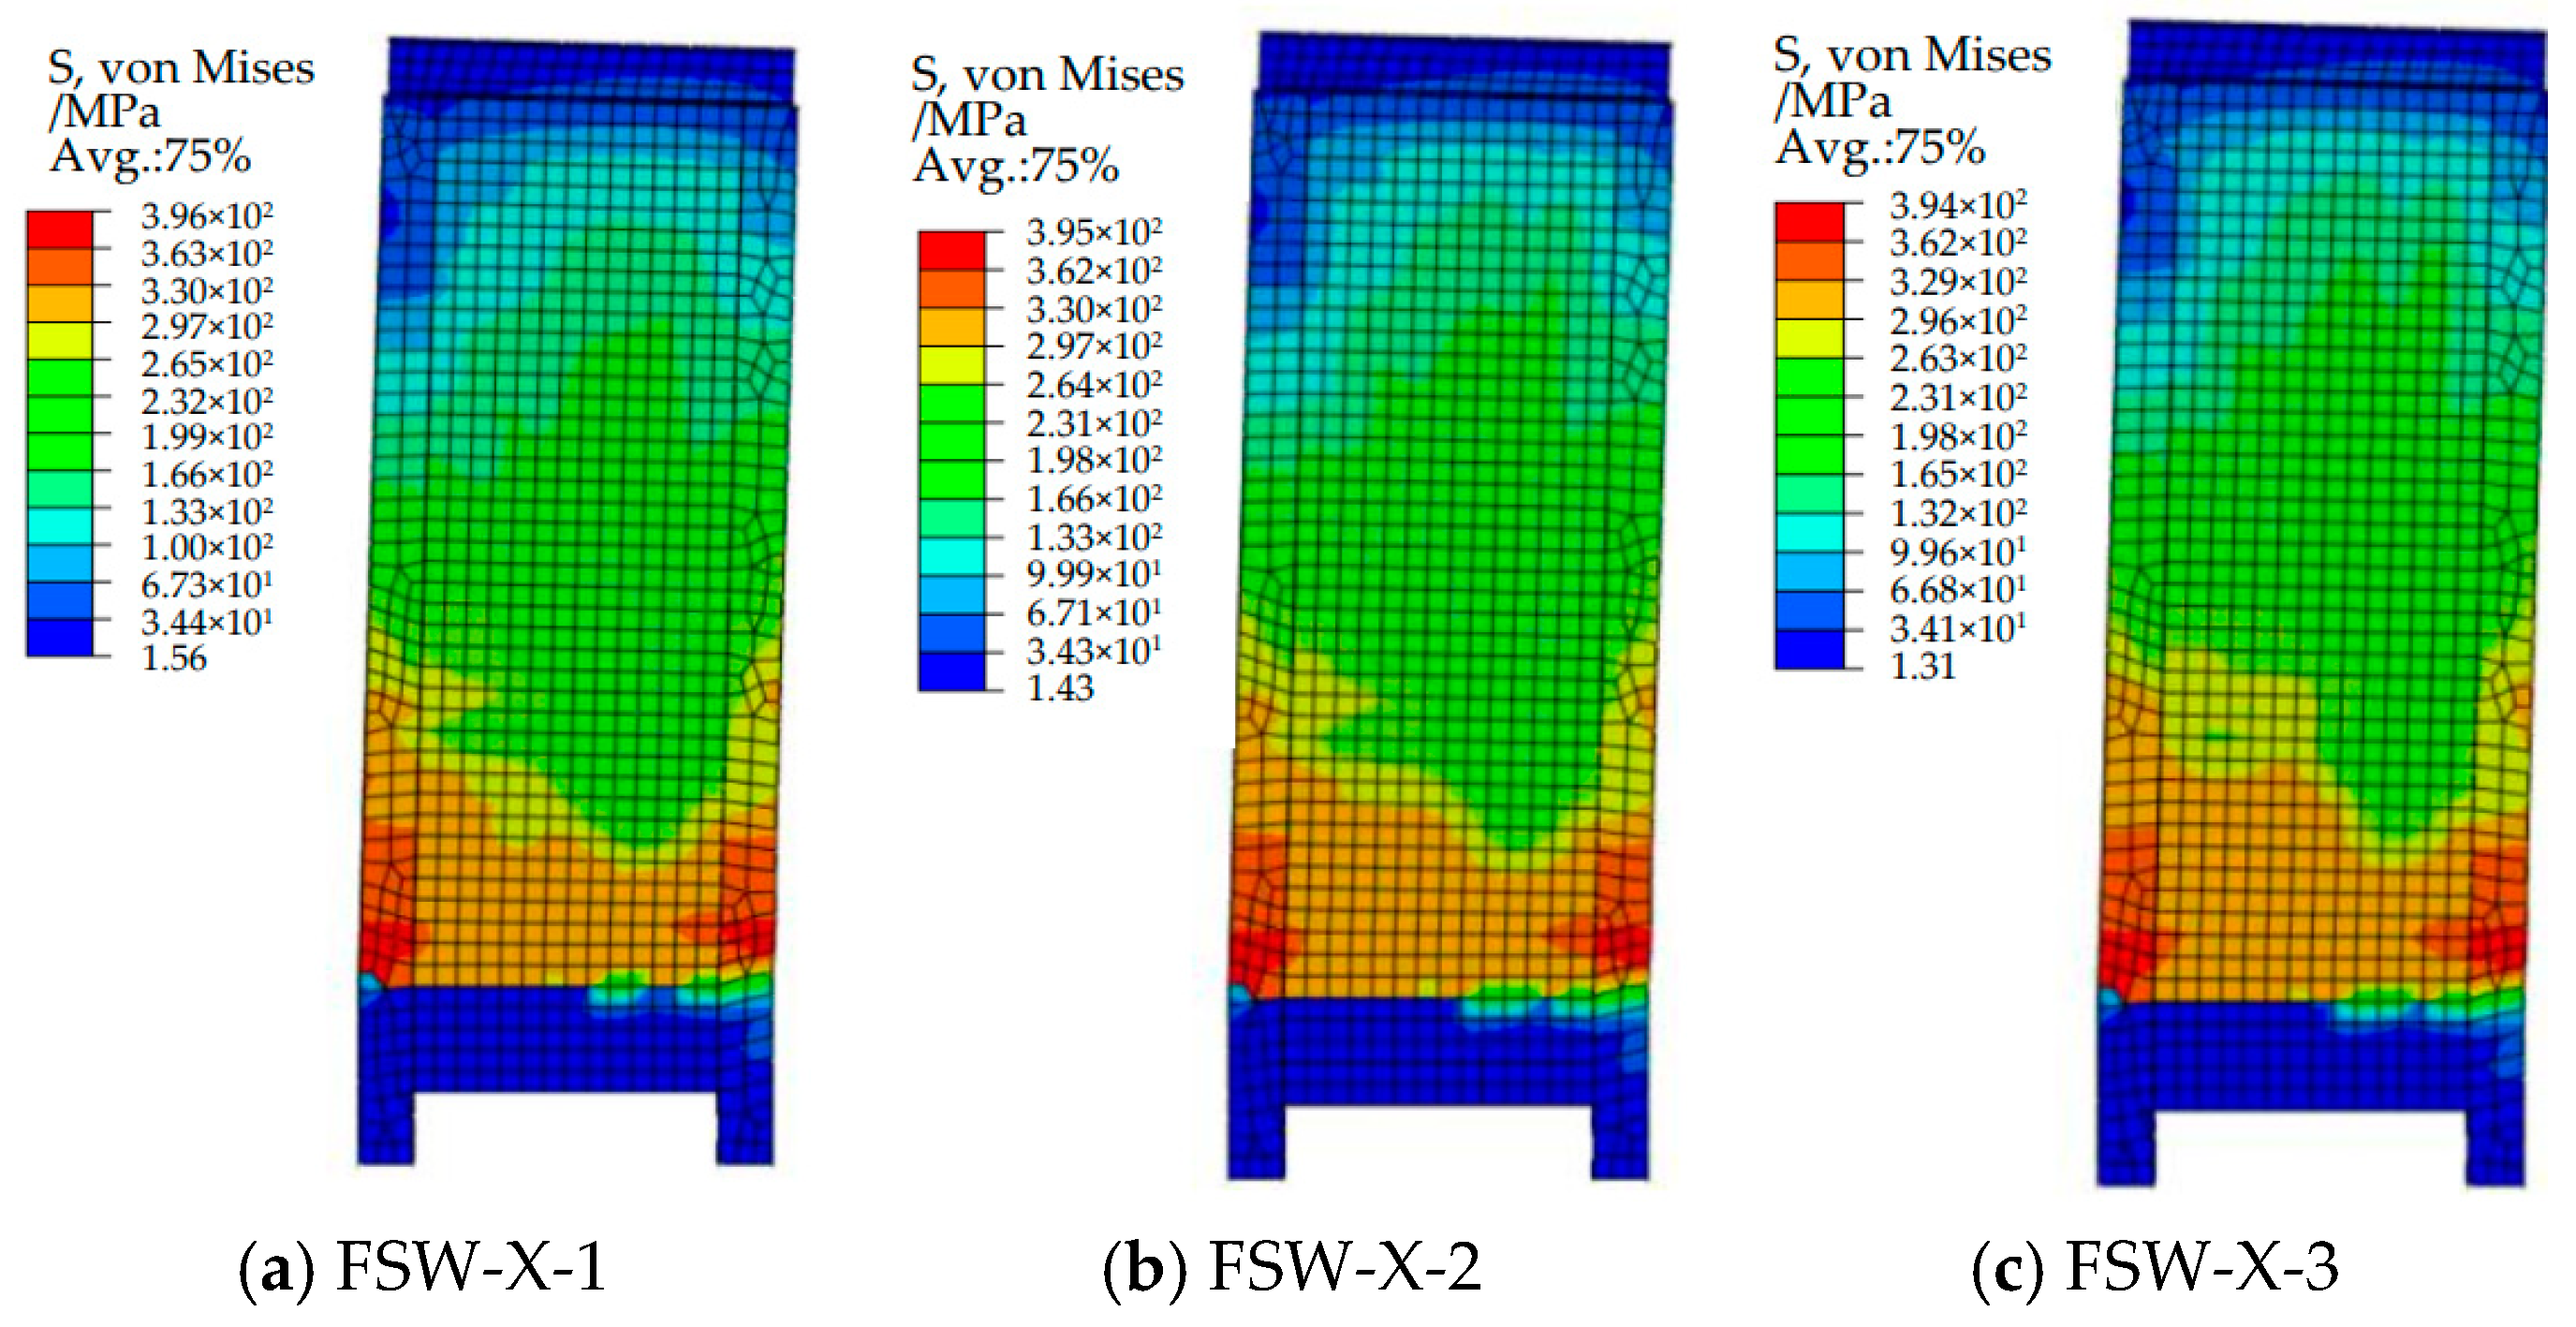
3.2.3. Comparative Analysis of Profile Flange Steel Plate Thickness
- (1)
- Comparison of Simulated Failure Modes and Patterns
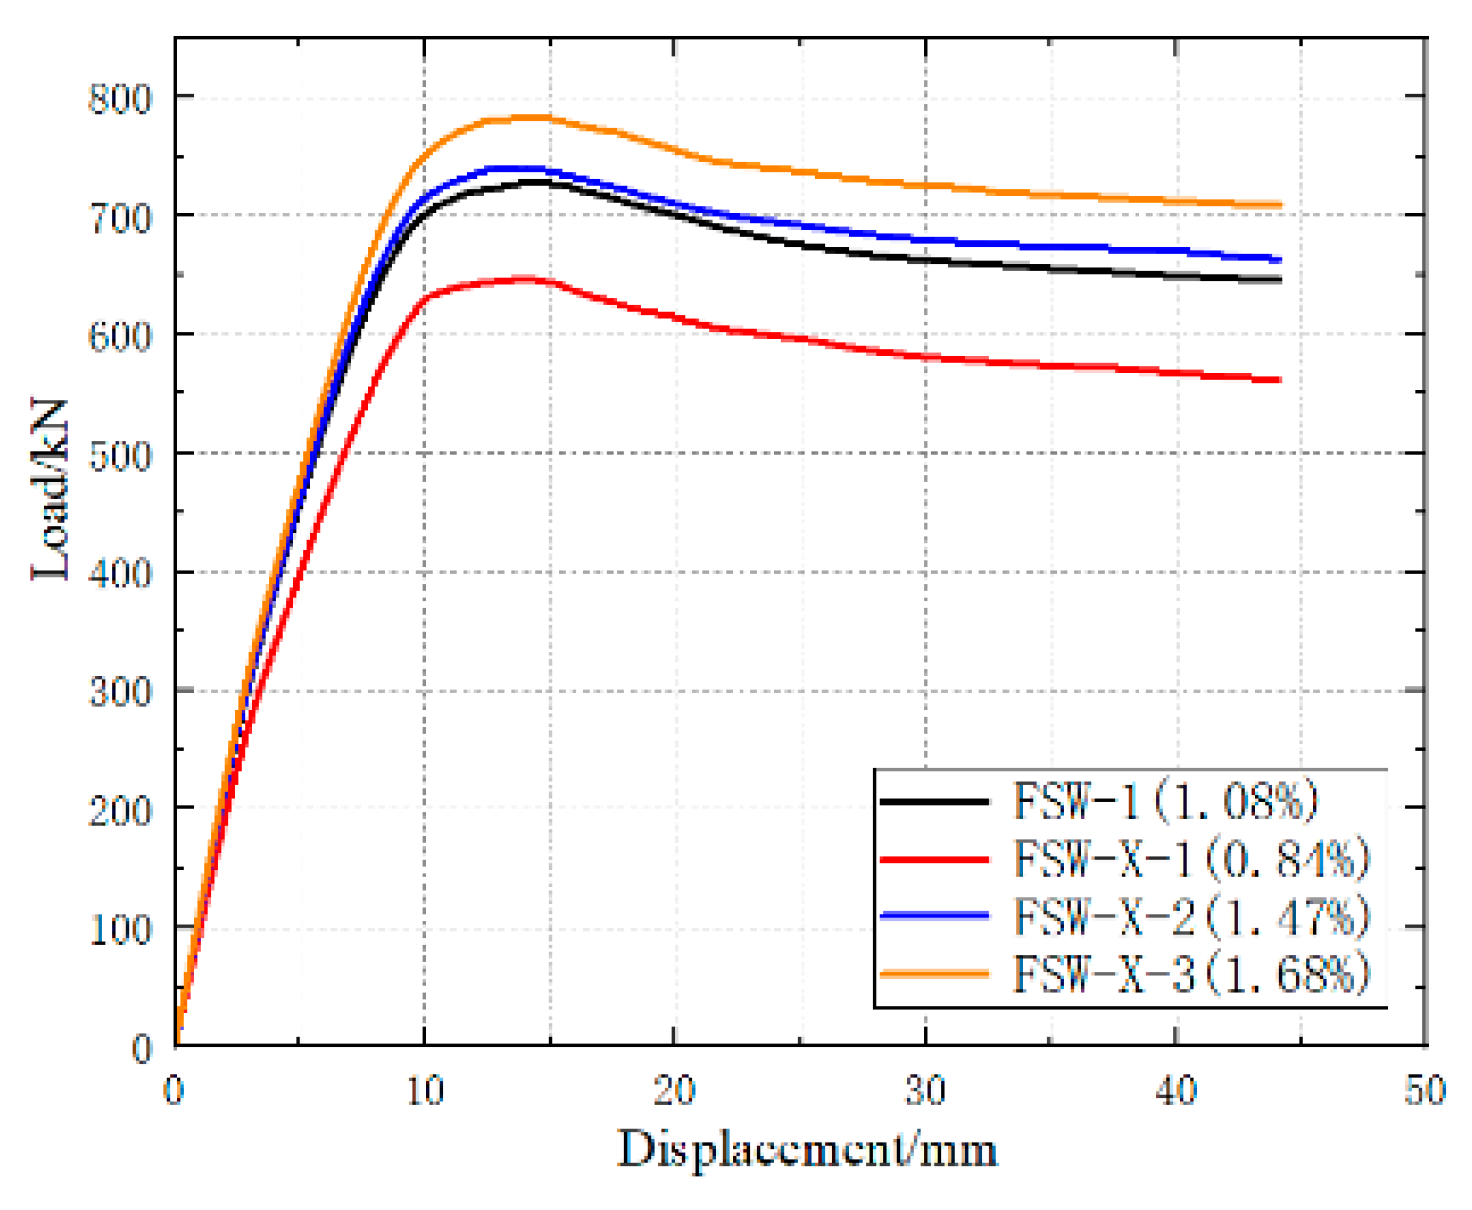
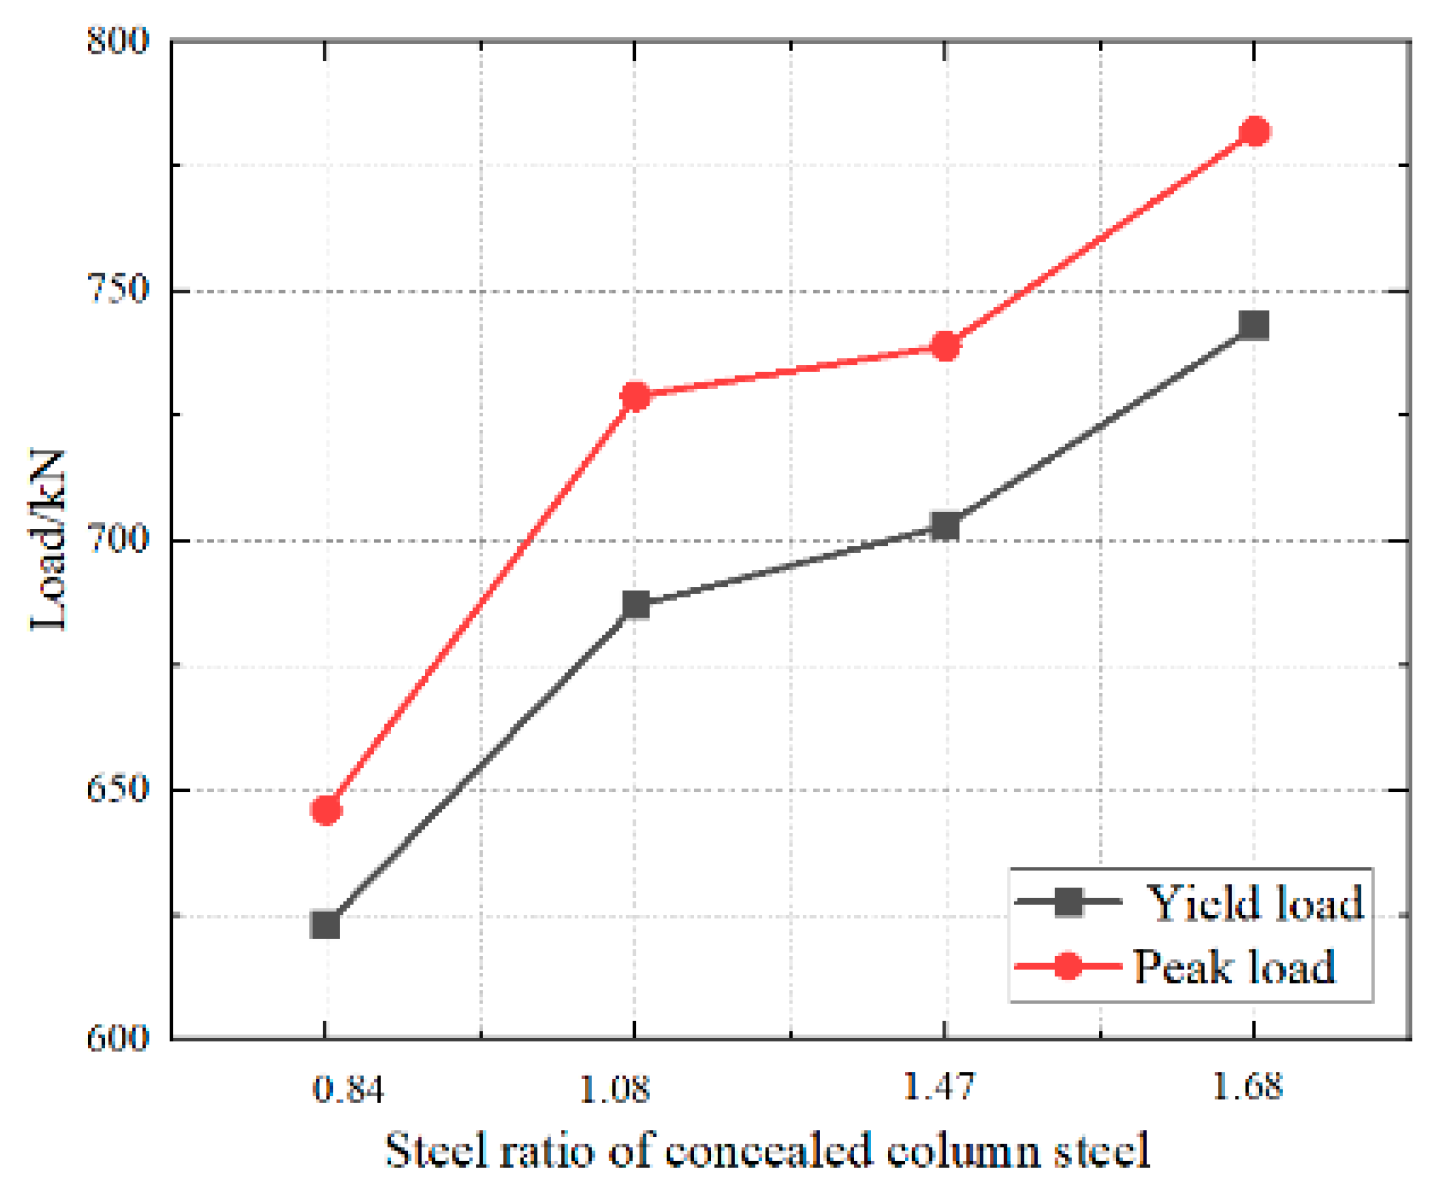
- (2)
- Comparison of Load–Displacement Curves
3.2.4. Comparative Analysis of Longitudinal Reinforcement Ratio in the Non-Restrained Zone
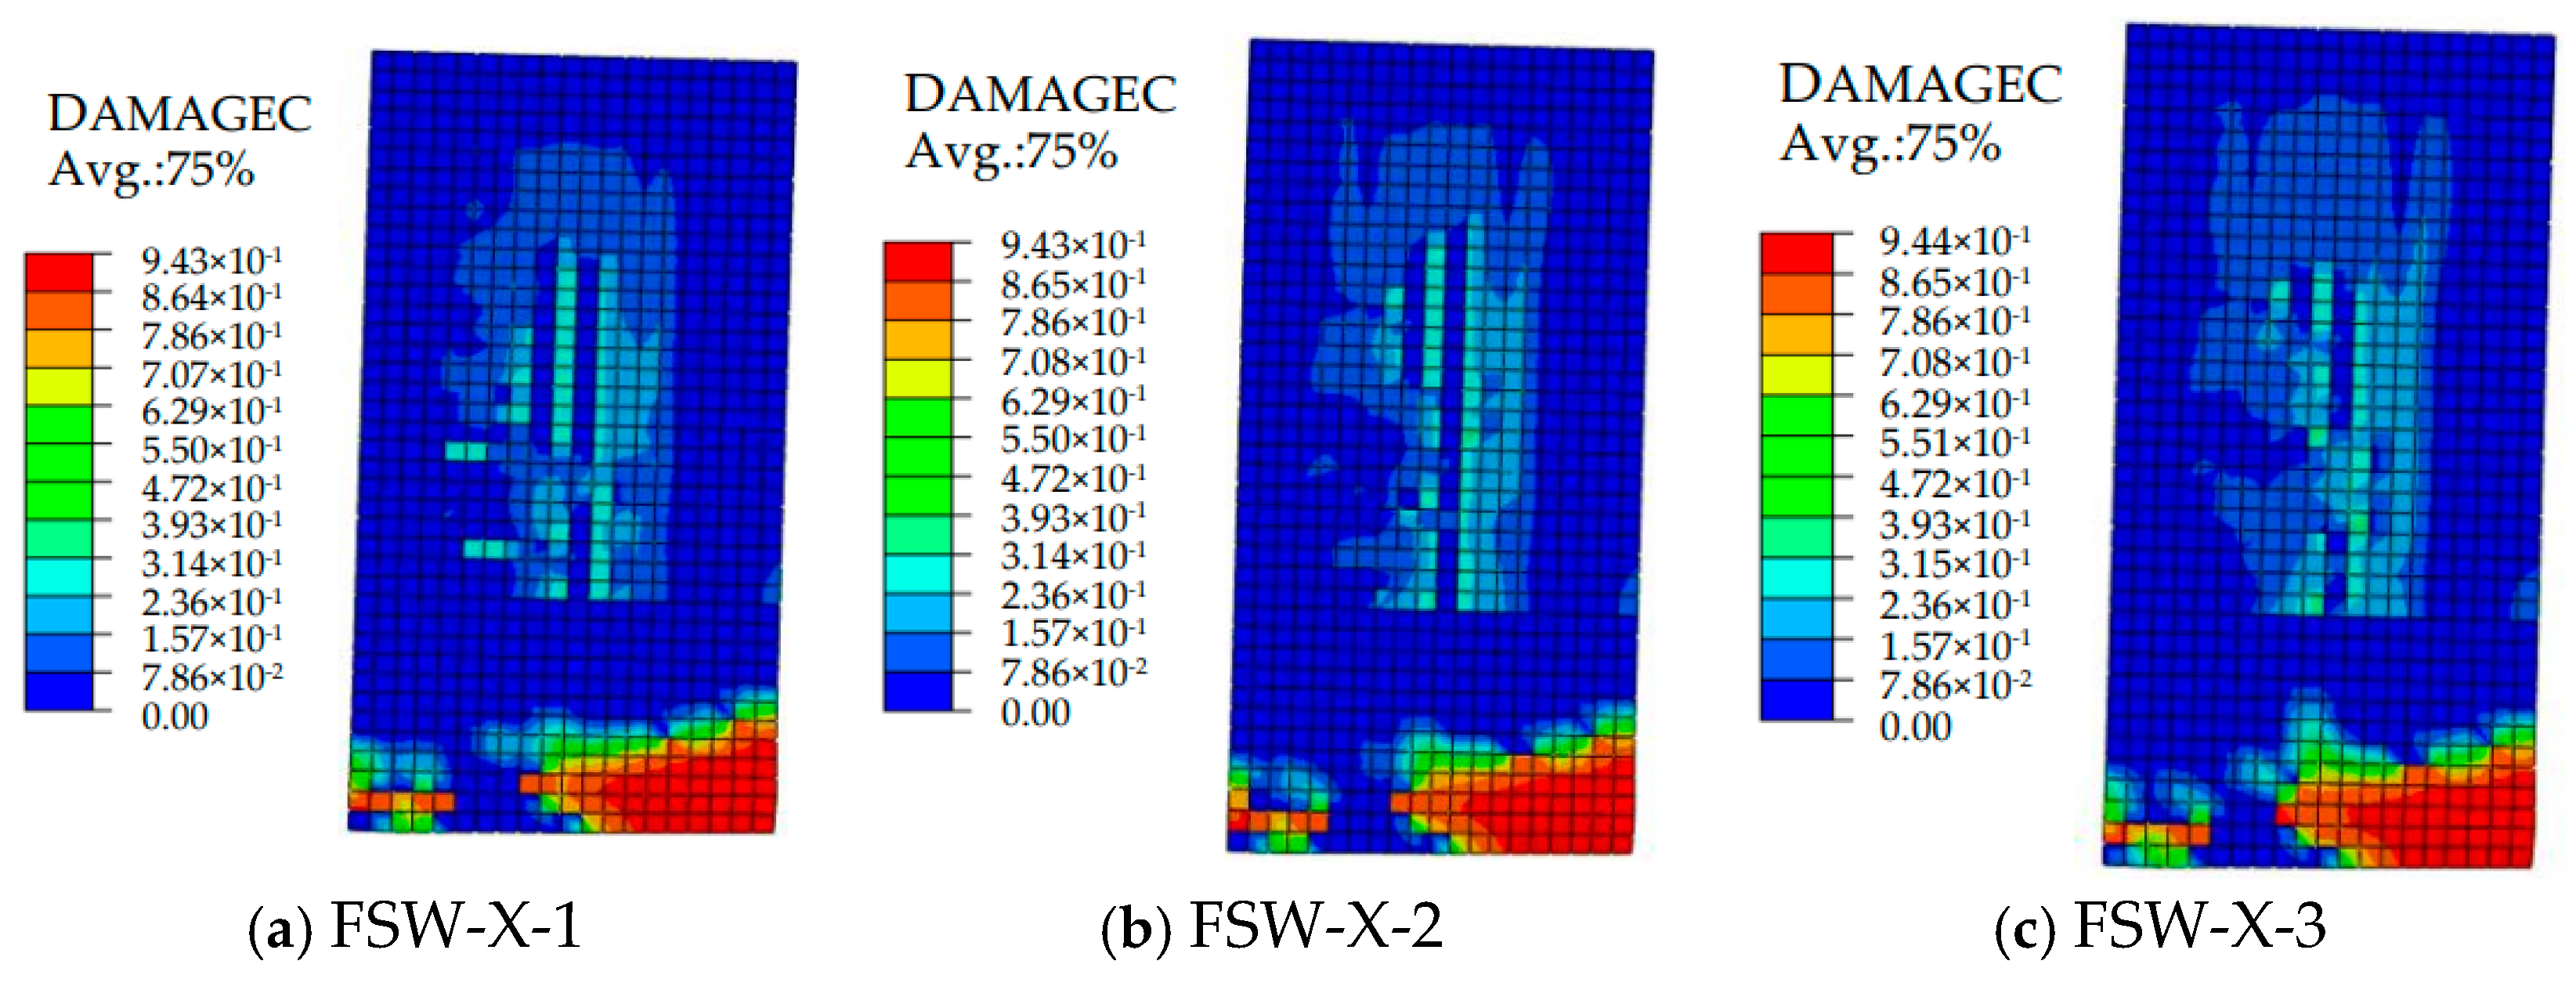
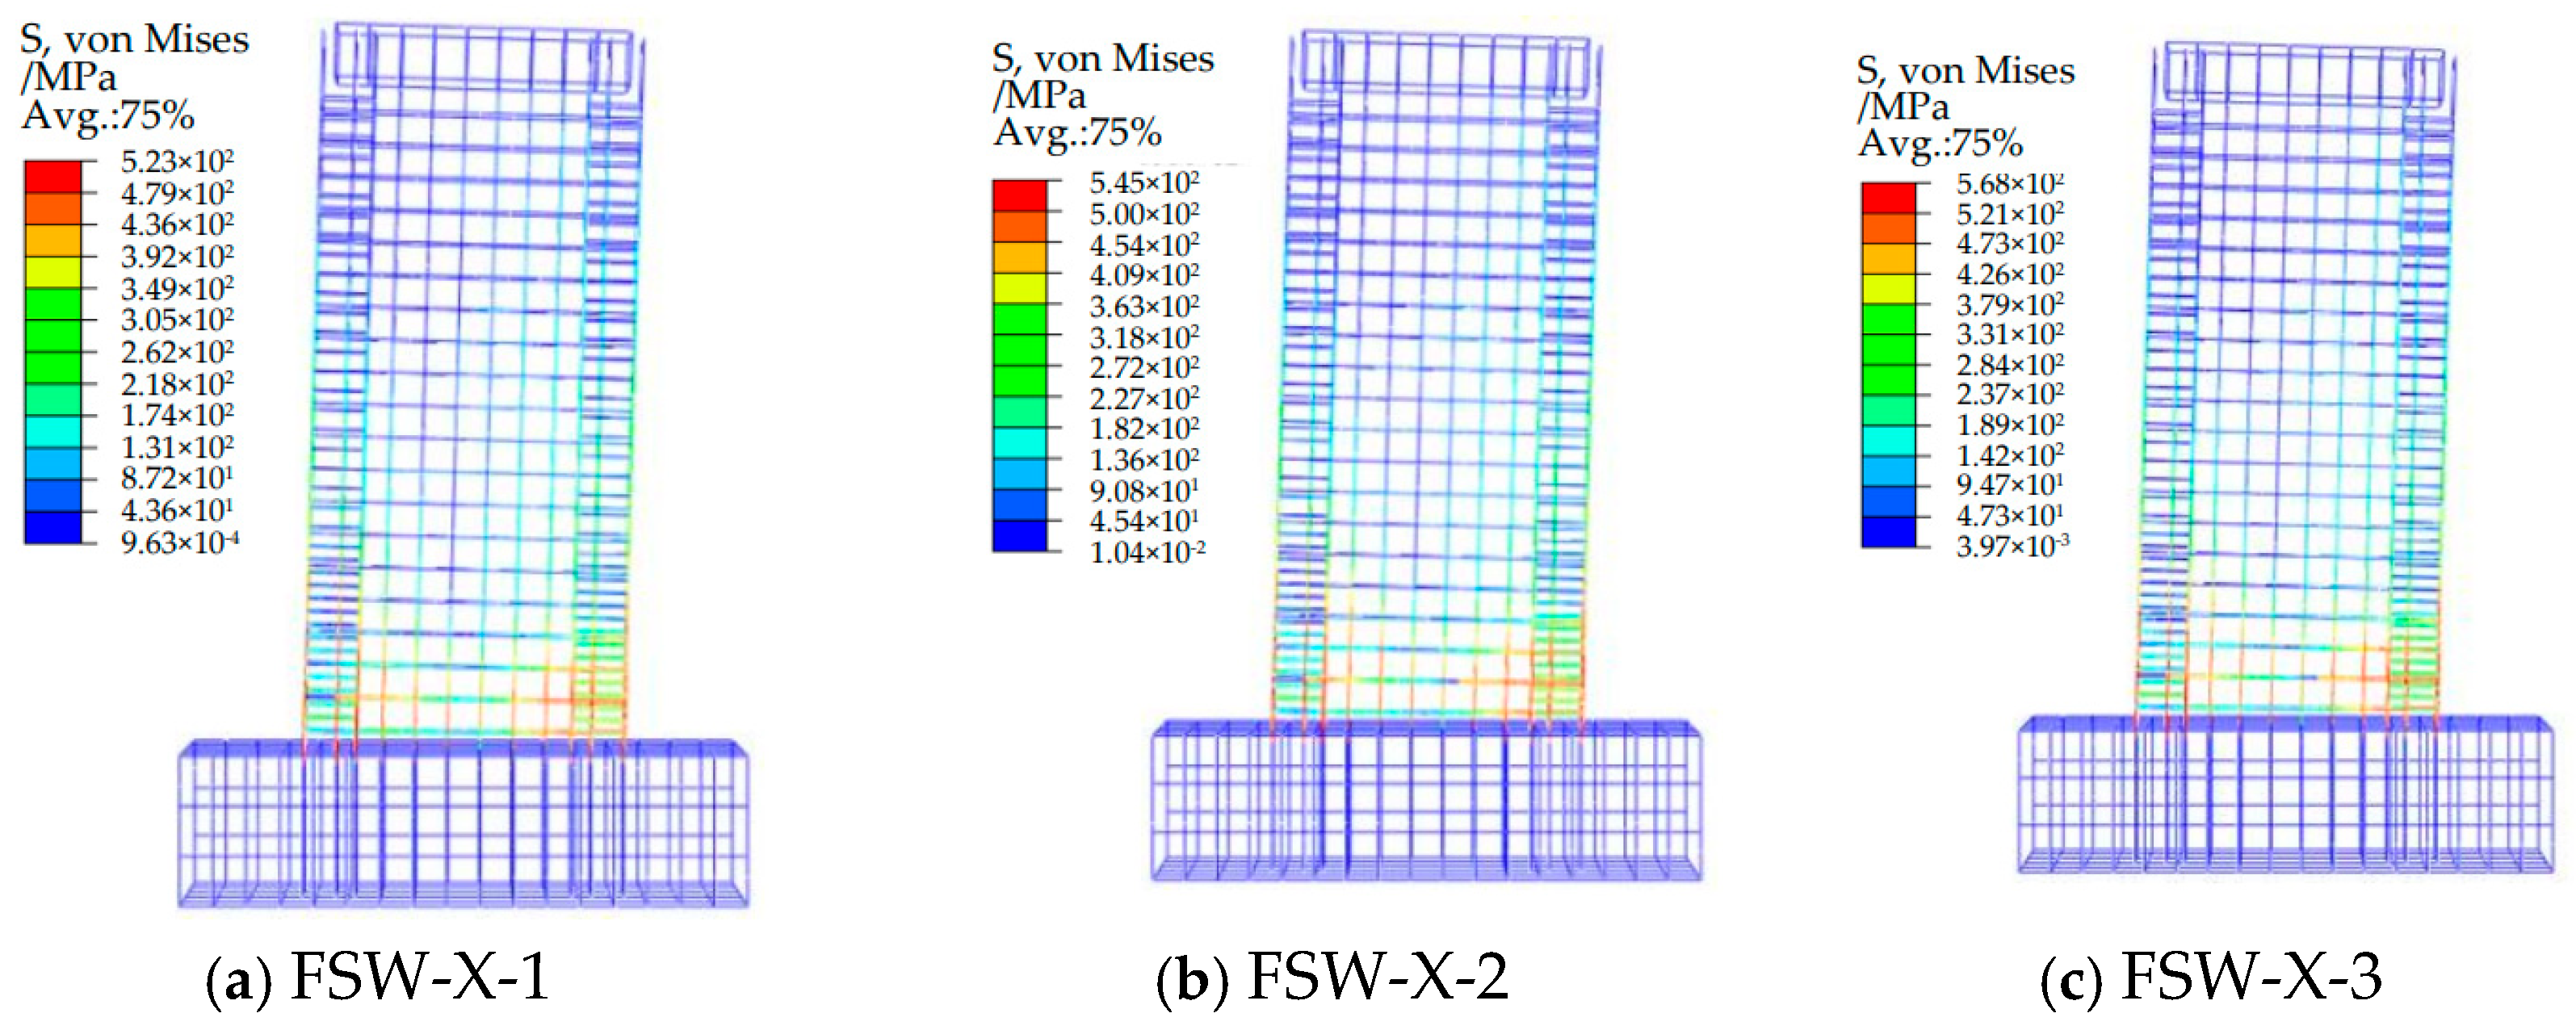
- (1)
- Comparison of Simulated Failure Modes and Morphologies
- (2)
- Comparison of Load–Displacement Curves
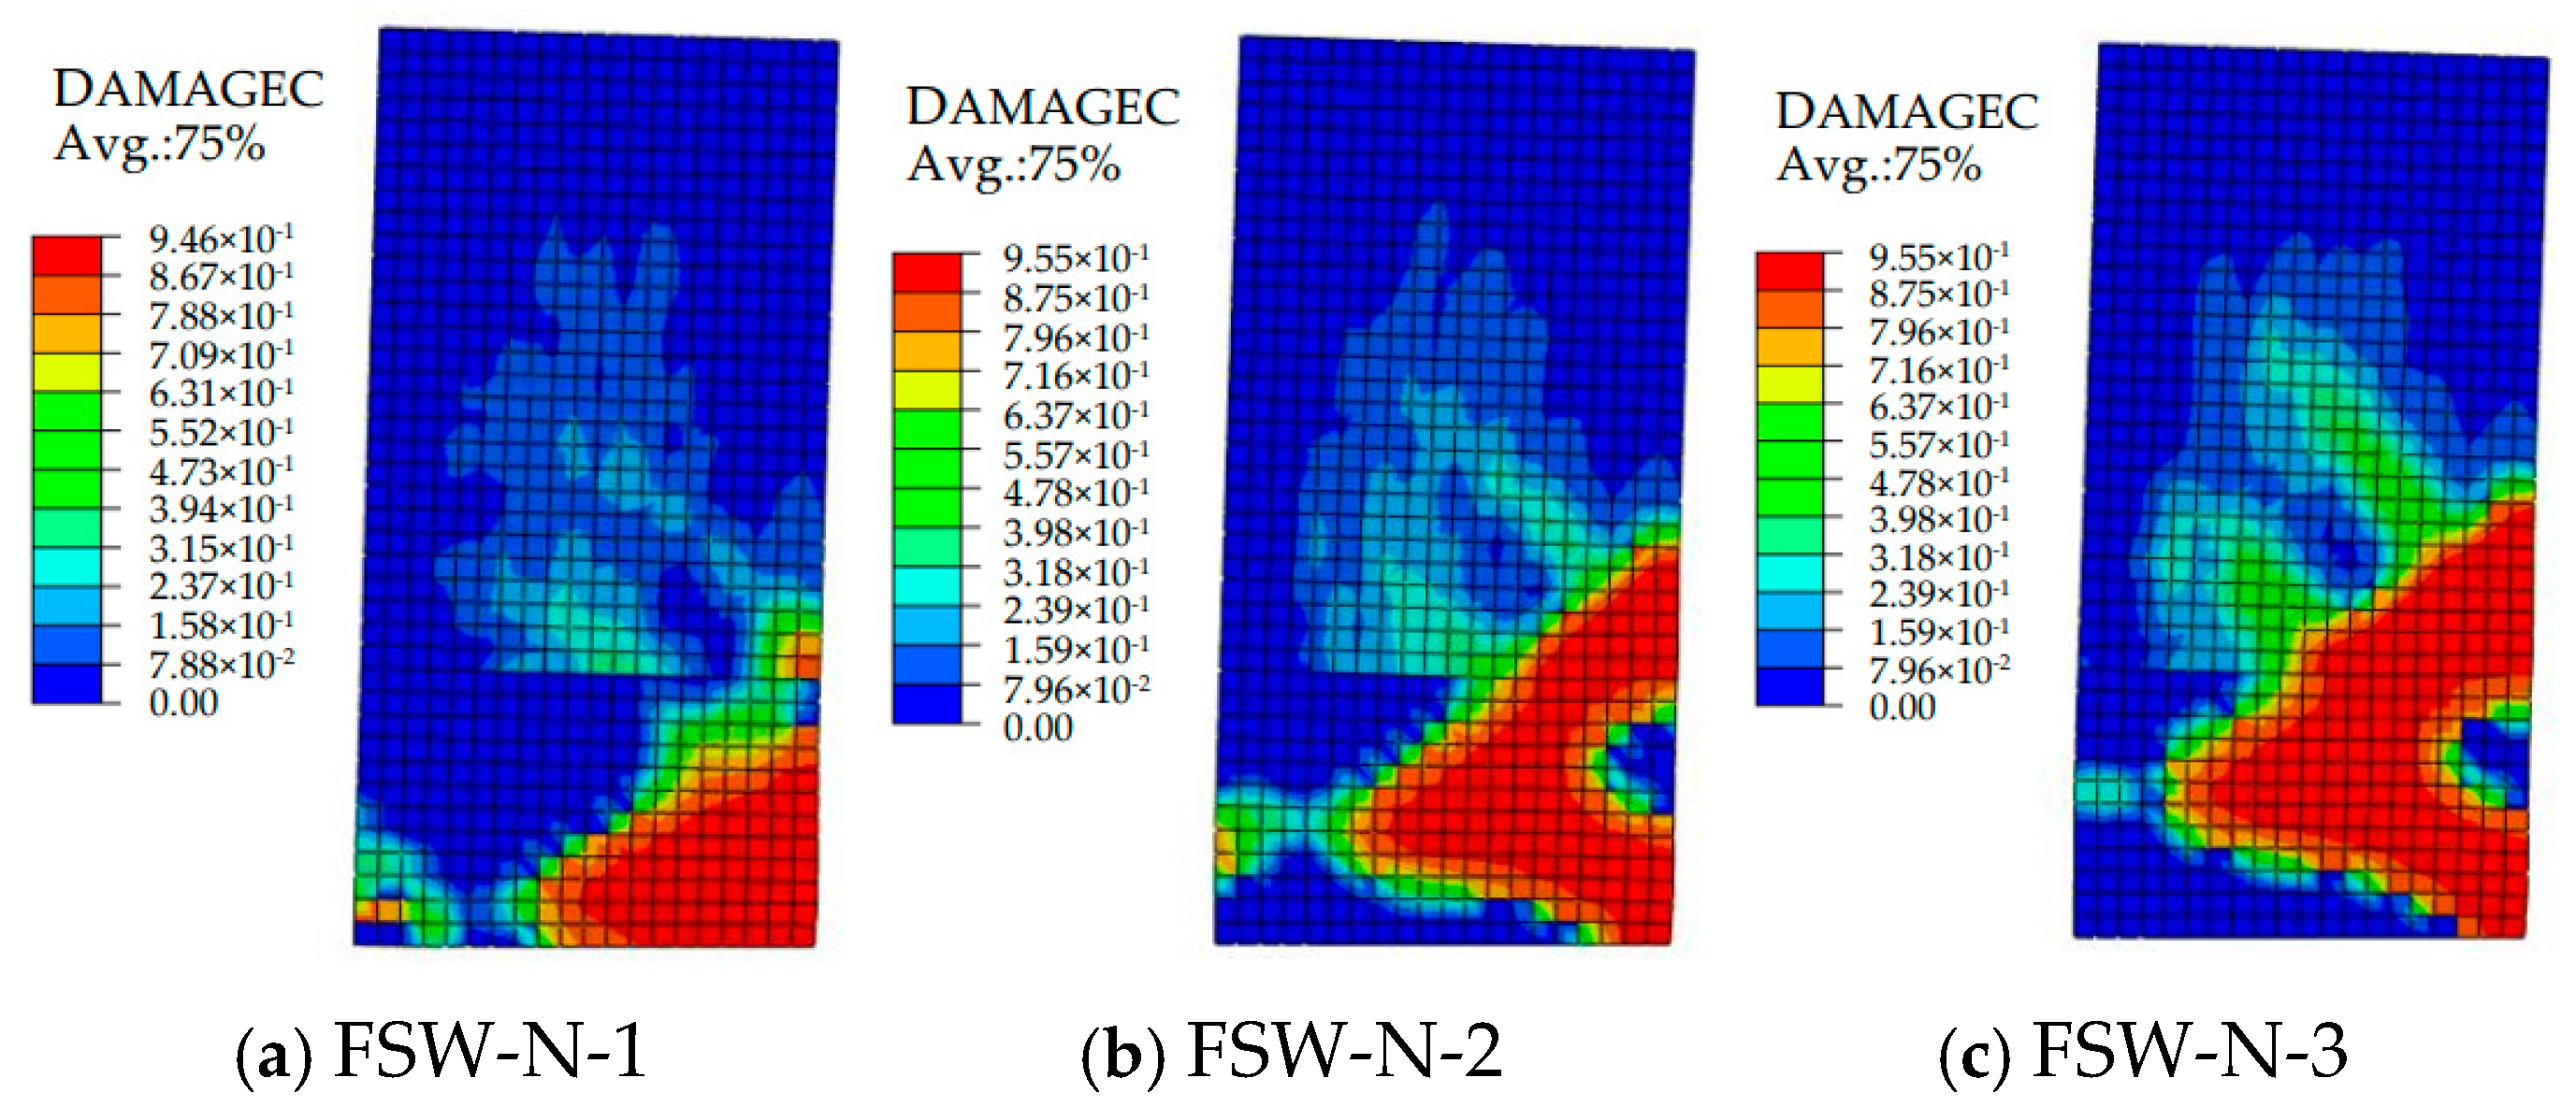
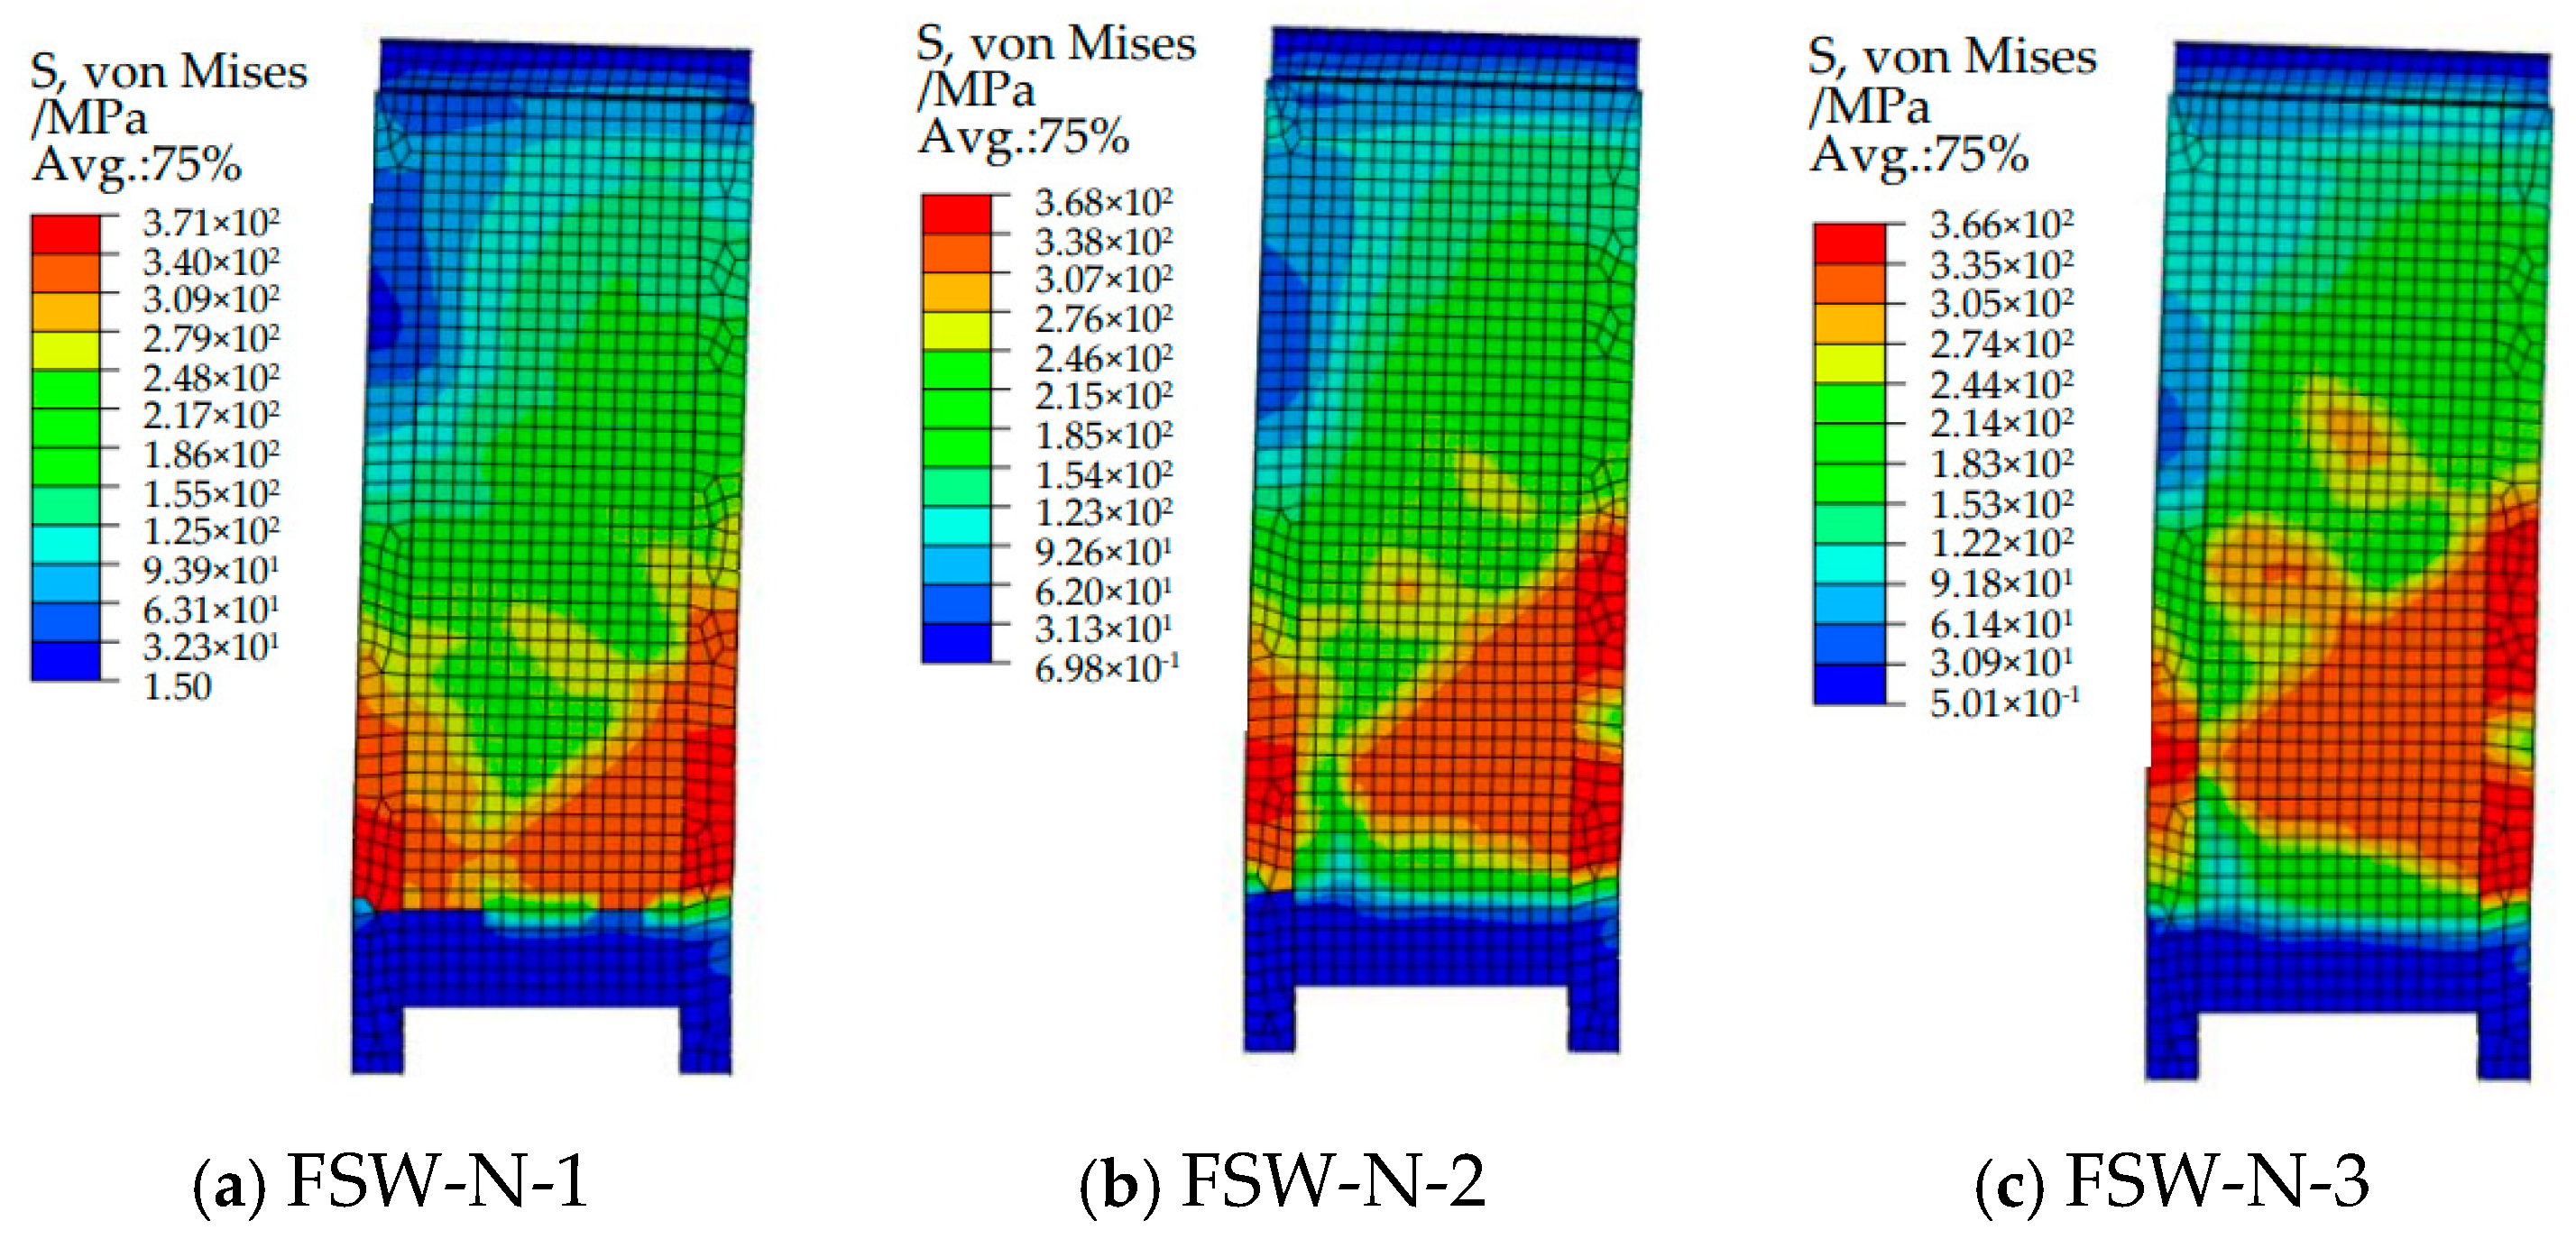
3.2.5. Comparative Analysis of Axial Load Ratio
- (1)
- Comparison of Simulated Failure Modes and Forms
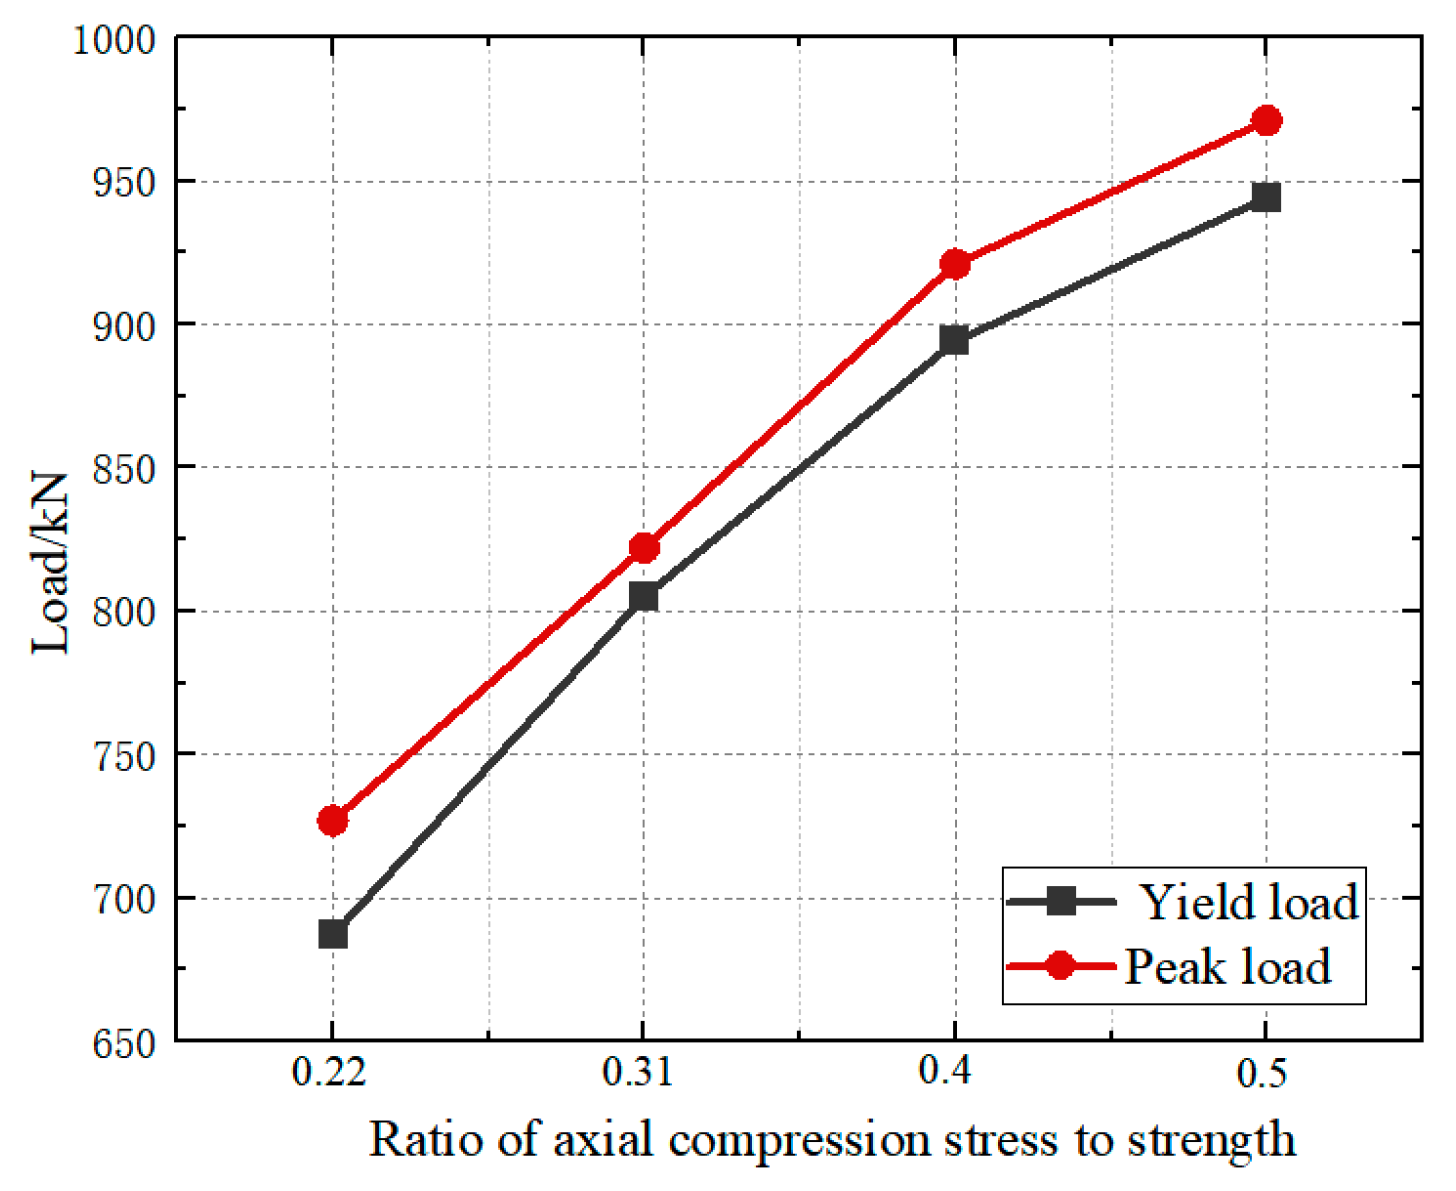
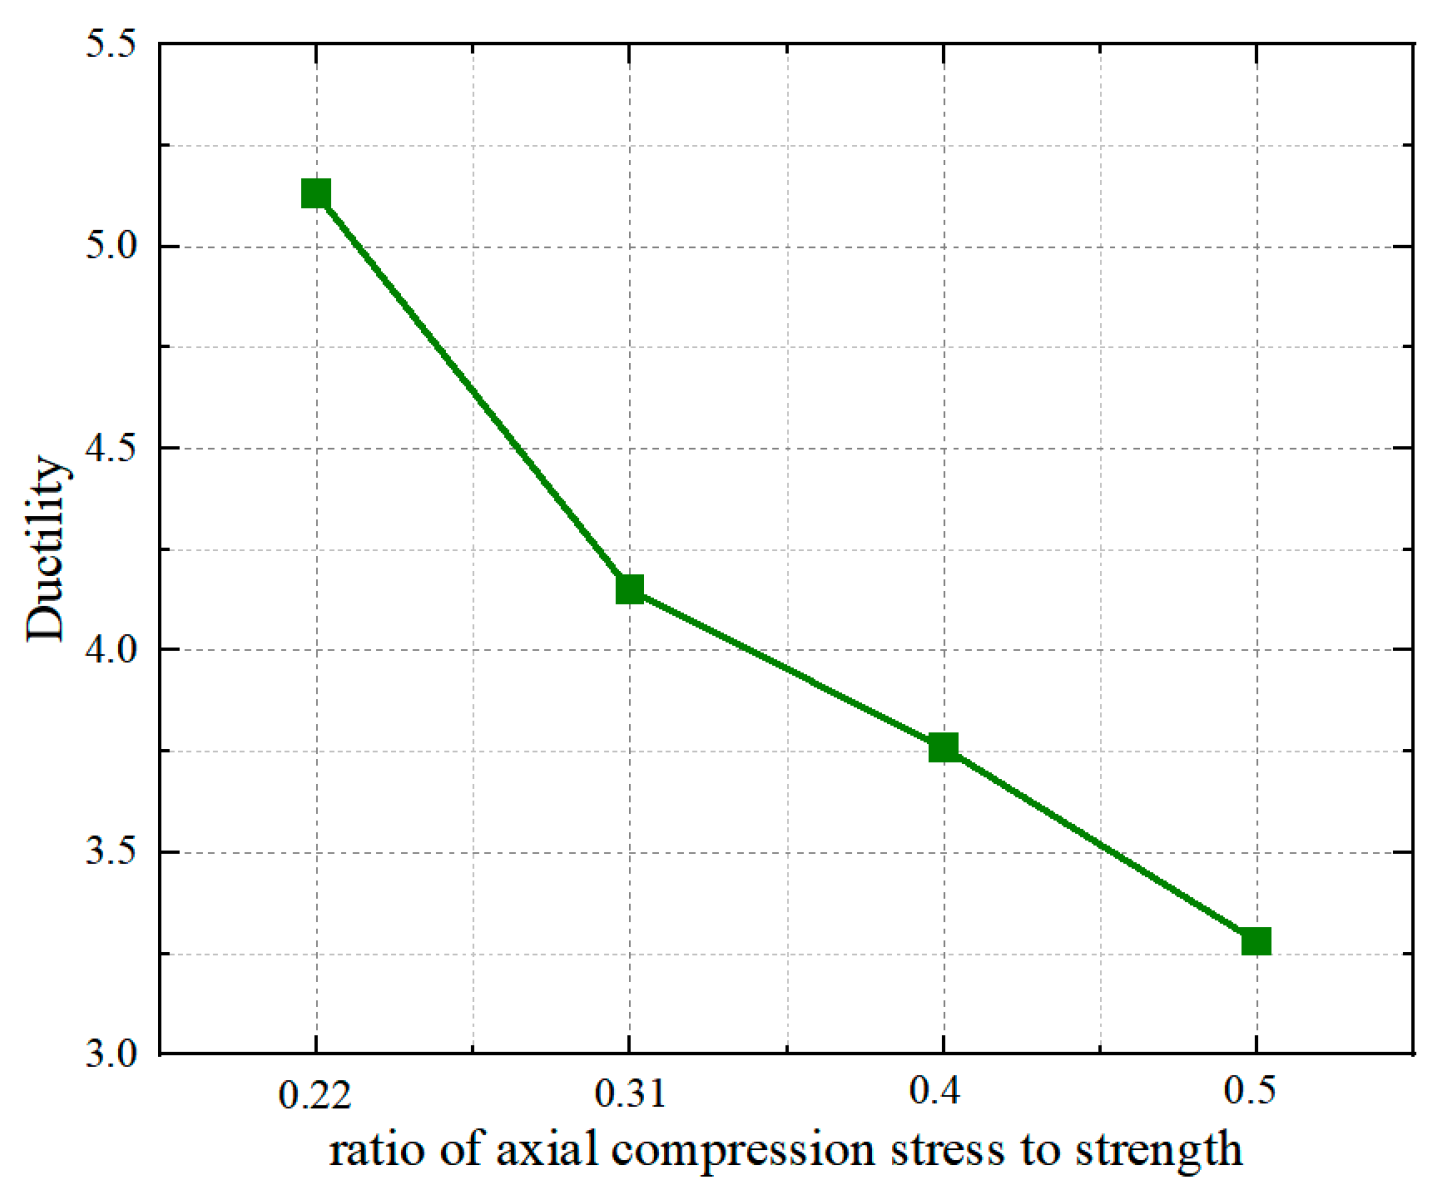
- (2)
- Comparison of Load–Displacement Curves
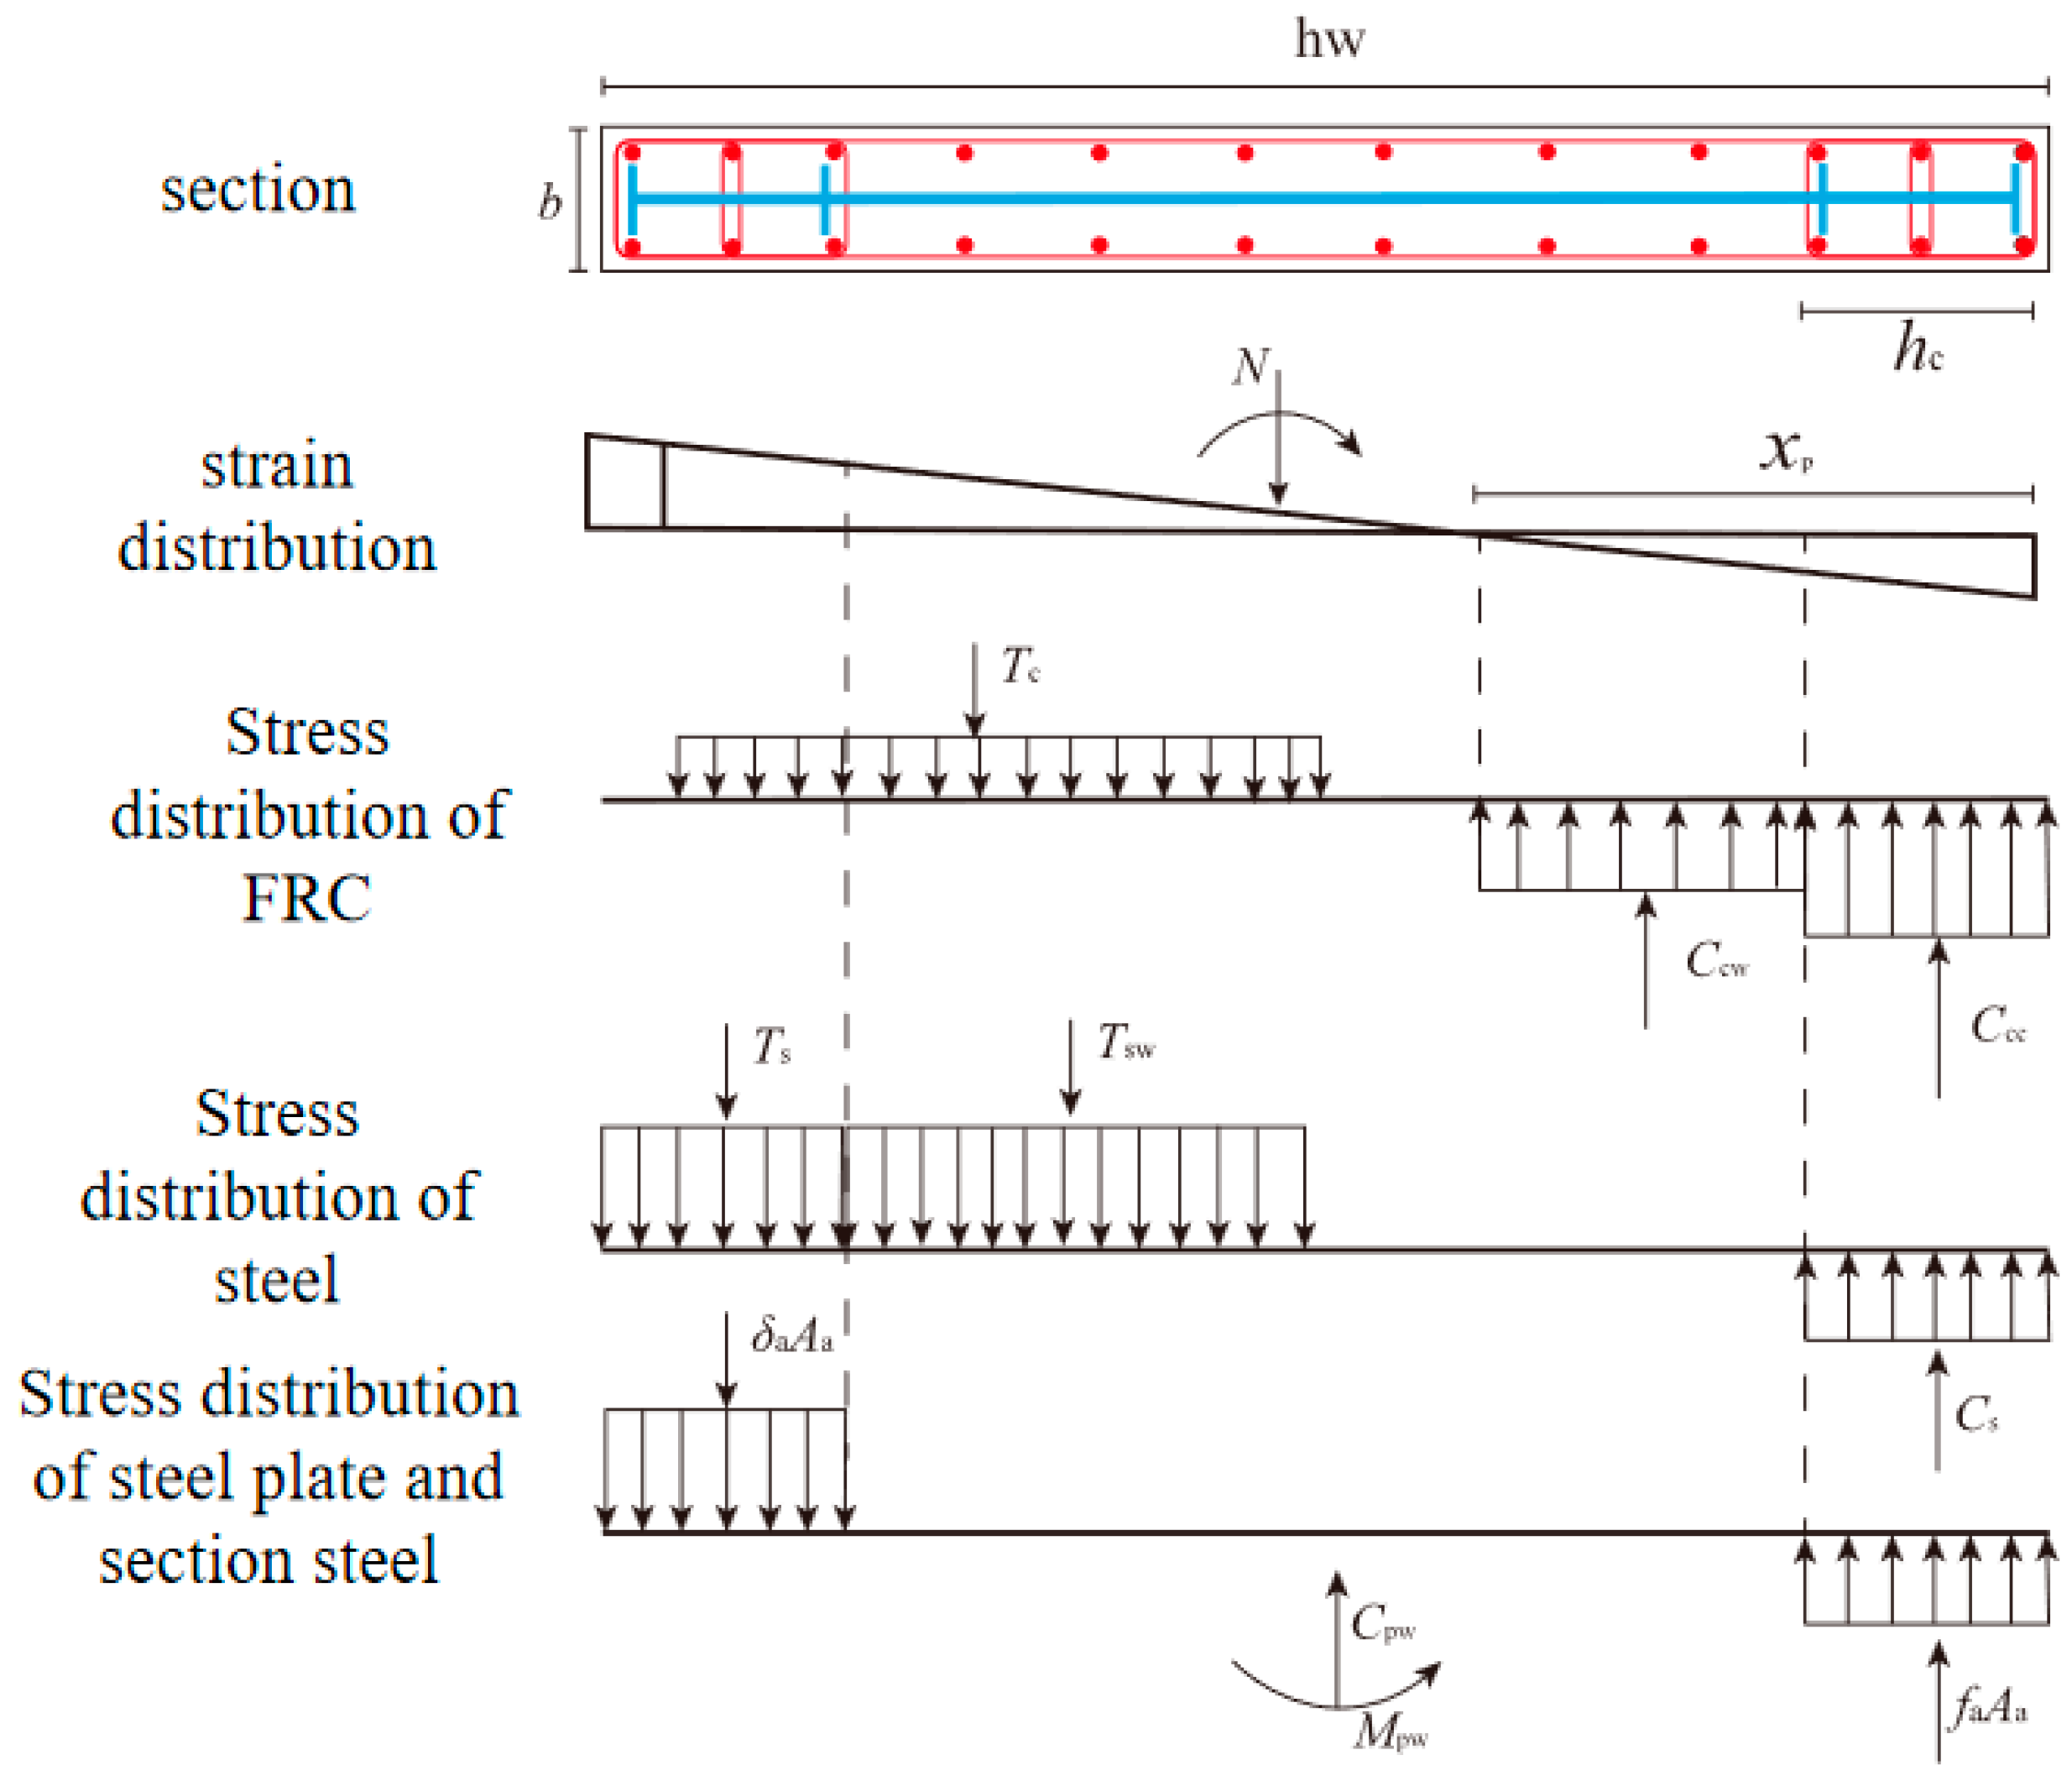
4. Calculation of Bending Capacity for the Cross-Section
- (1)
- After the yielding of the wall, due to the increasing influence of bond slip deformation, when the peak load is reached, the strain distribution in the tensile region of the section no longer conforms to the plane section assumption. However, considering that the fiber bridging effect of FRC significantly improves the tensile ductility after matrix cracking, the strain distribution in the section is still assumed to conform to the plane section assumption [35].
- (2)
- When the maximum compressive strain at the edge of the FRC under compression reaches the peak strain of the confined FRC (0.0096), the constrained end of the compression zone will be in a stirrup-confined state. Therefore, the concrete in the compression zone is divided into two parts: the stirrup-confined dark column region and the unconfined region, both of which are simplified into rectangular stress distribution patterns. The increase factor for compressive concrete strength in the stirrup-confined dark column region, α1, is taken as 1.3 [36]. For the unconfined region, the equivalent stress distribution factors are calculated as αc = 0.91, βc = 0.73 [37].
- (3)
- Consider the effect of fiber-reinforced concrete (FRC) in the tensile zone. When the longitudinal reinforcement at the tensile-constrained end reaches the design limit tensile strain (εsu = 0.01) [38], the edge of the tensile zone FRC also reaches the limit tensile strain (εtu = 0.0097). The tensile zone begins to exhibit a transition from the stable development of fine cracks to the concentration of localized cracks. At this stage, the stress distribution in the tensile zone is bilinear. The equivalent stress distribution factors are calculated as αt = 0.91, βt = 0.73, and the coefficient λ = xt/xp = εtu/εp [39] is introduced to calculate the effective height of the FRC tensile zone.
- (4)
- Typically, under peak load conditions, both the tensile and compressive constrained end longitudinal reinforcements have yielded and may even reach the strengthened region (εs ≥ εtu). For safety and simplified calculation purposes, the stress in the reinforcement is assumed to remain at the yield strength. For walls with a higher distribution of vertical reinforcement, only the contribution of the tensile vertical reinforcement Tsw is considered. The separated reinforcement distributed along the height hwt of the unconfined zone can be converted into an area-equivalent but continuous steel web Asw = tshwt. It is specified that within a certain range (ηxp) on both sides of the neutral axis, the stress in the reinforcement reaches the yield strength. The value of η can be determined according to the plane section assumption [40].
5. Conclusions
- (1)
- Finite element analysis of the specimens shows that the curves obtained from numerical simulations are in good agreement with the experimental results, with the error in the positive bearing capacity controlled within 10%. Therefore, the model is considered successfully established and exhibits a high level of accuracy.
- (2)
- At the peak load point, the steel plates at the beam–wall interface all experienced yielding, which is consistent with the observed buckling of the steel plates at the beam–wall interface after the pseudo-static tests. The entire cross-section of the steel plates at the beam–wall interface yielded, with a relatively large yielding area. This is consistent with the large bending moments experienced by the specimen, indicating that the use of fiber-reinforced concrete (FRC) significantly enhances the performance of the steel plates.
- (3)
- With the increase in reinforcement ratio, H-section thickness, and the strength of fiber-reinforced concrete (FRC), the bearing capacity of shear walls with embedded FRC steel plates in the plastic hinge zone increases steadily. Overall, the strength of fiber-reinforced concrete (FRC) has a relatively significant impact on seismic performance.
- (4)
- By comparing and analyzing the seismic requirements such as failure mode, bearing capacity, and ductility of the composite shear wall obtained by numerical simulation, the optimal design values of FRC concrete strength, steel plate steel ratio, steel ratio, and longitudinal reinforcement ratio in the plastic hinge area are C70, 3.96%, 1.08%, and 0.6%, respectively, which can provide design reference for its practical engineering application.
- (5)
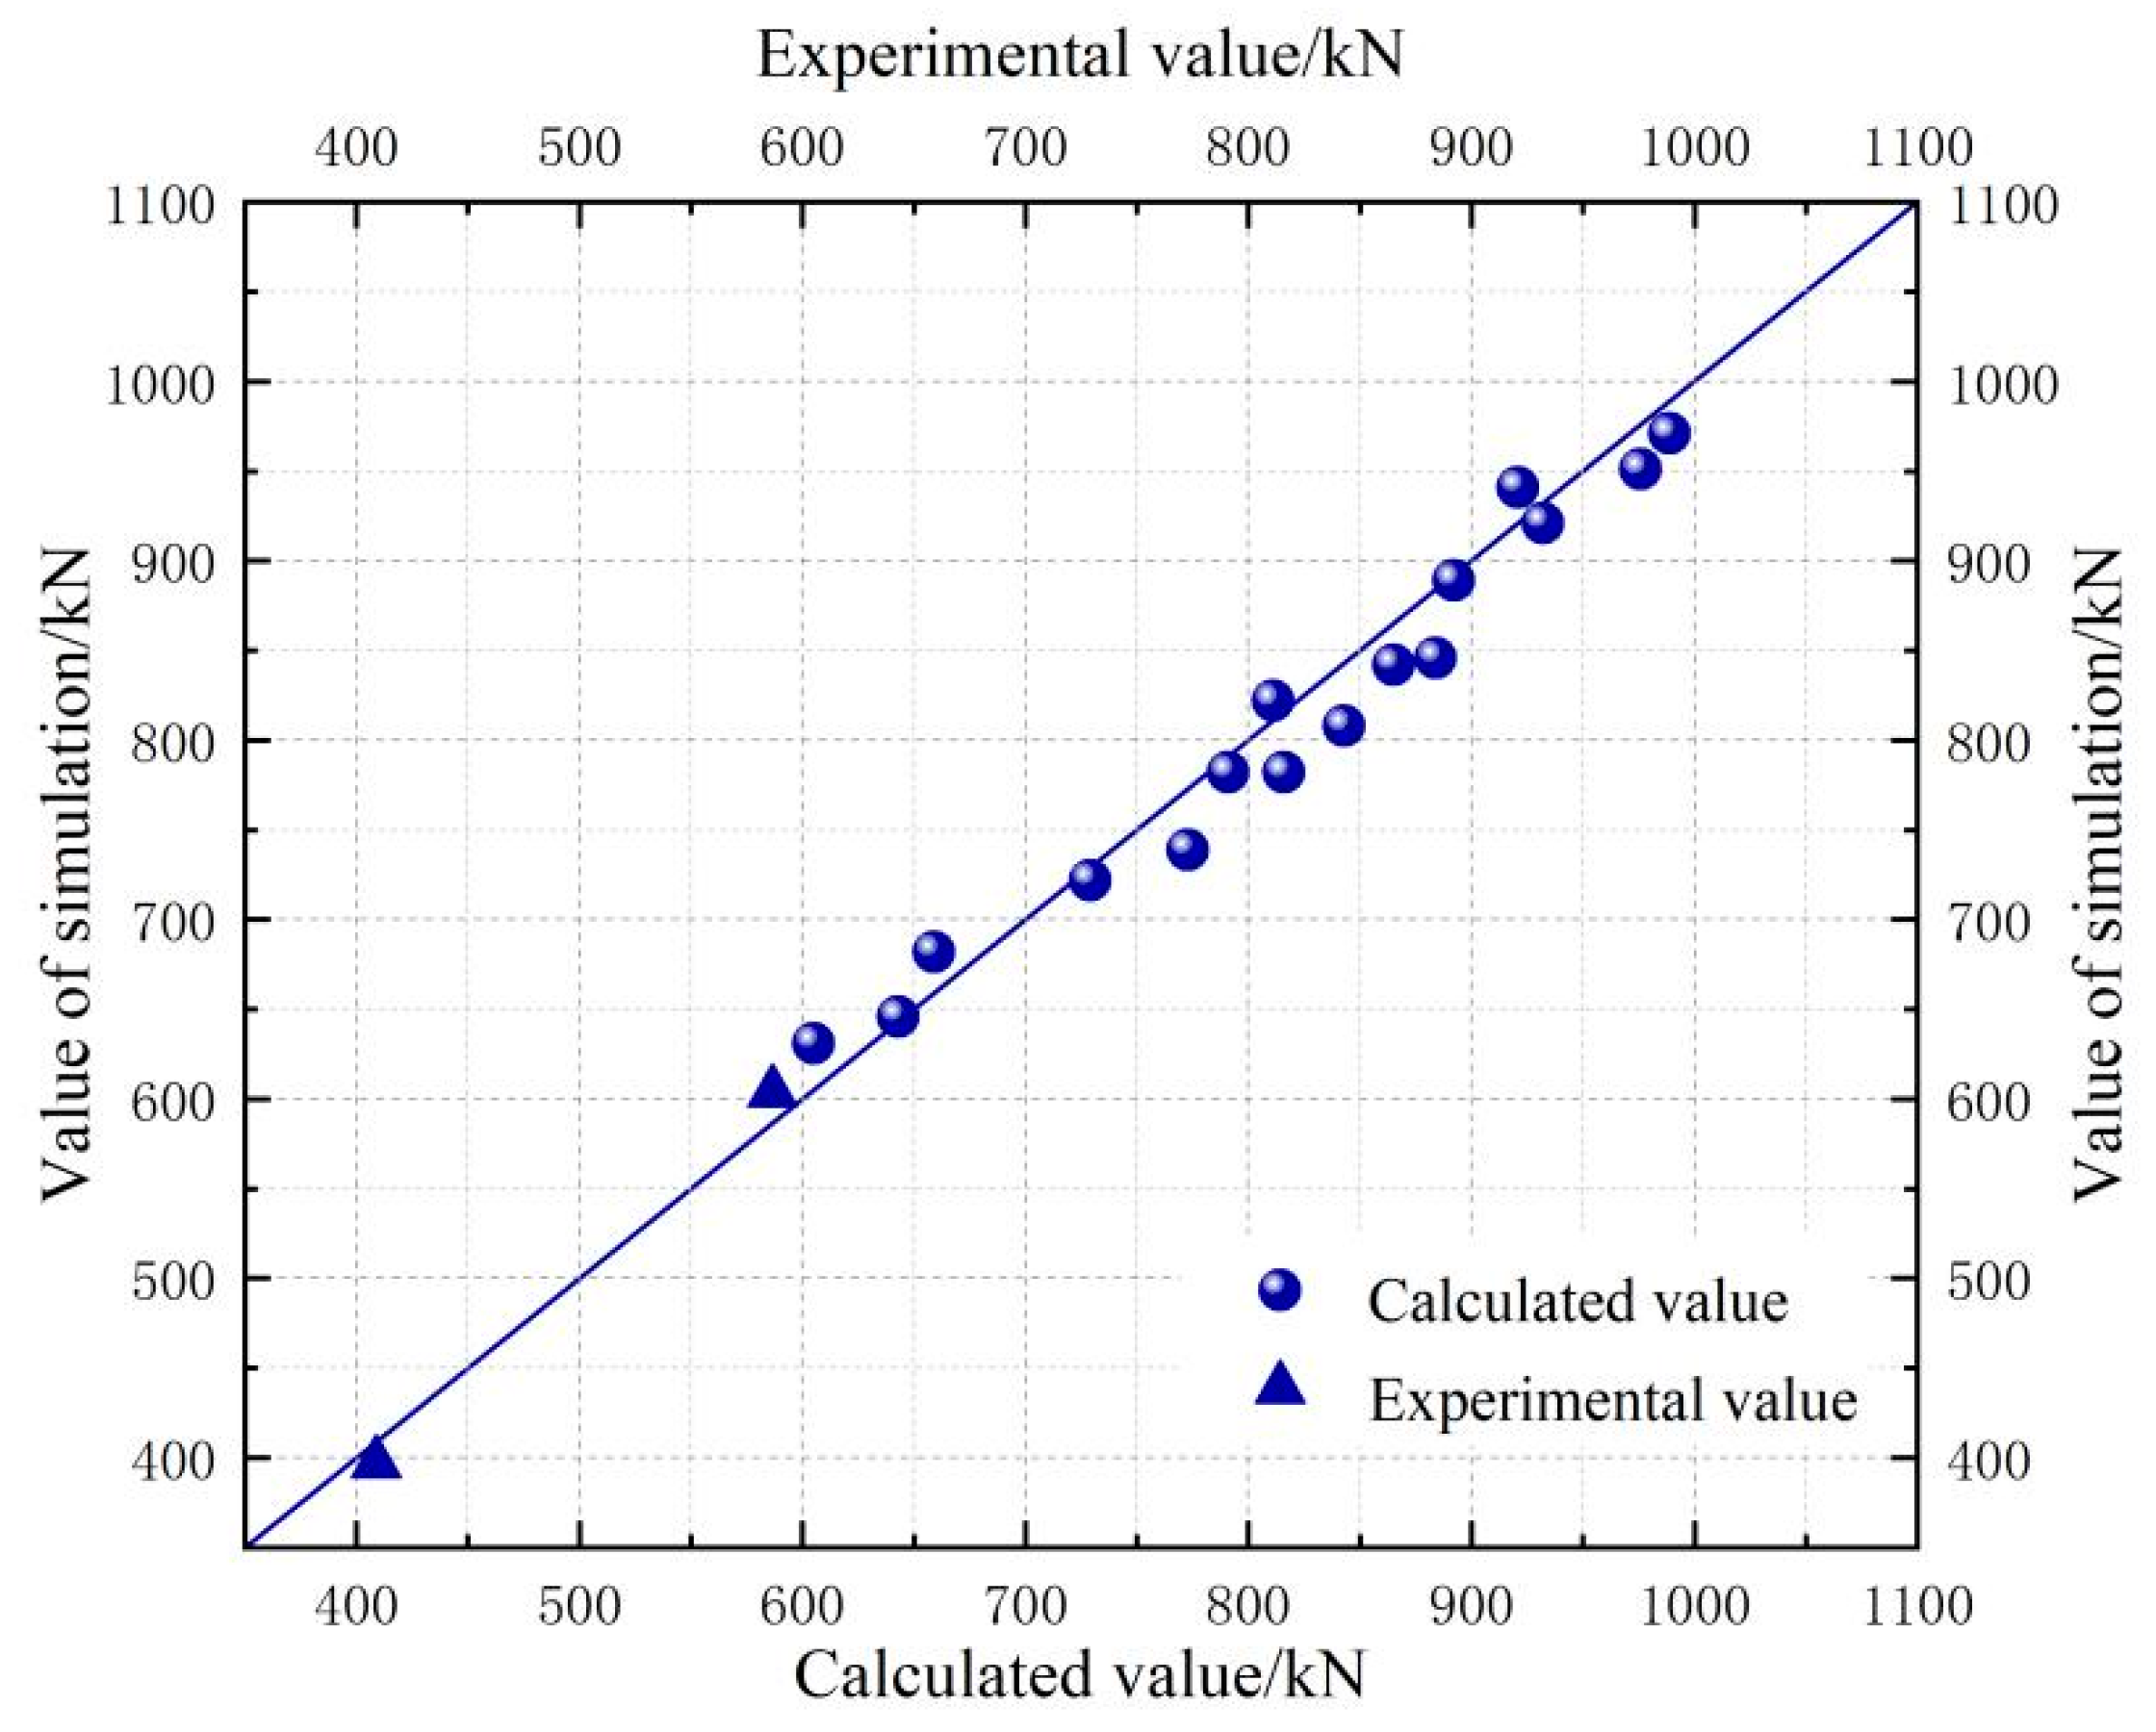
- In the current relevant design standards, the design of the plastic hinge zone usually depends on the characteristics of traditional concrete materials, which fails to fully consider the superior performance of FRC concrete. Moreover, the lack of special design formulas for FRC concrete may lead to the failure to give full play to the advantages of FRC in the design of the plastic hinge zone. The formula for calculating the flexural capacity of the normal section of the steel plate composite shear wall structure with FRC in the plastic hinge zone is proposed in this paper. The calculation results are in good agreement with the numerical simulation results. Therefore, the formula proposed in this paper can be referred to, and the relevant provisions of FRC concrete can be added to supplement the relevant design standards of crack resistance and toughness of FRC.
Author Contributions
Funding
Data Availability Statement
Acknowledgments
Conflicts of Interest
References
- Wang, W.; Wang, Y.; Lu, Z. Experimental study on seismic behavior of steel plate reinforced concrete composite shear wall. Eng. Struct. 2018, 160, 281–292. [Google Scholar] [CrossRef]
- Wang, B.; Jiang, H.J.; Lu, X.L. Seismic performance of steel plate reinforced concrete shear wall and its application in China Mainland. J. Constr. Steel Res. 2017, 131, 132–143. [Google Scholar] [CrossRef]
- Li, V.C. From micromechanics to structural engineeringthe design of cementitious composites for civil engineering applications. J. Struct. Mech. Earthq. Eng. 1993, 10, 37–48. [Google Scholar]
- Wen, C.B.; Zhu, B.L.; Hou, Y.G.; Guo, Y.L. Shear-bearing capacity prediction of concrete-infilled double steel corrugated-plate shear walls. Structures 2024, 65, 106763. [Google Scholar] [CrossRef]
- Wang, B.; Chen, P.; Jiang, H.; Wang, J. Performance of steel-plate-reinforced concrete composite walls in tall structures. In Institution of Civil Engineers-Civil Engineering; ICE Virtual Library: Bristol, UK, 2024; Volume 177, pp. 18–125. ISSN 0965-089X. [Google Scholar] [CrossRef]
- Kufner, F.; Rucker-Gramm, P.; Horstmann, M.; Hämmelmann-Breul, E.; Breul, F.; Hahn, E.; Hettwer, S.; Pachow, U. Short-fiber-reinforced concrete meeting the demands of wrapping textile-reinforced concrete. J. Build. Eng. 2024, 98, 111189. [Google Scholar] [CrossRef]
- Azandariani, M.G.; Vajdian, M.; Javadi, M.; Parvari, A. Durability and Compressive Strength of Composite Polyolefin Fiber-Reinforced Recycled Aggregate Concrete: An Experimental Study. Compos. Part C Open Access 2024, 15, 100533. [Google Scholar] [CrossRef]
- Wang, S.; Xu, L.; Li, B.; Liu, S.; Chi, Y. Mechanical behavior and stress-strain model of steel-polypropylene hybrid fiber reinforced ultra-high performance concrete under triaxial compression. Constr. Build. Mater. 2024, 450, 138595. [Google Scholar] [CrossRef]
- Wang, C.Q.; Yuan, J.Y.; Zhang, Y.C.; Ma, Z.M. A comparative study of low cyclic loading effects on plastic strain, nonlinear damping, and strength softening in fiber-reinforced recycled aggregate concrete. J. Build. Eng. 2024, 97, 110774. [Google Scholar] [CrossRef]
- Tahenni, T.; Bouziadi, F.; Kirgiz, M.S.; Kouider-Djelloul, O.; Boulekbache, B.; Amziane, S. Experimental and numerical studyof the effectof stirrups and steel fibres on the shear capacity of reinforced concrete beams. Eng. Struct. 2024, 319, 118834. [Google Scholar] [CrossRef]
- Lei, Z.X.; Li, Q.Q.; Zhou, Y.H.; Yin, B.B. Mechanical performance and reinforcing mechanisms of foamed concrete strengthened by carbon fibers. J. Build. Eng. 2024, 97, 110765. [Google Scholar] [CrossRef]
- Li, V.C.; Wang, S.; Wu, C. Tensile strain-hardening behavior of polyvinyl alcohol engineered cementitious composite (PVA-ECC). Am. Concr. Inst. Mater. J. 2001, 98, 483–492. [Google Scholar]
- Kabele, P. New developments in analytical modeling of mechanical behavior of ECC. J. Adv. Concr. Technol. 2003, 1, 253–264. [Google Scholar] [CrossRef]
- Xu, S.L.; Li, H.D. Uniaxial tensile experiments of ultra-high toughness cementitious composite. China Civ. Eng. J. 2009, 42, 32–41. (In Chinese) [Google Scholar]
- Quang, K.M.; Dang, V.P.; Han, S.W.; Shin, M.; Lee, K. Behavior of high-performance fiber-reinforced cement composite columns subjected to horizontal biaxial and axial loads. Constr. Build. Mater. 2016, 106, 89–101. [Google Scholar] [CrossRef]
- Parra-Montesinos, G.J.; Canbolat, B.A.; Jeyaraman, G. Relaxation of confinement reinforcement requirements in structural walls through the use of fiber reinforced cement composites. In Proceedings of the 8th National Conference on Earthquake Engineering, San Francisco, CA, USA, 18–22 April 2006. [Google Scholar]
- Parra-Montesinos, G.J.; Chompreda, P. Deformation capacity and shear strength of fiber reinforced cement composite flexural members subjected to displacement reversals. J. Struct. Eng. 2007, 133, 421–431. [Google Scholar] [CrossRef]
- Zhou, Y.; Zhong, G.; Xiao, Y. Seismic performance testing of steel-polyvinyl alcohol hybrid fiber reinforced concrete shear walls. World Earthq. Eng. 2020, 37, 11–25. [Google Scholar]
- Qian, H.; Kang, L.; Guo, Y. Experimental study on the seismic performance of self-healing shear walls based on SMA and ECC composite materials. J. Civ. Eng. 2020, 53, 51–61. [Google Scholar]
- Jafari, A.; Beheshti, M.; Shahmansouri, A.A.; Bengar, H.A. Plastic hinge length for coupled and hybrid-coupled shear walls. Steel Compos. Struct. 2023, 48, 367–383. [Google Scholar]
- GB/T 228-2010; Metallic Materials-Tensile Testing. China Quality Standards Publishing Media Co., Ltd.: Beijing, China, 2010.
- Saenz, L.P. Discussion of Equation for the Stress-strain Curve of Concrete by Desayi and Krishnan. J. Proc. 1964, 61, 1229–1235. [Google Scholar]
- Nie, J.G. Comparison study of constitutive mondel of concrete in ABAQUS for static analysis of structures. Eng. Mech. 2013, 30, 59–67. (In Chinese) [Google Scholar]
- Comit E Euro-International Du B Eton. CEB-FIP Model Code 1990; Thomas Telford Services Ltd.: Lausanne, Switzerland; London, UK, 1993. [Google Scholar]
- Qasem, M.; Hasan, M.; Muhamad, R. Finite element simulation of precast moment resisting reinforced concrete beam-column joint subjected to monotonic load. In Materials Today Proceedings; Elsevier: Amsterdam, The Netherlands, 2023; ISSN 2214-7853. [Google Scholar] [CrossRef]
- Tetsushi, K.; Zhong, L.; Victor, C.L. Modeling of tensile stress-strain relation of pseudo strain-hardening cementitious compo-sites. J. Mater. Civ. Eng. 2000, 12, 147–156. [Google Scholar]
- Jiang, D.Q. Experimental Research on Press-Bending Behavior of High-Strength Concrete Steel Composite Walls; China Academy of Building Research: Beijing, China, 2011. (In Chinese) [Google Scholar]
- Su, R.K.L.; Lam, W.Y.; Pam, H.J. Behavior of embedded steel plate in composite coupling beams. J. Constr. Steel Res. 2008, 64, 1112–1128. [Google Scholar] [CrossRef]
- Dang, Z.; Liang, X.W.; Deng, M.K.; Wang, J.; Qin, M.; Yu, J. The Compression-Bending Behavior of Shear Wall with Fiber-Reinforced Concrete in Bottom Region. Eng. Mech. 2015, 32, 120–130. (In Chinese) [Google Scholar]
- Zhu, A.P. Seismic Behavior of Embedded Steel Plate Reinforced C80 Concrete Composite Shear Walls. Ph.D. Thesis, China Academy of Building Research, Beijing, China, 2015. (In Chinese). [Google Scholar]
- Li, X.; Zhang, J.; Zhu, Y.; Cao, W. Effects of strengthening methods in plastic hinge zone on seismic performance of high-strength concrete shear wall. J. Cent. South Univ. 2024, 55, 3480–3493. [Google Scholar]
- Zhang, L.; Wang, J. Nonlinear finite element analysis of steel plate-reinforced high-strength concrete shear walls. J. Struct. Eng. 2023, 149, 123–135. [Google Scholar]
- Xiao, X.; Huang, W.; Guo, Z.Y.; Lin, Y.S.; Chen, J.M. Numerical study on shear capacity of steel plate reinforced concrete shear wall. Build. Sci. 2019, 35, 84–91. (In Chinese) [Google Scholar]
- Lv, X.L.; Dong, Y.G.; Ding, Z.W. Study on seismic behavior of steel reinforced concrete wall. Earthq. Eng. Eng. Vib. 2006, 26, 101–107. [Google Scholar]
- Carlberg, J.; Toyib, B. Finite Element Modelling of Interlaminar Slip in Stress-Laminated Timber Decks, Friction Interaction Modelling Using Abaqus. Master’s Thesis, Chalmers University of Technology, Göteborg, Sweden, 2012. [Google Scholar]
- Cui, M.Z.; Liu, F.J.; Fan, J.S. Experimental study on shear behavior of concrete shear walls reinforced with welded reinforcement grids. J. Build. Struct. 2018, 39, 39–47. (In Chinese) [Google Scholar]
- Zhang, J.; Yang, X.; Cao, W.; Hu, J.M. Seismic performance of low-rise shear walls with inclined bars and single-row reinforcement. Eng. Mech. 2016, 33, 125–132. [Google Scholar]
- Park, R.; Priestley, M.N.; Gill, W.D. Ductility of square-confined concrete columns. J. Struct. Eng. 1982, 108, 929–950. [Google Scholar] [CrossRef]
- GB 50011-2010; Code for Seismic Design of Buildings. National Standard of the People’s Republic of China: Beijing, China, 2010. (In Chinese)
- Mirza, S.A. Parametric study of composite column strength variability. J. Constr. Steel Res. 1989, 14, 121–137. [Google Scholar] [CrossRef]
- Huang, Y.; Lulu, H.; Xiongwei, W. Plastic hinge length of reinforced concrete shear wall. Earthq. Eng. Eng. Vib. 2019, 39, 79–88. [Google Scholar]


| Specimen Number | μ | fc/MPa | Lp/mm | h × l × w/mm | tw/mm | ρ1/% | ρ2/% | ρ3/% | ρ4/% |
|---|---|---|---|---|---|---|---|---|---|
| FSW-2 | 0.22 | C50 | 400 | 2000 × 1000 ×100 | 6 | 0.33 | 3.96 | 1.03 | 1.08 |
| FSW-1 | 0.22 | C60 | 400 | 2000 × 1000 ×100 | 6 | 0.33 | 3.96 | 1.03 | 1.08 |
| FSW-3 | 0.22 | C70 | 400 | 2000 × 1000 × 100 | 6 | 0.33 | 3.96 | 1.03 | 1.08 |
| FSW-4 | 0.22 | C80 | 400 | 2000 × 1000 × 100 | 6 | 0.33 | 3.96 | 1.03 | 1.08 |
| FSW-S-1 | 0.22 | C60 | 400 | 2000 × 1000 × 100 | 6 | 0.60 | 3.96 | 1.03 | 1.08 |
| FSW-S-2 | 0.22 | C60 | 400 | 2000 × 1000 × 100 | 6 | 0.91 | 3.96 | 1.03 | 1.08 |
| FSW-S-3 | 0.22 | C60 | 400 | 2000 × 1000 × 100 | 6 | 1.21 | 3.96 | 1.03 | 1.08 |
| FSW-X-1 | 0.22 | C60 | 400 | 2000 × 1000 × 100 | 6 | 0.33 | 3.96 | 1.03 | 0.84 |
| FSW-X-2 | 0.22 | C60 | 400 | 2000 × 1000 × 100 | 6 | 0.33 | 3.96 | 1.03 | 1.47 |
| FSW-X-3 | 0.22 | C60 | 400 | 2000 × 1000 × 100 | 6 | 0.33 | 3.96 | 1.03 | 1.68 |
| FSW-G-1 | 0.22 | C60 | 400 | 2000 × 1000 × 100 | 4 | 0.33 | 2.64 | 1.03 | 1.08 |
| FSW-G-2 | 0.22 | C60 | 400 | 2000 × 1000 × 100 | 8 | 0.33 | 5.28 | 1.03 | 1.08 |
| FSW-G-3 | 0.22 | C60 | 400 | 2000 × 1000 × 100 | 9 | 0.33 | 5.94 | 1.03 | 1.08 |
| FSW-N-1 | 0.31 | C60 | 400 | 2000 × 1000 × 100 | 6 | 0.33 | 3.96 | 1.03 | 1.08 |
| FSW-N-2 | 0.4 | C60 | 400 | 2000 × 1000 × 100 | 6 | 0.33 | 3.96 | 1.03 | 1.08 |
| FSW-N-3 | 0.5 | C60 | 400 | 2000 × 1000 × 100 | 6 | 0.33 | 3.96 | 1.03 | 1.08 |
| Parametric Variable | Specimen Number | Calculated Value | Value of Simulation | Specific Value | |
|---|---|---|---|---|---|
| FRC strength/MPa | C60 | FSW-1 | 729 | 722 | 1.01 |
| C50 | FSW-2 | 605 | 631 | 0.96 | |
| C70 | FSW-3 | 865 | 842 | 1.03 | |
| C80 | FSW-4 | 976 | 951 | 1.03 | |
| Longitudinal reinforcement ratio/% | 0.60 | FSW-S-1 | 884 | 846 | 1.04 |
| 0.91 | FSW-S-2 | 892 | 889 | 1.00 | |
| 1.3 | FSW-S-3 | 921 | 941 | 0.98 | |
| Shape steel ratio/% | 0.84 | FSW-X-1 | 643 | 646 | 0.99 |
| 1.47 | FSW-X-2 | 773 | 739 | 1.05 | |
| 1.68 | FSW-X-3 | 816 | 782 | 1.04 | |
| Steel ratio of steel plate/% | 2.64 | FSW-G-1 | 659 | 682 | 0.97 |
| 5.28 | FSW-G-2 | 791 | 782 | 1.01 | |
| 5.94 | FSW-G-3 | 843 | 808 | 1.04 | |
| Axle pressure/kN | 2180 | FSW-N-1 | 811 | 822 | 9.89 |
| 2610 | FSW-N-2 | 932 | 921 | 1.01 | |
| 3050 | FSW-N-3 | 989 | 971 | 1.02 | |
Disclaimer/Publisher’s Note: The statements, opinions and data contained in all publications are solely those of the individual author(s) and contributor(s) and not of MDPI and/or the editor(s). MDPI and/or the editor(s) disclaim responsibility for any injury to people or property resulting from any ideas, methods, instructions or products referred to in the content. |
© 2025 by the authors. Licensee MDPI, Basel, Switzerland. This article is an open access article distributed under the terms and conditions of the Creative Commons Attribution (CC BY) license (https://creativecommons.org/licenses/by/4.0/).
Share and Cite
Li, J.; He, G.; Tian, J. Seismic Performance and Flexural Capacity Analysis of Embedded Steel Plate Composite Shear Wall Structure with Fiber-Reinforced Concrete in the Plastic Hinge Zone. Buildings 2025, 15, 291. https://doi.org/10.3390/buildings15020291
Li J, He G, Tian J. Seismic Performance and Flexural Capacity Analysis of Embedded Steel Plate Composite Shear Wall Structure with Fiber-Reinforced Concrete in the Plastic Hinge Zone. Buildings. 2025; 15(2):291. https://doi.org/10.3390/buildings15020291
Chicago/Turabian StyleLi, Junlong, Guoqiang He, and Jianbo Tian. 2025. "Seismic Performance and Flexural Capacity Analysis of Embedded Steel Plate Composite Shear Wall Structure with Fiber-Reinforced Concrete in the Plastic Hinge Zone" Buildings 15, no. 2: 291. https://doi.org/10.3390/buildings15020291
APA StyleLi, J., He, G., & Tian, J. (2025). Seismic Performance and Flexural Capacity Analysis of Embedded Steel Plate Composite Shear Wall Structure with Fiber-Reinforced Concrete in the Plastic Hinge Zone. Buildings, 15(2), 291. https://doi.org/10.3390/buildings15020291