Article

Dynamic Characteristics and Seismic Response of Multi-Story Wooden Tower Considering the Influence of a High Stylobate

1
School of Civil Engineering, Xi’an University of Architecture & Technology, Xi’an 710055, China
2
Key Lab of Structural Engineering and Earthquake Resistance, Ministry of Education (XAUAT), Xi’an 710055, China
3
College of Architecture, Xi’an University of Architecture & Technology, Xi’an 710055, China
4
Xauat Engineering Technology Co., Ltd., Xi’an 710055, China
*
Author to whom correspondence should be addressed.
Buildings 2025, 15(2), 269; https://doi.org/10.3390/buildings15020269
Submission received: 8 December 2024 / Revised: 7 January 2025 / Accepted: 14 January 2025 / Published: 18 January 2025
(This article belongs to the Special Issue Advances and Applications in Timber Structures)

Abstract

:
In situ dynamic tests were conducted on Caiyunjian Tower to investigate the influence of a high stylobate on its dynamic characteristics and seismic response through time–domain and frequency–domain methods. Finite element models were developed for Caiyunjian Tower (wooden structure and platform) and the overall structure including the high stylobate. Subsequently, models were subjected to El Centro, Taft, and Lanzhou waves at varying amplitudes. The seismic response results indicate that the overall structure model exhibits a low natural vibration frequency with closely spaced modal frequencies. As the peak seismic wave acceleration increases, both models exhibit increased acceleration, displacement, and shear responses. The Caiyunjian Tower model shows greater sensitivity to the El Centro wave, whereas the overall structure model is more responsive to the Taft wave. Under seismic waves with identical peak acceleration, the overall structure model exhibits greater dynamic responses than the Caiyunjian Tower model. The high stylobate minimally affects the lower-order frequencies of the upper structure but significantly influences the higher-order frequencies. Therefore, the high stylobate has an adverse influence on the seismic behavior of Caiyunjian Tower.

1. Introduction

As one of the most remarkable architectural structures in modern history, Caiyunjian Tower in Xingqing Palace Park showcases the extraordinary craftsmanship of ancient times and carries significant cultural heritage value [1]. The Xingqing Palace site is currently on the tentative list of UNESCO World Cultural Heritage sites along the Silk Road, with significant historical, scientific, and artistic values. Unlike architectural landscapes on low plains or mountainous ancient buildings on elevated peaks, Caiyunjian wooden tower, situated at the park’s highest point with a bluestone platform and high stylobate, complicates the seismic performance of its overall structure.
Caiyunjian Tower is a three-story hexagonal tower constructed with a Dou-gong bracket, featuring a double-eave roof adorned with green glazed tiles (
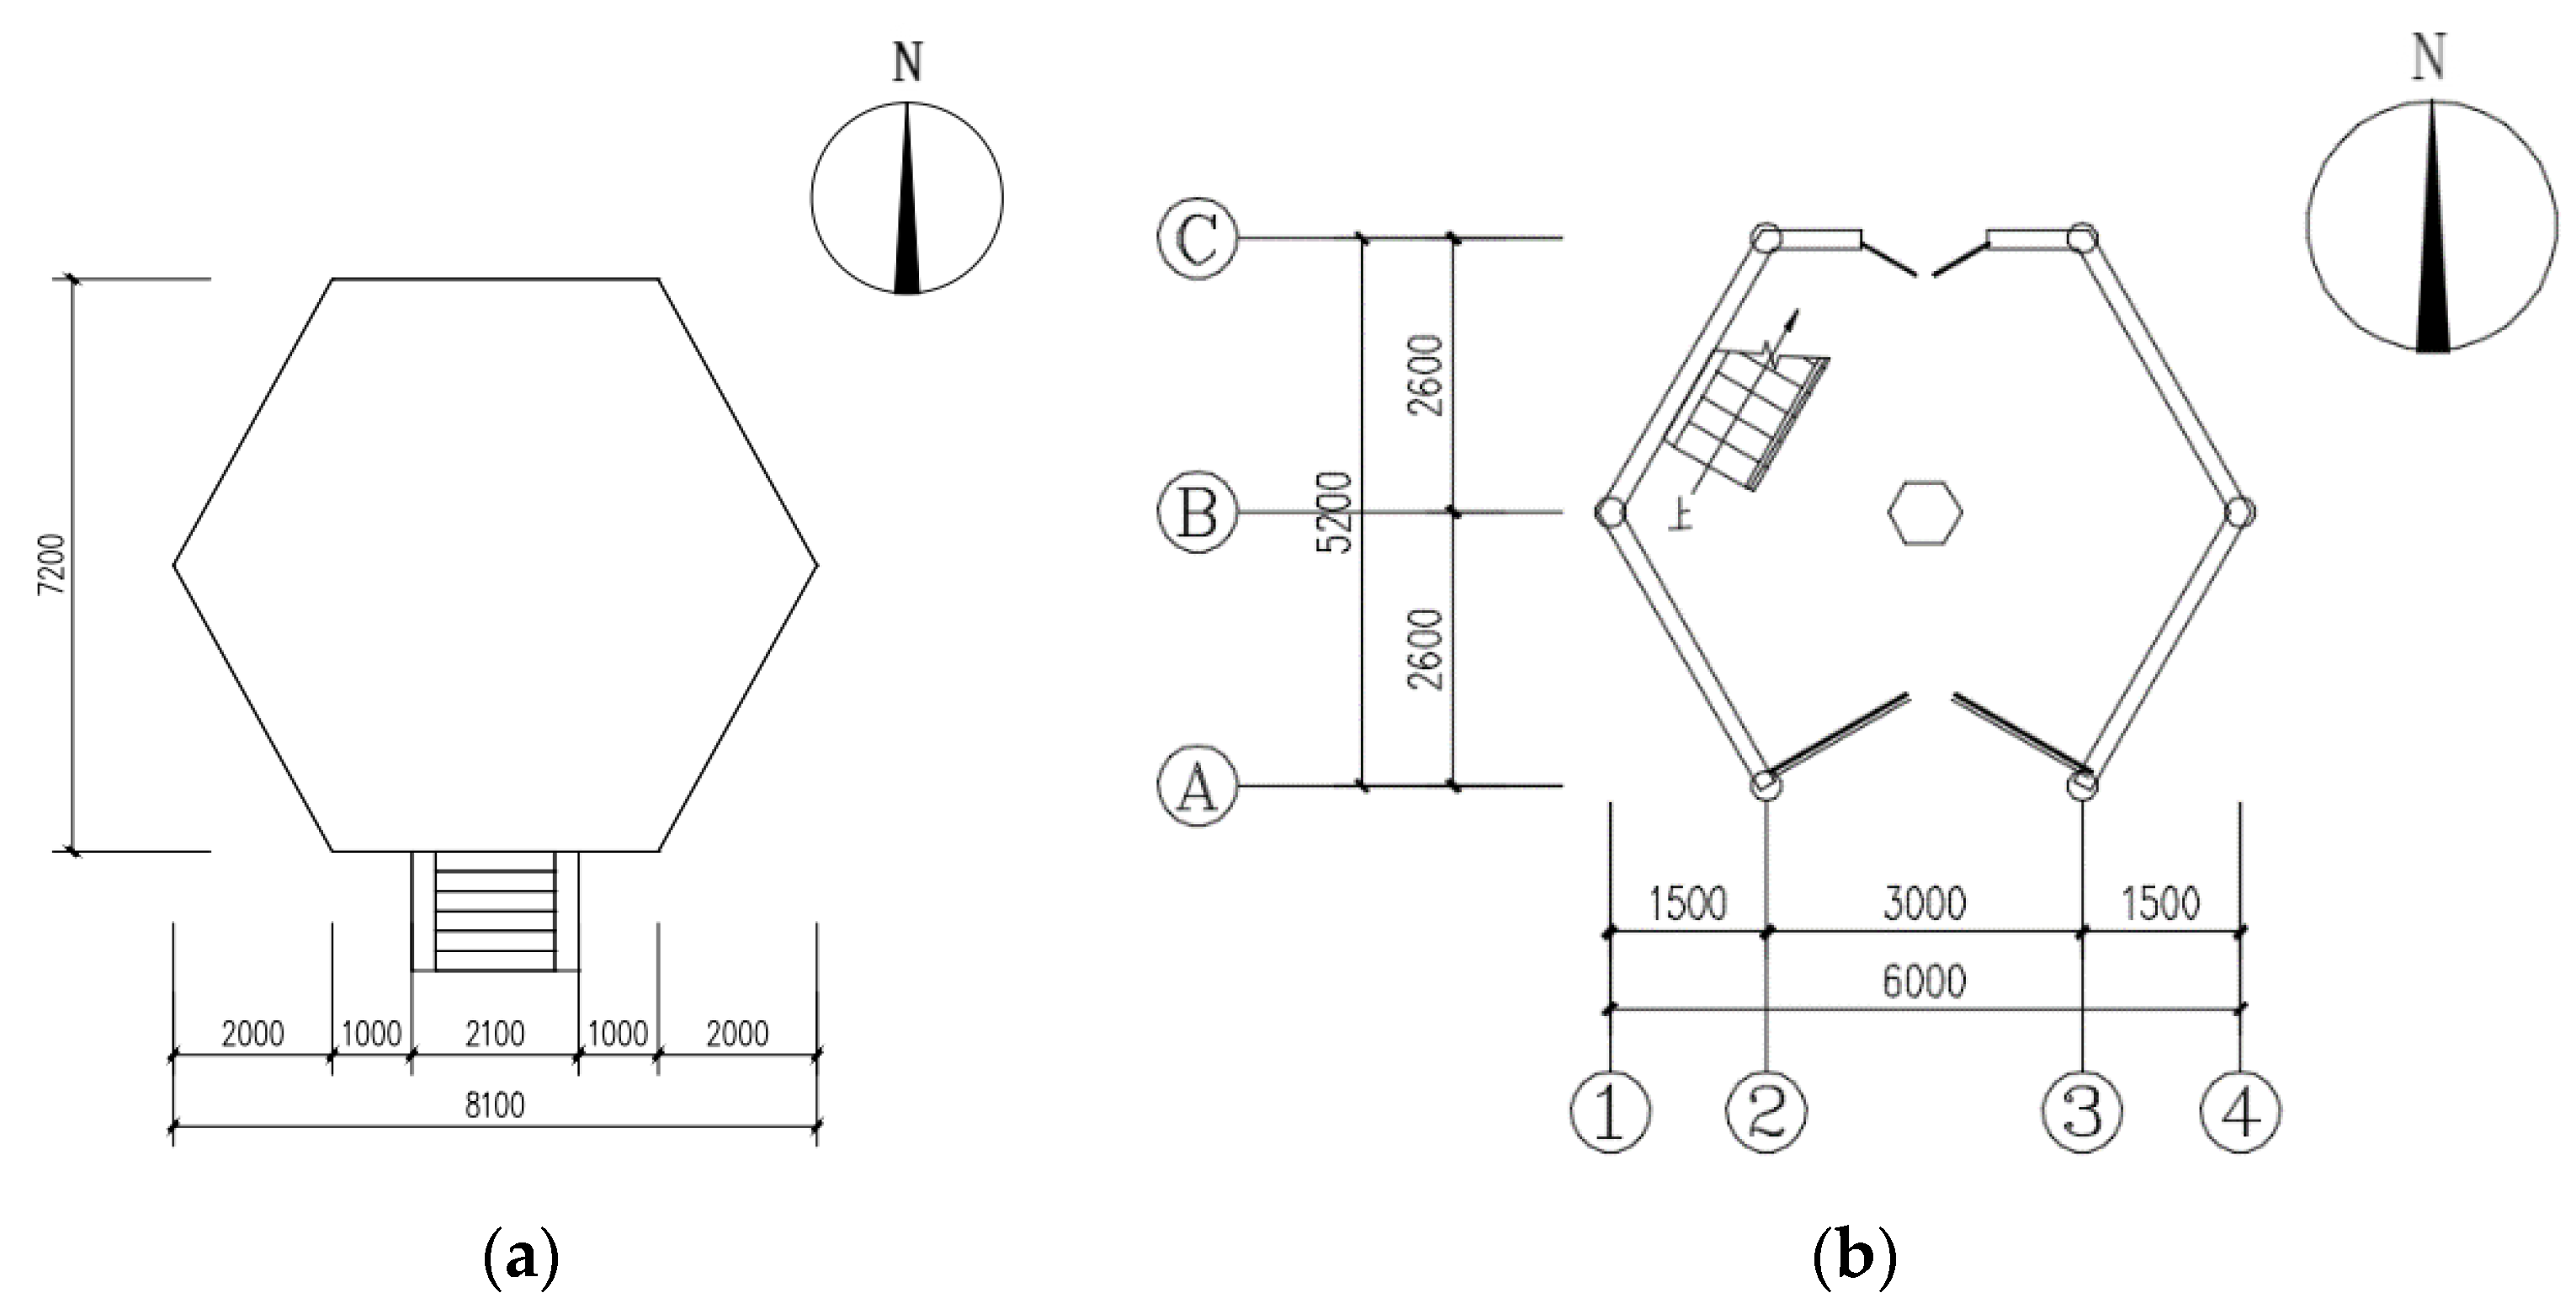
Figure 1). The high stylobate, composed of manually compacted fill soil and loess, is 10 m high with a slope ratio of approximately 1:2. Caiyunjian Tower stands at a height of 20.8 m, comprising a 1.5 m platform and a 19.3 m wooden structure. The hexagonal wooden structure consists of three visible floors and two flat-floored layers, with a decreasing projected area from bottom to top. The center of the wooden tower is a reinforced concrete core column with a variable cross-section through the top. Wood braces and steel plates are employed between the eave columns and core columns of the flat-floored layers. The dimensions of the first floor are 6 m in length and 5.2 m in width, with six columns measuring 0.32 m in diameter and 3.65 m in height, spaced 3 m apart. The second floor measures as 5.4 m in length and 4.65 m in width, with columns that are 0.3 m in diameter and 4.8 m in height. The third floor measures as 4.6 m in length and 3.75 m in width, with columns that are 0.28 m in diameter and 4.2 m in height. The platform is a hexagonal structure with a length of 8.1 m from east to west and a width of 7.2 m from south to north. It is covered with bluestones and boulder strips on the outside and filled with compacted clay and loess inside. Figure 2 shows the plan view of the platform and the first floor. The numbers and letters in Figure 2b are column grid axis numbers for east-west and north-south directions, respectively. Key components such as hypostyle columns, eave columns, braces, and diagonal beams are detailed in Table 1, including their cross-sectional dimensions.
Some scholars have carried out a lot of research to study the soil–structure interaction. Zhang and Far [2] performed simulation analysis of rigid base and flexible base frame-core tube structures. The results showed that the soil–structure interaction has a remarkable impact on the seismic behavior of high-rise frame-core tube structures as it can increase the lateral deflections and inter-story drifts and decrease the story shear forces of structures. Through a numerical analysis considering the interaction between soil and structure carried out for low- to medium-rise buildings, Bolisetti and Whittaker [3] pointed out that the presence of the deep basement reduces uplift in the footings and results in smaller peak spectral accelerations at the roof. Heiland et al. [4] studied the soil–structure interaction on the dynamic characteristics of railroad frame bridges. The results showed that the natural frequencies react robustly to the soil–structure interaction and are thus mainly influenced by the structural stiffness of the frame. The above studies indicated that the interaction between soil and structure makes the foundation affect the dynamic characteristics and seismic response of the superstructure [5,6]. However, the above studies mainly focused on the interaction between soil and structure in modern structures, with less research on historical buildings.
To investigate the influence of the substructure on the upper wooden structures of historic buildings, Zhao et al. [7,8] developed a finite element model of the Drum Tower in Xi’an. A modal analysis indicated that the impact of the stylobate on the dynamic characteristics of the upper wooden structure is significant and should be considered. Xue et al. [9] conducted a numerical analysis on the seismic response of the Yingxian Wooden Pagoda, and the results showed that the high stylobate amplifies the acceleration and displacement of the wooden structure. A 3D finite element model of wood structure–abutment–foundation of Xi’an Bell Tower was established by Meng et al. [10]. The results indicated that the relative displacement of the second floor of the timber structure is increased by 2.12 times and the displacement of tower base relative to the ground is increased by 44%. Their findings revealed that when the natural frequencies of the upper wooden structure align closely with those of the high stylobate, the latter significantly affects the dynamic characteristics of the former. As a famous palace-style timber building with a high stylobate, Guangyue Tower was studied by Sun et al. [11] and Meng et al. [12]. The results indicated that when the soil–structure interaction is considered, the natural frequency of the structure is reduced, and its influence on the high-order natural frequency of the structure is greater than the influence on the low-order natural frequency. Pan et al. [13,14,15] carried out a detailed analysis of the ancient wooden buildings on a slope from the aspects of failure mode, dynamic characteristics, and seismic mechanism. The research shows that the high-slope structure reduces the seismic performance of the upper wooden structures. The above research revealed the impact of the high stylobate on the superstructure should not be overlooked for historical structures [16,17,18]. However, in the existing research, the superstructure is mostly palace-style buildings, and there are few tower buildings.
Based on the study of palace-style historical buildings, tower-type historical buildings have been widely studied. Gao et al. [19] carried out an in situ dynamic test on the Jiufeng Temple ancient masonry pagoda and obtained its modal characteristics. On this basis, the finite element model of the pagoda was established to study the failure mechanism. The results showed that the top of the pagoda was the weak position. Yuan et al. [20] analyzed the dynamic characteristics and seismic response of Luoshan Temple Tower. The results show that the displacement angle of the bottom floor of the tower is large under earthquakes of various intensities, and the whipping effect at the top of the tower is obvious. The damage of the masonry at the bottom of the pagoda body and the openings of each layer of arch coupons is relatively serious. Xu et al. [21] studied the influence of inclination on the seismic performance of brick masonry toter. The results revealed that the resonant frequency of the inscribed tower model was 41% lower than the original model. Inclination enhances the acceleration and displacement responses. Abruzzese et al. [22] established a numerical model of masonry ancient pagoda while considering architectural characteristics and damage conditions, which provided a basis for the risk assessment of ancient pagodas. Zhang et al. [23] studied the influence of topographic effect on the seismic response of ancient pagodas. The results show that the hilly terrain can amplify the relative displacement, acceleration, and inter-story displacement angle of masonry pagodas. Therefore, the influence of high slope soil should be considered when studying the seismic performance of ancient pagodas. However, the research on the seismic performance of the tower structures mentioned above mainly focuses on the tower itself, and there is relatively little research on the influence of a high stylobate and high slope soil on the upper tower.
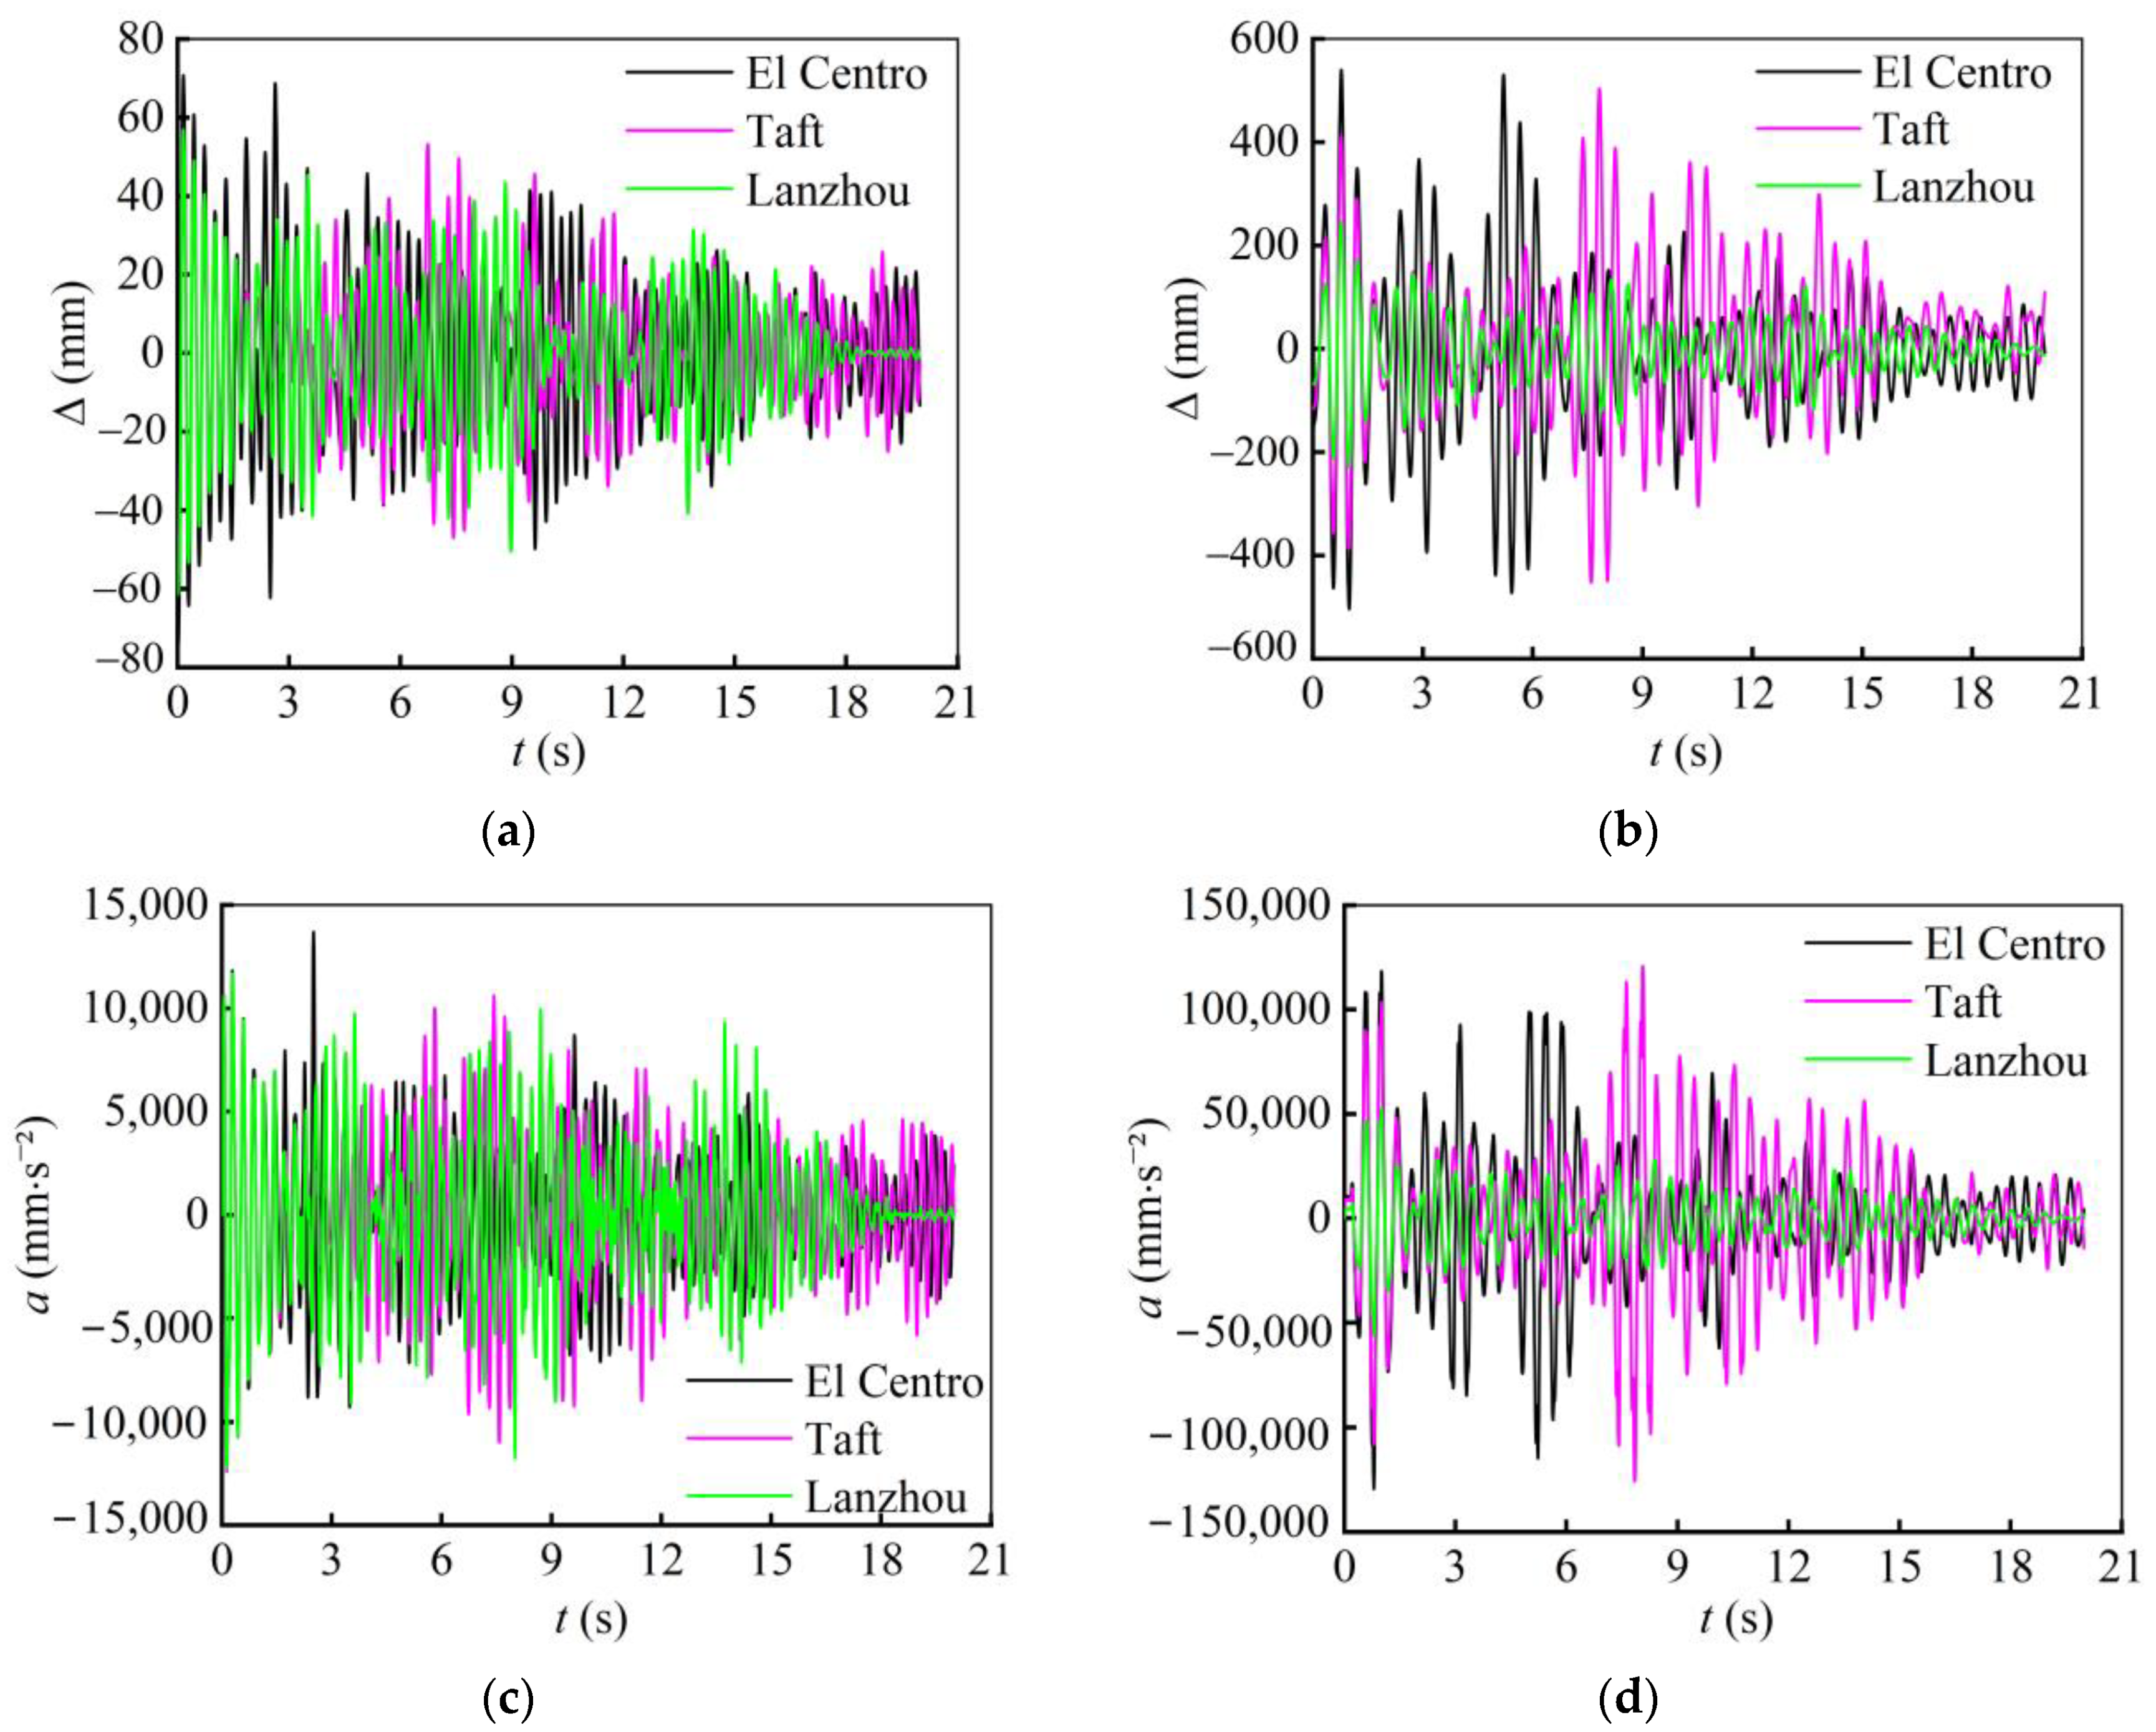
To predict the seismic response and evaluate the seismic performance of high-stylobate structures, this study uses Caiyunjian Tower, a multi-story wooden structure, as a case study. El Centro, Taft, and Lanzhou waves were selected for dynamic analyses, for which the reason are listed below: El Centro wave and Wenchuan waves include east–west, north–south, and vertical directions, and these waves are often used to calculate the dynamic response of the structure, which is located in the III-type site classification. The Lanzhou wave is an artificial wave with a duration of 20.00 s, which is statistically significant and often used for seismic performance analysis.
Through in situ dynamic testing and finite element simulation [24,25], the influence of a high stylobate on the dynamic characteristics and seismic response of wooden tower structures is discussed. Figure 3 shows a flowchart of dynamic characteristics and seismic response analysis.

2. In Situ Dynamic Test

2.1. Experimental Scheme and Measurement Point Arrangement

The 941B seismometer and the INV3062S/V network distributed data acquisition instrument were employed for measuring vibration signals and collecting data during in situ dynamic characteristic tests [26]. The seismometer has excellent ultra-low frequency performance and is a versatile ultra-low- or low-frequency vibration measurement device widely used for pulsation measurements in buildings. The seismometers were calibrated in advance to ensure the accuracy of the measurements. The seismometer is depicted in Figure 4. Different excitation conditions were applied for dynamic testing, encompassing environmental excitation, artificial bouncing, and hammer impacts. Xingqing Palace Park was closed to the public during the tests to maintain an undisturbed environment.
Measurement points were selected at both the top and base of columns on each floor [27]; the outdoor ground served as a stationary reference point. The tests were conducted in multiple phases due to limited seismometers and the large number of measurement points. Each floor was divided into three orders, resulting in a total of nine orders. Each order included 5 measurement points and 3 stationary reference points, leading to 16 testing channels and 16 seismometers, totaling 48 measurement points.
The hypostyle column of Caiyunjian Tower extends vertically within the tower, anchored at each floor level on the platform, illustrated in Figure 5. Multiple measurement points are established using two sensors arranged horizontally and orthogonally. Vibration signals in the east–west and north–south directions were simultaneously recorded during transient excitation. And the measurement points are positioned as indicated in Figure 5.

2.2. Test Results

The structure underwent transient excitations under five different conditions. Data from the in situ dynamic characteristic tests were analyzed using an FFT (fast Fourier transform) spectral analysis with DASP V-11. This analysis yielded a peak power spectral density–frequency curve showing the natural frequencies of the structure. The first-order frequency was 3.821 Hz, and the second-order frequency was 4.106 Hz, as depicted in Figure 6. Here, Sa stands for the power spectral density, and f stands for the frequency. A3, C2, B1, B4, A2, and C3 represent the column numbers, which are composed of letters and numbers in the two directions, as shown in Figure 2. A modal analysis of Caiyunjian Tower was conducted using the random subspace identification (SSI) method [28]. After removing unstable modes, modal shapes for the first and second modes were determined, illustrated in Figure 7 and Figure 8. Here, X, Y, and Z stand for the south–north direction, east–west direction, and vertical direction, respectively.
Acceleration responses were integrated to derive displacement responses. The peak-picking method was then used to analyze the amplitude spectrum curve. Displacement amplitudes in the respective directions were extracted at each measurement point corresponding to the resonant frequencies. Subsequently, average displacement amplitudes at the same height were calculated and compared with the maximum displacement response amplitude of the structure to determine the mode shape coefficient of Caiyunjian Tower. Torsional modes were observed in the mode shapes, with north and east being designated as positive directions, leading to spatial ambiguity, as indicated in Figure 9. This finding suggests possible issues with the experimental test point placement or distinguishing linearly related test modes [27].

3. Establishment of the Finite Element Model

3.1. Dimensions of Main Components

The finite element model of the wooden structure and platform was established based on the dimensions and construction details derived from the structural construction drawings.

3.2. Material Parameters

Material tests were performed on wooden columns sampled from Caiyunjian Tower to determine the material parameters. Pine wood [29] is used in the wooden structure, and its material parameters are detailed in Table 2. The Poisson’s ratio is approximately 0.43, and the wood density is 493 kg/m3. According to the “Standard for Evaluation of Concrete Compressive Strength” (GB/T 50107-2010) [30], the 300-grade concrete of the core column corresponds to Grade C 28. Material parameters for the core column are provided in Table 3.
The hexagonal platform is filled with rammed soil internally and surrounded by a 400 mm thick bluestone exterior, which greatly enhances its rigidity. The material parameters of bluestone are provided in Table 4 [31].
Caiyunjian Tower stands on a 10 m high stylobate. The lower layers consist primarily of fill soil and Tertiary Pleistocene aeolian loess (Q3eol), characterized by soft-plastic to flow-plastic behavior and localized saturation. The material parameters are detailed in Table 5.
The geometric parameters in the finite element model were established based on real measurement data. As for the material parameters, firstly, the load–displacement curves of different materials were obtained through material tests, and the obvious fluctuation and abnormal data were deleted. Then, the simplified load–displacement curves were obtained through statistical analysis and data fitting, and finally, the stress–strain curves of materials were obtained so as to calibrate the material parameters.

3.3. Element Selection and Model Establishment

The models of Caiyunjian Tower (wooden structure and platform, model 1) and the overall structure (Caiyunjian Tower and high stylobate, model 2) were established by ANSYS finite element software (R18.2). The wooden structure’s beams, columns, and braces were simulated with the BEAM188 element. The meshing dimensions of beams, columns, and braces are determined as 500 mm. Column bases are assumed to be hinged, neglecting base slip. The Dou-gong and are simulated by the COMBIN39 spring element. Spring stiffness values are mortise-tenon joints determined from both research team experiments [32] and actual tower construction, detailed in Table 6 and Table 7, respectively.
The roof was simulated using the MASS21 element to represent the mass. Based on the principles of area equivalence, the roof load was calculated and applied to the top of each column as concentrated masses uniformly, which is listed in Table 8.
The platform and the compacted soil of the high stylobate were simulated with the SOLID45 element, assuming material homogeneity throughout. The soil is simplified as an independent frustum, employing the Drucker–Prager yield criterion to establish the DP soil model. The upper part of the frustum is unrestricted on all four sides, while the soil bottom is fixed. A multi-point constrained contact algorithm is used between the platform and the frustum, defining MPC contact with face-to-face interaction [33]. CONTA173 and TARGE170 elements were chosen to designate the platform’s bottom surface as the contact area and the frustum’s upper surface as the target. The meshing dimensions of the platform are determined as 300 mm.
Both models are shown in Figure 10, where the X-axis represents the north–south direction, the Y-axis represents the east–west direction, and the Z-axis represents the vertical direction.

4. Dynamic Characteristics Analysis

The natural frequencies and corresponding vibration mode of model 1 were obtained by modal analysis using the block Lanczos algorithm, and the method has been widely used and calibrated in the references [34,35].
A comparison of simulated and in situ measured values in Table 9 shows a relative error of under 10%, confirming the validity of model 1. Model 2 is derived from model 1.
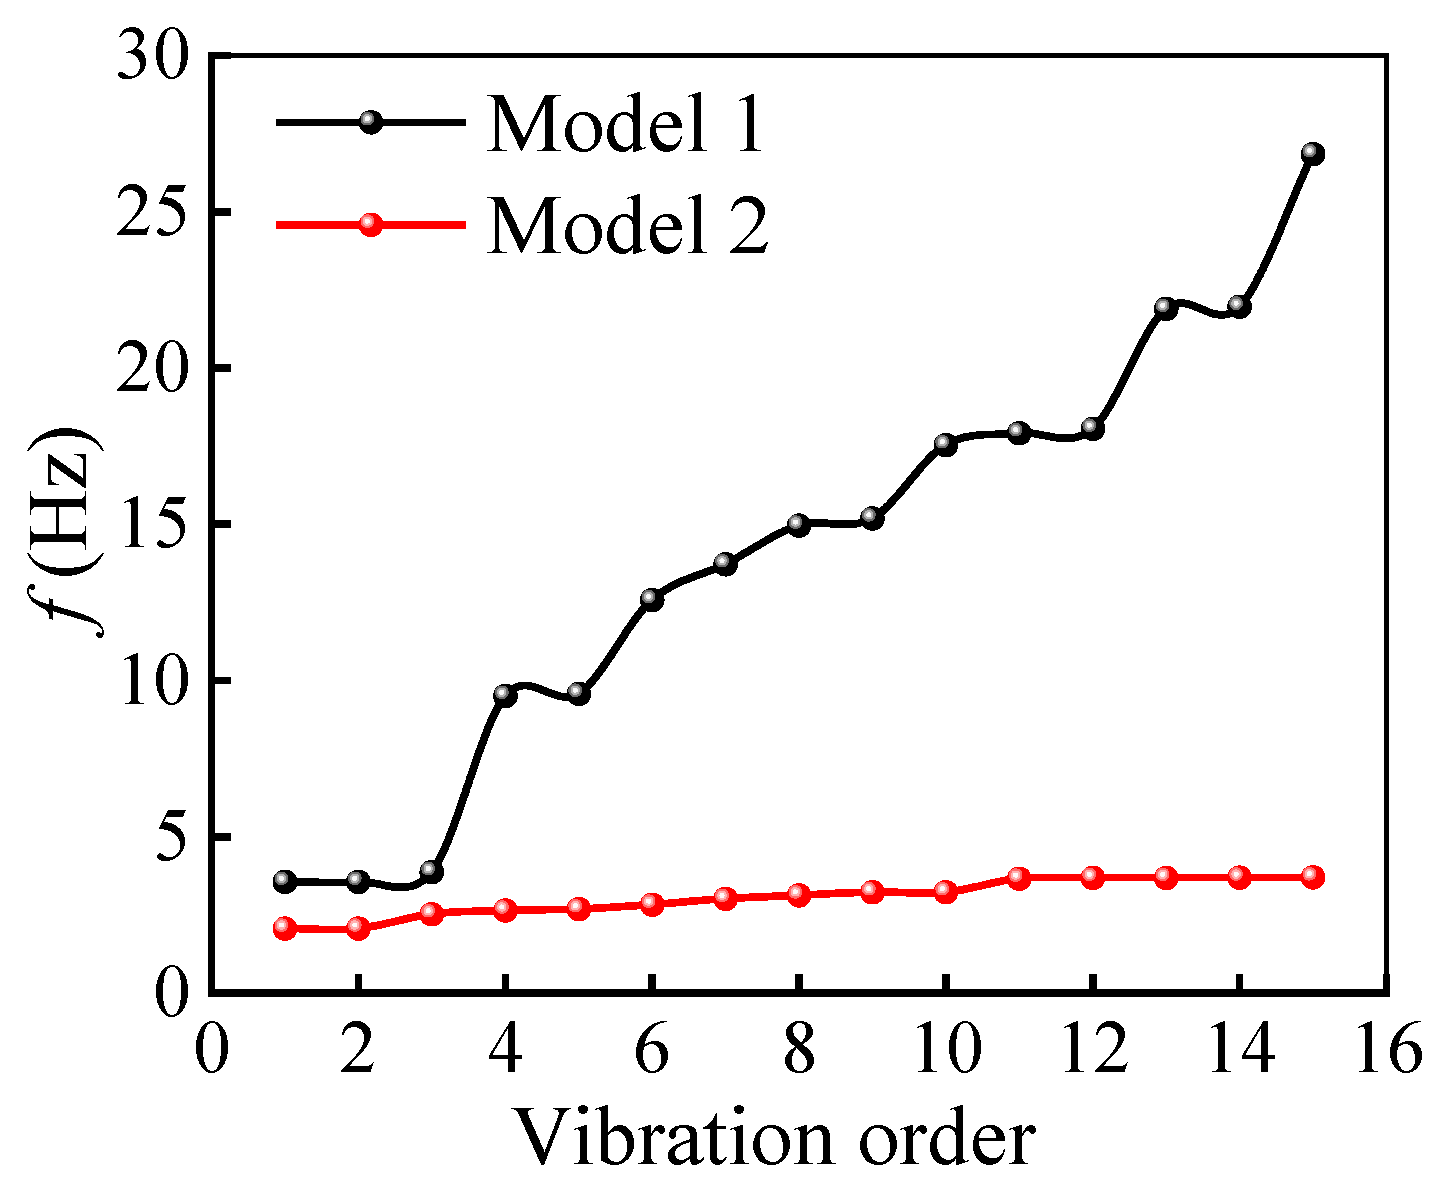
As shown in Figure 11, the first three order frequencies in model 1 are similar, but the fourth order and higher frequencies show significant variation, suggesting instability attributed to platform influence. Both models exhibit similar first three order frequencies, with model 2 accounting for the high stylobate’s impact. Model 2 displays minimal frequency variation as the order rises, with little effect from the high stylobate on low-order frequencies but significant influence on high-order frequencies. The soil–structure interaction leads to a decrease in the structure’s natural frequencies. The fundamental natural frequencies of model 1 and model 2 are, respectively, 3.7669 Hz and 2.0633 Hz, which means that the involvement of flexible soil reduces the fundamental frequency of the overall structure.
The first three mode shapes of model 1 and model 2 are nearly identical; the first and second modes show translational movements along the east–west and north–south directions, while the third mode exhibits torsional motion, as illustrated in Figure 12 and Figure 13. In model 2, the amplitude of soil vibration increases notably for the fourth and fifth modes, particularly for higher modes, owing to the low stiffness of the high stylobate.
Modal participation factors for vibration modes are presented in Table 10 and Table 11 for model 1 and model 2, respectively, illustrating each mode’s contribution to the structural seismic response.
The first two modes of model 1 significantly contribute to the seismic response, whereas the platform minimally affects the fourth mode along the east–west (Y-axis) and the fifth mode along the north–south (X-axis). Considering the high stylobate’s influence, modes 1 and 2 make the largest contributions to the seismic response. Furthermore, the influence of the ninth soil mode amplifies, thereby making the contributions of the first 10 modes substantial. Considering the high stylobate’s influence alters the response direction of the first mode, underscoring the significance of a high stylobate in the study of the dynamic properties of ancient wooden structures.

5. Seismic Response Analysis

5.1. Selection of Earthquake Waves

Caiyunjian Tower is situated in Xi’an City, Shaanxi Province. It falls under seismic design category class B, with a design seismic intensity of eight and a design basic earthquake acceleration of 0.2 g. The site is classified as category III, with a design earthquake grouping of group 1. The site has a characteristic period of 0.45 s, categorizing it as a class B building. According to the “Code for Seismic Design of Buildings” (GB 50011-2011) [36], the selection of actual strong motion records and artificially simulated acceleration time history curves should be based on the building’s site category and design seismic grouping when employing the time history analysis method. At least two-thirds of the total number of actual strong motion records should be selected. Therefore, seismic excitations such as the EI Centro wave, Taft wave, and Lanzhou wave were chosen [37].
The initial 20 s of earthquake waves were selected as seismic excitations, simultaneously applied in both the X- and Y-directions. The peak accelerations of earthquake waves were adjusted to 70 cm/s2 for frequent earthquakes, 200 cm/s2 for design scenarios, and 400 cm/s2 for rare events. Calculations show that model 1 had weaker horizontal stiffness in the Y-direction; thus, earthquake wave accelerations were set at a ratio of 0.85:1 between the X- and Y-directions. Model 2 exhibited weaker horizontal stiffness in the X-direction; therefore, earthquake wave accelerations were set at a ratio of 1:0.85 between the X- and Y-directions. The output data of the two models take the larger value in two directions, respectively. Model 1 and model 2 produce response results in the Y-direction and X-direction, respectively. According to prior research, the damping ratio of the structure is 0.03 [26].

5.2. Results and Analysis

Figure 14 displays the time history curves of the displacement and acceleration response of the reference point located at the top of the hypostyle column on the third floor subjected to three types of seismic waves with a modulation amplitude of 400 cm/s2. Table 12 shows the maximum inter-story displacement response Δ, maximum acceleration response a, and maximum inter-story displacement angle θ under three seismic wave excitations with peak accelerations of 70 cm/s2, 200 cm/s2, and 400 cm/s2.
As can be seen from Figure 14, under the action of different seismic waves, the peak times of displacement and acceleration responses of model 1 and model 2 are different. Both the displacement and acceleration of the models increase with the increase in peak acceleration of the seismic waves from Table 12. Moreover, the displacement and acceleration responses of model 2 are greater than those of model 1, the amplification factors under El Centro wave excitation range from 5.53 to 7.64, the amplification factors under Taft wave excitation range from 9.18 to 10.65, and the amplification factors under Lanzhou wave excitation range from 4.07 to 5.46. Under the same peak acceleration, model 1 exhibits a larger response to El Centro wave excitation, while model 2 exhibits a larger response to Taft wave excitation. Under the wave of a peak acceleration of 400 cm/s2, the displacement response and acceleration response absolute values of the model 2 are ordered as Taft wave > El Centro wave ≈ Lanzhou wave.
As indicated in Table 12, the maximum displacement angle is 1/25, which exceeds the 1/30 limit specified in “Standards for Maintenance and Strengthening of Ancient Building Wood Structures” (GB/T 50165-2020) [38]. Previous research pointed out that inter-story displacement angles above 1/20 significantly increase the risk of structural collapse [39]. Therefore, adopting 1/20 as the limit for inter-story displacement angle aligns with practical conditions [40]. The presence of soil significantly amplifies displacement and acceleration responses, as well as inter-story displacement angles, particularly compacted soil, exacerbating the seismic vulnerability of Caiyunjian Tower and potentially leading to structural overturning.
As shown in Table 12, the maximum displacement response and maximum acceleration response of the overall structure show a significant increase when the peak acceleration of the El Centro wave increases from 200 cm/s2 to 400 cm/s2. The increase factor is not approximately proportional to the increase in peak acceleration. It can be reasonably speculated that when the input excitation is an El Centro wave with a peak acceleration of 400 cm/s2, Caiyunjian Tower may have been damaged.
By summing up the shear time history responses of each column top of the models, the maximum floor shear forces under various seismic conditions are obtained. Table 13 and Table 14 show the maximum shear force of the two models. Figure 15 shows the shear force distribution from the base of the first floor to the top of the third floor for the models under partial working conditions. The trend of the maximum floor shear force along the structural height is basically consistent for both models under different seismic conditions. The addition of the cross-bridging on the second floor results in a small increase in the shear force at the column foot of the second floor compared with the column top of the first floor in all conditions. Due to the gradual inward displacement design of the upper column foot and the lower column top, the shear force on the node of the upper floor greatly reduces compared with the lower floor in the overall structure model. In response to EI, Taft, and Lanzhou wave excitations, the amplification factors of shear force for Caiyunjian Tower range from 2.96 to 3.38, 5.10 to 5.43, and 2.36 to 2.51, respectively, due to the high stylobate.
Under the Taft wave excitation with a peak acceleration of 400 cm/s2, the maximum shear force of model 2 increases substantially, with the increase in each layer relative to the bottom floor being 9.55%, 7.72%, 13.81%, 22.78%, 38.58%, and 26.89% from bottom to top, respectively. Soil makes the floor shear increase multiplier of the superstructure between 6.66 and 8.59, so if the seismic response of the superstructure is analyzed without considering the effect of the base soil, the calculation results will be biased and insecure.

6. Conclusions

In situ dynamic characteristic tests were conducted on Caiyunjian Tower of Xingqing Palace, and finite element models for both Caiyunjian Tower and the overall structure were established. Three different seismic waves with different peak values were used to analyze the seismic responses for both models. The following conclusions were obtained:
(1)
The first-order frequency of Caiyunjian Tower is 3.821 Hz, and the vibration mode is translation in the east–west direction. The second-order frequency is 4.106 Hz, and the vibration mode is translation in the north–south direction. The frequency in the east–west direction is less than that in the north–south direction, so the east–west direction is the weak stiffness direction of Caiyunjian Tower.
(2)
The natural frequency of the high stylobate is low, and the frequencies of each order are similar. There is little difference between the front three frequencies of Caiyunjian Tower and the overall structure, but the fourth and higher frequencies of the overall structure are significantly smaller than Caiyunjian Tower. Therefore, the high stylobate reduces the natural frequency of the upper structure and soil–structure interaction has a significant impact on higher mode frequencies.
(3)
The displacement and acceleration of Caiyunjian Tower and the overall structure increase with the increase in the peak acceleration of seismic waves, but the high stylobate increases the seismic response of the overall structure. The maximum inter-story drift angle of Caiyunjian Tower and the overall structure is 1/101 and 1/25, respectively, which is within the allowable limit for structural collapse.
(4)
The maximum shear force of Caiyunjian Tower and the overall structure increase as the peak acceleration of seismic waves increases. The variation trend of the maximum shear force on each floor in both models is the same under different conditions. The high stylobate increases the maximum shear force of the overall structure.
(5)
Due to the influence of the high stylobate, model 2 has different amplification factors for the displacement response, acceleration response, and maximum shear force on each floor under different seismic wave excitations. Caiyunjian Tower is more sensitive to excitation from the El Centro wave, while the overall structure is more sensitive to excitation from the Taft wave. The high stylobate amplifies the oscillation of the structure, which harms the seismic resistance of the structure.
(6)
Terrain effect, material properties, modeling details, and other parameters will affect the performance of wooden towers with high stylobates. Limitations such as imperfect modeling details and failure to consider multi-layer soil distribution need to be considered in future research.

Author Contributions

Writing—original draft preparation, H.X.; conceptualization, methodology, resources, project administration, and funding acquisition, J.X.; investigation and validation, D.S.; software and formal analysis, M.L.; data curation, B.X.; supervision and writing—reviewing and editing, C.W.; visualization, Y.S. All authors have read and agreed to the published version of the manuscript.

Funding

This research was funded by the National Natural Science Foundation of China (Grant No. 52308328, 52278317, 51908454), the China Postdoctoral Science Foundation (No 2023M732748), and the Preventive Conservation and Inheritance of Ancient Architecture “Scientist + Engineer” Teams (No. 2024QCY-KXJ-169).

Data Availability Statement

The data presented in this study are available on request from the corresponding author.

Conflicts of Interest

Author Yan Sui was employed by the company Xauat Engineering Technology Co., Ltd. The remaining authors declare that the research was conducted in the absence of any commercial or financial relationships that could be construed as a potential conflict of interest.

References

  1. Jian, W.N.; Yue, B.R.; Song, G.M. The evolving role of Xingqing Palace in urban space. Landsc. Archit. 2012, 2, 33–37. [Google Scholar] [CrossRef]
  2. Zhang, X.F.; Far, H. Effects of dynamic soil-structure interaction on seismic behaviour of high-rise buildings. Bull. Earthq. Eng. 2022, 20, 3443–3467. [Google Scholar] [CrossRef]
  3. Boliseetti, C.; Whittaker, A.S. Numerical investigations of structure-soil-structure interaction in buildings. Eng. Struct. 2020, 215, 110709. [Google Scholar] [CrossRef]
  4. Heiland, T.; Aji, H.D.B.; Wuttke, F.; Stempniewski, L.; Stark, A. Influence of soil-structure interaction on the dynamic charactitics of railroad frame bridges. Soil. Dyn. Earthq. Eng. 2023, 167, 107800. [Google Scholar] [CrossRef]
  5. Bapir, B.; Abrahamczyk, L.; Wichtmann, T.; Prada-Sarmiento, L.F. Soil-structure interaction: A state-of-the-art review of moeling techniques and studies on seismic response of building structures. Front. Built. Environ. 2023, 9, 1120351. [Google Scholar] [CrossRef]
  6. Anand, V.; Satish Kumar, S.R. Seismic Soil-structure Interaction: A State-of-the-Art Review. Structures 2018, 16, 317–326. [Google Scholar] [CrossRef]
  7. Ma, H.; Xue, J.Y.; Zhao, H.T. Analysis of response of ancient timber buildings on the high pedestal under random earthquake excitations. Ind. Archit. 2014, 44, 45–49+54. [Google Scholar] [CrossRef]
  8. Zhao, H.T.; Ma, H.; Xue, J.Y.; Zhang, F.L.; Zhang, X.C. Analysis of dynamic characteristics and seismic responses of the ancient timber building on high-platform base. J. Earthq. Eng. Eng. Vib. 2011, 31, 115–121. [Google Scholar] [CrossRef]
  9. Xue, J.Y.; Wu, C.W.; Zhai, L.; Wang, R.P.; Ma, L.L. Finite element analysis on seismic response of Yingxian Wooden Tower by considering the effect of the stylobate. J. Civ. Environ. Eng. 2022, 44, 22–29. [Google Scholar] [CrossRef]
  10. Meng, Z.B.; Wu, M.Z.; Hu, W.B.; Zhang, K.; Yuan, J. Seismic response analysis of Xi’an Bell Tower considering soil-structure interaction. World Earthq. Eng. 2008, 24, 125–129. [Google Scholar]
  11. Sun, S.J.; Meng, Z.B.; Zhao, Q.S.; Zhao, T.F.; Jin, J. Dynamic performance analysis of ancient buildings based on soil-structure interaction. In Proceedings of the 7th International Conference on Environmental Science and Civil Engineering, Nanchang, China, 9–10 January 2021; Volume 719, p. 022010. [Google Scholar]
  12. Meng, Z.B.; Hu, B.S.; Zhao, Q.S.; Jin, J.; Song, D.K. Dynamic response analysis of Liaocheng Guangyue Tower under the ground traffic load. In Proceedings of the 4th International Conference on Sensors, Measurement and Intelligent Materials, Shenzhen, China, 27–28 December 2015; Atlantis Press: Amsterdam, The Netherlands, 2016; pp. 1142–1146. [Google Scholar]
  13. Pan, Y.; Chen, J.; An, R.B.; Yi, D.Y. A review on seismic performance of ancient timber structures on a slope. J. Civ. Environ. Eng. 2022, 42, 10–21. [Google Scholar]
  14. Pan, Y.; Li, D.H.; Okuta, A.; Chen, J. Seismic performance of a historic timber structure on a slope. J. Build. Eng. 2023, 71, 106434. [Google Scholar] [CrossRef]
  15. An, R.B.; Yuan, J.C.; Pan, Y.; Li, D.H. Experimental study on the seismic performance of a full-scale two-story traditional timber frame on sloped land. Eng. Struct. 2024, 300, 117139. [Google Scholar] [CrossRef]
  16. Silva, F.D. Influence of soil-structure interaction on the site-specific seismic demand to masonry towers. Soil. Dyn. Earthq. Eng. 2020, 131, 106023. [Google Scholar] [CrossRef]
  17. Liao, R.M. Dynamic Performance Analysis of Historic Architecture Based on Soil-Structure Interaction. Master’s Thesis, Liaocheng University, Liaocheng, China, 2019. [Google Scholar]
  18. Wang, Y. Seismic Analysis of the Soil-Structure System in Marine Soft Soil for Mid-Rise and High-Rise RC Frames. Master’s Thesis, Southeast University, Nanjing, China, 2019. [Google Scholar]
  19. Gao, Z.W.; Yang, X.B.; Zhang, J.F.; Tang, H.Y.; Du, Y.; Zhao, S.Y. Modal modification based analysis of seismic performance of the Jiufeng Temple Ancient Masonry Pagoda. Soil. Dyn. Earthq. Eng. 2025, 188, 109087. [Google Scholar] [CrossRef]
  20. Yuan, Z.Y.; Lu, J.L.; Li, Z.; Chen, Y.F. Dynamic characteristics and seismic response analysis of Luoshan Temple Pagoda. Constr. Technol. 2024, 53, 13–17. [Google Scholar]
  21. Xu, D.F.; Xie, Q.F.; Zhang, Y.; Hao, W.M. Effects of inclination on the seismic performance of Chinese historical masonry tower identified through shaking table tests. J. Earthq. Eng. 2023, 27, 1458–1481. [Google Scholar] [CrossRef]
  22. Abruzzese, D.; Miccoli, L.; Yuan, J.L. Mechanical behavior of leaning masonry Huzhu Pagoda. J. Cult. Herit. 2009, 10, 480–486. [Google Scholar] [CrossRef]
  23. Zhang, F. Study on Seismic Response Characteristics of Masonry Pagodas in Hill Site. Master’s Thesis, Yangzhou University, Yangzhou, China, 2023. [Google Scholar]
  24. Xue, J.Y.; Wu, C.W.; Hao, F.H.; Ma, L.L. In situ experiment and finite element analysis on dynamic characteristics of Yingxian Wooden Tower. J. Build. Struct. 2022, 43, 85–93. [Google Scholar] [CrossRef]
  25. Bai, F.; Yang, N.; Liu, W.; Zhang, S.H. Study on condition assessment of Dingzhou Kaiyuan Pagoda under ambient vibration. J. Build. Struct. 2022, 43, 105–115. [Google Scholar] [CrossRef]
  26. Xue, J.Y.; Wu, C.W.; Zhou, S.Q.; Zhang, F.L. Analysis on dynamic characteristics and seismic response of the Anding Gate Tower in Xi’an considering high stylobate. J. Build. Struct. 2021, 42, 12–21. [Google Scholar] [CrossRef]
  27. Zhao, J. Studies on Optimal Design of Measurement Point Layout for Structural Health Monitoring. Doctor’s Thesis, Jinan University, Guangzhou, China, 2011. [Google Scholar]
  28. Xu, X.Z.; Hua, H.X.; Chen, Z.N. Review of modal identification method based on ambient excitation. J. Vib. Shock. 2002, 3, 3–7+91. [Google Scholar] [CrossRef]
  29. Li, S.C.; Wang, P.X.; Zhang, S.J.; Macchioni, N. Parameter estimation on material properties of timber beams in ancient building based on test and evaluation. Ind. Archit. 2019, 49, 77–82. [Google Scholar] [CrossRef]
  30. GB/T 50107-2010; Standard for Evaluation of Concrete Compressive Strength. China Building Industry Press: Beijing, China, 2010. (In Chinese)
  31. Chang, S.P. Geological Engineering Handbook, 5th ed.; China Building Industry Press: Beijing, China, 2018. [Google Scholar]
  32. Xue, J.Y.; Ling, H.Q.; Song, D.J.; Wu, C.W.; Guo, H.Z. Experimental study and finite element analysis on seismic behavior of Pingshenke Dou-Gong Brackets. J. Build. Struct. 2023, 44, 74–85. [Google Scholar] [CrossRef]
  33. Zhang, Y.X. Seismic Response Analysis of High-Deck Wood Structure in Ancient Buildings Considering Soil-Structure Dynamic Interaction. Master’s Thesis, Xi’an University of Architecture and Technology, Xi’an, China, 2017. [Google Scholar]
  34. Wu, C.W.; Xue, J.Y.; Zhang, X.C.; Bai, F.Y.; Ma, H.D. Seismic assessment and fragility analysis of traditional Chinese timber frame building considering degraded connections. Int. J. Archit. Herit. 2023, 17, 553–572. [Google Scholar] [CrossRef]
  35. Wu, C.W.; Zhang, X.C.; Xue, J.Y.; Ma, H.D.; Wu, J.B. Effect of performance degradation and infilled walls on seismic fragility assessment of traditional Chinese timber-frame structure. Int. J. Archit. Herit. 2022, 16, 1252–1269. [Google Scholar] [CrossRef]
  36. GB 50011-2011; Code for Seismic Design of Buildings. China Building Industry Press: Beijing, China, 2016. (In Chinese)
  37. Zhou, S.Q. Dynamic Characteristics and Seismic Response Analysis of Xi’an Andingmen Gate Building. Master’s Thesis, Xi’an University of Architecture and Technology, Xi’an, China, 2019. [Google Scholar]
  38. GB/T 50165-2020; Standards for Maintenance and Strengthening of Ancient Building Wood Structures. China Building Industry Press: Beijing, China, 2020. (In Chinese)
  39. Tanahashi, H.; Suzuki, Y. Analytical simulations of full-scale static and dynamic tests of traditional wooden frames. Hist. Urban Disaster Prev. J. 2010, 4, 181–188. [Google Scholar] [CrossRef]
  40. Zhang, X.C.; Hu, C.M.; Wu, C.W.; Ma, H.D. Analysis of anti-collapse performance of ancient timber frame buildings of grand style with Dou-gong under horizontal earthquake. Conserv. Archaeol. Sci. 2020, 32, 10–18. [Google Scholar] [CrossRef]
Figure 1. The typical multi-story wooden tower.
Buildings 15 00269 g001
Figure 2. The structure of Caiyunjian Tower. (a) Plan view of the platform; (b) plan view of the first floor.
Buildings 15 00269 g002
Figure 3. Flowchart of the dynamic characteristics and seismic response analysis.
Buildings 15 00269 g003
Figure 4. Photo of the seismometer.
Buildings 15 00269 g004
Figure 5. Diagram of measuring points.
Buildings 15 00269 g005
Figure 6. Power spectral density–frequency curves of measuring points. (a) The column top of first floor (east–west), (b) the ground of second floor (east–west), (c) the column top of first floor (north–south), and (d) the ground of third floor (north–south).
Buildings 15 00269 g006aBuildings 15 00269 g006b
Figure 7. First-order mode shape diagram. (a) X–Y, (b) X–Z, (c) Y–Z, and (d) X–Y–Z.
Buildings 15 00269 g007
Figure 8. Second-order mode shape diagram. (a) X–Y, (b) X–Z, (c) Y–Z, and (d) X–Y–Z.
Buildings 15 00269 g008
Figure 9. Vibration mode of Caiyunjian Tower. (a) The first mode (east–west); (b) the second mode (north–south).
Buildings 15 00269 g009
Figure 10. Finite element model. (a) Model 1 (with unit section), (b) model 1 (without unit section), (c) model 2 (with unit section), and (d) model 2 (without unit section).
Buildings 15 00269 g010
Figure 11. The front fifteen order frequencies of the models.
Buildings 15 00269 g011
Figure 12. The finite element model mode diagram of model 1. (a) The first mode, (b) the second mode, (c) the third mode, (d) the fourth mode, (e) the fifth mode, and (f) the sixth mode.
Buildings 15 00269 g012
Figure 13. The finite element model mode diagram of model 2. (a) The first mode, (b) the second mode, (c) the third mode, (d) the fourth mode, (e) the fifth mode, and (f) the sixth mode.
Buildings 15 00269 g013
Figure 14. Time history curves of the reference points of the two models under a local seismic excitation at the peak acceleration of 400 cm/s2. (a) Displacement–Time curve of model 1, (b) displacement–time curve of model 2, (c) acceleration–time curve of model 1, and (d) acceleration–time curve of model 2.
Buildings 15 00269 g014
Figure 15. Distribution diagram of floor shear force (C means column). (a) El Centro apeak = 70 cm/s2; (b) Taft apeak = 400 cm/s2.
Buildings 15 00269 g015
Table 1. Main component section dimensions.
ComponentD (mm)Componentb × h (mm)
First eave column320First architrave200 × 250
Second hypostyle column320First Rufu280 × 500
Third hypostyle column280Brace120 × 180
D, b, and h are the diameter, width, and height of the component section, respectively.
Table 2. Material parameters of wood.
EL (MPa)ER (MPa)ET (MPa)GRT (MPa)GLR (MPa)GLT (MPa)
10,000200200180600750
E and G are the elastic modulus and shear modulus of wood, respectively, and the subscripts L, R, and T represent the longitudinal, radial, and tangential direction of wood, respectively.
Table 3. Concrete material parameters of the core column.
MaterialE (MPa)ρ (kg/m3)μ
Concrete28,50025000.2
ρ and μ are the density and Poisson’s ratio of concrete, respectively.
Table 4. Material parameters of platform.
MaterialE (MPa)ρ (kg/m3)μ
Bluestone500025000.3
Table 5. Material parameters of foundation soil.
MaterialE (MPa)μρ (kg/m3)c (kPa)φ (°)
Rammed soil200.318676030.4
c and φ are the cohesive strength and angle of internal friction of the soil, respectively.
Table 6. Stiffness of mortise-tenon joints.
StiffnessDirectionK1K2
Translational stiffness/(kN/m)x1.81 × 106
(0.102 m)
1.1 × 10⁶
(0.16 m)
y
z
Rotational stiffness/(kN·m/rad)rotx800
(0.06 rad)
200
(0.1 rad)
roty
rotz
The numbers inside the parentheses of translational stiffness K1 and K2 represent the ultimate tensile strength d1 and yield strength d2, respectively. The numbers inside the parentheses of rotational stiffness K1 and K2 represent the ultimate tensile strength θ1 and yield strength θ2, respectively.
Table 7. Stiffness of Dou-gong joints.
StiffnessDirectionK1K2
Translational stiffness/(kN/m)x3500 (0.03 m)850 (0.04 m)
y
z12,000 (0.014 m)2920 (0.02 m)
Rotational stiffness/(kN·m/rad)rotx3000 (0.035 rad)740 (0.05 rad)
roty
rotz
Table 8. Column top load.
FloorFirstSecondThird
Load (kN)75.24250.18778.060
Table 9. Comparison of natural vibration frequencies between simulated and experimental values of model 1.
OrderExperimental Value (Hz)Simulated Value (Hz)Relative Error (%)
First3.8213.7671.413
Second4.1063.7718.159
Table 10. Modal participation mass coefficient of model 1.
ModeNorth–SouthEast–West
γr/%γr/%
First000.852585.25
Second0.883188.31085.25
Third088.31085.25
Fourth088.310.133398.58
Fifth0.102998.60--
γ is the modal participation mass coefficient, r is the mode contribution; r = 1 i γ % , i is the order of the mode.
Table 11. Modal participation mass coefficient of model 2.
ModeNorth–SouthEast–West
γr/%γr/%
First0.706370.6300
Second070.630.709670.96
Third070. 63070.96
Fourth0.074078.03070.96
Fifth078.030.075078.46
Sixth078.03078.46
Seventh078.03078.46
Eighth078.03078.46
Ninth0.185996.62078.46
Tenth--0.182696.72
Table 12. The maximum displacement, acceleration, and displacement–angle response of the models.
The Waveform Inputapeak
(cm/s2)
Model 1Model 2
Δ (mm)a (cm/s2)θ (rad)Δ (mm)a (cm/s2)θ (rad)
El Centro wave707.16281.801/54523.861933.361/164
20020.00782.471/19557.034669.171/68
40038.511362.441/101157.9812,533.901/25
Taft wave705.59216.391/69727.672297.591/141
20015.63616.951/49980.116570.581/49
40029.951198.111/130144.8212,109.301/27
Lanzhou wave706.97223.131/56013.721218.791/284
20017.17620.931/22733.783119.631/116
40032.961166.311/11858.445369.791/67
Table 13. The maximum floor shear response of model 1 under each working condition.
The Waveform Inputapeak
(cm/s2)
Model 1 Vmax (kN)
First FloorSecond FloorThird Floor
Column FootColumn TopColumn FootColumn TopColumn FootColumn Top
El Centro wave7068.7355.4759.5519.925.197.16
200193.15155.06166.4755.6814.5120.01
400371.88298.55320.52107.2027.9538.52
Taft wave7048.4937.8738.0713.314.455.13
200136.07105.84106.4037.1912.4514.35
400260.76202.83203.9071.2623.8527.50
Lanzhou wave7064.2640.3349.8917.915.516.44
200158.36112.71122.9544.1513.5815.86
400303.98216.36236.0384.7526.0730.45
Table 14. The maximum floor shear response of model 2 under each working condition.
The Waveform Inputapeak
(cm/s2)
Model 2 Vmax (kN)
First floorSecond FloorThird Floor
Column FootColumn TopColumn FootColumn TopColumn FootColumn Top
El Centro wave70203.43179.9834.2162.599.2530.96
200653.38577.14154.45176.0821.5197.40
4001200.271062.12237.80290.8947.58195.43
Taft wave70257.55229.0054.2667.529.2840.40
200738.69656.61155.71193.5526.63115.74
4001330.781180.73297.95348.6847.18204.32
Lanzhou wave70151.62134.6053.6454.222.2618.32
200397.37352.61140.51141.975.9547.96
400721.05639.32254.78257.1614.3186.83
Disclaimer/Publisher’s Note: The statements, opinions and data contained in all publications are solely those of the individual author(s) and contributor(s) and not of MDPI and/or the editor(s). MDPI and/or the editor(s) disclaim responsibility for any injury to people or property resulting from any ideas, methods, instructions or products referred to in the content.

