Article

Experimental and Numerical Investigation of Welding Residual Stress of U-Rib Joints in Orthotropic Steel Bridge Decks

1
First Engineering Co., Ltd., China Construction Third Bureau, Wuhan 430040, China
2
School of Civil Engineering and Architecture, Wuhan University of Technology, Wuhan 430070, China
*
Author to whom correspondence should be addressed.
Buildings 2025, 15(2), 262; https://doi.org/10.3390/buildings15020262
Submission received: 16 December 2024 / Revised: 8 January 2025 / Accepted: 13 January 2025 / Published: 17 January 2025

Abstract

:
The residual stresses at U-rib joints have a significant adverse impact on the structure. Therefore, it is necessary to conduct research and analysis on their residual stresses. Based on experimental testing and thermal elastic-plastic finite element analysis (FEA), this study investigates the residual stress (RS) of a U-rib joint using gas metal arc welding in an orthotropic steel bridge deck (OSBD). X-ray diffraction (XRD) was adopted to measure the RS of the U-rib welds, and the measurement results were utilized to verify the FEA. The effects of the weld root gap, weld penetration, and weld groove angle on the RS of U-rib welds were investigated by using FEA. The weld root gap had minor effect on the RS of the U-rib welds. With an increase in weld penetration, the peak values of the transverse tensile RS at both the deck plate and the U-rib weld toes increased. Additionally, an enlargement of the groove angle also resulted in a notable increase in the transverse tensile RS peak at the deck plate weld toe.

1. Introduction

Orthotropic steel deck plates are widely utilized in steel bridges because of their many advantages, including their light weight, high load-carrying capacity, and fast construction speed. The U-rib, as a fundamental component of orthotropic steel bridge decks, functions in conjunction with the deck plate to share loads and enhance the overall flexural capacity of the bridge deck. A schematic representation of the U-rib configuration is provided in Figure 1a for reference. The U-ribs and deck plate are connected through welding, and the residual stress (RS) generated during the welding process has a great impact on the fatigue performance of steel bridges [1,2,3,4,5,6,7]. Therefore, it is necessary to study the welding RS in the U-rib welds of orthotropic steel bridge decks (OSBDs).
In the 1930s, Boulton and Martin [8] were the first to investigate the welding process of structural components, discovering that the welding residual stress field generated in structural components was induced by the plastic deformation resulting from the heat applied to the weld metal. Kobayashi Yukio et al. [9] incorporated the thermophysical properties of structural materials into a welding finite element model and measured the three-dimensional residual stress distribution based on the thermo-elastoplastic finite element method, providing a theoretical foundation for future simulation studies of welding’s dynamic processes. Kainuma et al. [10] measured the RSs in OSBD specimens with different weld penetration rates and root gaps using the cutting method and the magnetostriction method. They also carried out numerical simulations to analyze the influence of the weld root gap and penetration rate on the RS. Kong et al. [11] conducted FEA of the RSs of double-sided welded U-rib joints using submerged arc welding and reported the influence of several key parameters, such as the deck thickness, on the RS. Wang et al. [12] explored the feasibility of the sharp indentation testing method to measure the RSs of welded U-rib joints. They made a comparison between the RSs measured with the sharp indentation testing method and the blind hole-drilling method and concluded that it is feasible to measure the RSs of welded U-rib joints using the sharp indentation testing method. Liu et al. [13] investigated the RSs of U-rib joints using the blind hole-drilling method and FEA. They also investigated the RS relaxation of cyclic loaded U-rib joints through FEA. Li et al. [14] measured the RS in a welded OSBD using the blind hole-drilling method, taking the biaxial stress into account. Wang et al. [15] investigated the RSs of U-rib joints through conducting experimental testing and FEA and proposed a simplified distribution diagram for practical usage.
Conventionally, measurement of the welding RSs in the U-rib joints of OSBDs has relied on destructive methods, such as the strip cutting method [9] and hole-drilling method [10,13,14,15]. Non-destructive methods such as the sharp indentation testing method [12] and X-ray diffraction (XRD) have rarely been used. XRD can measure the RS at positions much closer to the weld toes of the U-rib joints compared with the blind hole-drilling method and output the stress components in the two directions of concern, which are the directions perpendicular and parallel to the welding direction. The surface residual stresses at the weld toes and roots directly affect the fatigue performance of the U-rib joints because fatigue cracks are prone to initiate at these places. Therefore, this study employs the non-destructive technique of XRD to measure the welding RSs in the U-rib joints of OSBDs. After validating the FEA using the experimental results, extensive FEAs are conducted to study the effects of the weld root gap, penetration rate, and groove angle on the welding RS in the U-rib joints of OSBDs.

2. U-Rib Joint Experimental Results

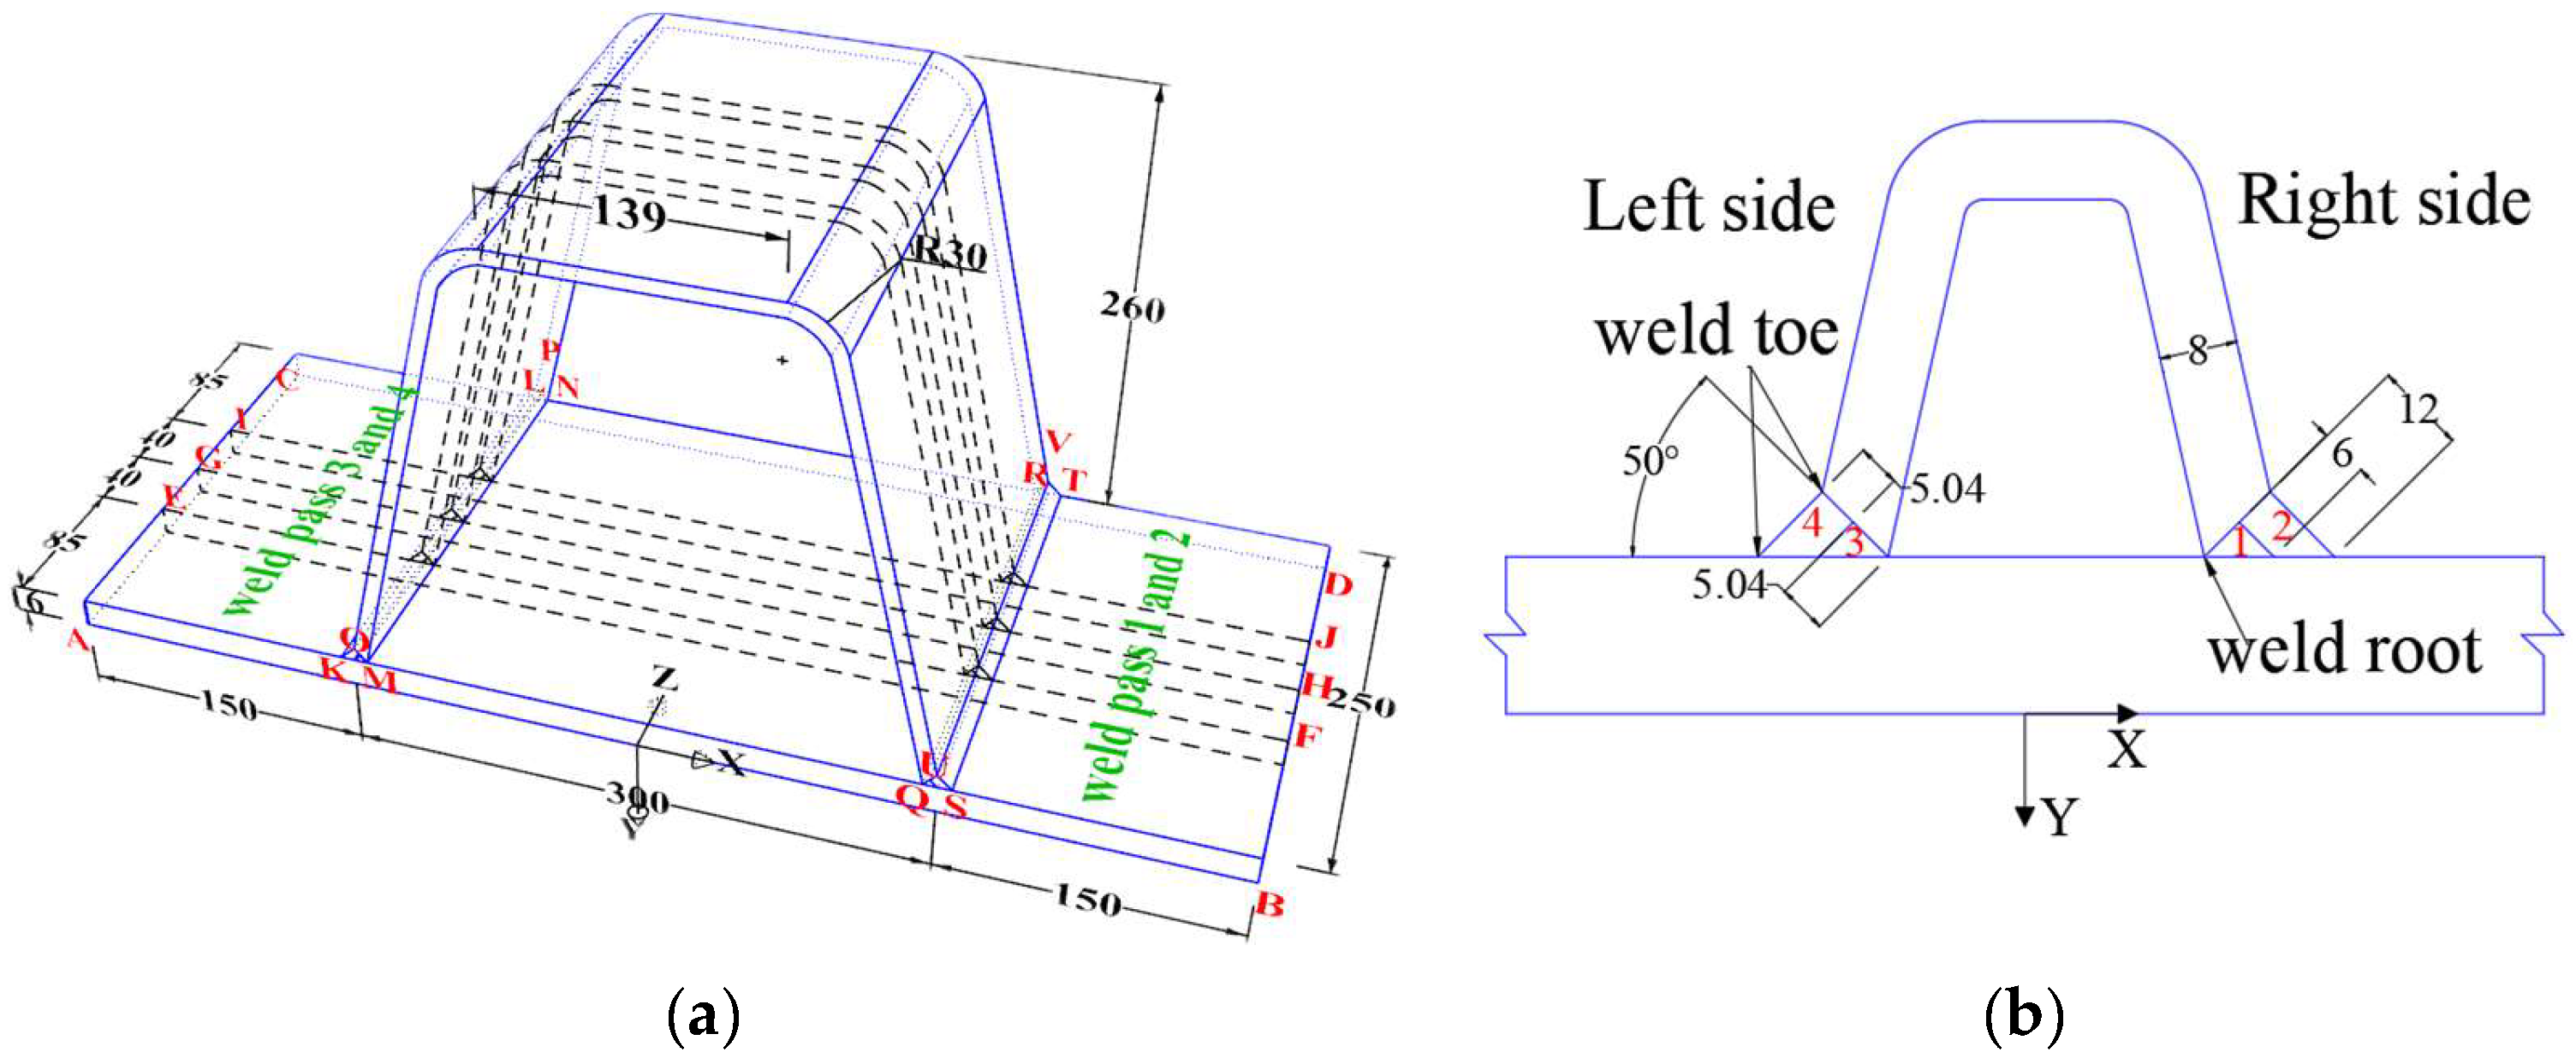
2.1. Dimensions of U-Rib Specimens and Welding Parameters

In this study, the dimensions and welding process, including the number of welding passes and the welding sequence of the U-rib specimens, were from the engineering practices of the Ba He Yuan Shuo bridge located in Xi An, China. The U-rib specimens were made of Q345qD steel, and their geometries and dimensions are illustrated in Figure 1a,b. The letters indicated in Figure 1a define the relevant paths utilized in subsequent residual stress distribution analyses. Manual gas metal arc welding (GMAW) was employed, utilizing an ER50-6 welding wire 1.2 mm in diameter and CO2 as the shielding gas. The welding sequence involved welding the first and second passes (red number in Figure 1b) on the right side first, followed by the third and fourth passes on the opposite side. The detailed welding parameters, including the welding current, voltage, and speed, are provided in Table 1. No constraints were applied to the specimens during the welding process. A total of five specimens were welded, among which four were used for residual stress measurement.

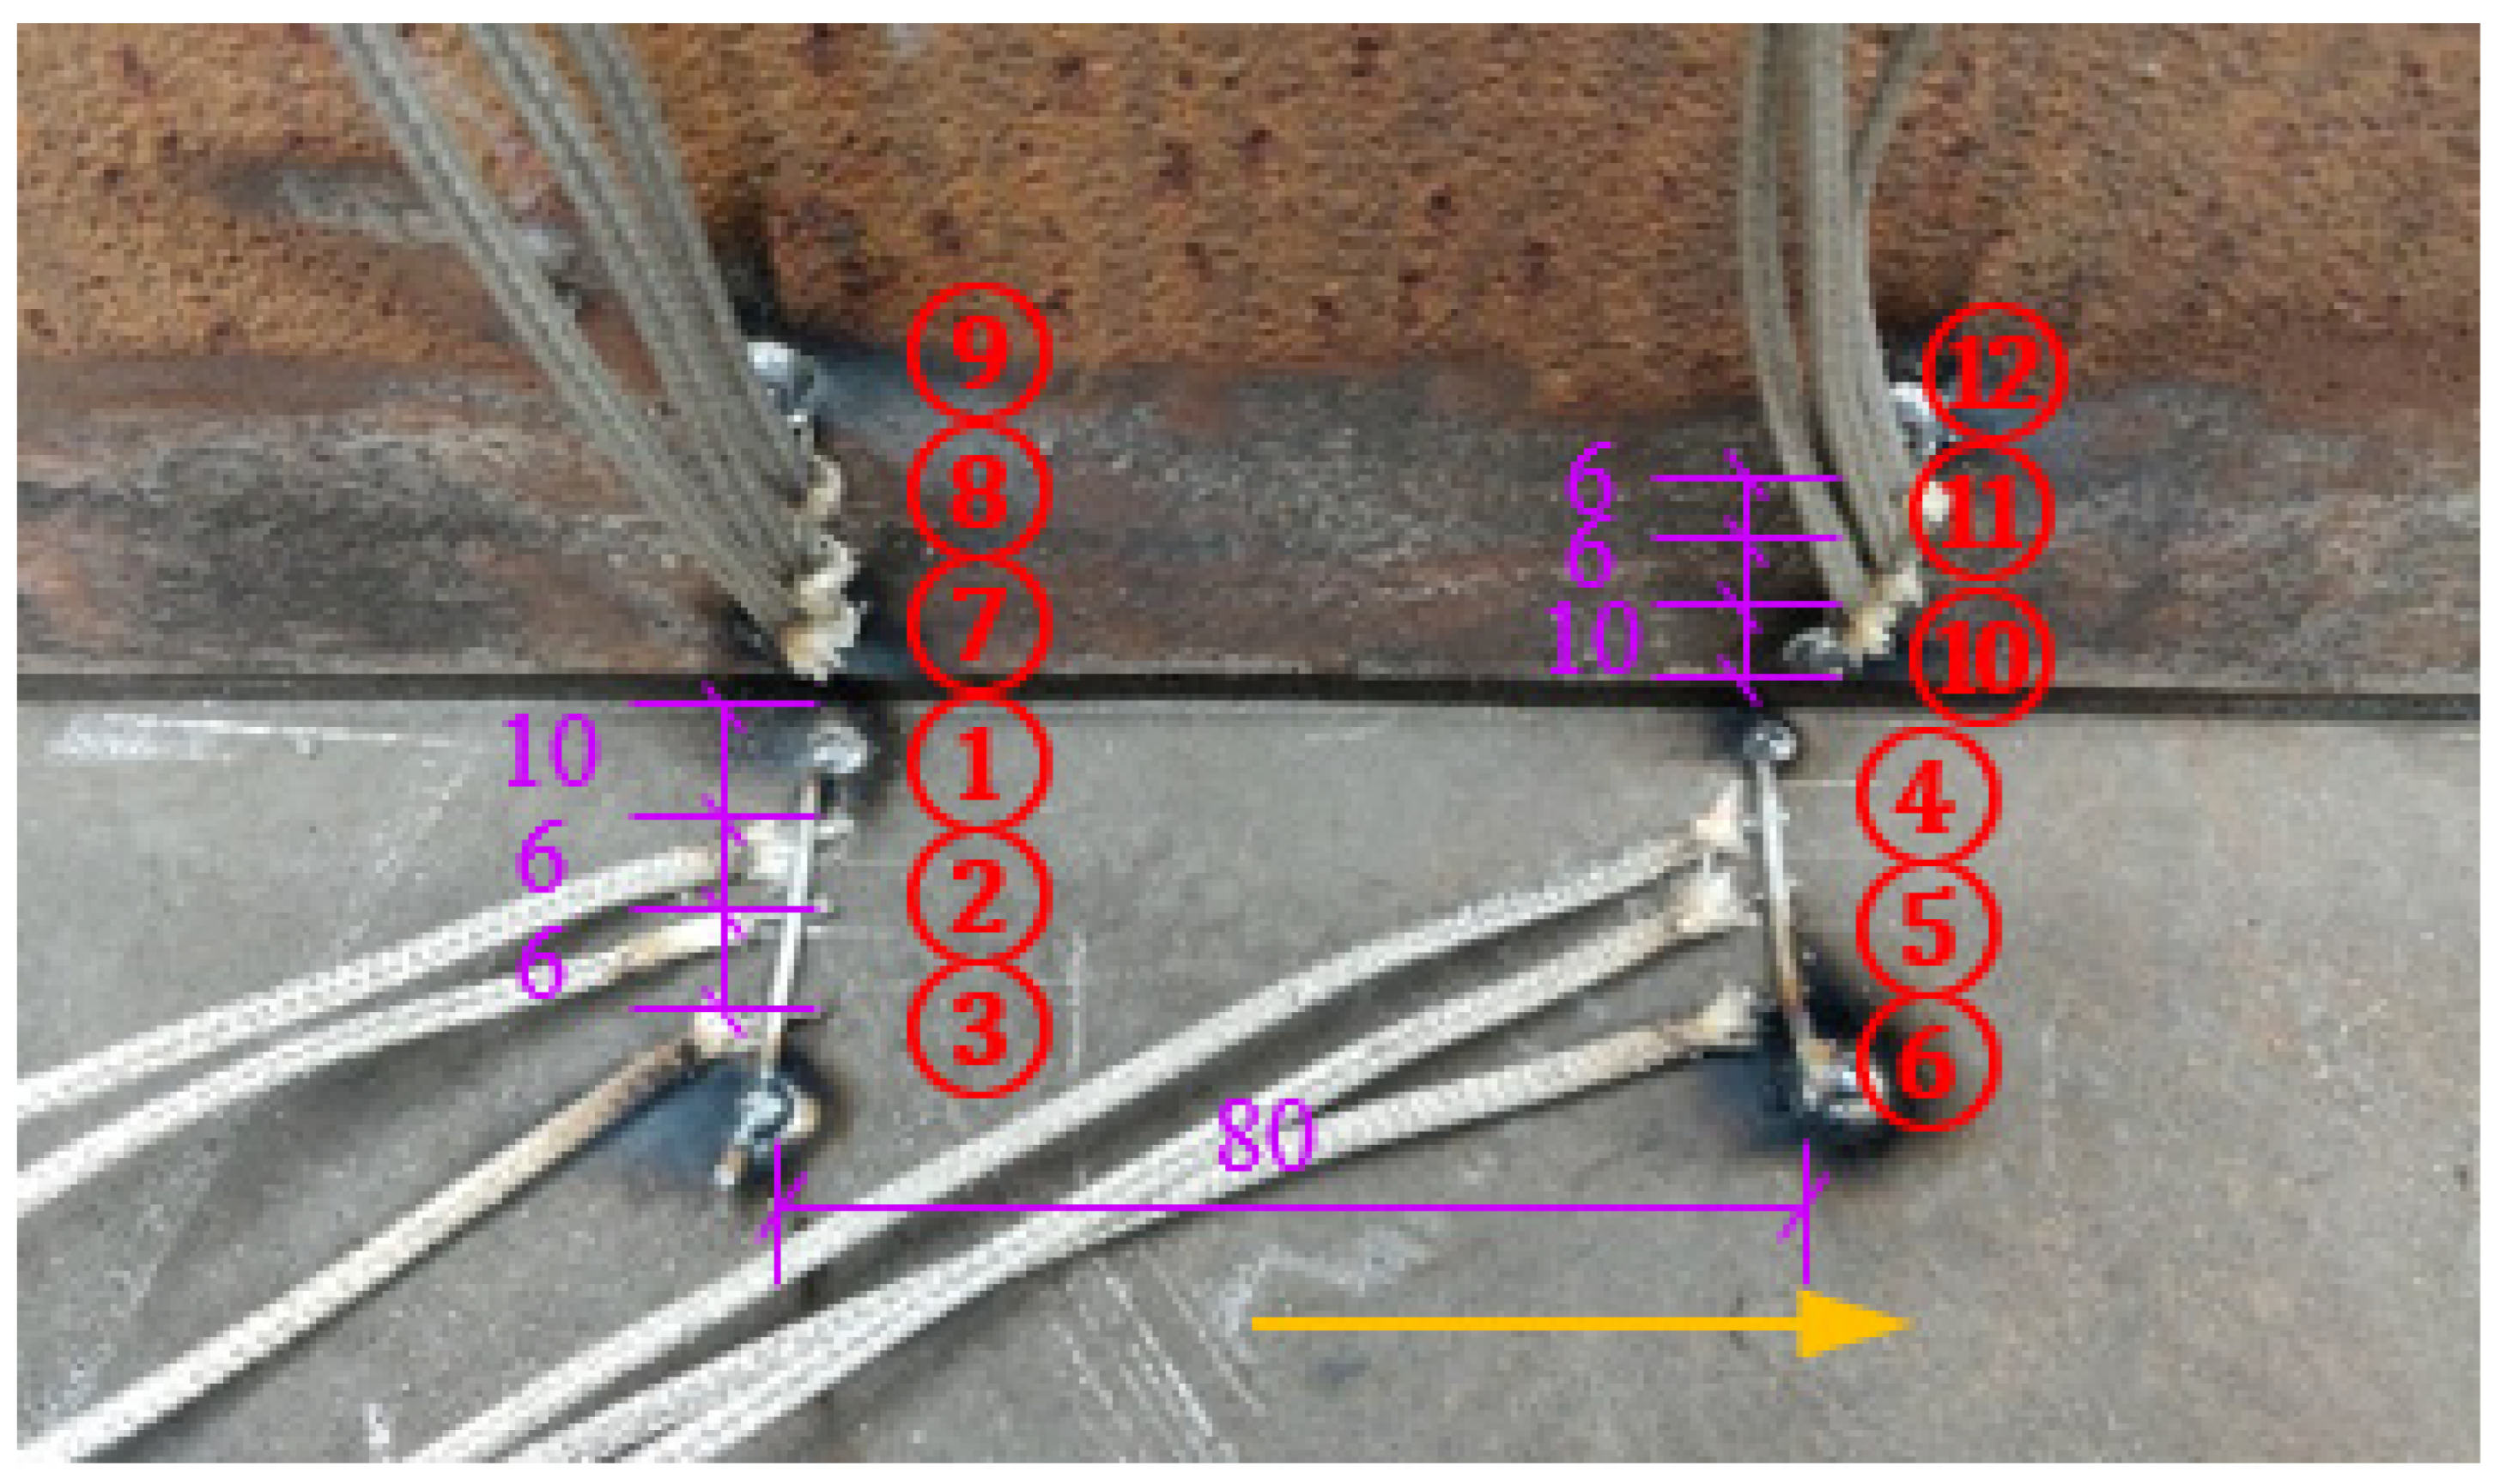
2.2. Thermal History Measurement

To measure the thermal history in the heating and cooling processes, 12 thermocouples with a measurement range of 0–1000 °C were fixed on the deck plate and the U-rib. Figure 2 shows the arrangement of temperature measurement points. The circled numbers represent the thermocouples, and the other numbers represent the spacing between the thermocouples or the distance from the thermocouple to the groove edge.

2.3. Residual Stress Measurement

The residual stress in the U-rib specimens was measured using a portable XRD analyzer. The surfaces of the specimens were contaminated with corrosion oxides, oil stains, and other substances. According to [16], electrolytic polishing was employed to remove these contaminants. Due to the existing slope angle between the U-rib and the deck plate, which made it difficult for the XRD equipment to measure the transverse RS (perpendicular to the weld seam) of the U-rib joint specimens, only the longitudinal RS (parallel to the weld seam) was measured, as shown in Figure 3a. For the U-rib and the deck plate, the surface measured points, with a diameter of 4 mm, were electrolytically polished before measurement. The layout of the points measured for residual stress is shown in Figure 3b.

3. FEA of the U-Rib Joint Welding
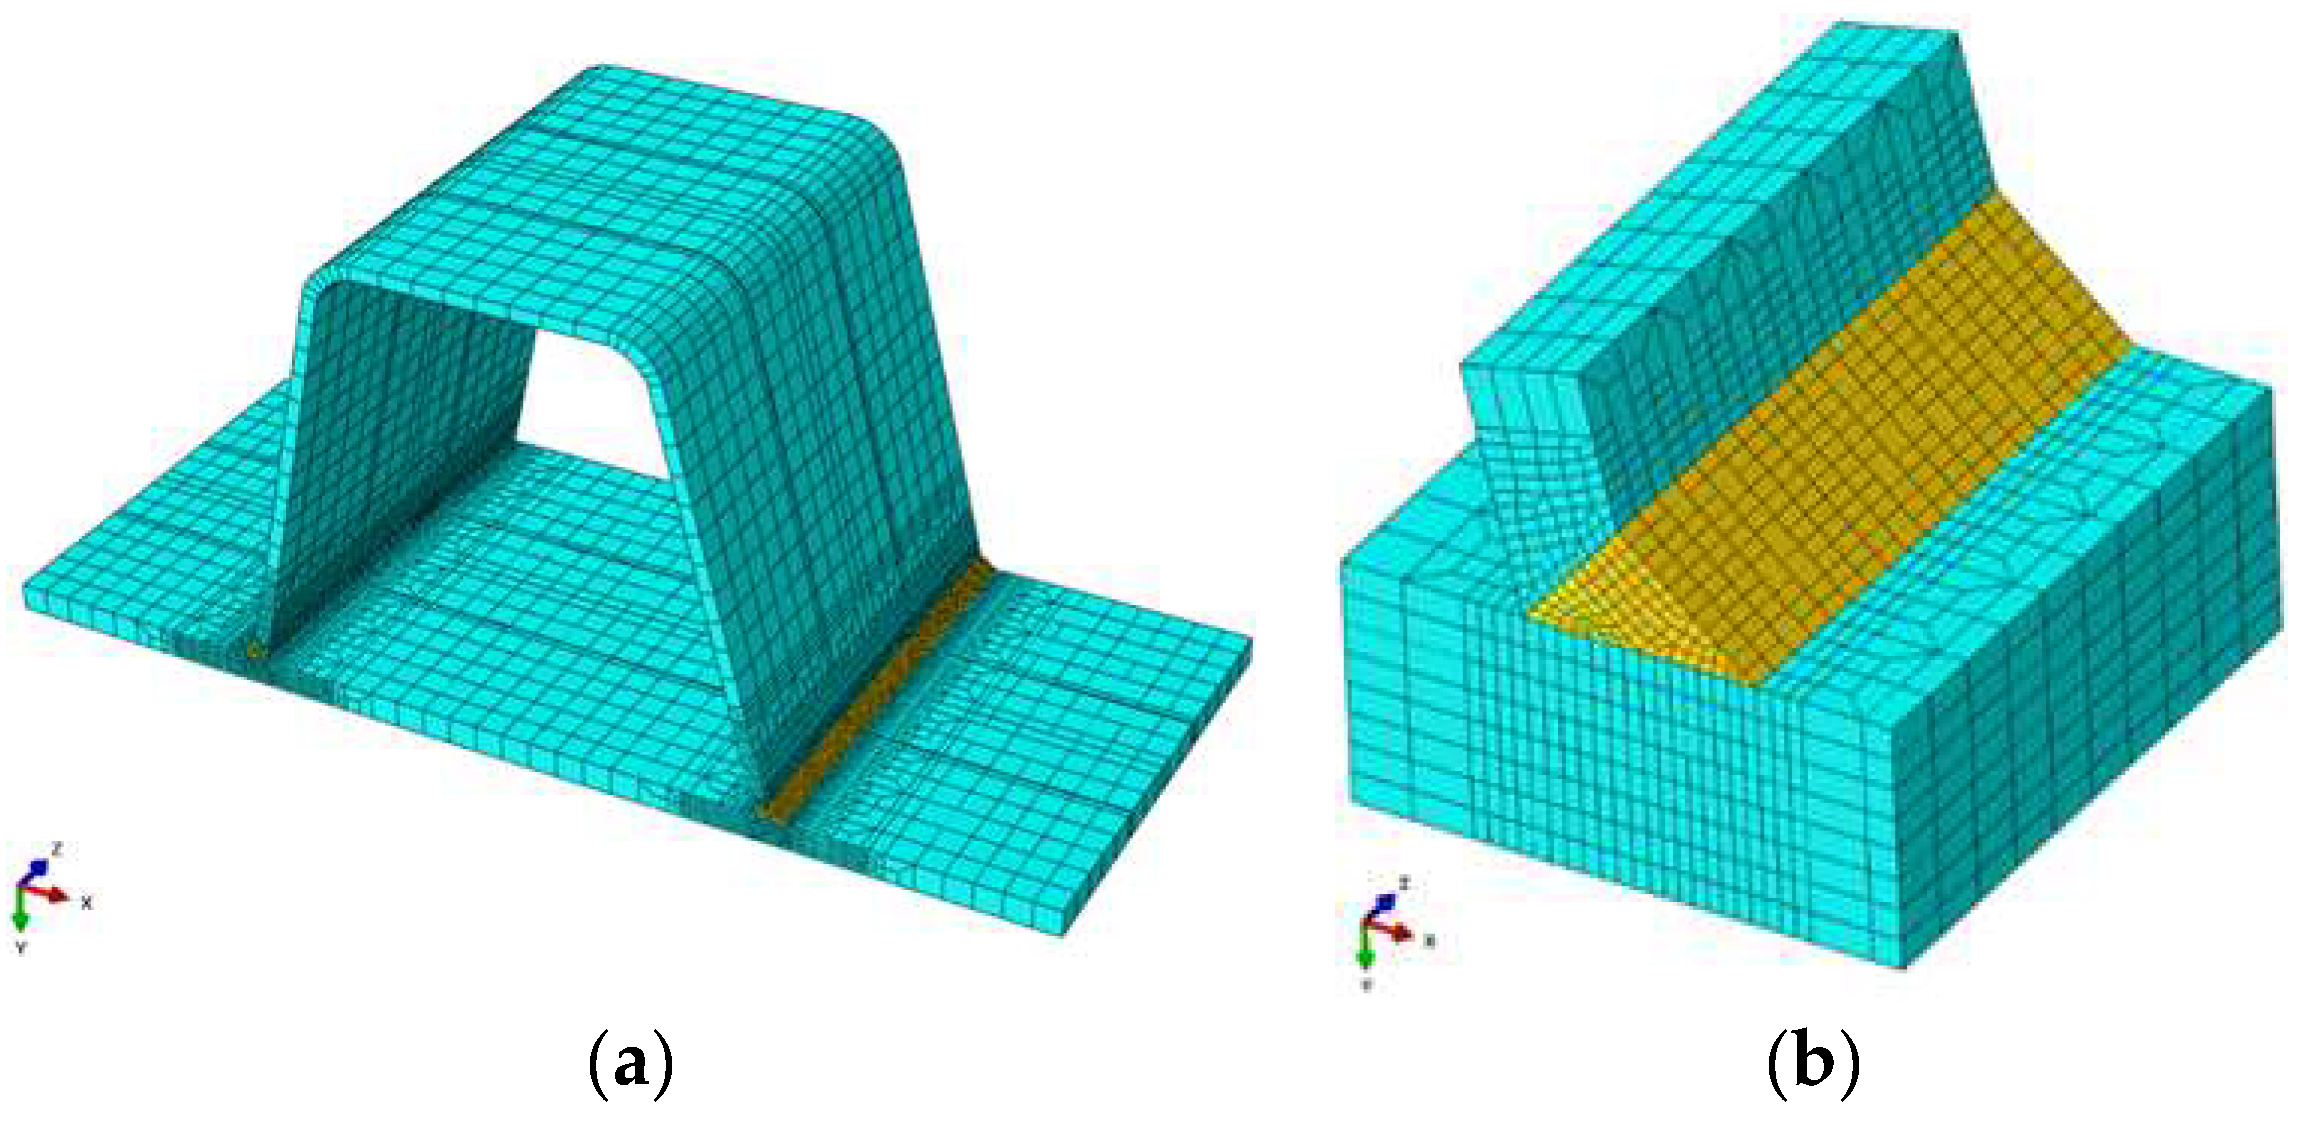
3.1. Mesh Model

The finite element model was established using HyperMesh 14.0 software. The FE model of the U-rib joint employed fine mesh near the weld and coarse mesh away from the weld region [17]. The element sizes in the vicinity of the weld were approximately 2 mm, and there were 110,543 nodes and 97,976 elements for the entire specimen. The global mesh model of the U-rib joint specimen is shown in Figure 4a, while the local refined mesh at the weld is shown in Figure 4b. The welding simulation adopted a sequentially coupled thermo-elastoplastic method, with DC3D8 and C3D8R elements used for the thermal analysis and mechanical analysis, respectively. The DC3D8 element is suitable for three-dimensional steady-state and transient thermal analysis, which means it can be used for the calculation of temperature fields. The C3D8R element is capable of accurately depicting the complex thermal and mechanical stresses during the welding process.

3.2. Heat Source Model

In actual welding processes, the welding pool is not spherically symmetrical, leading to the proposal of an ellipsoidal heat source model. However, the energy distribution along the length of the welding pool is uneven, causing the temperature changes in the front and rear portions of the ellipsoid to not be completely symmetrical. To improve the accuracy of the numerical simulation results, a double-ellipsoid heat source model (Figure 5) was used in this study [18], and the heat source distribution function expression for the front half is
q ( x , y , z ) = 6 3 f f Q π 3 / 2 a f b c exp ( 3 ( ( z a f ) 2 + ( x b ) 2 + ( y c ) 2 ) )
The heat source distribution function expression for the rear half is
q ( x , y , z ) = 6 3 f r Q π 3 / 2 a r b c exp ( 3 ( ( z a r ) 2 + ( x b ) 2 + ( y c ) 2 ) )
where x, y, and z are the local coordinates of the moving heat source, Q is the heat input, and Q = ηVI/v, where η is the welding efficiency, which typically ranges from 50% to 70% during gas metal arc welding [19]. In this study, η was taken to be 70%. Parameters V, I, and v represent the welding voltage, current, and speed, respectively. Parameters b, c, af, and ar are the geometric dimensions of the two semi-ellipsoids, where b denotes the heat source width, c represents the heat source depth, and af and ar are the lengths of the front and the rear ellipsoids, respectively. The specific values of af and ar are provided in Table 2. Parameters ff and fr are the proportional coefficients of heat input for the front and rear ellipsoids, respectively. The expressions of ff and fr are as follows [18]:
f f = 2 a f / ( a f + a r )
f r = 2 a r / ( a f + a r )

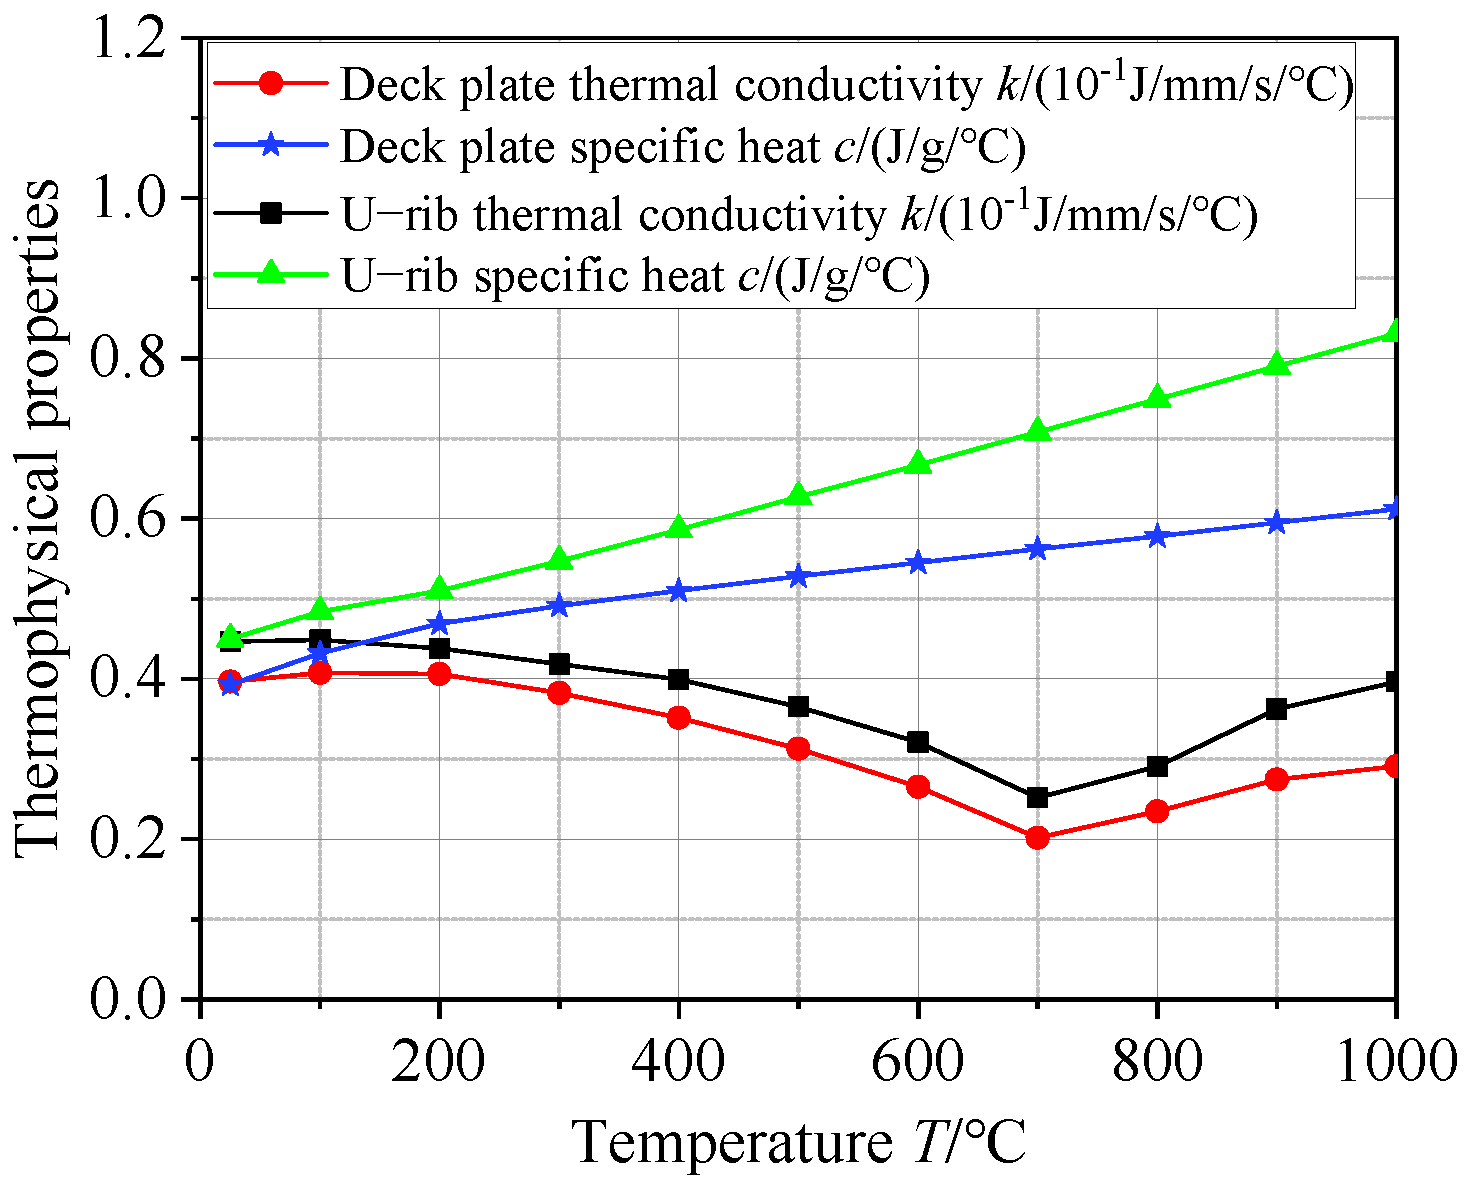
3.3. Thermophysical and Mechanical Properties of Steels

The thermal conductivity and specific heat capacity of the steels were measured with a laser flash thermal conductivity analyzer. The thermal expansion coefficients of the steels were determined through a thermal expansion coefficient tester. The yield strengths of the steels at varying temperatures were also measured. The density and Poisson’s ratio variables of the steels were assumed to be constant, with values of 7.85 × 10⁻³ g/mm3 and 0.3, respectively. The thermophysical and mechanical properties of the deck plate and the U-rib are presented in Figure 6 and Figure 7, respectively. In the FE simulation, the effect of latent heat from phase changing was considered, with a fusion latent heat of 300,000 J/kg. Steel fusion occurred between 1500 °C (solidus) and 1535 °C (liquidus) [3,20].

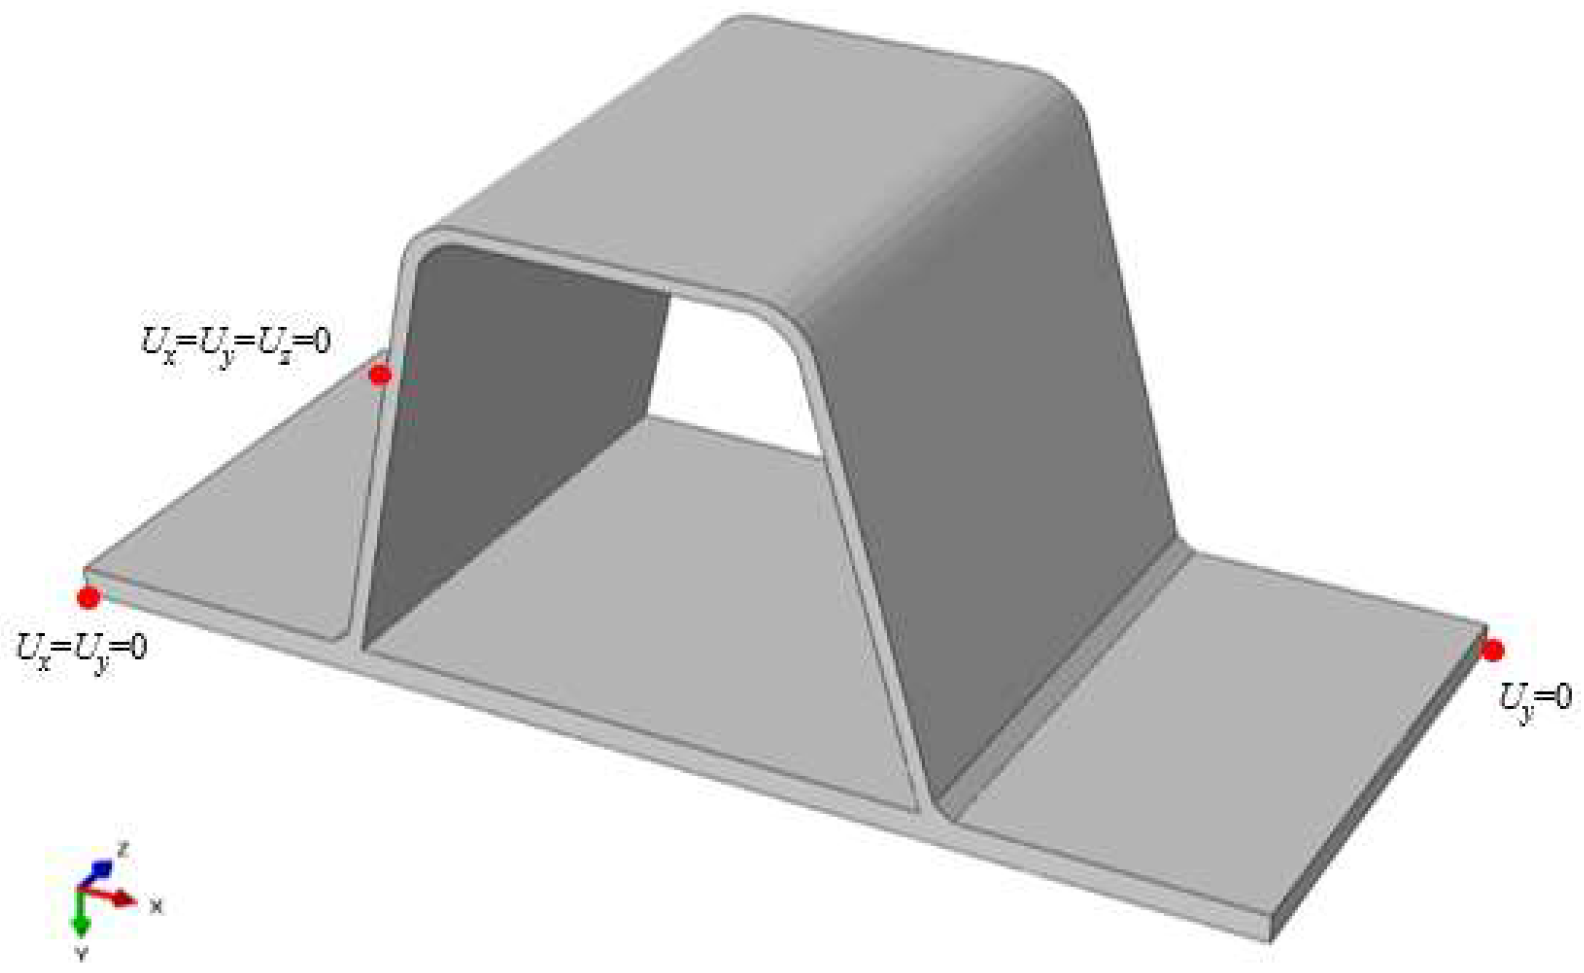
3.4. Boundary Conditions for the Temperature and Stress Analyses

When conducting the temperature analysis, the initial temperature of the surrounding medium around the model needed to be set, and the heat exchange boundary conditions between the model and the surrounding medium had to be defined. In the simulation, the initial temperature was taken to be 20 °C in this study. Heat transfer occurs in three forms: conduction, convection, and radiation. Due to limited experimental data, the convection heat transfer coefficient and Stefan–Boltzmann constant for radiation are often assumed to be constant in FE simulations [3,5,20]. In this study, the convection heat transfer coefficient was taken to be 15 Wm−2K−1, the emissivity was 0.85, and the Stefan–Boltzmann constant was 5.67 × 10⁻⁸ Wm−2K−4. Since no constraints were applied to the specimen during the welding process, only the rigid body motion needed to be restricted in the RS analysis, as shown in Figure 8.

4. FEA Verification

4.1. Temperature Comparison

Due to accidental movement of thermocouples 1–4 during the welding process, resulting in significant measurement errors, only the temperature data of thermocouples 5–12 are presented in this study. A comparison of the temperatures between the FE simulation and experimental measurement of the U-rib joint is shown in Figure 9a–c, with only the data from the first 500 s of the welding process being presented. As can be observed from Figure 9a–c, the temperature curves measured in the experiments exhibited a consistent trend with the FE simulation results. When the heat source was close to the thermocouple, the temperature rose rapidly, and when the heat source moved away from the thermocouple, the temperature dropped quickly. Furthermore, the temperature decreased as the distance between the thermocouple and the heat source increased. Overall, the temperature curves measured by the thermocouples agreed well with the FEA results, thereby demonstrating the accuracy of the FE simulation of the temperature field.

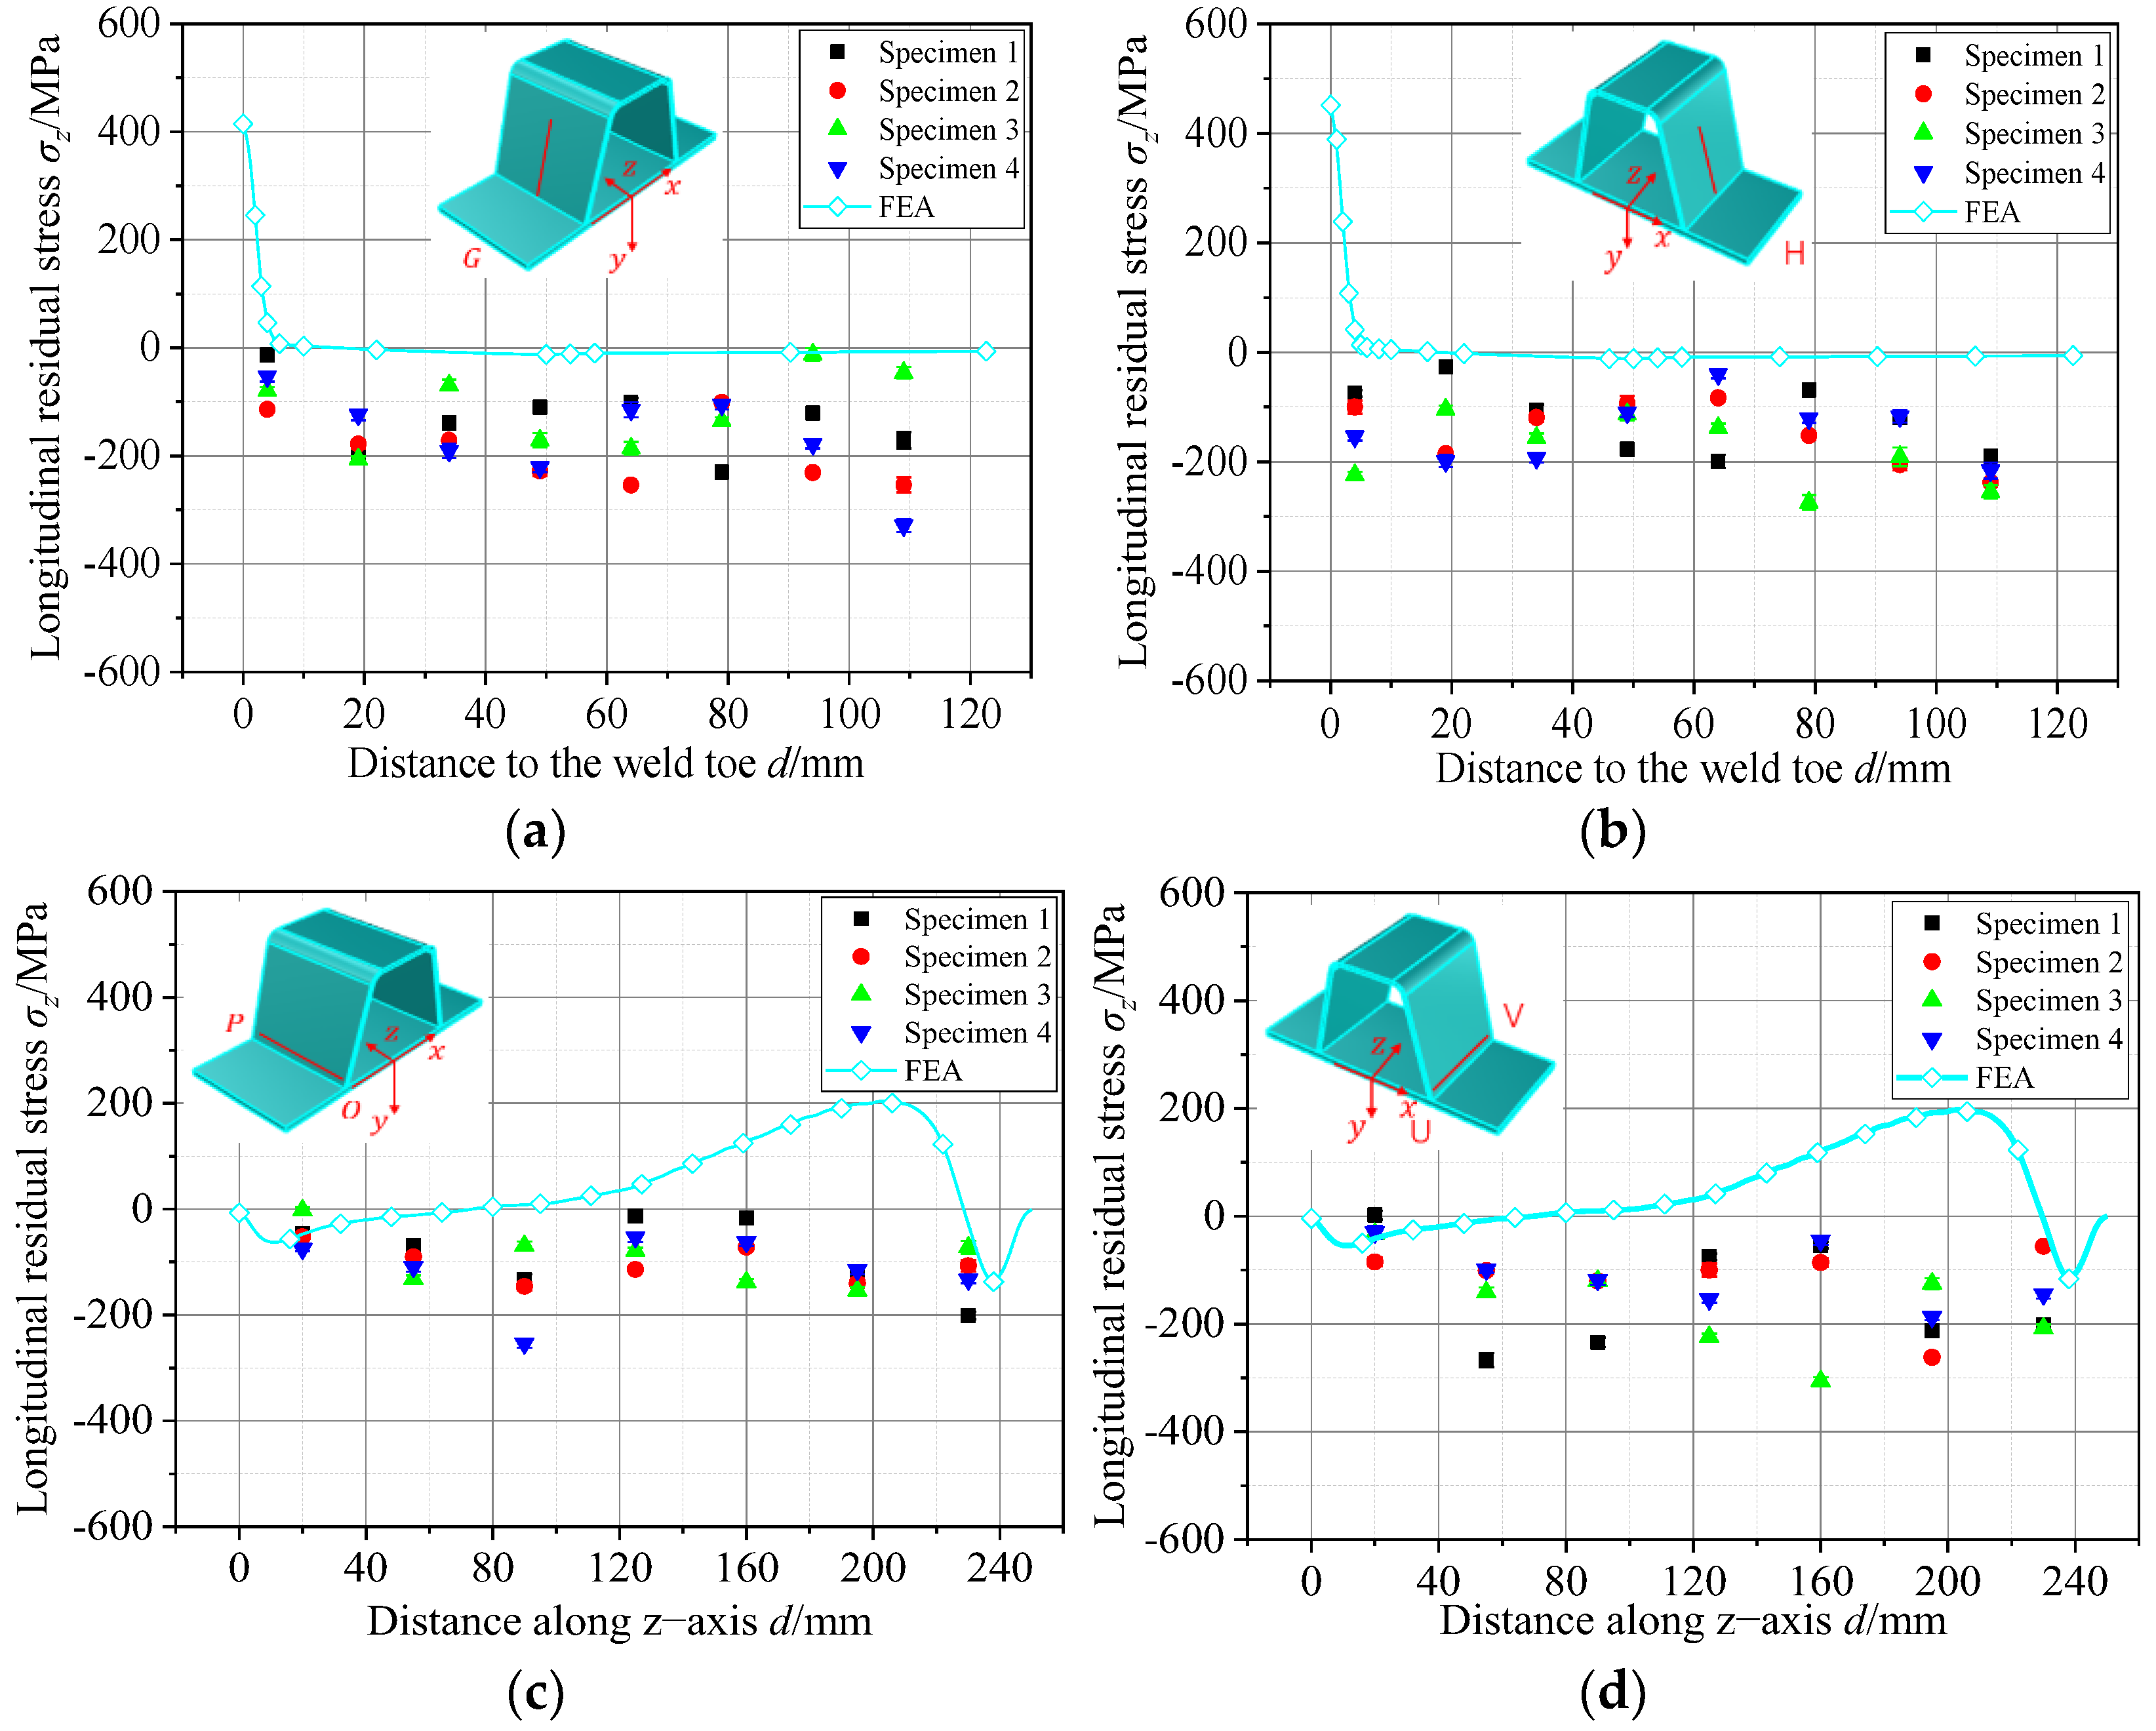
4.2. Comparison of the Residual Stresses

Figure 10a–d shows a comparison of the longitudinal RSs in the deck plate between the FEA and experimental measurements. Figure 10a,b illustrates a comparison of the longitudinal RSs at the measured points perpendicular to the weld on the deck plate. Overall, the longitudinal RSs measured using XRD agreed well with the trend of the results obtained from FEA, particularly in terms of the tensile RSs at the points 4 mm from the weld toe, where the values were quite close. As the distance away from the weld seam increased, the longitudinal RS changed from tension to compression, exhibiting the same distribution trend as the experimental and FE results of the longitudinal RSs in the deck plate reported in [21,22,23,24].
Figure 10c,d presents a comparison of the longitudinal RSs at the measured points parallel to the weld seam on the deck plate. The longitudinal RS curves from the experimental measurements and FEA exhibited a relatively consistent trend. Although the peak RS did not occur at the same location, the longitudinal RS was characterized by tension stress at most regions of the weld seam and nearly zero stress at the two ends of the weld seam.
Figure 11a,b shows a comparison of the longitudinal RSs at the measured points perpendicular to the weld in the U-rib. The measured data were all compressive stresses, while the longitudinal RS obtained via FEA was tension stress near the weld and became compressive stress as it moved away from the weld. The reason for the experimental data being entirely compressive stress may be due to the presence of initial compressive stress in manufacturing the U-rib.
Figure 11c,d presents a comparison of the longitudinal RSs at the measured points parallel to the weld in the U-rib. Most of the experimental data were compressive stresses, which may also be attributed to the compressive RS generated in the manufacturing process. Generally, only the longitudinal RSs near the start and end positions of the weld were compressive, as shown in Figure 11c,d.
By comparing the experimental data with the FEA results, it can be observed that the longitudinal RS measured on the deck plate showed a relatively consistent trend with the FEA results. However, there were some discrepancies between the measured longitudinal RS and that obtained from the FEA. This difference may be attributed to the compressive RS generated in manufacturing the U-rib.

5. FE Parametric Study

The FE parametric study in this section was performed to study the effects of the weld root gap, weld penetration rate, and weld groove angle on the RSs at the weld toe and weld root of the U-rib joint.

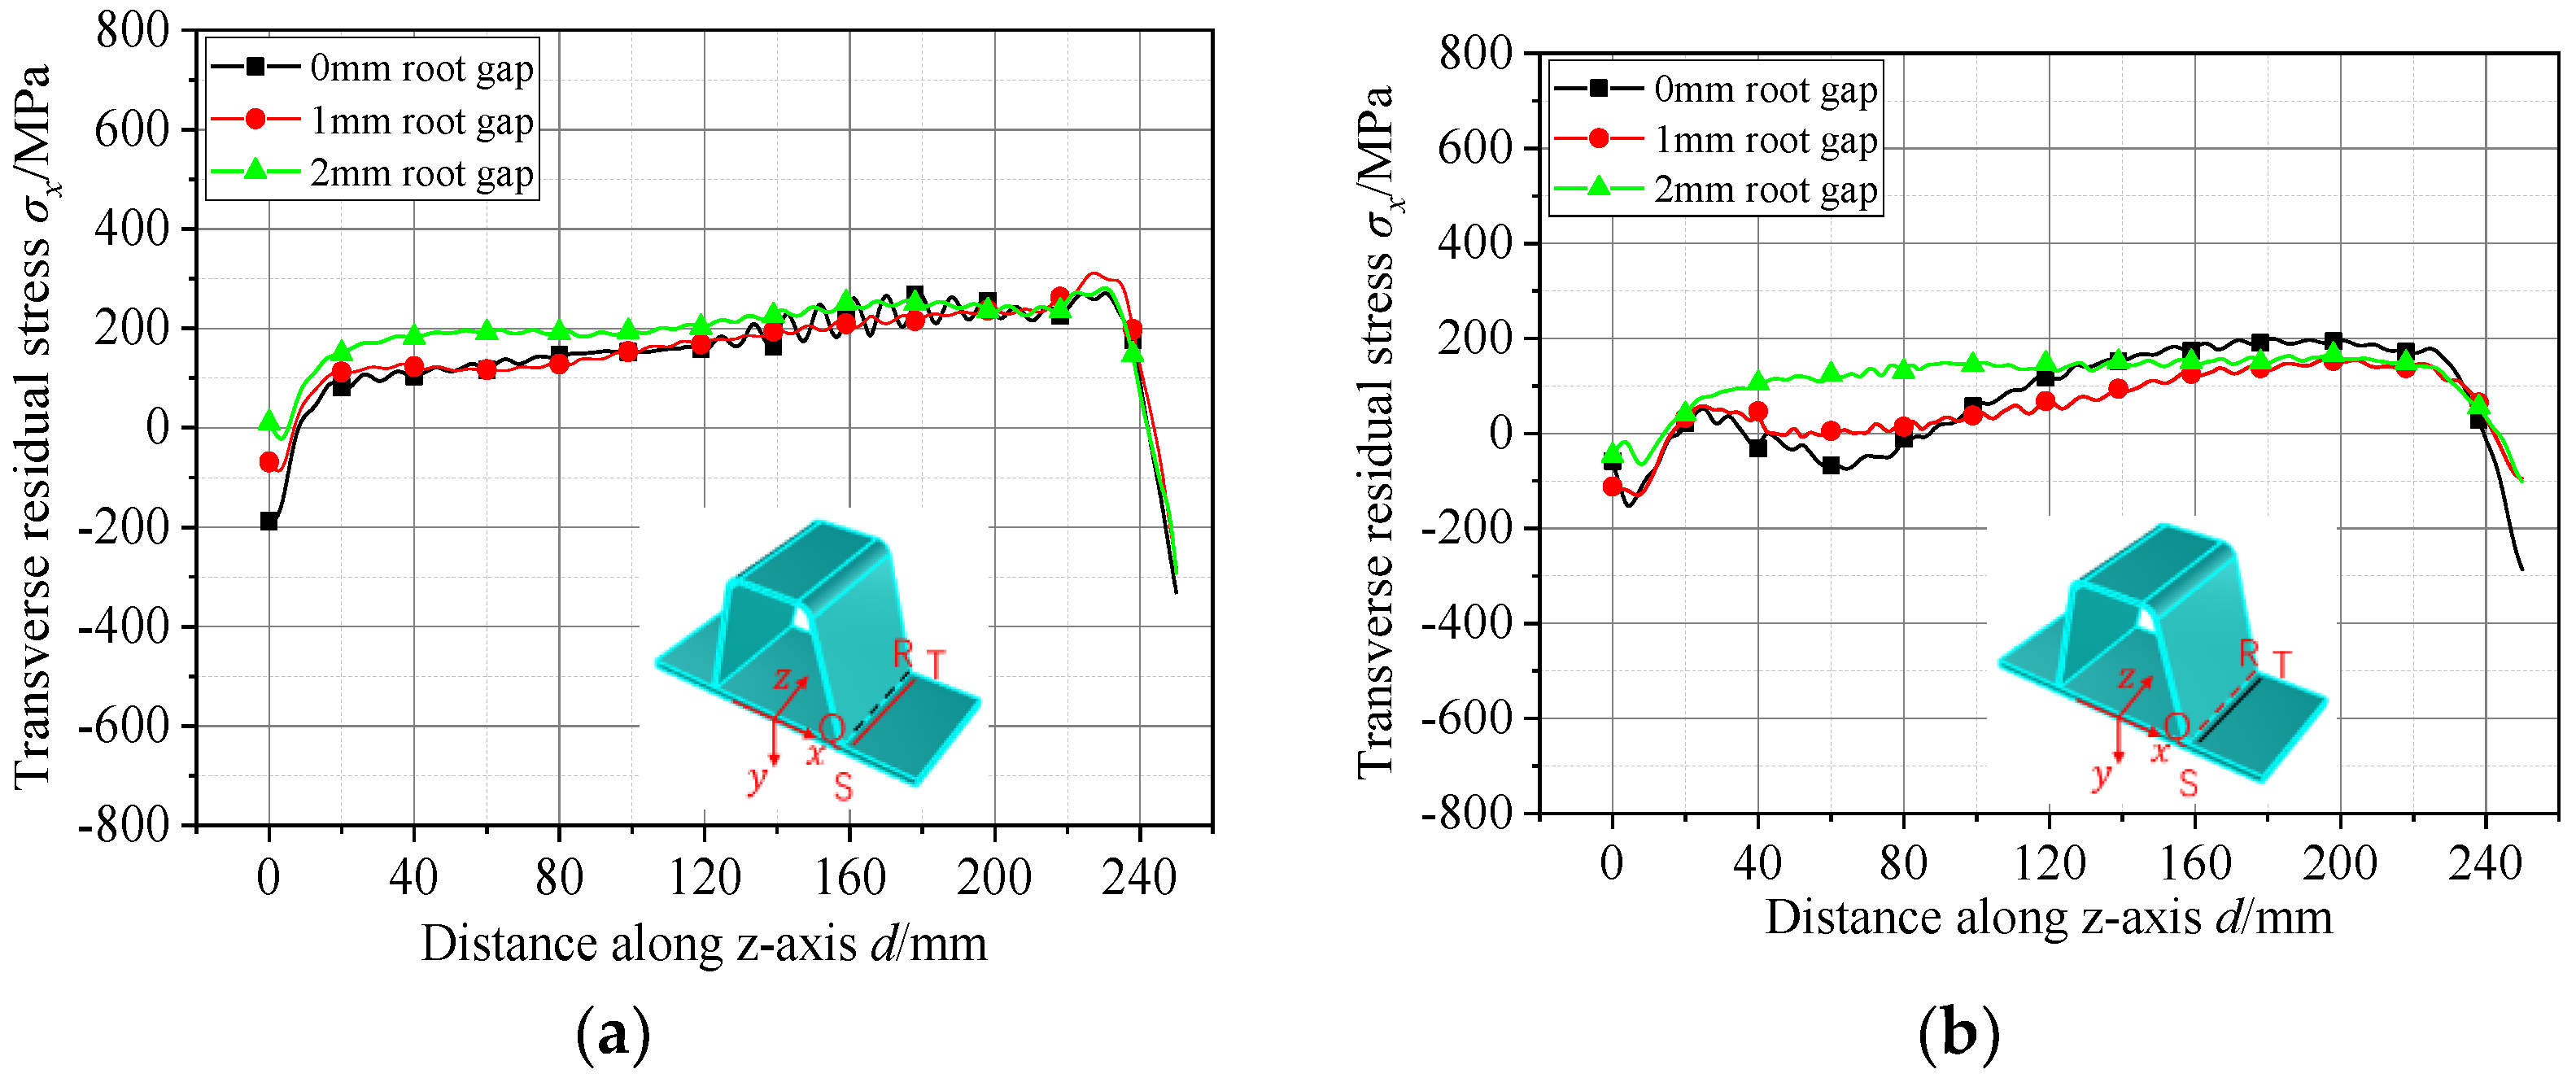
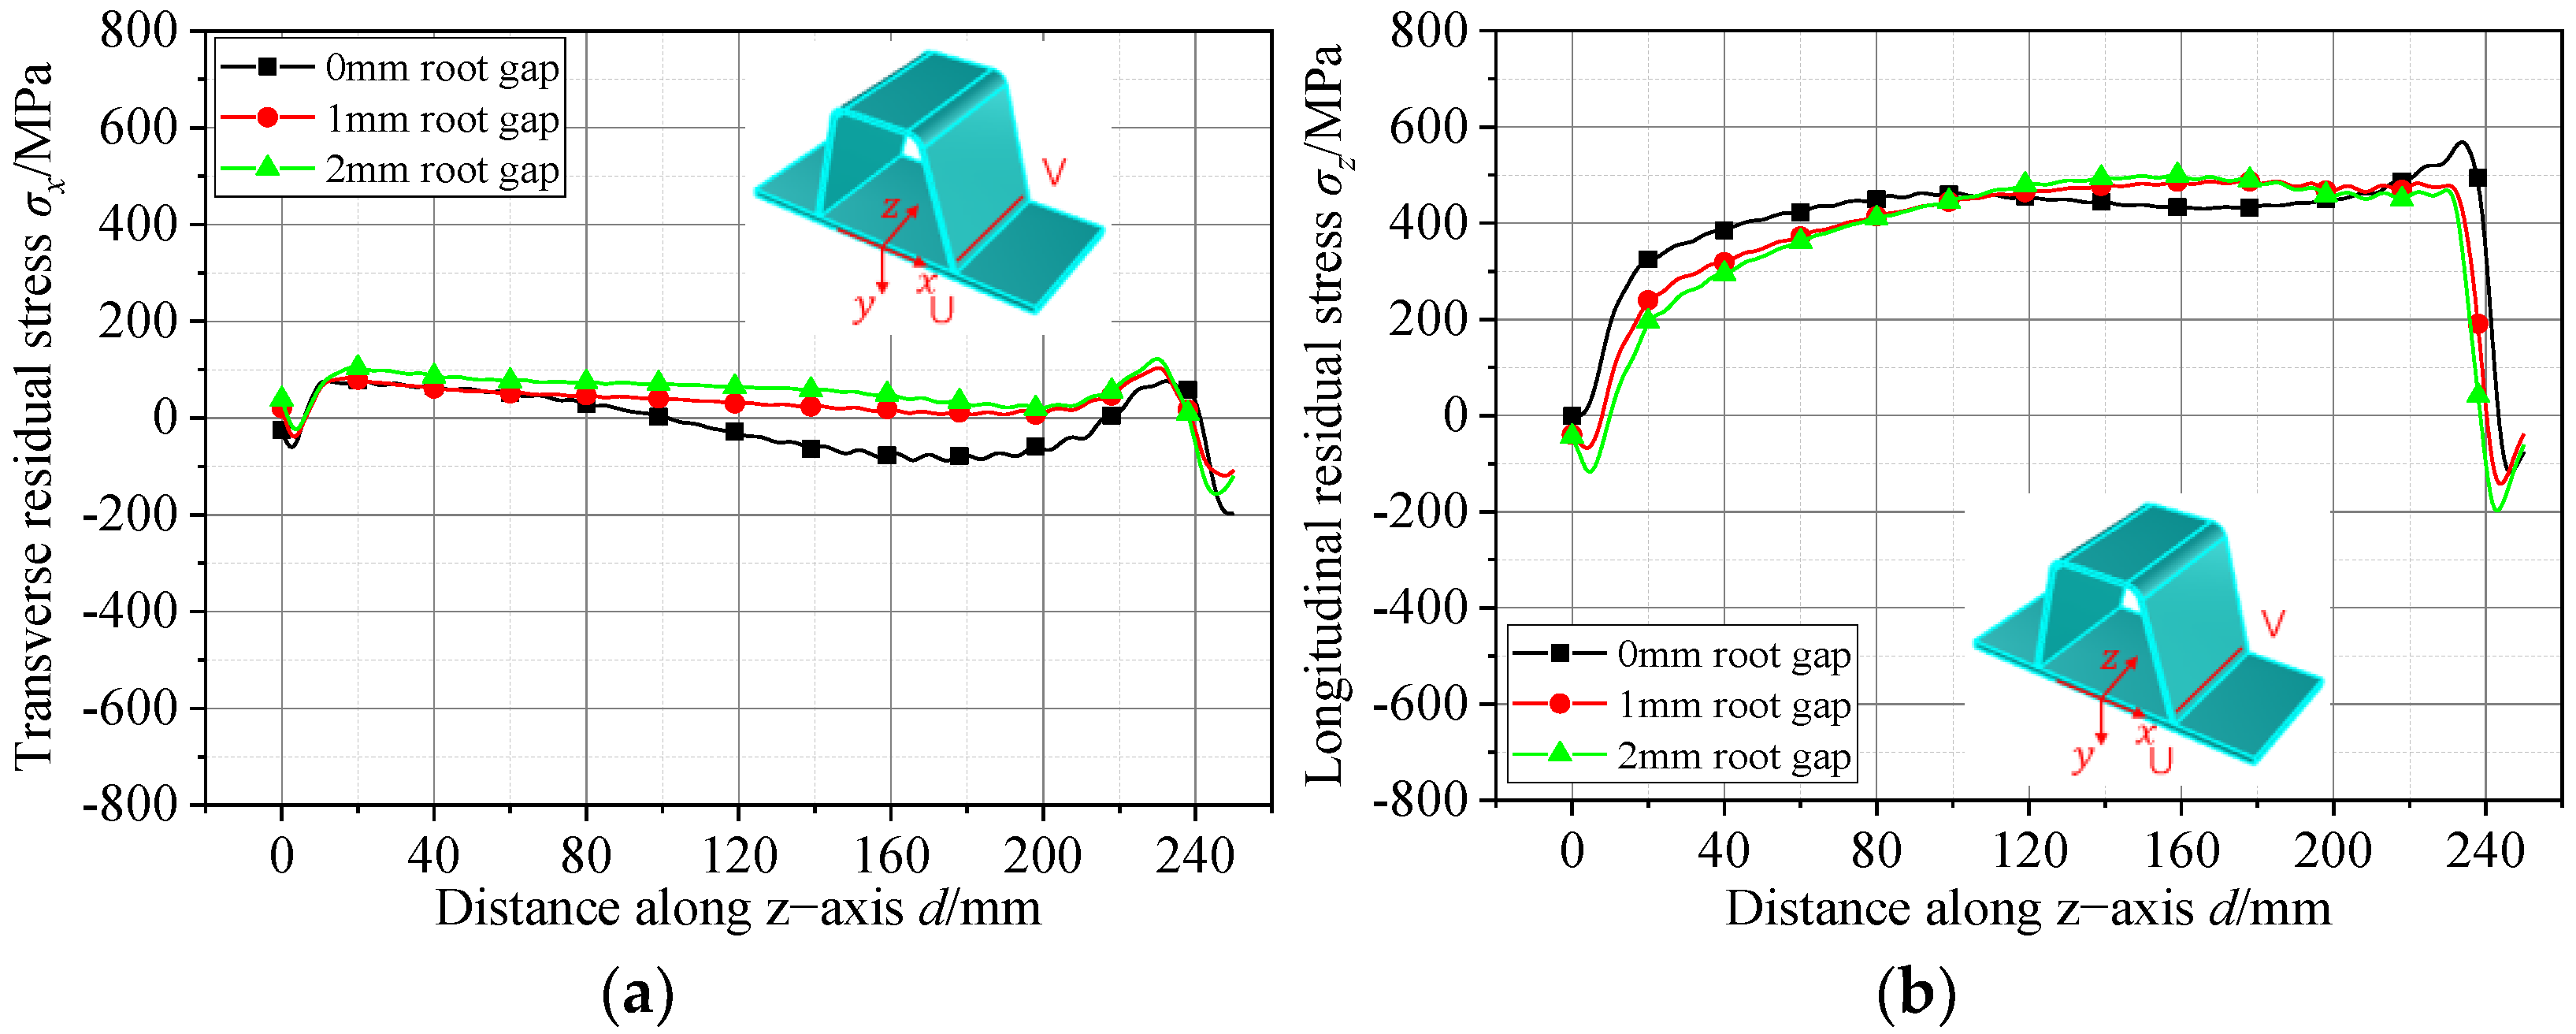
5.1. Effect of Root Gap on Residual Stresses

The European standard [25] specifies that when subjected to vehicle loads, U-ribs and deck plates must be joined using full-penetration groove fillet welds. Additionally, the unpenetrated portion between the deck plate and the U-rib should be less than 2 mm, and the gap between them should also be less than 2 mm, as illustrated in Figure 12, where parameter a represents the thickness of the deck plate and t represents the thickness of the U-rib plate.
To investigate the influence of different root gaps on the welding RS of the U-rib joint, three FE models with root gaps of 0, 1, and 2 mm were established. The welded specimens in this study utilized a root gap of 0 mm with the weld dimensions shown in Figure 1b. The weld dimensions corresponding to the other two root gaps are depicted in Figure 13a,b, respectively.
The weld seams of the U-rib joint exhibited high tensile RS and stress concentrations at the weld toe and root. Under cyclic wheel loads, fatigue cracks are prone to initiating and propagating at the weld toes (including the deck plate weld toe and the U-rib weld toe) and the weld root (solely the deck plate weld root). The influence of the weld root gap on the transverse and longitudinal RS in the deck plate are illustrated in Figure 14a–d. As shown in Figure 14a,b, the transverse RS distribution at the weld toe and root of the deck plate exhibited compressive stresses at two ends and tensile stresses in the central region. The weld root gap had a minor impact on the transverse RS distribution at the weld toe and root of the deck plate. Compared with the model with the 0 mm weld root gap, the peak transverse tensile RS in the models with 1 mm and 2 mm weld root gaps decreased by 12.5% and increased by 2.5%, respectively, as shown in Figure 14a, while it decreased by 21.9% and 17.4%, respectively, as shown in Figure 14b.
Figure 14c,d shows the longitudinal RS distributions at the weld toe and root of the deck plate, which were predominantly tensile stress across most regions. The weld root gap had minimal influence on the longitudinal RS distribution at the weld toe and root. Compared with the model with the 0 mm weld root gap, the peak longitudinal tensile RS in the models with 1 mm and 2 mm weld root gaps decreased by 8.1% and 5.1%, respectively, as shown in Figure 14c, while it decreased by 1.7% and increased by 5.9%, respectively, as shown in Figure 14d.
Figure 15a depicts the transverse RS distribution at the U-rib weld toe. The root gap of the weld seam had a negligible effect on the transverse RS distribution at the U-rib weld toe. Compared with the 0 mm weld root gap model, the peak transverse tensile RS increased by 3.5% and 6.1% for the models with 1 mm and 2 mm root gaps, respectively.
Figure 15b illustrates the longitudinal RS distribution at the U-rib weld toe. Similarly, the root gap of the weld seam exerted minimal influence on the longitudinal RS distribution at the U-rib weld toe. Compared with the 0 mm weld root gap model, the peak longitudinal tensile RS decreased by 14.9% and 13.1% for the models with 1 mm and 2 mm weld root gaps, respectively.

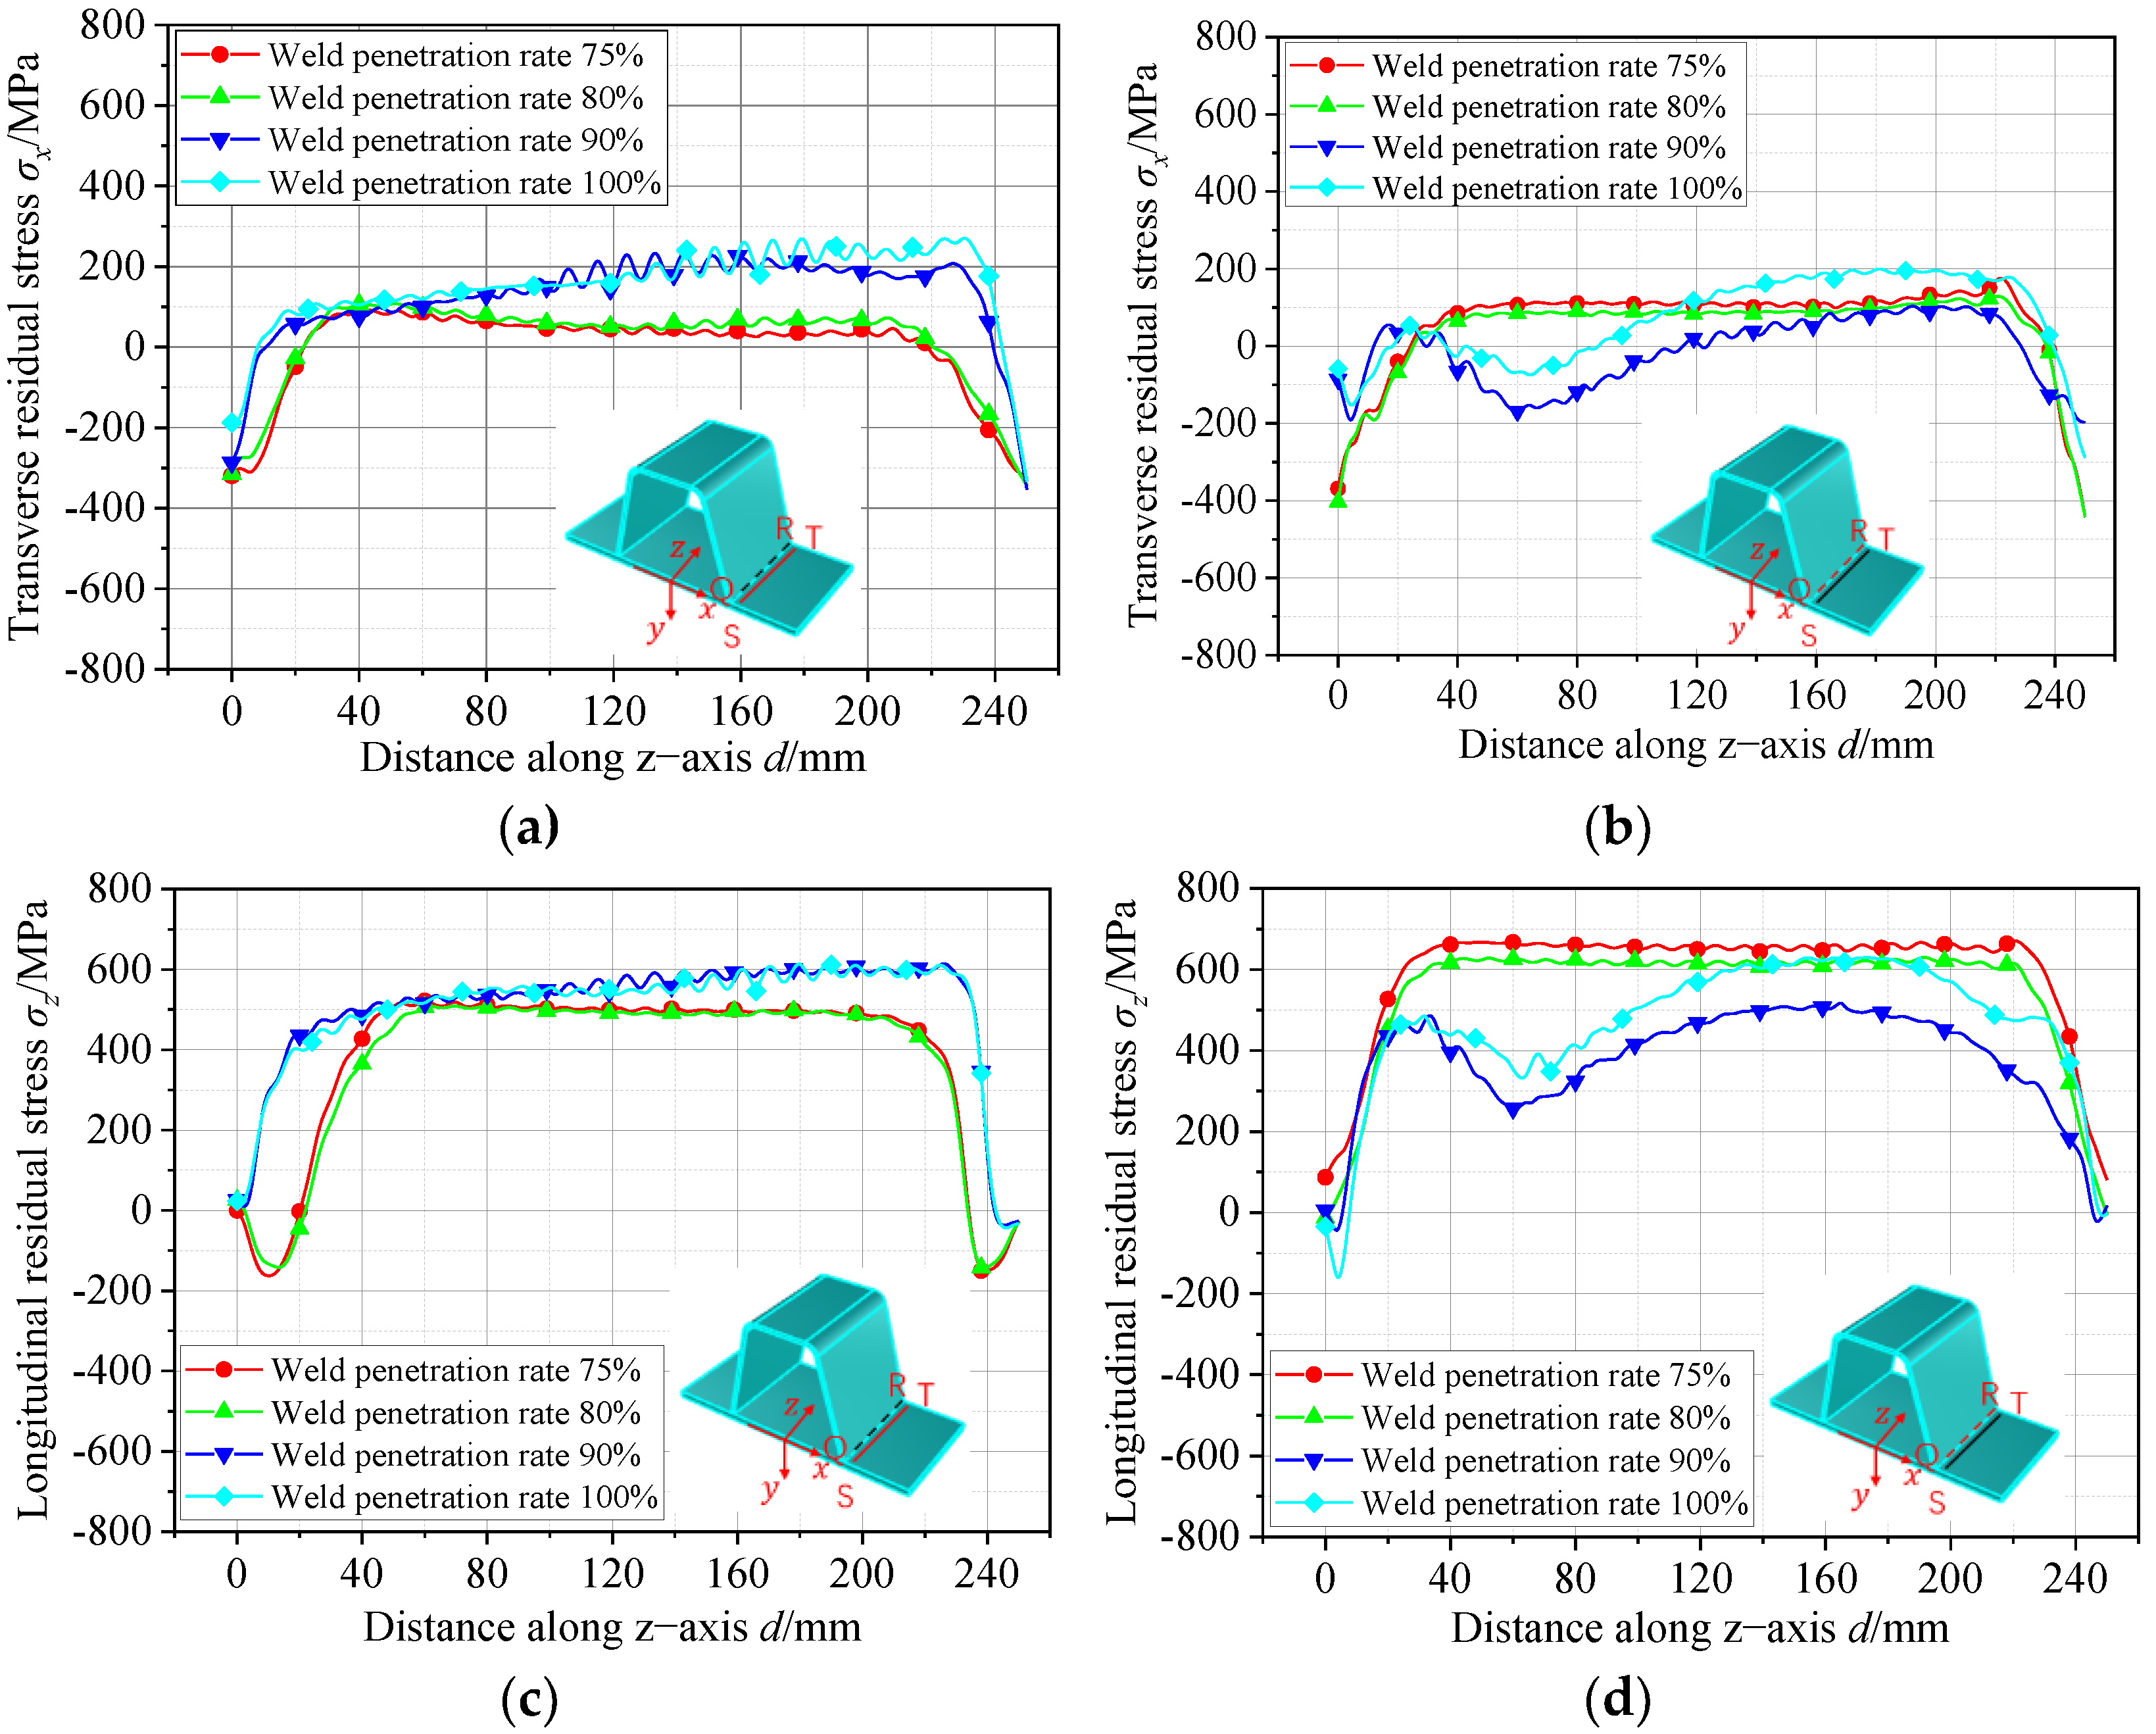
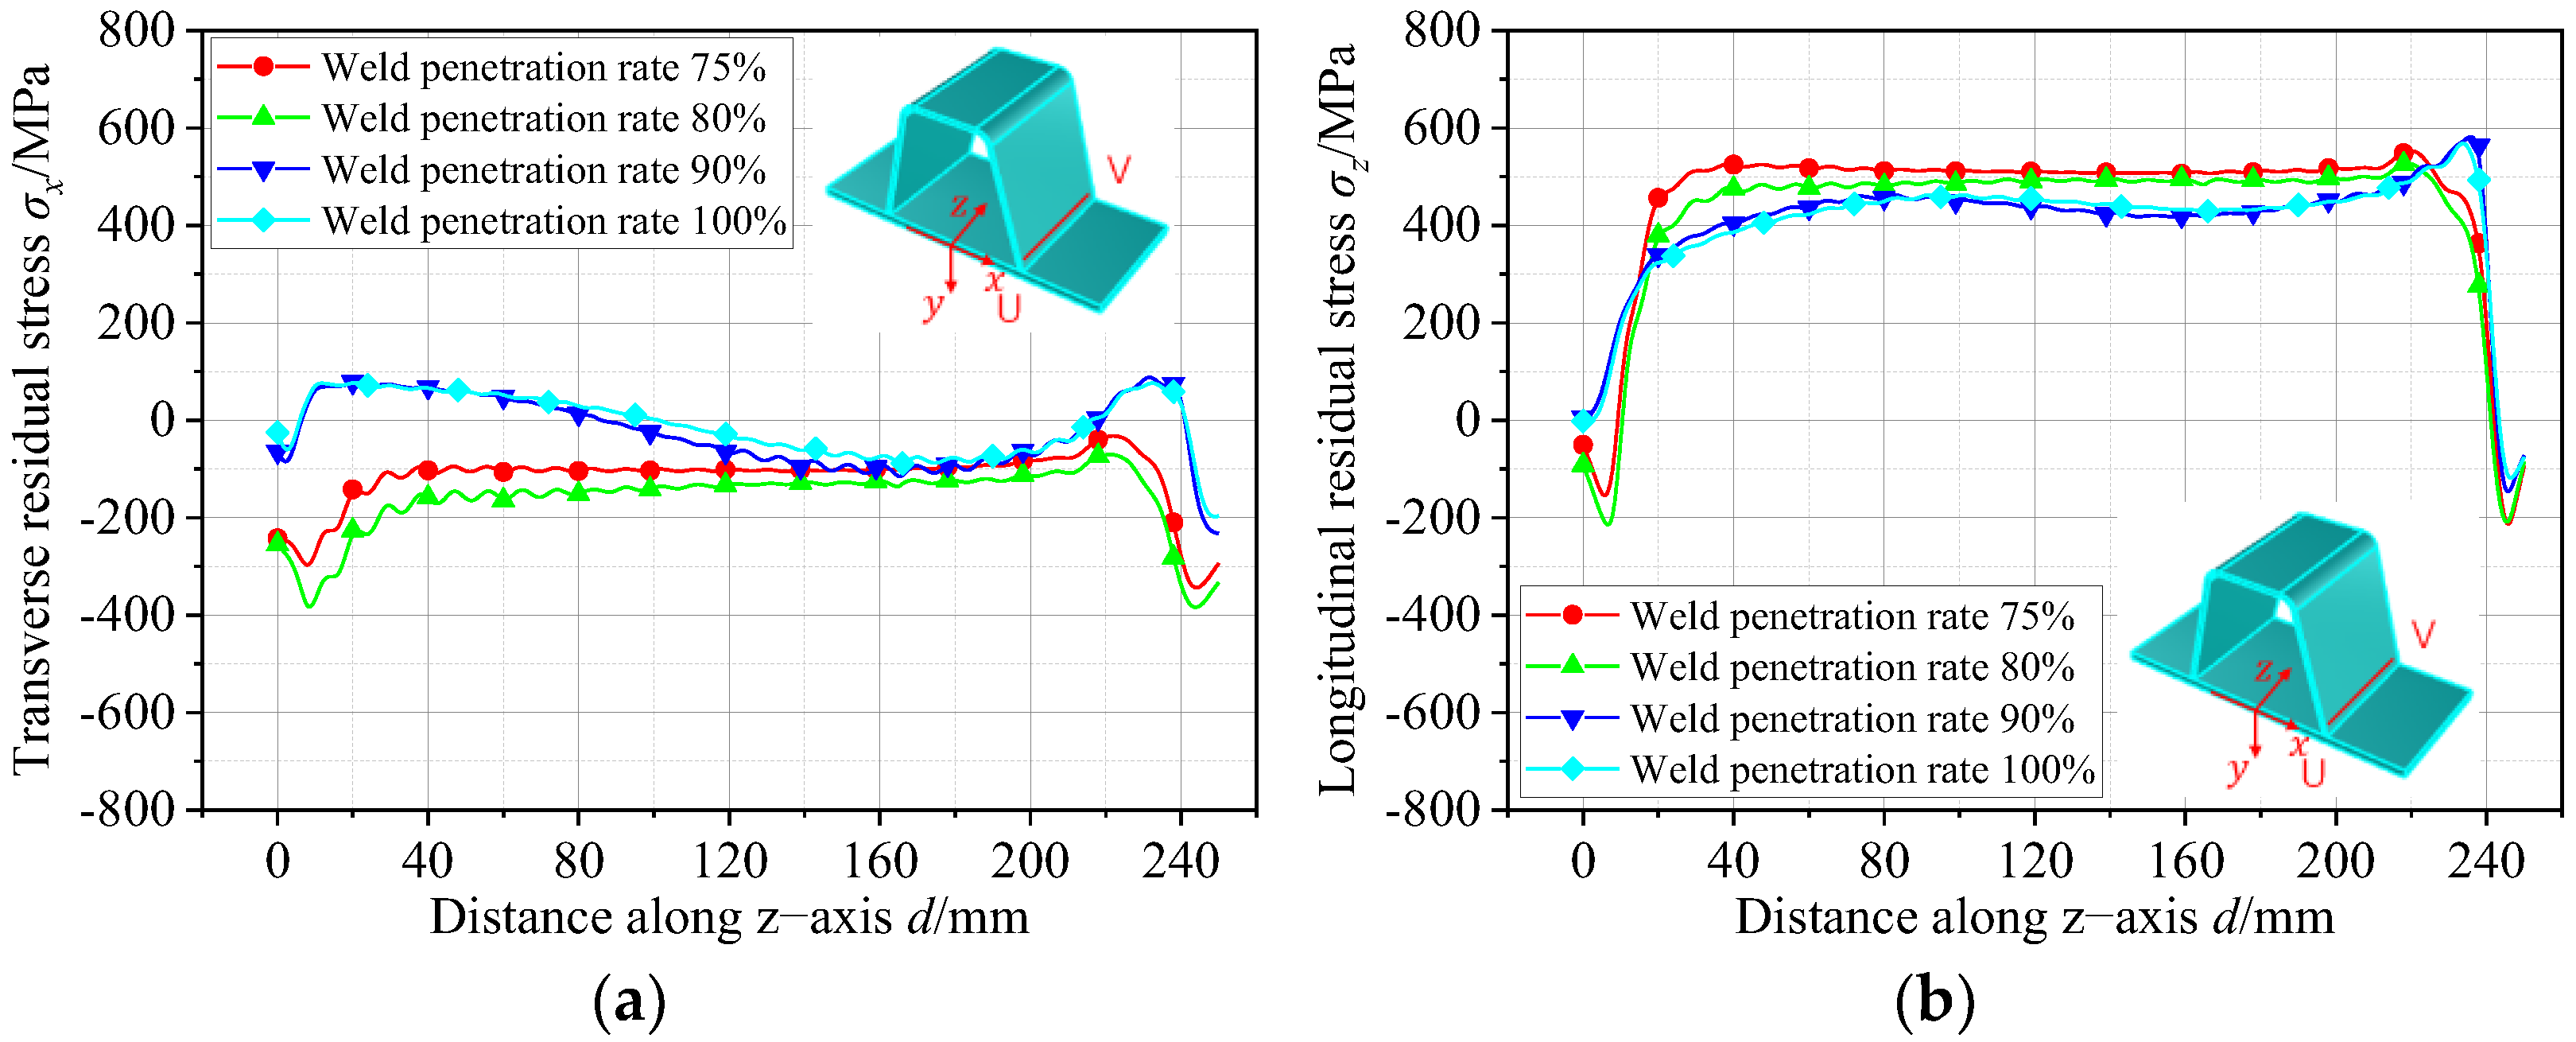
5.2. Effect of Weld Penetration Rate on Residual Stresses

According to Eurocode [25], when full penetration welding is adopted for a U-rib joint, the penetration depth should exceed 75% of the rib’s thickness. The AASHTO Code [26] specifies that full penetration welding is preferable for welding closed-section longitudinal stiffeners and top plates when the plate thickness is greater than 6.35 mm, and the penetration depth must exceed 80% of the longitudinal stiffener’s thickness. Additionally, China’s code for the design of highway steel structure bridges [27] requires that the penetration depth for welding closed-section longitudinal stiffeners to top plates should not be less than 80% of the plate thickness of the stiffener.
To investigate the influence of different penetration rates on the RS of U-rib joints, four FE models with penetration rates of 75%, 80%, 90%, and 100% were created. The test specimen in this study employed a 100% penetration rate, with the weld dimensions depicted in Figure 1b. The corresponding weld dimensions for the remaining three models with different penetration rates are shown in Figure 16a–c, respectively.
Figure 17a,b shows the distribution of the transverse RS at the weld toe and root of the deck plate, respectively. Compared with the model with 100% weld penetration, the peak transverse tensile RS at the weld toes in the models with 75%, 80%, and 90% weld penetration, as shown in Figure 17a, decreased by 66.8%, 61.0%, and 11.8%, respectively. Similarly, the peak transverse tensile RS at the weld roots in the models with 75%, 80%, and 90% weld penetration, as illustrated in Figure 17b, decreased by 10.5%, 35.3%, and 47.5%, respectively.
Figure 17c,d presents the distribution of the longitudinal RS at the weld toe and root of the deck plate, respectively. Compared with the model with 100% weld penetration, the peak longitudinal tensile RS at the weld toe in the models with 75%, 80%, and 90% weld penetration, as depicted in Figure 17c, decreased by 15.7%, 17.7%, and 0.2%, respectively. Meanwhile, at the weld root, the peak longitudinal tensile RS in the models with 75%, 80%, and 90% weld penetration, as shown in Figure 17d, exhibited increases of 6.8% and 0.3% and a decrease of 17.2%, respectively.
Figure 18a,b shows the effect of the weld penetration rates on the RS distribution at the U-rib weld toes. As is evident from Figure 18a, the models with 75% and 80% weld penetration exhibited compressive transverse RS, whereas the models with 90% and 100% weld penetration displayed tensile transverse RS within a short range at both ends. Compared with the model with 100% weld penetration, the peak transverse compressive RS at the U-rib weld toes increased by 74.2%, 97.4%, and 16.4% for the models with 75%, 80%, and 90% weld penetration, respectively.
Figure 18b demonstrates that the weld penetration rate had a negligible impact on the longitudinal RS distribution at the U-rib weld toes. When compared with the model with 100% weld penetration, the peak longitudinal tensile RS at the U-rib weld toes decreased by 3.5% and 8.1% and increased by 2.4% for the models with 75%, 80%, and 90% weld penetration, respectively.

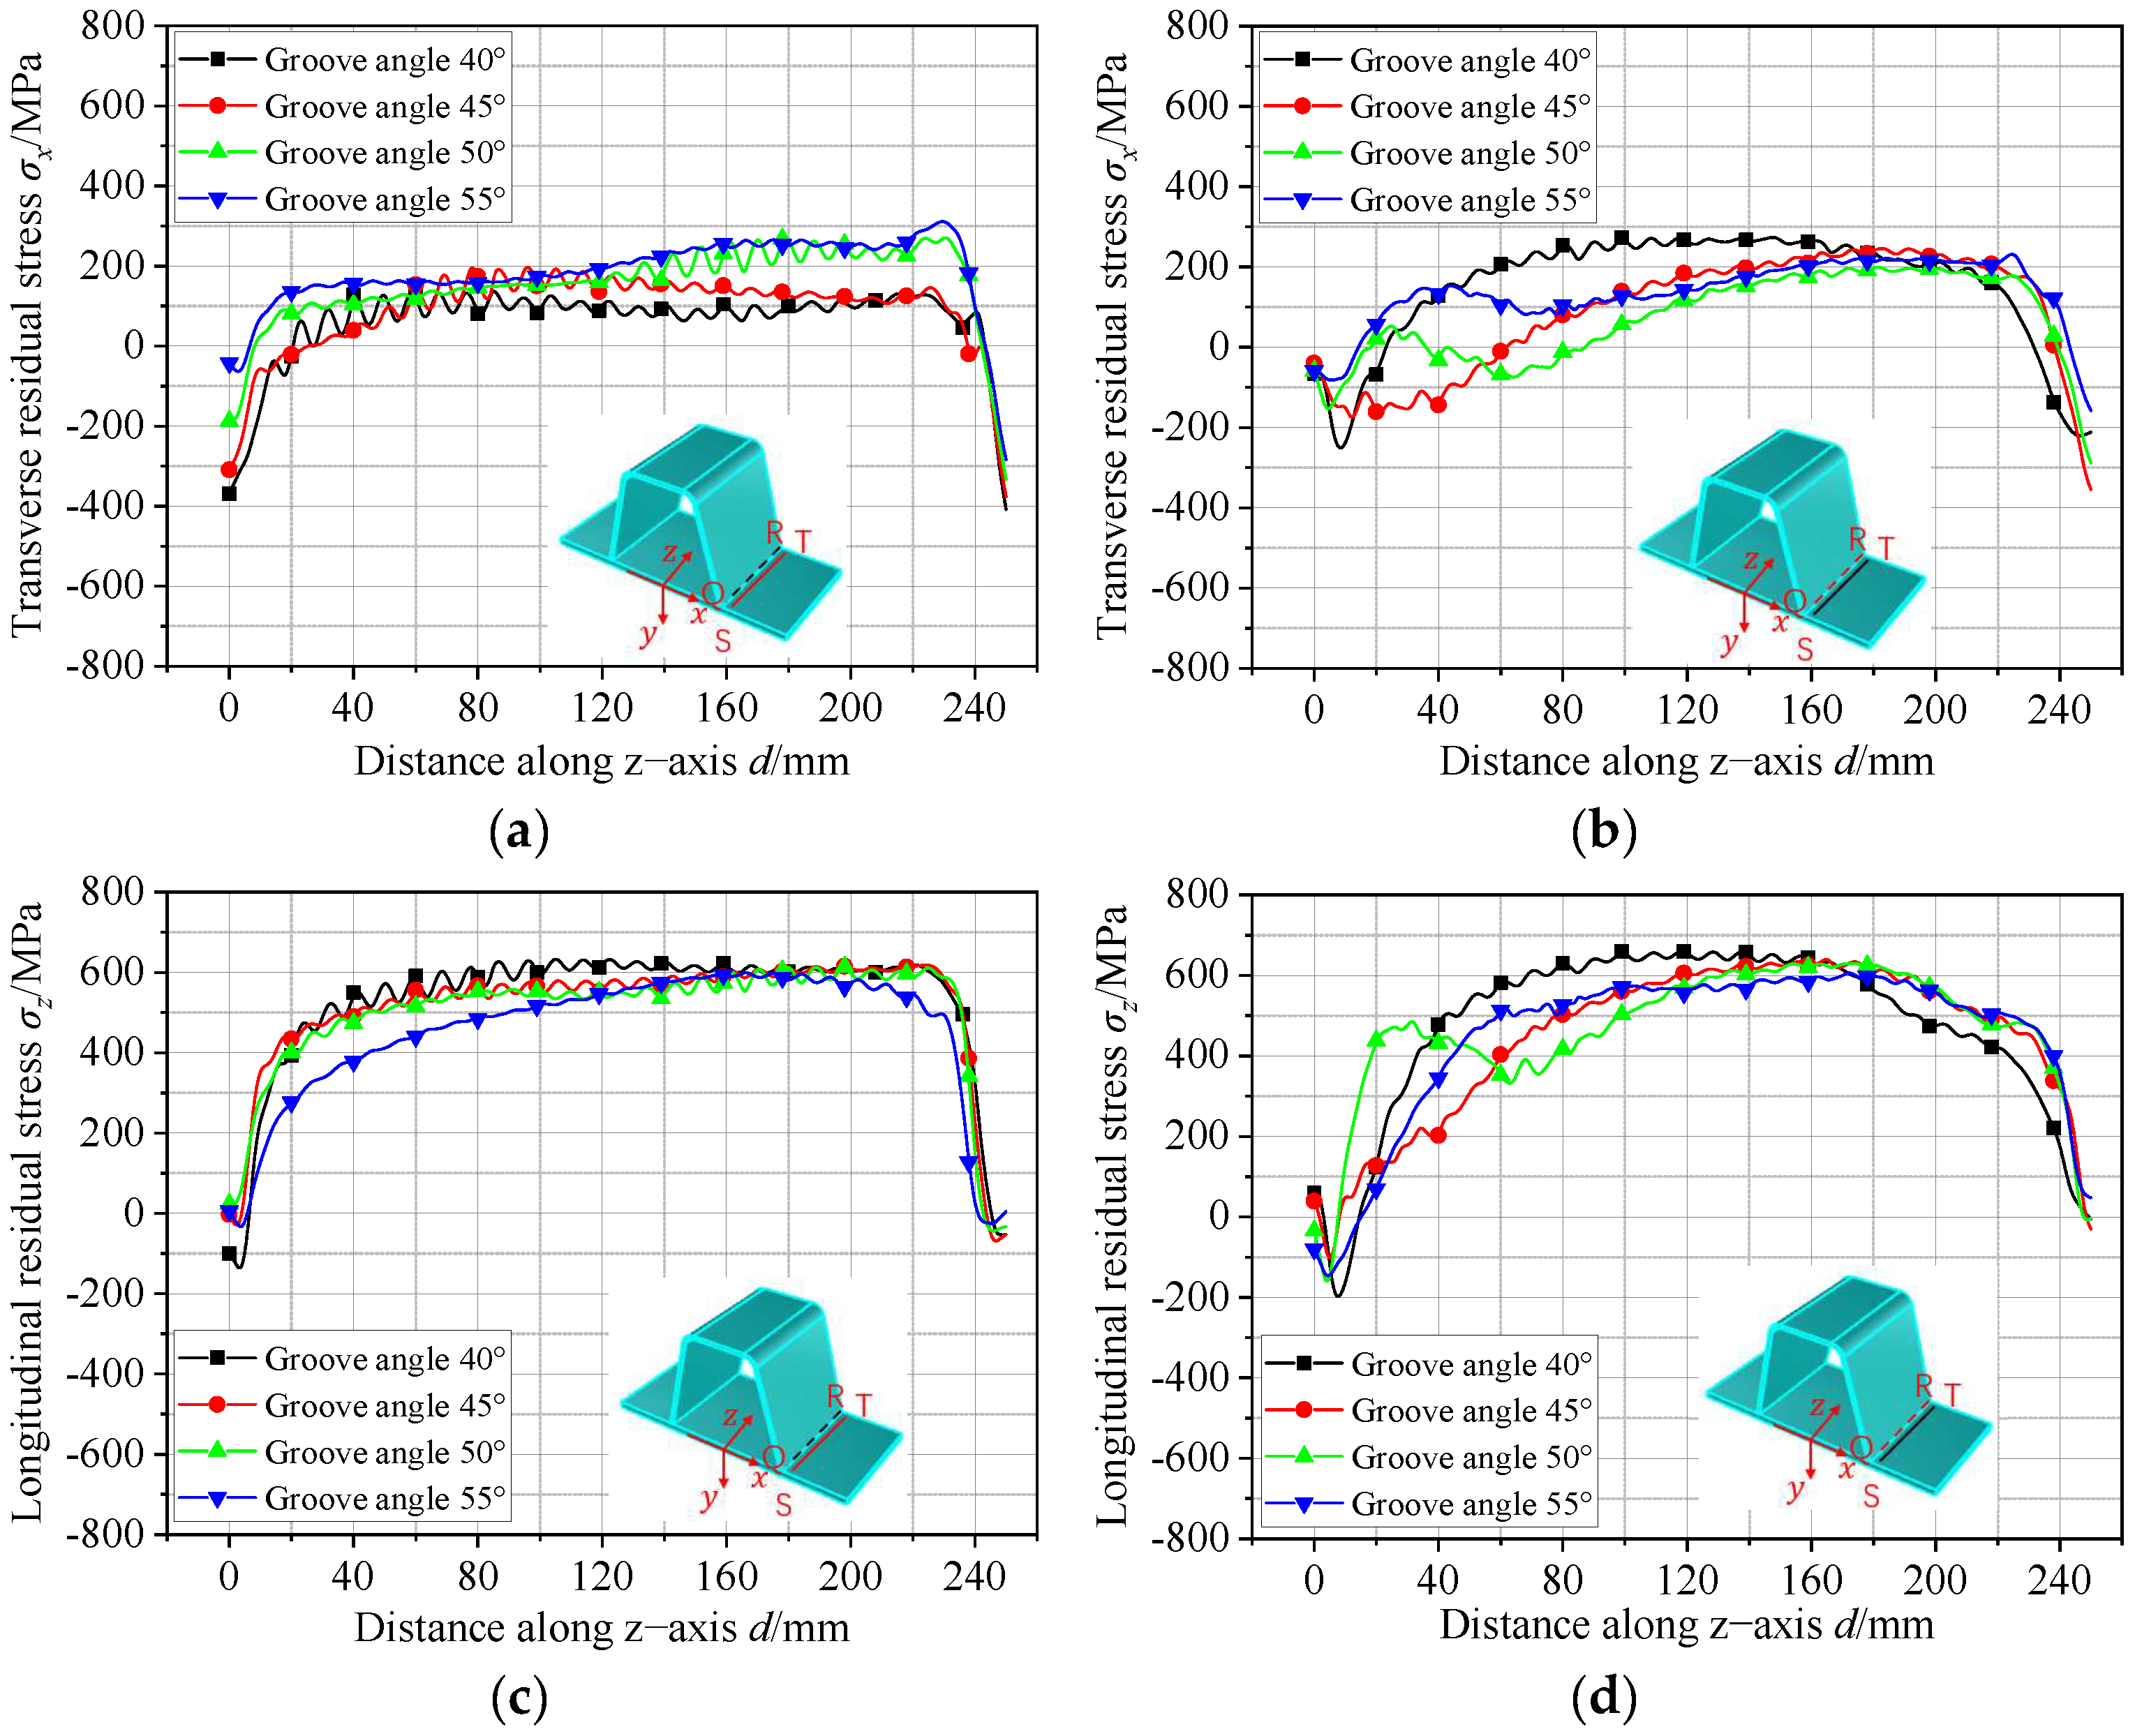
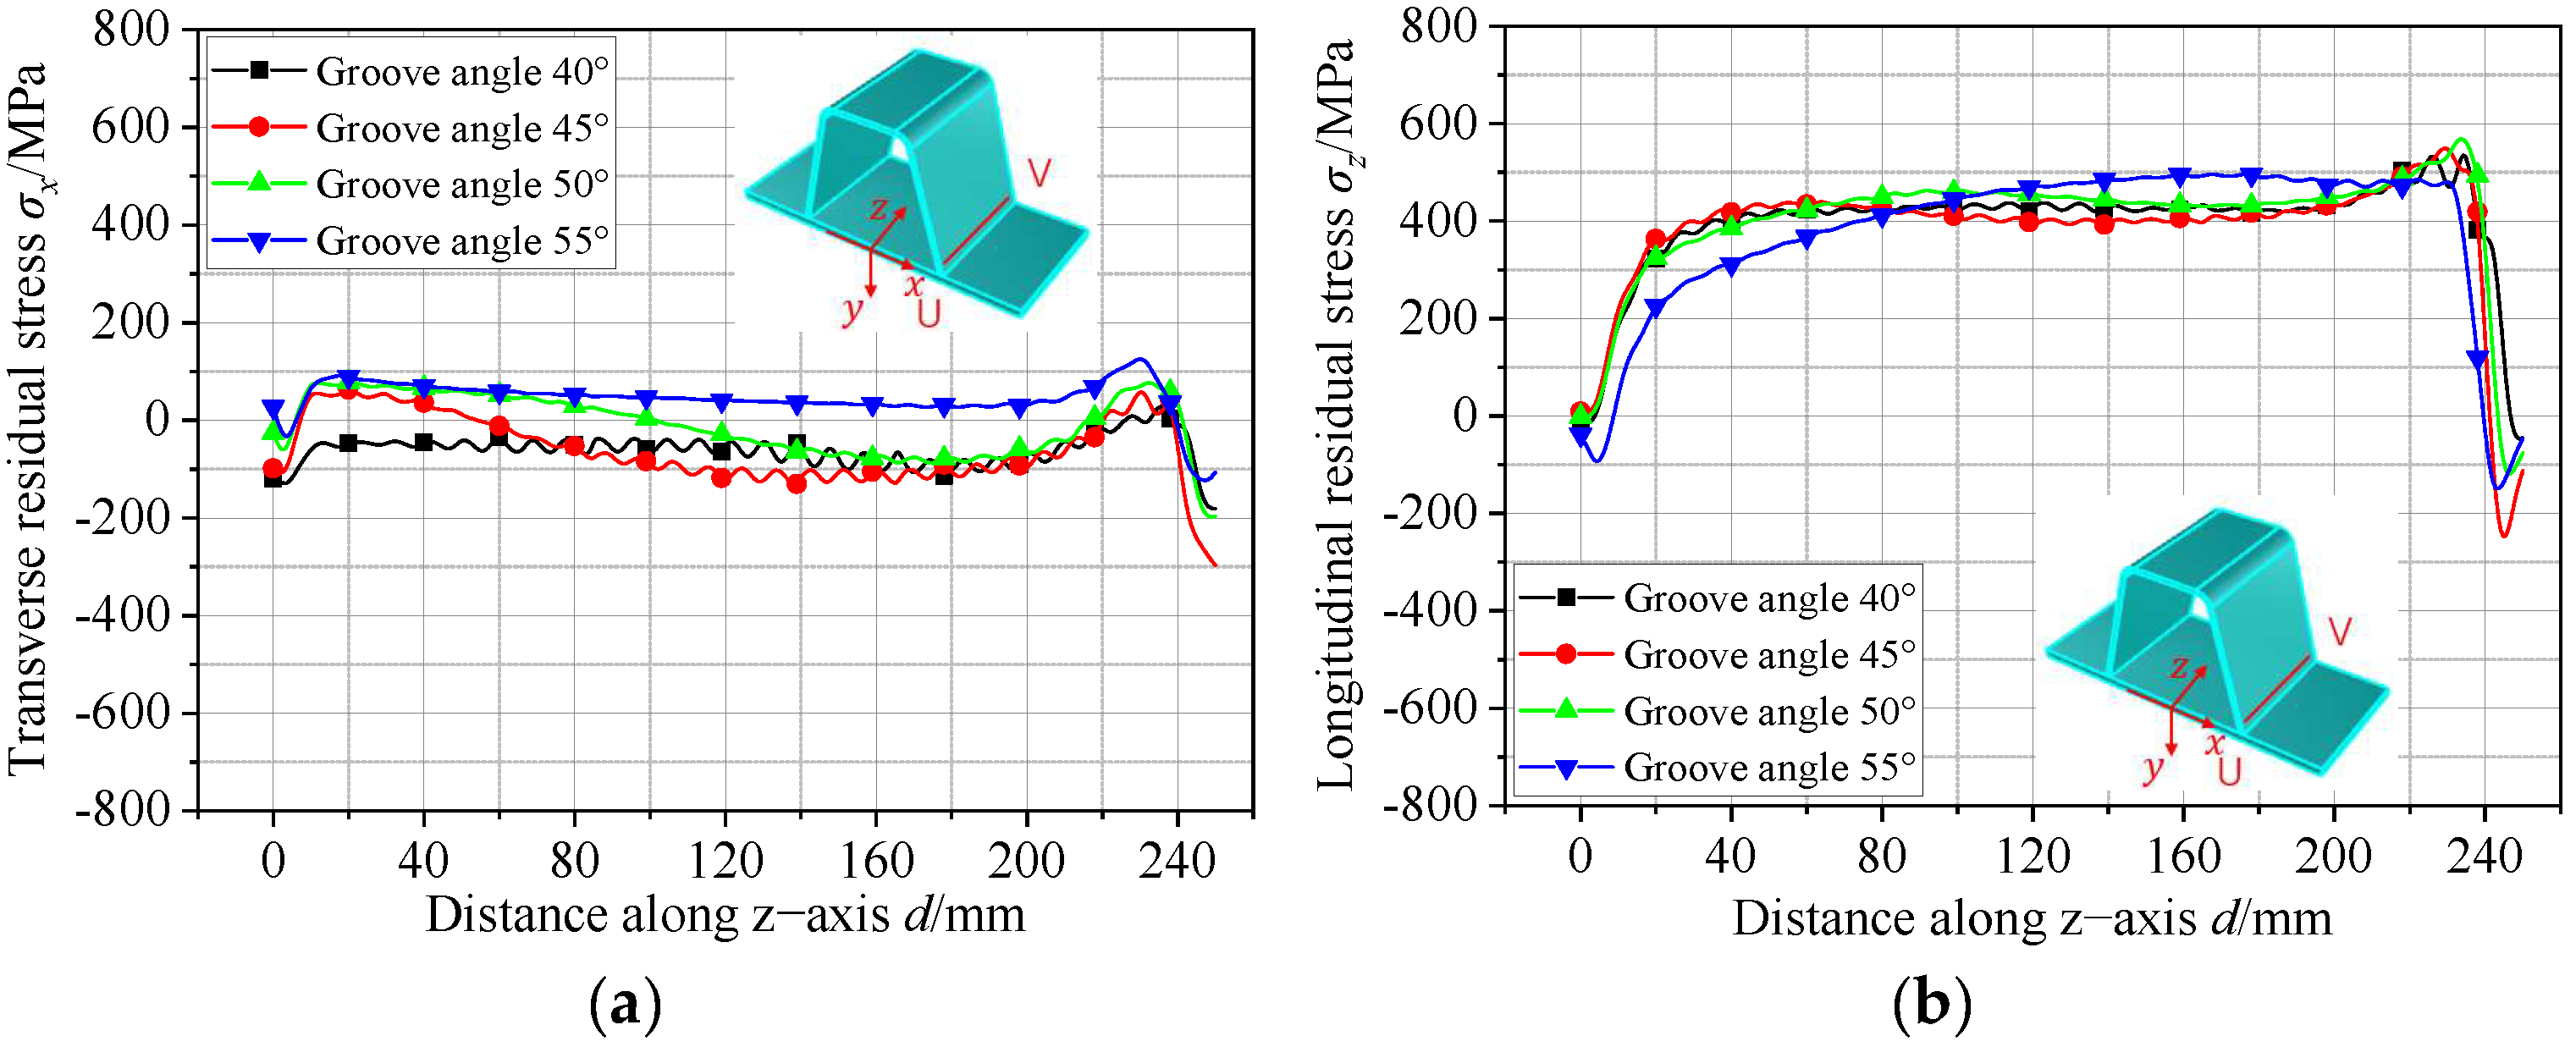
5.3. Effect of Groove Angle on Residual Stresses

Finite element models of U-rib joints with four different groove angles of 40°, 45°, 50°, and 55° were established. The test specimens in this study had a groove angle of 50°, and their dimensions are shown in Figure 1b. The dimensions of the weld for the U-rib joint models with other groove angles are presented in Figure 19a–c.
The effects of the weld groove angle on the distribution of the RS at the weld toe and root of the deck plate are illustrated in Figure 20a–d. As depicted in Figure 20a,b, when compared with the model with a weld groove angle of 40°, the peak values of the transverse tensile RS at the weld toe of the deck plate models with weld groove angles of 45°, 50°, and 55° increased by 46.0%, 93.1%, and 117.9%, respectively. Conversely, the peak values of the transverse tensile RS at the weld root decreased by 10.2%, 26.8%, and 15.0%, respectively.
Furthermore, as observed in Figure 20c,d, the peak values of the longitudinal tensile RS at the weld toe of the deck plate models with weld groove angles of 45°, 50°, and 55° decreased by 3.1%, 2.9%, and 5.8%, respectively, in comparison with the model with a 40° weld groove angle. Similarly, the peak values for the longitudinal tensile RS at the weld root decreased by 2.6%, 4.6%, and 7.8%, respectively, for the same range of weld groove angles.
The influence of weld groove angles on the transverse and longitudinal RSs at the weld toe of U-ribs are illustrated in Figure 21a,b. As depicted in Figure 21a, regarding the transverse RS distribution at the weld toe of U-ribs, compared with the model with a weld groove angle of 40°, the peak values for the transverse tensile RS at the weld toe for models with weld groove angles of 45°, 50°, and 55° increased by 86.4%, 127.9%, and 272.9%, respectively.
Furthermore, Figure 21b reveals the longitudinal RS distribution at the weld toe of U-ribs. Notably, the weld groove angle exhibited minimal influence on the longitudinal RS distribution at the weld toe. Specifically, compared with the model with a weld groove angle of 40°, the peak values for the longitudinal tensile RS at the weld toe for models with weld groove angles of 45°, 50°, and 55° exhibited a decrease of 0.1%, an increase of 3.6%, and a decrease of 10.4%, respectively.

6. Conclusions

This study investigated the welding RSs in U-rib joints by utilizing XRD and thermal-elastoplastic FEA. After validating the accuracy of the FEA, this study examined the influence of the weld root gap, weld penetration rate, and weld groove angle on the welding RSs of U-rib joints. Based on the experimental measurement and FEA results obtained, the following conclusions can be drawn:
(1) The magnitudes of the transverse RS at the weld toes and roots of the deck plate, as well as at the weld toes of the U-rib, were generally much smaller than those of the longitudinal RS. This suggests that longitudinal stresses dominate in these regions.
(2) The weld root gap had minimal influence on the peak values of either the transverse or longitudinal RS at the weld toes and roots of the deck plate, as well as at the weld toes of the U-rib.
(3) With an increase in the weld penetration rate, the peak transverse tensile RS at the weld toes of the deck plate rose significantly. However, it had a relatively minor impact on the peak transverse and longitudinal stresses in other locations.
(4) As the weld groove angle increased, the peak transverse tensile RS at the weld toes of the deck plate rose significantly. Conversely, the peak longitudinal tensile RS, as well as the transverse and longitudinal tensile RS at the weld roots, exhibited a slight decrease. At the weld toes of the U-rib, the peak transverse tensile RS increased slightly, while the peak longitudinal RS remained essentially unchanged.
In conclusion, our research offers profound insights into the factors influencing welding RSs in U-rib joints, with a specific focus on the distinct effects of the welding parameters on both transverse and longitudinal stresses, providing reference for the design and construction of steel bridges.

Author Contributions

Conceptualization, Z.H. and T.L.; methodology, T.L.; software, W.S.; validation, W.S. and J.S.; formal analysis, W.S. and Z.H.; investigation, J.S.; resources, H.C.; data curation, W.S.; writing—original draft preparation, Z.H.; writing—review and editing, T.L. and H.C.; supervision, T.L. and H.C.; project administration, T.L.; funding acquisition, T.L. All authors have read and agreed to the published version of the manuscript.

Funding

This research was funded by the National Natural Science Foundation of China, grant number 51908437.

Data Availability Statement

The original contributions presented in this study are included in the article. Further inquiries can be directed toward the corresponding author.

Conflicts of Interest

Authors Z.H. and J.S. were employed by the company First Engineering Co., Ltd., China Construction Third Bureau. The remaining authors declare that the research was conducted in the absence of any commercial or financial relationships that could be constructed as a potential conflict of interest.

References

  1. Jiang, F.; Fu, Z.; Ji, B. Fatigue life evaluation of deck to U-rib welds in orthotropic steel deck integrating weldment size effects on welding residual stress. Eng. Fail. Anal. 2021, 124, 105359. [Google Scholar] [CrossRef]
  2. Wang, Q.; Ji, B.; Li, C. Fatigue evaluation of rib-deck welds: Crack-propagation-life predictive model and parametric analysis. J. Constr. Steel Res. 2020, 173, 106248. [Google Scholar] [CrossRef]
  3. Wu, J.; Qiang, B.; Liao, X. Experimental investigation and numerical simulation of welding residual stress in the orthotropic steel deck with diaphragm considering solid-state phase transformation. Eng. Struct. 2022, 250, 113415. [Google Scholar] [CrossRef]
  4. Chen, J.; Wei, C.; Zhao, Y. Fatigue resistance of orthotropic steel deck system with double-side welded rib-to-deck joint. Adv. Struct. Eng. 2023, 26, 952–965. [Google Scholar] [CrossRef]
  5. Chen, F.; Zhang, H.; Li, Z.; Luo, Y.; Xiao, X.; Liu, Y. Residual stresses effects on fatigue crack growth behavior of rib-to-deck double-sided welded joints in orthotropic steel decks. Adv. Struct. Eng. 2024, 27, 35–50. [Google Scholar] [CrossRef]
  6. Matos, J.C.; Nicoletti, V.; Kralovanec, J.; Sousa, H.S.; Gara, F.; Moravcik, M.; Morais, M.J. Comparison of Condition Rating Systems for Bridges in Three European Countries. Appl. Sci. 2023, 13, 12343. [Google Scholar] [CrossRef]
  7. Issa, M.A.; Shumin, T.; Yousif, A. Application of knowledge-based expert systems for rating highway bridges. Eng. Fract. Mech. 1995, 50, 923–934. [Google Scholar] [CrossRef]
  8. Boulton, N.S.; Lance Martin, H.E. Residual Stresses in Arc-Welded Plates. Proc. Inst. Mech. Eng. 1936, 133, 295–347. [Google Scholar] [CrossRef]
  9. Ueda, Y.; Fukuda, K.; Nakacho, K. A New Measuring Method of Residual Stresses with the Aid of Finite Element Method and Reliability of Estimated Values. Trans. JWRI 1975, 4, 123–131. [Google Scholar] [CrossRef]
  10. Kainuma, S.; Young-Soo, J.; Yang, M.Y. Welding residual stress in roots between deck plate and U-rib in orthotropic steel decks. Measurement 2016, 92, 475–482. [Google Scholar] [CrossRef]
  11. Kong, W.; Huang, W.; Wei, Y. Numerical study on welding residual stress of double-sided submerged arc welding for orthotropic steel deck. Eng. Struct. 2024, 302, 117445. [Google Scholar] [CrossRef]
  12. Wang, Q.; Ji, B.; Fu, Z. Experimental study on the determination of welding residual stress in rib-deck by sharp indentation testing. Thin-Walled Struct. 2021, 161, 107516. [Google Scholar] [CrossRef]
  13. Liu, X.; Qiang, B.; Wu, H. Distribution and relaxation of welding residual stress in U-rib-to-deck joints considering actual material properties. Thin-Walled Struct. 2022, 180, 109747. [Google Scholar] [CrossRef]
  14. Li, Y.; Wu, J.; Qiang, B. Measurement of residual stresses in a welded orthotropic steel deck by the hole-drilling method considering stress biaxiality. Eng. Struct. 2021, 230, 111690. [Google Scholar] [CrossRef]
  15. Wang, F.; Lyu, Z.; Zhao, Z. Experimental and numerical study on welding residual stress of U-rib stiffened plates. J. Constr. Steel Res. 2020, 175, 106362. [Google Scholar] [CrossRef]
  16. Inspection and Quarantine of the People’s Public of China. Non-Destructive Testing-Practice for Residual Stress Measurement by X-Ray, General Administration of Quality Supervision; Inspection and Quarantine of the People’s Public of China: Beijing, China, 2017.
  17. Qiang, B.; Li, Y.D.; Yao, C.R. Through-thickness Welding Residual Stress and Its Effect on Stress Intensity Factors for Semi-elliptical Surface Cracks in a Butt-welded Steel Plate. Eng. Fract. Mech. 2018, 193, 17–31. [Google Scholar] [CrossRef]
  18. Goldak, J.; Chakravarti, A.; Bibby, M. A New Finite Element Model for Welding Heat Sources. Metall. Mater. Trans. B 1984, 15, 299–305. [Google Scholar] [CrossRef]
  19. Attarha, M.J.; Sattari-Far, I. Study on Welding Temperature Distribution in Thin Welded Plates Through Experimental Measurements and Finite Element Simulation. J. Mater. Process. Technol. 2011, 211, 688–694. [Google Scholar] [CrossRef]
  20. Qiang, B.; Wang, X. Evaluating Stress Intensity Factors for Surface Cracks in an Orthotropic Steel Deck Accounting for the Welding Residual Stresses. Theor. Appl. Fract. Mech. 2020, 110, 102827. [Google Scholar] [CrossRef]
  21. Gu, Y.; Li, Y.; Zhou, Z. Numerical simulation and measurement of welding residual stresses in orthotropic steel decks stiffened with U-shaped ribs. Int. J. Steel Struct. 2020, 20, 856–869. [Google Scholar] [CrossRef]
  22. Wang, H.; Qin, S.; Wang, B. Welding-indued residual stresses in U-ribs of a steel bridge deck. Period. Polytech. Civ. Eng. 2021, 65, 1239–1246. [Google Scholar]
  23. Yang, H.; Wang, P.; Qian, H. An experimental investigation into fatigue behaviors of single- and double-sided U rib welds in orthotropic bridge decks. Int. J. Fatigue 2022, 159, 106827. [Google Scholar] [CrossRef]
  24. Qiang, B.; Xie, Y.; Xie, Q. Influence of post-weld heat treatment on welding residual stress in U-rib-to-deck joint. Thin-Walled Struct. 2024, 196, 111550. [Google Scholar] [CrossRef]
  25. European Committee for Standardization. EN 1993-2: Eurocode 3—Design of Steel Structures—Part 2: Steel Bridges; CEN: Brussels, Belgium, 2012. [Google Scholar]
  26. American Association of State Highway and Transportation of Officials. LRFD Bridge Design Specifications, 3rd ed.; AASHTO: Washington, DC, USA, 2012. [Google Scholar]
  27. Ministry of Transport of the People’s Republic of China. Specifications for Design of Highway Steel Bridge; China Communications Press: Beijing, China, 2015.
Figure 1. Dimensions and weld details of the U-rib joint specimens (unit: mm). (a) Dimensions and notation. (b) Weld details.
Buildings 15 00262 g001
Figure 2. Thermocouple arrangement diagram (unit: mm).
Buildings 15 00262 g002
Figure 3. Residual stress measurement (unit: mm). (a) X-ray diffraction equipment. (b) Measured points.
Buildings 15 00262 g003
Figure 4. Mesh model. (a) Global mesh. (b) Mesh of the weld.
Buildings 15 00262 g004
Figure 5. Double-ellipsoid heat source model.
Buildings 15 00262 g005
Figure 6. Thermo-physical properties of steels.
Buildings 15 00262 g006
Figure 7. Thermodynamic properties of steels.
Buildings 15 00262 g007
Figure 8. Boundary conditions of the RS analysis.
Buildings 15 00262 g008
Figure 9. Comparison of temperatures between experimental measurement and FEA. (a) Thermocouples at the deck plate. (b) Thermocouples at the U-rib. (c) Thermocouples at the U-rib.
Buildings 15 00262 g009
Figure 10. Comparison of longitudinal residual stresses on deck plate: (a) perpendicular to the weld seam direction (left side), (b) perpendicular to the weld seam direction (right side), (c) parallel to the weld seam direction (left side), and (d) parallel to the weld seam direction (right side).
Buildings 15 00262 g010
Figure 11. Comparison of longitudinal residual stresses at the weld toe of U-rib: (a) perpendicular to the weld seam direction (left side), (b) perpendicular to the weld seam direction (right side), (c) parallel to the weld seam direction (left side), and (d) parallel to the weld seam direction (right side).
Buildings 15 00262 g011
Figure 12. Construction requirement of weld root gap.
Buildings 15 00262 g012
Figure 13. Weld sizes for different root gap FE models. (a) Weld root gap = 1 mm. (b) Weld root gap = 2 mm.
Buildings 15 00262 g013
Figure 14. Comparison of residual stresses at the deck plate weld toe and root: (a) transverse residual stress at weld toe; (b) transverse residual stress at weld root; (c) longitudinal residual stress at weld toe; and (d) longitudinal residual stress at weld root.
Buildings 15 00262 g014aBuildings 15 00262 g014b
Figure 15. Comparison of residual stresses at the U-rib weld toe: (a) transverse residual stress and (b) longitudinal residual stress.
Buildings 15 00262 g015
Figure 16. Sizes of weld models with different weld penetration rates: (a) 75%; (b) 80%; and (c) 90%.
Buildings 15 00262 g016
Figure 17. Comparison of residual stresses at the deck plate: (a) transverse residual stress at weld toe; (b) transverse residual stress at weld root; (c) longitudinal residual stress at weld toe; and (d) longitudinal residual stress at weld root.
Buildings 15 00262 g017
Figure 18. Comparison of residual stresses at the U-rib weld toe: (a) transverse residual stress and (b) longitudinal residual stress.
Buildings 15 00262 g018
Figure 19. Weld sizes of U-rib models with different groove angles: (a) 40%; (b) 45%; and (c) 55%.
Buildings 15 00262 g019
Figure 20. Comparison of residual stress at the deck plate. (a) Transverse residual stress at the weld toe. (b) Transverse residual stress at the weld root. (c) Longitudinal residual stress at the weld toe. (d) Longitudinal residual stress at the weld root.
Buildings 15 00262 g020
Figure 21. Comparison of residual stress on the U-rib. (a) Transverse residual stress at weld toe. (b) Longitudinal residual stress at weld toe.
Buildings 15 00262 g021
Table 1. Welding process parameters.
Welding Pass
No.
Welding Current
(A)
Welding Voltage
(V)
Welding Speed
(mm/s)
1, 3140232.10
2, 4140233.13
Table 2. Heat source parameters.
Welding Pass
No.
b
(mm)
c
(mm)
af
(mm)
ar
(mm)
1, 32.977.422.975.94
2, 45.786.525.7811.56
Disclaimer/Publisher’s Note: The statements, opinions and data contained in all publications are solely those of the individual author(s) and contributor(s) and not of MDPI and/or the editor(s). MDPI and/or the editor(s) disclaim responsibility for any injury to people or property resulting from any ideas, methods, instructions or products referred to in the content.

