Abstract
To predict the mid-span deflection and crack width of reinforced ultra-high-performance concrete (R-UHPC) shallow T-shaped beams, a simplified analysis model comprising a bilinear curve with several characterization points is proposed in this paper. The proposed model is distinguished from existing deflection and crack width prediction methods by its consideration of several significant factors, including the tensile stiffening effect, tension contribution of UHPC post-cracking, nonconstant bond behavior of the interface, and shrinkage and creep effect. To obtain closed-form solutions, the proposed simplified analysis model directly incorporates the bond properties from bond tests, thereby eliminating the reliance on constant bond stress simplification and the subsequent necessity for member calibration, which is commonly required in existing design codes for UHPC-based structures. To validate the proposed model, six reinforced UHPC shallow T-shaped specimens with dimensions of 3.7 m × 0.7 m × 0.22 m, varying reinforcement ratios and fiber types within UHPC, are utilized and tested statically under four-point bending conditions. The experimental values obtained from these tests are then compared with the theoretical calculations derived from the simplified analysis model. The ratios of mid-span deflections and crack widths at reinforcement yielding, calculated using the simplified analysis model, to the counterparts from experimental values are found to be within a range of 0.9 and 0.95, respectively. The average percentage of differences between experimental and predicted values for the deflections and crack widths at reinforcement yielding are 4.2% and 5.8%, respectively. These findings demonstrate that the simplified analysis model proposed is accessible and accurate for predicting the deflection and crack width of reinforced UHPC shallow T-shaped beams, which has the potential to be a valuable reference for the design and calculation of such beams.
1. Introduction
Steel–concrete composite beams can fully utilize the advantages of each material, presenting significant economic benefits [1]. However, an excessive self-weight and a tendency to easily crack the concrete deck in a negative moment zone will be some challenges, which limits the application of steel–concrete composite beams to large-span bridges [2,3,4]. Ultra-high-performance concrete (UHPC) is a newly developed type of fiber-reinforced cementitious composite material characterized by exceptionally high toughness and long-term durability [5,6,7,8,9]. Recent advancements in the field of sustainable innovations in UHPC have garnered increased attention, with researchers focusing on the utilization of industrial by-products to enhance the mechanical properties and environmental performance of UHPC [10]. Combining the mechanically and environmentally enhanced UHPC with steel beams can reduce the self-weight of the structure and enhance its spanning capabilities, potentially addressing the technical challenges of traditional steel–concrete composite beam bridges and expanding their range of applications [11,12,13].
In recent years, there has been an increasing utilization of UHPC in the field of steel–concrete composite beam bridges, particularly in the context of waffle-type UHPC bridge decks. This trend is driven by the urgent motivation to enhance the strength of waffle concrete decks and address the issue of premature cracking observed in such mechanically insufficient concrete elements [14,15]. Compared to normal concrete, the increased strength and ductility of UHPC result in a reduction in material consumption and structure weight for waffle deck construction under the same loading conditions. Consequently, the utilization of UHPC is particularly pertinent and widespread in lightweight waffle deck configurations. As a result, UHPC can be cast in a thinner thickness or depth than traditional concrete to produce a shallow bridge deck. However, this reduction in thickness will inevitably lead to a compromise in the flexural stiffness of the cross-section and the crack resistance of the shallow bridge deck. The waffle-type UHPC bridge decks are structurally composed of reinforced UHPC shallow beams with T-shaped cross-sections in a separate direction, namely reinforced UHPC shallow T-shaped beams. The crack resistance and crack evolution mechanisms of the aforementioned reinforced UHPC shallow T-shaped beam are fundamental from both a structural safety and a serviceability perspective. This is due to the fact that excessive deflections and crack widths under service loads will significantly impair the long-term functionality and durability of these shallow structures.
For reinforced UHPC shallow T-shaped beams, the volume fraction of steel fibers within UHPC is relatively high, resulting in its crack resistance and crack evolution mechanism that differs considerably from traditional reinforced concrete beams. Accordingly, it is crucial to investigate the crack evolution mechanism of reinforced UHPC shallow T-shaped beams and develop a simplified analysis method of crack width, for enhancing the crack resistance of lightweight composite bridges with waffle UHPC decks and for advancing engineering applications. Consequently, to efficiently assess the crack resistance and crack evolution, it is imperative to accurately predict the deflections and crack widths of reinforced UHPC shallow T-shaped beams. The prevailing methodologies for calculating crack width and deflection of UHPC elements employ either experimental parameter fitting or the iteration solution of classic analytical formulas for ordinary concrete, which are relatively labor-intensive or time-consuming.
Numerous studies have been conducted on the mechanical properties of reinforced UHPC flexural specimens, and notable advancements have been achieved in the exploration of crack-relevant behaviors. Zheng et al. [16,17] devised flexural experiments for RPC rectangular beams reinforced steel bars and GFRP bars, respectively, and a formula for calculating crack width has been derived by considering the tension action and analyzing the distribution and propagation of cracks. Furthermore, Kwahk et al. [18] and Leutbecher et al. [19] examined the bond behavior between reinforcement and UHPC and presented revisions to the calculation formulas of crack width for reinforced UHPC rectangular beam. Xu et al. [20] conducted flexural tests of two non-prestressed and six prestressed T-shaped UHPC beams to investigate crack resistance and crack development. The introduction of correction factors based on the parameters in the current concrete design codes enabled the derivation of the formula for calculating the maximum crack width of UHPC beams. Deng et al. [21] employed the ordinary concrete design code to calculate the maximum crack widths of T-shaped reinforced UHPC beams, and their findings indicated that the calculated values were consistently higher than the observed values. By introducing a correction factor of 0.7, a notable alignment was observed between the calculated and the measured values. Zhao et al. [22] conducted flexural tests on twenty reinforced UHPC rectangular slabs to investigate the effects of cover layer thickness and reinforcement ratio on crack development. Based on the methodologies of ordinary reinforced concrete, a non-uniformity coefficient was employed to assess the influence exerted by the reinforcement and to establish a formula for calculating the maximum crack width of UHPC slabs. Sturm et al. [23,24] considered the tensile effects and shrinkage creep of UHPC, deriving simplified calculation methodologies for deflection and crack width under service conditions of rectangular beams. Qiu et al. [25] performed four-point bending tests on six reinforced UHPC rectangular beams to observe the crack evolution and updated the average crack spacing, and non-uniformity coefficient with regard to existing standards. The formulas were established for calculating both the reinforcement stress and crack width of reinforced UHPC flexural specimens.
Despite the existence of studies that have investigated the crack resistance of reinforced UHPC beams, the available evidence remains limited, and further verification is required to refine the methodology applicability of these studies for shallow T-shaped beams. It is of paramount importance to develop a reliable and efficient simplified analysis method tailored for predicting the crack width and deflection of reinforced UHPC shallow T-shaped beams. Moreover, the current structure design codes do not provide specific calculation methodologies with accuracy and efficiency for the deflection and crack width prediction of reinforced UHPC shallow T-shaped beams. While the international CEB-FIP model code 2010 [26] presents a method for determining the average crack spacing in ordinary concrete, this approach is not applicable to UHPC. The standard formula tends to overestimate the average crack spacing due to the favorable bond between UHPC and reinforcement, as well as the tension stiffening due to a beneficial crack-bridging effect of steel fibers. Existing analysis models for predicting deflections and crack widths, as proposed by the AFGC recommendations [27] and the French standard NF P 18-710 [28] for the design of UHPC, are based on modifications of traditional sectional moment–curvature analyses. In those design-oriented models, tension stiffening is addressed by multiplying the curvature by the ratio of the reinforcement strain at the crack to the mean reinforcement strain. This accounts for a bond factor that requires calibration for novel combinations of UHPC materials. Another critical factor influencing the deflection and cracking behavior of UHPC is the impact of shrinkage and creep effects, which are addressed indirectly in the aforementioned design codes. A significant research gap exists in the literature concerning the prediction of the deflection and crack width of reinforced UHPC T-shaped beams, considering critical factors such as tensile stiffening effect, tension contribution of UHPC post-cracking, nonconstant bond behavior of the interface and shrinkage and creep effect. It is therefore essential to conduct flexural tests on reinforced UHPC shallow T-shaped beams to explore their deflection and crack development, with the aim of developing a reliable and efficient method for predicting the deflection and crack width.
This paper proposes a simplified analysis model comprising a bilinear curve with several characterization points to predict the mid-span deflection and crack width of reinforced UHPC shallow T-shaped beams under four-point bending. The proposed simplified analysis model is distinguished from existing deflection and crack width prediction methods by its consideration of several significant factors including the tensile stiffening effect, tension contribution of UHPC post-cracking, nonconstant bond behavior of the interface, and shrinkage and creep effect. The proposed model is based not on experimental calibration but rather on the direct application of material properties that are easily obtainable from simple and low-cost experiments. To validate the proposed model, six reinforced UHPC shallow T-shaped specimens with dimensions of 3.7 m × 0.7 m × 0.22 m, varying reinforcement ratios and fiber types within UHPC, are utilized and tested statically under four-point bending conditions. The experimental values obtained from these tests are then compared with the theoretical calculations derived from the simplified analysis model. The purpose of this comparison is to validate the feasibility and accuracy of the proposed analysis model. The proposed model has the potential to furnish a benchmark for predicting the crack width and deflection of reinforced UHPC shallow T-shaped beams under four-point bending. The application of the simplified analysis model is expected to increase in steel–UHPC composite bridges with waffle-type UHPC bridge decks, where UHPC shallow T-shaped beams are prevalent in a separate direction.
2. Segmental Analysis of Reinforced UHPC Shallow T-Shaped Beam
This section presents a detailed analysis of the stress distribution in a shallow T-shaped section beam, with consideration of the tensile constitutive responses of UHPC materials. The sectional curvature and neutral axis height are then determined using the equilibrium equation, thereby establishing the moment–curvature relationship of the flexural T-beam. Subsequently, the load–deflection and load–crack width relationships are derived through deflection–curvature conversion conditions. The solution procedure is presented in full below.
2.1. Tensile Constitutive Relationship of UHPC
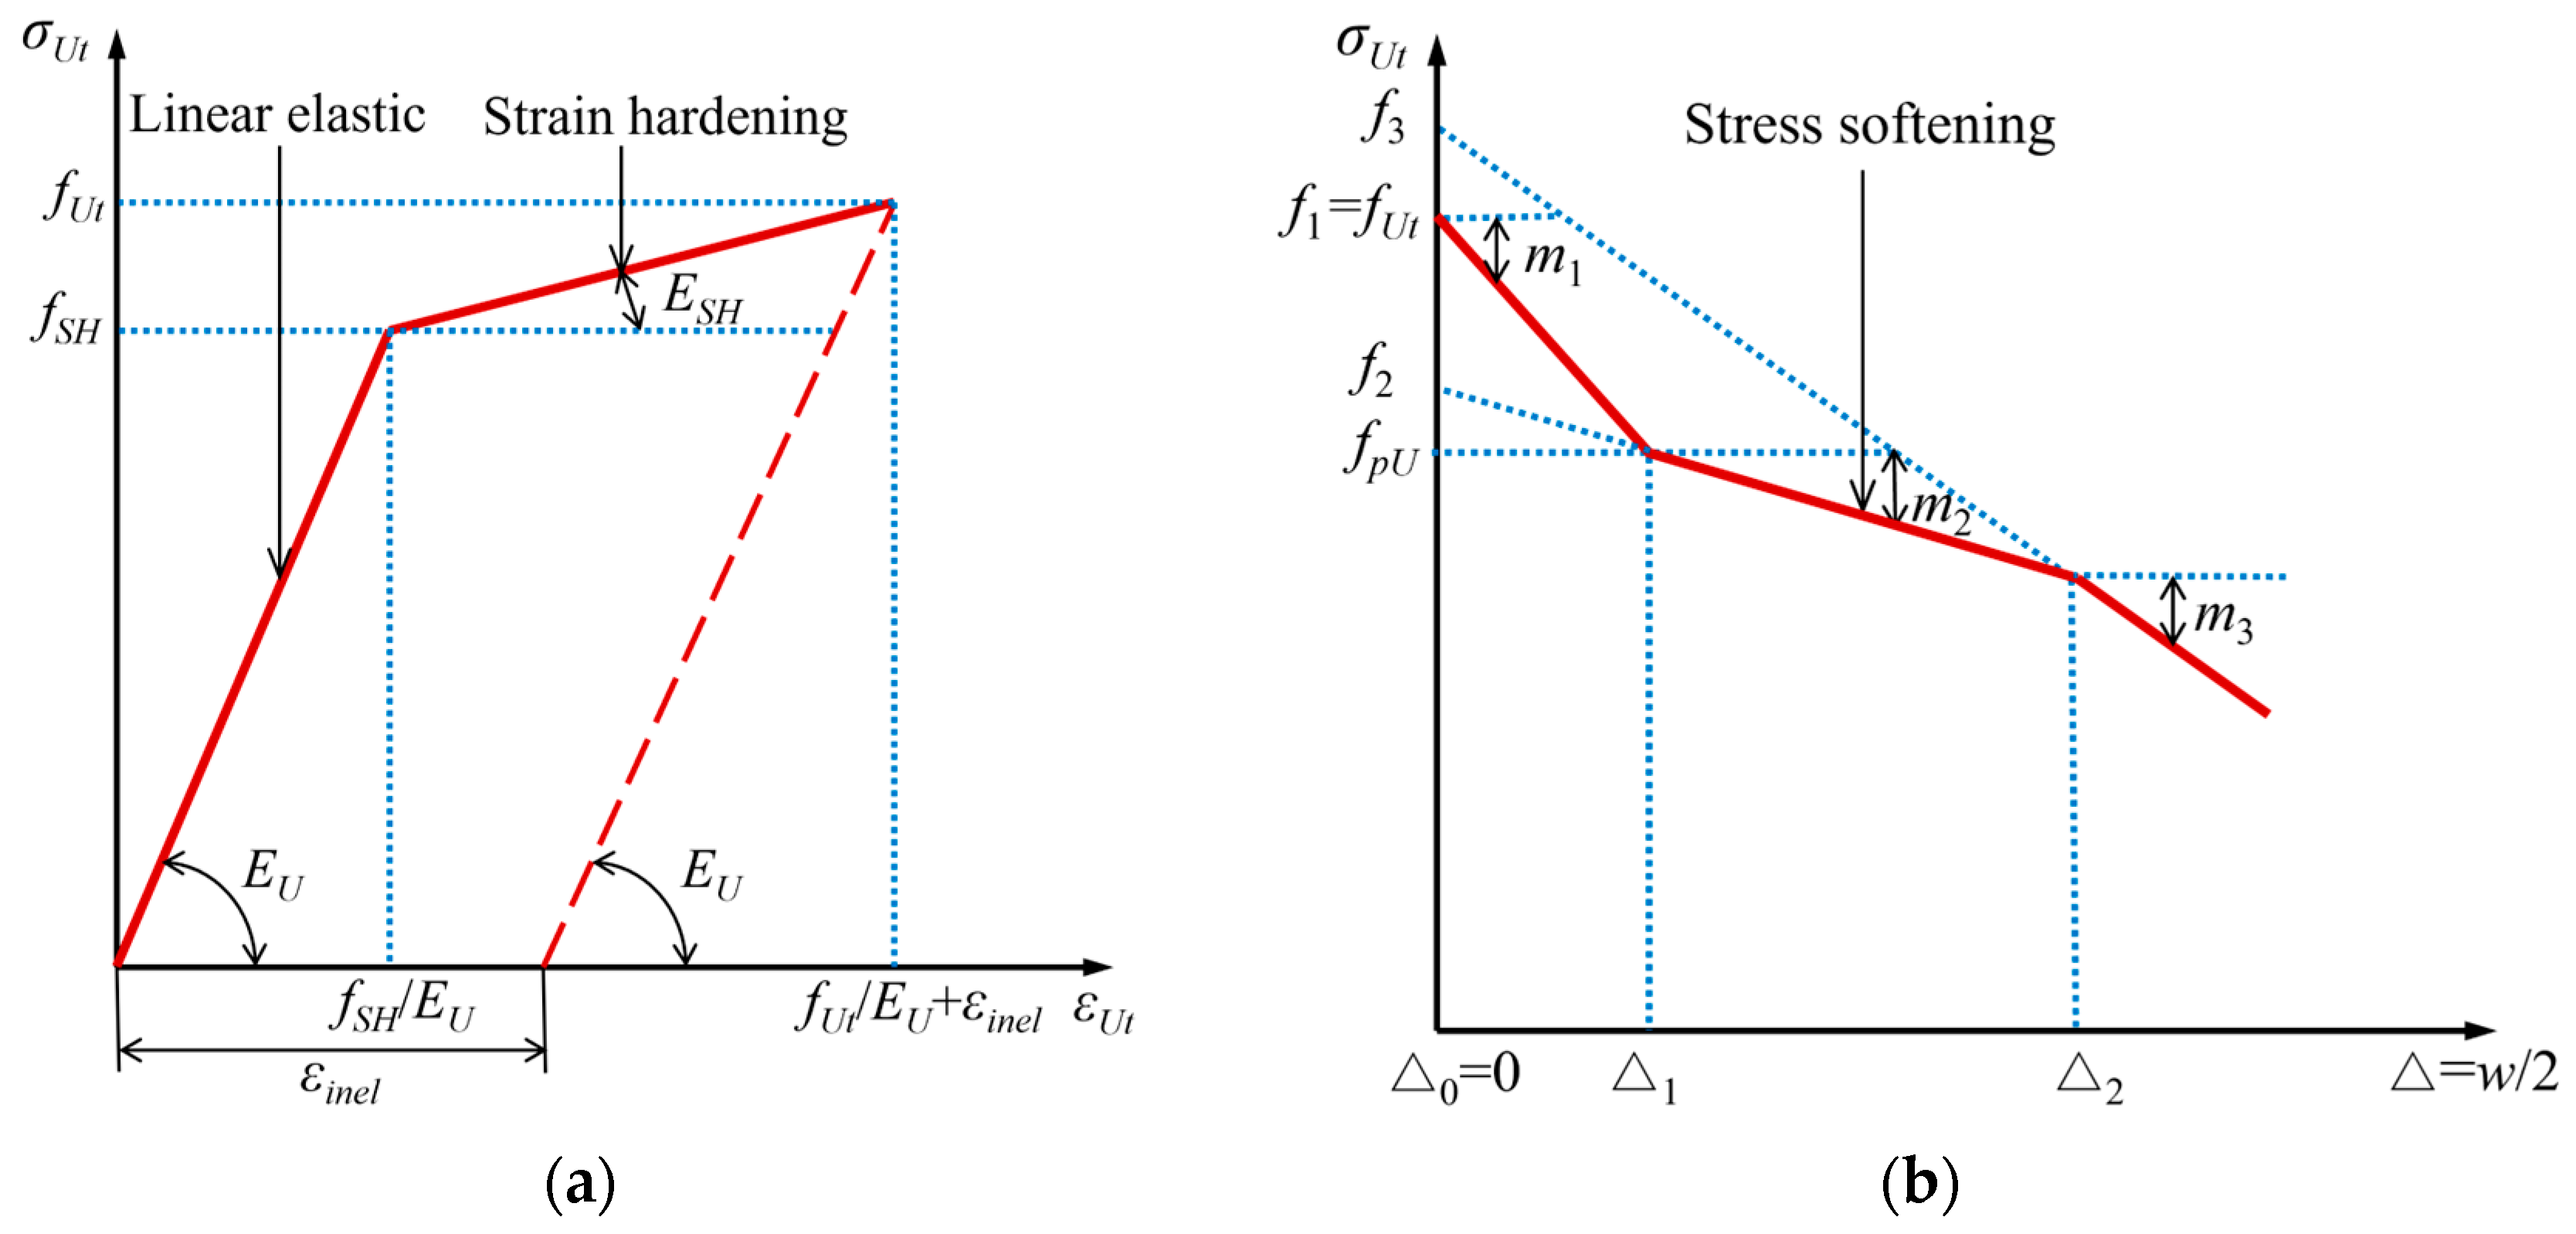
The tensile response of UHPC material can be divided into the following stages [29,30]: (1) a linear elastic stage before initial cracking, characterized by a linear stress–strain relationship; (2) a strain-hardening stage, marked by the development of multiple micro-cracks; (3) a strain-softening stage, characterized by rapid crack propagation and stress reduction. In the linear elastic stage, UHPC remains uncracked. During the strain-hardening stage, numerous micro-cracks are dispersed throughout the UHPC matrix. In the strain-softening stage, tensile deformation rapidly develops at the visible main cracks, as shown in Figure 1.
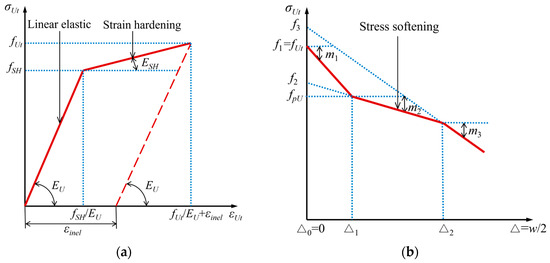
Figure 1.
Tensile constitutive responses of UHPC. (a) Stress–strain relationship; (b) stress–crack width relationship.
The tensile stress σUt of UHPC can be expressed as a piecewise linear function of strain εUt or half crack width Δ (Δ = w/2):
where EU is the elastic modulus of UHPC; fSH is the initial cracking stress; ESH is the modulus of strain hardening; fUt is the tensile strength of UHPC; εinel is the permanent plastic strain caused by multiple micro-cracks; mi and fi are the slope and y-intercept of segment i of the stress-half crack width segmental curve, respectively; Δi is the half crack width at the right endpoint of segment i of the stress-half crack width relationship σ(Δ). The parameters can be obtained either through direct tensile tests or via the secondary backwards method based on flexural tests.
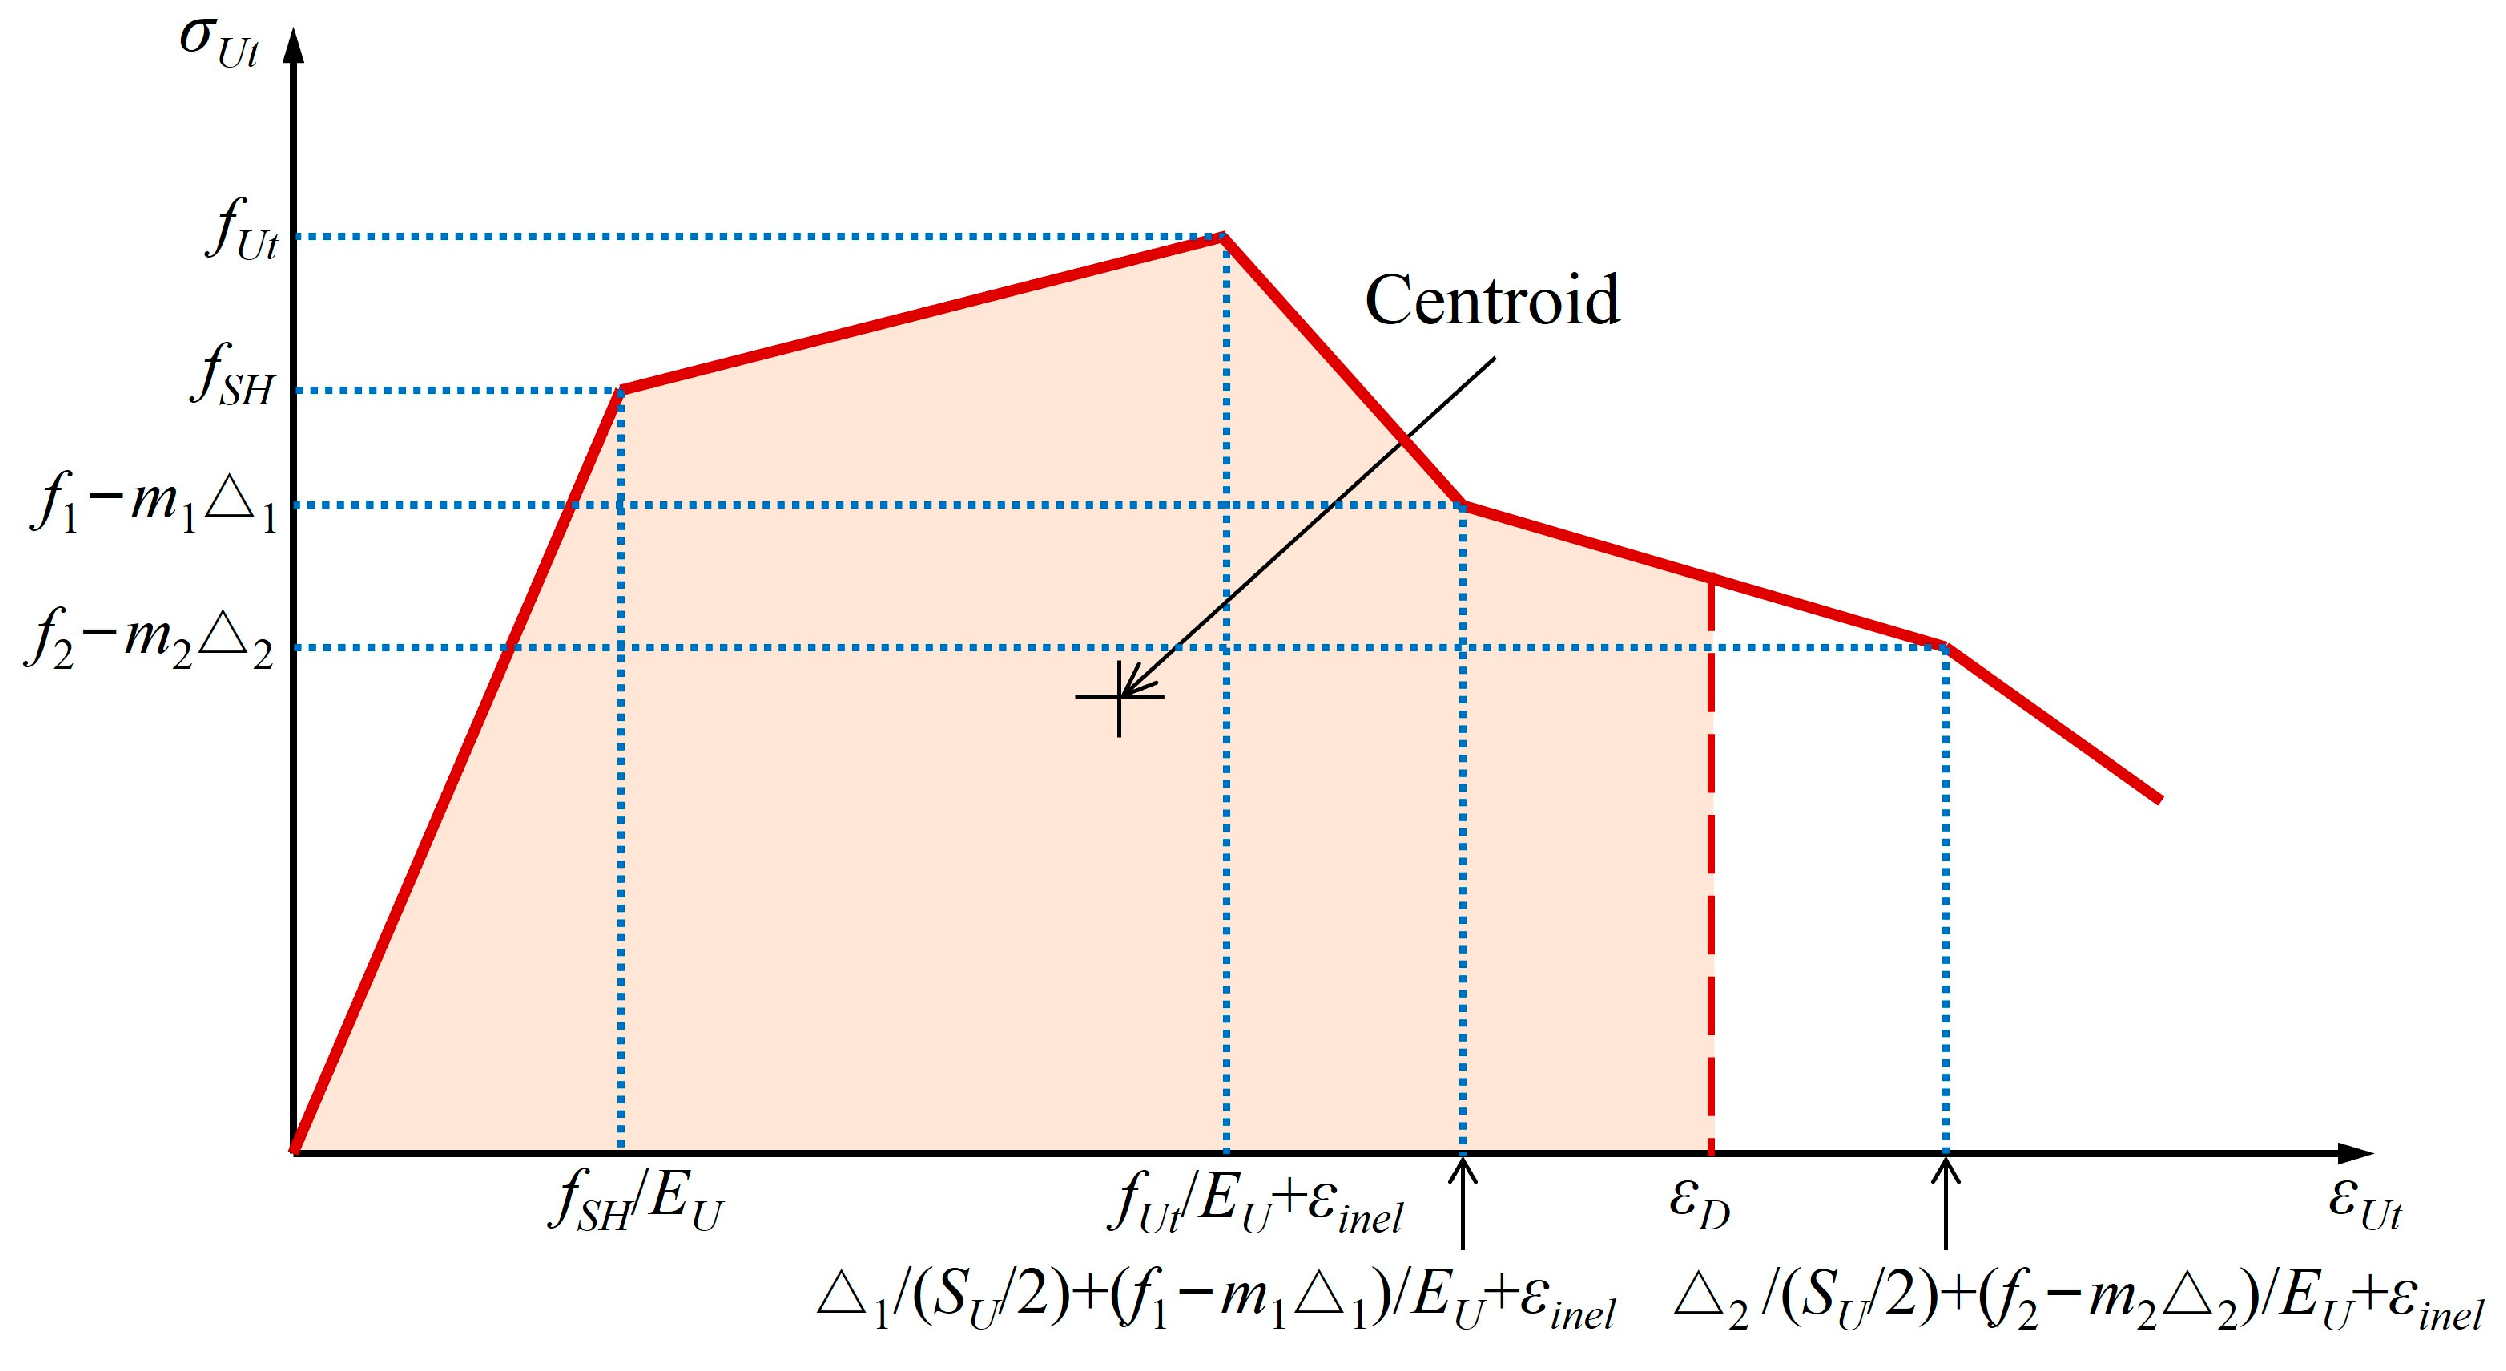
To simplify calculations, the stress-half crack width relationship shown in Figure 1b is converted into an equivalent stress–strain relationship [29]. The equivalent tensile strain within the crack zone is therefore estimated using the following formula:
where Δ/(SU/2) is the strain caused by crack propagation; σUt/EU is the strain caused by elastic deformation of UHPC between cracks; εinel is the plastic strain caused by micro-cracks. By converting the stress–crack width relationship into a stress–strain relationship according to Equation (2), the stress–strain constitutive model shown in Figure 2 is obtained.
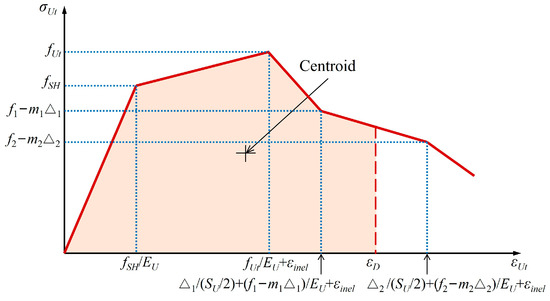
Figure 2.
Equivalent stress–strain relationship for tensile UHPC.
2.2. Determination of Internal Forces in Reinforced UHPC Shallow T-Shaped Beams
2.2.1. Internal Force of UHPC in Tensile Zone
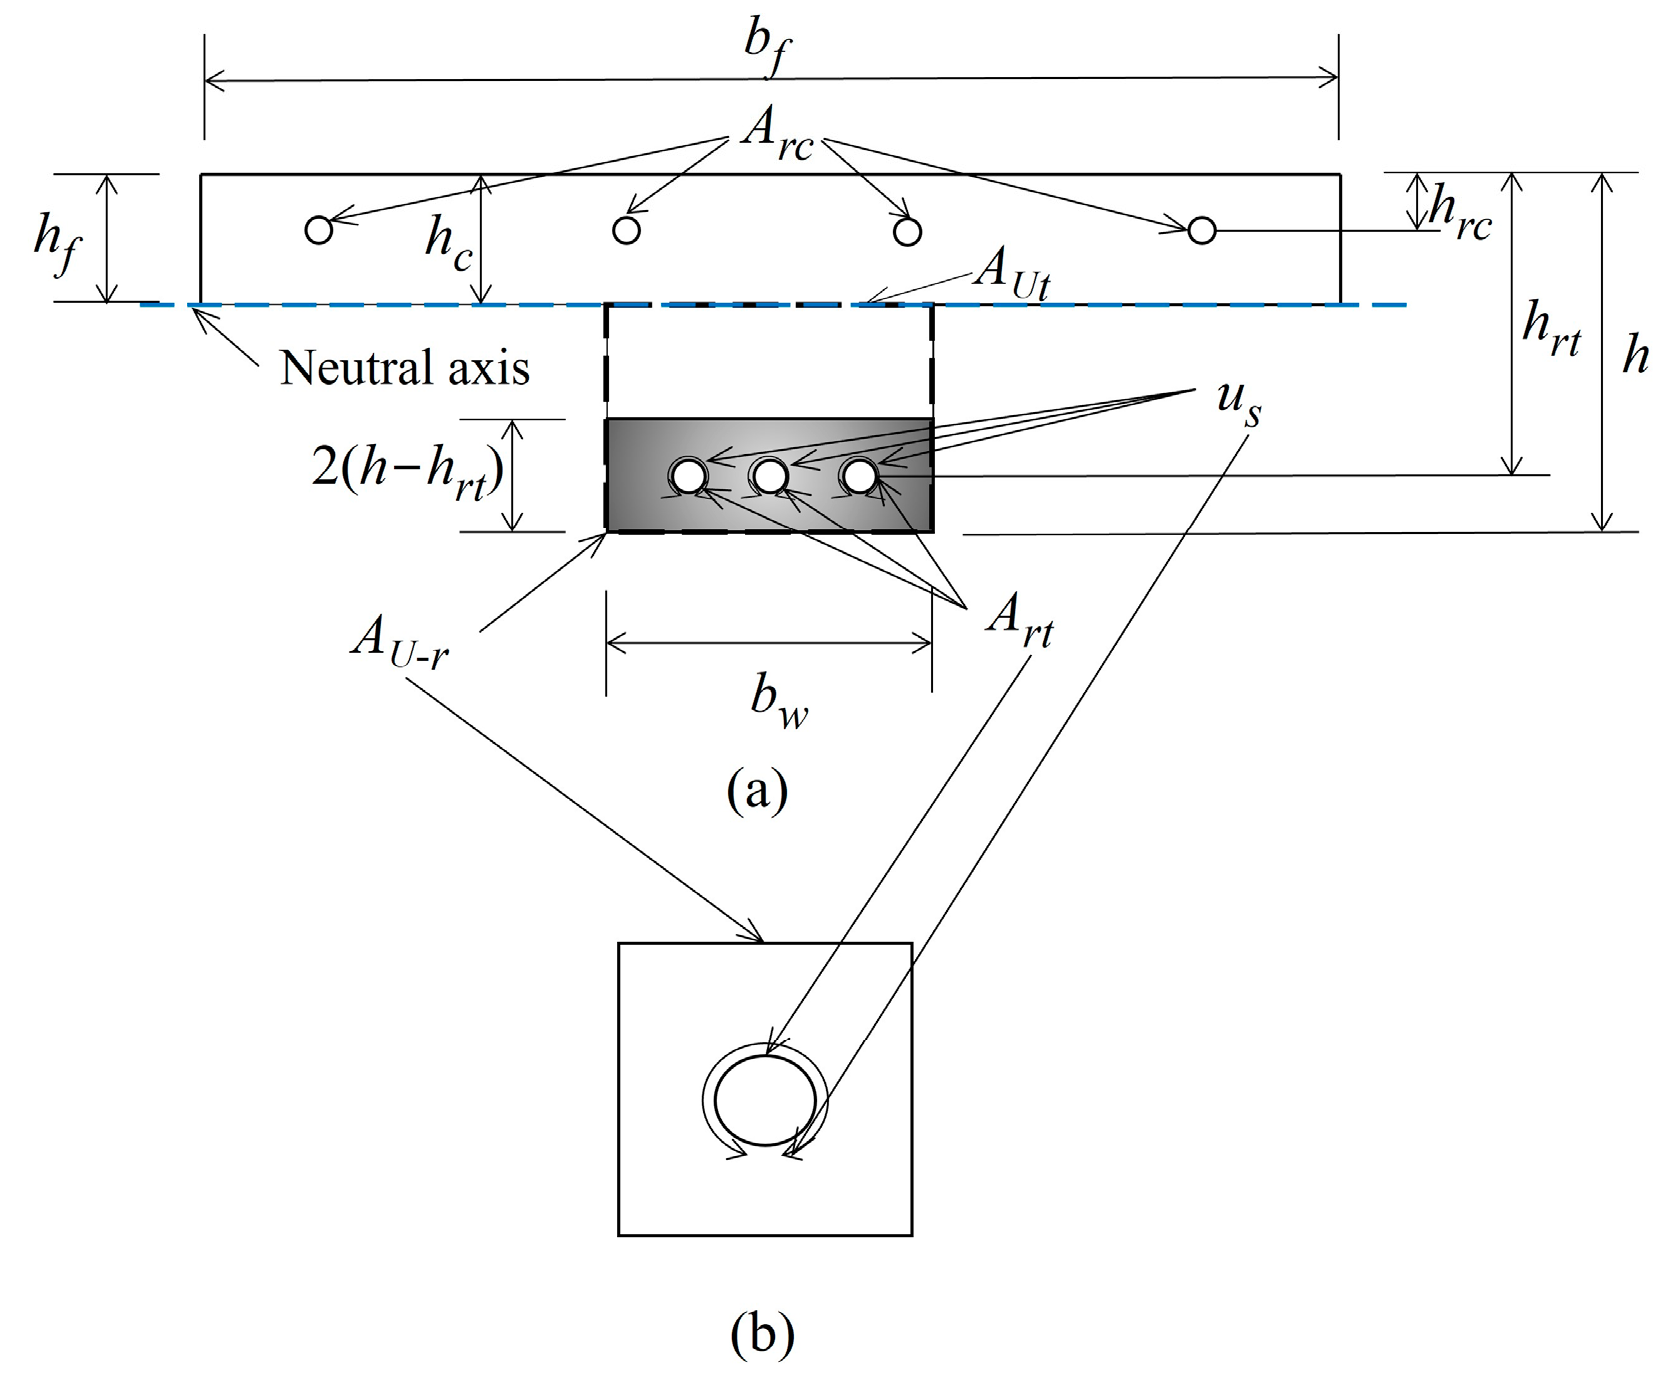
As demonstrated by the reinforced UHPC shallow T-shaped beam shown in Figure 3, the axial force exerted in the tensile zone of UHPC can be quantitatively derived through the application of an integral, which is based on the stress–strain relationship of UHPC material as defined by Equation (1).
where AUt is the area of the UHPC tensile zone; h − hc is the height of the tensile zone; is the average stress of UHPC in the tensile zone and can be determined by
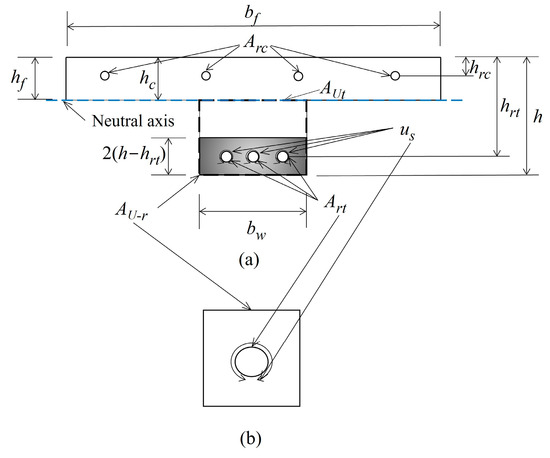
Figure 3.
Cross-section of reinforced UHPC shallow T-shaped beam. (a) cross section of beam; (b) cross section of effective tension-stiffening prism.
The arm of force of UHPC in tensile zone is defined as
where η is the ratio of the distance between the centroid of the tensile stress distribution and the neutral axis to the height of the tensile zone.
2.2.2. Internal Force of UHPC in Compressive Zone
The UHPC in the compressive zone is considered to be linear elastic as defined by the modulus of elasticity EU. The axial force in the UHPC compressive zone is thus given by
where φ is the curvature, bf is the flange width, and the height of the arm of force in the compression zone relative to the neutral axis is 2/3hc.
2.2.3. Internal Force of Reinforcement in Tensile Zone
The elevation of tension-stiffening zone between two cracks for a reinforced UHPC element is shown in Figure 4. The axial force in tension reinforcement within the T-shaped beam is given by:
where αE is the elasticity modulus ratio of reinforcement to UHPC; φ is the curvature; hc is the height of the compressive zone; γ is the increased stiffness coefficient due to tension stiffening effect. Before the formation of macro-cracks (εD < fUt/EU + εinel), γ is taken as 1, and after the formation of a macro-crack (εD ≥ fUt/EU + εinel), γ is taken by the following expression:
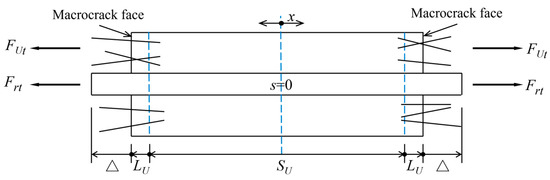
Figure 4.
Elevation of tension stiffening region between cracks of reinforced UHPC beam.
2.2.4. Internal Force of Reinforcement in Compressive Zone
The reinforcement in compressive zone is as assumed to be linear elastic. Hence, the axial force of reinforcement is derived as
where the force attributed to shrinkage strain is given by
2.3. Crack Spacing
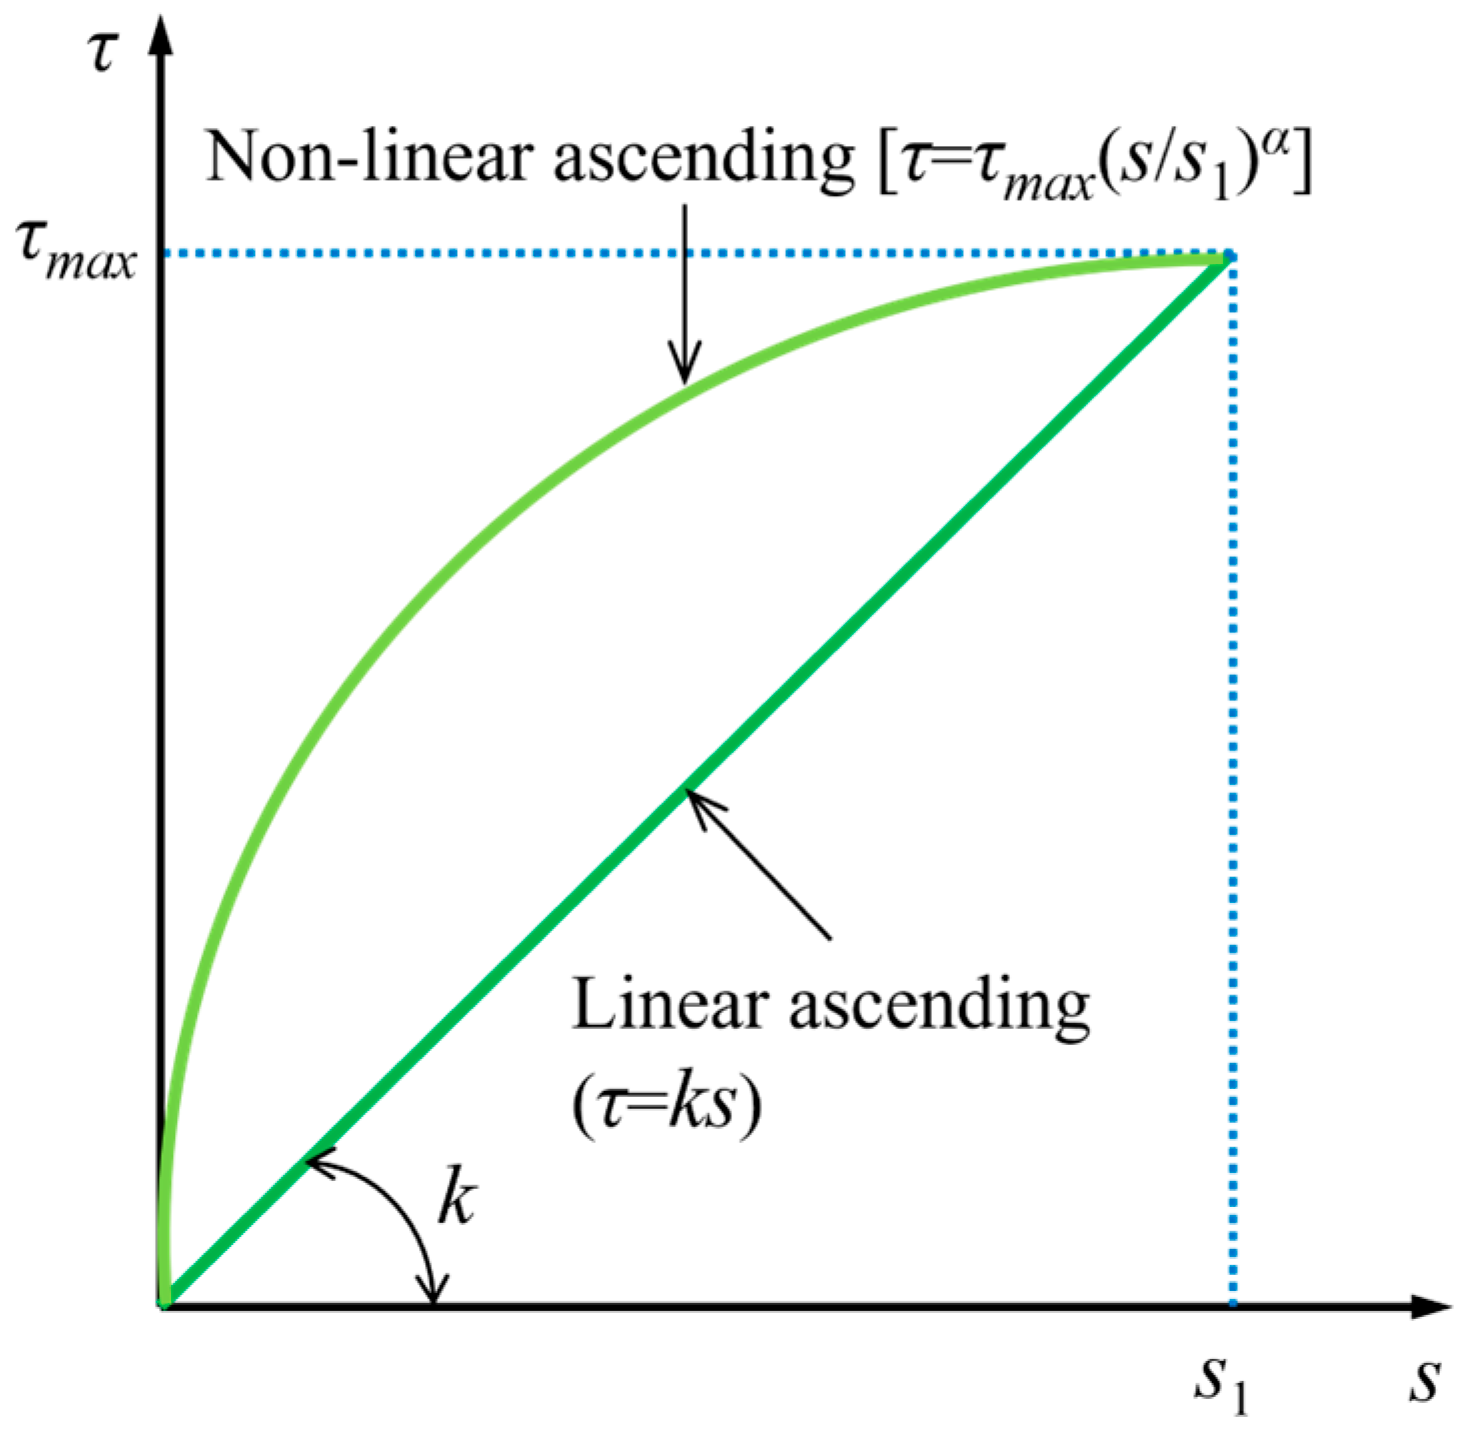
The determination of an adequate crack spacing is a fundamental aspect in the accurate calculation of crack width. Considering the bridging and crack resistance effects of steel fibers, as well as the shrinkage and creep characteristics of UHPC, the expression for crack spacing, as outlined in the literature [23], is presented as
where τmax is the maximum bond stress (bond strength); s1 is the slip corresponding to the bond strength; α is the fitted coefficient of bond behavior of the reinforcement–UHPC interface. Figure 5 illustrates the relationship between these parameters including τmax, s1, and α, which is typically determined through pull-out tests of the reinforcement within the concrete.
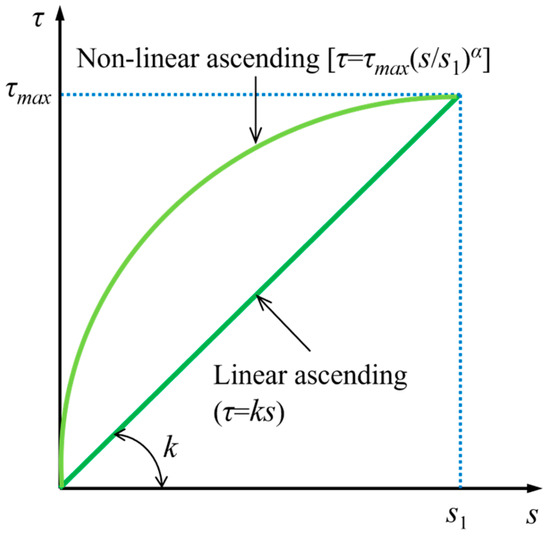
Figure 5.
Bond stress–slip relationship between steel rebar and UHPC.
2.4. Segmental Analysis of Reinforced UHPC Shallow T-Shaped Beams
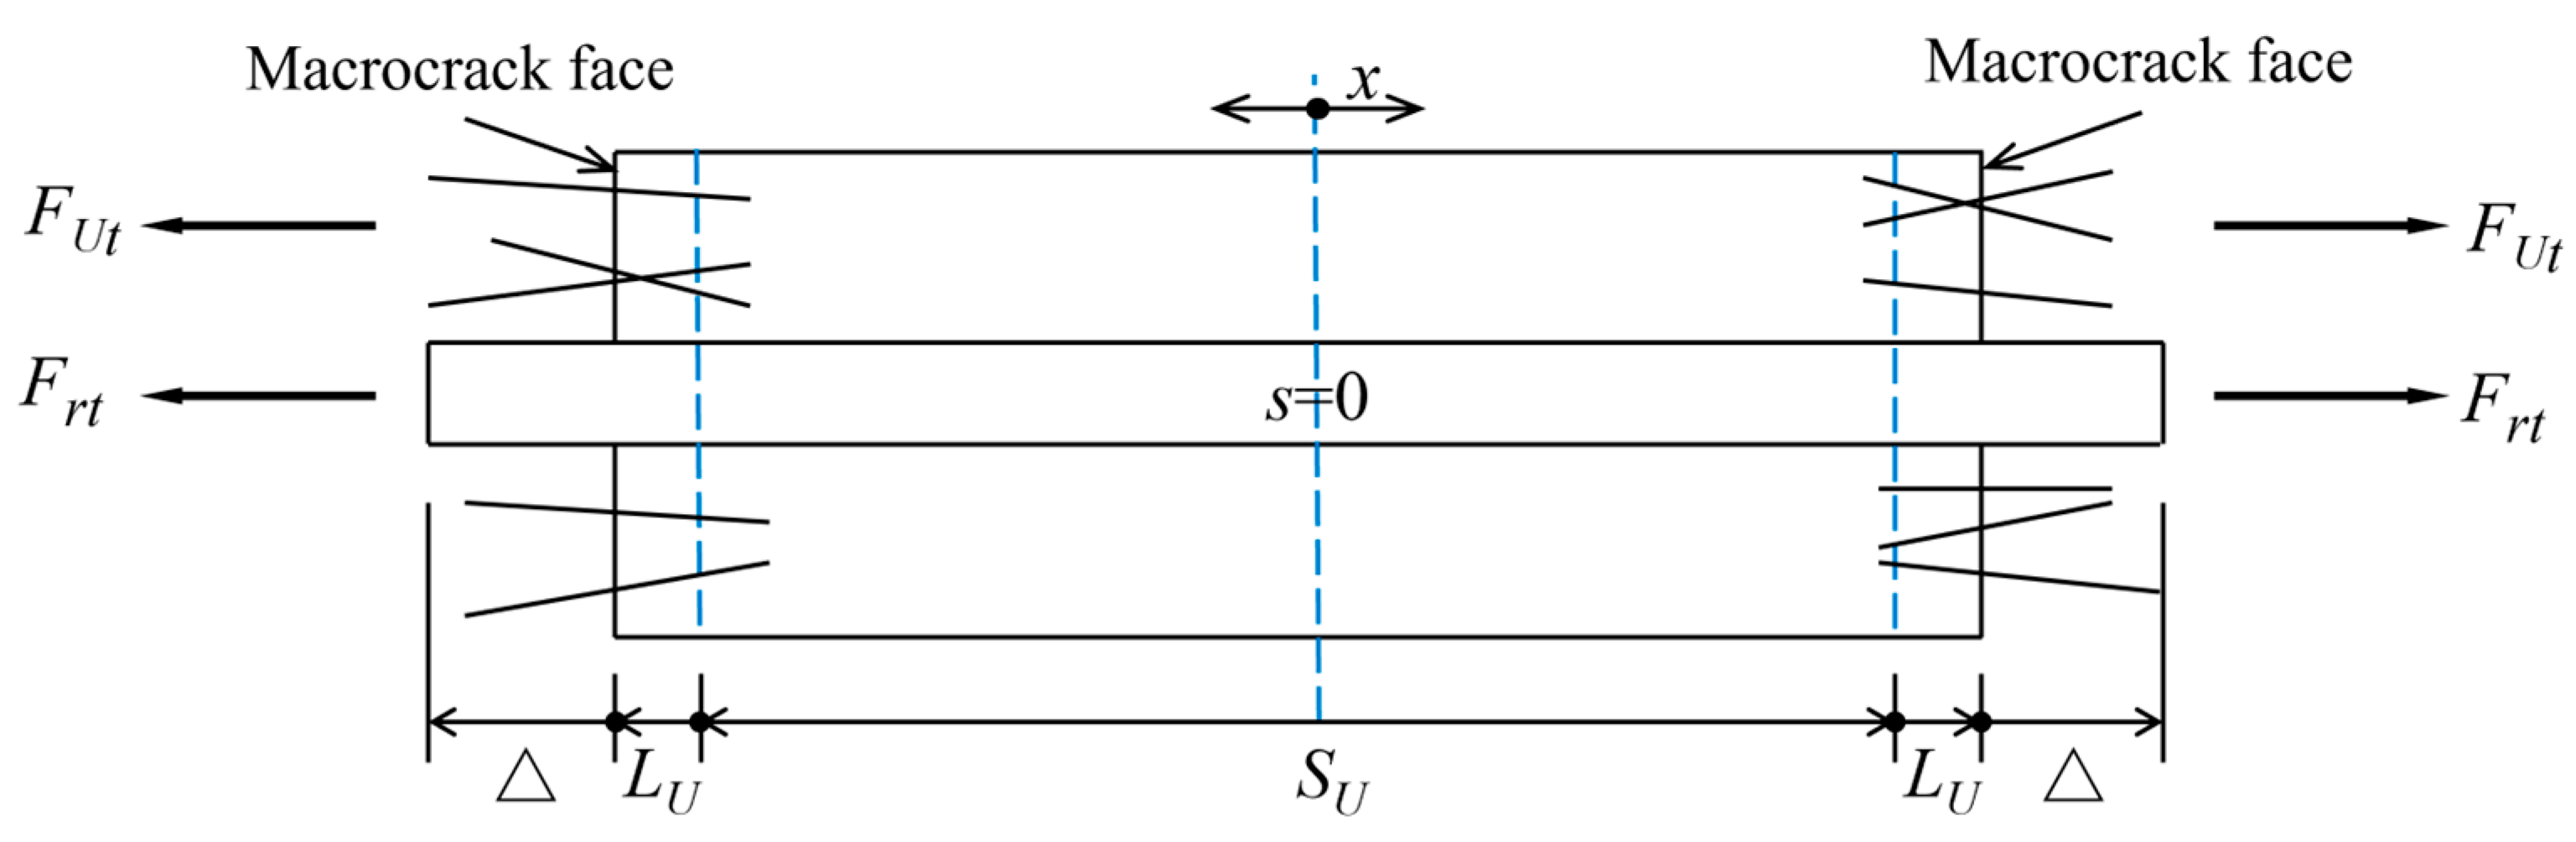
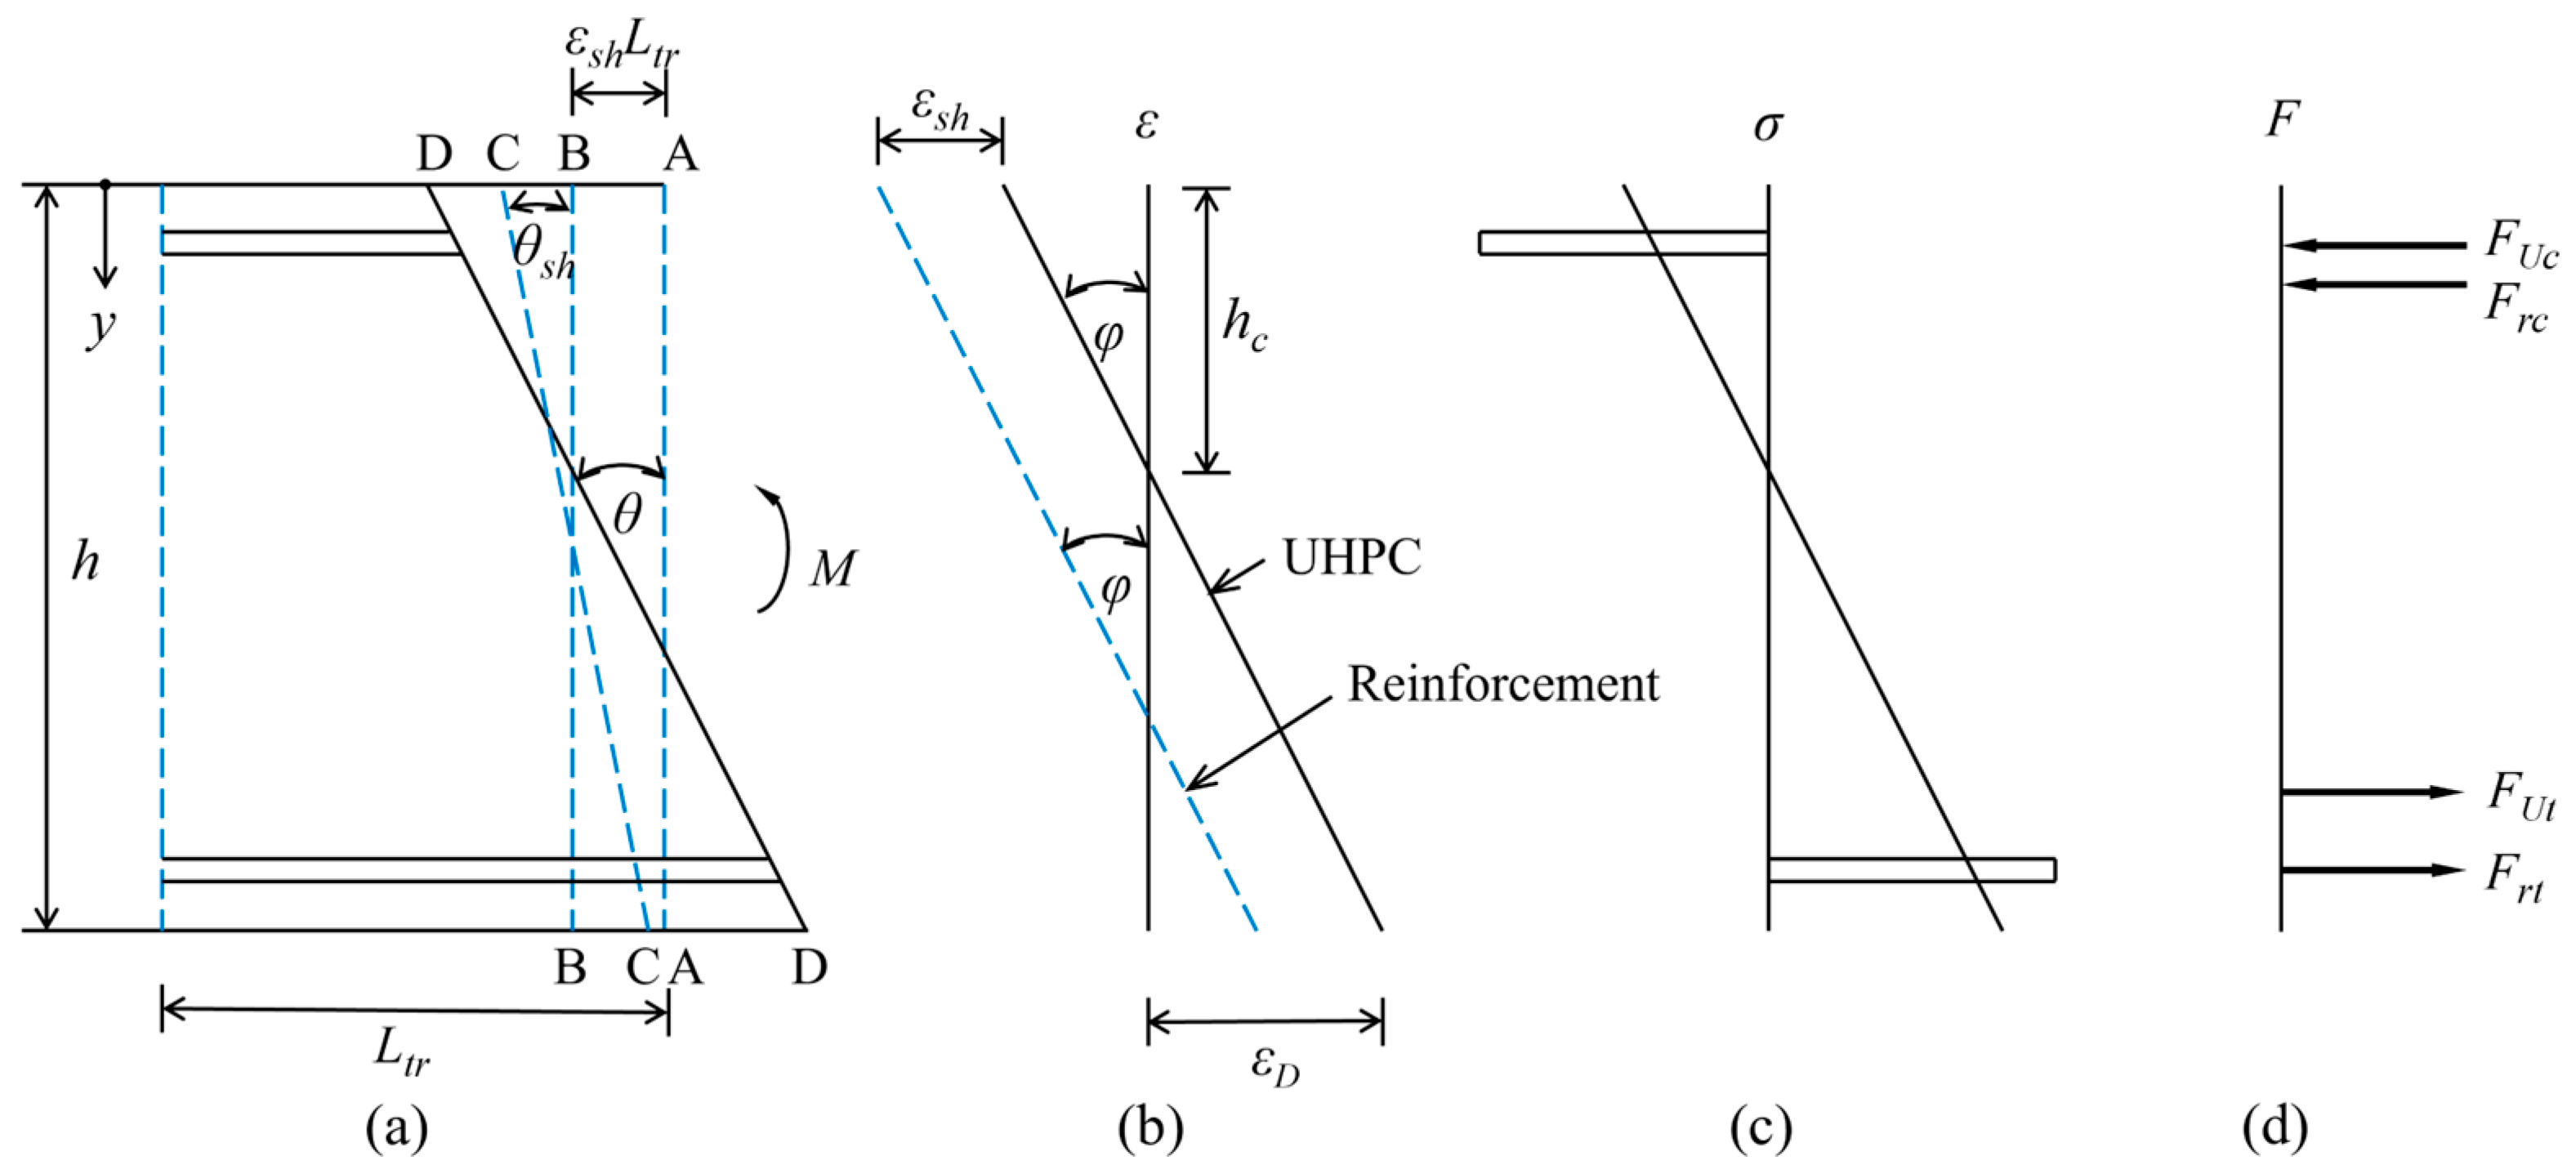
To ascertain the moment–rotation behavior of a beam, the uncracked segment as shown in Figure 6a is initially considered. It is assumed that the stress transfer length Ltr is equal to half the crack spacing (SU/2), while the A-A section represents the initial position of the segment. As the shrinkage strain develops in the segment, if the reinforcement is not bonded, the resulting contraction is manifested as Section B-B. Due to the bond nature between UHPC and reinforcement, the contraction results in compressive forces being exerted on the reinforcement, while tensile forces are generated in the concrete to maintain equilibrium. This leads to the formation of Section C-C at a rotation angle θsh. The application of an external moment results in an increase in rotation θ to achieve equilibrium between force and moment, leading to the formation of Section D-D. For analytical purposes, the shrinkage strain εsh can be determined by shrinkage-relevant tests of UHPC material. The influence of creep can also be incorporated through the modification of the elastic modulus of UHPC using the age-adjusted effective modulus method [31,32]. A division of the deformation profile in Figure 6a by the transfer length Ltr produces the strain profile illustrated in Figure 6b, which represents the strain subsequent to the imposition of shrinkage strain and external moment. The sectional strain distribution of both UHPC and reinforcement is defined in Figure 6b, where the difference in their strains represents the shrinkage strain.
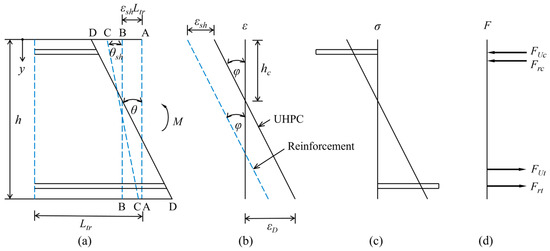
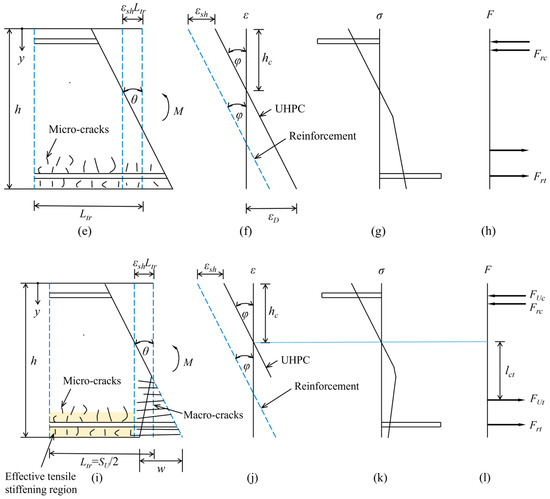
Figure 6.
Detailed segmental analysis of reinforced UHPC shallow T-shaped beam: (a) uncracked half segment; (b) strain profile; (c) stress profile; (d) force profile; (e) micro-cracked half segment; (f) strain profile; (g) stress profile; (h) force profile; (i) macro-cracked half segment; (j) strain profile; (k) stress profile; and (l) force profile.
Based on the strain distribution and constitutive relationship of UHPC material, the sectional stress distribution can be obtained as shown in Figure 6c, and its integration then produces the internal force profile in Figure 6d. By applying the force and moment equilibrium equation, the relationship between the external moment M and curvature can then be solved. As the growing of the external moment, the strain εD of UHPC bottom face will eventually reach the multi-cracking strain. Thereafter, the segment in Figure 6a is replaced by the one shown in Figure 6e. The emergence of microcracks leads to the stress hardening of UHPC, as illustrated in Figure 6g. Upon arrival of strain εD at the macrocracking strain, fUt/EU + εinel, macrocracks are initiated on the bottom face of beam, as represented in Figure 6i. The presence of macrocracks indicates the stress softening of UHPC tensile response, as shown in Figure 6k. In the post-cracking phase, the tension contribution of UHPC is elaborately modeled by considering the conversion of stress–crack width relationship into a post-cracking stress–strain relationship according to Equation (2), as shown in Figure 2. In this situation, the effective stiffness of the tensile reinforcement increases due to the tensile stiffening effect. It is represented by the multiplication of the axial rigidity of the reinforcement by the tension-stiffening parameter defined by Equation (10). By employing the moment–rotation approach, enables the derivation of the relationship between moment–curvature and moment–crack width and further determines the deflections and crack widths in the section.
The strain at the bottom of UHPC beam εD is applied, and then the curvature is
To determine the neutral axis depth, the force equilibrium is referred as
Substituting Equations (1), (5), (8), (14) and (18) into Equation (19), for a T-shaped section of UHPC shallow beam the following is obtained:
where
After determining the height of neutral axis from Equations (20) and (21), the curvature can be calculated using Equation (18), and then internal forces can be evaluated using Equations (3), (7), (8) and (14), thereby determining the external moment M of the section. By rearranging Equation (2), it arrives
By applying aforementioned process, it allows for the evaluation of the moment–curvature and moment–crack width relationships in a parametric manner across a range of bottom strains εD. It is noteworthy that the maximum crack width of the section can be obtained from Equation (22) under the assumptions made during the derivation of crack spacing.
3. Simplified Analysis Model for Reinforced UHPC Shallow T-Shaped Beams
The aforementioned methodology requires the assessment of the moment, curvature, and crack width over a range of bottom strain εD for the acquisition of a continuous smooth curve. To simplify the solution process, a simplified analysis model characterized by a bilinear curve is proposed for reinforced UHPC shallow T-shaped beams. The establishment of a simplified analysis model is determined by a continuous moment–curvature relationship with four characterization points, as illustrated in Figure 7a, which is approximated by a bilinear curve. The four characterization points employed include the curvature point at zero moment due to shrinkage, the curvature point at reinforcement yielding, the point where the strain of most tensioned UHPC face corresponding to 50% of reinforcement yield strain, and the transition point of the proposed bilinear moment–curvature curve. The simplified analysis model is presented for the simplification of the derivation process for the moment–curvature relationship prior to the reinforcement yielding. Note that the proposed analysis model is not responsible for the post-yielding behavior, since shallow T-shaped beams are not usually tailor-designed to enter the post-yielding stage in real-world engineering applications from a structural safety perspective.
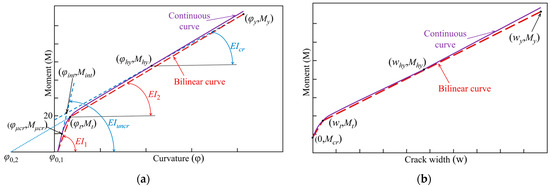
Figure 7.
Simplified analysis model for reinforced UHPC shallow T-shaped beam: (a) moment–curvature relationship; (b) moment–crack width relationship.
The moment–curvature relationship of the simplified analysis model is expressed as follows:
where φ0,1 is the curvature at zero moment due to shrinkage, and the first portion of the bilinear curve (flexural stiffness) is characterized by a slope as
The slope of the second portion of the bilinear curve is
The second portion of the bilinear curve intersects with the curvature axis at
Before the establishment of the simplified analysis model, the focus of this study is mainly on how to determine the characterization points. To be more specific, the curvature at zero moment φ0,1, moment My and curvature φy at reinforcement yielding, and moment Mt and curvature φt at the transition point of simplified bilinear curves are the key parameters to be discussed.
3.1. Curvature at Zero Moment φ0,1
The curvature at zero moment is derived here for a reinforced UHPC beam with a T-shaped cross-section, as illustrated in Figure 3a. When UHPC is uncracked (εD < fSH/EU), its stress can be considered as linear elastic. The stress is thus defined as the elastic modulus with multiplication of the strain, which is related to the curvature φ0,1, compressive zone height hc0, and distance from the top of the section y, that is φ0,1(y − hc0). The axial force composition of UHPC is
By combining Equations (8), (14) and (25), force equilibrium provides
The solution of the curvature is obtained
where the area and first-order moment of the transformed section gives, respectively, to
By taking the moment at the top of the section, the moment composition of UHPC is
The moment equilibrium at the top fiber gives
where M is the external moment applied; and is the moment composition carried by reinforcements in tension and in compression, respectively. The solution of the curvature is derived as
where the second-order moment of the transformed section is
By combining Equations (29) and (34), it determines the compression zone height or neutral axis depth
where
and thus
Once the compressive zone height has been quantified using Equation (38), the curvature can be calculated using either Equation (29) or Equation (34) when external moment is zero. As shown in Equation (29) or Equation (34), the existence of shrinkage strain εsh indicates the characteristic curvature at zero moment φ0,1 is depended on the effects of shrinkage and creep. As previously mentioned, the shrinkage strain εsh takes into account of shrinkage and creep effect and can be obtained by specific experimental tests. For a purpose of simplification analysis, the shrinkage strain εsh in the proposed model is determined equal to 550 μm/m according to the recommendations of AFGC [27].
3.2. Moment My and Curvature φy at Reinforcement Yielding
In Figure 2, the bottom strain εD is unknown at the beginning of reinforcement yielding. It is however required to quantify the average stress and the force arm lct of the UHPC in tension. It is observed that the yielding strain εy of reinforcement is typically significantly larger than the microcracking strain (fSH/EU) of UHPC, which implies the height of the crack almost extends to the neutral axis. In such case, the tensile stress–strain curve prior to cracking is ignored as a simplification to obtain closed-form solutions and is assumed to be a linear relationship providing the intersection with the stress axis at f1 in a slope of Ef. From Equations (4) and (6):
By establishing the axial force of reinforcement at yielding as Frt = fy Art and reordering Equation (8), the effective yielding strain is derived as
The curvature at yielding is
The force of tensile reinforcement is fy Art, and the force of compressive reinforcement is given by Equation (14). Similarly, the force of UHPC in compression is calculated using Equation (7), and the force of UHPC in the tensile zone is determined by Equation (3). In this situation, the force equilibrium denotes
Substituting Equation (42) into Equation (43), it is obtained:
where
Having obtained the neutral axis height hcy using Equation (44), the curvature φy is determined using Equation (42), and the moment My can be quantified after the determination of the axial force and the force arm.
3.3. Moment Mt and Curvature φt at Transition Point
To identify the transition point, the flexural stiffness EIuncr for the uncracked section and EIcr for the cracked section is first required. As illustrated in Figure 7a, the flexural stiffness of the uncracked section is determined with
where Mμcr and φμcr are the moment and curvature at beginning of microcracking, respectively, determined by evaluating the bottom strain εD with fSH /EU.
The flexural stiffness of the cracked section can be estimated using the secant stiffness through the yield point and the point where the strain at the UHPC bottom reaches 50% of the yield strain, that is
where Mhy and φhy are the moment and curvature, respectively, derived by the assessing the bottom strain εD with 0.5φy (h − hcy).
Upon obtaining the flexural stiffness for both the uncracked and cracked sections, the intersection of the two curves, as shown in Figure 7a, can be determined. By means of a direct comparison between the curvature at the intersection point, as indicated by the two curves, it can be defined as
The moment at the intersection point is derived from the rearrangement of Equation (48) as:
The selection of transition point is determined by evaluating the bottom strain same as that of the intersection point. The bottom tensile strain εD,t at the transition point is a function of curvature and can estimated by a linear interpolation between the microcracking strain and a value of 0.5φy (hrt −hc), which results in
Once the bottom strain εD,t is determined, the neutral axis height and curvature can be obtained using Equations (20) and (18), respectively. Subsequently, the forces of the reinforcement and UHPC are evaluated by Equations (3), (7), (8) and (14), and then the moment is determined by the multiplication of the forces by their level arms. Finally, the flexural stiffnesses of different parts of the curve can be assessed using Equations (24) and (25).
3.4. Estimation of Crack Width
The relationship between moment and crack width is shown in Figure 7b. The crack width can be estimated through linear interpolation between the crack widths corresponding to microcracking, transition, half yielding, and reinforcement yielding.
3.5. Mid-Span Deflection
Based on the bending moment diagram from a four-point bending test, an expression for calculating the mid-span deflection of shallow T-shaped beams with two different flexural stiffnesses can be derived. The curvature distribution is obtained from Equations (25) and (26). By performing a double integration of the curvature distribution and considering the boundary condition of zero deflection at the supports, the mid-span deflection can be found as:
where F is the applied load; L is the span length of the beam; a is the distance between loads; x1 is the critical point between two different flexural stiffnesses, defined as
As outlined in the foregoing derivation of the simplified analysis model, it can be seen that two assumptions made are of paramount significance in simplifying and smoothing the solution process. First, in the determination of moment My and curvature φy at reinforcement yielding, the effective tensile stress–strain curve is assumed to be a linear relationship, with the portion prior to microcracking disregarded as a simplification to obtain closed-form solutions. Second, the transition point is selected to have an identical bottom strain to that of the hypothetical intersection point. The intersection point itself is determined based on the assumption of the secant stiffness through the point at reinforcement yielding and the point where the bottom strain of UHPC corresponds to 50% of reinforcement yield strain.
Having determined the curvature at zero moment φ0,1, moment My and curvature φy at reinforcement yielding, and moment Mt and curvature φt at the transition point, the Equations (52) and (22) can be employed, respectively, for predicting the deflections and crack widths of characteristic points in the proposed simplified analysis model. With known deflections and crack widths at characteristic points, the deflection and crack width of reinforced UHPC shallow T-shaped beams can be estimated using linear interpolation between the characteristic points.
4. Four-Point Bending Test of Reinforced UHPC Shallow T-Shaped Beams
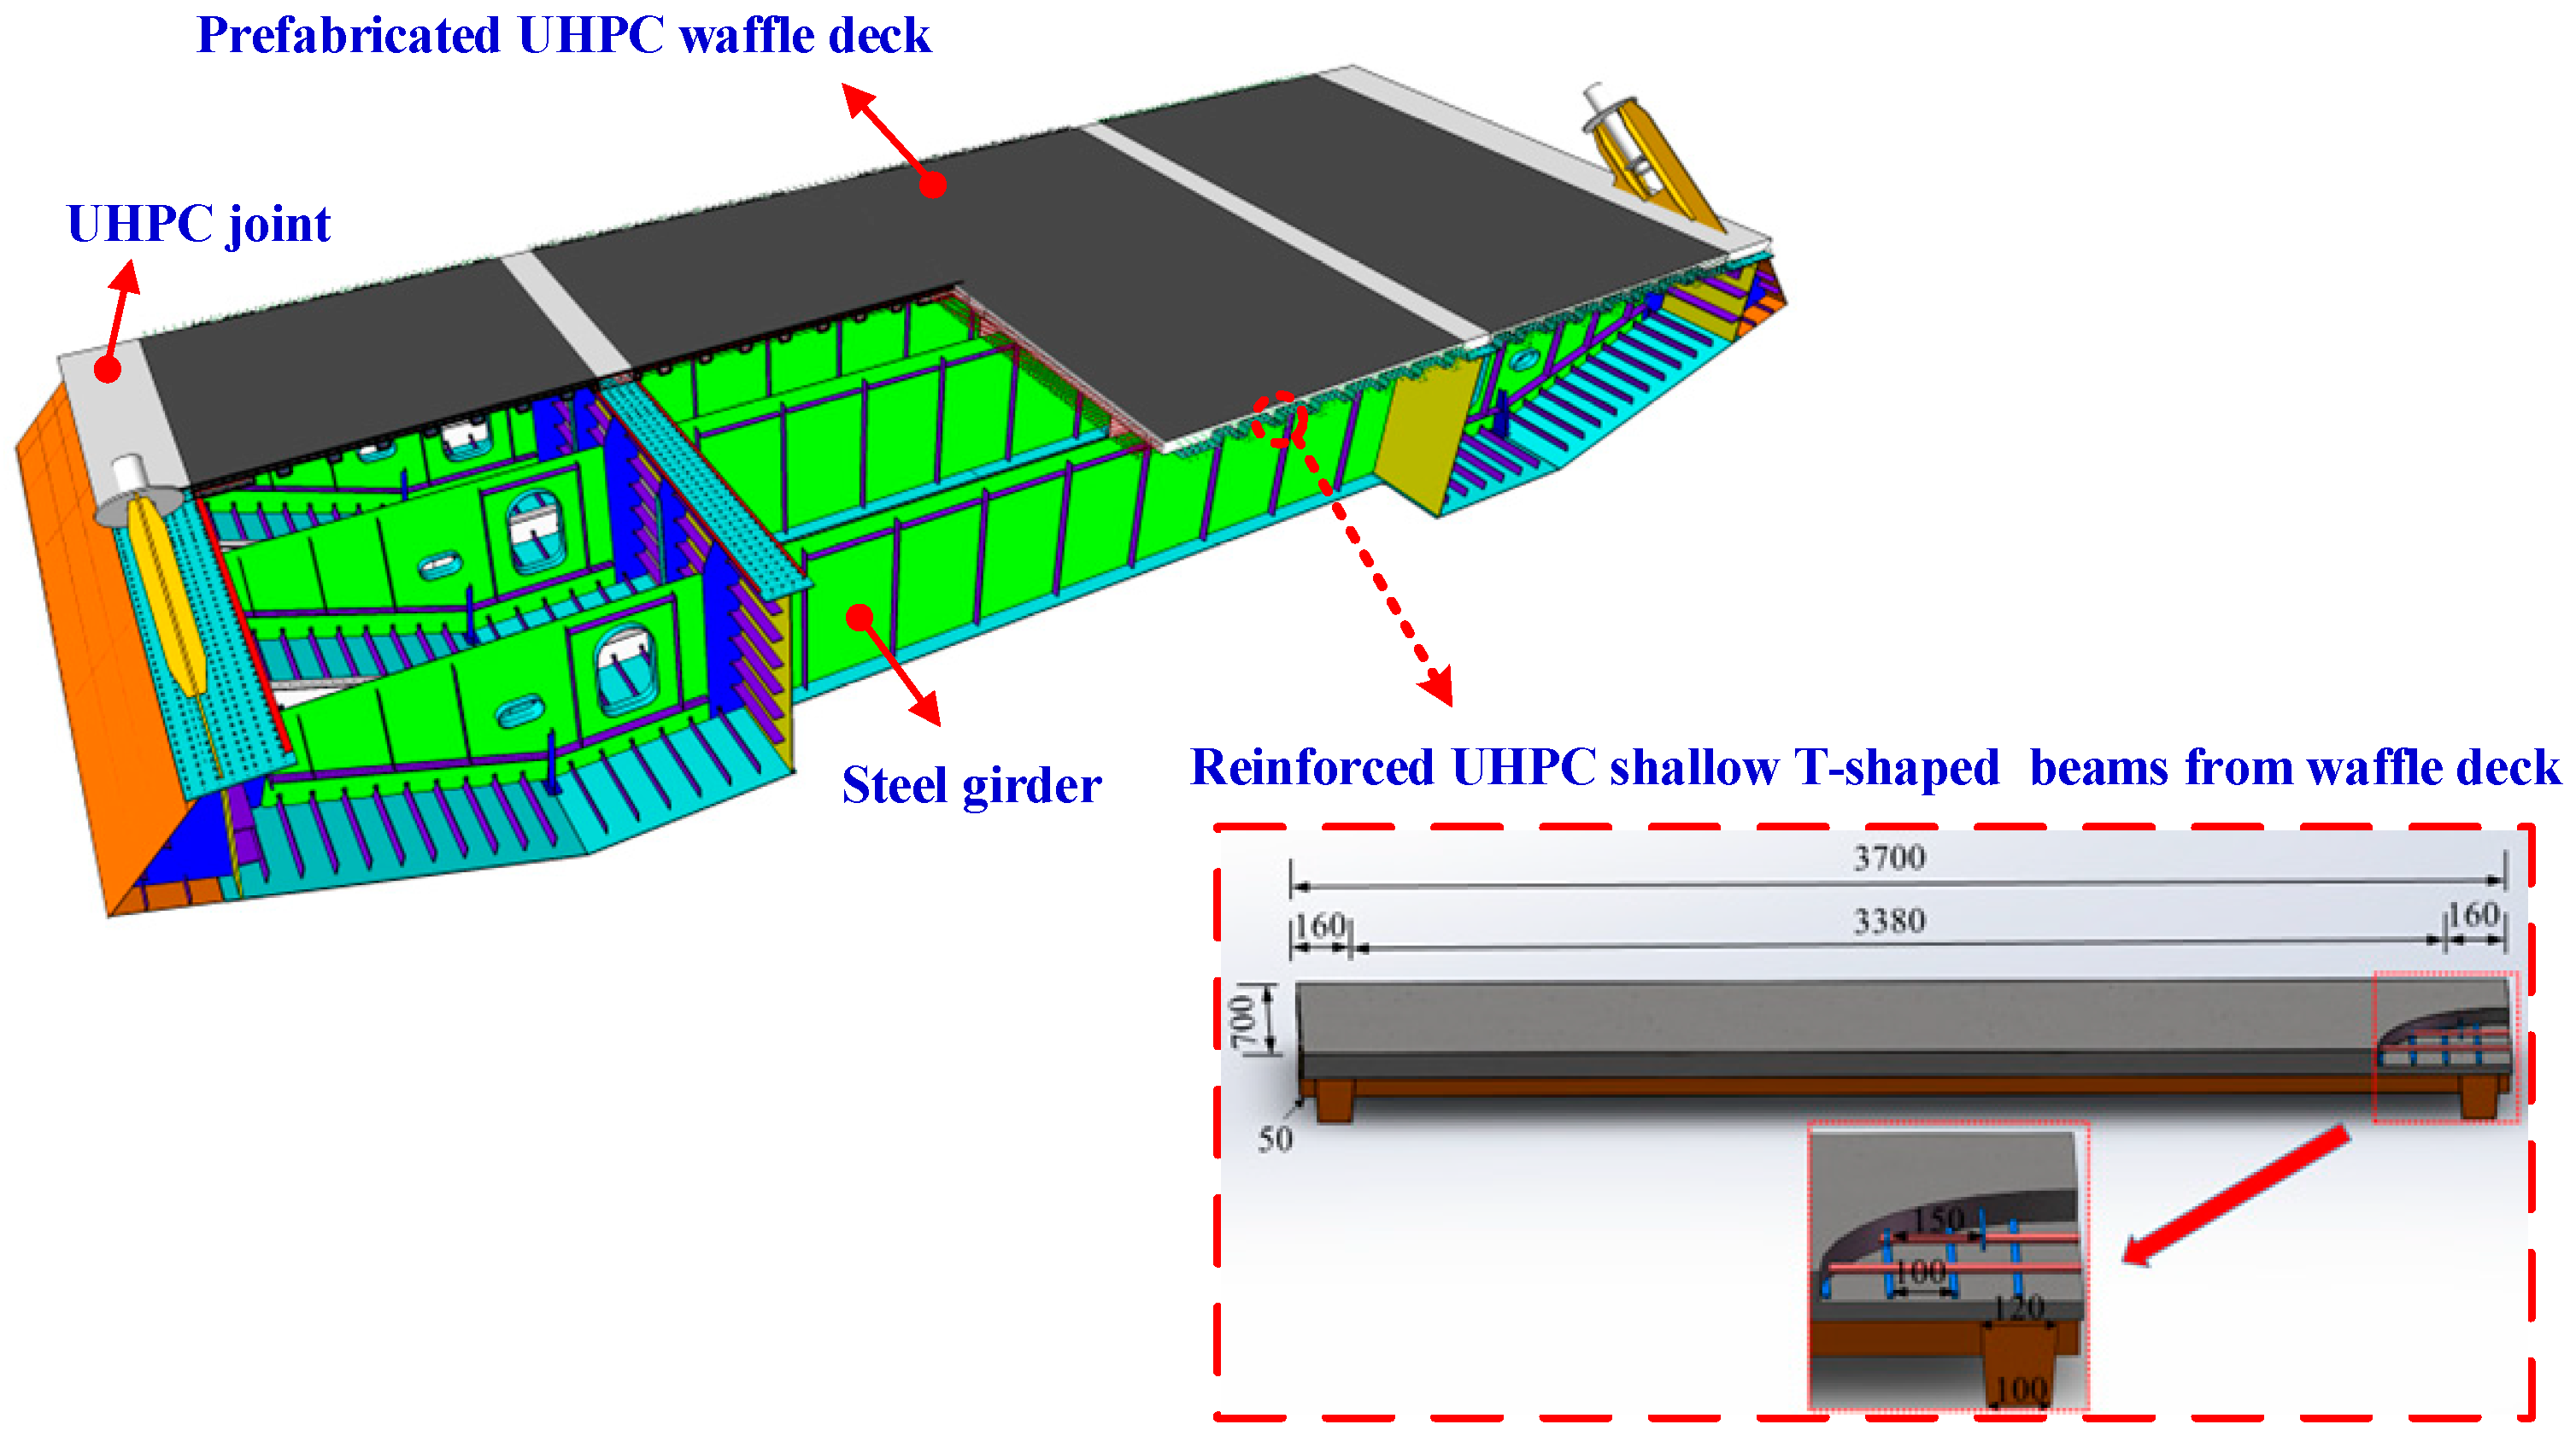
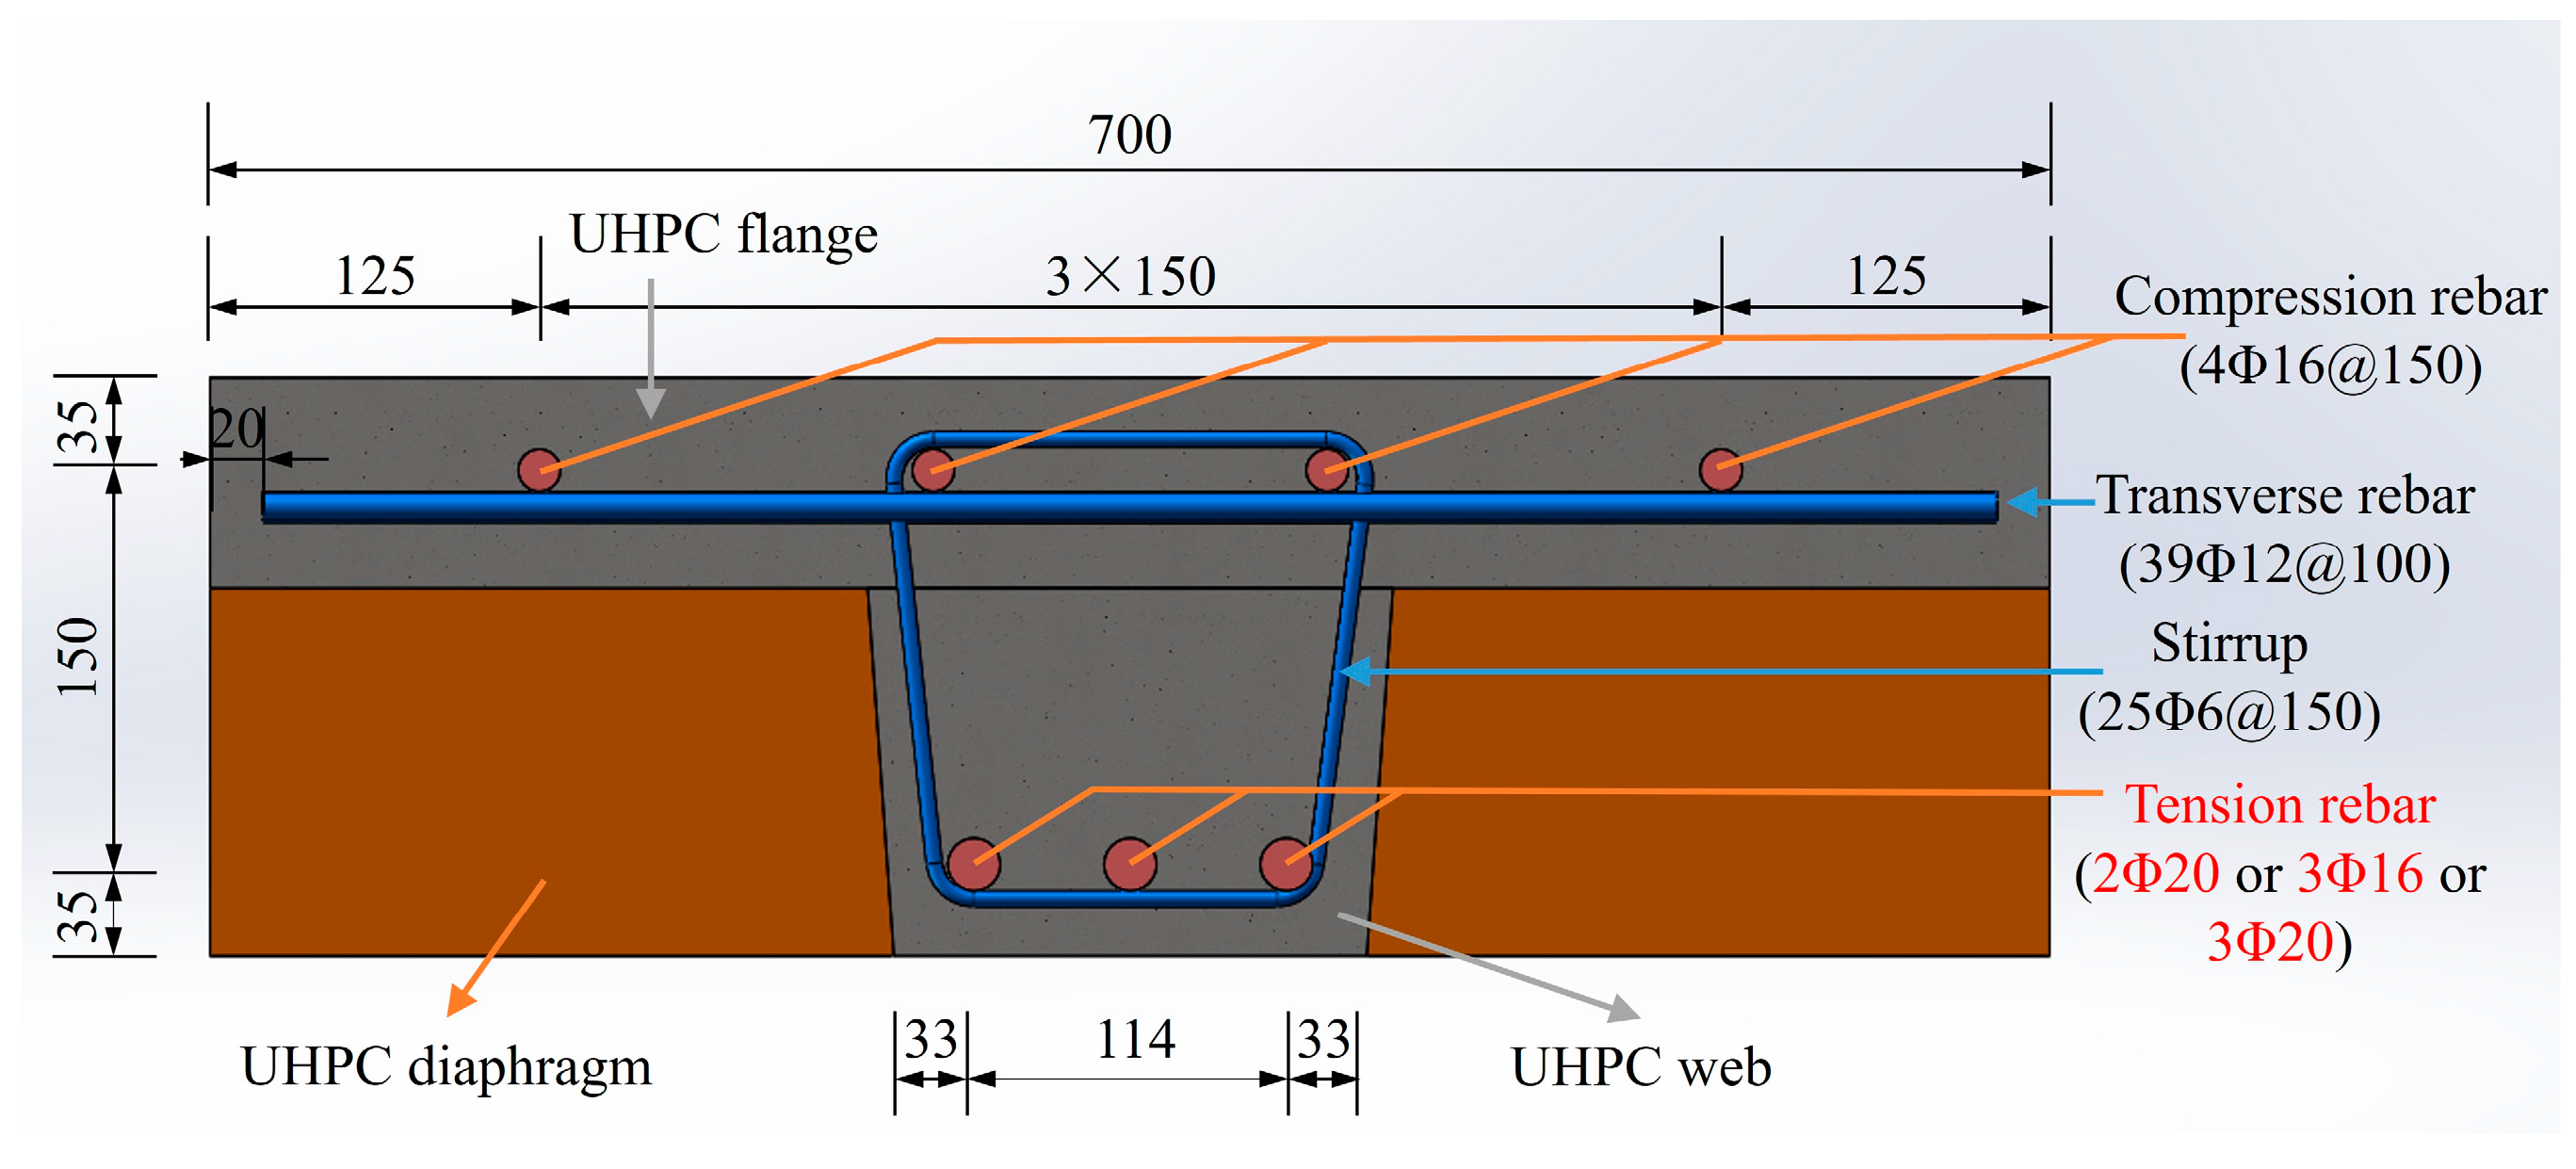
Figure 8 gives a schematic diagram of a steel–UHPC lightweight composite bridge. A reinforced UHPC shallow T-shaped beam is extracted longitudinally from the waffle-type deck of composite bridges as the representative of bending tests. The reinforced UHPC shallow T-shaped specimens employed in the bending tests have a total length of 3.7 m with a calculated diaphragm-to-diaphragm span of 3.5 m. The geometric dimensions of shallow T-shaped specimens are shown in Figure 8. The dimensions of each specimen are identical, comprising a flange width of 70 cm and a flange thickness of 8 cm. The height of the UHPC web with a linear variable width is 14 cm, and its bottom width and top width are 18 cm and 20 cm, respectively. Figure 9 presents a schematic diagram with relevant dimensions and reinforcement details. As shown in Figure 9, the specimens are longitudinally reinforced with steel reinforcements on the tension side and in compression side, respectively. Additionally, some transverse reinforcements and stirrups are equipped to stabilize the longitudinal reinforcements. The details of the reinforcement arrangement are illustrated in Figure 9. Six reinforced UHPC shallow T-shaped specimens are designed and fabricated, with a variable type of steel fibers and a varying reinforcement ratio of longitudinal rebars in tension. The volume fraction of steel fibers within UHPC is 2.5% and the grade of steel rebars is HRB400 in China. The characteristics of the steel fibers used within UHPC are presented in Table 1, while a comprehensive description of measured properties for UHPC material used with varying fiber types is shown in Table 2. Table 3 gives the design parameters of reinforced UHPC shallow T-shaped specimens.

Figure 8.
Geometric dimensions of shallow T-shaped specimen (unit: mm).

Figure 9.
Cross-sectional reinforcement configuration of T-shaped specimen (unit: mm).

Table 1.
Characteristics of steel fibers used within UHPC.
Table 2.
Measured material properties of UHPC material used in this study.
Table 3.
Design parameters of reinforced UHPC shallow T-shaped specimens.
All reinforced UHPC shallow T-shaped specimens are applied to four-point loading where the boundary of the specimen and the distribution beam are simply supported. The experimental setup for the four-point bending tests is illustrated in Figure 10, which includes specimen dimensions, support conditions, and instrumentation used. The loading scheme is set with a step-by-step force-controlled loading in the early stages, followed by displacement-controlled loading after the reinforcement yielding.
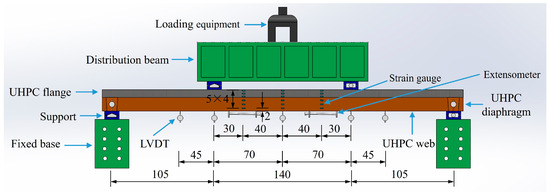
Figure 10.
Experimental setup for the four-point bending tests (unit: cm).
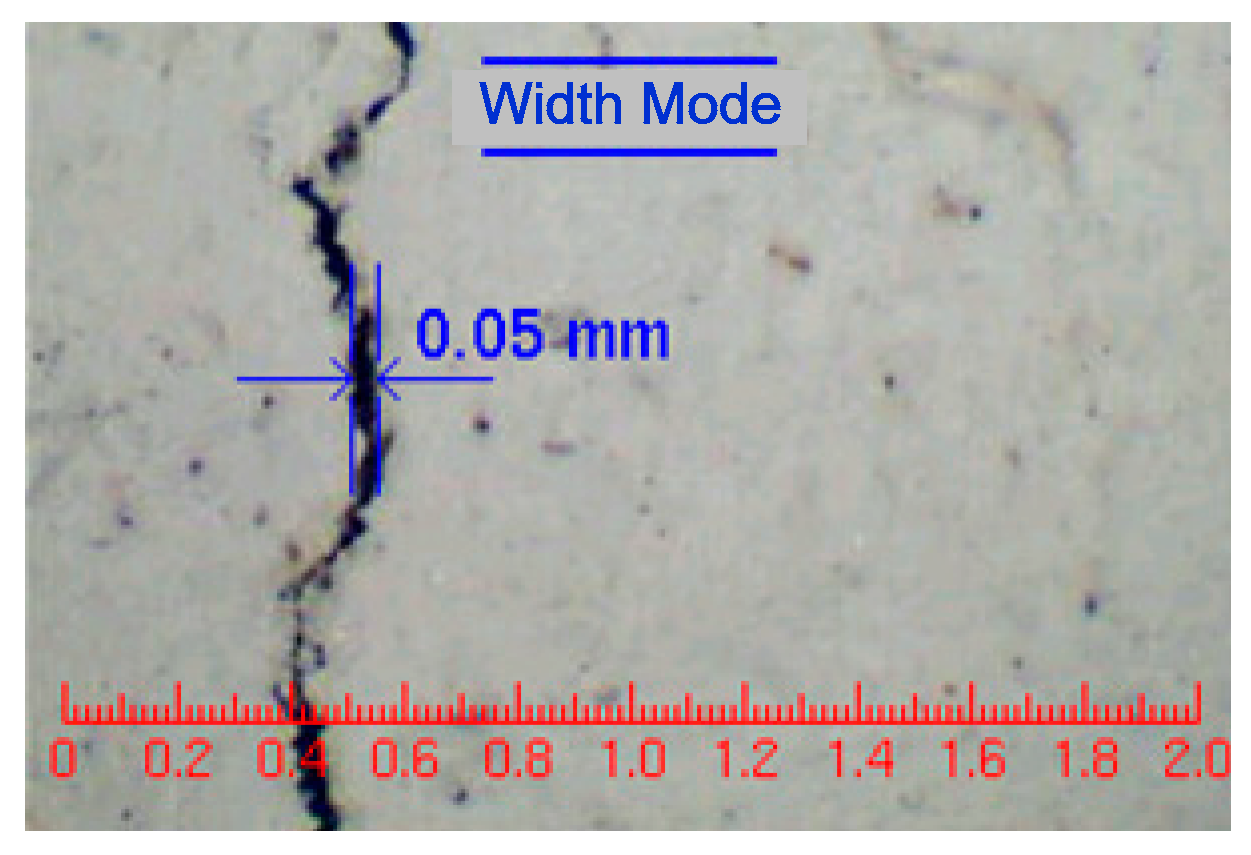
To monitor the deflection variation in reinforced UHPC specimens under four-point loading, five Linear Variable Differential Transformers (LVDTs) are positioned at the mid-span and four loading sections. Moreover, to quantify the deformation of UHPC at post-cracking, two LVDTs are, respectively, installed on the bottom surfaces of chosen cross-sections with a 45 cm spacing from the end of the distribution beam. Within a 1.6 m long middle pure-bending zone of four-point loading, three cross-sections at the mid-span and at the 30 cm to end sections of the distribution beam are selected for the purpose of measuring the strain distribution. On each cross-section chosen, five strain gauges are aligned longitudinally and each is separated by a vertical spacing of 40 mm. As shown in Figure 10, the tension contribution of UHPC, particularly in the post-cracking phase, is measured by averaging the elongations of two extensometers on the bottom faces of chosen sections with a 30 cm distance from the ends of the distribution beam. Furthermore, the distribution and development of cracks during loading are also recorded by using a crack width measuring device. The width and location of the visible crack can be visually obtained and measured using a handheld digital microscope with a magnification of 200 times, as indicated in Figure 11.
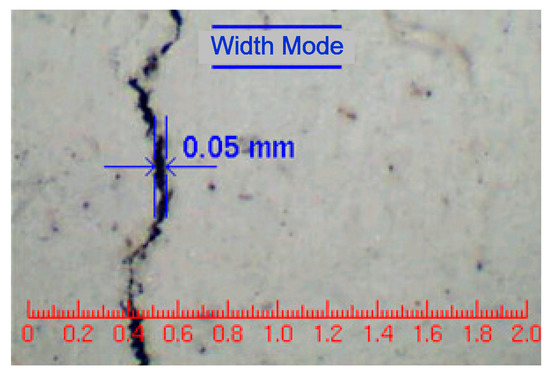
Figure 11.
Measurement of the crack propagation.
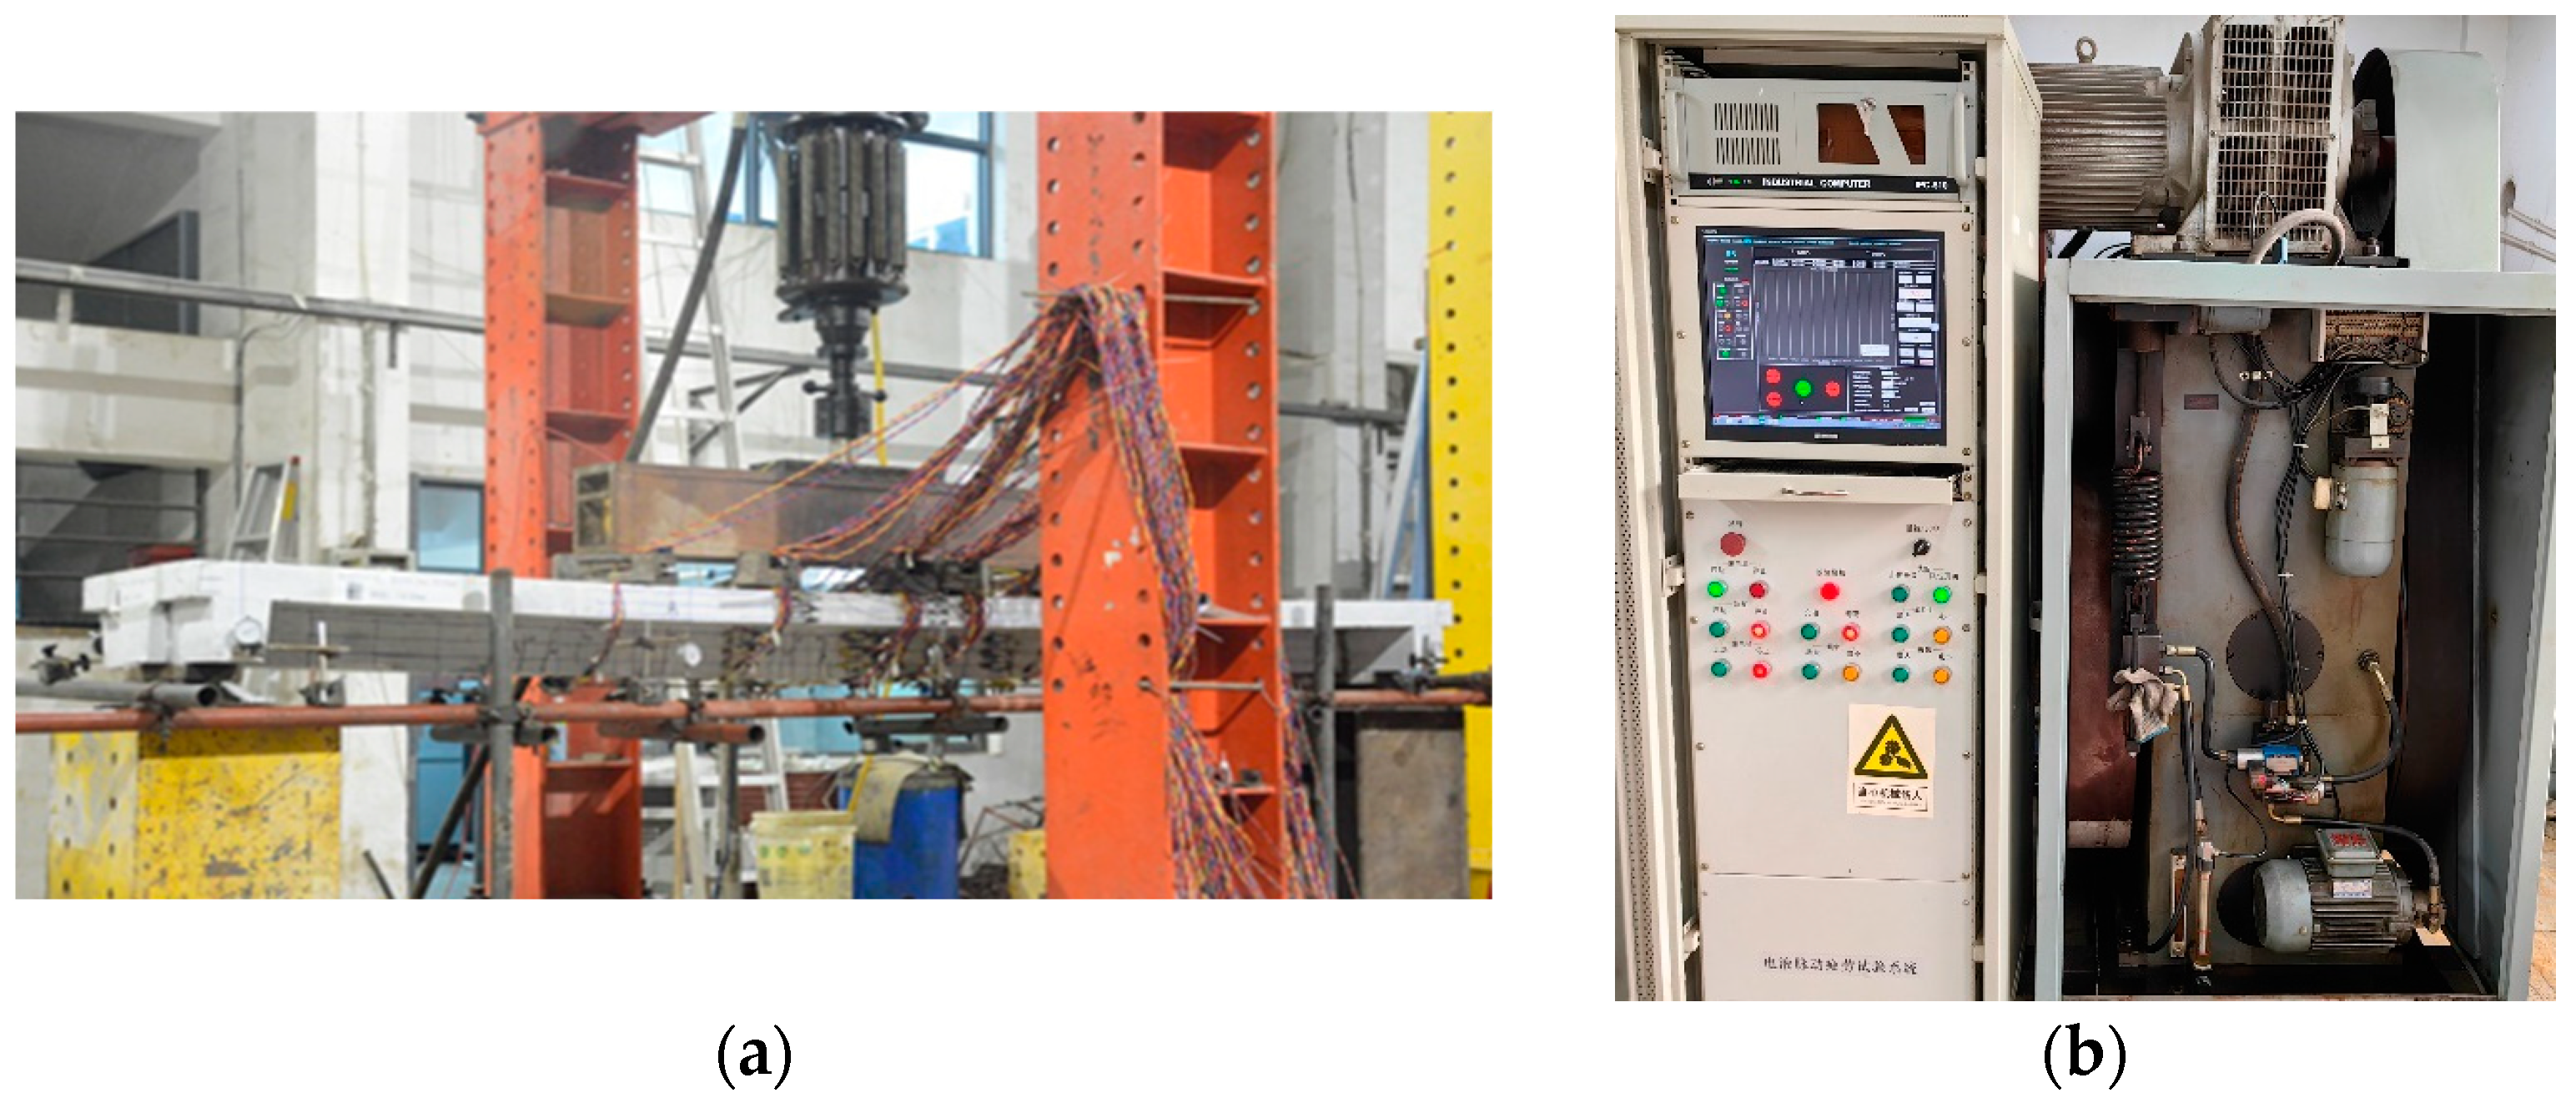
A photo of the test setup and the loading scheme, along with the layout of the measuring points, is illustrated in Figure 12a. Four-point bending tests of reinforced UHPC specimens with shallow T-shaped sections are carried out at Hunan Provincial Key Laboratory of Wind Engineering and Bridge Engineering of Hunan University. The loading equipment used is an electro-hydraulic automatic control testing machine with a load capacity of 500 kN, as shown in Figure 12b.

Figure 12.
Photos of four-point bending tests for reinforced UHPC specimens: (a) test setup and loading scheme; (b) electro-hydraulic automatic control testing machine.
5. Result Analysis and Discussion
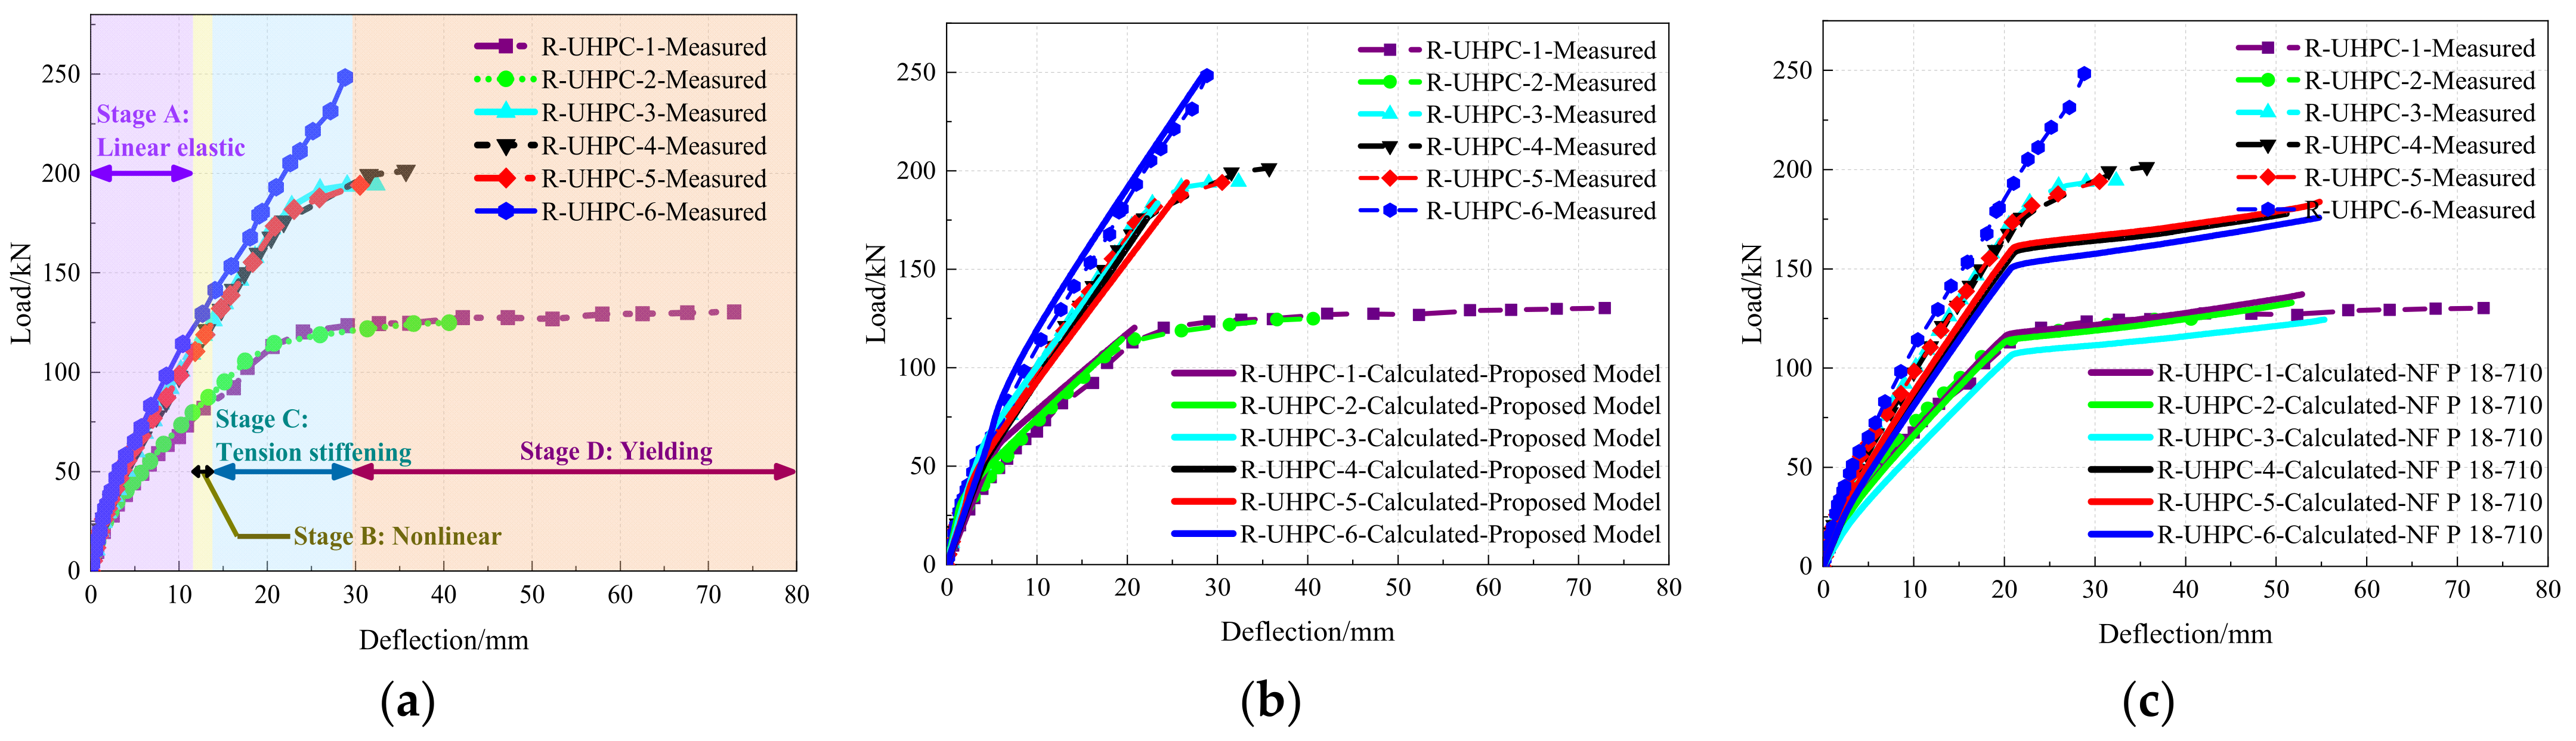
Figure 13a presents the load–deflection curves obtained from the static flexural tests on the reinforced UHPC shallow T-shaped beams, while Figure 13b compares the theoretical load–deflection curves derived from the proposed simplified analysis model with those obtained from the experimental tests. A graphical representation is provided of the load–deflection behavior for all tested specimens in Figure 13a. This figure highlights the different characteristic phases of linear elasticity, non-linear elasticity, tension stiffening, and yielding. As illustrated in Figure 13a, a load–deflection curve can be roughly divided into four distinct stages: the linear elasticity stage, the nonlinear elasticity stage with the emergence of micro-cracks, the tension stiffening stage with rapid propagation of cracks, and the yielding stage with localized macro-cracks. As evidenced by the experimental results, during the initial elastic stage, the load versus mid-span deflection curves of reinforced UHPC specimens exhibit a nearly linear trend, with the flexural stiffness comprising the UHPC and steel reinforcement. As the applied load increases, the emergence of micro-cracks is evident within the reinforced UHPC specimens, resulting in the presence of a nonlinear relationship between load and deflection. With a growing applied load, micro-cracks develop rapidly, and then a macro-crack forms in the weakest zone that is most structurally vulnerable to bending moment, the pure bending zone, thereby leading to a significant reduction in flexural stiffness. This indicates the onset of the tension stiffening stage. During this period, a multitude of observed cracks commence formation, concurrently with the emergence of macro-cracks. It is of particular significance to note that the load-bearing level during this period remains relatively stable despite a substantial increase in mid-span deflection. This phenomenon is attributed to a strain softening but deflection hardening response. During this domain, the effect of strain softening of UHPC plays a significant role in the rapid growth of sectional curvature, resulting in a substantial increase in mid-span deflection. With the propagation of visible cracks, the position of the neutral axis is steadily moved upward along the sectional height. Meanwhile, the force arm of strain-softening UHPC in the tensile zone is gradually increased. In such a case, the load-bearing level is relatively stable for a gentle increase in the resistive moment, indicating a deflection hardening of flexural response. Upon the final yielding stage, the load-bearing capacity of reinforced UHPC shallow T-shaped specimens predominantly remains stabilized despite the reinforcement yielding. This is due to the fact that the compressive UHPC has not yet fully reached its ultimate compressive strength, allowing it to maintain a certain degree of bearing capacity. In such cases, the reinforced UHPC specimens exhibit a sustained increase in deflection with a notable degree of ductility which implies a characterized failure of a balanced-reinforced beam. For instance, the specimen named R-UHPC-1 is loaded gradually under a displacement control following the yielding of the reinforcement. Despite a constant load level, the mid-span deflection of the specimen is observed by a more than twofold increase, indicative of a markedly ductile failure characteristic of the reinforced UHPC T-shaped beam.
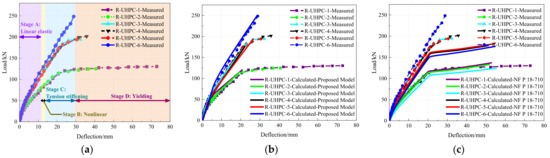
Figure 13.
Load–deflection curves of reinforced UHPC shallow T-shaped specimens: (a) measured load–deflection curves of the whole response; (b) comparison between measured curves and calculated curves derived from the proposed model; and (c) comparison between measured curves and calculated curves based on NF P 18-710.
A favorable comparison between the theoretical values derived from the simplified analysis model previously mentioned and those obtained from measurement in Figure 13b reveals a high degree of agreement. Particularly, with regard to the predicted mid-span deflection of reinforced UHPC specimen, it is observed to be relatively insignificant prior to the onset of reinforcement yielding. Once the reinforcement has yielded, the load-bearing level of the specimen remains approximately constant, while the mid-span deflection increases considerably. The load-bearing capacity of the flexural specimen at the onset of reinforcement yielding is typically defined as the ultimate flexural capacity. As demonstrated in Figure 13b, a moderate divergence is observed between the predicted load–deflection curves and the experimental curves at higher loads. This slight discrepancy may be attributed to the absence of the portion of the effective tensile stress–strain curve prior to microcracking. The simplification is intentionally employed to derive closed-form solutions, facilitating the determination of moment My and curvature φy at the point of reinforcement yielding. From the perspective of structural safety, shallow T-shaped beams are usually not designed to enter the post-yielding stage for real-world engineering application; thus, the proposed simplified analysis model is a feasible and reliable approach for predicting the mid-span deflection of reinforced T-shaped UHPC beams.
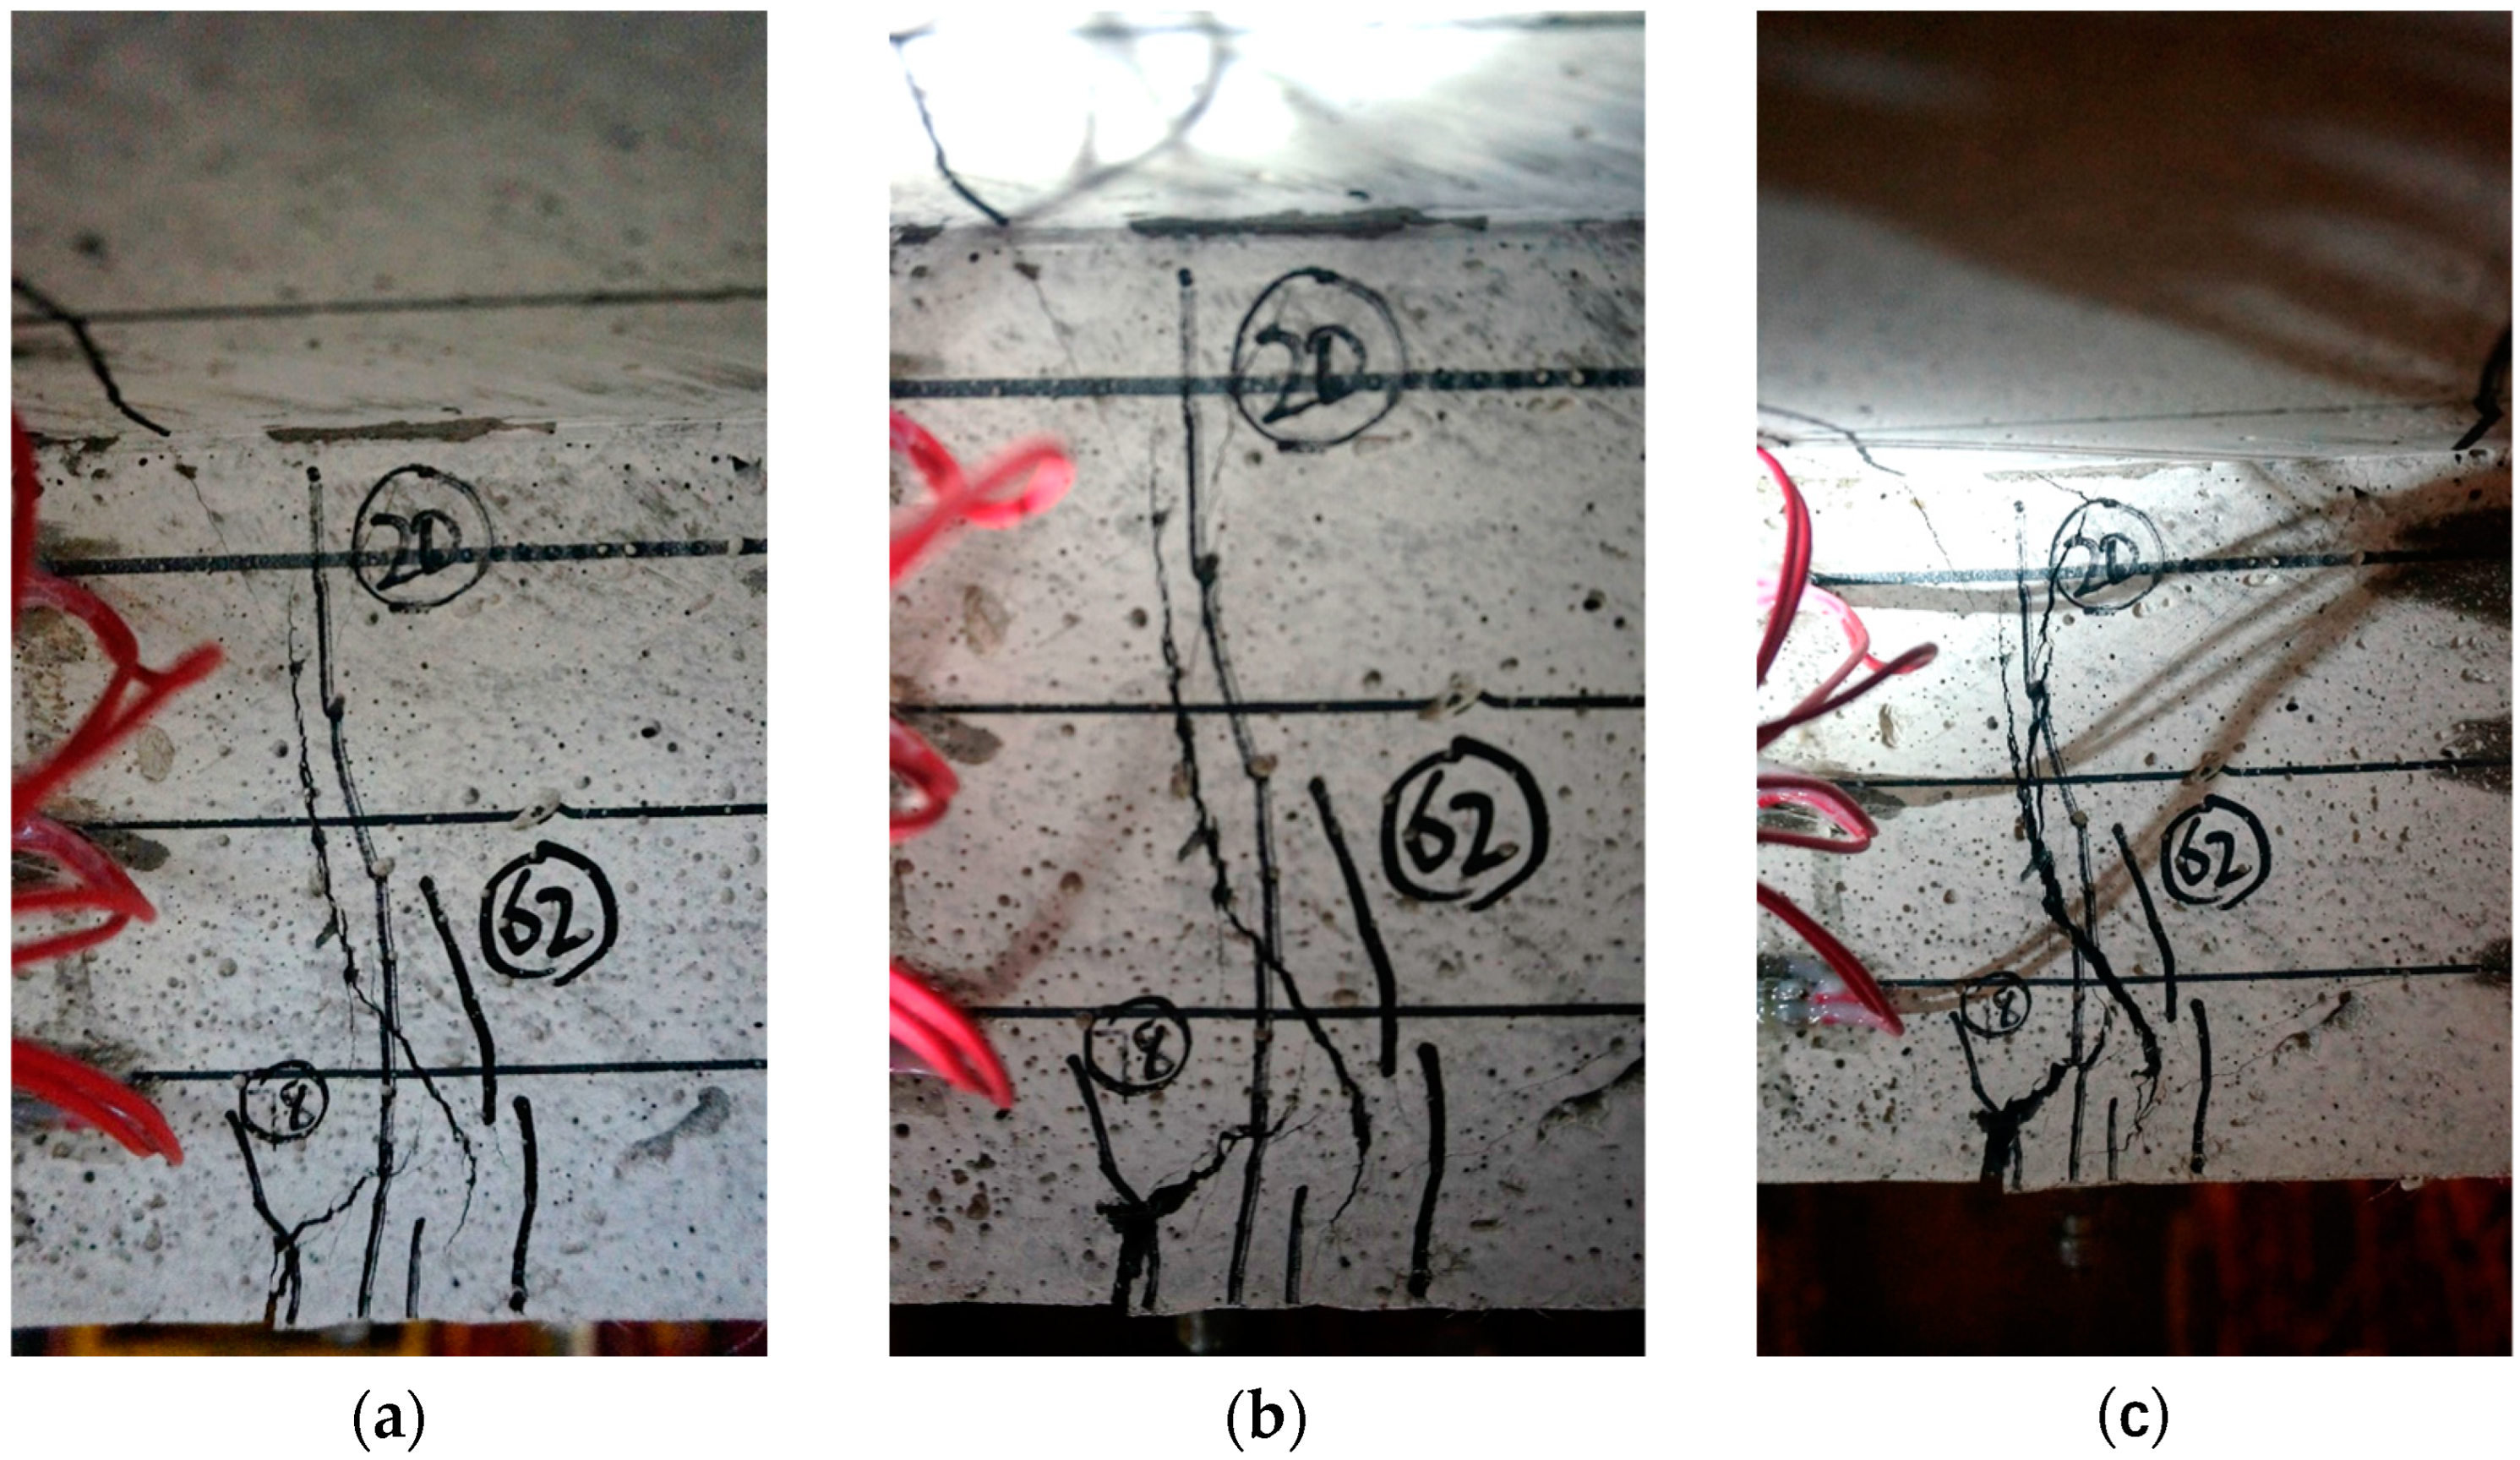
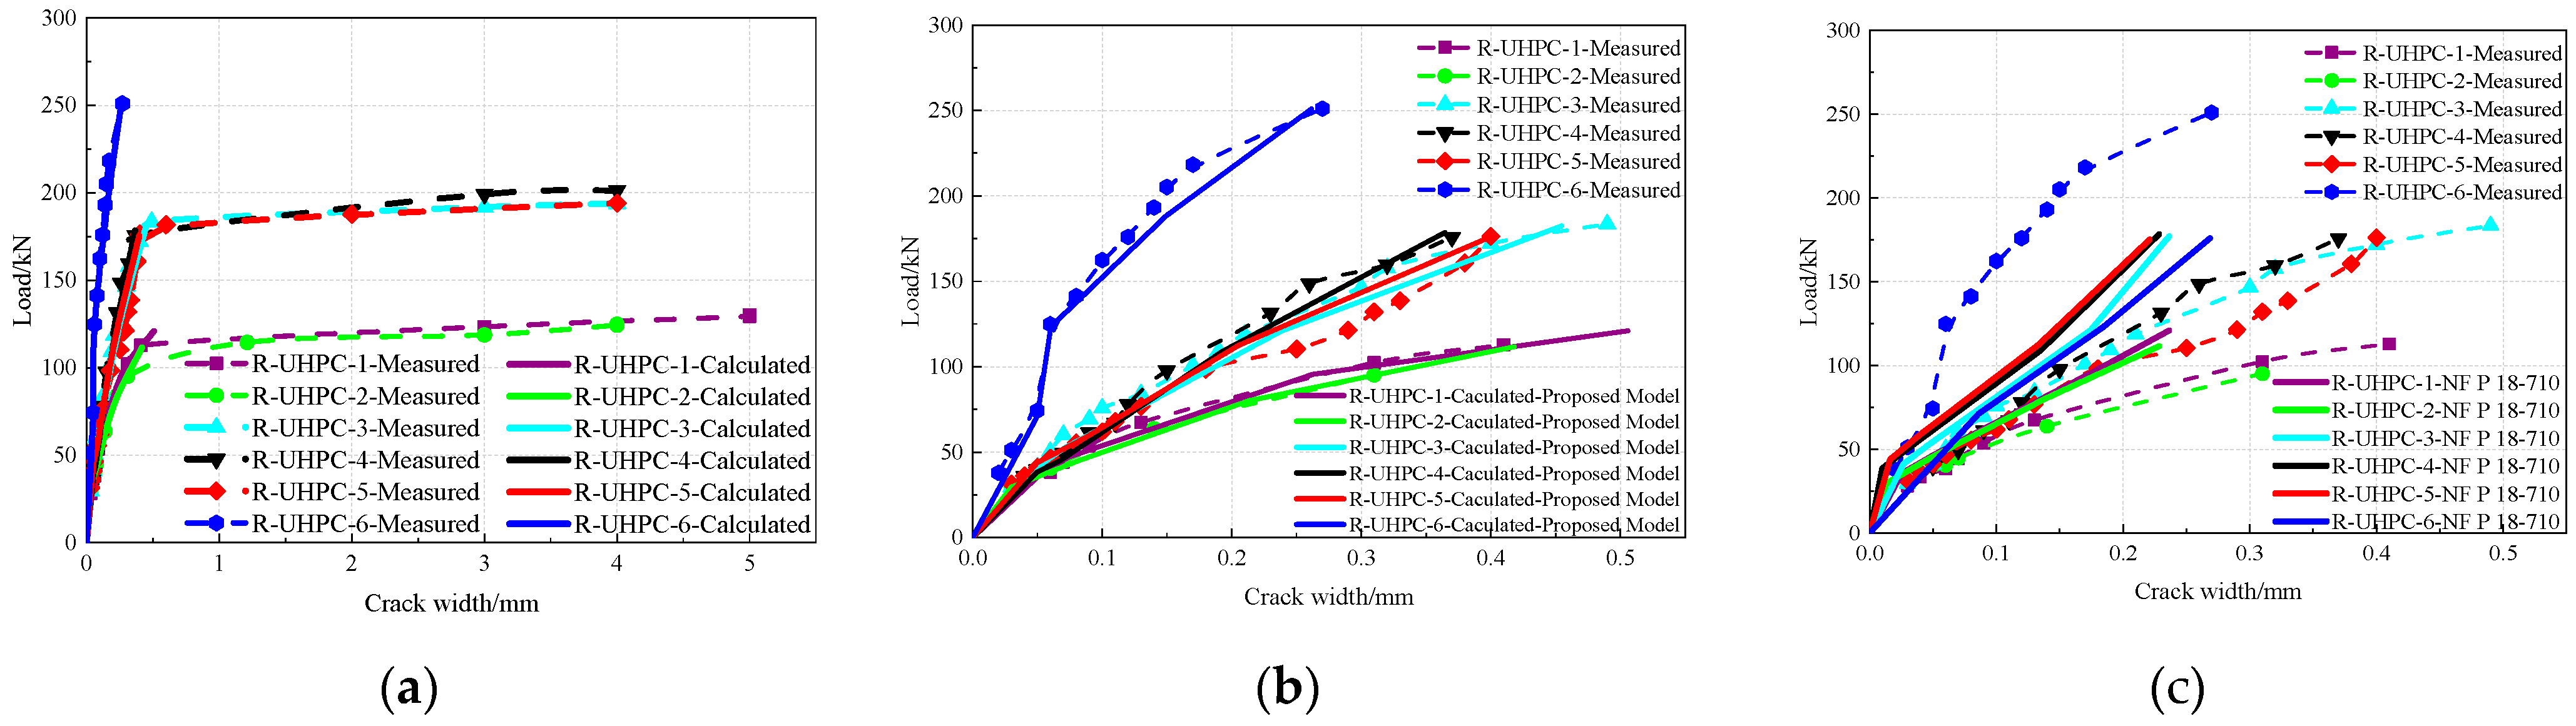
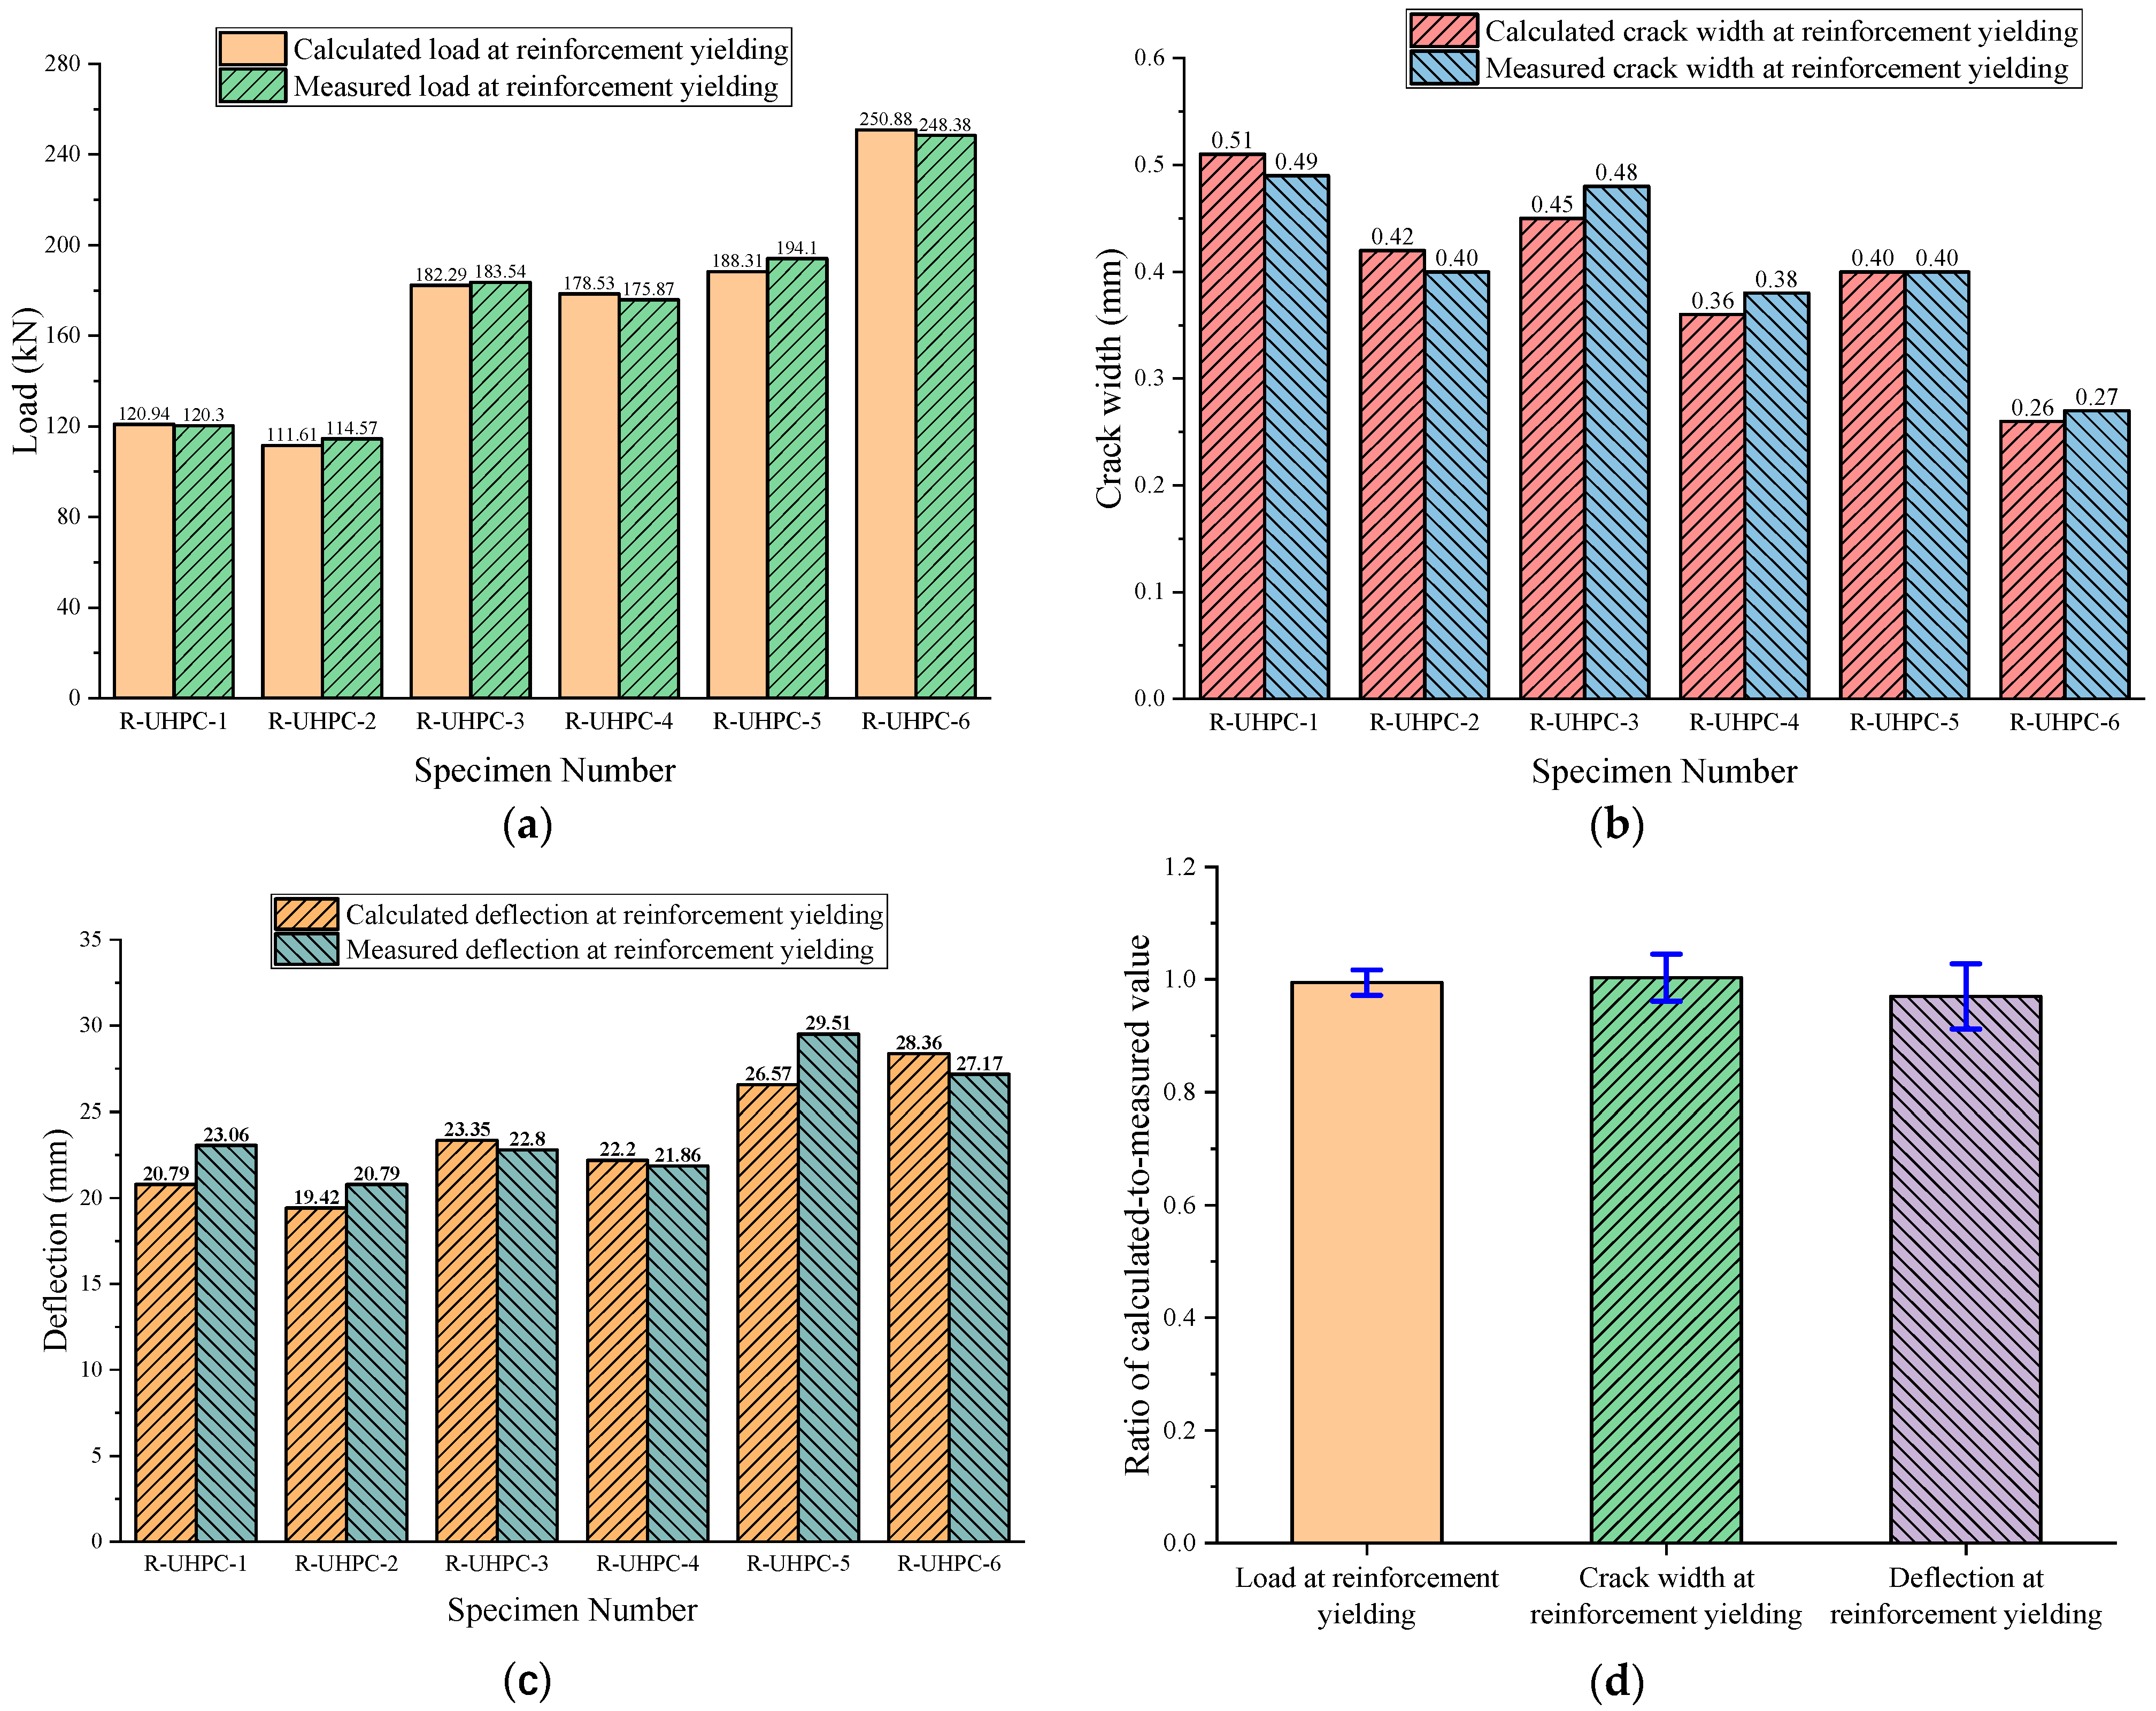
The cracking behavior of the reinforced UHPC shallow T-shaped beams is monitored and documented in great detail throughout the loading process. Taking the specimen of R-UHPC-1 for example, the crack patterns observed during different phases of loading are shown in Figure 14. Figure 15 presents the progression of maximum crack width with applied load for each specimen. The load at which a crack width of 0.05 mm is first observed is defined as the first cracking load hereafter. As illustrated in Figure 15, the observed evolution of cracks within the pure bending zone is also compared with the calculated results to assess the accuracy of the theoretical model. Figure 16 illustrates a more detailed comparison between calculated and measured values of reinforced UHPC shallow T-shaped specimens in terms of loads at first cracking, crack widths at reinforcement yielding, deflections at reinforcement yielding, and the ratios of calculated-to-measured values, respectively. Table 4 compares the measured values of the cracking loads, deflections, and the crack widths at reinforcement yielding along with percentage differences with the calculation results derived from the simplified analysis model. The percentage discrepancies between experimental and predicted values are also outlined. As illustrated in Table 4, the theoretical analysis model is capable of accurately predicting the crack width of the reinforced UHPC flexural specimens, exhibiting a high degree of agreement between the theoretical results and experimental measurements. The ratios of cracking loads at reinforcement yielding by theoretical calculations to the counterparts from experimental measurements are found to be all within 0.96, with an average error of approximately 2.24%. This indicates that the theoretical analysis model can predict cracking loads with a high degree of accuracy. Similarly, the ratios of crack widths at reinforcement yielding theoretically calculated to those experimentally measured are all within a range of 0.9, with an average variation of around 3.48%. This implies that the simplified analysis model also can accurately predict the crack width at the ultimate limit state for reinforced UHPC shallow T-shaped beams. The ratios of deflection by theoretical calculations to the counterparts from experimental measurements are found to be all within 0.90, with an average error of approximately 6.92%. This indicates that the theoretical analysis model can predict deflection with an acceptable accuracy. In summary, the theoretical model proposed for the simplification analysis of reinforced UHPC shallow T-shaped beams is accessible and accurate in its prediction of deflection and crack width, thereby it is promising to provide a valuable reference for the design and calculation of such beams.

Figure 14.
Crack patterns observed during different phases of loading for the specimen of R-UHPC-1. (a) at the stage of nonlinear elasticity; (b) at the stage of tension stiffening; and (c) at the stage of reinforcement yielding.
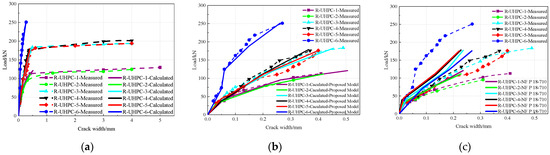
Figure 15.
Load–crack width curves of reinforced UHPC shallow T-shaped specimens in static flexural tests: (a) load–crack width curves of the whole response; (b) comparison between measured curves prior to reinforcement yielding and calculated curves derived from the proposed model; and (c) comparison between measured curves prior to reinforcement yielding and calculated curves based on NF P 18-710.
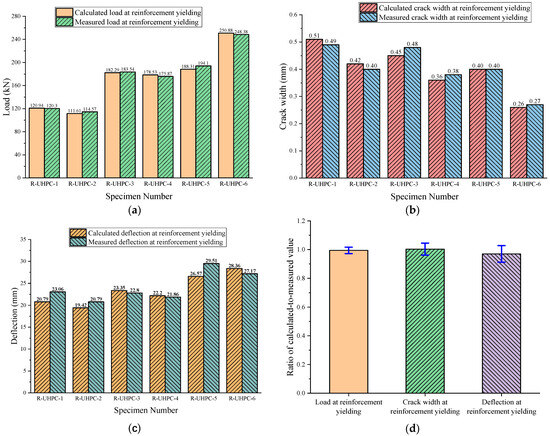
Figure 16.
Graphical comparison between calculated values and measured values of reinforced UHPC shallow T-shaped specimens. (a) Loads at first cracking; (b) crack widths at reinforcement yielding; (c) deflections at reinforcement yielding; and (d) ratios of calculated-to-measured values.
Table 4.
Comparison between calculated values and measured values of reinforced UHPC shallow T-shaped specimens.
6. Conclusions
A simplified analysis model has been introduced in this paper for the prediction of the mid-span deflection and crack width of reinforced UHPC shallow T-shaped beams. The feasibility and accuracy of the proposed simplified analysis model are verified by comparing the theoretical values derived by simplification analysis with the experimental results from the four-point bending tests on six reinforced UHPC shallow T-shaped specimens. The following conclusions are obtained:
- Taking account into several factors including shrinkage and creep of UHPC, the contribution of tensile UHPC, the bond strength of the interface, and the tension stiffening effect, the segmental analysis method of reinforced UHPC shallow beam with T-shaped sections is first established, and then a bilinear simplified analysis model with four characteristic points is derived for determining the mid-span deflection and crack width of reinforced UHPC shallow T-shaped beams.
- The experimental curves of load–deflection for reinforced UHPC shallow T-shaped specimens can be divided into four stages: the linear elastic stage, the nonlinear stage with the emergence of micro-cracks, the tension stiffening stage with rapid propagation of cracks, and the yielding stage with localized macro-cracks. During the initial elastic stage, the load–deflection curve exhibits a nearly linear trend. As the load increases, the emergence of a micro-crack is observed, resulting in a nonlinear relationship between load and deflection. With a growing load, micro-cracks develop rapidly, and then macro-cracks form within the pure bending zone, leading to a significant reduction in flexural stiffness. Following the onset of the tension stiffening stage, observed cracks form with the emergence of macro-cracks. Upon the yielding stage, the load-bearing capacity of reinforced UHPC shallow T-shaped specimens remains stabilized. As such, those specimens exhibit a sustained increase in deflection with a notable ductility characterized by the failure of a balanced-reinforced beam.
- A comparison between the theoretical values derived from the simplified analysis model and those results obtained from experimental measurements reveals a high degree of agreement. With regard to the predicted mid-span deflection of reinforced UHPC specimen, it is observed to be insignificant prior to reinforcement yielding. Once the reinforcement has yielded, the load-bearing level of the specimen remains nearly constant, while the mid-span deflection increases considerably. From the perspective of structural safety, the proposed simplified analysis model is a feasible and reliable approach for predicting the mid-span deflection of reinforced UHPC shallow beams.
- The measured values of the first cracking load and crack width at reinforcement yielding are compared with the calculation results by a simplified analysis model. The ratios of the loads and crack widths at reinforcement yielding by theoretical calculations to the counterparts from experimental measurements are found to be within a range of 0.96 and 0.9, respectively. The average error percentage of 2.2% for the load and 4.2% for the crack width at reinforcement yielding, respectively, indicating that the theoretical analysis model is capable of predicting cracking loads and crack widths with a high degree of accuracy.
Eventually, the simplified analysis model proposed for reinforced UHPC shallow T-shaped beams is accessible and accurate in its prediction of deflection and crack width, promising to provide a valuable reference for the design and calculation of such beams.
Despite acceptable feasibility and accuracy, it is crucial to acknowledge the limitations of the present study, including the relatively small sample size (only six beams) and the absence of long-term performance evaluation. Moreover, the proposed simplified analysis model is advised to be incorporated into design codes or guidelines for UHPC-based beams or structural elements. Additionally, further validation of the proposed simplified model is required through large-scale experimental tests, alternative specimens with higher reinforcement ratios, or beams subjected to cyclic or dynamic loading. From the perspective of future research orientations, it is recommended to expand the proposed simplified analysis model to incorporate other factors, such as reinforcement corrosion effects, temperature variations, or alternative formulations of UHPC tensile response.
Author Contributions
Conceptualization, methodology, and funding acquisition, Z.Z.; investigation, visualization, Y.W.; project administration, writing—original draft preparation, B.Y.; supervision, writing—review and editing, P.Z. All authors have read and agreed to the published version of the manuscript.
Funding
The authors appreciate the support from the Natural Science Foundation of Hunan Province, China (Grant No. 2023JJ30216), the Excellent Youth Foundation from the Department of Education, Hunan Province (Grant No. 23B0576), and the Natural Science Foundation of Chongqing, China (CSTB2024NSCQ-MSX1206), respectively. Moreover, the authors thank the support from the National Natural Science Foundation of China (Grant No. 51808212).
Data Availability Statement
Data are contained within the article.
Conflicts of Interest
The authors declare no conflicts of interest.
References
- Nie, J.G.; Tao, M.X.; Wu, L.L.; Nie, X.; Li, F.X.; Lei, F.L. Advances of Research on Steel-concrete Composite Bridges. China Civ. Eng. J. 2012, 45, 110–122. [Google Scholar]
- Nie, J. The Future of Structural Engineering in China—High-performance structural Engineering. China Civ. Eng. J. 2016, 49, 1–8. [Google Scholar]
- Xiang, H. The future trend of the world’s bridges—Inspiration from the 2011 London International Bridge Association Conference. In Proceedings of the 20th National Bridge Association Conference of China, Wuhan, China, 1 May 2012; pp. 18–25. [Google Scholar]
- Russell, H.G.; Graybeal, B. Ultra-High Performance Concrete: A State-of-the-Art Report for the Bridge Community; US Department of Transportation, Federal Highway Administration: McLean, VA, USA, 2013. [Google Scholar]
- Shao, X.D.; Cao, J.H.; Yi, D.T.; Chen, B.; Huang, Z.Y. Research on Basic Performance of Composite Bridge Deck System with Orthotropic Steel Deck and Thin RPC Layer. China J. Highw. Transp. 2012, 25, 40–45. [Google Scholar]
- Shi, C.; Wu, Z.; Xiao, J.; Wang, D.; Huang, Z.; Fang, Z. A review on Ultra High Performance Concrete: Part I. Raw materials and mixture design. Constr. Build. Mater. 2015, 101, 741–751. [Google Scholar] [CrossRef]
- Wang, D.; Shi, C.; Wu, Z.; Xiao, J.; Huang, Z.; Fang, Z. A review on Ultra High Performance Concrete: Part II. Hydration, microstructure and properties. Constr. Build. Mater. 2015, 96, 368–377. [Google Scholar] [CrossRef]
- Yoo, D.Y.; Banthia, N. Mechanical properties of Ultra-High-Performance Fiber-Reinforced Concrete: A review. Cem. Concr. Compos. 2016, 73, 267–280. [Google Scholar] [CrossRef]
- Yoo, D.Y.; Yoon, Y.S. A review on structural behavior, design, and application of Ultra-High Performance Fiber-Reinforced Concrete. Int. J. Concr. Struct. Mater. 2016, 10, 125–142. [Google Scholar] [CrossRef]
- Bahmani, H.; Mostafaei, H.; Santos, P.; Fallah Chamasemani, N. Enhancing the mechanical properties of Ultra-High-Performance Concrete (UHPC) through silica sand replacement with steel slag. Buildings 2024, 14, 3520. [Google Scholar] [CrossRef]
- Shao, X.; Zhan, H.; Lei, W.; Zhang, Z. Conceptual Design and Preliminary Experiment of Super-long-span Continuous Box-girder Bridge Composed of One-way Prestressed UHPC. China Civ. Eng. J. 2013, 46, 83–89. [Google Scholar]
- Shao, X.D.; Qiu, M.H.; Yan, B.F.; Luo, J. A Review on the Research and Application of Ultra-high Performance Concrete in Bridge Engineering Around the World. Mater. Rep. 2017, 31, 33–43. [Google Scholar]
- Shao, X.; Cao, J. Research and Application of High Performance Bridge Structures Toward Future. J. Archit. Civ. Eng. 2017, 34, 41–58. [Google Scholar]
- Shao, X.D.; Wu, J.J.; Liu, R.; Li, Z. Basic Performance of Waffle Deck Panel of Lightweight Steel-UHPC Composite Bridge. China J. Highw. Transp. 2017, 30, 218–225+245. [Google Scholar]
- Zhu, J.; Wang, Y.; Yan, J.; Guo, X. Shear behaviour of steel-UHPC composite beams in waffle bridge deck. Compos. Struct. 2020, 234, 111678. [Google Scholar] [CrossRef]
- Shao, X.D.; Wu, J.J.; Liu, R.; Li, Z. Experimental Research Mechanical Performance of Normal Section of Reinforced Reactive Powder Concrete Beam. J. Build. Struct. 2011, 32, 125–134. [Google Scholar]
- Zheng, W.; Lu, S.; Li, L. Experimental Research on Mechanical Performance of Reactive Powder Concrete Beams Reinforced with GFRP Bars. J. Build. Struct. 2011, 32, 115–124. [Google Scholar]
- Kwahk, I.; Lee, J.; Kim, J.; Joh, C. Evaluation of the Crack Width of the Ultra High Performance Concrete(K-UHPC) Structures. J. Korean Soc. Saf. 2012, 27, 99–108. [Google Scholar]
- Leutbecher, T.; Fehling, E. Tensile Behavior of Ultra-High-Performance Concrete Reinforced with Reinforcing Bars and Fibers: Minimizing Fiber Content. ACI Struct. J. 2012, 109, 253–263. [Google Scholar]
- Xu, H.; Deng, Z. Cracking Moment and Crack Width of Ultra-high Performance Concrete Beams. J. Harbin Inst. Technol. 2014, 46, 87–92. [Google Scholar]
- Deng, Z.; Xiao, R.; Xu, H.; Chen, C.; Chen, X. Serviceability Research of Ultra-High performance concrete Beams Reinforced with High Strength Steel Bars. J. Harbin Inst. Technol. 2015, 36, 1335–1340. [Google Scholar]
- Zhao, C.; Wang, C.; Li, L. Experimental Study on Calculation Method of Crack Width of Reactive Powder Concrete Slab. J. Highw. Transp. Res. Dev. Appl. Technol. Ed. 2017, 13, 251–254+301. [Google Scholar]
- Sturm, A.B.; Visintin, P.; Oehlers, D.J.; Seracino, R. Time-dependent tension-stiffening mechanics of fiber-reinforced and Ultra-High-Performance Fiber-Reinforced Concrete. J. Struct. Eng. 2018, 144, 04018122. [Google Scholar] [CrossRef]
- Sturm, A.B.; Visintin, P.; Oehlers, D.J. Rational Design Approach for the Instantaneous and Time-dependent Serviceability Deflections and Crack Widths of FRC and UHPFRC Continuous and Simply Supported Beams. J. Struct. Eng. 2019, 145, 4019138. [Google Scholar] [CrossRef]
- Qiu, M.H.; Shao, X.D.; Hu, W.Y.; Zhao, X.D.; Wang, Y. Calculation Method for Crack Width of Reinforced UHPC Flexural Components. China Civ. Eng. J. 2020, 53, 89–98+119. [Google Scholar]
- International Federation for Structural Concrete (fib). CEB-FIP Model Code 2010; International Federation for Structural Concrete: Lausanne, Switzerland, 2010. [Google Scholar]
- AFGC-SETRA. Ultra High Performance Fiber-Reinforced Concrete Recommendations; AFGC-SETRA Working Group: Pairs, France, 2013. [Google Scholar]
- NF P 18-710; National Addition to Eurocode 2—Design of Concrete Structures: Specific Rules for Ultra-High Performance Fibre-Reinforced Concrete (UHPFRC). Association Française de Normalisation: Paris, France, 2016.
- Wille, K.; El-Tawil, S.; Naaman, A.E. Properties of strain hardening Ultra High Performance Fiber Reinforced Concrete (UHPFRC) under direct tensile loading. Cem. Concr. Compos. 2014, 48, 53–66. [Google Scholar] [CrossRef]
- Zhang, Z. Bending Behaviors of Composite Bridge Deck System Composed of OSD and Reinforced UHPC Layer. Ph.D. Thesis, Hunan University, Changsha, China, 2016. [Google Scholar]
- Hillerborg, A. A Model for Fracture Analysis; Lund Institute of Technology, Division of Building Materials: Lund, Sweden, 1978. [Google Scholar]
- Gilbert, R.I.; Ranzi, G. Time-Dependent Behaviour of Concrete Structures; CRC Press: Boca Raton, FL, USA, 2010. [Google Scholar]


Disclaimer/Publisher’s Note: The statements, opinions and data contained in all publications are solely those of the individual author(s) and contributor(s) and not of MDPI and/or the editor(s). MDPI and/or the editor(s) disclaim responsibility for any injury to people or property resulting from any ideas, methods, instructions or products referred to in the content. |
© 2025 by the authors. Licensee MDPI, Basel, Switzerland. This article is an open access article distributed under the terms and conditions of the Creative Commons Attribution (CC BY) license (https://creativecommons.org/licenses/by/4.0/).