Abstract
As an important indicator of the level of urban economic development and the quality of the residents’ lives, housing prices are affected by various factors, such as the spatial distribution of the housing market, the housing characteristics of neighborhoods, and the location conditions. This paper summarizes the spatial distribution of housing prices in Qingdao using GIS, analyzing spatial distribution characteristics, and combines these with the Geographically Weighted Regression (GWR) model to explore the influence of various factors, such as community attributes, location, transportation, and peripheral facilities on residential prices. The results show that from 2003 to 2023, residential housing prices in Qingdao exhibited a significant, continuous upward trend, with rapid growth in the early period and more stable growth in the later period; the spatial structure of residential prices evolved from a “single core” in Shinan District to a “double core + fan” structure involving both Shinan and Laoshan Districts, eventually forming a “double core + fan + mosaic” spatial layout; the green environment, congestion, leisure facilities, service management, and other community factors not only reflect the economic strengths and lifestyles of the residents, but also serve as key drivers of residential price differentiation.
1. Introduction
In the nearly 30 years since the marketization of housing in China, a flexible and diverse housing allocation policy has been implemented [1,2]. However, with the continuous development of the economy and society, there has been a significant change in housing demand, with residents now having higher requirements for the comfort of the living environment and the perfection of supporting facilities, and a tendency to choose the urban core or areas with unique natural and humanistic landscapes [3,4]. The diversification of residential demand directly leads to differences in the choice of residential areas, and through the fluctuation and differentiation of residential prices, these differences can be specifically reflected [5]. The spatial dependence and spatial heterogeneity of residential prices directly affect residents’ quality of life and the city’s socio-economic development, which is related to the stability of the real estate market and the healthy operation of the macro-economy [6,7]. The ongoing reconfiguration of urban space and the persistent imbalance in resource allocation has served to underscore the significance of residential price differentiation, thereby prompting scholars both domestically and internationally to undertake in-depth research on the characteristics of spatial differentiation of residential prices, the evolution mechanisms, and the price prediction models [8,9].
In the past, scholars from abroad have directed their attention towards the issue of the spatial differentiation of residential prices, and in doing so, have proposed a variety of theoretical models and methods. Early research concentrated on economics, sociology, and urban planning, amongst other disciplines. In the field of economics, the predominant approach has been to employ the theoretical framework of neoclassical economics, utilizing economic models to quantitatively analyze the impact of market forces (such as income level, population growth, credit conditions, etc.) on the equilibrium of supply and demand for residential housing across different regions. This, in turn, gives rise to price variations [10,11]. Conversely, sociologists have delved into the social underpinnings that shape spatial variations in residential prices. They have done so by meticulously examining community structure, social stratification, and their repercussions for residential prices [12,13]. In a similar vein, urban planners investigate the influence of urban structure on spatial residential price differentiation. This is achieved by analyzing urban layout, infrastructure configuration, and land use policies [14,15].
Current domestic research in China focuses on the spatial differentiation characteristics of housing prices at different scales, such as nationwide [16,17,18], economic belts and economic zones [19,20], and key cities and their internal spaces [21,22,23], and explores in depth the influencing factors and formation mechanisms behind them [24,25]. The discussion of the influencing factors covers both micro and macro levels, with the micro level focusing on the attributes of residential property, detailed variables such as housing attributes, location conditions [26], natural landscape and service support [27,28], which directly affect the attractiveness and market positioning of residential property, and the macro level focusing on the overall market position of residential property, as well as general factors such as the level of urban economic development [3,20], the administrative hierarchy and the size of the population [29,30], which provide broader constraints and scope for the development of the spatial pattern of the housing market. With the development of geographic information systems (GIS) and spatial statistical methods, spatial econometrics has gradually become an important tool for studying the spatial differentiation of housing prices, which is used to deal with the spatial non-independence and heterogeneity of the factors influencing housing prices. There is a significant trend in domestic research focusing on the spatial differentiation of residential prices, and the research perspective has shifted from traditional qualitative descriptions to in-depth quantitative analyses, which is notably reflected in first-tier cities such as Beijing [31,32,33], Shanghai [34,35,36,37], Nanjing [9,38], Hangzhou [39,40] and a number of key second-tier cities. The research methodology can be broadly divided into two categories: one uses GIS and geostatistics to analyze the spatial distribution pattern of residential prices and its inherent laws, including the use of exploratory data analysis [41], spatial interpolation [42,43] and other technical means, aiming to accurately depict the spatial characteristics of the spatial variation of residential prices within the city in a quantitative manner; the other focuses on the quantitative analysis of the factors influencing residential prices and constructs the Hedonic Price Model (HPM) based on the market equilibrium theory of supply and demand perspectives and residential characteristics. The model decomposes residential price values into residential attributes such as building type and newness [27,44], community environment and management level [31,45], as well as location conditions such as distance to the city center [46], landscape quality [39,47], school district attributes [28,48,49,50], public transport accessibility [32,51], and the level of infrastructure and ancillary services [42,52] in order to comprehensively analyze the mechanisms of residential price formation.
However, although the characteristic price model is based on the assumption of a spatial mean, it can only reflect the simple mean relationship between the two, and fails to fully explore the spatial heterogeneity between the variables. That is to say, it ignores the possible differentiation effects of the influencing factors on the residential prices under different spatial locations, which restricts the model’s ability to comprehensively analyze the complex market environment. In contrast, the Geographical Weighted Regression (GWR) model introduces the first law of geography into multiple linear regression analysis, thereby generating local regression results for each data point. This is achieved by incorporating geographic location parameters into the model, thus unveiling the distinct effects of influencing factors across different regions. The GWR model has been demonstrated to be highly advantageous in the context of analyzing spatial variations in residential prices and capturing price changes. It has been observed to exhibit superior flexibility and accuracy in capturing the micro-mechanisms underpinning price changes, thereby facilitating a more nuanced and precise understanding of the spatial dynamics of residential prices when compared to conventional price models.
Despite the considerable progress made by foreign studies in analyzing various aspects of spatial differences in housing prices, the majority of extant studies are confined to case studies of a single city or country, and do not sufficiently take into account the special economic and social contextual factors of some specific regions. Qingdao, a major economic and cultural hub along China’s eastern coastal region, stands out for its thriving maritime and tourism sectors. In contrast to Beijing, the political capital, and Shanghai, the economic center, Qingdao provides a distinctive example of a second-tier coastal city influenced by both historical and modern factors. Secondly, the city’s unique urban structure, shaped by the confluence of coastal geography and rapid urbanization, offers a distinctive context for examining spatial variations in residential property prices. The present study adopts an empirical research approach, taking Qingdao as the object of study. Firstly, relying on the GIS10.8.1 spatial analysis technology, it thoroughly examines the residential price variation patterns in Qingdao across different years. Secondly, the characteristic price model is adopted, in conjunction with the GWR model, which takes into account spatial heterogeneity. This enables the exploration of the spatial variation factors influencing Qingdao’s residential prices from the perspectives of community attributes, location and traffic, and peripheral supporting facilities. The objective of this study is threefold: firstly, to ascertain the spatial distribution characteristics and patterns of the factors affecting residential prices in the region; secondly, to address the research lacunae in this area in Qingdao; and thirdly, to furnish the government and relevant departments with a scientific basis for an in-depth understanding of the distribution of residential prices in urban areas.
2. Research Area and Data Sources
Qingdao, as an important central city along the country’s coast, is located at the strategic highland of Shandong Province’s openness and development to the world. Due to its rapid urbanization and continuous expansion of living space, it has seen a sharp increase in demand for housing, and residential property prices have shown significant differences within the region. By 2023, Qingdao will have a population of 10,371,500, of which 8,121,000 will live in the urban area (seven districts, including Shinan District, Shibei District, Laoshan District, Lichang District, West Coast New District, Chengyang District, and Jimo District, etc.), and the built-up area of the city will cover an area of 11,282 km2 (Figure 1).
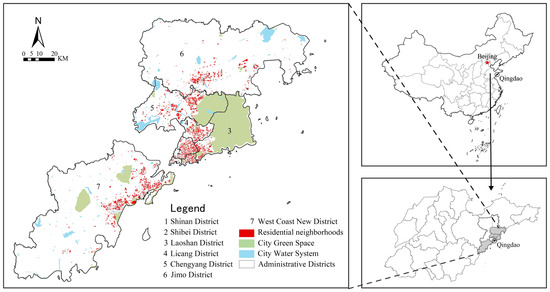
Figure 1.
Research areas.
This paper takes the residential districts of the urban area of Qingdao as the basic unit of study and collects the sample data of 2003, 2013, and 2023 housing prices from the sample districts, which are summarized based on the average value of the transaction price per unit area of new and used houses traded in the same month of each year. ArcGIS10.8.1 was used to vectorize key spatial components such as transport network, mountain topography, and water system, and the converted vector data were overlaid on the latest Qingdao geographic base map to ensure the accurate location of the sample neighborhoods.
The basic geographic data, such as administrative district boundaries and water and green areas, were obtained from the Resource and Environmental Science and Data Platform of the Chinese Academy of Sciences (https://www.resdc.cn/) (accessed on 18 November 2023), and the vector layer published by OSM (open street map) was used for the urban road network data (https://www.openstreetmap) (accessed on 18 November 2023). The geographic coordinates of residential neighborhoods, the average price of a listing, and comprehensive attribute data of neighborhoods were collected from the website of Anjuke (https://qd.anjuke.com/) (accessed on 12 November 2023) by relying on the web crawler tool; the boundaries of neighborhoods were obtained from the AOI (area of interests) boundary data of Baidu map. After data processing, 5314 residential neighborhoods were selected as research samples, and the spatial attribute database of the sample neighborhoods was established.
3. Variable Description and Methodology
3.1. Variable Description
The spatial differentiation of urban housing prices is the result of a combination of factors, including the macroeconomic environment [53], monetary policy, interest rate level, micro-population growth, the urbanization process [54], employment opportunities, and the income level of residents [55,56]. Combining data accessibility and quantitative capability, this paper aims to analyze the factors influencing house prices from regional characteristics and housing structure, and first identifies three types of indicators: ① Community Attribute Characteristics (C), which includes six variables, including the degree of newness and oldness of the community, the quality of services and management, the configuration of parking facilities, the density of housing, the green landscape, and the scale of community housing; ② Location and Transport Characteristics (L), which include the advantages of the central location, environmental location, environmental advantages, environmental advantages, and environmental advantages; ③ Location and Transport Characteristics (L), which include the five variables of central location advantage, environmental location, educational resources, internal transport accessibility, and external transport convenience; and (S), which includes indicators of the completeness of housing facilities, the convenience of medical services, the concentration of business resources and the richness of leisure and recreational facilities (Table 1).

Table 1.
Characterization of characteristic variables affecting the spatial differentiation of residential prices in a community.
3.2. Kriging Interpolation
Kriging interpolation, also known as spatial local interpolation, is an optimal unbiased estimation method based on spatial autocorrelation used to minimize the estimation variance and to predict the unknown points [57]. Kriging interpolation is an accurate local interpolation method based on the theory of stochastic function [58], operated by constructing the spatial variational function and calculating the optimal weights, and using the known sample point data to predict the unknown region. The specific function expression is as follows [59]:
In the formula, is the house value of the unknown sample point; is the house value of the known sample points around the unknown sample point; is the weight of the th known sample point to the unknown sample point, is the number of known sample points. In this paper, ordinary Kriging interpolation is used to detect the spatial distribution characteristics of house prices; assuming that the mean value is unknown but constant, the requirement to meet the unbiased estimation of the variance is minimized, so the weights are obtained by solving the Kriging system equation, which is constructed by the variational function:
Once the weighting factors have been calculated, the value of the house at the uncollected point can be derived .
3.3. Hedonic Prices Model
The characteristic price model is one of the most commonly used models for studying the micro-elements affecting residential prices and is derived from the characteristic price theory [60]. This theory suggests that the price of a good is a combination of the characteristics it possesses, and that the effect of each characteristic on the price of a good is the characteristic price of that characteristic. It regards residential price as a function of each characteristic, and through regression analysis of the prices of various residential attributes in non-market transactions on the real transaction price, it can reveal the factors that really induce purchasing behavior [61], and through the establishment of the economic regression model, it can measure the influence of each characteristic factor on the residential price more effectively, and get the strength and direction of the effect of each characteristic factor on the residential price [28].
The equation forms of residential characteristic price are mainly linear, logarithmic, and semi-logarithmic equations. After many attempts and computational comparisons, the linear form of the characteristic price model is used to estimate and validate the characteristic prices of residential neighborhoods in Qingdao. The linear model can effectively simulate the willingness-to-pay price close to each residential attribute, and if the VIF value of each characteristic variable is less than 5, then the model has no covariance. The model expression is:
In the formula, is the price of the dwelling; and are the th continuous and th dummy characteristic variables, respectively; and are the characteristic prices of the th continuous and th dummy characteristic variables, respectively; is the sum of constants other than the characteristic variables that affect the price of the dwelling; and is the error term.
3.4. Geographically Weighted Regression
The housing characteristic price model is based on the assumption of spatial averages, which does not fully take into account the peculiarities of housing price formation in different regions, resulting in an insufficient consideration of spatial heterogeneity. Therefore, the use of a geographically weighted regression model that fully accounts for spatial heterogeneity to analyze the drivers of house prices is a useful addition to the study in terms of spatial statistics.
The geographically weighted regression (GWR) model is an improved spatial linear regression model that allows local rather than global parameter estimation, and also introduces information about the spatial location of the data compared to traditional regression models [35,62]. The method can apply the spatial weight matrix to the linear regression model, allowing the regression coefficients to vary with geographic location and better capture local features and variations in the spatial data to visualize the spatial structural differentiation [63]. The study of the GWR model for use in the spatial differentiation of urban housing prices is still in the exploratory stage. In this paper, the GWR model is used to identify the spatial change law of the influencing factors of housing prices, and the model expression is as follows:
In the formula, is the housing price of the sample point, is the spatial location coordinates of the sample point, is the regression constant term, is the characteristic variable of the sample point , is the local regression coefficient, is the random error term, and is the coefficient of the characteristic variable.
4. Results
4.1. Spatial Differentiation Pattern of Housing Prices in Qingdao
Through the establishment of the Qingdao residential spatial attribute database, and the use of ArcGIS10.8.1 software to realize the accurate matching of the sample district attribute data and geographic coordinates, we can systematically analyze the overall spatial characteristics of residential prices in Qingdao, from the dimensions of price characteristics, location distribution, and so on, and summarize the development of the spatial structure of residential space in different periods.
4.1.1. Residential Prices in General Show a Continuous Upward Trend
Housing prices in Qingdao’s urban area rose from an initial CNY 4786/m2 to 21,752/m2 between 2003 and 2023, with an average annual increase of CNY 848.3/m2 and an overall increase of 354.5%, showing a significant and continuous upward trend (Figure 2). Among these results, the period between 2003 and 2013 was a period of rapid escalation in residential prices, with an average annual increase of CNY 928/m2, or as high as 19.4%. There are slight differences in the rate of increase in different districts; Chengyang District has the fastest growth rate, followed by Lichang District, and both rose more than 230%; in 2013–2023, Qingdao’s residential prices continued to rise, with an average annual increase of 5.46%, after which the growth rate has slowed. Laoshan District and Shinan District showed growth rates of 40.8% and 45% to average prices of CNY 38,729/m2 and CNY 34,761/m2, ultimately becoming a new point of price growth. The average price of Qingdao City and the average price of each region showed a high degree of consistency, that is, with rapid growth in the early period and stable growth in the late period.
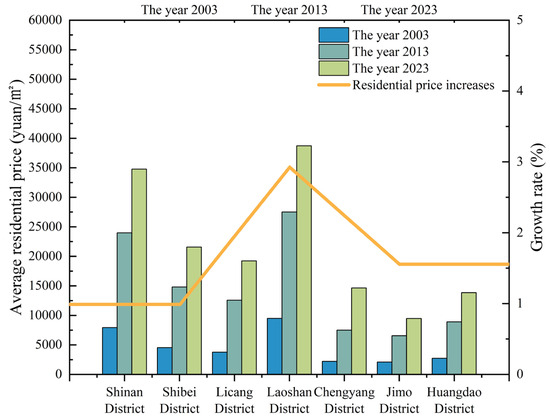
Figure 2.
Changes in average residential prices in Qingdao’s urban areas (unit: RMB/m2).
4.1.2. Regional Disparities Are Evident and Widening
Housing prices in the central urban area (Shinan District, Shibei District, Laoshan District, Lichang District) have led the way, and their differences from the peripheral regions have become more pronounced over time. From 2003 to 2013, the average price of residential units in the central urban area increased from CNY 6427/m2 to CNY 19,715.75/m2, with a growth rate of 206.8%, and the rate of increase in the southern district and Laoshan district was particularly significant. In the same period, the average price of residential units in peripheral urban areas increased from CNY 2346.7/m2 to CNY 7656/m2, an increase of 28.5%, this being a smaller increase; in 2013–2023, the difference in average price between regions further widened; between Laoshan District and Jimo District, this difference grew from CNY 20,955/m2 in 2013 to CNY 29,256/m2 in 2023. The center of the clustering effect is increasingly evident. The price difference between the center and the urban center is also currently increasing, which not only raises the overall housing price level of the Qingdao urban area, but also means that the housing price of most of the peripheral areas is lower than the overall price, and the gap from the central urban area is widening.
4.1.3. Fan-Shaped Spread from Jiaozhou Bay, Decreasing to the Periphery
The development of residential prices shows an overall pattern of the east coast of Jiaozhou Bay as the core, with prices decreasing towards the periphery (Figure 3). In 2003, the traditional core area of Shinan District formed a “single core” price space pattern due to its well-developed supporting facilities and superior ecological environment; in 2013, the core influence of Shinan District continued to expand to the north and east, and Laoshan District formed a new price plateau due to the eastward relocation of the Qingdao Municipal Government and the gradual improvement of supporting facilities. At the same time, the Shibei District underwent industrial renewal and upgrading to attract the foreign population to settle down; residential prices gradually increased, and the entire urban area of Qingdao presented a “double core + fan” space pattern. In 2023, the residential space continued to expand outwards, and the transport convenience of the peripheral Lichang District was gradually improved, while the development of the West Coast New Economic Zone continued, ultimately becoming an emerging growth point of residential prices, and the whole city showed a spatial structure of “double core + fan + mosaic”.
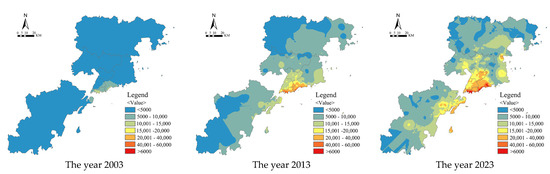
Figure 3.
Spatial distribution pattern of residential prices in Qingdao in 2003, 2013, and 2023.
4.2. Analyses of Driving Factors Based on GWR Modeling
4.2.1. GWR Model Construction
We set the specific coordinates of the geographic center of the first residential subdivision and constructed the following geographically weighted regression (GWR) model based on the screened indicator variables and their corresponding parameters:
In the formula, is the housing price of the sample point, is the spatial location coordinates of the sample point, is the regression constant term, is the characteristic variable of the sample point , is the local regression coefficient, is the random error term, and is the coefficient of the characteristic variable.
Using SPSS26.0 and ArcGIS10.8.1 to calculate the relevant parameters of the OLS model and GWR model, the comparison found that the goodness of fit of the GWR model is much greater than that of the OLS model, and the residual sum of squares (Residual Squares) and standard deviation (Sigma) are also significantly reduced compared with the OLS model (Table 2). Therefore, the GWR model was used to analyze the driving factors of urban residential prices in Qingdao; firstly, the 13 indicators were subjected to covariance diagnosis and significance testing, and some indicators that did not enter the model in 2003, 2013, and 2023 were excluded. Finally, a total of eight indicators, including the degree of old and new, the green environment, the scale of residence, the central location, the environmental location, the attributes of school districts, the commercial support, and the business support, were selected for the GWR analysis.
Table 2.
Comparison of OLS model and GWR model fitting results for 2003, 2013, and 2023.
4.2.2. GWR Model Regression Results
The degree of newness and oldness of residential neighborhoods had a positive effect on urban house prices in 2003, with the lower the age of the house, the higher the price, and a negative effect in 2013 and 2023 (Figure 4). In terms of the absolute value of the regression coefficients in the three years, the highest values are found in the central urban area, where old neighborhoods are concentrated, and the lowest values are found in the periphery of the city, such as the West Coast New District and the Jimo District, indicating that the influence of the degree of newness and oldness on the central urban area is much greater than that on other urban areas. The regression coefficient shows an increasing trend, indicating that the influence of the degree of oldness and newness on the price of urban housing is gradually increasing.
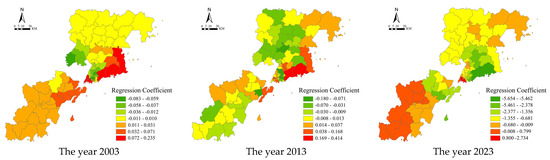
Figure 4.
Spatial distribution of regression coefficients for the degree of newness of the GWR model.
The green environment of residential areas has an obvious positive correlation with the price of urban housing, and the higher the green rate, the higher the price of housing (Figure 5). In the spatial distribution of the regression coefficient, the area with the greatest influence gradually expands from Laoshan District in the northwest to Shinan District and Shibei District, and the areas with less influence are always concentrated in the periphery of the city, such as the West Coast New District, Chengyang District, and Jimo District. From the average regression coefficient of three years, we see that the regression coefficient gradually becomes larger, indicating that the influence of the green environment on housing prices is increasing progressively.
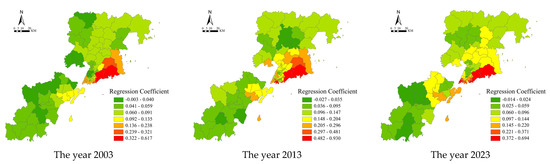
Figure 5.
Spatial distribution of regression coefficients for the greening environment of the GWR model.
The regression coefficients of dwelling size on house prices are mostly negative, with the changes in the regression coefficients in the central urban area being much smaller than those in the peripheral urban areas (Figure 6). This is due to the relatively mature spatial structure and stable demand for housing units in the central city, while changes in housing size have a more significant impact on housing prices in the peripheral city, which is in the rapid development stage. The absolute value of the regression coefficients varies little and remains at a relatively stable level, indicating that the influence of residential scale on urban housing prices is relatively stable.
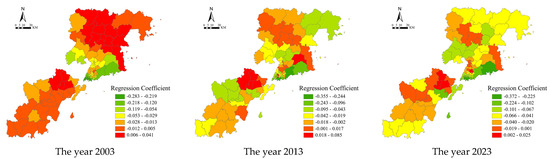
Figure 6.
Spatial distribution of regression coefficients for dwelling size in the GWR model.
The central location of residential communities is negatively correlated with house prices, and the closer the residential area is to the center, the more the growth of house prices can be reduced (Figure 7). The spatial distribution of the regression coefficient shows that the change in the regression coefficient of the central urban area is much smaller than that of the peripheral urban area, indicating that the explanatory power of the central location on house prices is relatively reduced against the background of the continuous expansion of the urban scale and the gradual formation of multipolar patterns. The absolute value of the regression coefficients for the three years shows a tendency to increase, indicating that although the direct influence of the central urban area on house prices has decreased, the comprehensive influence of the central location on house prices in the context of the whole city has gradually increased.
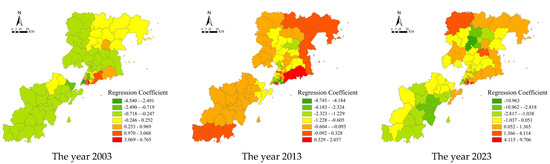
Figure 7.
Spatial distribution of regression coefficients for center location in the GWR model.
Most of the regression coefficients of the environmental location of residential neighborhoods on house prices are negative (Figure 8), and the closer the distance to mountain and marine resources, the greater the influence on house prices. As the large-scale mountain and marine resources are mostly located along the coast of Jiaozhou Bay, while the peripheral urban areas are relatively scarce, the spatial distribution of the regression coefficient decreases from the eastern coast of Jiaozhou Bay to the periphery. From the year-to-year change in the regression coefficient, we can see that the influence of environmental location on house prices shows a “Matthew effect”, i.e., the resource-rich coast of Jiaozhou Bay is increasingly influenced by it, while the peripheral urban areas, which are relatively resource-poor, are influenced by it with a declining trend. The absolute value of the three-year regression coefficient gradually increases, indicating that the influence of environmental location on regional house prices is increasing.
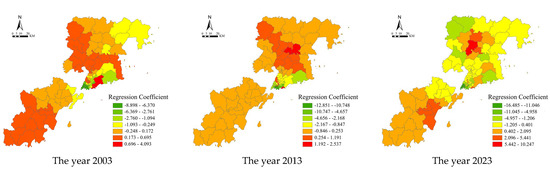
Figure 8.
Spatial distribution of environmental location regression coefficients for the GWR model.
The regression coefficients of distance to primary and secondary schools on housing prices were mostly positive in 2003 and 2013, and were negative in 2023 (Figure 9), indicating that residents gradually attach more importance to education, and living near primary and secondary schools helps to save commuting costs, which in turn pushes up housing prices. The spatial distribution of the absolute value of the regression coefficient shows a decreasing trend from the coast of Jiaozhou Bay to the periphery, and the maximum value is concentrated in parts of Shinan District and Laoshan District. Due to the small number of schools in the peripheral urban areas and the superior natural environment, the weight of the school district attributes is replaced by the natural landscape, and the regression coefficient is relatively small. The inter-annual variation of the regression coefficients is not significant, indicating that the pattern of the influence of school district attributes on house prices is relatively stable, and the extent of the role of school district attributes on house prices in each region will remain at a stable level in the long run.
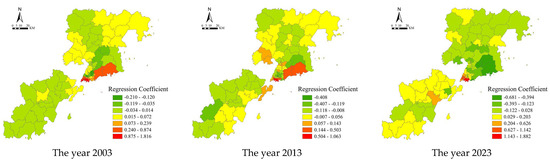
Figure 9.
Spatial distribution of regression coefficients for school district attributes in the GWR model.
The commercial facilities in residential neighborhoods are negatively correlated with residential prices in general (Figure 10), while the number of commercial facilities in peripheral urban areas is positively correlated with house prices, due to the weak infrastructure in the periphery, and the perfect commercial facilities enhance residential prices. From the perspective of spatial distribution, the core urban areas (Shinan District, Shibei District, Laoshan District) have perfect commercial facilities, attracting high-income groups, with larger regression coefficients; in parts of the peripheral areas, due to the obvious environmental advantages, the lack of commercial facilities did not significantly reduce the price of housing. The absolute value of the regression coefficient gradually increases in three years, indicating that the influence of commercial facilities on house prices is increasing.
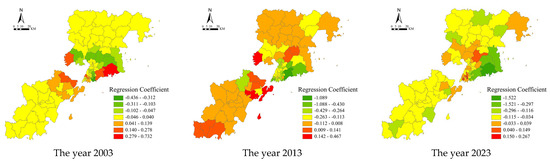
Figure 10.
Spatial distribution of regression coefficients for commercial supports in the GWR model.
The regression coefficients of business support in residential neighborhoods on urban housing prices are mostly positive (Figure 11), indicating that service outlets can provide convenient housing services and increase housing prices. From the spatial distribution of the regression coefficients, we see that the areas with the largest impact are always concentrated in Shinan District and Shibei District, and the areas with the smallest impacts are gradually shifted to the periphery from the coast of Jiaozhou Bay to some areas such as Jimo District, while some areas such as Chengyang District and West Coast New District are also in the low range of impact. Overall, the impacts of the number of business support facilities in Jimo District and West Coast New District are increasing, and the impacts on some areas of East Coast Capital Centre, Lichang District, and Chengyang District are more stable. The absolute value of the three-year regression coefficient is gradually increasing, indicating that the impact of business support on regional housing prices is undergoing an increase.
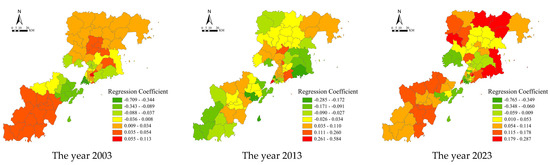
Figure 11.
Spatial distribution of regression coefficients for business supports in the GWR model.
5. Discussion
Based on the spatial variation pattern of residential prices in Qingdao and the spatial distribution of the coefficients of the geographically weighted regression (GWR) model, a spatial structure model of residential prices in Qingdao is constructed to analyze the main driving factors that dominate the trend of residential price changes. Among them, the identification of the dominant factors focuses on the specific degree of influence of each influential factor on residential prices in each geographical unit of the city, that is, by analyzing the geographical differences in the absolute values of the regression coefficients of each factor and comparing them with the overall average level of the city.
The residential price space in Qingdao shows a circular divergence structure, with multiple sectors and concentric circles intertwined (Figure 12). The city core, peripheral areas, and remote suburbs form an obvious residential price gradient, with significant differences in living environments. As an economic and cultural center, the urban core area focuses on high-end commercial facilities and high-quality educational and medical resources, with high residential prices, and the residential population is dominated by high-income groups and foreign investors, gradually forming an affluent circle. With the expansion of the city, the peripheral areas are gradually developing, such as Licang District, Laoshan District, West Coast New District and other parts of the area, where the infrastructure and commercial facilities are becoming more and more complete, and the overall living environment and residential prices, although there is a gap with the core area, are not the same as in the core area. Although there is a gap between the price of the residential area and that of the core area, its relatively low residential price and better convenience of life mean that the main residents are middle-income families, with the formation of a middle-income circle. The outer circle comprises the remote suburbs, such as Jimo District; due to thier distance from the city center, the public services and infrastructure are relatively under-developed here, the living environment and convenience of life are relatively poor, and the low residential price attracts low-income groups and migrant workers, forming a low-income circle of the city.
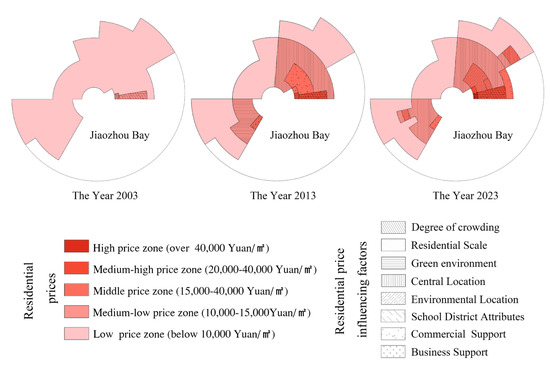
Figure 12.
Structural modeling of residential prices and their dominant factors in Qingdao.
The fluctuations in residential prices are a result of the interweaving of many complex factors, and different driving factors shape various types of residential prices. The spatial differentiation of residential prices is mainly reflected between the coast of Jiaozhou Bay and other regions, and is influenced by the combination of a green environment, a central location, an environmental location, and business support. Here, the formation of high-price areas is mainly due to the agglomeration effect brought about by the high population density, the excellent green environment, the large residential scale, the convenient transportation network, the perfect medical services, and the richness of leisure facilities, among other factors. Medium- and high-priced areas are related to the quality of the green environment, school district resources, medical and business facilities, and other factors. Medium-priced areas reflect a more balanced approach, focusing on the creation of green environments, the convenience of internal transportation, and the sophistication of support facilities. Housing prices in low- and moderate-priced areas are more dependent on the uniqueness of school district resources and the basic sophistication of supporting facilities. The price level in low-priced areas is directly influenced by the central location factors. In summary, the level of housing prices directly reflects the richness and quality of the dominant factors affecting housing prices in the region where they are located. Regions with diverse and high-quality dominant factors generally have higher residential prices; conversely, regions with fewer or lower-quality dominant factors have lower residential price levels.
6. Conclusions
Taking Qingdao’s urban area as the research object, and using the GIS spatial analysis method to analyze the spatial differentiation pattern of housing prices in the region, the study found that housing prices in the Qingdao urban area showed a significant and stable upward trend from 2003 to 2023, and the differences between areas have been constantly increasing. The spatial structure has evolved from a “single core”, with Shinan District as the main focus in 2003, to a “double core + sector” with Shinan District and Laoshan District as the main focus in 2013, and with the development of Licang District and West Coast New District, it will eventually form a “double core + sector” pattern. With the development of Licang District and West Coast New District, the spatial layout of “double core + fan + mosaic” will eventually be formed. On this basis, the geographically weighted regression (GWR) model is used to explore the factors influencing housing prices and their spatial differences in terms of housing characteristics and location conditions. Among them, excellent geographical location, pleasant greenery, and perfect business facilities have a positive incentivizing effect on urban residential prices. Green landscape quality, residential density, and recreational facilities, as important indicators of consumers’ economic strength, preference for the living environment, and pursuit of quality of life, are increasingly emphasized as key variables influencing residential prices and their spatial distribution. In general, residential prices in Qingdao’s urban areas show a hierarchical structure of multiple sectors intertwined with concentric circles. Diversified community types and grades precisely match the housing demand groups with unique economic and social characteristics, so the spatial distribution of urban residential prices and the phenomenon of residential spatial differentiation show significant coupling. With the complexification of the housing market mechanism, as well as the emphasis on social class and cultural characteristics and the increasing maturity of residential preferences, the spatial differentiation of urban housing prices is not an isolated phenomenon, but it also “intensifies” and “solidifies” the spatial differentiation of residential spaces, which not only reflects the changes in market supply and demand, but also reflects the changes in market demand and supply relationships. The spatial differentiation of residential space not only reflects the changes in market supply and demand, but also reflects the spatial distribution and residential preferences of different social groups in the city.
To ensure that urban housing prices truly map the social attributes of residential groups, and thus accurately depict the complexity of socio-spatial structures, it is important to ensure a close match between the two. However, the current research is limited by the breadth and depth of the data, particularly the lack of insight into the spatial variability of driving factors at social and temporal scales. To fill this gap, future research can use micro-scale mobile phone signal data to build a detailed and accurate user profile system, comprehensively analyze the spatial and temporal heterogeneity of factors influencing housing prices in Qingdao, formulate a more scientific and accurate housing price control policy, and promote the healthy development of the urban real estate market and the harmonious coexistence of social space.
Author Contributions
Conceptualization, Y.W. and Y.F.; data curation, Y.F.; methodology, Y.F.; resources, Y.F. and K.H.; software, Y.F.; supervision, Y.W.; visualization, Y.F. and Z.Z.; writing—original draft, Y.F.; writing—review and editing, Y.W., K.H. and P.D. All authors have read and agreed to the published version of the manuscript.
Funding
This research is funded by the National Natural Science Foundation of China (Grant No. 51408344) and the Qingdao Philosophy and Social Science Planning Project (QDSKL2101111, QDSKL2401104).
Data Availability Statement
The raw data supporting the conclusions of this article will be made available by the authors on request.
Conflicts of Interest
Author Kun Han was employed by the company Qingdao Tengyuan Design Office Co. The remaining authors declare that the research was conducted in the absence of any commercial or financial relationships that could be construed as a potential conflict of interest.
References
- Lee, J.; Zhu, Y. Urban governance, neoliberalism and housing reform in China. Pac. Rev. 2006, 19, 39–61. [Google Scholar] [CrossRef]
- He, S.; Wu, F. China’s Emerging Neoliberal Urbanism: Perspectives from Urban Redevelopment. Antipode 2009, 41, 282–304. [Google Scholar] [CrossRef]
- Duan, J.; Tian, G.; Yang, L.; Zhou, T. Addressing the macroeconomic and hedonic determinants of housing prices in Beijing Metropolitan Area, China. Habitat Int. 2021, 113, 102374. [Google Scholar] [CrossRef]
- Mou, Y.; He, Q.; Zhou, B. Detecting the Spatially Non-Stationary Relationships between Housing Price and Its Determinants in China: Guide for Housing Market Sustainability. Sustainability 2017, 9, 1826. [Google Scholar] [CrossRef]
- Li, Q.; Chand, S. House prices and market fundamentals in urban China. Habitat Int. 2013, 40, 148–153. [Google Scholar] [CrossRef]
- Lin, S.; Wu, F.; Wang, Y.; Li, Z. Migrants’ perceived social integration in different housing tenures in urban China. Geoforum 2023, 139, 103693. [Google Scholar] [CrossRef]
- Wu, F. Commodification and housing market cycles in Chinese cities. Int. J. Hous. Policy 2015, 15, 6–26. [Google Scholar] [CrossRef]
- Yeh, A.G.; Yang, F.F.; Wang, J. Economic transition and urban transformation of China: The interplay of the state and the market. Urban Stud. 2015, 52, 2822–2848. [Google Scholar] [CrossRef]
- Song, W.; Mao, N.; Chen, P.; Yuan, Y.; Wang, Y. Coupling mechanism and spatial-temporal pattern of residential differentiation from the perspective of housing prices: A case study of Nanjing. Acta Geogr. Sin. 2017, 72, 589–602. [Google Scholar]
- Alonso, W. Location and Land Use: Toward a General Theory of Land Rent; Harvard University Press: Cambridge, MA, USA, 2013; ISBN 978-0-674-73085-4. [Google Scholar]
- Kristof, F.S. Review of Cities and Housing: The Spatial Pattern of Urban Residential Land Use. J. Econ. Lit. 1970, 8, 493–495. [Google Scholar]
- Clark, W.A.V. Residential segregation in American cities: A review and interpretation. Popul. Res. Policy Rev. 1986, 5, 95–127. [Google Scholar] [CrossRef]
- Massey, D.S.; Denton, N.A. American Apartheid: Segregation and the Making of the Underclass. In Sociological Perspective; Routledge: London, UK, 2001; ISBN 978-0-429-30641-9. [Google Scholar]
- Harvey, D. The urban process under capitalism: A framework for analysis. Int. J. Urban Reg. Res. 1978, 2, 101–131. [Google Scholar] [CrossRef]
- Healey, P. Collaborative Planning: Shaping Places in Fragmented Societies; Bloomsbury Publishing: London, UK, 2020; ISBN 978-1-137-08600-6. [Google Scholar]
- Chen, Y.; Gu, Y.; Song, W. The spatiotemporal differentiation pattern of Chinese urban housing price, income and housing price-to-income ratio. Geogr. Res. 2021, 40, 2442–2458. [Google Scholar]
- Wang, Y.; Wang, D.; Wang, S. Spatial Differentiation Patterns and Impact Factors of Housing Prices of China’s Cities. Sci. Geogr. Sin. 2013, 33, 1157–1165. [Google Scholar] [CrossRef]
- Pan, J.; Yang, L. Spatial-temporal differentiation of housing price-to-income ratio at prefecture level cities in China. Arid Land Geogr. 2017, 40, 1274–1281. [Google Scholar] [CrossRef]
- Chen, Y.; Song, W.; Yin, S.; Ma, Y. Spatial-Temporal Differentiation of Housing Price-to-Income Ratio in the Yangtze River Delta. Econ. Geogr. 2020, 40, 32–39. [Google Scholar] [CrossRef]
- Song, W.; Liu, C. The price differentiation mechanism of commercial housing in the Yangtze River Delta. Geogr. Res. 2018, 37, 92–102. [Google Scholar]
- Guo, J.; Feng, Z.; Chen, H.; Chen, Z.; Liu, S.; Wu, R.; He, J.; Li, H. Spatio-temporal Characteristics and Driving Mechanism of High-quality Residential Market Prices in Beijing: A Case of Sunhe Township. Areal Res. Dev. 2020, 39, 64–69. [Google Scholar]
- Song, W.; Chen, Y.; Sun, J.; He, M. Spatial differentiation of urban housing prices in integrated region of Yangtze River Delta. Acta Geogr. Sin. 2020, 75, 2109–2125. [Google Scholar]
- Yan, L.; Han, Z.; Liu, D. Study on the spatio-temporal differentiation of the impact of educational resource allocation on housing price: Taking 35 large and medium cities as examples. Hum. Geogr. 2020, 35, 22–31. [Google Scholar] [CrossRef]
- Liu, X.; Zhang, W. Influencing Factors and Mechanism of Urban Residential Price Spatial Differentiation in Yangzhou City. Areal Res. Dev. 2023, 42, 70–75. [Google Scholar]
- Hao, J.; Liu, Y. Spatial differentiation of housing prices and mechanism of influence in a shrinking city:A case study of Hegang. Prog. Geogr. 2022, 41, 812–824. [Google Scholar] [CrossRef]
- Liu, X.; Jiang, C.; Wang, F.; Yao, S. The impact of high-speed railway on urban housing prices in China: A network accessibility perspective. Transp. Res. Part A Policy Pract. 2021, 152, 84–99. [Google Scholar] [CrossRef]
- Huang, H.; Yin, L. Creating sustainable urban built environments: An application of hedonic house price models in Wuhan, China. J. Hous. Built Environ. 2015, 30, 219–235. [Google Scholar] [CrossRef]
- Gao, Z.; Qiu, J.; Yu, J.; Zhu, Y. Influence of school districts on housing prices and the effect on socio-spatial restructuring: Taking Wuchang District of Wuhan City as a case. Prog. Geogr. 2022, 41, 609–620. [Google Scholar] [CrossRef]
- Li, Y.; Li, H. Differential response of housing price in resource-based cities and its influencing factors within the context of population shrinkage. J. Nat. Resour. 2023, 38, 157–170. [Google Scholar] [CrossRef]
- Chen, J.; Guo, F.; Wu, Y. One decade of urban housing reform in China: Urban housing price dynamics and the role of migration and urbanization, 1995–2005. Habitat Int. 2011, 35, 1–8. [Google Scholar] [CrossRef]
- Wang, F.; Gao, X.; Yan, B. Research on urban spatial structure in Beijing based on housing prices. Prog. Geogr. 2014, 33, 1322–1331. [Google Scholar]
- Dai, X.; Bai, X.; Xu, M. The influence of Beijing rail transfer stations on surrounding housing prices. Habitat Int. 2016, 55, 79–88. [Google Scholar] [CrossRef]
- Shen, T.; Yu, H.; Zhou, L.; Gu, H.; He, H. On Hedonic Price of Second-Hand Houses in Beijing Based on Multi-Scale Geographically Weighted Regression: Scale Law of Spatial Heterogeneity. Econ. Geogr. 2020, 40, 75–83. [Google Scholar] [CrossRef]
- Li, Z.; Wu, F. Sociospatial Differentiation in Transitional Shanghai. Acta Geogr. Sin. 2006, 61, 199–211. [Google Scholar]
- Tang, Q.; Xu, W.; Ai, F. A GWR-Based Study on Spatial Pattern and Structural Determinants of Shanghai’s Housing Price. Econ. Geogr. 2012, 32, 52–58. [Google Scholar] [CrossRef]
- Guo, L.; Lin, S.; Zhang, G. Impact Mechanism of Shanghai Rail Transit on Residential Prices and Planning Implications. Urban Mass Transit 2023, 26, 166–173. [Google Scholar] [CrossRef]
- Peng, B.; Shi, Y.-S.; Shan, Y.; Chen, D. The Spatial Impacts of Class 3A Comprehensive Hospitals on A Peripheral Residential Property Prices in Shanghai. Sci. Geogr. Sin. 2015, 35, 860–866. [Google Scholar] [CrossRef]
- Yin, S.; Song, W.; Ma, Z.; Li, Z.; Wu, Q. Spatial Differentiation and Influencing Factors Analysis of housing prices in Nanjing: Based on geographically weighted regression model. Hum. Geogr. 2018, 33, 68–77. [Google Scholar] [CrossRef]
- Wen, H.; Bu, X.; Qin, Z. Spatial effect of lake landscape on housing price: A case study of the West Lake in Hangzhou, China. Habitat Int. 2014, 44, 31–40. [Google Scholar] [CrossRef]
- Gu, J.; Jia, S. The Effects Of Expected Transport Improvements on Housing Prices and Price Spatial Distribution-Hangzhou-Based Research Evidence of Planning the Mass Transit Railway. Econ. Geogr. 2008, 6, 1020–1024. [Google Scholar]
- Zhong, Y.; Feng, J. Residential spatial differentiation of migrant population within the city:A case study of Shenzhen. Prog. Geogr. 2017, 36, 125–135. [Google Scholar]
- Qiang, H.; Wang, H.; Lei, S. Analysis on Spatial Differentiation Characteristics and Influencing Factors of Housing Prices in Metropolis Based on MGWR Model: A Case Study of the Main Urban Area of Nanjing. Mod. Urban Res. 2024, 4, 109–116. [Google Scholar]
- Song, W.; Ma, Y.; Chen, Y. Spatiotemporal differentiation and influencing factors of housing selling and rental prices: A case study of Nanjing City. Prog. Geogr. 2018, 37, 1268–1276. [Google Scholar]
- Li, Y.; Liu, Y.; Liu, X. Spatial heterogeneity in factors affecting Chongqing housing prices. Resour. Sci. 2017, 39, 335–345. [Google Scholar]
- Sun, Q.; Tang, F. The comparison of city housing price spatial variances based on spatial expansion and geographical weighted regression models. Geogr. Res. 2015, 34, 1343–1351. [Google Scholar]
- Zhu, Z.; Zhu, Y.; Liu, R.; Zhang, L.; Yuan, J. Examining the Effect of Urban Rail Transit on Property Prices from the Perspective of Sustainable Development: Evidence from Xuzhou, China. Buildings 2022, 12, 1760. [Google Scholar] [CrossRef]
- Li, J.; Hu, Y.; Liu, C. Exploring the Influence of an Urban Water System on Housing Prices: Case Study of Zhengzhou. Buildings 2020, 10, 44. [Google Scholar] [CrossRef]
- Song, W.; Cao, H.; Tu, T.; Song, Z.; Chen, P.; Liu, C. Jiaoyufication as an education-driven gentrification in urban China: A case study of Nanjing. Acta Geogr. Sin. 2023, 78, 792–810. [Google Scholar] [CrossRef]
- Ma, G.; Zhao, J.; Sun, Y.; Zhu, H. Mechanism and Effect of Social-Spatial Alienation in High-Quality School-District Community: A Case Study of Nanjing. Trop. Geogr. 2022, 42, 1617–1627. [Google Scholar] [CrossRef]
- Jin, S.; Zhao, Y.; Liu, C. Reconstructing Social Segregation in Danwei: An Examination of High-Quality Education Resources’ Impact on Housing Prices in Nanjing, China. Buildings 2023, 13, 2427. [Google Scholar] [CrossRef]
- Fan, Z.; Yi, C.; Wang, Y.; Cao, Y.; Liu, Y. Has Cross-City Commuting Promoted Housing Purchases among the Workforce within Metropolitan Areas?—An Empirical Analysis from Micro Survey Data from China’s Three Major Metropolitan Areas. Buildings 2024, 14, 3130. [Google Scholar] [CrossRef]
- Fu, Y.; Qu, W. Stay or Return: Analysis of Residence Decision-making of Migrant Population—Analyzing the Effects of Multiple Factors Such as Housing Prices and Public Service Levels. PriceTheory Pract. 2023, 7, 131–135. [Google Scholar] [CrossRef]
- Yan, L.; Zhang, S.; Wang, D. Agglomeration Economies, the New-type Urbanization, and the Planning Reform. Urban Dev. Stud. 2022, 29, 5–11. [Google Scholar]
- Wu, Y.; Chen, L. Housing Price, Population Heterogeneity and City Size. Urban Dev. Stud. 2017, 24, 73–78. [Google Scholar]
- Hu, W.; Yin, S.; Gong, H. Spatial–Temporal Evolution Patterns and Influencing Factors of China’s Urban Housing Price-to-Income Ratio. Land 2022, 11, 2224. [Google Scholar] [CrossRef]
- Zhuang, T.; Yuan, M.; Liu, G. Deciphering the External Economic Effects of Urban Regeneration from the Perspective of Housing Price and Housing Rent: An Empirical Study in Chongqing. Urban Dev. Stud. 2024, 31, 121–128. [Google Scholar]
- Mei, Z.; Li, X. Spatial Analysis of Houses’ Price in Dongguan based on ESDA and Kring Techniques. Econ. Geogr. 2008, 28, 862–866. [Google Scholar] [CrossRef]
- Meng, B.; Zhang, J.; Wang, J.; Zhang, W.; Hao, W. Application of spatial analysis to the research of real estate: Taking Beijing as a case. Geogr. Res. 2005, 24, 956–964. [Google Scholar]
- Kuntz, M.; Helbich, M. Geostatistical mapping of real estate prices: An empirical comparison of kriging and cokriging. Int. J. Geogr. Inf. Sci. 2014, 28, 1904–1921. [Google Scholar] [CrossRef]
- Helbich, M.; Brunauer, W.; Vaz, E.; Nijkamp, P. Spatial Heterogeneity in Hedonic House Price Models: The Case of Austria. Urban Stud. 2014, 51, 390–411. [Google Scholar] [CrossRef]
- Li, X.; Fu, W. Investigation of the capitalization of municipal government infrastructure investment on housing market: Hedonic model based on Guangzhou housing price data. Geogr. Res. 2010, 29, 1269–1280. [Google Scholar]
- Brunsdon, C.; Fotheringham, A.S.; Charlton, M.E. Geographically Weighted Regression: A Method for Exploring Spatial Nonstationarity. Geogr. Anal. 1996, 28, 281–298. [Google Scholar] [CrossRef]
- Zhang, J.; Zhang, L.; Pu, L.; Guan, C. Research on Spatio-temporal Variation of Urban Residential Land Price based on GWR Model: A Case Study of Jiangsu Province. Sci. Geogr. Sin. 2012, 32, 828–834. [Google Scholar] [CrossRef]
Disclaimer/Publisher’s Note: The statements, opinions and data contained in all publications are solely those of the individual author(s) and contributor(s) and not of MDPI and/or the editor(s). MDPI and/or the editor(s) disclaim responsibility for any injury to people or property resulting from any ideas, methods, instructions or products referred to in the content. |
© 2025 by the authors. Licensee MDPI, Basel, Switzerland. This article is an open access article distributed under the terms and conditions of the Creative Commons Attribution (CC BY) license (https://creativecommons.org/licenses/by/4.0/).