Article

Assessment of Masonry-Infilled Steel Frames Using Existing Experimental Tests Database in Comparison to Standards

1
Faculty of Civil Engineering, Transilvania University of Brașov, 500152 Brașov, Romania
2
Doctoral School, Politehnica University of Timișoara, 00223 Timișoara, Romania
3
Faculty of Civil Engineering and Architecture Osijek, Josip Juraj Strossmayer University of Osijek, 31000 Osijek, Croatia
4
Faculty of Civil Engineering, University of Sarajevo, 71000 Sarajevo, Bosnia and Herzegovina
5
Department of Civil Engineering, Bitlis Eren University, Bitlis 13100, Türkiye
6
Faculty of Technical Sciences, University of Novi Sad, 21000 Novi Sad, Serbia
*
Authors to whom correspondence should be addressed.
Buildings 2025, 15(2), 190; https://doi.org/10.3390/buildings15020190
Submission received: 6 December 2024 / Revised: 27 December 2024 / Accepted: 8 January 2025 / Published: 10 January 2025

Abstract

Although the influence of infill masonry on horizontal load structure behavior is well-documented, current standards and regulations have yet to fully incorporate or explicitly define the load-bearing capacity of this complex system. Canadian and American standards present more comprehensive and specific methodologies for calculating the load-bearing capacity of infill masonry and frame systems. In contrast, European standards tend to focus on offering general guidelines for the design of these systems without delving into the detailed calculation procedures. However, extensive data and experimental studies on this topic are available in the literature. The primary aim of this paper was to compile a database of experiments involving frames with different types of infill masonry. Subsequently, the empirical results obtained through the application of analytical expressions from various standards are compared to the experimental data included in the compiled database. The obtained load-bearing values were compared to different standards and work conducted by various researchers found in the literature in order to assess their reliability. Based on the obtained results, important conclusions were drawn, specifically to the most accurate equivalent diagonal model used and the analytical expressions to be used in the assessment of the masonry-infilled steel frame behavior. The equivalent diagonal model, utilized in all analytical expressions, can provide highly accurate estimations of load-bearing capacities that closely align with the experimental results. Regardless of the type of infill element, the analytical expressions consistently overestimated the load-bearing capacity. In the presence of longitudinal force, analytical expressions tend to be conservative, providing significantly lower load-bearing values compared with experimental results, which ensures a safety margin. The database can be utilized to develop numerical models, which can subsequently serve as the foundation for probabilistic methods used in conducting reliability assessments.

1. Introduction

Numerous experimental studies have demonstrated that infill walls, despite being non-load-bearing elements, exert a substantial influence on the overall behavior of frame structures, contributing to greater initial rigidity at the initial load stage. Infill masonry also has a detrimental effect on the frame structure when subjected to stronger horizontal loads, such as those generated by significant earthquakes.
Steel structures, particularly multi-story frames, are widely used in modern construction due to their high strength-to-weight ratio, flexibility, and ease of assembly. However, when subjected to seismic forces, these structures can exhibit poor performance, particularly in regions with significant earthquake activity. The 1994 Northridge Earthquake in California and the 2011 Great East Japan Earthquake are two prominent examples where steel structures, especially multi-story frames with infill walls, experienced significant damage, raising concerns about the vulnerability of such designs under extreme seismic events [1,2,3,4,5].
Despite advancements in seismic design, several issues in current design codes remain unresolved when it comes to accounting for the effects of infill walls in steel structures. Additionally, the interactions between the infill walls and steel frames are often oversimplified in current analysis methods, leading to inadequate design and potential failure during seismic events. The lack of specific detailing requirements for connections and the absence of comprehensive energy dissipation strategies contribute to the insufficient performance of steel frames with infill walls during earthquakes.
The relevance of this work lies in addressing these gaps in current design practices and codes. Given the increasing use of steel-framed buildings with infill walls in seismically active regions, it is crucial to better understand the seismic behavior of such structures and to develop improved design methodologies. Through this research, we sought to provide a more comprehensive framework for designing steel multi-story frames with infill walls that can perform reliably during future seismic events, thus improving the safety and resilience of buildings in earthquake-prone regions.
Damage to infill walls can present considerable risks to human safety and result in significant economic losses, as evidenced by prior seismic events. Despite their crucial role in both the overall and localized response of reinforced concrete or steel buildings during earthquakes, infill walls are generally regarded as non-structural [6].
In the current design of such structures, in most cases, only the weight of the infill walls is taken into account, and other strength parameters are ignored. Such walls do not directly contribute to the structural integrity of the structure; in other words, they are non-bearing walls. The purpose of infill walls is generally to provide privacy, insulation, visual separation, and protection. The structural behavior of such frames depends significantly on the dynamic properties of the relevant infill walls loaded laterally and vertically, including their rigidity, bearing capacity, period, and damping level. Infill walls constructed using different types of materials can be designed to make the building more resistant to external effects such as earthquakes [7,8,9,10,11,12,13,14].
Most steel multi-story frames in Europe, designed before modern seismic standards, perform poorly under earthquake loads due to low lateral resistance and energy dissipation [15,16,17,18,19,20,21,22]. Additionally, rigid, brittle masonry infill walls impact their lateral response and damage distribution [23]. Damages in infill walls following earthquakes reveal the necessity of examining these non-bearing elements.
Recent research has addressed this topic from multiple perspectives. While much of the focus has been on reinforced concrete buildings, significant attention has also been given to infilled masonry in steel structures.
In their paper [6], De Risi et al. compiled an extensive and homogeneous database of experimental tests on RC frames infilled with hollow clay-masonry infills—common in Italian and Mediterranean RC building stock. The study analyzed the experimental responses of these infills under lateral loads and compared them to various existing numerical models from the literature. The authors proposed a practical quadri-linear curve for modeling infill panels, which achieved accurate predictions with errors below 3%. Lognormal fragility functions were applied to empirical data, yielding results consistent with the existing literature. The study also found that higher masonry compressive strength increases displacement capacity. Additionally, a preliminary analysis suggests that the presence of openings in hollow clay brick panels has minimal impact on drift capacity for Medium-Severe and Collapse Damage States.
Di Sarno et al. [23] evaluated the limitations of the European standards through a code-based assessment using pushover analysis on a steel moment frame case study. The authors analyzed three common single strut models used to simulate the presence of masonry infills in RC structures and, in addition, conducted pseudo-dynamic tests on a large-scale 3D steel frame with masonry infills. The numerical analysis revealed that masonry infills reduced displacement capacities by approximately 40% compared with bare frames. Experimental findings showed that damage to infill walls began with local top-corner cracks, followed by diagonal tension cracking, sliding shear, and diagonal compression. Additionally, the fundamental period of the test model nearly tripled after initial cracks appeared.
In the study [24], the authors adopted an alternative approach by examining the effects of a vertically applied load, focusing on horizontal displacement, failure modes, stress distribution, and load redistribution in a center-column pushdown scenario. They also investigated the influence of material properties and opening dimensions in partial infill walls. The results showed that masonry infill walls enhance vertical load capacity and stiffness but reduce ductility and may alter failure modes. Mortar joints and opening dimensions significantly affected progressive collapse performance.
The authors of [25] studied the application of FRP (Fiber-Reinforced Polymers) composites to strengthen unreinforced masonry structures. A database of 120 FRP-reinforced wall samples was compiled from the literature, presenting and detailing various approaches for calculating the bearing capacity of FRP-reinforced masonry. The experimental findings, compiled into a database, were compared to results from literature formulas and building codes, and the model’s limitations were then discussed. Five theoretical models were used to estimate the shear strength and FRP contributions based on the literature, as well as American and Chinese standards [26,27]. The comparison of experimental and theoretical results showed that the FRP contribution from experimental to theoretical was closely aligned with the presented standards and literature, with the Chinese standards being the only ones to overestimate the FRP contribution.
Several databases of infilled frames are already available in the literature (De Luca et al., Huang and Burton) [28,29]. The database compiled by De Luca et al. [28] was developed to derive empirical expressions based on which the behavior of the infill elements will be assumed. More precisely, it was used for the creation of the so-called backbone curve. A similar approach was used by Huang and Burton [29], who used their database to define a damage classification for frame structures with infill walls, and to estimate the collapse mechanisms. While most databases deal with either concrete frames with infill elements or a combination of steel and concrete, which are nevertheless mainly dominated by concrete frames, the aim of this paper was to create a database only for steel frames. The next step, after compiling the database, was to utilize existing analytical expressions derived from various standards and research studies to evaluate how accurately these expressions assess the load-bearing capacity and rigidity of the building system, as well as to identify any deviations from the expected results. Given the importance of the input parameters for analytical expressions, the database had to be significantly refined. It now only includes experiments where specific data on the material and geometric characteristics of the infill masonry and frames are provided. In addition to the numerical comparison between analytically derived values and experimental results, it is essential to conduct a detailed evaluation of the failure modes. Several authors (El-Dekhakhni, Mohebkhah and Sarhosis, Asteris et al., Farshidnia) [30,31,32,33] have proposed failure modes for infill masonry; however, it is necessary to select only those that can be assessed using the chosen analytical expressions. In Figure 1, five modes of failure defined according to El-Dakhakhni [30] are shown: corner crushing (CC), sliding shear (SS), diagonal compression (DC), diagonal cracking (DK), and frame failure (FF).
The CC mode is characterized as a breakdown in the corners of the wall panel and as a diagonal cracking between opposite corners. The SS mode is mainly characteristic of infill elements with weaker mortar and strong frames. The DC mode consists of a failure in the center of the wall panel, which is a characteristic of very slender infill elements, which are rare. This mode of failure is characteristic of weak frames with strong infill wall elements. The diagonal cracking failure mode, DK, should not be regarded as a failure mode, as the infill can continue to bear additional load even after cracking. The last failure mode, FF, occurs when frame failure manifests as the formation of plastic hinges in the columns or at the connections between the columns and beams. This mode of failure is characteristic of weak frames or frames with weaker connections and strong infill wall elements. In most of the frames examined through the load cycle test, almost every mode of failure occurs at different intensities. By examining the failure modes, a critical assessment of the validity of the analytical expressions can be conducted to determine whether the minimum values associated with the load-bearing capacity align with the failure mode of the analyzed frame with infill masonry.
Non-structural infill walls are not included in the load-bearing system of a structure and are constructed only to separate interior spaces. In the current design of such structures, in most cases, only the weight of the infill walls is taken into account, and other strength parameters are ignored. Structural damages occurring in non-structural infill walls, especially after earthquakes, reveal that infill walls should not be taken into account only as weight in structural analyses. The effect of infill walls on the load-bearing capacity is of great importance, especially in terms of the stability, safety, and economic efficiency of the structure. In the design phase of the structure, the correct evaluation and construction of the load-bearing capacity of infill walls are important in order to reveal the behavior of structures, especially under earthquake effects, more realistically. Within the scope of this study, many publications examining the contribution of infill walls to the load-bearing capacity of steel structures were taken into consideration. For this purpose, it was aimed to create a database by compiling these studies. This database created from experimental results was compared to the empirical results obtained by applying analytical expressions from individual standards. It is thought that this study will contribute to the development of building codes in order to reveal the effects of non-bearing infill walls on the structural system. In addition, this study will make significant contributions to the academy by compiling and using the results predicted by many different researchers.

2. Database of the Masonry-Infilled Steel Frame Structures

A key aspect of the database is the compilation of relevant parameters within a specific research area. Consequently, when the preparation of the database began, an initial version was created to collect as much data as possible. After determining the final set of relevant parameters using selected analytical expressions, the database was refined to include only experiments with complete input and output data.
The final database comprises 59 samples, all steel frames with various infill elements, as noted in the introduction. Of the 59 experimental datasets, only two represent two-story frames, while the remainder are single-story frames. Additionally, 54 datasets correspond to frames with rigid connections, and five pertain to frames with pin joints. The basic parameters that were collected include frame and infill geometry and material properties, with outputs covering initial stiffness, secant stiffness, cracking force, and maximum force.
Types of infill were various, from solid brick to concrete blocks (a description of each type of infill is presented in Table 1). A significant number of concrete blocks were included, whereas aerated concrete blocks (denoted as AAC in the database) were minimally represented. The solid wall elements (68%) prevailed predominantly, with the solid brick wall element being the most prevalent, while the representation of hollow blocks was 32%. In addition to this, the classification also considered the vertical compressive strength of the wall element. The infill elements with a compressive strength greater than or equal to 10 MPa were grouped as “strong”, while those with a lower value of 10 MPa were grouped as “weak”. Given the dominance of solid wall elements, a higher percentage of “strong” infill (67%) was anticipated and observed in the whole database. In addition to the various properties of the infill material, a key characteristic of the steel frame examined in this study was the aspect ratio (height/width). Frames with a ratio of 0.5 prevailed, while a smaller number of frames had a ratio higher than 1.0.
The selection of parameters for infill walls was fundamentally guided by their role in contributing to the load-bearing capacity of masonry structures. The type of material used in infill walls is critical, as it determines the basic mechanical properties, such as compressive and shear strengths, which directly influence the wall’s ability to carry axial and lateral loads. High-strength materials like concrete blocks or bricks are preferred in load-bearing applications, while lighter materials like aerated concrete are used when weight reduction is prioritized, albeit with a compromise in load capacity. The compressive strength of the mortar also plays a crucial role in ensuring effective bonding between masonry units and maintaining structural integrity under load. Furthermore, the interaction between the infill elements and the structural frame determines how forces are distributed. Rigid connections enhance load-sharing but can lead to stress concentrations, while partially detached connections allow for differential movement, especially in seismic zones.
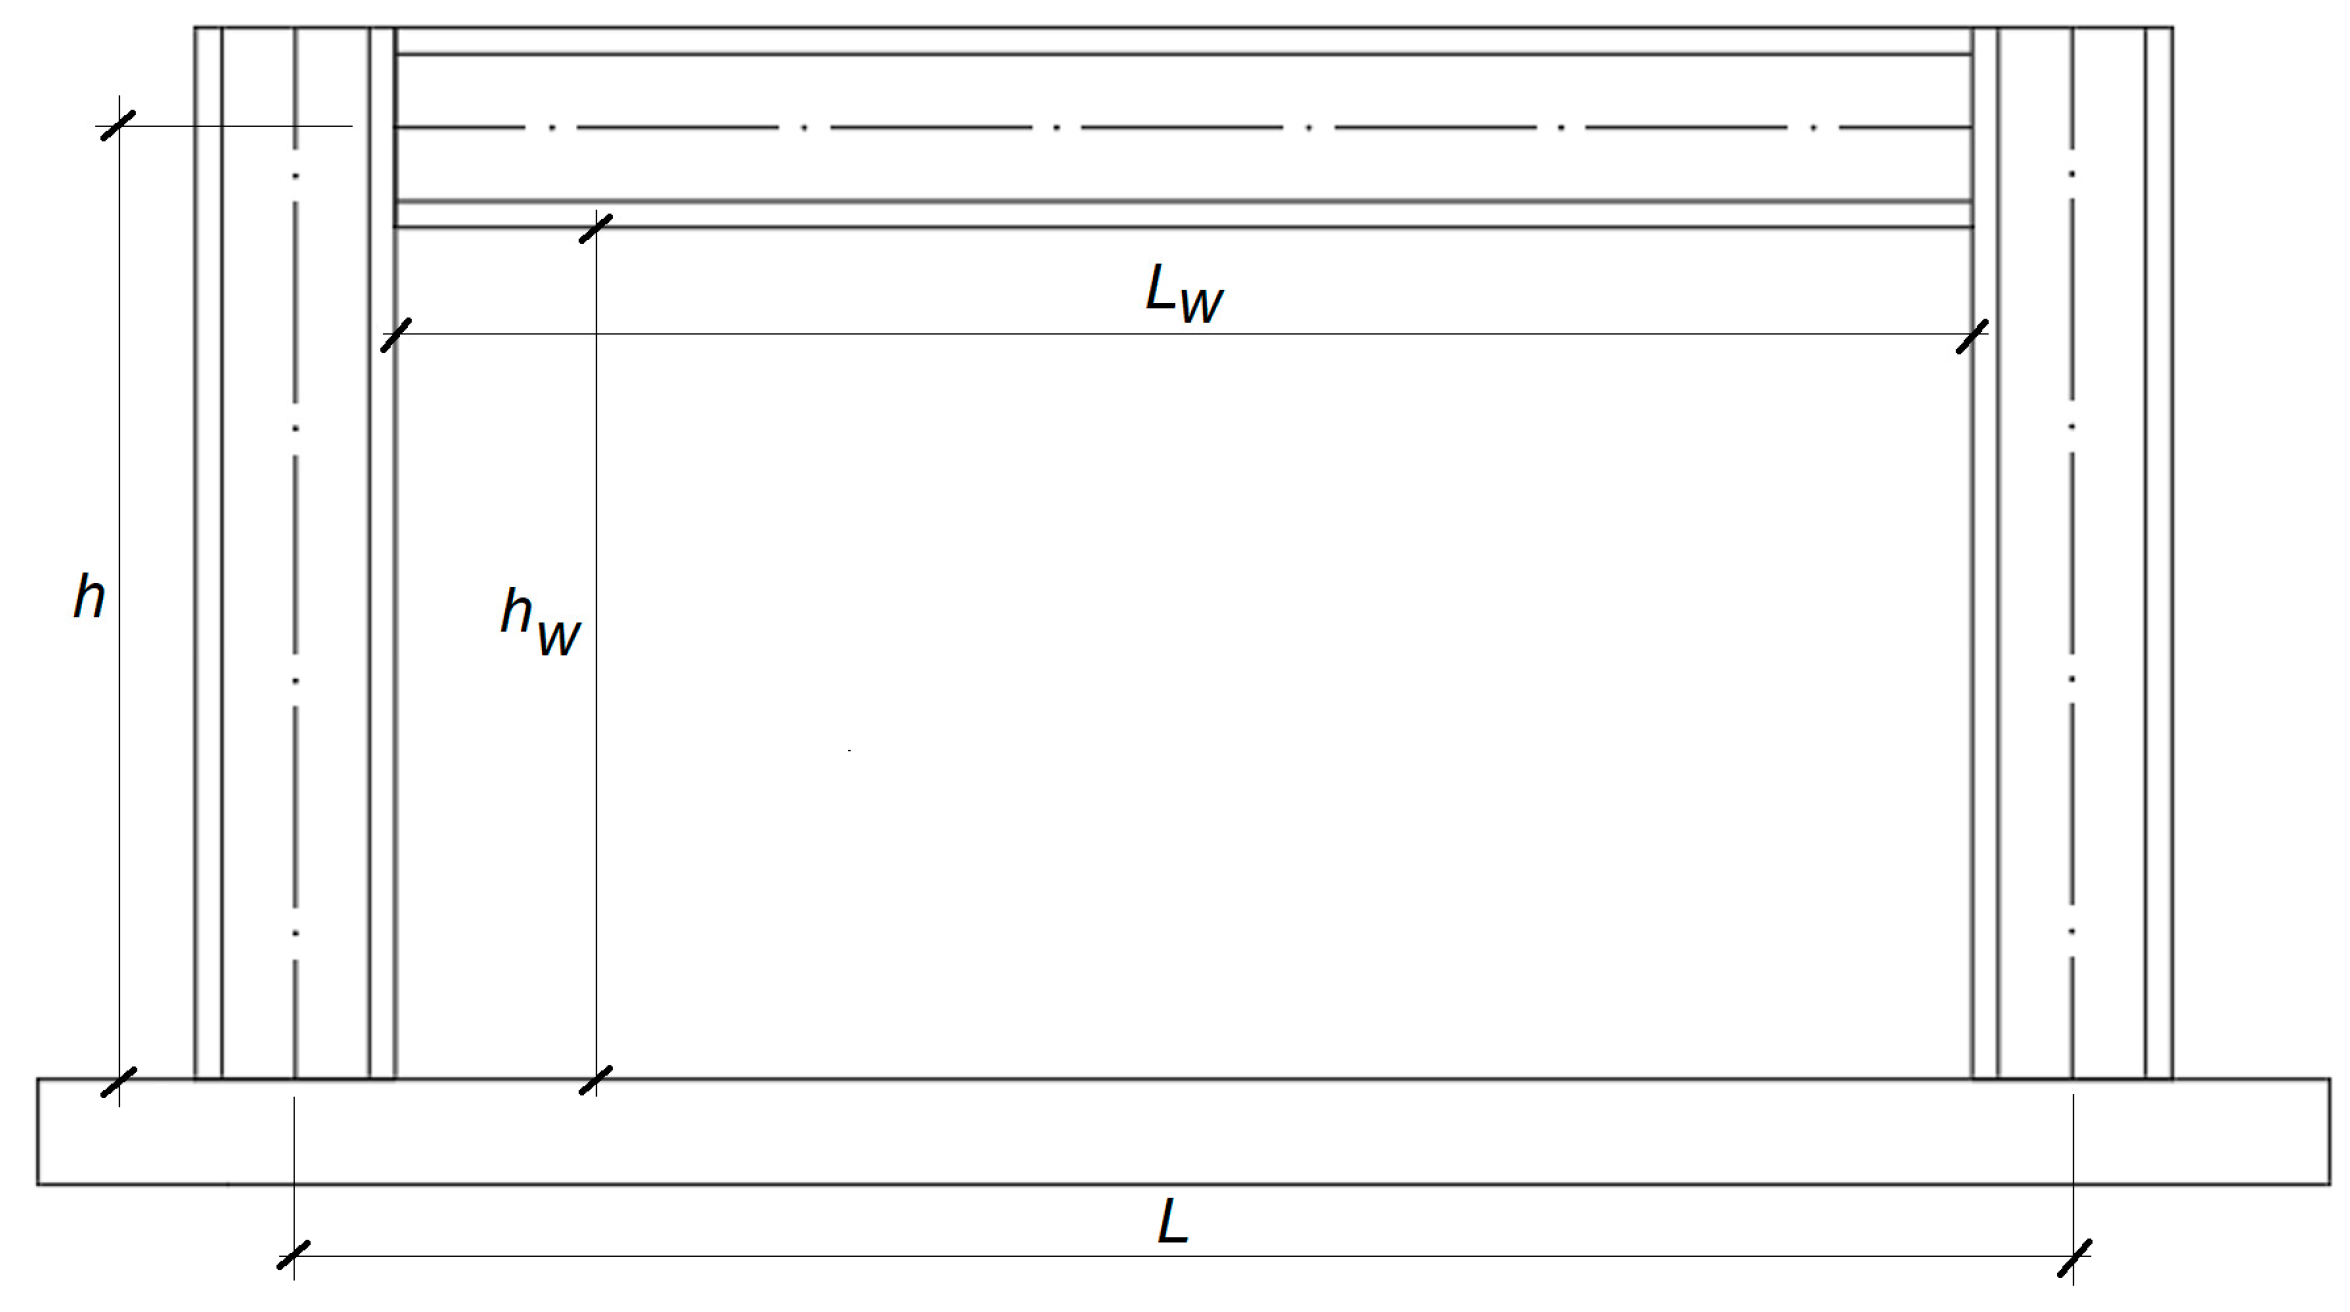
Table 1 contains the parameters of the steel frame, such as height (H), width (L), column and beam moment of inertia (Andc; Andb), the module of elasticity (Es), and plasticity (Wpl,c).
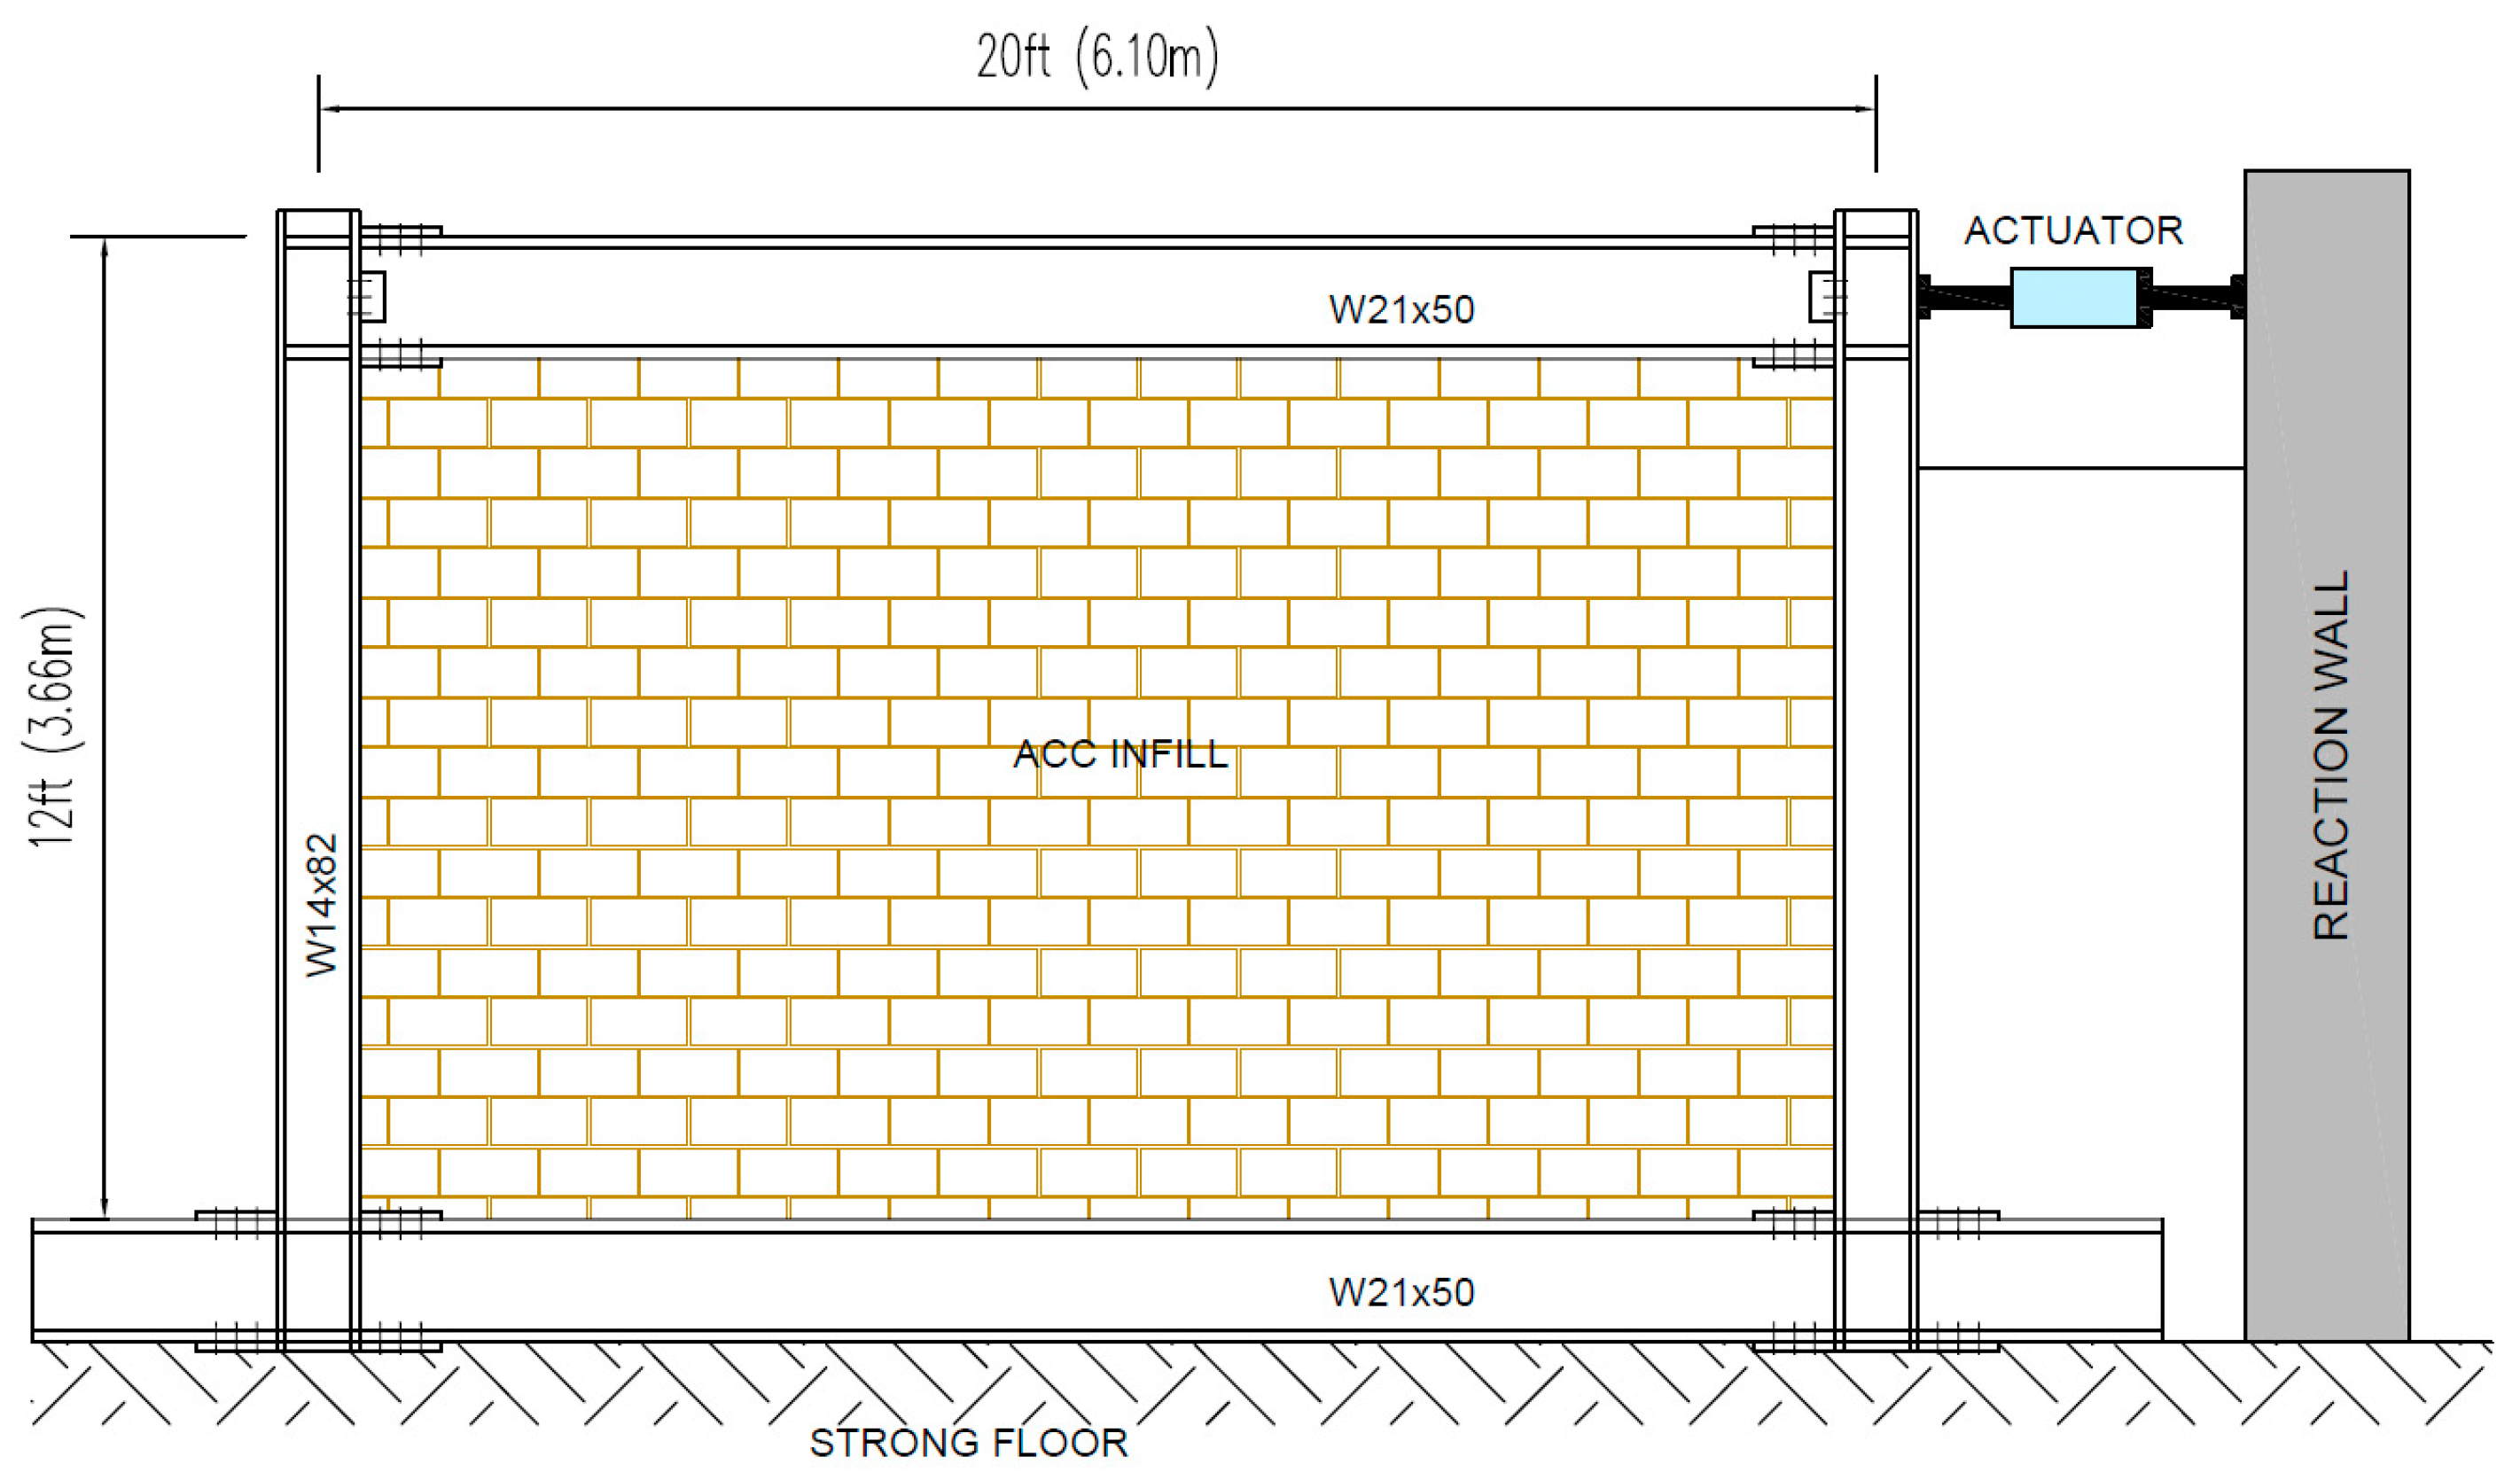
Figure 2 illustrates the steel frame scheme with the infill material. When the modulus of elasticity for steel was unspecified, a standard value of 210,000 MPa was used in the calculations. The plastic modulus, calculated based on the geometry of the element profile, was utilized to determine the load-bearing capacity of the frame.
Table 2 presents the values of the following parameters for each frame considered: height (Hw), length (Lw), width (tw) of masonry, vertical compressive strength of the masonry unit (fb) and masonry (fk), and modulus of elasticity of masonry (Em). In the locations of empty fields, the values were not defined. In the considered articles, where the modulus of elasticity of masonry made of solid elements was not stated, the term given in EN 1996-1-1 [48] was used, while for aerated concrete infill elements, the term state in CSA-S304-14 [49] was used.
E m = 1000 · f k ,
E m , A A C = 6500 · f k 0.6 ,
where the following is true:
  • Em—modulus of elasticity of masonry;
  • Em,AAC—modulus of elasticity of aerated concrete infill;
  • fk—compressive strength of masonry.
Given the diverse range of infill materials incorporated into frame structures, it is expected that the modulus of elasticity values exhibit considerable variability. This broad range can be attributed to the distinct mechanical properties of the infill materials, which are influenced by their composition, production methods, and exposure to environmental conditions. Such variability highlights the complexity of accurately modeling and predicting the behavior of infill materials in structural applications.
Regarding the horizontal load, cyclic (quasi-static) loading was predominantly applied, while the lateral force was applied monotonically in only two samples. Of the 59 frames tested, six were subjected to both horizontal and vertical forces.
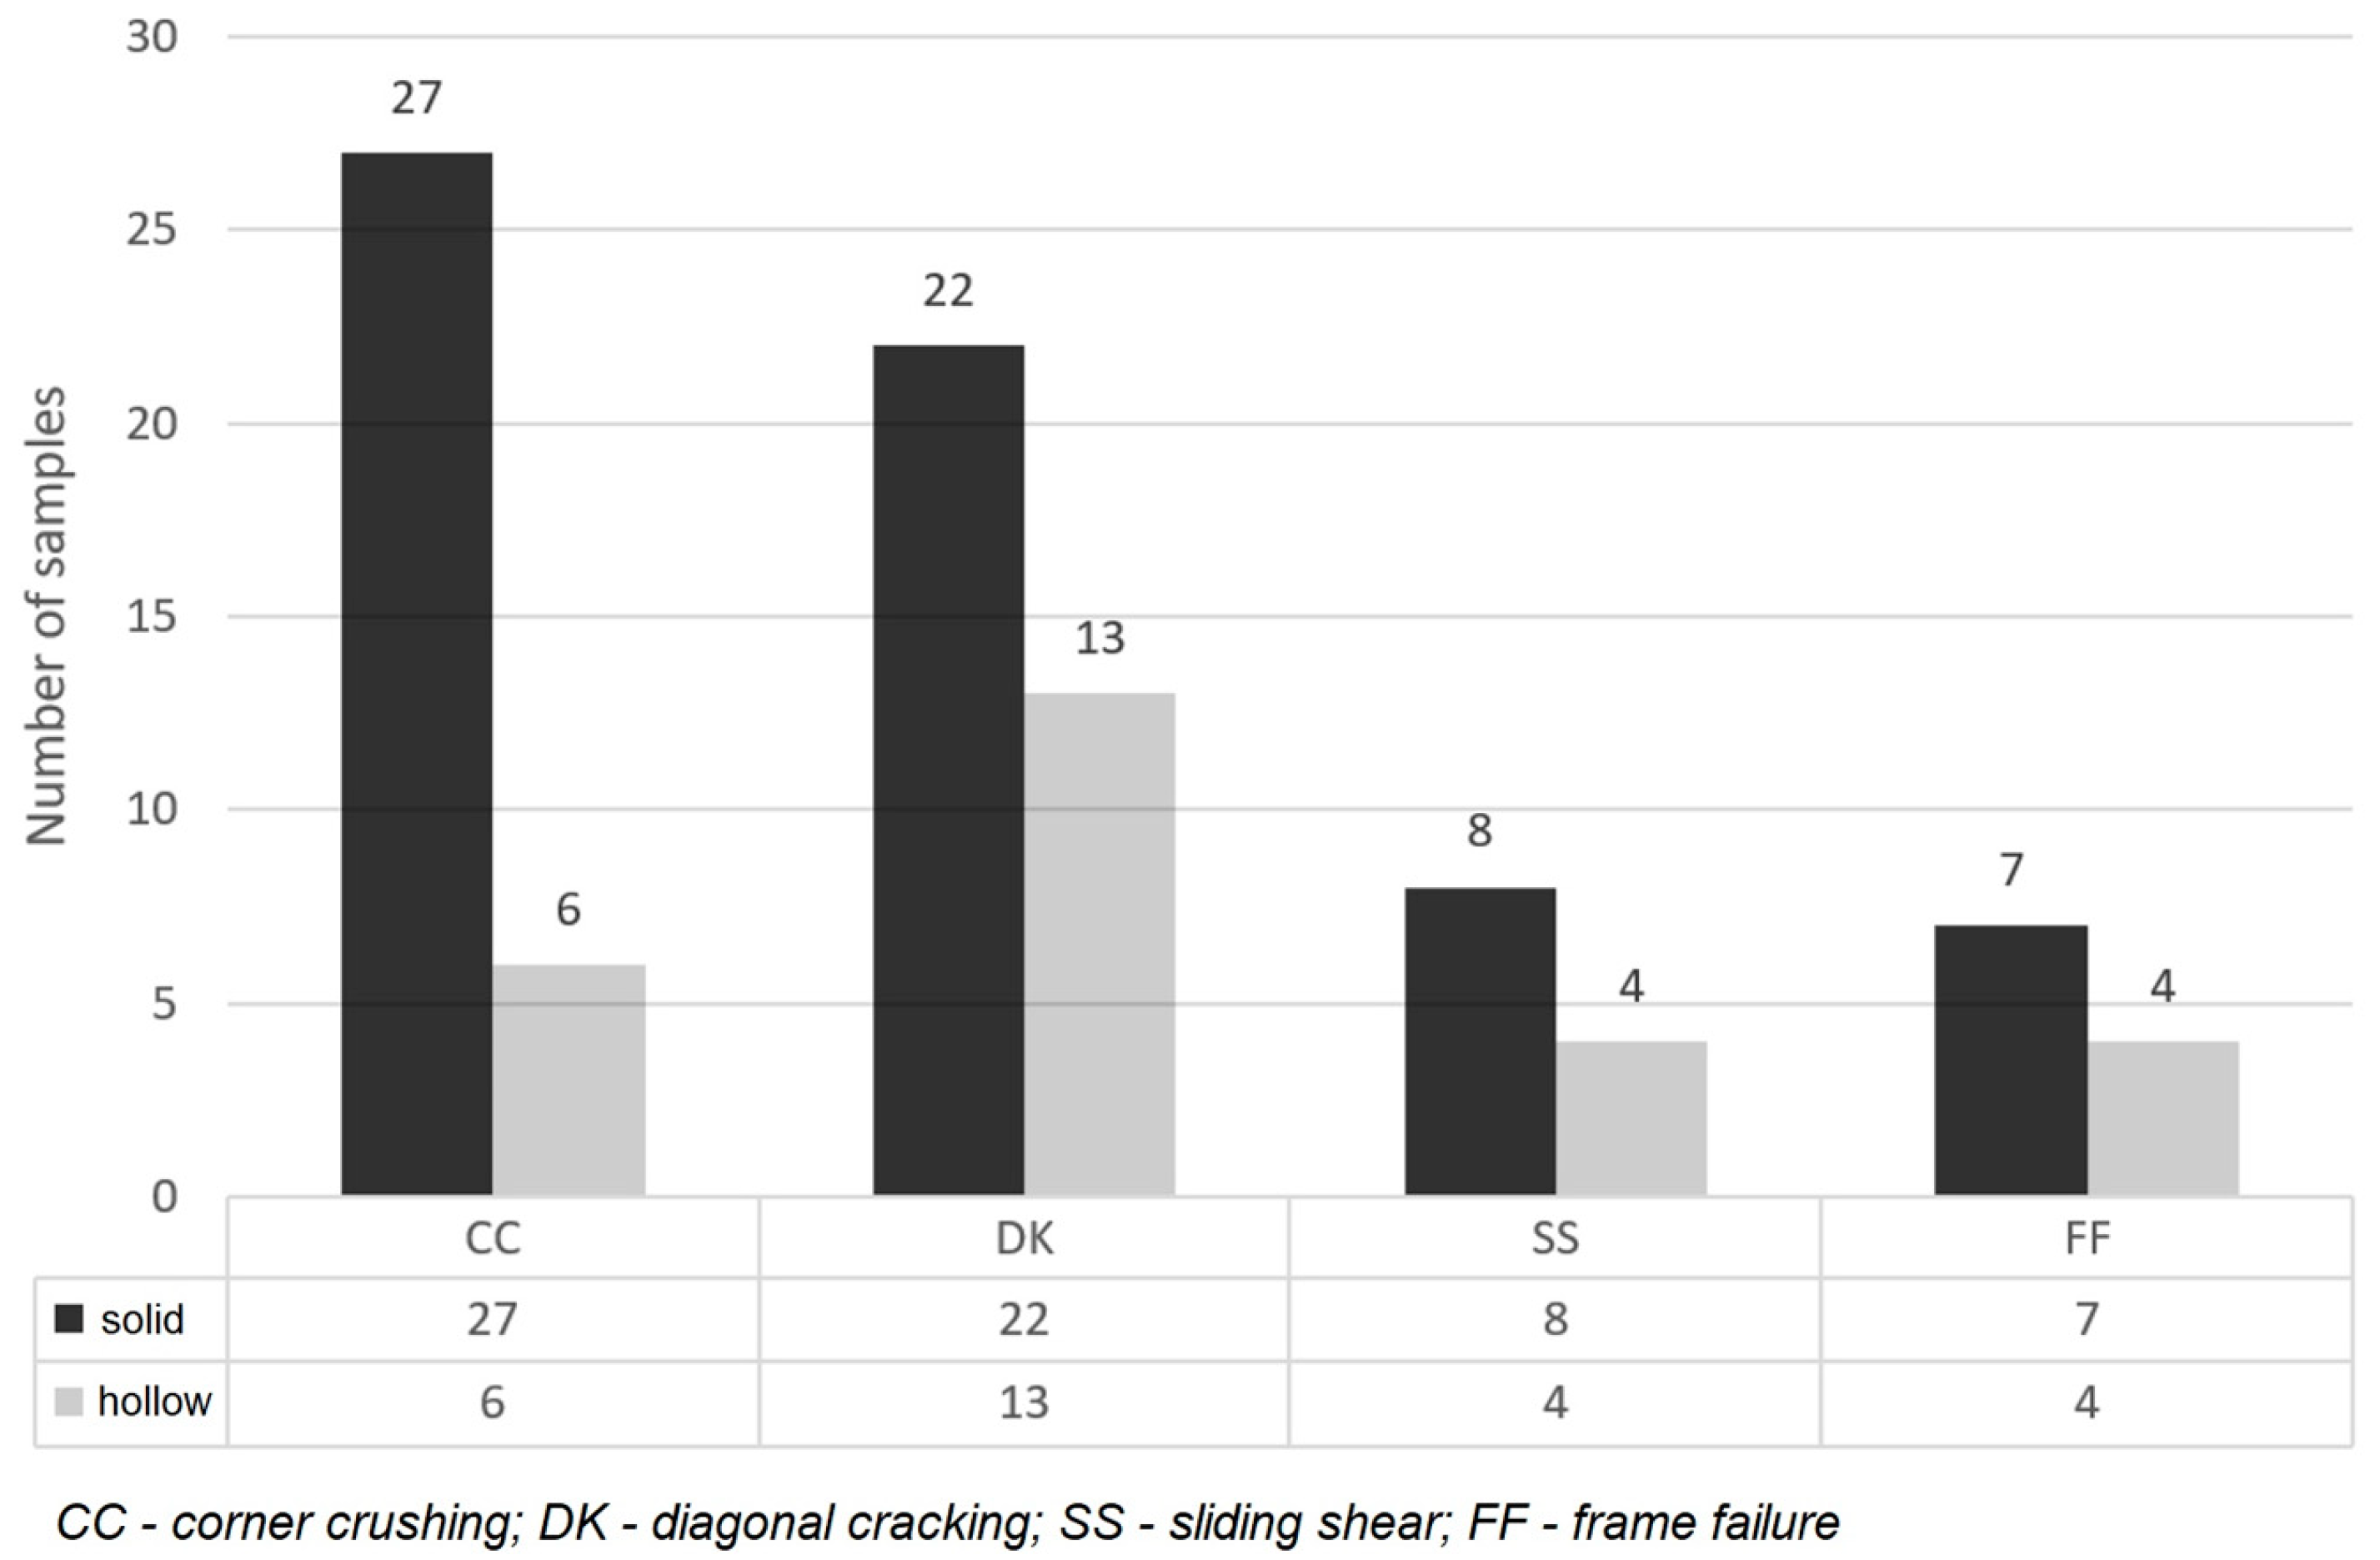
Figure 3 presents histograms of failure mechanisms based on the type of wall element (solid or hollow).
In most cases, several damage mechanisms on one tested sample were observed, and the database was thus adapted. According to Figure 3 histograms, the most common failure mode for solid infill is the compression failure mode, characterized by crushing of the infill at the corners (CC—failure). This failure mechanism is associated with higher compressive strength of the infill masonry and is consistent with the findings reported by De Luca et al. [28] concerning the failure mode and the type of infill element. For hollow blocks, diagonal cracking (DK) is the predominant failure mechanism, with numerous cracks observed in the infill masonry. This eventually leads to block fallout or corner crushing, which is the final stage of failure. In addition to the above failure mechanism, failure in the mortar joints has been observed, which is characteristic of the masonry infill with higher mortar compressive strength in relation to the vertical compressive strength of the infill elements. Plasticization of the frame was recorded in only a few tested frames. However, in some studies, experiments were conducted only up to the failure of the infill elements or a specific displacement limit, making plasticization unattainable in certain cases. Ultimately, it can be noted that this failure mechanism for steel frames is not represented in this way. SS failure is less prevalent overall, with eight cases for full infill and four for hollow infill. Lastly, FF failure is observed in seven full infill cases and four hollow infill cases. These data suggest that full infill is more prone to failure across all mechanisms, with CC and DK being the dominant types, while SS and FF failures are comparatively rare.
The main test results are initial stiffness (Kini), secant stiffness (Ksec), the value of the force at the appearance of the first crack (Fy), and the maximum force (Fmax) that the system could withstand, and they are presented in Table 3.
Figure 4 illustrates two loading schemes for the tested frames. The first scheme involves cyclic loading without vertical load, characteristic of all studies except for those numbered 18, 19, 20, 22, 23, and 24 in Table 1, where an additional vertical load was applied to the beam. The second scheme in Figure 4 illustrates the application of vertical force, with its positioning varying across different studies.
An important aspect of this database is that the analytical expressions referenced in subsequent sections do not account for vertical force. Therefore, experiments involving additional vertical load are expected to deviate from the analytical results. These deviations were analyzed to determine whether vertical force positively or negatively impacts the load-bearing capacity and, specifically, whether it underestimates or overestimates the capacity of a frame with infill masonry.

3. Database Analytical Terms/Expressions Used for Estimating the Load-Bearing Capacity and Stiffness

Analytical expressions in various standards and codes provide guidelines for calculating the load-bearing capacity of masonry-infilled frames (Table 4). In this study, three different equations specified by regulations used in USA (FEMA-306) [50], Canada (CSA S304-14) [49], and Europe (EN 1996, EN 1998) [48,51], as well as two different equations (Paulay and Priestley [52] and Liauw and Kwan [53]) commonly found in the literature, were taken into account in order to analytically calculate the load-bearing capacity of infill walls. These expressions, based on the equivalent diagonal strut model, were used to evaluate the system’s load-bearing capacity and deviations from actual behavior. Detailed explanations and descriptions of the parameters found in Table 4 will be provided in the subsequent sections.

4. Comparison of CSA S304-14 [49] Standard with Experimental Data

This section provides a detailed overview and analysis of the standard in question and all experiments included in the database. This approach allows for a more precise understanding of how analytical expressions assess load-bearing capacity and highlights the behaviors of frames with infill walls that cannot be captured or defined by these expressions. According to CSA S304-14 [49], there are three possible approaches to the design of infill masonry in frame structures:
  • Participating infill (diagonal strut approach). For frame structures with an infill wall that lacks openings and where there is no direct connection between the frame and the wall, the diagonal failure model is applied (Figure 5). However, if openings are present, it must be demonstrated that diagonal failure remains a feasible failure mechanism.
  • Frame and infill composite action. When the infill shear wall is tied and bonded to the frame to create a composite shear wall.
  • Isolated infill masonry.
In the following subsections, frames will be selected from groups of articles by the same authors, accompanied by brief descriptions of the corresponding experiments (as referenced, numbered, and labeled in Table 1). These selections aim to illustrate how various factors related to the configuration of the frame with the infill wall influence the final results, highlighting the limitation of analytical expressions in capturing certain aspects. The parameters presented in the tables in this section are in accordance with the CSA S304-14 standard [49] as previously defined.

4.1. Experimental Database—Markulak et al. (2013) [34] and Markulak et al. (2020) [35]

All specimens associated with the experiments conducted by the authors of the aforementioned articles were subjected to quasi-static loading without vertical load. Of the 15 frames studied, only two were pinned. The masonry is enclosed within the steel frame but lacks any structural connection to it, leaving a gap at the interface between the wall and the frame. Additionally, the wall contains no openings, leading to a diagonal failure mechanism as outlined in CSA S304-14 [49]. The results obtained from these experiments are summarized in Table 5.
Frame markings listed in Table 5 are as follows: C—brick block, AAC—aerated concrete, CA—a combination of aerated concrete and brick block in the wall, PF—pinned frame, RF—frame with clamped joints, M and MF—self-compacting concrete wall element with recycled brick aggregates and polystyrene. The analytical results obtained in accordance with CSA-S304-14 show a strong correlation with the experimental findings, particularly for hollow wall elements (samples 1, 2, 3, 12, 13, 14, and 15), where diagonal compression was identified as the primary failure mode. Despite differences in compressive strength and modulus of elasticity between wall elements C and M, the analytical model provided accurate load-bearing capacity estimates. However, larger deviations were observed with aerated concrete wall elements, which showed insignificant diagonal compression failure. Nevertheless, the analytical predictions correctly reflected their low resistance, which was attributed to their very low compressive strength.
The failure in these samples occurred in the mortar joints, as YTONG glue (with higher compressive strength than aerated concrete) replaced the mortar, a factor not included in the analytical model. For the combined filling frame (samples 7, 8, and 9), the analytical results showed larger discrepancies compared with experimental data due to the experiment’s configuration, which the model could not predict. The main issue is accounting for the compressive strength of the combined blocks, as aerated concrete blocks near the column fail quickly, while brick blocks remain largely intact.
Samples 10 and 11 exceeded the expected resistance due to an inaccurately defined joint frame bearing capacity (VFr), while the masonry resistances were consistent with those of the other samples. In conclusion, the comparison of the tested frames with the analytical results showed relatively good agreement, particularly for samples with diagonal compression failure. However, larger discrepancies were observed for frames exhibiting shear failure.

4.2. Experimental Database—Liu and Soon (2012) [36] and Liu and Manesh (2013) [38]

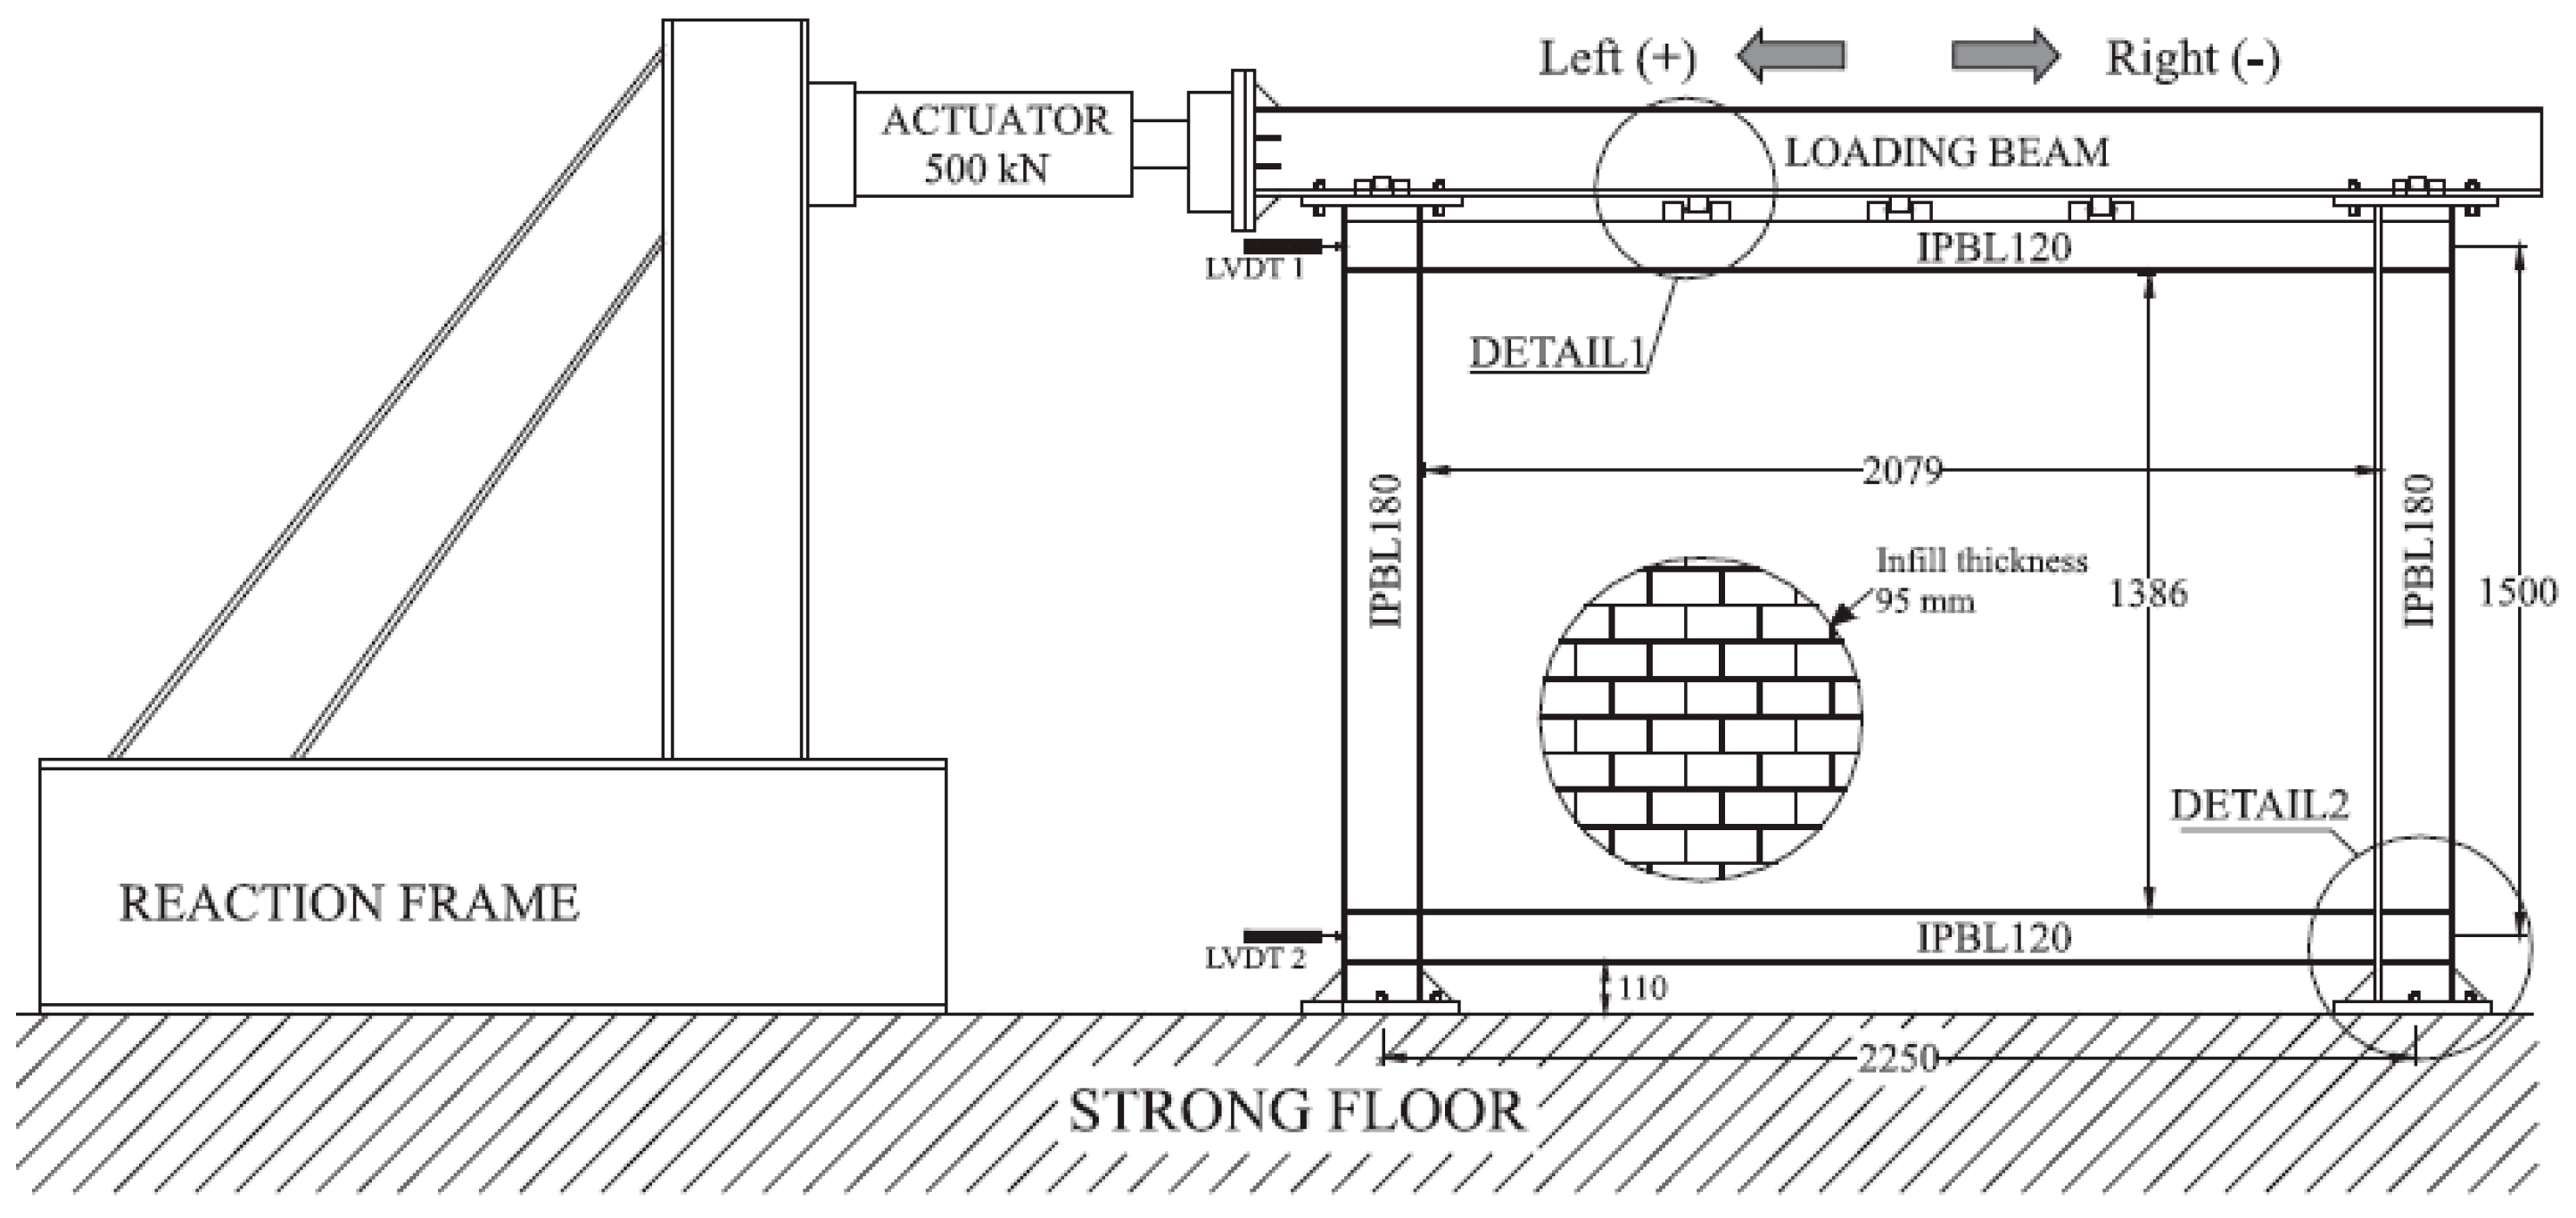
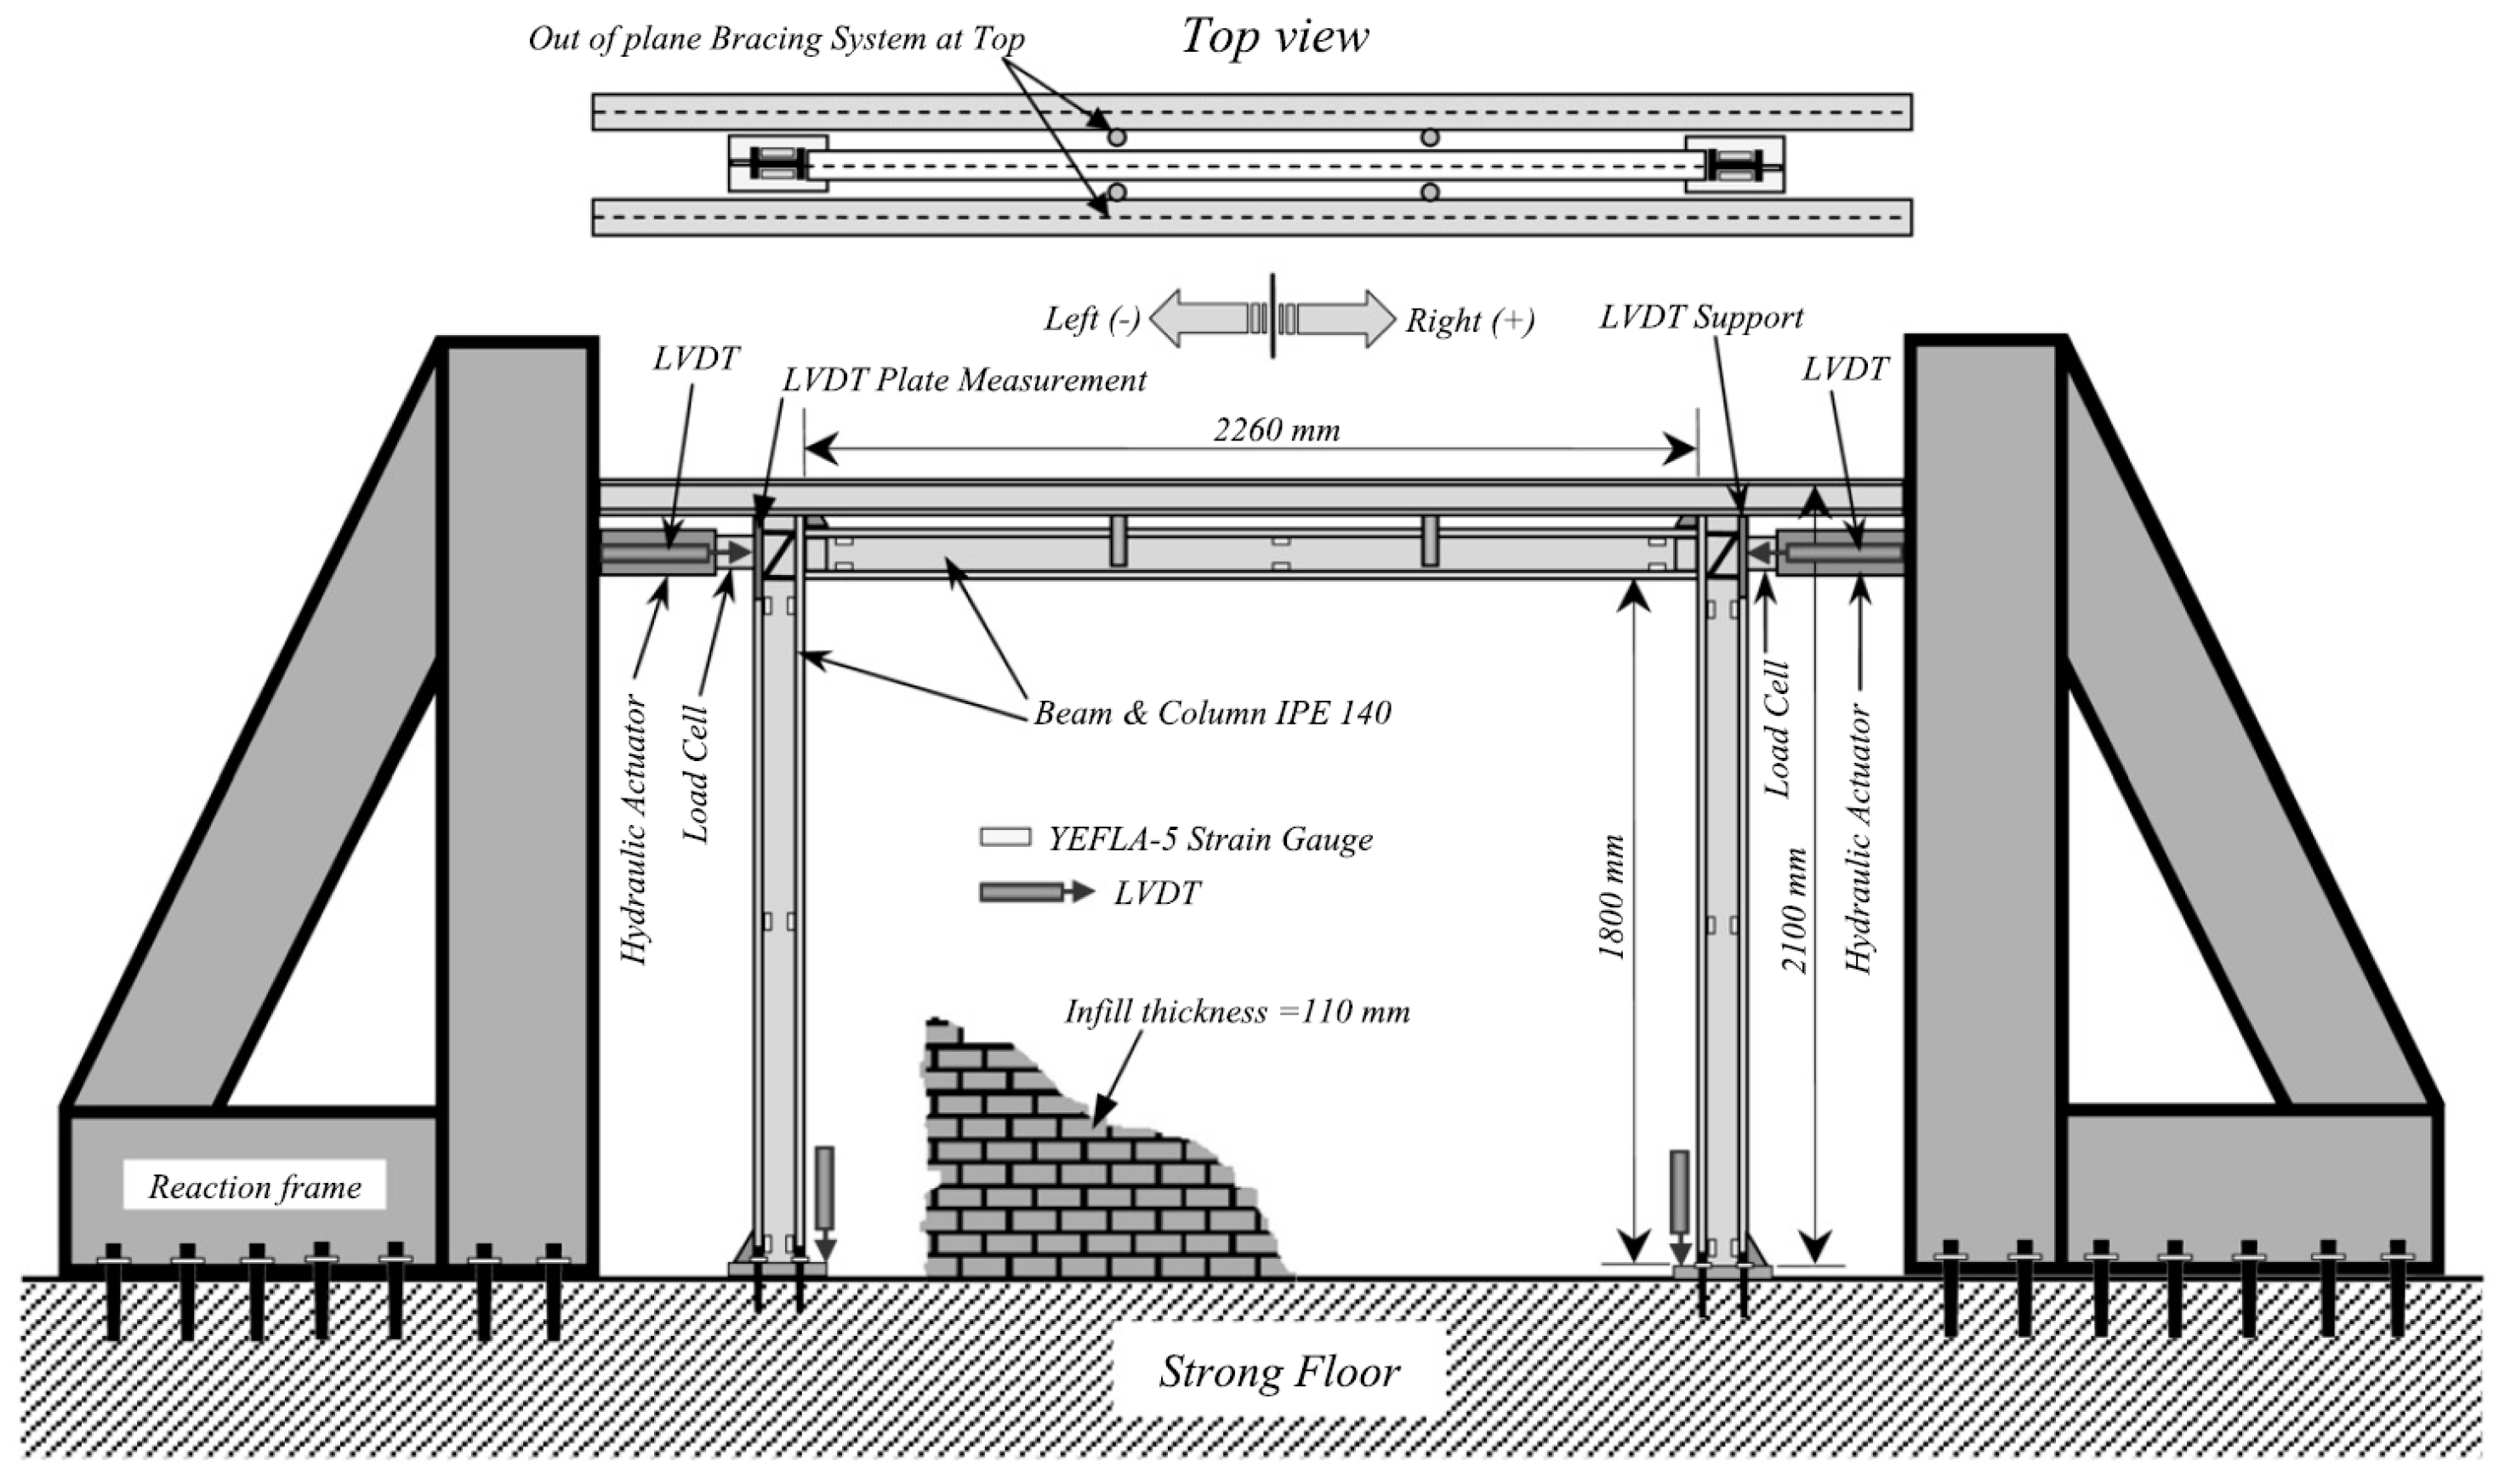
The configuration presented in studies [36] and [38] consists of frames subjected to both cyclic and vertical longitudinal loading. The masonry consists of concrete blocks, which are either partially, fully, or not filled with mortar, depending on the pattern. The masonry is framed by a steel frame, ensuring there are no gaps between the frame and the masonry. The experimental setup conducted in refs. [36,38] is presented in Figure 5.
The obtained results are presented in Table 6, which were very uneven. The experiment uses the following symbols: C—combined load, N—no filling of concrete blocks, F—fully filled cavities in blocks, P—partially filled cavities in blocks, and 1, 2, 3—indicate the intensity of the longitudinal force (samples: 18, 19, 20, 22, 23, 24). For samples 28–35, the numbers represent the height/length ratio. Additionally, NI refers to a column-oriented along the weaker axis, and NA refers to a column-oriented along the stronger axis. For samples subjected to combined load, a vertical force of predetermined intensity was first applied, followed by a horizontal load until the experiment was stopped.
Many samples deviate from the analytically predicted load capacity, likely due to the high compressive strength of the concrete blocks. In sample 16 (without longitudinal force and additional mortar inside the block cavities), the discrepancy is over 100%. In comparison, sample 17 (no longitudinal force, fully filled cavities) shows a smaller deviation. Masonry fully filled with mortar in cavities has lower compressive strength (9.1 MPa) but a higher modulus of elasticity (12,800 MPa). The CF-1,2,3 samples align well with analytical results despite not accounting for longitudinal force or the influence of the filling of concrete blocks. Samples with different height/length ratios deviate significantly, except for F1NA (length-to-height ratio 1), which matches the analytical results, though this is questionable due to the unaccounted impact of cavity filling. Experimental results show that longitudinal force increases the load-bearing capacity, making analytical expressions with longitudinal force conservative.

4.3. Experimental Database—Tsantilis and Triantafillou (2020) [37]

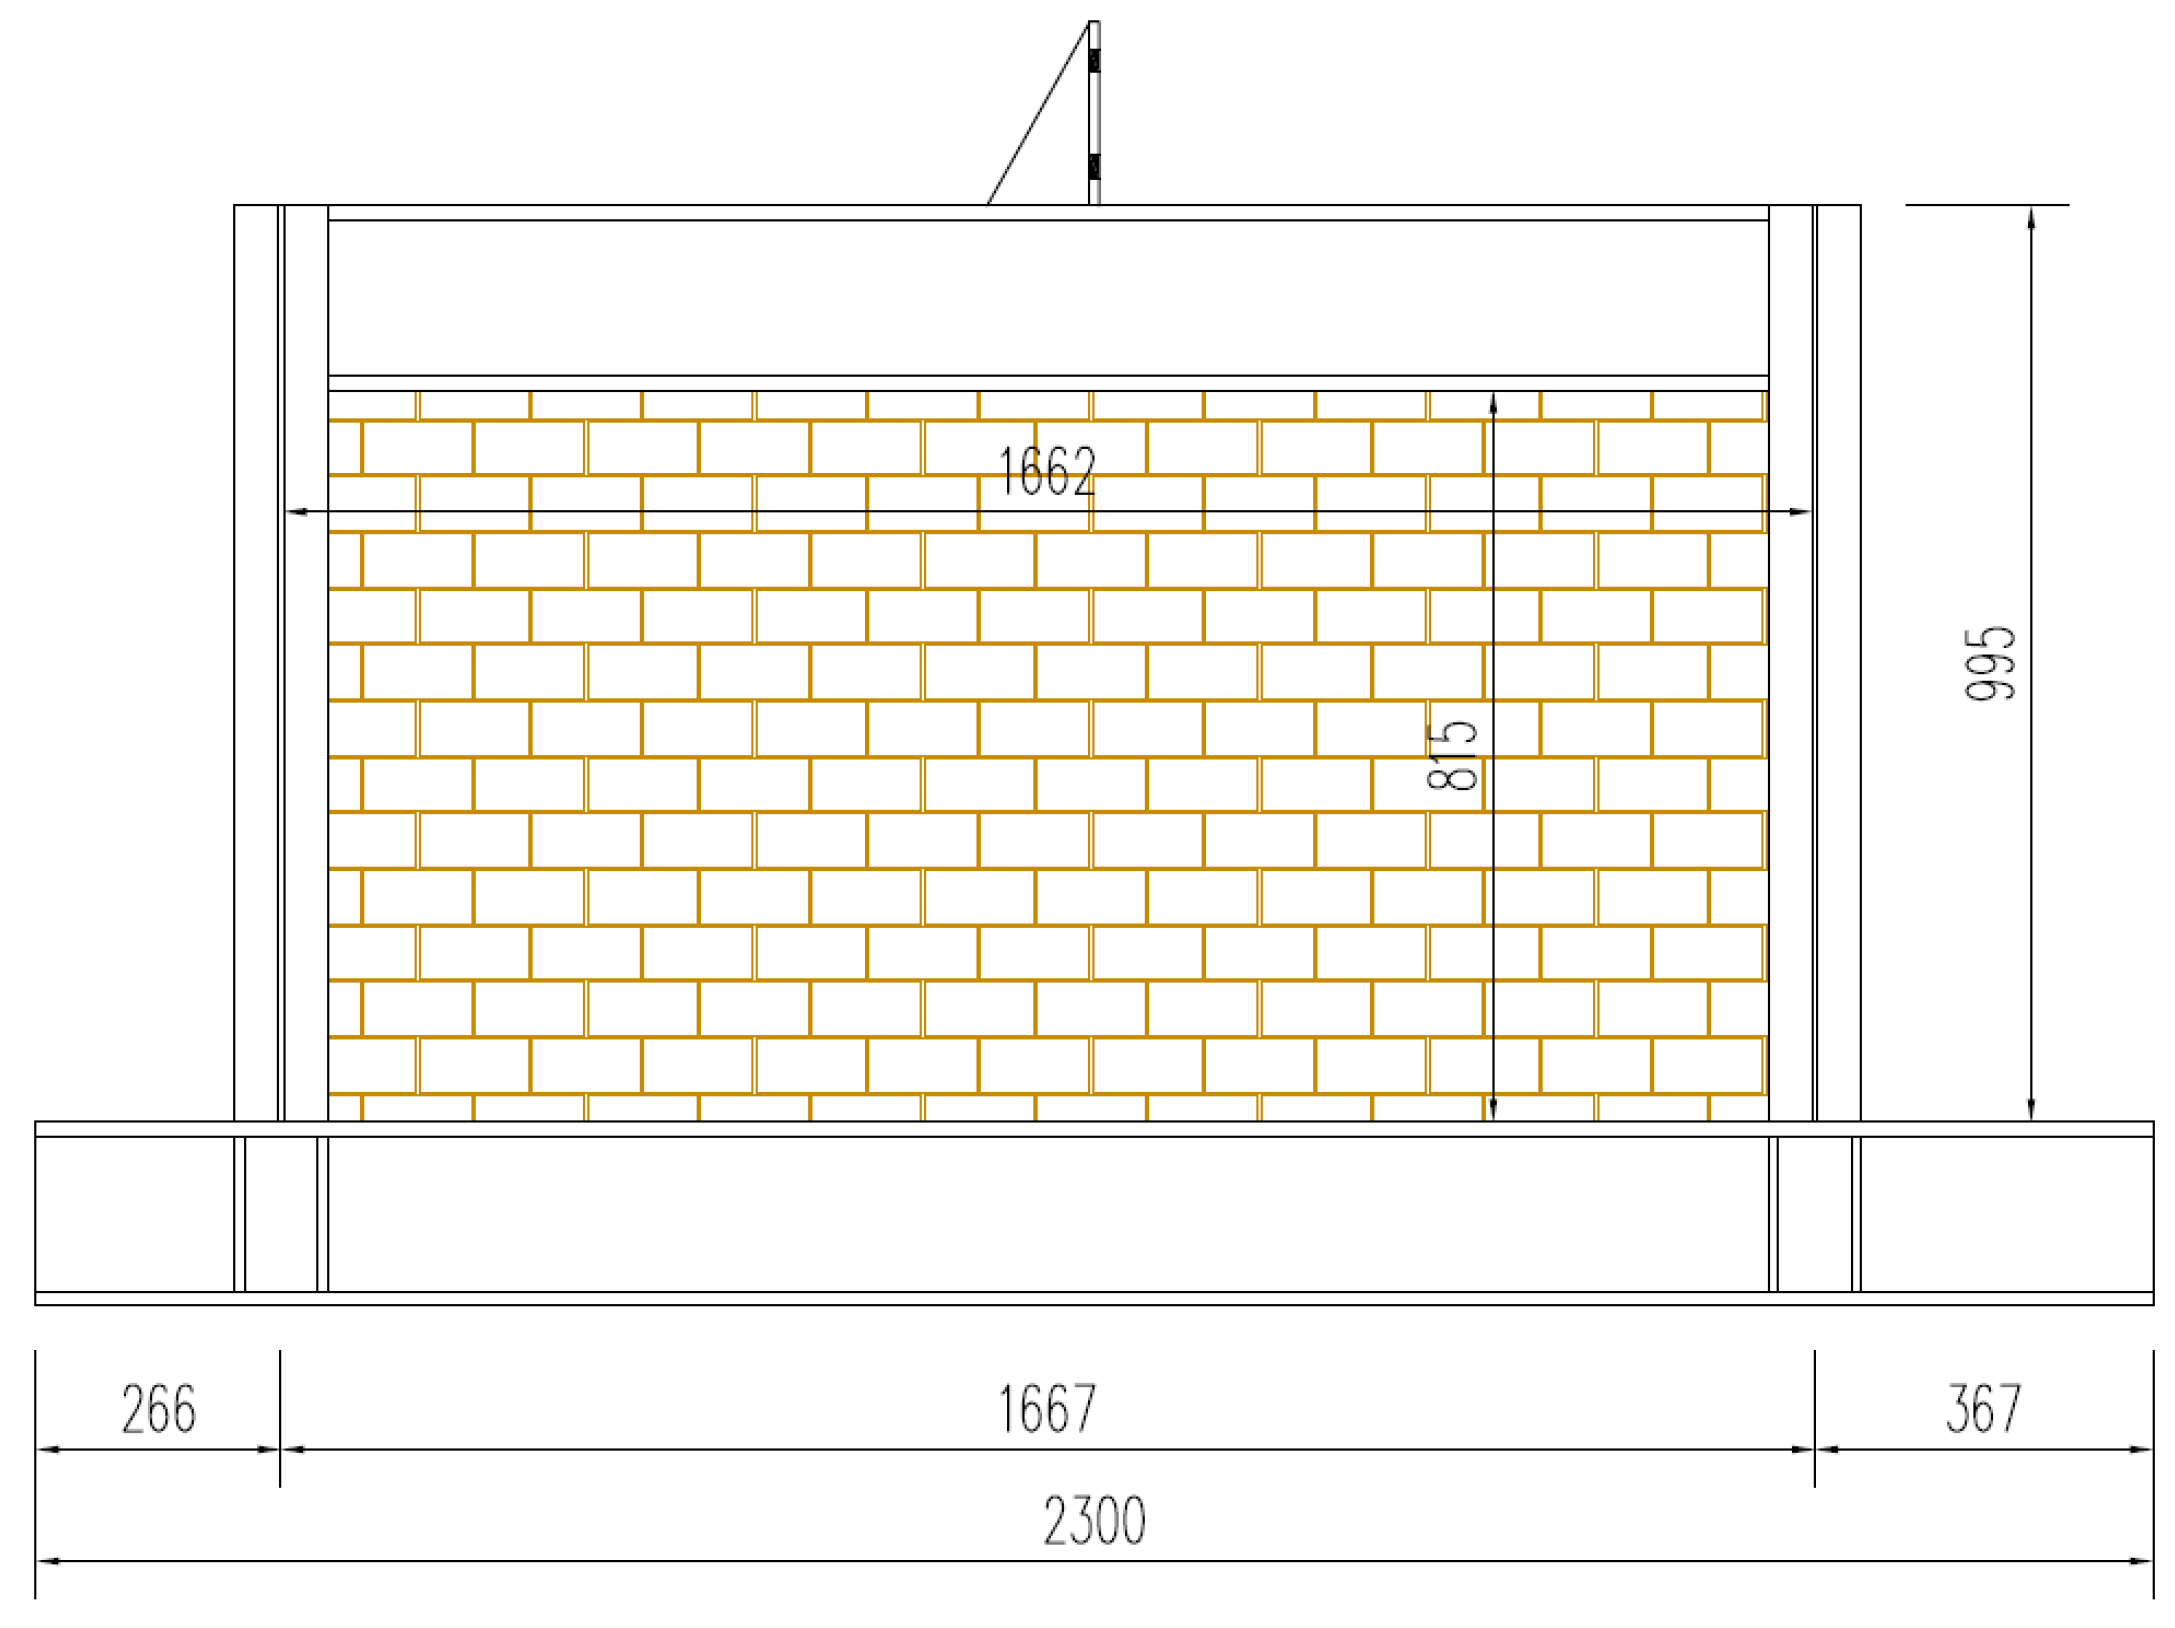
The experimental setup conducted in ref. [37] is presented in Figure 6.
Sample S0, presented in Table 7, is similar to previous samples, with no gap between the frame and masonry, while the other two samples (S2 and S4) were made in such a way that there is a layer of polyethylene rubber of different thicknesses being placed on the contact between the masonry infill and the frame. In this configuration, the masonry is partially isolated from the frame, allowing for some displacement. The frames are subjected exclusively to horizontal forces, with brick blocks used as infill elements. The results are summarized in Table 7, where discrepancies from experimentally obtained data are evident. These discrepancies are expected, particularly for S2 and S4, due to variations in sample configurations compared with the equivalent diagonal model defined in CSA S304-14 [49].

4.4. Experimental Database—Moghadam (2004) [39] and Moghadam et al. (2006) [45]

The obtained analytical results of these studies are summarized in Table 8. Solid bricks were used for samples 38, 54, and 55, while block bricks were used for the remaining two. In samples 54 and 55, the gap between the masonry and the beam was filled with a layer of concrete. As for comparing analytical and experimental values, similarities can be seen only in samples 36 and 37, while the deviations for other samples are much larger. The most noticeable similarity emerged once more in the sample where the failure along the compressive diagonal was particularly significant.

4.5. Experimental Database—Mohammadi and Emami (2019) [41], Mohammadi et al. (2011) [43], and Mohammadi et al. (2017) [44]

The experimental results presented in the aforementioned articles are summarized in Table 9. The samples are categorized into three distinct groups: the first group includes samples 41–44, the second group comprises samples 46–51, and the third group consists of samples 52 and 53.
All frames were subjected to horizontal loading and filled with solid brick wall elements. The first group of experiments aimed to evaluate the effects of connections (fixed or pinned) and the influence of multiple spans. Comparisons of the results for samples 41 and 43 reveal that the analytical expressions do not accurately estimate the load-bearing capacity of multi-span frames, as observed in sample 43. However, for the same frame configuration with a single span (sample 41), the results align within a 3% margin. Furthermore, for pinned frames (samples 42 and 44), the concordance between analytical and experimental results is relatively good. This is especially notable given the significant discrepancies observed in previously tested pinned frames (Table 5) when compared to the experimental results.
For the Group 2 samples, values for samples 46, 47, 49, and 51 were omitted due to the absence of bearing capacity data. Significant discrepancies were observed for samples 48 and 50 when compared to the experimental results. In Group 3, the primary difference lies in the method of force transfer to the frame. For sample 52, the horizontal force was applied to the reactive beam, resulting in a continuous load transfer to the frame. In contrast, for sample 53, the force was applied directly to the frame. These differing transfer methods resulted in analytical estimates with a 6% deviation for sample 53 and a 21% deviation for sample 52. These findings underscore the critical importance of force transfer mechanisms, alongside span configuration and connection type (fixed or pinned), in accurately defining load-bearing capacity through analytical models.
In Figure 7, the experimental setup conducted in ref. [41] is presented.

4.6. Experimental Database—Ravichandran (2009) [42]

The experimental setup conducted in ref. [42] is presented in Figure 8.
Table 10 shows the results from the work of Ravichandran (2009) [42]. The frame is loaded cyclically and is filled with aerated concrete wall elements. All gaps between the frame and the filling elements are filled with mortar.
During the experiment, cracking in the masonry developed gradually along the mortar joints, culminating in the formation of a compression diagonal crack. However, the ultimate failure was not caused by the masonry itself but rather by the plasticization of the steel frame. As shown in Table 10, the analytical expression tends to underestimate the system’s load-bearing capacity. The minimum load value is governed by the shear resistance, Vrs. Upon evaluating the load-bearing values, it is evident that the diagonal and shear capacities substantially exceed the frame’s load-bearing capacity. This discrepancy may be attributed to the large height-to-length ratio of the frame, which influences the diagonal length and, consequently, reduces the frame’s load capacity.

4.7. Experimental Database—Tasnimi and Mohebkhah (2011) [46]

In the study conducted by Tasnimi and Mohebkhah (2011) [46], a steel frame filled with solid brick wall elements (Figure 9) was subjected to cyclical loading. Table 11 shows the results, comparing analytical calculations with experimental outcomes. A reasonably good correlation was observed, with a deviation of 17%. The failure mechanism of this sample involved the cracking of the wall element at the corners, occurring after the compressive strength of the material was exceeded, followed by the formation of a compressive diagonal.

5. Comparison of Analytical Expressions and Experimental Data

The main purpose of this section is to examine the ratio of experimental to analytical results (presented as a percentage) to pinpoint deviations from established norms and assess whether the analytical expressions overestimate or underestimate load-bearing capacity. A ratio below 1.0 indicates underestimation, while a ratio above 1.0 suggests overestimation. However, this metric alone does not fully reflect the structural reliability; rather, it evaluates the analytical expression’s accuracy. The analysis offers a general comparison of experimental and analytical outcomes but acknowledges limitations, as analytical models exclude the load-bearing effects of vertical longitudinal forces on columns. Results from experiments involving non-cyclic and vertical loads should, therefore, be interpreted cautiously. The following sections will present the results and examine the influence of key parameters, including the type of infill element, the compressive strength of the infill, and the ratio of frame height to width, on the system’s load capacity. These parameters are considered because they are commonly included in load calculation equations and have a direct impact on the results. The total load-bearing capacity of the system is defined as the sum of the load-bearing capacities of the frame and the infill wall, as recommended in the studies by Saneinejad (1990) [54] and Tasnimi and Mohebkhah (2011) [46].
V u k = V F R + V i n f , m i n ,
where the following is true:
  • Vuk—the total load-bearing capacity of the system;
  • VFR—frame bearing capacity;
  • Vinf,min—the minimum load-bearing capacity value of the infill masonry, depending on the norm.
The minimum value signifies the infill wall’s load-bearing capacity, reflecting early-stage diagonal cracking rather than failure. The frame’s load-bearing capacity is calculated using Salmon and Johnson’s (1996) [55] expression:
V F R = 4 M p / h ,
where the following is true:
  • VFR—frame bearing capacity;
  • Mpl—plastic flexural resistance of column;
  • h—the height of the column.
Based on the expression for the load-bearing capacity of the frame, it is evident that the load-bearing capacity depends on both the geometry of the frame and the material properties of the columns, as consistently stated in the literature. This minimizes data gaps, which are a common limitation in expressions used to calculate the load-bearing capacity of masonry. The load-bearing capacity of the frame, as defined by the expression, depends on its geometry and the material properties of the columns, minimizing data gaps, unlike expressions for masonry load-bearing capacity. Previous studies do not define an “acceptable” discrepancy between analytical and experimental results. In this paper, a deviation of 10% from experimental results was considered acceptable for comparing analytical expressions from various standards.

5.1. Calculation of the Load-Bearing Capacity of the Frame with Infill Elements According to FEMA 306 [50]

FEMA 306 [50] identifies five types of failure for calculating the load-bearing capacity of infill walls, with the final type accounting for the impact of reinforcement. However, since the database has been limited to experiments involving infill walls without reinforcement, the influence of reinforcement will not be considered in the calculations.
Sliding-Shear failure.
V s l i d e i = L i n f t i n f E m θ 2 μ
The shear failure is determined based on Mohr–Coulomb’s failure criteria.
Due to not knowing the parameter θ, which is associated with inter-story displacement and is not reported in all studies, the Mohr–Coulomb failure criteria were applied using the following formula to calculate shear resistance along the mortar joint:
V s l i d e i = τ 0 + σ y t a n ϕ L i n f t i n f
In case of insufficient data, parameter τ0 can be defined as follows:
τ 0 = f m e , 90 / 20
The angle of friction (tan ϕ ) actually represents the coefficient of friction μ (it can be taken as 0.4).
Compression failure of the equivalent diagonal strut.
V c = a t i n f f m c o s θ
Compressive capacity is defined as the shear force or horizontal component of the action of the equivalent diagonal. The parameter α denotes the width of the equivalent diagonal.
Diagonal tension failure of the panel.
V c r = 2 2 · σ c r L i n f h i n f + h i n f L i n f
Diagonal tensile cracking is determined following the recommendations of Saneinejad and Hobbs (1995) [56]. This term is also employed in FEMA 306 for the calculation of diagonal cracking.
General shear failure of the panel
V m f = 0.3 V m i ,
where the following is true:
  • Vislide—initial sliding-shear capacity of the infill;
  • Vc—the shear force (horizontal component of the diagonal strut capacity);
  • Vcr—the cracking shear in the infill;
  • Vmf—final shear capacity as a result of cyclic loading effects;
  • Vmi—available initial shear capacity that is consumed during the first half-cyclic (monotonic) loading;
  • Linf—length of infill panel;
  • tinf—thickness of infill panel and equivalent strut;
  • hinf—height of infill panel;
  • a—equivalent strut width;
  • t—infill thickness;
  • Em—Young’s modulus of the masonry;
  • θ—angle whose tangent is the infill height-to-length aspect ratio;
  • μ—coefficient of sliding friction along the bed joint;
  • ϕ —the angle of sliding friction of the masonry along a bed joint;
  • τ0—cohesive capacity of the mortar beds;
  • σcr—the cracking capacity of masonry;
  • f’me,90—expected strength of masonry in the horizontal direction, which may be set at 50% of the expected stacked prism strength f’m.
Shear failure of the infill masonry wall is based on the expressions of Paulay and Priestley (1991) [52].
Based on the calculated results, a comparison of load-bearing capacities determined using FEMA 306 [50] for the analyzed database was performed, emphasizing the percentage of experiments with deviations above or below 10%. Although a larger proportion of experiments exhibit deviations exceeding 10%, analysis of the complete database identifies several samples with deviations close to this threshold. The most critical concern arises in cases where deviations surpass 50%. Contributing factors to these discrepancies include the impact of vertical forces, boundary conditions between steel and infill masonry, and the initial stiffness of the system. The load-bearing capacity estimates vary depending on the type of wall element (hollow or solid). For hollow wall elements, analytical expressions tend to overestimate the system’s load-bearing capacity, whereas for solid wall elements, the estimates align more closely with the actual values. Regarding the relationship between the height-to-length ratio of the infill wall (H/L) and load-bearing capacity estimation, analytical expressions tend to overestimate the load-bearing capacity for frames with an H/L ratio of less than 1.0. In contrast, for frames with a H/L ratio greater than 1.0, these expressions typically underestimate the load-bearing capacity. The relationship between the vertical compressive strength of the infill elements and the load-bearing capacity obtained from analytical expressions was also analyzed. Infill elements were categorized as “strong” and “weak.” Regardless of their compressive strength, analytical expressions consistently overestimate the load-bearing capacity of the infill wall.

5.2. Calculation of Load-Bearing Capacity of Frames with Infill Masonry According to CSA S304-14 (R2019) [49]

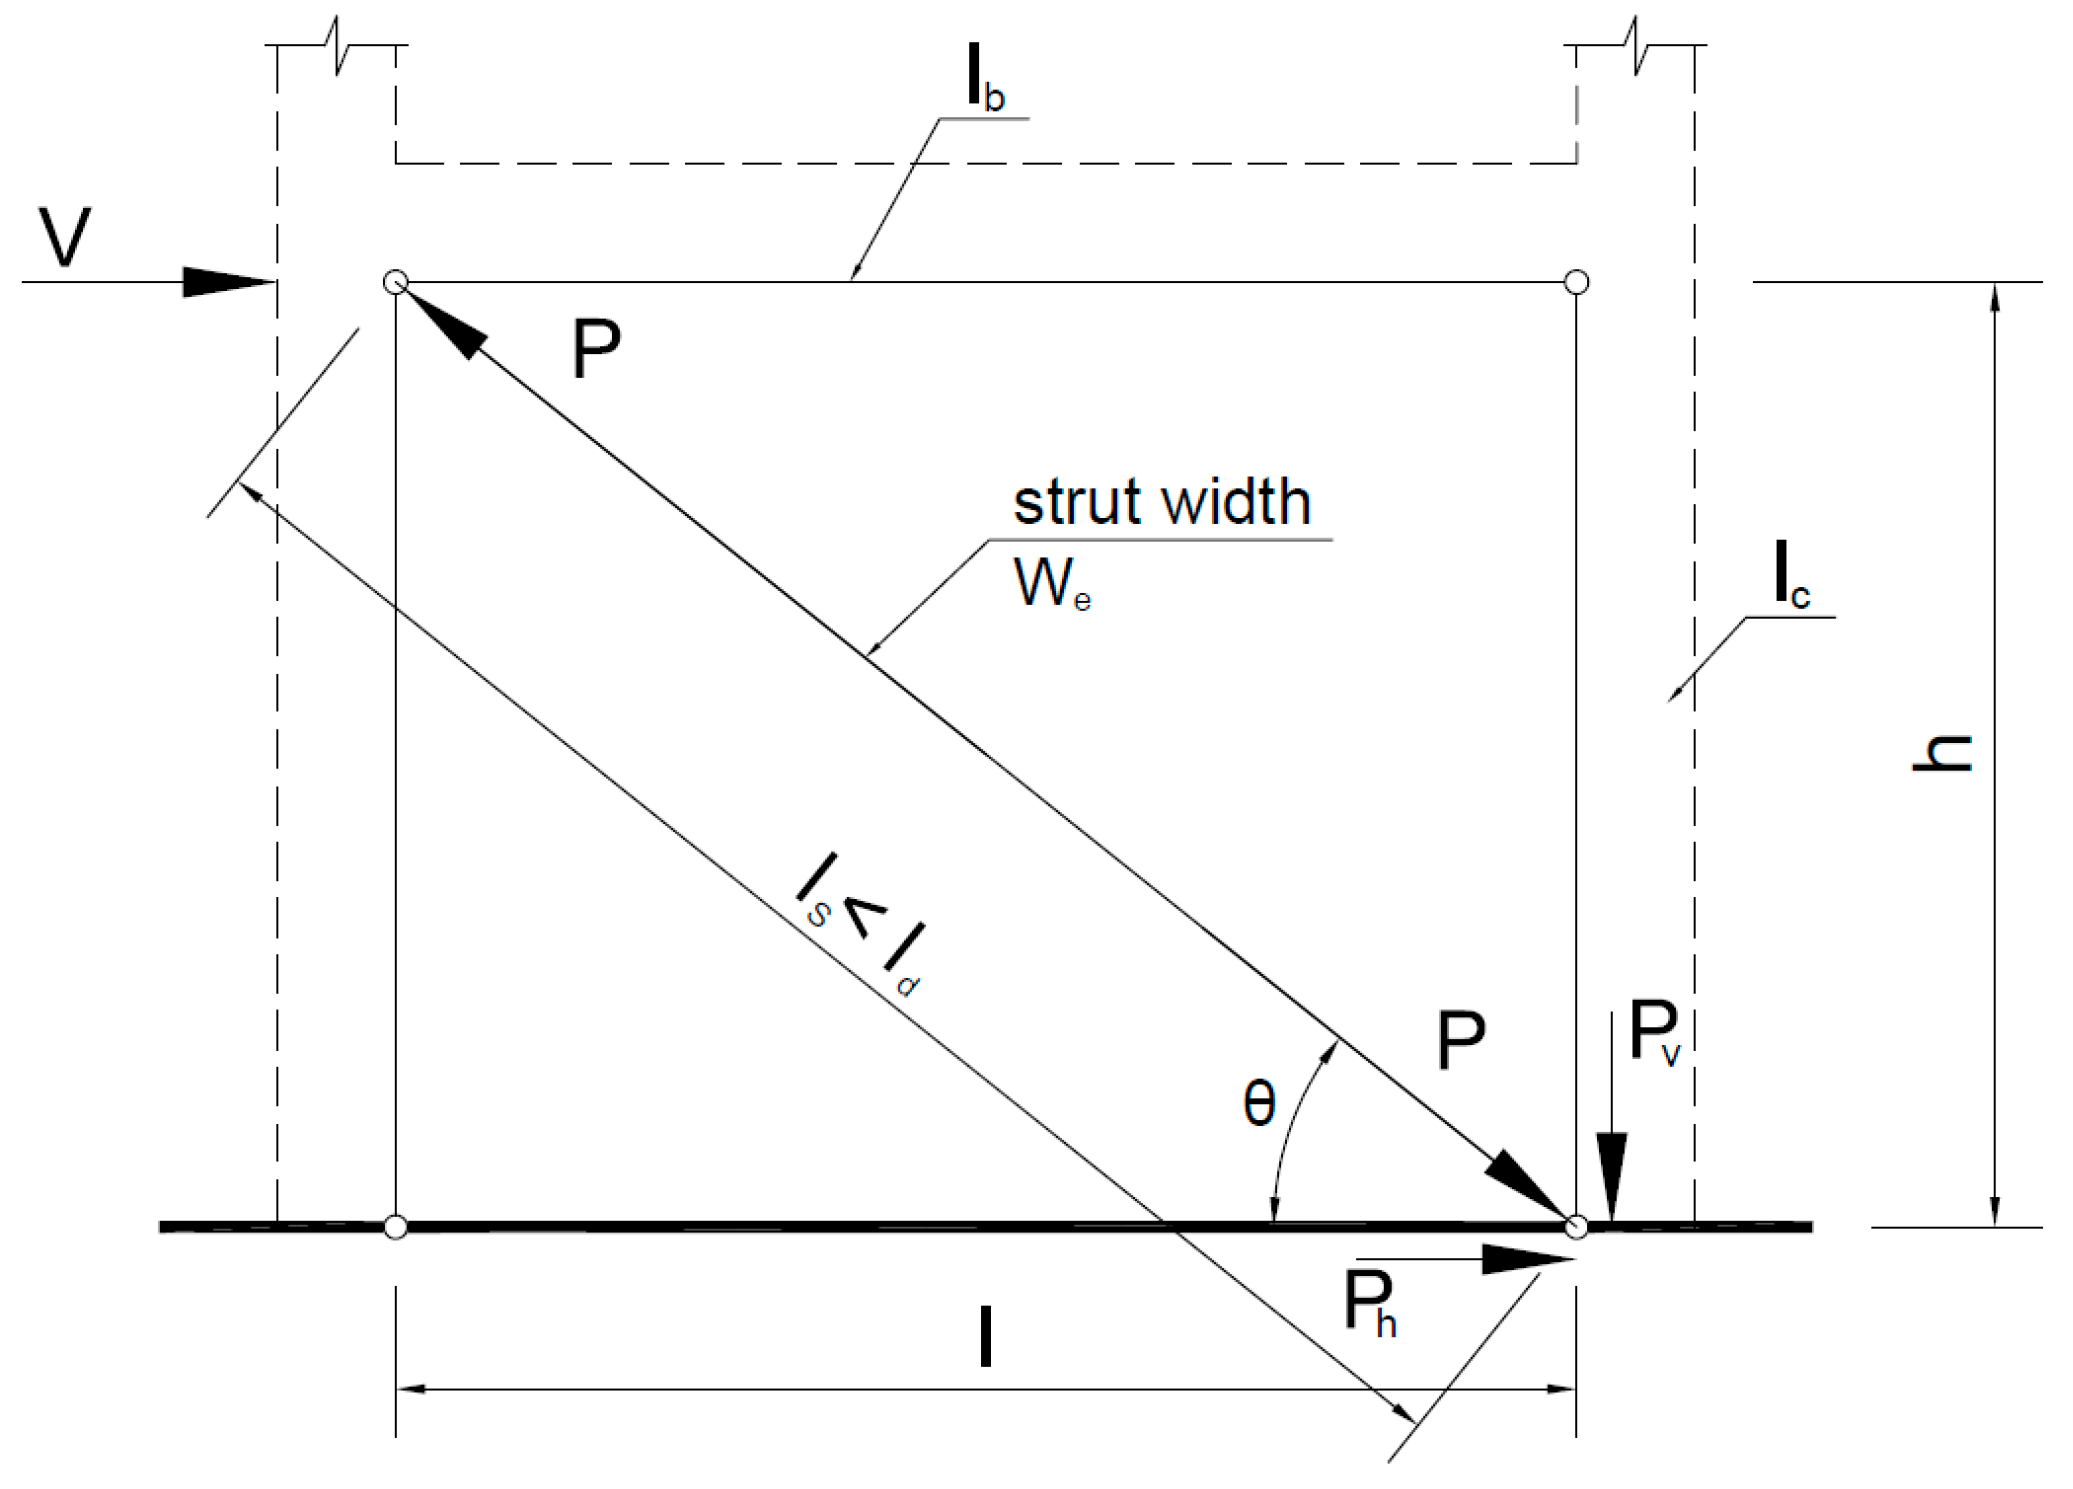
CSA 304-14 (R2019) [49] standard states that, for infill masonry design, the method of equivalent diagonal (Figure 10) should be used, with the main parameters being the diagonal width and the contact length between masonry and the frame.
The design of infill masonry should consider the following failure mechanisms.
Compressive failure of the equivalent diagonal strut.
P r = 0.85 χ ϕ m f m A e
In calculating the compressive failure of the equivalent diagonal, the CSA S304-14 [49] standard uniquely incorporates masonry slenderness as a criterion, addressing failure caused by bending. To prevent buckling, the compressive force in the equivalent diagonal must remain below the critical buckling force. Given the varying height-to-width ratios of masonry in the experimental dataset, the potential for buckling is explicitly considered in this analysis.
Diagonal tensile resistance.
V r = ϕ m v m b w d v + 0.25 P d γ g
Shear resistance of masonry.
V r s = 0.16 ϕ m f m A u c + ϕ m μ ( 0.9 V r s t a n ( θ ) ) ,
where the following is true:
  • Pr—the factored axial load resistance;
  • Vr—factored shear resistance;
  • Vm—shear strength attributed to the masonry;
  • Vrs—shear resistance of masonry;
  • Pd—axial compressive load on the section under consideration, based on 0.9 times dead load plus any factored axial load arising from bending in coupling beams where applicable;
  • χ—factor used to account for the direction of compressive stress in a masonry member relative to the direction used for the determination of f’m;
  • Фm—resistance factor for masonry;
  • f’m—compressive strength of masonry normal to the bed joint at 28 days;
  • d—distance from extreme compression fiber to centroid of tension reinforcement;
  • Ae—effective cross-sectional area of masonry;
  • Auc—uncracked area of the cross-section;
  • vm—factored shear resistance of masonry members provided by the masonry;
  • bw—overall web width, which does not include flanges or projections formed by intersecting walls when calculating factored shear resistance of walls;
  • dv—effective depth for shear calculations, taken as the greater of 0.9d or 0.72hb but need not be taken as less than 0.8lw for walls;
  • lw—wall length;
  • hb—overall height of a beam;
  • γg—factor to account for partially grouted walls or columns or ungrouted walls and columns when calculating the shear resistance;
  • μ—the friction coefficient;
  • θ—angle of diagonal strut measured from the horizontal.
The friction coefficient μ can be taken as 1.0.
The following conclusions were drawn after calculating the load-bearing capacity of masonry-infilled frames using CSA S304-14 [49].
A comparison of the estimated load-bearing capacity according to CSA S304-14 reveals that 27% of the samples exhibit deviations below 10%, while 56% show deviations exceeding 10%. Similar to the results obtained using FEMA 306 [49], some samples have values close to the 10% threshold. Additionally, CSA S304-14 indicates that, regardless of the type of infill element (hollow or solid), the load-bearing capacity determined using analytical expressions tends to be overestimated. The relationship between the height-to-length ratio of the frame and the load-bearing capacity obtained through analytical expressions was analyzed. For frames with smaller height-to-width ratios, the analytically determined load-bearing capacity was overestimated compared with experimentally measured values. Additionally, the influence of vertical compressive strength of infill elements, categorized as “strong” or “weak,” on the analytically derived load capacities was examined. Regardless of the compressive strength magnitude, analytical expressions consistently overestimated the load-bearing capacity (about 63% for “strong” infills and 69% for “weak” infills).

5.3. Calculation of the Load-Bearing Capacity of the Frame with Infill Masonry According to Paulay and Priestley (1991) [52]

Paulay and Priestley (1991) also represent the infill wall using the equivalent diagonal model. However, unlike the diagonal width defined in FEMA 306 [50] and CSA S304-14 [49], Paulay and Priestley (1991) defined the equivalent diagonal width in analytical terms as 25% of the diagonal length. The following failure modes are defined according to work conducted by Paulay and Priestley [52].
Compression on the failure of a diagonal strut.
R c = 2 3 z t f m s e c θ
The parameter z represents the contact length between the wall and the column.
Shear resistance of masonry.
V s = f v 0 t w L w 1 μ h L ,
where the following is true:
  • Rc—the diagonal compression failure force;
  • z—vertical length between panel and column;
  • t—infill thickness;
  • f’m—compression strength of the masonry;
  • θ—the angle between the diagonal strut and the horizontal;
  • Vs—shear resistance of the masonry infill panel
  • fv0—design shear strength of masonry;
  • tw—thickness of web of a flanged wall;
  • Lw—length of the infill masonry wall (between the columns)
  • h—overall thickness of member;
  • L—interaxis length (between the columns axis)
  • μ—the friction coefficient.
This failure mode of the infill wall is initiated by the formation of plastic hinges at the mid-height of the column. Subsequently, as shear forces are fully transferred through the wall, ultimate failure occurs. The coefficient of friction (μ) is assumed to be 0.3.
The following conclusions were derived after completing the calculation of the load-bearing capacity of masonry-infilled frames.
The deviations in load-bearing capacity calculated using analytical expressions, compared with experimentally obtained values, were analyzed according to the method proposed by Paulay and Priestley [52]. The results indicate that 22% of the samples exhibited deviations of less than 10%, a percentage comparable to that observed with FEMA 306 [50], which stands at 24%. For hollow infill elements, the proportion of tested samples with overestimated load-bearing capacity was significantly higher, at 74%. In contrast, for solid infill elements, this proportion was considerably lower, at 54%.
With respect to the height-to-length ratio of the infill wall and its relationship to the estimated load-bearing capacity of the frame, the results indicate that frames with an H/L ratio of less than 1.0 tend to have their load capacity overestimated by analytical methods. Conversely, frames with a H/L ratio greater than 1.0 are typically underestimated. When estimating the load-bearing capacity of masonry-infilled frames based on the vertical compressive strength of the infill elements, the elements were categorized as “strong” and “weak” infills. Similar to previous analytical expressions, the load-bearing capacity was overestimated in both cases, with overestimations occurring in approximately 65% of “strong” infills and 71% of “weak” infills.

5.4. Calculation of the Load-Bearing Capacity of the Masonry-Infilled Frame According to EN 1996-1 and EN 1998-1 [48,51]

The analysis of frame structures incorporating infill masonry, as outlined in EN 1996 and EN 1998, is contingent upon the degree of interaction between the infill masonry and the frame, specifically their interconnectedness. When the frame and the load-bearing masonry are integrally connected to function as a composite unit, the structural analysis is conducted in accordance with the principles governing composite structures. Conversely, if the frame and the load-bearing masonry are fully separated, the analysis is performed assuming the frame behaves as a bare steel structure. An intermediate scenario arises when the infill masonry is in contact with the steel frame but lacks a mechanical connection; this configuration necessitates a distinct approach to structural modeling and analysis.
The design value of the shear resistance:
V R d = f v t w L w
From the above expression it can be concluded that the horizontal force is actually equal to the shear strength of the masonry estimated from the shear strength of the horizontal joint. The masonry shear strength can be characterized as shear strength at zero compressive loads (fvk0).
Shear force in the columns:
V c , E d = γ R d · 2 M c , R d / l c ,
where the following is true:
  • VRd—the design value of the shear resistance;
  • Vc,Ed—the shear force in the columns;
  • Mc,Rd—the flexural capacity of the column;
  • fv—is the design shear strength of masonry;
  • tw—is the thickness of the wall;
  • Lw—is the length of the wall;
  • lc—contact length, should be assumed to be equal to the full vertical width of the diagonal strut of the infill;
  • γRd—is the factor accounting for possible overstrength due to steel strain hardening.
The shear force in the aforementioned expression was determined following the principles of bearing capacity calculation, specifically by considering the equilibrium of the column under the moments generated at both ends of the tangential length, lc.
From the aforementioned expressions, it can be concluded that the initial calculation necessitates a shear resistance value. However, since the shear resistance value is not provided in the articles utilized for the considered database, the calculation in accordance with EN 1998 [51] was conducted exclusively for articles where this parameter was explicitly specified. As per the guidelines of EN 1998, the contact length is assumed to be equal to the total vertical width of the diagonal strut of the infill wall.
The assessment of the system based on EN 1996-1 [48] and EN 1998-1 [51] cannot be considered fully representative when compared to other standards and studies presented primarily due to the limited availability of data. This scarcity of data, particularly experimental results, arises from the absence of a crucial input parameter: shear resistance. A comparison of the load-bearing capacity assessment of frames with infill masonry, as per EN 1998, reveals a percentage of samples with deviations below 10%, accounting for 35%, and a percentage of 65% for deviations above 10%. The evaluation of load capacity based on the height-to-length (H/L) ratio of the frame indicates that, for both categories of H/L ratios, the analytical expressions tend to overestimate the system’s load capacity. However, the data corresponding to frames with an H/L ratio greater than 1.0 are not statistically significant, as they are derived from only a single sample with such geometric characteristics. The assessment of the dependence of the vertical compressive strength of the infill element in relation to the load capacity according to EN 1998-1 reveals that, despite the limited number of samples, the analytical expressions consistently overestimated the load-bearing capacity. This overestimation was approximately 80% for “strong” infills and 92% for “weak” infills.

5.5. Calculation of the Load-Bearing Capacity of the Frame with Infill Masonry According to Liauw and Kwan (1983) [53]

Liauw and Kwan [53] considered the minimum shear resistance value among various types of fractures as the governing factor. Relations are presented for both single-story and multi-story infilled frames. According to their study, four distinct failure modes were identified, with the load-bearing capacity analyzed in relation to the height-to-length ratio of the masonry for each case (single- or multi-story). In the following, the equations for each of the four failure modes for single-story infilled frames will be presented. Liauw and Kwan define the shear force values for cases where the height of the masonry exceeds or is less than its length. The failure modes described by Liauw and Kwan are as follows:
Mode 1—corner crushing with failure in columns and infill/beam connections.
H u , 1 = σ c t h · 2 M p j + M p c σ c t h 2 + s l h 2 , w h e n   l > h
H u , 1 = σ c t h · 2 M p j + M p c σ c t h 2 + s l / 2 , w h e n   l < h
Mode 2—corner crushing with failure in beams and infill/column connections.
H u , 2 = 1 tan θ σ c t h · 2 M p j + M p b σ c t h 2 + s h / 2 , w h e n   l > h
H u , 2 = 1 tan θ σ c t h · 2 M p j + M p b σ c t h 2 + s ( h l / 2 ) ,   w h e n   l < h
Mode 3—diagonal crushing with failure in infill/beam connection.
H u , 3 = 4 M p j h + σ c t h 6 + s ( h l / 2 ) ,   w h e n   l > h
H u , 3 = 4 M p j h + σ c t h 6 + s h / 2 ,   w h e n   l < h
Mode 4—diagonal crushing with failure in infill/column connections.
H u , 4 = 4 M p j h + σ c t h 6 tan 2 θ + s h / 2 tan θ ,   w h e n   l > h ,
H u , 4 = 4 M p j h + σ c t h 6 tan 2 θ + s h l / 2 / tan θ ,   w h e n   l < h
where the following is true:
  • Hu—collapse shear;
  • Mpj—plastic moment of the (the smallest value of Mpc and Mpb);
  • Mpc—plastic moment of the column;
  • Mpb—plastic moment of the beam;
  • σc—crushing stress of the panel material;
  • s—shear strength of interface connection (force per unit length);
  • t—thickness of the infill wall;
  • h—story height;
  • l—span of the infilled frame;
  • θ—angle between the diagonal of the infilled panel and the horizontal.
Corner crushing is independent of the height-to-width ratio, and in both cases, the same expressions are utilized to describe this failure mode.
The calculation of load-bearing capacity, according to Liauw and Kwan [53], compared with the methods proposed by other authors, exhibits the highest percentage of discrepancies, with 93% of the capacities exceeding a 10% deviation threshold. However, other estimates of bearing capacity coincide with other analytical expressions where the bearing capacity is overestimated. For frames with smaller height-to-width ratios, the analytically determined load-bearing capacity was found to be overestimated when compared with experimentally measured values. What distinguishes Liauw and Kwan’s approach most notably is their definition of load-bearing capacity as a function of the H/L ratio, as reflected in their equations. However, ultimately, both cases result in an overestimation of load-bearing capacity compared with the experimental results. Additionally, the impact of the vertical compressive strength of infill elements, classified as either “strong” or “weak,” on the analytically derived load capacities was analyzed. Regardless of the compressive strength value, the analytical expressions consistently overestimated the load-bearing capacity, with deviations of approximately 78% for “strong” infills and 71% for “weak” infills.

5.6. Conclusions on the Analytical Expressions and Experimental Data Comparison

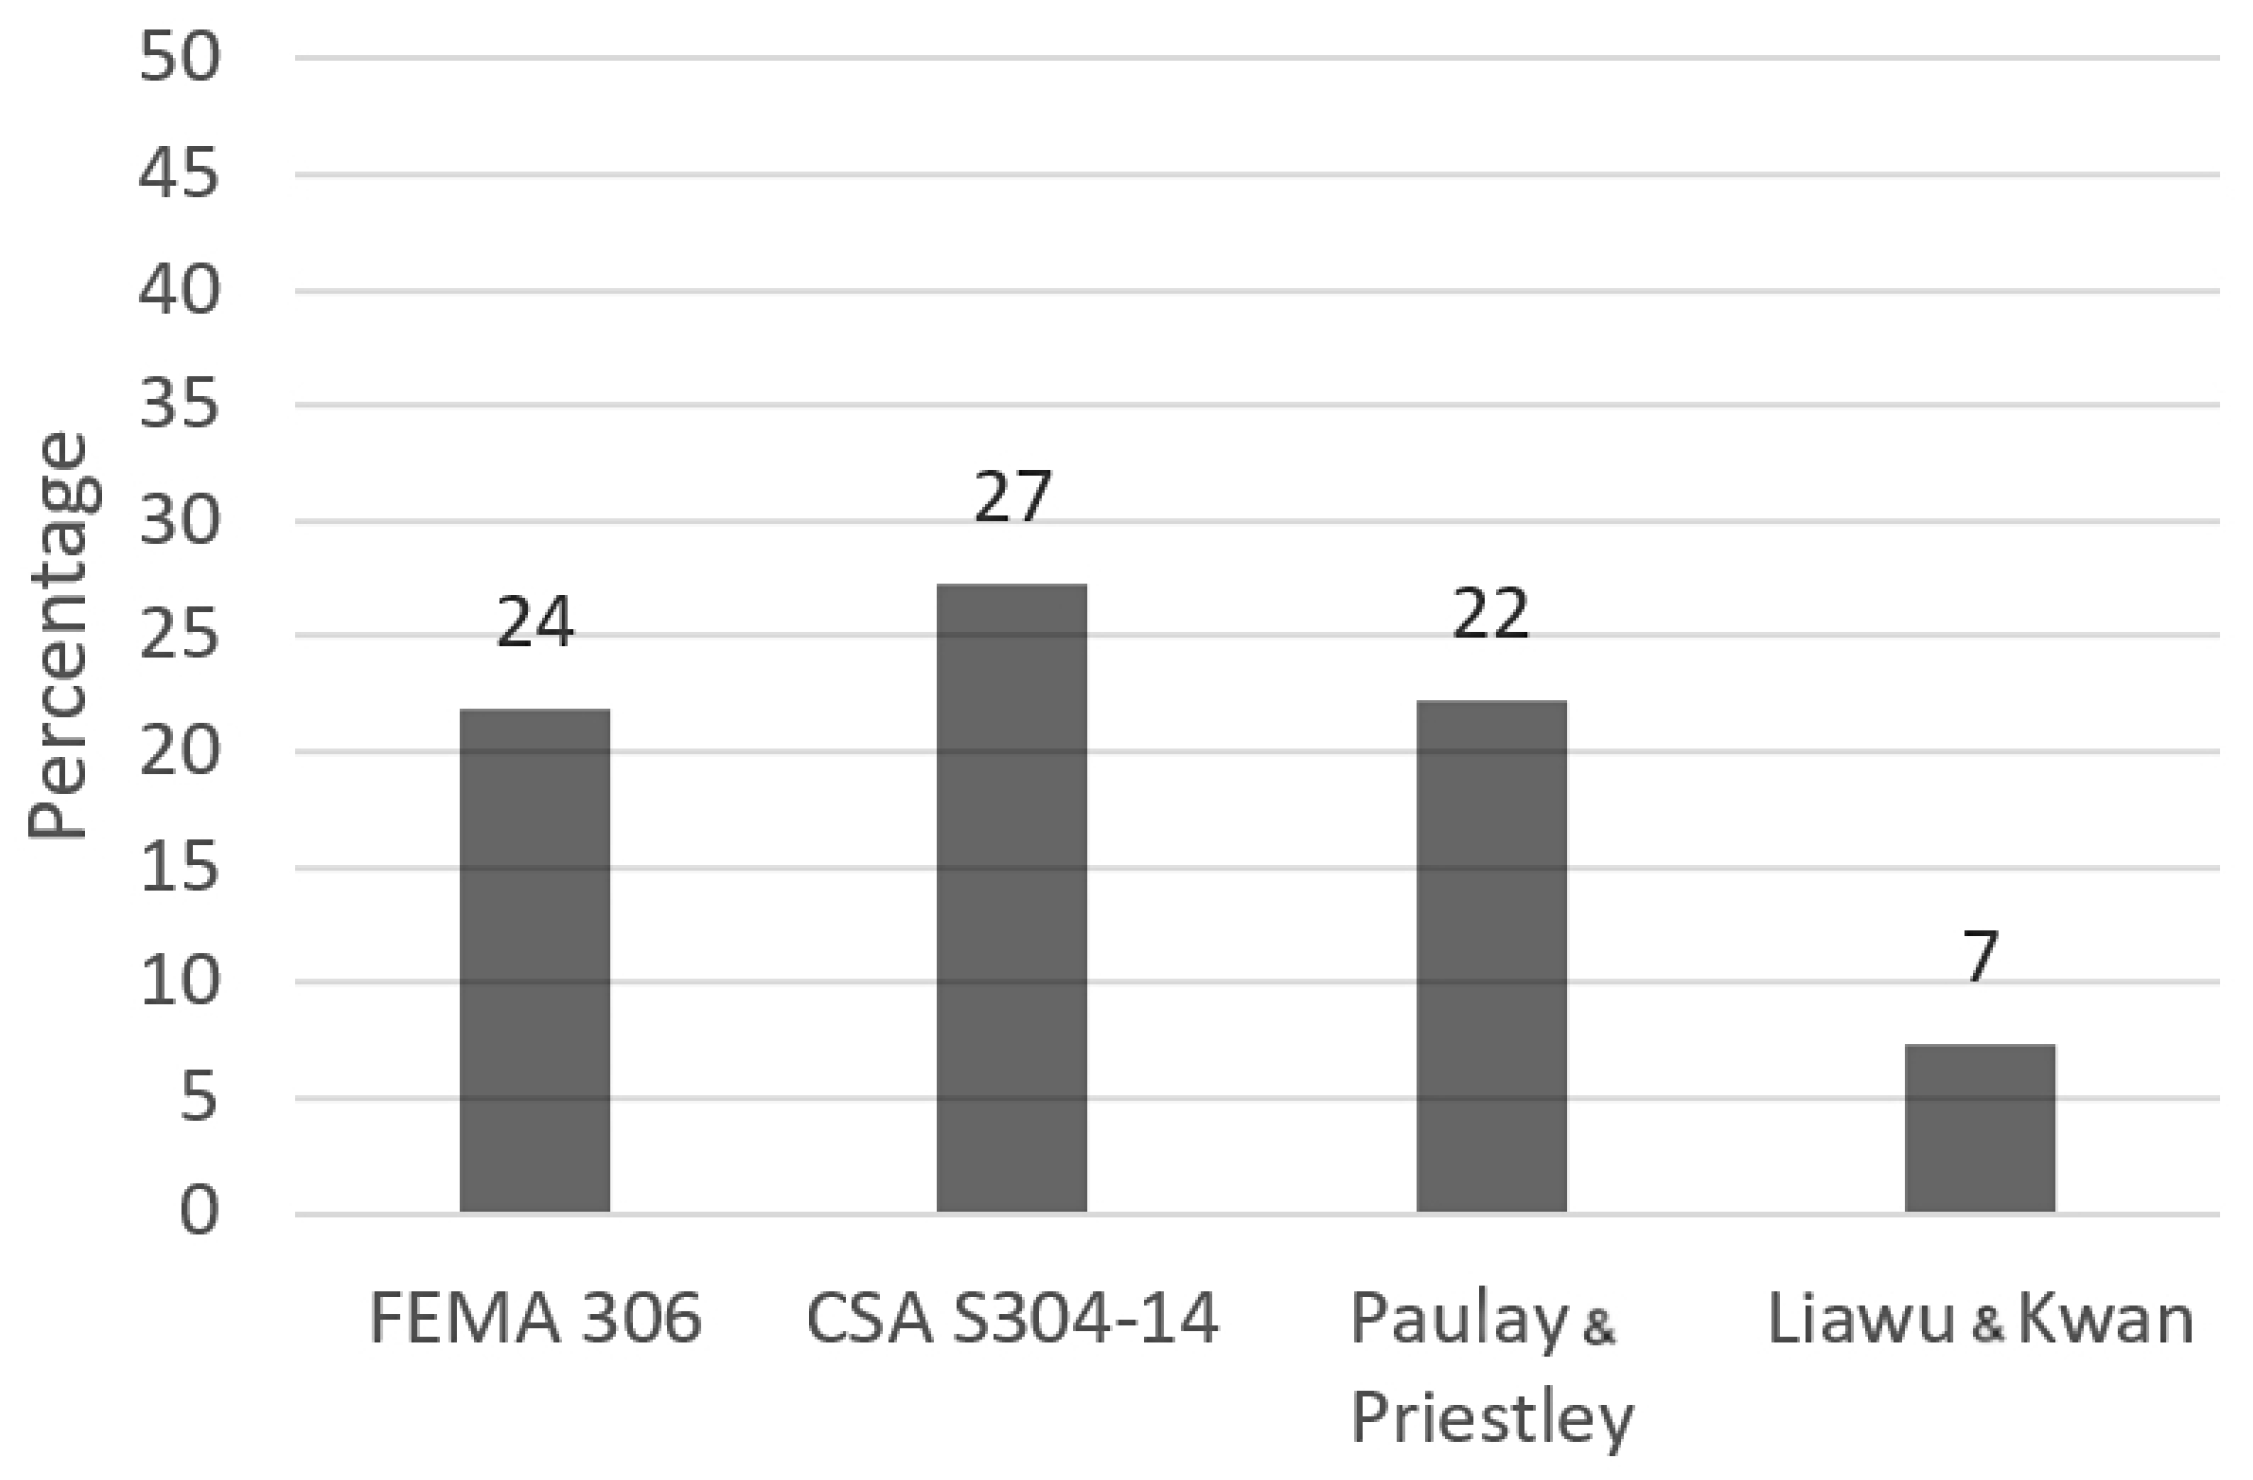
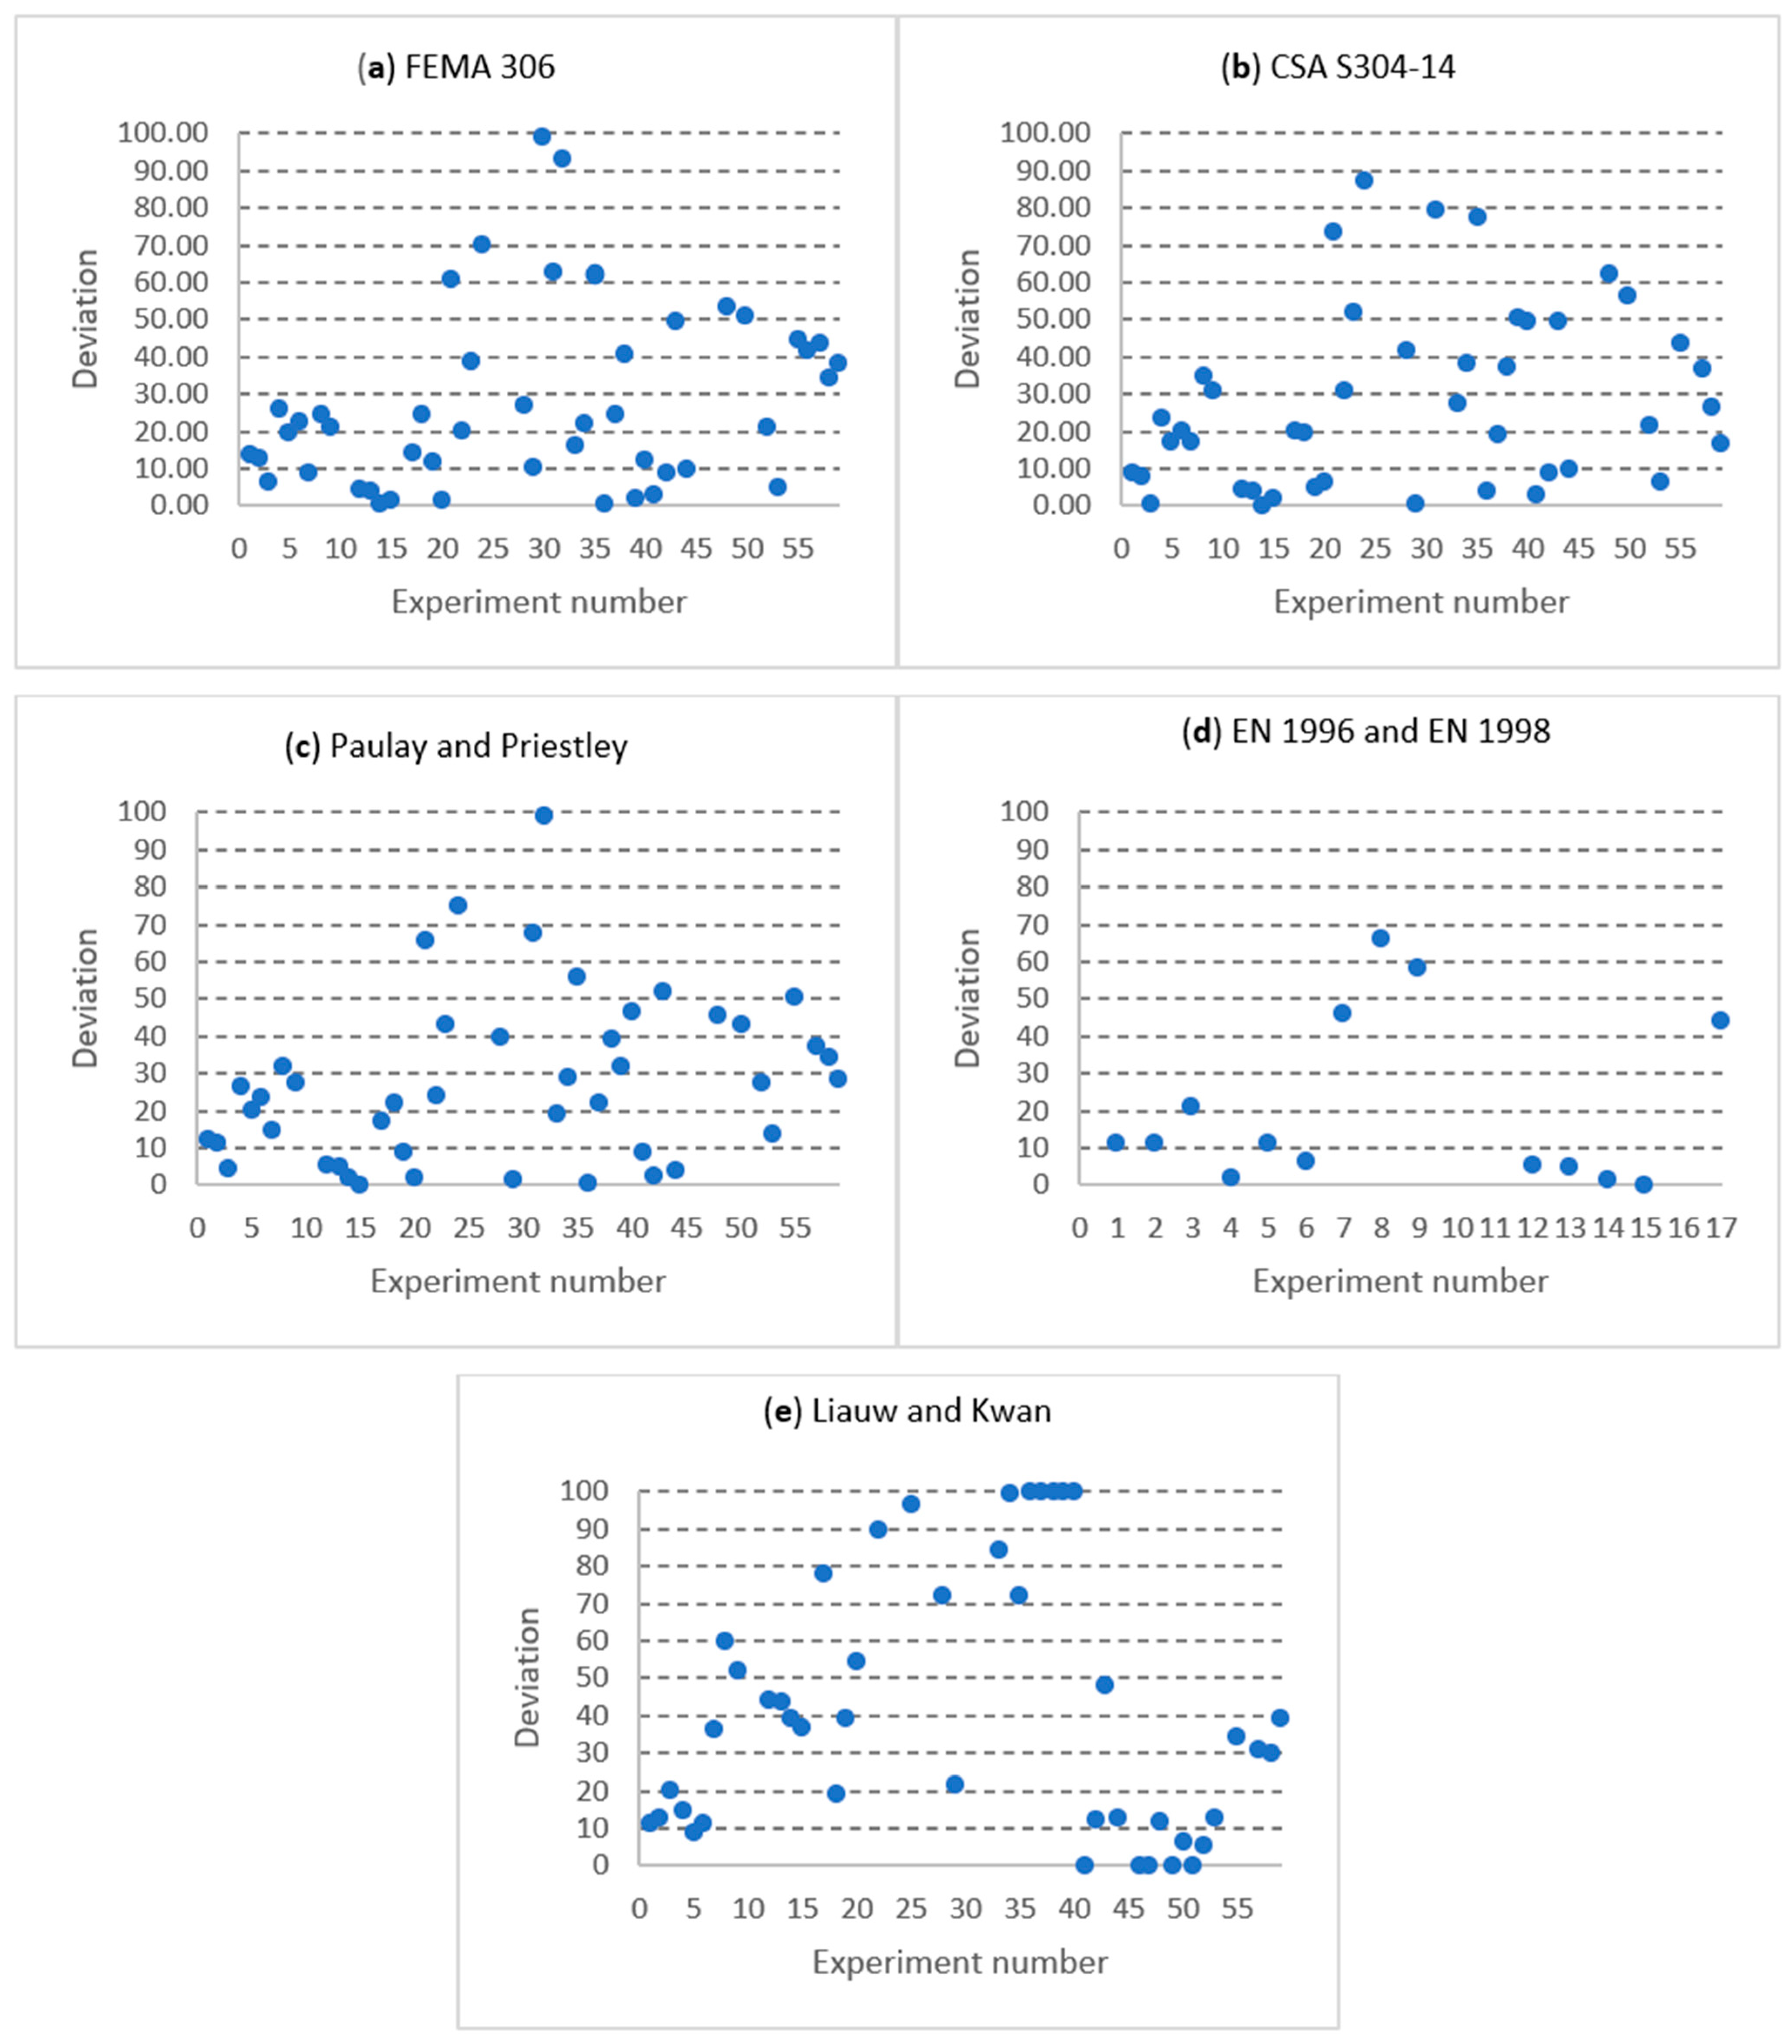
To effectively illustrate the comparison between various analytical expressions, a histogram is presented in Figure 11, depicting the percentages of cases where the deviation is less than 10%. Based on this analysis, CSA S304-14 [49] demonstrates the highest percentage of experiments with deviations below this threshold. However, despite showing a considerable proportion of minor deviations, EN 1996 [48] and EN 1998 [51] were excluded from the analysis due to the limited number of experiments included in their evaluation.
Based on this analysis, the CSA S304-14 [49] standard yields the highest percentage of experiments with deviations below 10%, accounting for 27% of the total tested samples. In contrast, EN 1996 [48] and EN 1998 [51], although showing a significant proportion of small deviations, were deemed less relevant due to the limited number of experiments considered. Following CSA S304-14 [49], FEMA 306 [50] produces results comparable to those of Paulay and Priestley’s [52] expressions. The lowest percentage is observed in Liauw and Kwan’s [53] approach, with only 7% of experiments exhibiting deviations below 10%.
A comprehensive analysis of the comparative outcomes illustrated in Figure 11 is further illustrated in Figure 12. This figure provides calculations for each experiment performed according to the referenced standards and displayed across individual deviation ranges on a scale from 1% to 100%.
This approach graphically illustrates the extent to which analytical results vary within the boundaries defined by the same expressions and highlights the trends of deviations within specific ranges. Experiments with deviations exceeding 100% were excluded from the charts. In the ordinate axis of the charts, the percentage of deviations is displayed, while the abscissa represents the sequence number of experiments as listed in Table 1.

6. Conclusions

This paper presented a database of steel frames with infill masonry aimed at estimating the under horizontal loads simulating seismic conditions. Using input data from all tested frames with infill walls, an attempt was made to analytically determine the load-bearing capacity based on the formula from Table 4 and compare it to experimentally obtained results.
The total load-bearing capacity was calculated as the sum of the frame’s and the infill wall’s load-bearing capacities. These values were then compared to standards and studies from various researchers found in the literature to assess their accuracy and reliability. Based on the obtained results, the following conclusions can be drawn:
  • The equivalent diagonal model, utilized in all analytical expressions, can provide highly accurate estimations of load-bearing capacities that closely align with the experimental results. However, this accuracy is significantly influenced by the configuration of both the frame and the infill wall, as well as their interaction and interconnection. It is important to note that the behavior observed before failure cannot be captured by the equivalent diagonal model, as the interaction between the frame and the infill wall exhibits distinctly nonlinear characteristics, which the model does not account for.
  • The type of infill element, whether hollow or solid, as well as the size of the vertical compressive strength, did not significantly impact the obtained results. Regardless of the type of infill element, the analytical expressions consistently overestimated the load-bearing capacity.
  • The influence of longitudinal force enhances the load-bearing capacity of the frame, with the load-bearing capacity increasing as the longitudinal force increases. In the presence of longitudinal force, analytical expressions tend to be conservative, providing significantly lower load-bearing values compared with experimental results, which ensures a safety margin.
  • The manner in which the force is transferred to the frame—whether directly or indirectly—significantly influences the analytical results. In the equivalent diagonal model, the force is applied directly to the node, the column and the beam, and experiments with this type of load application yield more accurate results compared with those where the load is applied indirectly.
  • Steel frames with an infill wall, where the failure mode occurred diagonally along the compression diagonal and ultimately led to corner crushing, show better agreement with analytical expressions. This is in contrast to cases where failure occurs through shear failure in the mortar joints, which tend to exhibit discrepancies with the analytical predictions.
  • The database can be utilized to develop numerical models, which can subsequently serve as the foundation for probabilistic methods used in conducting reliability assessments.

Author Contributions

Conceptualization, M.H.-N. and N.A.; methodology, D.Š.; software, D.Š.; validation, C.B., N.A. and M.H.-N.; formal analysis, E.I.; investigation, D.Š.; writing—original draft preparation, C.B.; writing—review and editing, B.B.; visualization, D.R.; supervision, M.H.-N., N.A. and D.R. All authors have read and agreed to the published version of the manuscript.

Funding

This research received no external funding references.

Data Availability Statement

The original contributions presented in this study are included in the article. Further inquiries can be directed to the corresponding authors.

Conflicts of Interest

The authors declare no conflict of interest.

References

  1. Cheng, C.; Kawaguchi, K.I. A preliminary study on the response of steel structures using surveillance camera image with vision-based method during the Great East Japan Earthquake. Measurement 2015, 62, 142–148. [Google Scholar] [CrossRef]
  2. Tremblay, R.; Filiatrault, A.; Timler, P.; Bruneau, M. Performance of steel structures during the 1994 Northridge earthquake. Can. J. Civ. Eng. 1995, 22, 338–360. [Google Scholar] [CrossRef]
  3. Miller, D.K. Lessons learned from the Northridge earthquake. Eng. Struct. 1998, 20, 249–260. [Google Scholar] [CrossRef]
  4. Mahin, S.A. Lessons from damage to steel buildings during the Northridge earthquake. Eng. Struct. 1998, 20, 261–270. [Google Scholar] [CrossRef]
  5. Okazaki, T.; Lignos, D.G.; Midorikawa, M.; Ricles, J.M.; Love, J. Damage to steel buildings observed after the 2011 Tohoku-Oki earthquake. Earthq. Spectra 2013, 29 (Suppl. 1), 219–243. [Google Scholar] [CrossRef]
  6. De Risi, M.T.; Del Gaudio, C.; Ricci, P.; Verderame, G.M. In-plane behaviour and damage assessment of masonry infills with hollow clay bricks in RC frames. Eng. Struct. 2018, 168, 257–275. [Google Scholar] [CrossRef]
  7. Furtado, A.; Rodrigues, H.; Arêde, A.; Varum, H. Out-of-plane behavior of masonry infilled RC frames based on the experimental tests available: A systematic review. Constr. Build. Mater. 2018, 168, 831–848. [Google Scholar] [CrossRef]
  8. Dolsek, M.; Fajfar, P. The effect of masonry infills on the seismic response of a four-storey reinforced concrete frame- a deterministic assessment. Eng. Struct. 2008, 30, 1991–2001. [Google Scholar] [CrossRef]
  9. Dilmac, H.; Ulutas, H.; Tekeli, H.; Demir, F. The investigation of seismic performance of existing RC buildings with and without infill walls. Comput. Concr. 2018, 22, 439–447. [Google Scholar] [CrossRef]
  10. Timurağaoğlu, M.Ö.; Doğangün, A.; Livaoğlu, R. Comparison and assessment of material models for simulation of infilled RC frames under lateral loads. Građevinar 2019, 71, 45–56. [Google Scholar] [CrossRef]
  11. Radić, I.; Markulak, D.; Sigmund, V. Controlled seismic behaviour of masonry-infilled steel frames. Građevinar 2016, 68, 883–893. [Google Scholar] [CrossRef]
  12. Cetisli, F. Effect of openings on infilled frame stiffness. Građevinar 2015, 67, 787–798. [Google Scholar] [CrossRef]
  13. Hak, S.; Morandi, P.; Magenes, G. Evaluation of infill strut properties based on in-plane cyclictests. Građevinar 2013, 65, 509–522. [Google Scholar] [CrossRef]
  14. Shendkar, M.R.; Kontoni, D.P.N.; Işık, E.; Mandal, S.; Maiti, P.R.; Harirchian, E. Influence of Masonry Infill on Seismic Design Factors of Reinforced-Concrete Buildings. Shock Vib. 2022, 2022, 1–15. [Google Scholar] [CrossRef]
  15. Athanasiou, A.; Dakour, M.; Pejmanfar, S.; Tirca, L.; Stathopoulos, T. Multihazard performance-based assessment framework for multistory steel buildings. J. Struct. Eng. 2022, 148, 04022054. [Google Scholar] [CrossRef]
  16. Tapia-Hernández, E.; Geneş, M.C.; Gülkan, P. Damage assessment and seismic response of steel buildings during the Kahramanmaraş, Turkey earthquakes of February 6, 2023. Earthq. Spectra 2022, 4, 102–122. [Google Scholar] [CrossRef]
  17. Georgiev, T. Field observations and assessment of performance level of steel structures after the Kahramanmaras Earthquake Sequence of 2023. In Proceedings of the International Conference on the Behaviour of Steel Structures in Seismic Areas; Springer Nature: Cham, Switzerland, 2024; pp. 633–645. [Google Scholar]
  18. Qiu, C.; Zhang, A.; Jiang, T.; Du, X. Seismic performance analysis of multi-story steel frames equipped with FeSMA BRBs. Soil Dyn. Earthq. Eng. 2022, 161, 107392. [Google Scholar] [CrossRef]
  19. Clifton, G.C.; Bruneau, M.; MacRae, G.; Leon, R.; Fussell, A. Multistorey steel framed building damage from the Christchurch earthquake series of 2010/2011. In Proceedings of the 7th International Conference on Behaviour of Steel Structures in Seismic Areas, Santiago, Chile, 9–11 January 2012. [Google Scholar]
  20. Clifton, C.; Bruneau, M.; MacRae, G.; Leon, R.; Fussell, A. Steel structures damage from the Christchurch earthquake series of 2010 and 2011. Bull. N. Z. Soc. Earthq. Eng. 2011, 44, 297–318. [Google Scholar] [CrossRef]
  21. Kadhum, A.K.; Abdul-Razzaq, K.S. Effect of seismic load on steel frame multistory building from economical point of view. In Proceedings of the AIP Conference Proceedings 2020, Baghdad, Iraq, 25–29 September 2019; Volume 2213. [Google Scholar]
  22. Zou, C.; Chen, Y. Study on Damage Law of Multistory and High-rise Steel Frame Structures under Strong Earthquake. In IOP Conference Series: Earth and Environmental Science; IOP Publishing: Bristol, UK, 2020; Volume 525, No. 1; p. 012116. [Google Scholar]
  23. Di Sarno, L.; Freddi, F.; D’Aniello, M.; Kwon, O.-S.; Wu, J.-R.; Gutiérrez-Urzúa, F.; Landolfo, R.; Park, J.; Palios, X.; Strepelias, E. Assessment of existing steel frames: Numerical study, pseudo-dynamic testing and influence of masonry infills. J. Constr. Steel Res. 2021, 185, 106873. [Google Scholar] [CrossRef]
  24. Shan, S.; Li, S.; Wang, S. Effect of infill walls on mechanisms of steel frames against progressive collapse. J. Constr. Steel Res. 2019, 162, 105720. [Google Scholar] [CrossRef]
  25. Hadzima-Nyarko, M.; Čolak, S.; Bulajić, B.Đ.; Ademović, N. Assessment of Selected Models for FRP-Retrofitted URM Walls under In-Plane Loads. Buildings 2021, 11, 559. [Google Scholar] [CrossRef]
  26. Chinese Standards. Design Guidance for FRP Strengthened Structures (Provisional); Ministry of Construction: Beijing, China, 2006.
  27. ACI 440.7R-10; Guide for the Design and Construction of Externally Bonded Fiber-Reinforced Polymer Systems for Strengthening Unreinforced Masonry Structures. American Concrete Institute Committee 440: Farmington Hills, MI, USA, 2010.
  28. De Luca, F.; Morciano, E.; Perrone, D.; Aiello, M.A. Masonry Infilled RC Frame Experimental Database. Proc. Ital. Concr. Days 2018, 10, 147–160. [Google Scholar] [CrossRef]
  29. Sun, H.; Burton, H.V.; Huang, H. Machine learning applications for building structural design and performance assessment: State-of-the-art review. J. Build. Eng. 2021, 33, 101816. [Google Scholar] [CrossRef]
  30. El-Dakhakhni, W.W.; Mohamed, E.; Ahmad, H.A. Three-Strut Model for Concrete Masonry-Infilled Steel Frames. J. Struct. Eng. 2003, 129, 177–185. [Google Scholar] [CrossRef]
  31. Mohebkhah, A.; Sarhosis, V. Discrete Element Modeling of Masonry-Infilled Frames, 1st ed.; Sarhosis, V., Bagi, K., Lemos, J.V., Milani, G., Eds.; Engineering Science Reference; IGI Global: Hershey, PA, USA, 2016; Chapter 9; pp. 200–234. [Google Scholar] [CrossRef]
  32. Asteris, P.G.; Antoniou, S.T.; Sophianopoulos, D.S.; Chrysostomou, C.Z. Mathematical Macromodeling of Infilled Frames: State of the Art. J. Struct. Eng. 2011, 137, 1508–1517. [Google Scholar] [CrossRef]
  33. Farshidnia, P. Behavior and analysis of masonry-infilled reinforced concrete frames subjected to lateral load. WIT Trans. Built Environ. 2009, 104, 13–23. [Google Scholar] [CrossRef]
  34. Markulak, D.; Radic, I.; Sigmund, V. Cyclic testing of single bay steel frames with various types of masonry infill. Eng. Struct. 2013, 51, 267–277. [Google Scholar] [CrossRef]
  35. Markulak, D.; Dokšanović, T.; Radić, I.; Zovkić, J. Behaviour of steel frames infilled with environmentally and structurally favourable masonry units. Eng. Struct. 2020, 204, 109909. [Google Scholar] [CrossRef]
  36. Liu, Y.; Soon, S. Experimental study of concrete masonry infills bounded by steel frames. Can. J. Civ. Eng. 2012, 39, 180–190. [Google Scholar] [CrossRef]
  37. Tsantilis, A.; Triantafillou, T. Innovative Seismic Isolation of Masonry Infills in Steel Frames using Cellular Materials at the Frame-Infill Interface. J. Earthq. Eng. 2018, 24, 1–18. [Google Scholar] [CrossRef]
  38. Liu, Y.; Manesh, P. Concrete masonry infiltrated steel frames subjected to combined in-plane lateral and axial loading—An experimental study. Eng. Struct. 2013, 52, 331–339. [Google Scholar] [CrossRef]
  39. Moghaddam, H.A. Lateral Load Behavior of Masonry Infilled Steel Frames with Repair and Retrofit. J. Struct. Eng. 2004, 130, 56–63. [Google Scholar] [CrossRef]
  40. Dawe, J.L.; Seah, C.K. Behaviour of masonry infilled steel frames. Can. J. Civ. Eng. 1989, 16, 865–876. [Google Scholar] [CrossRef]
  41. Emami, S.M.M.; Mohammadi, M. Multi-bay and pinned connection steel infilled frames; an experimental and numerical study. Eng. Struct. 2019, 188, 43–59. [Google Scholar] [CrossRef]
  42. Ravichandran, S.S. Design Provisions for Autoclaved Aerated Concrete (AAC) Infiltrated Steel Moment Frames. Ph.D. Thesis, The University of Texas at Austin, Austin, TX, USA, 2009; 342p. Available online: http://hdl.handle.net/2152/7529 (accessed on 4 December 2024).
  43. Mohammadi, M.; Akrami, V.; Mohammadi-Ghazi, R. Methods to Improve Infilled Frame Ductility. J. Struct. Eng. 2011, 137, 646–653. [Google Scholar] [CrossRef]
  44. Najarkolaie, K.; Mohammadi, M.; Fanaie, N. Realistic behavior of infilled steel frames in seismic events: Experimental and analytical study. Bull. Earthq. Eng. 2017, 15, 5365–5392. [Google Scholar] [CrossRef]
  45. Moghadam, H.; Mohammadi, M.; Ghaemian, M. Experimental and analytical investigation into crack strength determination of infiltrated steel frames. J. Constr. Steel Res. 2006, 62, 1341–1352. [Google Scholar] [CrossRef]
  46. Tasnimi, A.A.; Mohebkhah, A. Investigation on the behavior of brick-infilled steel frames with openings, experimental and analytical approaches. Eng. Struct. 2011, 33, 968–980. [Google Scholar] [CrossRef]
  47. Hashemi, S.J.; Razzaghi, J.; Moghadam, A.S.; Lourenço, P.B. Cyclic testing of steel frames infilled with concrete sandwich panels. Archit. Civ. Mech. Eng. 2018, 18, 557–572. [Google Scholar] [CrossRef]
  48. EN1996-1-1; Eurocode 6: Design of Masonry Structures-Part 1-1: General Rules for Reinforced and Unreinforced Masonry Structures. European Committee for Standardization: Brussels, Belgium, 1996.
  49. CSA S304-14; (R2019) Design of Masonry Structures. Canadian Standards Association: Toronto, ON, Canada, 2019.
  50. Federal Emergency Management Agency. FEMA 306 Evaluation of Earthquake Damaged Concrete and Masonry Wall Buildings; Basic Procedures Manual; Federal Emergency Management Agency: Washington, DC, USA, 1998.
  51. Eurocode 8: Design of Structures for Earthquake Resistance–Part 1: General Rules, Seismic Actions and Rules for Buildings; European Committee for Standardization: Brussels, Belgium, 2005.
  52. Paulay, T.; Priestley, M.J.N. Seismic Design of Reinforced Concrete and Masonry Buildings; John Wiley & Sons: New York, NY, USA; Chichester, UK; Brisbane, Australia; Toronto, ON, Canada; Singapore, 1991. [Google Scholar]
  53. Liauw, T.; Kwan, K. Plastic theory of infilled frames with finite interface shear strength. Proc. Inst. Civ. Eng. 1983, 75, 707–723. [Google Scholar] [CrossRef]
  54. Saneinejad, A. Non-Linear Analysis of Infilled Frames; University of Sheffield: Sheffield, UK, 1990; Available online: https://books.google.ro/books?id=_NIuGwAACAAJ (accessed on 12 November 2024).
  55. Salmon, C.G.; Johnson, J.E. Steel Structures: Design and Behavior: Emphasizing Load and Resistance Factor Design. HarperCollins College Publishers, University of Michigan. 1996. Available online: https://books.google.ro/books?id=I-pRAAAAMAAJ (accessed on 10 October 2024).
  56. Saneineja, A.; Hobbs, B. Inelastic Design of Infilled Frames. J. Struct. Eng. 1995, 121, 634–650. [Google Scholar] [CrossRef]
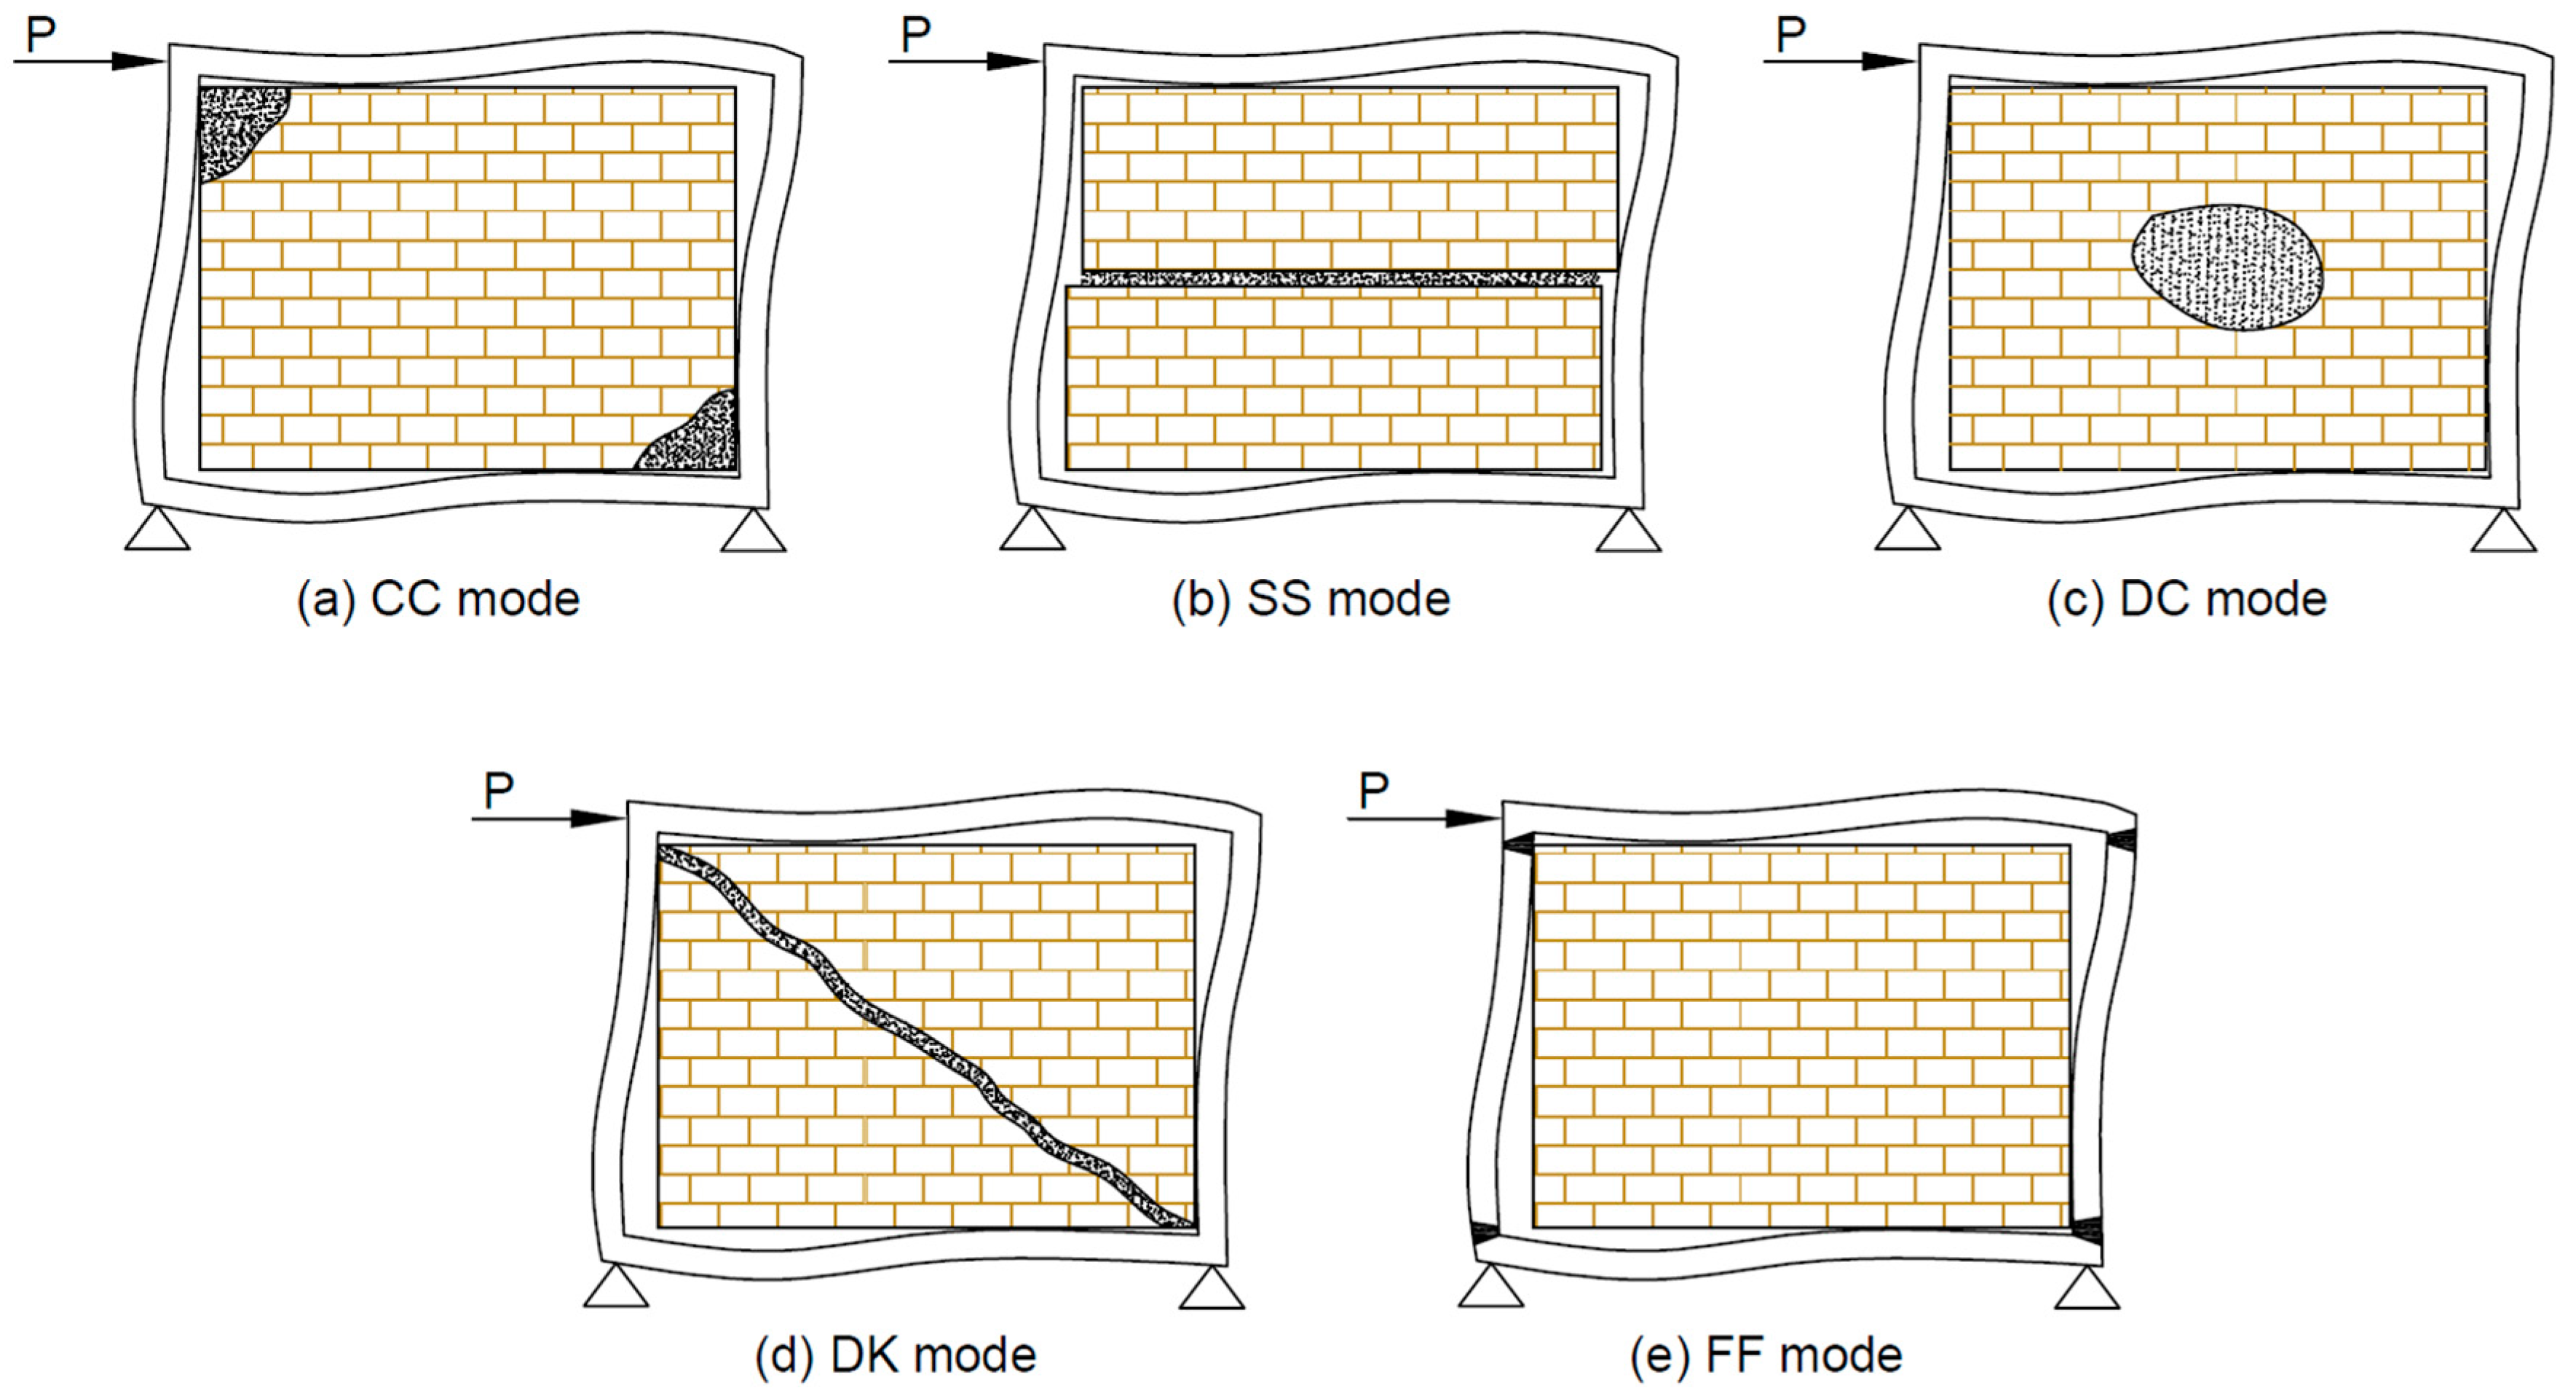
Figure 1. Modes of failure according to El-Dakhakhni (2003) (adapted from [30]): (a) corner crushing (CC), (b) sliding shear (SS), (c) diagonal compression (DC), (d) diagonal cracking (DK), and (e) frame failure (FF).
Buildings 15 00190 g001
Figure 2. Scheme of a steel frame with infill material.
Buildings 15 00190 g002
Figure 3. Failure mode relationships for hollow and solid infill masonry.
Buildings 15 00190 g003
Figure 4. Frames load scheme (left) load without vertical force, (right) load with vertical force.
Buildings 15 00190 g004
Figure 5. Tested frame configurations ((left) without the action of vertical force—adapted from [36]; (right) with the action of vertical force—adapted from [38]).
Buildings 15 00190 g005
Figure 6. Tested frame with infill masonry according to (adapted from) [37].
Buildings 15 00190 g006
Figure 7. Tested frame with infill masonry according to ref. [41].
Buildings 15 00190 g007
Figure 8. Tested frame with infill masonry according to (adapted from) [42].
Buildings 15 00190 g008
Figure 9. Tested frame with infill masonry according to ref. [46].
Buildings 15 00190 g009
Figure 10. Analytical model of replacement diagonal—(adapted from [49]).
Buildings 15 00190 g010
Figure 11. Comparisons of results obtained by analytical expressions.
Buildings 15 00190 g011
Figure 12. Comparative results of experiments: (a) FEMA 306 [50]; (b) CSA S304-14 [49]; (c) Paulay and Priestley (1991) [52]; (d) EN 1996 [48] and EN 1998 [51]; (e) Liauw and Kwan (1983) [53].
Buildings 15 00190 g012
Table 1. Steel frame database—geometric and material characteristics of steel frame.
#ReferencesLabelH
(m)
L
(m)
Andc
(cm4)
Andb
(cm4)
Wpl.c
(mm3)
Es
(GPa)
1Markulak et al. (2013) [34]C-11.6132.176606.2606.2119,500210
2 C-21.6132.176606.2606.2119,500210
3 C-31.6132.176606.2606.2119,500210
4 AAC-11.6132.176606.2606.2119,500210
5 AAC-21.6132.176606.2606.2119,500210
6 AAC-31.6132.176606.2606.2119,500210
7 CA-11.6132.176606.2606.2119,500210
8 CA-21.6132.176606.2606.2119,500210
9 CA-31.6132.176606.2606.2119,500210
where: C—hollow clay blocks; AAC—autoclaved aerated blocks.
10Markulak et al. (2020) [35]PF-M-11.6132.17613.67013.670111,200210
11 PF-M-21.6132.17613.67013.670111,200210
12 RF-M-11.6132.176606.2606.2119,500210
13 RF-M-21.6132.176606.2606.2119,500210
14 RF-MF-11.6132.176606.2606.2119,500210
15 RF-MF-11.6132.176606.2606.2119,500210
where: PF-M—Pinned steel frame infilled with masonry units of Type A; RF-M—Rigid steel frame infilled with masonry units of Type A; RF-MF—Steel frame infilled with masonry units of Type A and Type B.
16Liu and Soon (2012) [36]N-01.2391.407476476103,000199.5
17 F-01.2391.407476476103,000199.5
18 CF-11.2391.407476476103,000199.5
19 CF-21.2391.407476476103,000199.5
20 CF-31.2391.407476476103,000199.5
21 P-01.2391.407476476103,000199.5
22 CP-11.2391.407476476103,000199.5
23 CP-21.2391.407476476103,000199.5
24 CP-31.2391.407476476103,000199.5
where: C—combined load; N—ungrouted infill; F—fully grouted infill; P—partially grouted infill
25Tsantilis and Triantafillou (2018) [37]S00.9051.6671.3171.31716,640210
26 S20.9051.6671.3171.31716,640210
27 S40.9051.6671.3171.31716,640210
where: S0—infilled frame; S2—cellular material 2mm at vertical slits; S4—cellular material 4 mm perimets.
28Liu and Manesh (2013) [38]P1NA1.2391.136476476103,000199.5
29 F1NA1.2391.136476476103,000199.5
30 N3NA1.2391.136476476103,000199.5
31 P3NA1.2391.136476476103,000199.5
32 F3NA1.2391.136476476103,000199.5
33 P3NI1.2391.136476476103,000199.5
34 F3NI1.2391.136476476103,000199.5
35 P6NA1.2391.814476476103,000199.5
where: P—partially grouted; F—fully grouted; N—non-grouted; A—major column orientation in frame; I—minor column orientation in frame.
36H. Moghaddam (2004) [39]S11.3001.5003283286,360210
37 S21.3001.5003283286,360210
38 S31.3001.5003283286,360210
where: S1—solid brick, intact condition; S2—solid brick repaired (corner strengthened); S3—perforated brick intact condition.
39Dawe and Seah (1989) [40]WA42.6973.6008.7304.540770,000210
40 WC72.6973.6008.7304.540770,000210
where: WA4—mortar between column flange and panel, but without bed-join reinforcement; WC7—mortar packed between column flanges and panel, without mortar between panel and column flanges, with no joint reinforcement.
41Mohammadi and Emami (2019) [41]M-RC-1B1.5002.2502.510606.2324,900185
42 M-PC-1B1.5002.2502.510606.2324,900185
43 M-RC-2B1.5002.2502.510606.2324,900185
44 M-PC-2B1.5002.2502.510606.2324,900185
where: M—masonry unit; R—rigid; P -pinned; 1—one way; 2—two bay.
45Ravichandran (2009) [42]AAC3.1396.10036.69140.934139,000210
where: AACAutoclaved aerated concrete
46Mohammadi et al. (2011) [43]SP12.0703.000541.20541.2088,340210
47 CL-SP12.0703.000541.20541.2088,340210
48 SP-22.0703.000541.20541.2088,340210
49 CF-SP22.0703.000541.20541.2088,340210
50 CP32.0703.000541.20541.2088,340210
51 SF-SP32.0703.000541.20541.2088,340210
where: SP1—three-layer infill, composed of 25 mm concrete, 100 mm brick, 25 mm concrete; CL-SP1—corner less; SP2—three-layer infill, two 100 mm masonry wall with 75 mm RC wall at the middle; CF-SP2—column fuse; CP3—three-layer infill, two 100mm masonry wall with 50 mm RC wall at the middle; SF-SP3—sliding fuse in the infill.
52Najarkolaie et al. (2017) [44]DL2.2262.2192.510606.00324,900199
53 CL2.2262.2192.510606.00324,900199
where: DL—specimen distributed loading; CL—specimen concentrated loading.
54Moghadam et al. (2006) [45]MS 2.0201.800541.20541.2088,340170
55 MM2.0703.000541.20541.2088,340170
where: M—masonry.
56Tasnimi and Mohebkhah (2011) [46]SW1.8702.400541.20541.2088,340210
where: SW—solid infilled frame
57Hashemi et al. (2018) [47]IFS1.7531.1001.6731.033245,100203
58 IFM1.7531.7521.6731.033245,100203
59 IFL1.7532.5021.6731.033245,100203
where: IFS—infilled frame with small aspect ratio; IFM—infilled frame with medium aspect ratio; IFL—infilled frame with large aspect ratio.
Table 2. Steel frame database—geometric and material characteristics of infill masonry.
#ReferencesLabelFillHw
(m)
Lw
(m)
tw
(mm)
fb
(MPa)
fk
(MPa)
Em
(MPa)
1Markulak et al. (2013) [34]C-1HC1.5562.06212013.051.94600
2 C-2HC1.5562.06212013.052.04600
3 C-3HC1.5562.06212013.051.94600
4 AAC-1AAC1.5562.0621202.131.061174
5 AAC-2AAC1.5562.0621202.130.971174
6 AAC-3AAC1.5562.0621202.131.051174
7 CA-1HC+AAC1.5562.0621202.121.94600
8 CA-2HC+AAC1.5562.0621202.032.04600
9 CA-3HC+AAC1.5562.0621201.61.94600
10Markulak et al. (2020) [35]PF-M-1RBA-EP1.5482.0621204.043.132746
11 PF-M-2RBA-EP1.5482.0621204.043.132746
12 RF-M-1RBA-EP1.5482.0621204.043.132746
13 RF-M-2RBA-EP1.5482.0621204.043.132746
14 RF-MF-1RBA-EP1.5482.0621204.043.132746
15 RF-MF-1RBA-EP1.5482.0621204.043.132746
16Liu and Soon (2012) [36]N-0CMB1.0801.3516420.510.59920
17 F-0CMB1.0801.3516420.59.1010,100
18 CF-1CMB1.0801.3516420.59.1012,800
19 CF-2CMB1.0801.3516420.59.1012,800
20 CF-3CMB1.0801.3516420.59.1012,800
21 P-0CMB1.0801.3516420.59.4012,800
22 CP-1CMB1.0801.3516420.59.4012,800
23 CP-2CMB1.0801.3516420.59.4012,800
24 CP-3CMB1.0801.3516420.59.4012,800
25Tsantilis and Triantafillou (2018) [37]S0HC1.6620.8155814.264.193890
26 S2HC1.6620.8155814.264.193890
27 S4HC1.6620.8155814.264.193890
28Liu and Manesh (2013) [38]P1NACMB1.0801.0806420.59.710,940
29 F1NACMB1.0801.0806420.59.710,940
30 N3NACMB1.0801.0806420.59.710,940
31 P3NACMB1.0801.0806420.59.710,940
32 F3NACMB1.0801.0806420.59.710,940
33 P3NICMB1.0801.0806420.59.710,940
34 F3NICMB1.0801.0806420.59.710,940
35 P6NACMB1.0801.0806420.59.710,940
36H. Moghaddam (2004) [39]S1SB1.2401.380110-3.50782
37 S2HC1.2401.380110-2.95782
38 S3HC1.2401.380110-2.281350
39Dawe and Seah (1989) [40]WA4HCB2.5973.34820024.418.9231,303
40 WC7HCB2.5973.34820033.423.5733,691
41Mohammadi and Emami (2019) [41]M-RC-1BSB1.3862.07955-8.301892
42 M-PC-1BSB1.3862.07955-8.301892
43 M-RC-2BSB1.3862.07955-8.301892
44 M-PC-2BSB1.3862.07955-8.301892
45Ravichandran (2009) [42]RF-AACAAC3.1315.736203-4.902041
46Mohammadi et al. (2011) [43]SP1SB2.0002.8601506.704.904900
47 CL-SP1SB2.0002.8601506.704.904900
48 SP-2SB2.0002.86027513.04.904900
49 CF-SP2SB2.0002.86027517.404.904900
50 CP3SB2.0002.8602506.204.904900
51 SF-SP3SB2.0002.860250104.904900
52Najarkolaie et al. (2017) [44]DLSB2.0791.38655-7.501425
53 CLSB2.0791.38655-7.501425
54Moghadam et al. (2006) [45]MS SB1.6300.9605629.04.902321
55 MMSB1.6300.9605629.04.902321
56Tasnimi and Mohebkhah (2011) [46]SWSB1.8002.26011012.607.40-
57Hashemi et al. (2018) [47]IFSCSP0.9501.62014028.204.1316,700
58 IFMCSP1.6001.62014028.204.1316,700
59 IFLCSP2.6501.62014028.204.1316,700
Table 3. Experimental results.
#ReferencesLabelKini
(kN/mm)
Ksec
(kN/mm)
Fy
(kN)
Fmax
(kN)
1Markulak et al. (2013) [34]C-132.07-59.0139.0
2 C-227.89-70.0139.0
3 C-334.00-51.0128.0
4 AAC-126.93-54.0152.0
5 AAC-215.07-51.0139.0
6 AAC-317.50-49.0146.0
7 CA-123.93-39.0106.0
8 CA-223.26-40.093.0
9 CA-319.49-50.095.0
10Markulak et al. (2020) [35]PF-M-17.90-24.8060.0
11 PF-M-28.20-19.0050.0
12 RF-M-114.40-69.50130.0
13 RF-M-214.90-30.50130.70
14 RF-MF-114.00-65.00135.0
15 RF-MF-114.30-68.50137.0
16Liu and Soon (2012) [36]N-0-18.7062.0077.0
17 F-0-26.90128.0132.0
18 CF-1-36.70165.0198.0
19 CF-2-32.0150.0169.0
20 CF-3-29.10130.0152.0
21 P-0-24.8094.094.0
22 CP-1-26.3080.0126.0
23 CP-2-24.9065.0109.0
24 CP-3-25.6075.089.0
25Tsantilis and Triantafillou (2018) [37]S0-11.98-107.54
26 S2-7.79-87.52
27 S4-6.66-98.0
28Liu and Manesh (2013) [38]P1NA27.1019.9092.0111.0
29 F1NA38.8022.60109.0157.0
30 N3NA24.3018.7062.077.0
31 P3NA35.4024.8094.094.0
32 F3NA17.9013.1063.079.0
33 P3NI56.4026.90128.0132.0
34 F3NI21.4018.4046.0128.0
35 P6NA29.7023.40104.0104.0
36H. Moghaddam (2004) [39]S122.10--82.13
37 S331.65--116.0
38 S542.85--139.3
39Dawe and Seah (1989) [40]WA463.0-211.04760
40 WC764.0-310.0534.0
41Mohammadi and Emami (2019) [41]M-RC-1B10.64--325.0
42 M-PC-1B5.60--290.0
43 M-RC-2B17.20--623.0
44 M-PC-2B13.90--288.0
45Ravichandran (2009) [42]RF-AAC---431.0
46Mohammadi et al. (2011) [43]SP1----
47 CL-SP1----
48 SP-2--304.0412.0
49 CF-SP2----
50 CP3--196.0368.0
51 SF-SP3--31.0-
52Najarkolaie et al. (2017) [44]DL13.40--325.0
53 CL10.60--272.0
54Moghadam et al. (2006) [45]MS 7.23--21.85
55 MM6.79--147.16
56Tasnimi and Mohebkhah (2011) [46]SW---212.0
57Hashemi et al. (2018) [47]IFS20.10--315.0
58 IFM28.40--394.0
59 IFL31.90--391.0
Table 4. Suggested analytical terms for the load-bearing capacity of the masonry-infilled frames.
FEMA 306 [35] V s l i d e i = L i n f t i n f E m θ 2 μ Sliding-shear capacity of the infill
V c = a t i n f f m c o s θ Compression resistance of the diagonal
V c r = 2 2 · σ c r ( L i n f h i n f + h i n f L i n f ) Resistance to diagonal tensile cracking
V i n f = 0.3 V m i Sheer resistance of infill masonry
EN 1996, EN 1998 [33,36] V w = f v t w L w Sheer resistance of infill masonry
V c , E d = γ R d · 2 M c , R d / l c Sheer force in the columns
CSA S304-14 [34] P r = 0.85 χ ϕ m f m A e Compression resistance of the diagonal
V r = ϕ m v m b w d v + 0.25 P d γ s Resistance to diagonal tensile cracking
V r s = 0.16 ϕ m f m A u c + ϕ m μ ( 0.9 V r s t a n ( θ ) Sheer resistance of infill masonry
Paulay and Priestley [37] V s = f v 0 t w L w 1 μ h L Sheer resistance of infill masonry
R c = 2 3 z t f m s e c θ Compression resistance of the diagonal
Liauw and Kwan [38] H u , 1 = σ c t h · 2 M p j + M p c σ c t h 2 Corner crushing with failure in columns and infill/beam connections
H u , 2 = σ c t h tan θ · 2 M p j + M p b σ c t h 2 Corner crushing with failure in beams and infill/column connections.
H u , 3 = 4 M p j h + σ c t h 6 Diagonal crushing with failure in infill/beam connection
H u , 4 = 4 M p j h + σ c t h 6 tan 2 θ Diagonal crushing with failure in infill/column connections
Table 5. Calculation of load-bearing capacity of masonry-infilled frames according to CSA S304-14 as applied in the studies (according with) [34,35].
#LabelInfill TypeVFR
(kN)
Ph
(kN)
Vm
(kN)
Vrs
(kN)
Vuk
(kN)
Vuk/Vexp
(%)
1C-1HC99.6829.9713.1027.63127.310.92
2C-2HC99.6831.5513.4428.35128.030.92
3C-3HC99.6829.9713.1027.63127.310.99
4AAC-1AAC99.6816.729.7820.64116.400.77
5AAC-2AAC99.6815.309.3619.74114.980.83
6AAC-3AAC99.6816.569.7420.54116.240.80
7CA-1HC+AAC99.6824.4510.6826.68124.131.17
8CA-2HC+AAC99.6825.7310.9627.38125.421.35
9CA-3HC+AAC99.6824.4510.6826.68124.131.31
10PF-M-1RBA-EP745.3049.3712.6135.34780.6413.01
11PF-M-2RBA-EP745.3049.3712.6135.34780.6415.61
12RF-M-1RBA-EP99.7149.3712.6135.34135.051.04
13RF-M-2RBA-EP99.7149.3712.6135.34135.051.03
14RF-MF-1RBA-EP99.7149.3712.6135.34135.051.00
15RF-MF-1RBA-EP99.7149.3712.6135.34135.050.99
Table 6. Calculation of load-bearing capacity of masonry-infilled frames according to CSA S304-14 as applied in the studies (adapted from) [36,38].
#LabelInfill TypeVFR
(kN)
Ph
(kN)
Vm
(kN)
Vrs
(kN)
Vuk
(kN)
Vuk/Vexp
(%)
16N-0CMB114.7257.8815.4745.55160.272.08
17F-0CMB114.7250.1614.7143.51158.231.20
18CF-1CMB114.7250.1615.0244.61159.330.80
19CF-2CMB114.7250.1615.3445.71160.430.95
20CF-3CMB114.7250.1615.6546.81161.531.06
21P-0CMB114.7251.8116.2248.70163.421.74
22CP-1CMB114.7251.8116.5449.82164.541.31
23CP-2CMB114.7251.8116.8650.94165.661.52
24CP-3CMB114.7251.8117.1852.06166.541.87
28P1NACMB114.7242.7414.9856.72157.461.42
29F1NACMB114.7242.7415.2457.84157.461.00
30N3NACMB114.7253.4719.3959.70168.192.18
31P3NACMB114.7253.4719.7160.84168.191.79
32F3NACMB114.7253.4720.0461.98168.192.13
33P3NICMB114.7253.4720.3663.12168.191.27
34F3NICMB114.7253.4720.6864.25168.191.38
35P6NACMB114.7269.5727.3372.36184.301.77
Table 7. Calculation of load-bearing capacity of masonry-infilled frames according to CSA S304-14 as applied in the study (adapted from) [37].
#LabelInfill TypeVFR
(kN)
Ph
(kN)
Vm
(kN)
Vrs
(kN)
Vuk
(kN)
Vuk/Vexp
(%)
25S0HC42.0625.7514.3733.7667.800.63
26S2HC42.0625.7514.6334.4767.800.77
27S4HC42.0625.7514.8935.1867.800.69
Table 8. Calculation of load-bearing capacity of masonry-infilled frames according to CSA S304-14 as applied in the studies (adapted from) [39,45].
#LabelInfill TypeVFR
(kN)
Ph
(kN)
Vm
(kN)
Vrs
(kN)
Vuk
(kN)
Vuk/Vexp
(%)
36S1SB65.5419.7113.0945.0685.241.04
37S2HC65.5428.5512.2042.0894.090.81
38S3HC65.5422.0610.8837.6287.600.63
54MS SB55.9828.5123.4262.5884.493.87
55MMSB54.6328.5123.6963.3983.140.56
Table 9. Calculation of load-bearing capacity of masonry-infilled frames according to CSA S304-14, as applied in the studies (adapted from) [41,43,44].
#LabelInfill TypeVFR
(kN)
Ph
(kN)
Vm
(kN)
Vrs
(kN)
Vuk
(kN)
Vuk/Vexp
(%)
41M-RC-1BSB254.7860.5032.6691.28315.290.97
42M-PC-1BSB254.7860.5033.1292.72315.291.09
43M-RC-2BSB254.7860.5033.5894.16315.290.51
44M-PC-2BSB254.7860.5034.0495.59315.291.09
46SP1SB47.80134.0136.95107.03154.82-
47CL-SP1SB47.80134.0137.44108.59156.39-
48SP-2SB47.80245.6837.92110.15157.950.38
49CF-SP2SB47.80245.6838.41111.71159.51-
50CP3SB47.80223.3538.90113.28161.070.44
51SF-SP3SB47.80223.3539.38114.84162.64-
52DLSB186.8269.2540.60115.34256.070.79
53CLSB186.8269.2541.09116.88256.070.94
Table 10. Calculation of load-bearing capacity of masonry-infilled frames according to CSA S304-14 as applied in the studies (adapted from) [42].
#LabelInfill TypeVFR
(kN)
Ph
(kN)
Vm
(kN)
Vrs
(kN)
Vuk
(kN)
Vuk/Vexp
(%)
45RF-AACAAC61.05298.7266.25169.10230.150.53
Table 11. Calculation of load-bearing capacity of masonry-infilled frames according to CSA S304-14 as applied in the studies (adapted from) [46].
#LabelInfill TypeVFR
(kN)
Ph
(kN)
Vm
(kN)
Vrs
(kN)
Vuk
(kN)
Vuk/Vexp
(%)
56SWSB59,52117.2842.26135.87363.520.83
Disclaimer/Publisher’s Note: The statements, opinions and data contained in all publications are solely those of the individual author(s) and contributor(s) and not of MDPI and/or the editor(s). MDPI and/or the editor(s) disclaim responsibility for any injury to people or property resulting from any ideas, methods, instructions or products referred to in the content.