1. Introduction
Planning can be considered a set of strategies aimed at forecasting and controlling the application of human and material resources to ensure that the execution of a project meets its economic, time, and quality objectives [
1]. The management of construction project execution is often hampered by construction processes’ high degree of variability, introducing extreme complexity into aligning what was planned with what is actually executed. In contexts of uncertainty, the risk of divergence between the real outcome and the planned outcome increases [
2].
To address this challenge, methodologies such as Location-Based Management Systems (LBMSs) and Line of Balance (LOB) have been analyzed. An LBMS focuses on workflow optimization by linking activities to specific physical locations, ensuring the efficient allocation of resources in projects with multiple locations [
3]. Similarly, the LOB ensures that resources move seamlessly between units of repetitive tasks, while adjusting activity durations to prevent delays [
4,
5]. These methodologies emphasize task flow visualization and resource synchronization, which are vital in maintaining project efficiency.
On the other hand, the Last Planner System (LPS) promotes collaborative planning to improve project reliability and efficiency [
6,
7]. Through processes such as pull planning, removing constraints, and weekly commitment planning, the LPS ensures that tasks are executed on time with minimal waste. Integrating the LPS with the LBMS enhances collaborative decision-making and location-specific tracking, helping identify bottlenecks and gaps in real-time [
8,
9].
A comparison of these methodologies is presented in
Table 1, highlighting their complementary aspects.
As can be seen, using the LBMS + LOB enhances the visualization of task flows and improves coordination, ensuring that work progresses smoothly with minimal idle time or delays, while the LPS + LBMS improves collaborative decision-making, ensures location-specific tracking of the progress, and helps identify bottlenecks and gaps in real-time.
Furthermore, traditional methodologies such as the Critical Path Method (CPM) and Earned Value Management (EVM) are widely used today (
Table 2). The CPM identifies the longest sequence of tasks to ensure timely project completion, focusing on dependencies, critical paths, and task durations (Optimizing Time, Cost, and Quality in Multi-Mode Projects, 2021) [
10]. EVM provides cost and schedule control by comparing the planned work with the actual performance, offering insights into project health [
11,
12,
13].
Using the CPM and EVM together gives project managers the ability to track schedule adherence (CPM) while also monitoring cost performance (EVM). This combination provides a comprehensive view of project health, ensuring that both time and cost are managed effectively [
14,
15,
16].
It has been shown that combining the LBMS, LOB, LPS, CPM, and EVM creates a holistic approach to managing construction projects, ensuring that time, cost, quality, and resource allocation are optimized. This integrated approach leverages the strengths of each methodology to deliver projects more efficiently and with fewer delays, cost overruns, or workflow disruptions. The benefits of combining these methodologies are the following:
Comprehensive Control: You can manage everything from location-based task flows (LBMS) to repetitive task synchronization (LOB), collaborative planning (LPS), critical scheduling (CPM), and cost performance (EVM).
Improved Decision-Making: Each methodology provides different insights, such as schedule risk, location-specific progress, or cost efficiency, which together help managers make better, data-driven decisions.
Greater Flexibility: The integration of real-time tracking (LBMS), collaborative planning (LPS), and cost/schedule monitoring (CPM + EVM) allows teams to adapt to changes and mitigate risks more effectively.
Enhanced Efficiency and Productivity: By aligning these methodologies, you ensure that resources are used efficiently, delays are minimized, and the project remains on schedule and within budget.
There are several projects that analyze case studies based on the above [
17,
18,
19,
20,
21,
22]. The present research based on these guidelines develops a tool that covers and embraces factors relating to various parameters such as cost, activities, tools, and the timeframe.
2. Methodology
2.1. Methodological Approach
The efficiency of strategies used for tracking cost and schedule deviations significantly impacts the quality of the final product. Specifically, in scheduling, smaller deviations ensure there is sufficient time for conducting production validation tasks, while delays often rush validation processes, leading to increased issues during the post-sale phase [
2].
The development of this user-friendly tool is based on the following considerations:
What needs to be done and where? The activity sequence is defined for specific locations [
4].
What is the progress flow of each activity? The execution path for each activity through the defined locations is tracked.
Does the plan promote continuous and balanced resource flow? Discontinuities are identified and optimized to enhance resource utilization.
Does the plan support effective product quality management? The hours worked are maintained at a normal distribution to avoid productivity dips [
23].
What has been done compared to the plan? Progress is visualized to assess execution versus scheduling [
3].
2.2. Proposed Methodology
The proposed methodology, referred to as Sofia’s Board (ETS, from the Spanish “El Tablero de Sofia”), was developed to combine the best aspects of existing planning and monitoring methodologies into a unified tool tailored to construction projects. Named for its intuitive and engaging design, ETS is both visually appealing and functionally robust. It allows users to visualize planning strategies, monitor execution with ease, and foster maximum productivity during the construction process. The tool’s goal is to provide comprehensive support for planning and monitoring construction projects, achieved by leveraging advanced methodologies while maintaining simplicity and efficiency.
Regarding planning, the development of this tool is based on two fundamental concepts: zoning and the formation of production packages. Correctly defining the areas of action and production packages within a project make using the tool easier. A zone defines an area of action within a project. Each zone is small enough for one activity at a time but substantial enough to represent a significant fraction of the overall project scope.
Production packages represent the sequence of activities in a work zone. An activity is defined as a task performed continuously over a period with constant use of resources throughout its execution. Placing a restriction on resource use, both material and human, helps to delineate the boundaries between different activities in a sequence of execution steps and ensures a continuous resource flow and reduced logistical constraints in a work zone [
3].
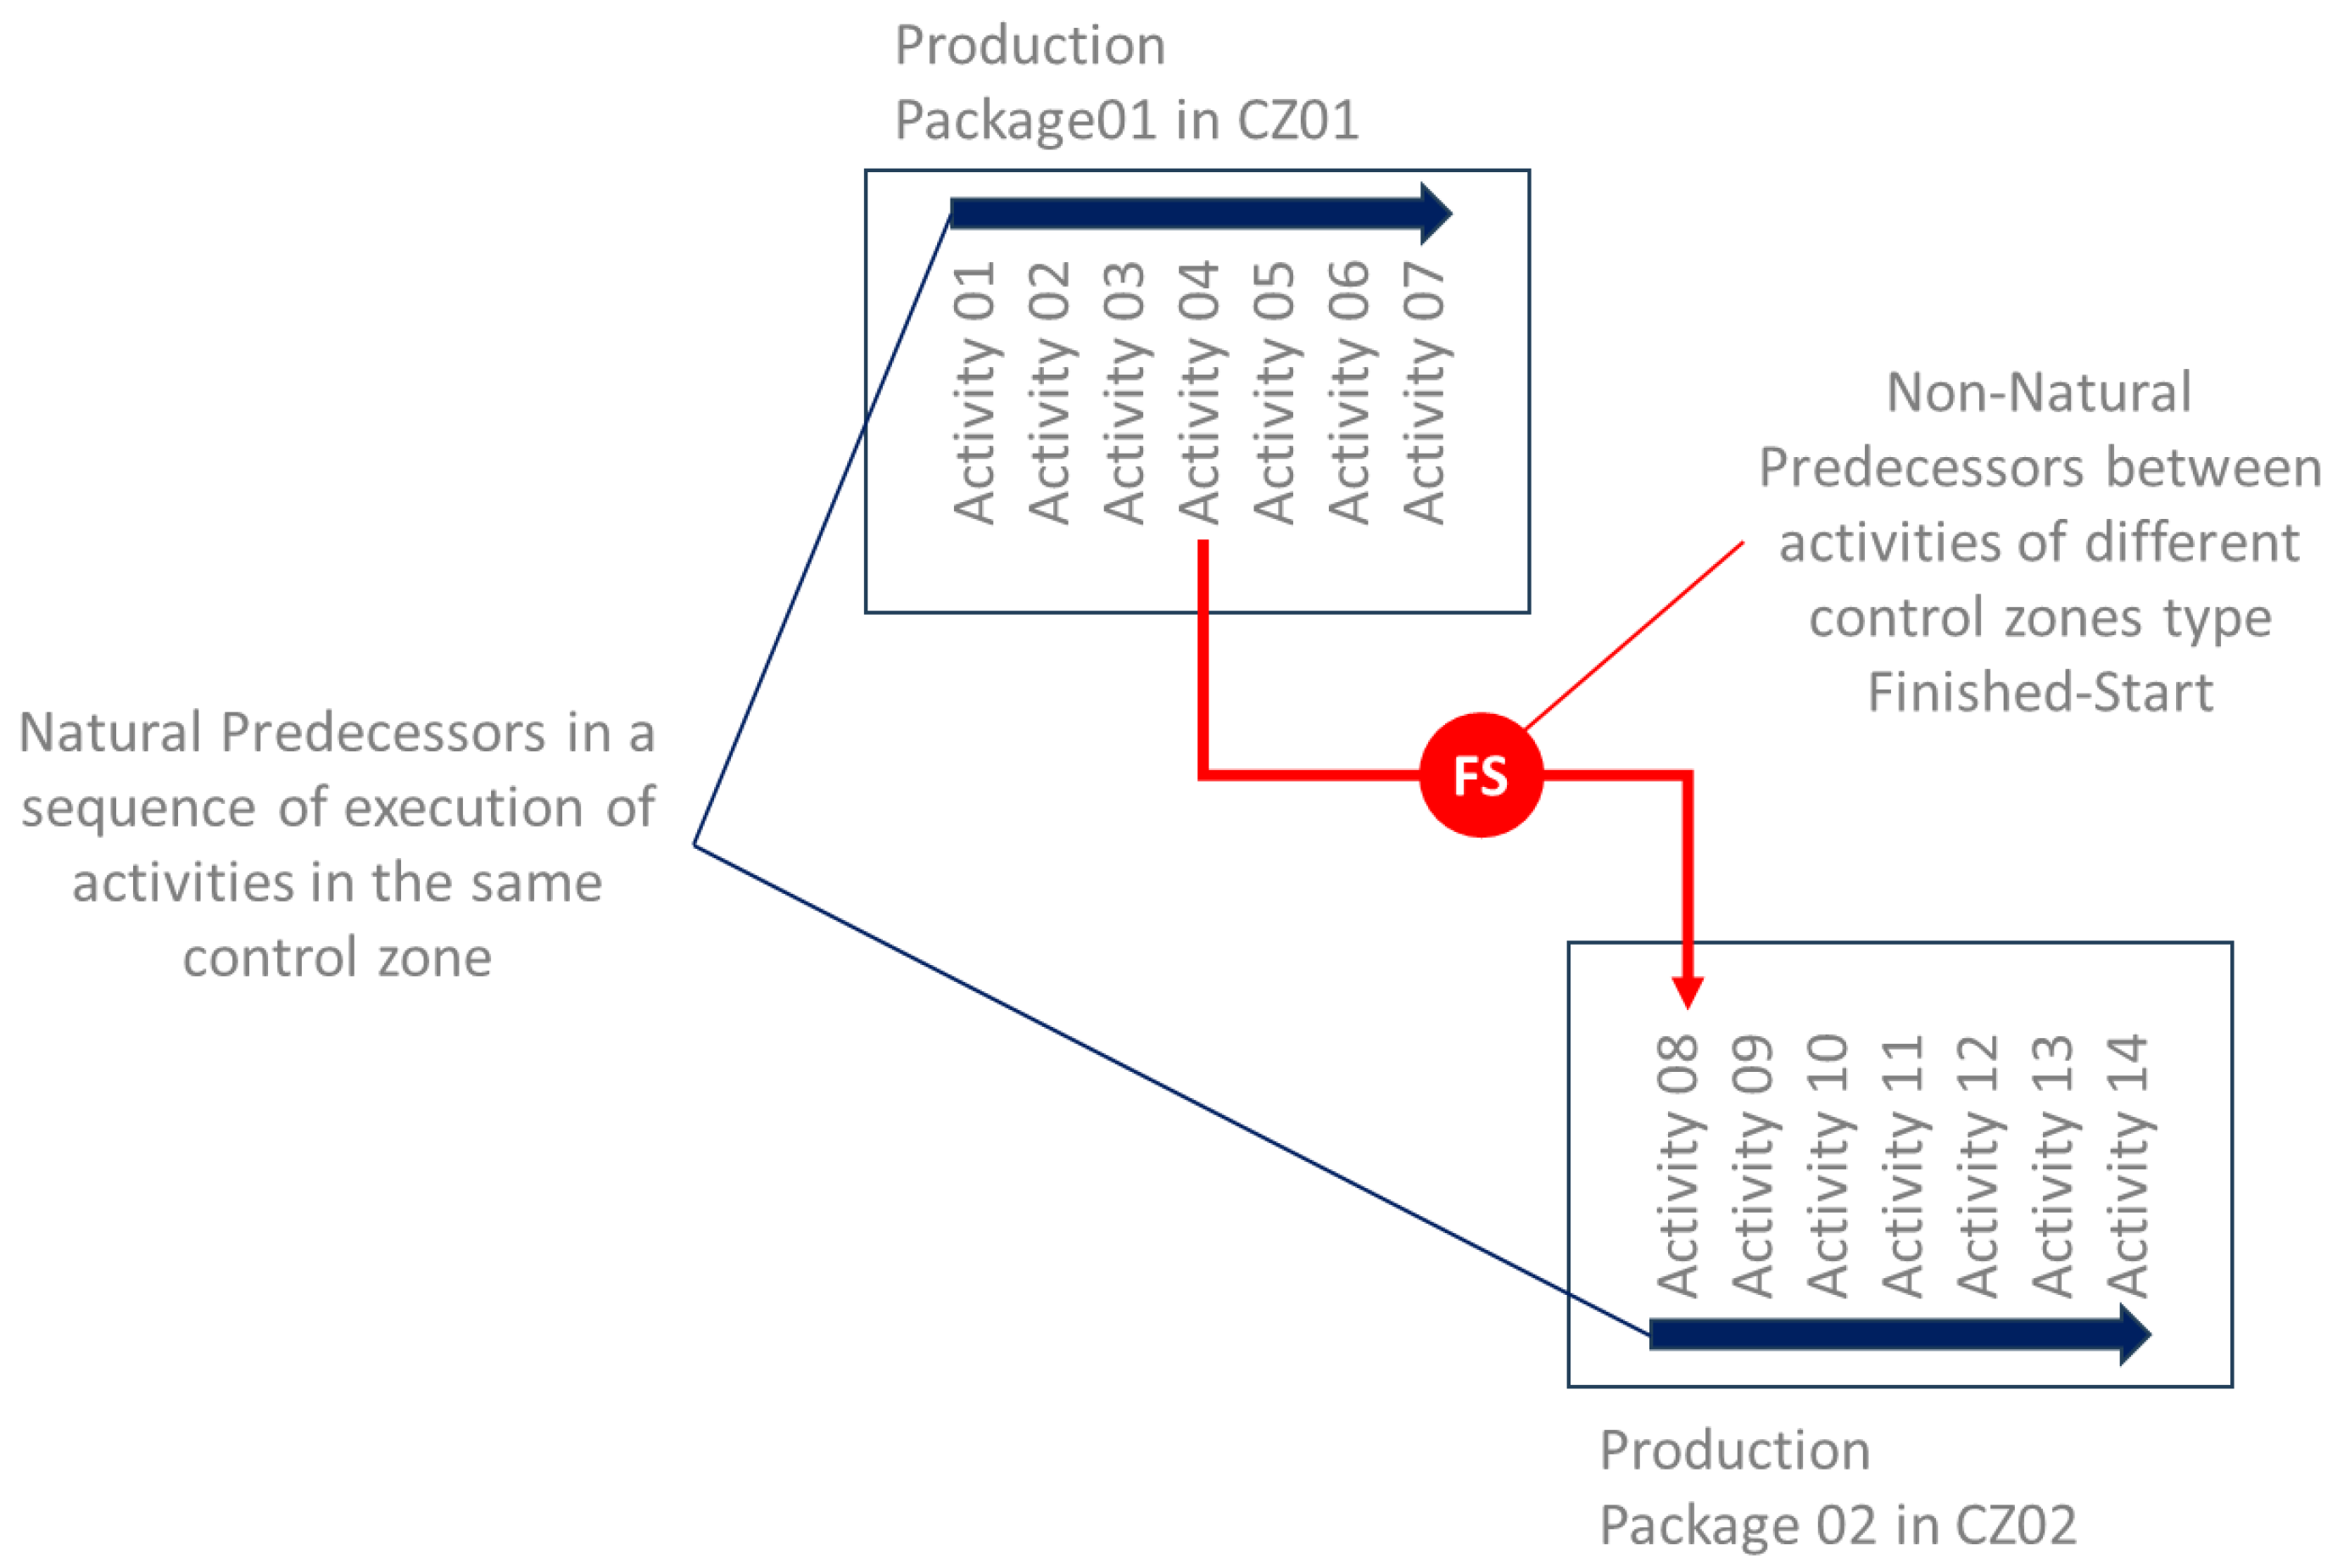
The relationship between activities, whether within the same production package or across different zones, follows an exclusive finish-to-start dependency, with natural predecessors and non-natural predecessors, as presented in
Figure 1. This ensures that activities within a zone are synchronized, preventing overlaps and facilitating seamless execution across production chains [
6]. The sequence of work zones also establishes a relationship that extends to the production packages and, subsequently, to their production chains. A production chain is defined as the grouping of production packages executed across several work zones. This ensures that activities within these packages are synchronized, with a focus on avoiding delays in repetitive cycles.
With regard to optimizing and facilitating the monitoring of planning, the development of the tool was based not only on the reference methodologies—LBMS, LOB, LPS, CPM, and EVM—but also on two additional concepts: project execution management techniques, in the form of control boards that were used in construction offices before the advent of computers, and the concept of gamification, prioritizing graphical interaction over tabular data entry.
Before the widespread use of computers, project management in construction involved the creative assembly of large physical boards in offices, where managers represented the project’s execution status by mapping activities to specific zones of the site. Gamification is introduced as a strategy to enhance motivation and engagement, thereby improving productivity [
24]: “Gamification is simultaneously a technique, a method, and a strategy. It involves identifying the elements that make games engaging and incorporating them into non-game environments—such as specific activities, tasks, or messages—by transforming those aspects into game-like or playful dynamics. The objective is to create a meaningful experience that engages users, promotes behavioral change, or conveys a specific message or content”.
ETS includes the functionality to replicate and utilize the principles of the Critical Path Method (CPM). It enables users to identify and analyze critical tasks within the project’s timeline, ensuring efficient scheduling and timely completion. Additionally, ETS offers an export feature to integrate CPM-generated data with Microsoft Project, providing flexibility for users accustomed to traditional tools. This functionality bridges the gap between ETS and widely used software, making it adaptable for various project management workflows.
One of the unique aspects of ETS is its structured approach to linking activities, work units from the project’s budget, and associated resources. This integration allows planners to understand resource requirements comprehensively and allocate resources effectively to fulfill the planning objectives. The data structure’s design facilitates seamless coordination between planning and budgeting, ensuring that resources are aligned with the project’s execution strategy.
To illustrate this,
Figure 2 provides an overview of the data structure, showcasing the relationships between activities, work units, and resource allocation.
ETS introduces gamification elements to enhance user engagement and support the planning phase’s goal of achieving balanced takt times. Specifically, ETS enables planners to achieve the following:
Adjust takt times for activities that are non-natural predecessors, such as those spanning different control zones.
Define up to three predecessors for activities, modifying their sequence and timing to optimize resource utilization.
Modify the number of team members in professional profiles to ensure balanced workloads.
Reorder execution sequences for activities or groups of activities to eliminate inefficiencies highlighted in the Flow Analysis board.
The Flow Analysis board is a key feature of ETS, visually representing the continuity and efficiency of workflows. Planners can use it to identify and address potential bottlenecks or inefficiencies, iterating through various adjustments until achieving an optimized plan devoid of red or yellow indicators.
ETS employs a robust approach to weekly programming and monitoring. Each activity in a control zone is classified into one of three states: not started, in progress, or completed. Unlike traditional methodologies, ETS does not measure partial progress within a zone. This approach simplifies tracking and ensures clarity in monitoring the status of activities. By focusing on these discrete states, ETS eliminates ambiguity and promotes efficient resource allocation.
ETS incorporates principles from the Location-Based Management System (LBMS) and Line of Balance (LOB) methodologies. It emphasizes takt times for activities within the same zone and between intersecting activities from different zones. This integration ensures that workflows are synchronized and resources are utilized efficiently, minimizing idle time and enhancing productivity. By aligning these methodologies, ETS provides users with a powerful tool for managing complex construction projects with repetitive activity sequences.
Designed to be versatile, ETS can be applied to a wide range of construction projects. Its primary requirement is the presence of repetitive sequences of activities across multiple zones. This makes it particularly suitable for projects such as residential developments, high-rise buildings, or infrastructural works where consistent activity sequences are critical to success.
ETS’s design philosophy centers on integrating the strengths of established methodologies while addressing their limitations. By combining gamification, real-time monitoring, and advanced planning techniques, ETS provides the following:
A unified platform for planning and monitoring.
Tools for optimizing takt times and resource allocation.
Compatibility with existing software like Microsoft Project.
Flexibility to adapt to diverse construction scenarios.
With these capabilities, ETS establishes itself as a comprehensive solution for modern construction project management, ensuring efficiency, engagement, and effectiveness in every phase of the project lifecycle.
4. Applying ETS in a Real Case
The ETS (“El Tablero de Sofia”) tool was implemented in a real-world construction project to validate its core functionalities and evaluate its effectiveness in optimizing construction workflows. This validation sought to demonstrate the innovative methodologies underpinning ETS in a practical context. A residential apartment construction project, designated as ArqStr_01, was selected as the case study. This project involved the structural execution phase of a building comprising 89 apartments distributed across six stairwells (E01, E02, E03, E04, E11, and E12) and constructed within four distinct concrete joints. The project’s structural complexities and resource dependencies made it an ideal candidate for testing ETS capabilities.
The construction project was characterized by stairwells distributed as follows:
Stairwells E01 and E02 corresponded to Joints J01 and J02, respectively.
Stairwells E03 and E04 were part of Joint J03.
Stairwells E11 and E12 were associated with Joint J07.
The construction heights varied across the stairwells. Those associated with Joints J01 and J07 reached up to five floors, while those under Joints J02 and J03 extended to seven floors. The remaining stairwells and concrete joints were scheduled for subsequent construction phases.
Figure 6 illustrates the spatial layout and zoning of the construction site, highlighting the division of work areas into control zones for systematic planning and execution.
To utilize the ETS tool effectively, the following steps were implemented after the initial project analysis:
Definition of Control Zones: The project was divided into control zones to create manageable areas for localized planning and execution. This zoning process is illustrated in
Figure 6, which displays the spatial distribution of control zones across stairwells (E01, E02, E03, E04, E11, and E12) and joints (J01, J02, J03, and J07). Each zone was defined to ensure precise task coordination and minimize resource conflicts.
Activity Identification and Sequencing: The activities required within each control zone were identified and logically sequenced to ensure a smooth and efficient workflow. This sequencing considered the unique characteristics of each control zone, as can be seen in the zoning plan in
Figure 6, ensuring activities progressed seamlessly from one zone to the next.
Specification of Professional Profiles: The professional roles and expertise necessary for each activity were defined to ensure optimal resource allocation. This ensured that the right team with the required skills was allocated to each control zone, as reflected in the planned workflows visualized in the figure.
Formation of Production Packages: The sequenced activities were grouped into production packages, aligned with their corresponding control zones. This grouping facilitated streamlined planning and execution, ensuring that resources were utilized effectively across multiple zones while maintaining the flow of work.
The structured measurement of work units, and subsequently, the activities across the data structure hierarchy, was derived from the BIM model and the planning tables. For each object in the BIM model, a shared parameter was created to assign the control zone it was located in.
For the ArqStr_01 project, this data structure established coherence between work units, resources, and activities. As illustrated previously in
Figure 2 and now expanded upon in
Figure 7, an example of this application is shown with the work unit “One-way slab with a 25 + 5 edge and a concrete vault”. This work unit is connected to its resources for cost estimation using consumption performance, and its hours are distributed among the activities required for execution, based on distribution performance. In cases where the activity’s measurement unit differs from that of the work unit, the transformation performance is used to calculate its quantity. Lastly, resources from the cost composition are linked to the activities, and when a resource is shared among multiple activities, the consumption is proportionally distributed using the % association performance.
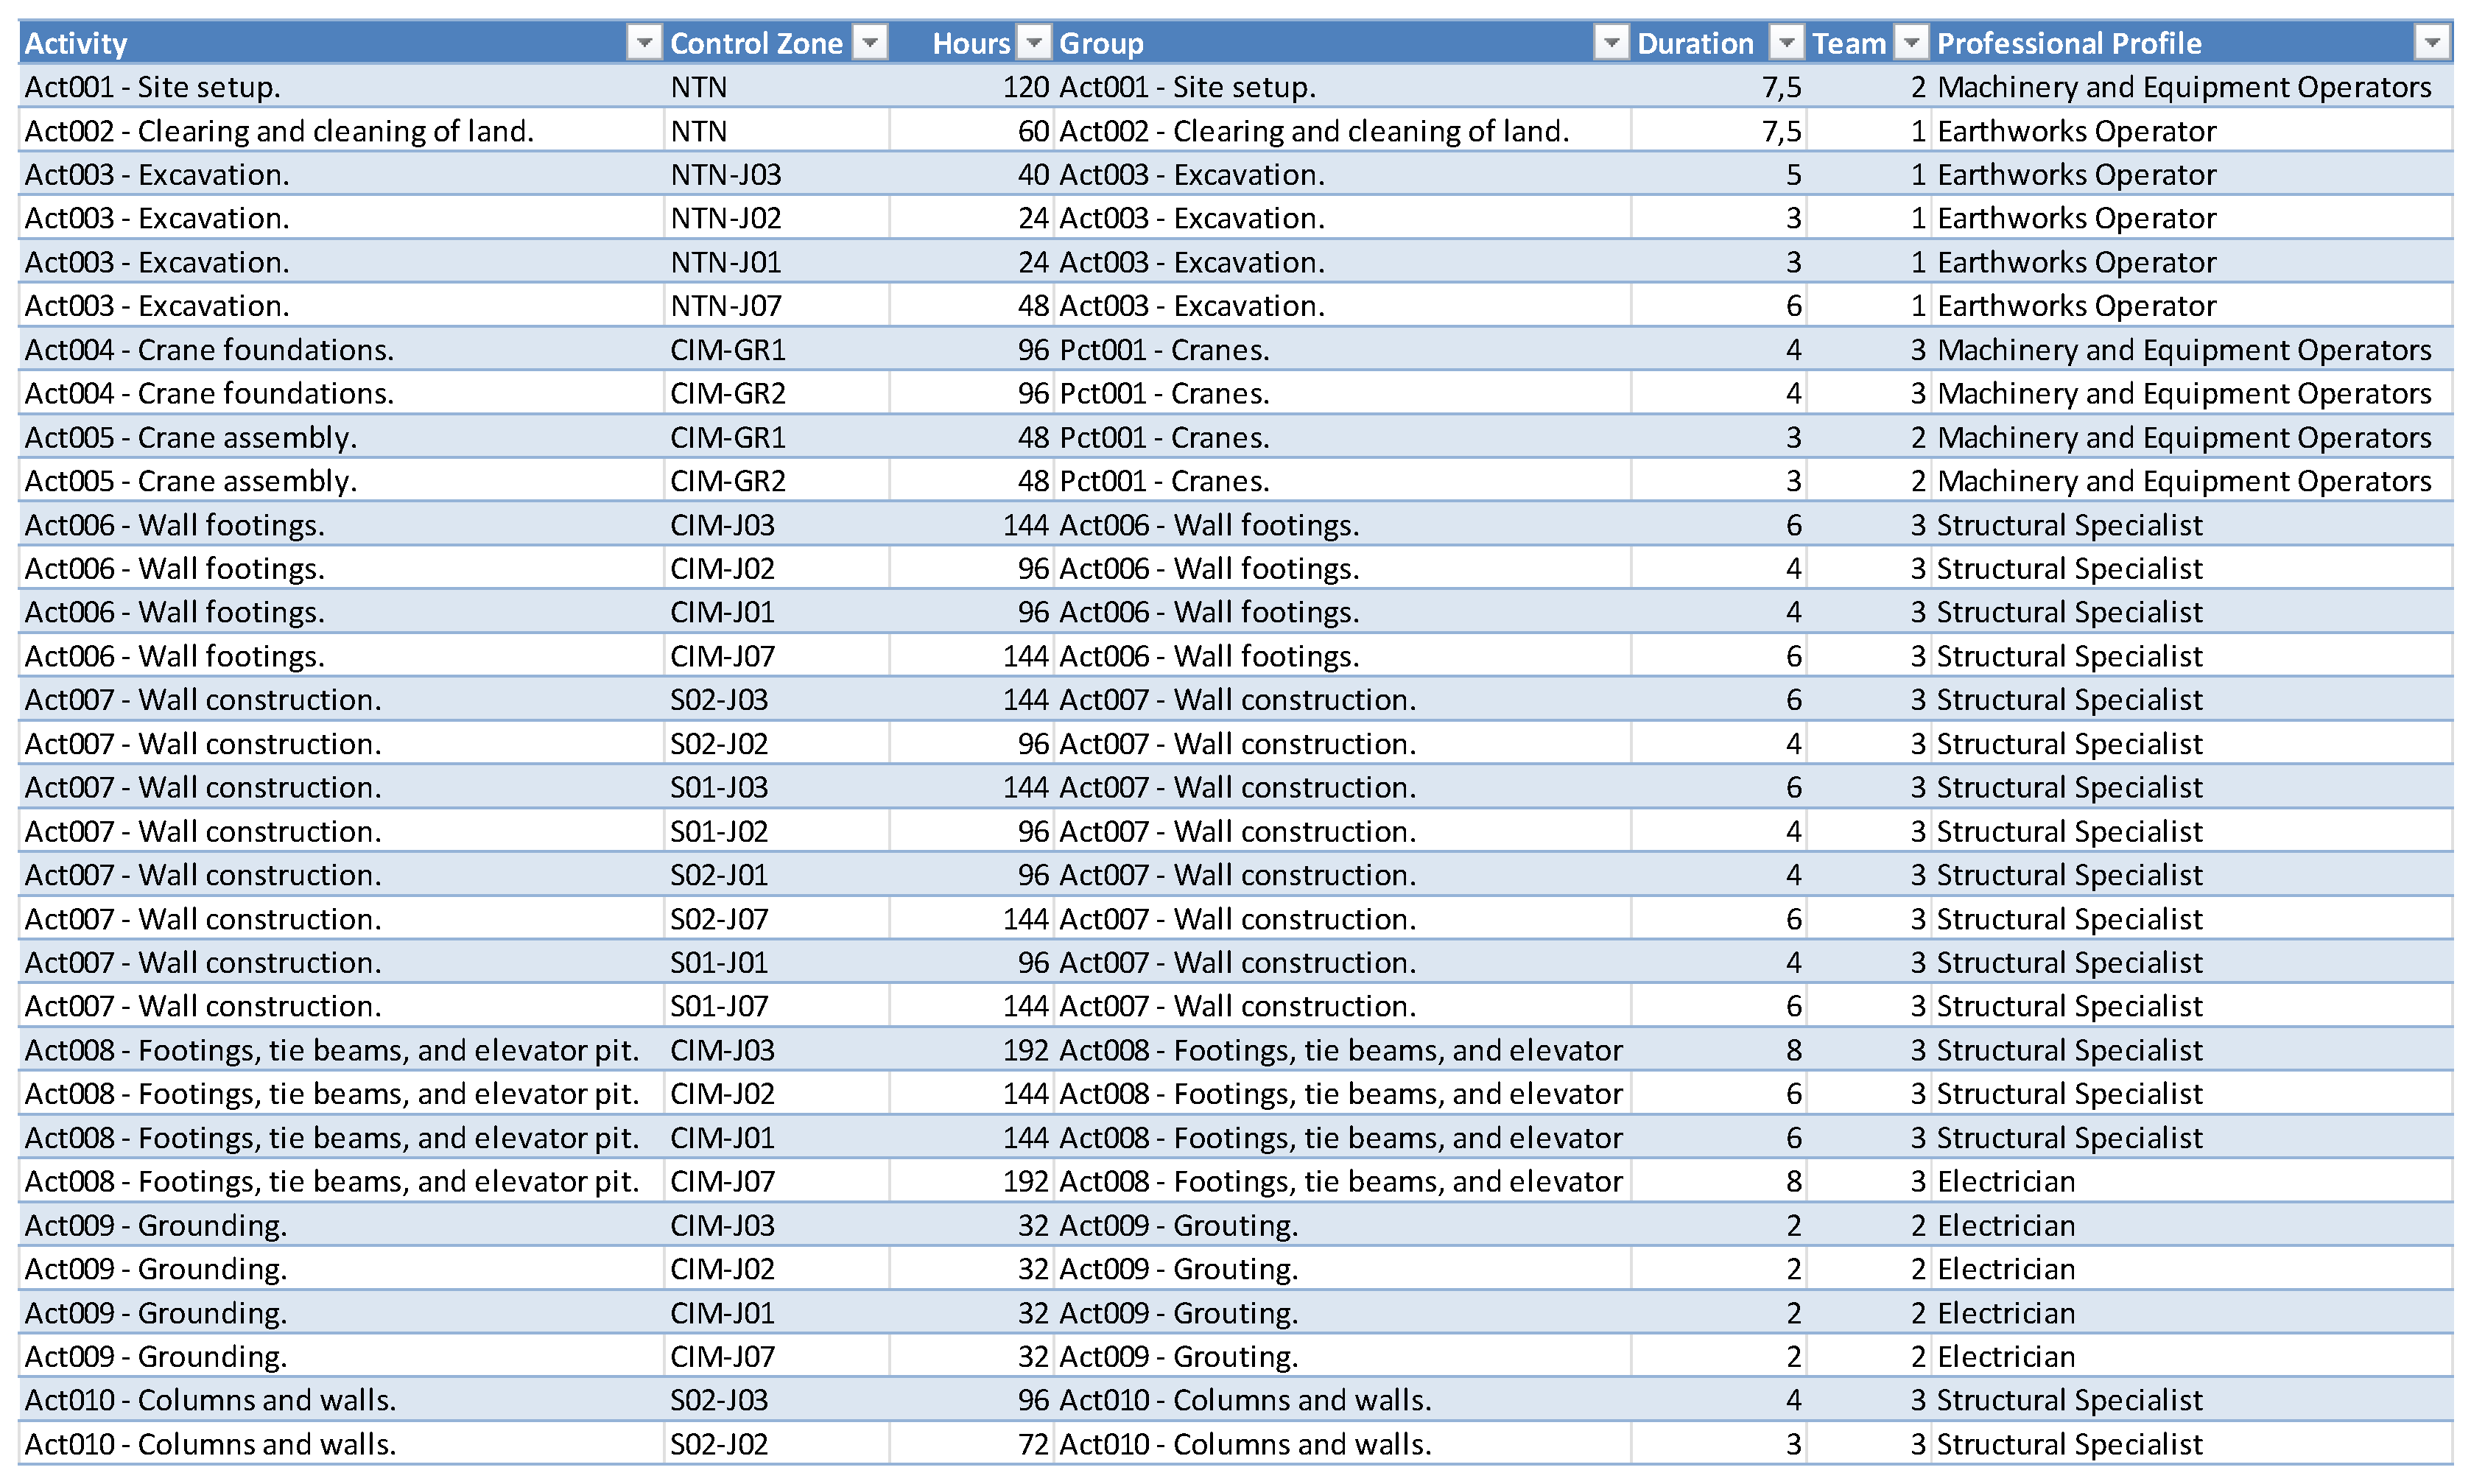
After applying this data structure to all work units within the project scope, the resulting data were organized into
Figure 8, which highlights key activities and their groupings into production packages. For example, Production Package Pct001—Cranes includes activities such as Act003—Crane Foundations and Act004—Crane Assembly. While
Figure 8 showcases the highlights, the full dataset contains over 200 rows, demonstrating the depth and comprehensiveness of the data required for effective use of the ETS tool.
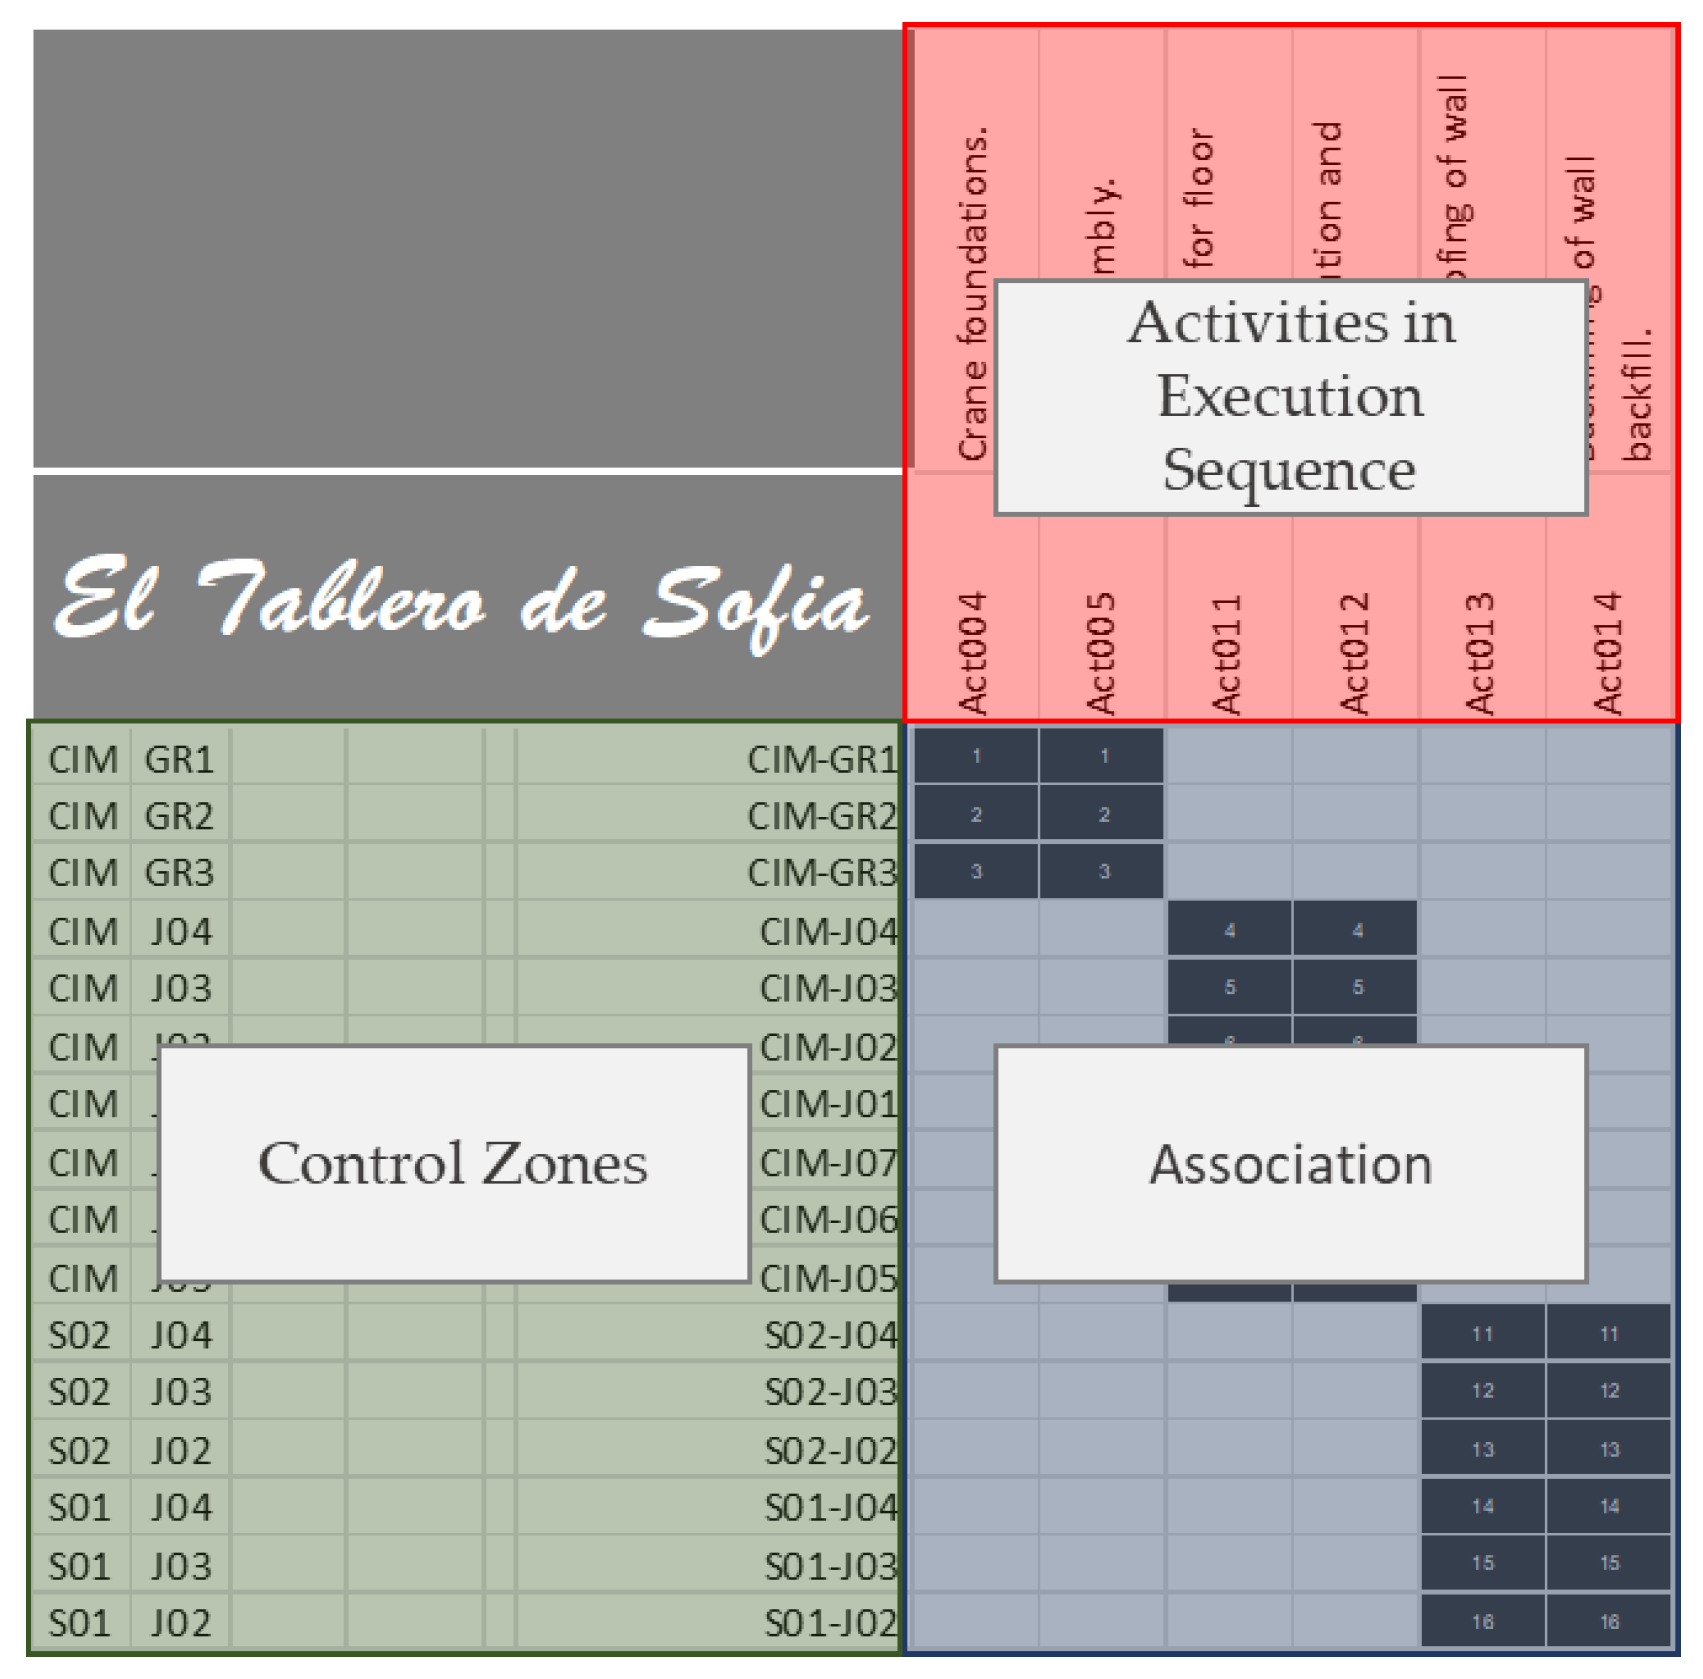
The ETS tool simplified the generation of a detailed project schedule, beginning with a planner-defined start date. This process is significantly streamlined through the use of cascading boards: by placing control zones in their correct execution sequence on the left side of the board and activities or production packages in their natural sequence along the top, numerous rows that would traditionally require manual creation and linking by the planner are automatically generated. This automation greatly reduces the time and effort planners typically expend on assigning predecessors, allowing them to focus on higher-level optimization and decision-making.
Moreover, the tool provides the capability of establishing relationships between activities spanning multiple control zones. Where necessary, non-natural predecessors can be configured to address interdependencies, as illustrated in
Figure 9. This ensures that activities proceed in the correct sequence, even when resource constraints or spatial dependencies introduce additional complexity.
Once activities were correctly sequenced within their control zones, and appropriate predecessors were assigned to production modules (activities or packages within a control zone), the ETS tool generated the project schedule. This included a comprehensive analysis of whether each production module was critical or non-critical. A portion of this schedule, generated for the ArqStr_01 project, is displayed in
Figure 10.
The ETS schedule operates on the assumption of an early start for all production modules. However, this approach, when disconnected from balancing execution pacing, can result in “dead times” or interruptions within specific control zones. The tool also differentiates between inherent waiting times in the process and discontinuities caused by other factors, enabling planners to fine-tune schedules for the optimal workflow.
Building on the structured planning approach described earlier, the ETS tool transitions seamlessly into execution monitoring and optimization through its Flow Analysis and Execution Dashboard functionalities. These features allow planners to analyze potential disruptions and proactively maintain the project flow, ensuring resource efficiency and schedule alignment.
To analyze “dead times” during the planning phase, the ETS tool generates a Flow Analysis board. This board visualizes the durations of prior time periods associated with each production module. While these durations are calculated based on activity-specific criteria, the combination of multiple activities within the same control zones can result in varied and undesirable progress rates. This disrupts the optimized flow of resource utilization, making it crucial for planners to identify and mitigate critical situations. The Flow Analysis board highlights these issues, enabling planners to intervene and implement corrective measures to minimize disruptions.
The Flow Analysis board provides detailed information on the start and end working days of each production module. Discontinuities lasting between two and nine days are flagged in yellow, while those exceeding nine days are marked in red. The board invites the planner to “play” with the workflow as if solving a puzzle—adjusting sequences, redefining resource allocations, or tweaking execution timelines until the red and yellow colors disappear. This gamified interaction fosters engagement and creativity, empowering planners to iteratively refine the project plan until achieving the most suitable arrangement.
Figure 11 illustrates a segment of the Flow Analysis board as applied to the ArqStr_01 project, demonstrating its application in addressing workflow challenges.
Two distinct scenarios are evident in
Figure 11. The first demonstrates a perfect workflow for the activity
Act006—Wall Footings across control zones CIM-J07, CIM-J01, CIM-J02, and CIM-J03, starting on day 23 and finishing on day 45 without interruptions. Similarly, within Control Zone S01-J07, sequential activities such as
Act007—Wall Construction,
Act010—Columns and Walls,
Act015—Slab Construction,
Act019—Stair Construction, and
Act020—Formwork Removal and Cleaning progress smoothly, culminating in Production Package
Pct004—Wall Backfill (
Act013—Waterproofing of Wall Backfill and
Act014—Backfilling of Wall Backfill).
In contrast, the second scenario highlights a significant gap within control zone S02-J0. After completing Act010—Columns and Walls, there was a delay before starting Act015—Slab Construction due to resource constraints, particularly the crane, which was simultaneously required in Control Zone S02-J07. These insights, derived from the Flow Analysis board, underscore the tool’s ability to pinpoint and address interdependencies and bottlenecks.
The Execution Dashboard complements the Flow Analysis board by monitoring and analyzing execution progress in real-time. It reflects the status of control modules from two perspectives: planned and actual. Planned statuses are represented using the following color legend: green indicates “not started” with a planned start date later than the analysis date; yellow signifies “not started” but delayed by up to nine working days; and red denotes delays exceeding nine working days. Actual statuses are represented by gray for “executed” and blue for “in execution”. To simplify real-time tracking, the dashboard categorizes production modules into three statuses—not started, in progress, and completed—eliminating the need for quantifying partial production within control zones.
For the execution flow of ArqStr_01, the completion of Act015—Slab Construction in each control zone was selected as a representative control point.
Figure 12 presents the executed analysis board for 8 September 2023, which uses a color-coded system to illustrate the status of activities within the control zones. Green indicates scheduled activities with a start date later than the analysis date. Yellow represents scheduled activities where the analysis date exceeds the scheduled start date by up to nine working days, while red highlights delays exceeding nine working days past the scheduled start date. The actual status of activities is represented by gray for completed tasks and blue for those currently in execution. The board also shows that the expected completion of all structural work below road level is unmet in the ceiling areas of S01-J01 and S01-J02, both still in execution, and in the ceiling of S01-J03, which has experienced a delay in its start. The project began on 8 May 2023, with additional control points set for 2 November 2023 (completion of the third floor of the structure,
Act015 on the roof of P03-J03) and 22 December 2023 (completion of the entire structure,
Act015 on the roof of P07-J03).
As of 8 September 2023, project execution lagged by approximately 22.5%, equating to a shortfall of 1696 h compared to the planned schedule. However, through targeted interventions guided by ETS insights, the delays were reduced to 2.1% (352 h) by 2 November 2023. By 22 December 2023, the project achieved full alignment with the structural phase planning, demonstrating the effectiveness of the ETS tool in bridging planning and execution gaps.
5. Conclusions
The implementation of the ETS tool in the ArqStr_01 project highlights its effectiveness in enhancing planning, monitoring, and execution processes for construction projects. Despite the project’s inherent complexities and only the partial application of certain tool functionalities, ETS demonstrated its adaptability and value in addressing specific planning and execution challenges.
One of the primary strengths of ETS lies in its dual functionality: it serves as both a visual planning interface and a centralized repository of comprehensive project data. By integrating detailed information about activities, control zones, and resource requirements, ETS created a cohesive framework for tracking project progress and comparing the actual execution with planned schedules. This integration allows planners and project teams to identify bottlenecks, optimize resource allocation, and implement timely corrective measures, streamlining project workflows.
The gamification features of ETS, combined with its real-time tracking capabilities, significantly enhanced team engagement and facilitated intuitive decision-making. The Flow Analysis board, in particular, proved instrumental in identifying inefficiencies and discontinuities, allowing planners to iteratively refine workflows and improve productivity. Additionally, the tool’s ability to incorporate non-standard dependencies and assess critical activities demonstrated its versatility and applicability across diverse project scenarios.
However, some limitations of this study must be acknowledged. The testing of ETS functionalities was partial, and scalability issues—especially for larger and more complex projects—were not extensively addressed. Furthermore, the real-world application was confined to the structural phase of a residential construction project, limiting the scope of conclusions about its performance in other typologies. Nonetheless, ETS demonstrated its potential in managing projects characterized by repetitive sequences of activities across multiple control zones.
The ArqStr_01 case study demonstrated notable progress in project performance, with a reduction in delays from a 22.5% lag at the first checkpoint to alignment with the planned schedule at the final milestone. These improvements highlight ETS’s potential to support project efficiency by providing a unique form of Earned Value Management (EVM) adapted to hours, offering planners detailed insights into activity progress and delays. Through precise analytical calculations, ETS enables the evaluation of advances or setbacks, serving as a critical input for informed decision-making. This analysis can be conducted across the global project, within specific groups, for individual activities, or in designated control zones or sets of control zones—showcasing ETS’s exceptional flexibility and robust capabilities. Nevertheless, further quantitative studies and comprehensive data analysis are essential to validate these findings and establish ETS as a reliable and versatile tool for broader implementation across diverse project scenarios.
Future directions for ETS development include enhancing its integration with Building Information Modeling (BIM) systems to further improve visualization and data consistency. Such integration could leverage BIM’s potential to facilitate real-time visualization of project progress, enabling better coordination and decision-making. Additionally, ongoing work aims to extend ETS’s adaptability to projects with higher complexity and to further refine its ability to manage intricate interdependencies.
In conclusion, ETS represents a valuable option for combining advanced planning and monitoring methodologies. Its innovative features and user-friendly interface position it as a promising tool for the construction industry. While this study marks an important step in validating its potential, ETS remains open to incorporating additional methodologies and functionalities, ensuring its continued evolution as a comprehensive project management solution.


