Article

Graph-RWGAN: A Method for Generating House Layouts Based on Multi-Relation Graph Attention Mechanism

by
Ziqi Ye
1,
Sirui Liu
1,
Zhen Tian
2,
Yile Chen
3,*,
Liang Zheng
3 and
Junming Chen
3,*
1
School of Visual Arts and Design, Guangzhou Academy of Fine Arts, Guangzhou 510006, China
2
James Watt School of Engineering, University of Glasgow, Glasgow G12 8QQ, UK
3
Faculty of Humanities and Arts, Macau University of Science and Technology, Macau 999078, China
*
Authors to whom correspondence should be addressed.
Buildings 2025, 15(19), 3623; https://doi.org/10.3390/buildings15193623
Submission received: 18 September 2025 / Revised: 7 October 2025 / Accepted: 8 October 2025 / Published: 9 October 2025

Abstract

We address issues in existing house layout generation methods, including chaotic room layouts, limited iterative refinement, and restricted style diversity. We propose Graph-RWGAN, a generative adversarial network based on a multi-relational graph attention mechanism, to automatically generate reasonable and globally consistent house layouts under weak constraints. In our framework, rooms are represented as graph nodes with semantic attributes. Their spatial relationships are modeled as edges. Optional room-level objects can be added by augmenting node attributes. This allows for object-aware layout generation when needed. The multi-relational graph attention mechanism captures complex inter-room relationships. Iterative generation enables stepwise layout optimization. Fusion of node features with building boundaries ensures spatial accuracy and structural coherence. A conditional graph discriminator with Wasserstein loss constrains global consistency. Experiments on the RPLAN dataset show strong performance. FID is 92.73, SSIM is 0.828, and layout accuracy is 85.96%. Room topology accuracy reaches 95%, layout quality 90%, and structural coherence 95%, outperforming House-GAN, LayoutGAN, and MR-GAT. Ablation studies confirm the effectiveness of each key component. Graph-RWGAN shows strong adaptability, flexible generation under weak constraints, and multi-style layouts. It provides an efficient and controllable scheme for intelligent building design and automated planning.

1. Introduction

With the rapid development of intelligent building design and interior space planning, automatic generation of reasonable and normative house layout has become a core research problem in building informatization and design automation [1]. A high-quality house layout not only must meet the functional requirements of each room and the building code, but also must take into account the spatial relationship between the rooms, connectivity, and various constraints, such as door and window orientation, ventilation and lighting, and flow of lines [2]. Therefore, how to generate reasonable and diverse layout schemes under complex constraints has become an important technical challenge to improve design efficiency, reduce labor costs, and support intelligent building systems [3].
Existing methods for house layout generation generally fall into three categories: rule-based approaches, optimization-based techniques, and deep learning models [4]. Rule-based methods generate layouts through predefined design rules and heuristic strategies, but they often lack flexibility and are difficult to adapt to diverse design requirements [5]. The optimization algorithm solves the global optimal layout by searching or iterating, but the computational cost is high, and it is difficult to ensure the naturalness and realism of the generated layout [6]. Deep learning methods use neural networks to automatically learn layout patterns. Although they have certain advantages in generation efficiency and style diversity, they still face a series of problems [7].
Li et al. [8] introduced the attribute-conditional layout generative adversarial network, which inputs the attributes of elements into the layout generator and forces the generator and discriminator to meet the attribute conditions and perform training. Wang et al. [9] input human activity maps as constraints into ActFloor-GAN to guide pixel-wise prediction of room types. Zhou et al. [10] proposed an outlier detection method based on high-density iteration, which leverages graph-structured data and can inspire the use of graph neural networks for detecting irregular spatial patterns in house layout generation. Ong et al. [11] proposed VG-GAN network to automatically learn the class relationship in the target by constructing a selection module to generate the layout map. Graph structure is a structured representation of images and text. In order to define the relationship between multiple objects concisely and clearly, and obtain prior knowledge of layout, some methods use the form of graph structure to describe layout images. Johnson et al. [12] first introduced the graph structure to guide the image generation task in the generation field and proposed the scene graph generation adversarial network SGGAN, which is widely used in the field of layout generation. Nauata et al. [13] proposed a graph constraint-based Generative Adversarial Network (House-GAN), which encodes user constraints into the graph structure and generates room bounding-box layout styles through training to improve the diversity of layouts. In the following year, Yao et al. [14] developed Waterscenes, a multi-task 4D radar-camera fusion dataset, demonstrating techniques for multi-modal data fusion and graph-based modeling that are relevant for multi-relation graph attention mechanisms in layout generation. Chang et al. [15] proposed Building-GAN, a floorplan generation adversarial network for multi-storey buildings based on structural diagrams, which extended the two-dimensional floorplan design to a three-dimensional design for the first time.
Although many researchers have proposed house layout generation methods based on generative adversarial networks and achieved promising results, existing approaches still have several limitations. These include chaotic room layouts, limited ability for iterative refinement, and insufficient style diversity. To address these issues, we propose Graph-RWGAN (Graph Relation Wasserstein GAN), a generative adversarial network incorporating a multi-relational graph attention mechanism. In our framework, rooms are represented as graph nodes, and their spatial relationships are modeled as edges; optional room-level objects can be incorporated as node attributes, allowing for object-aware layout generation when needed. The key contributions of this network are summarized as follows:
  • Multi-relational graph attention mechanism: For the first time, multi-relational graph attention is introduced into house layout generation to capture the complex spatial and functional relationships between room nodes and improve the rationality of room layout.
  • Iterated prediction generator: Through multiple iterations, the node features and room relationships are gradually optimized to achieve accurate generation of the layout. It supports iterative modification and dynamic optimization to make up for the shortcomings of traditional methods that cannot adjust the layout.
  • Conditional graph discriminator combined with Wasserstein loss: A conditional graph discriminator with Wasserstein loss enforces global consistency in generated layouts, ensuring realistic spatial connectivity and rationality while enhancing training stability and layout diversity.
  • Efficient layout generation under weak constraints: The proposed method generates house layouts under partial constraints with flexibility, controllability, and strong adaptability, while enhancing style diversity to provide rich solutions for diverse building types and personalized design needs.

2. Related Work

2.1. Graph Attention Module

Graph Attention Module (GAT) is a mechanism used to process graph structure data in graph neural networks [16]. Its core idea is to introduce an attention mechanism in the process of node information aggregation, so that each node can adaptively pay attention to the more important nodes in its neighbors, rather than treating all neighbors equally [17]. Specifically, the node features are first linearly transformed to obtain a new representation, and then the attention coefficient between the node and its neighbors is calculated through the learnable attention vector, and it is normalized by Softmax to change the weight of each neighbor sum to 1.
Then, the normalized attention coefficient is used to weigh and aggregate the neighbor node features, and the new feature representation of the node is generated by the activation function [18]. This module usually supports multi-head attention mechanism, which enhances the stability and expressiveness of the model by parallel multiple attention heads, so as to achieve flexible and effective node feature update while retaining local graph structure information.

2.2. Generators in Different Domains

Generators exhibit a wealth of expertise in different domains. In the field of deep learning, the generator is the core component of Generative Adversarial Network (GAN). Its function is to map random noise to the target data distribution space, and continuously optimize the quality and diversity of generated samples through adversarial training with the discriminator, so as to realize the modeling and realistic reproduction of complex data distribution [19]. In computer programming, the generator is a lazy iterator, which can generate sequence elements on demand without taking up all the memory at once, so as to efficiently process large-scale or streaming data and realize the optimal utilization of computing resources [20].

2.3. Boundary-Aware Graph Convolution Module

Boundary-aware Graph Convolution Module (BAGC) is a graph neural network module specifically designed for architecture or spatial layout tasks [21]. Its core goal is to effectively integrate node features and spatial Boundary information. In this module, each node not only aggregates the feature information of its neighbors, but also encodes the geometric or topological boundary information between nodes into weights or constraints, and realizes the bounding-aware update of node features through weighted aggregation.
Specifically, the module first encodes node features and boundary features separately, and then interactively fuses the two types of information through bounding-aware graph convolution or attention mechanism to generate a feature representation that not only preserves node attribute expression, but also conforms to spatial constraints. The module can significantly enhance the model’s ability to understand and generate the building layout structure, and provide an effective graph structure information fusion strategy for complex spatial layout modeling [22].

2.4. Conditional Graph Discriminator

A Conditional Graph Discriminator (CGD) is a discriminative module for graph generation tasks, which is widely used in graph structure modeling based on Generative Adversarial Network (GAN) [23]. The core goal of the module is to effectively fuse conditional constraint information (such as node attributes, boundary features, or external control signals) while assessing the authenticity of the graph or subgraph to realize the conditional discrimination of the generated graph [24]. Specifically, the conditional graph discriminator generates graph-level or node-level authenticity scores by encoding the node features, edge features, and condition vectors of the input graph, and aggregating neighbor information by graph convolution or graph attention mechanism.
This design not only ensures the discrimination ability of the overall structure and local features of the generated graph, but also strictly restricts the generated graph to meet specific conditions, which makes the model have higher accuracy and controllability in building layout, molecular graph generation, and other structural graph data generation tasks, and it provides an effective conditional discrimination strategy for the generation of complex graph structure [25].

3. Preparatory Work

This section provides an overview of the fundamental concepts underlying our proposed framework, including (i) utilizing a multi-relation graph attention module to capture the complex relationships between room nodes; (ii) gradually inferring the complete room relation graph through iterative prediction generators and effectively integrating node features with architectural boundary information; (iii) introducing a conditional graph discriminator and combining it with the Wasserstein loss to impose global consistency constraints on the generated layout.

3.1. Captures the Relationship Between Room Nodes

In building-layout modeling, rooms often have multiple types of relationships, such as spatial adjacency, functional association, and shared boundaries [26]. To effectively capture these complex relationships, we use a Multi-Relational Graph Attention Module (MR-GAT), which considers different types of side information when updating node features.
Consider a house layout represented as a graph G = ( V , E ) , where each node i V corresponds to a room. Each node is associated with a feature vector.
h i = [ t i , a i , f i , o i ] R F ,
where t i encodes the room type (e.g., bedroom, kitchen), a i represents approximate area, f i captures functional properties (e.g., bathroom fixtures), and o i optionally includes room-level object features such as furniture attributes. The edge set E encodes R different types of relations between rooms, forming the full graph representation G. These node features provide both semantic and spatial information, enabling the graph attention module to reason about room connectivity, functional constraints, and structural coherence.
For a given relation r { 1 , , R } , the attention score between node i and its neighbor j N i r is computed as follows:
s i j ( r ) = σ a r ( W r h i W r h j ) ,
where W r is a relation-specific transformation matrix, a r is a learnable attention vector, and σ ( · ) denotes a LeakyReLU activation. The difference of transformed features captures relational interactions more effectively than standard concatenation.
The updated node representation is obtained by aggregating information from all neighboring nodes and relation types:
h i = Fuse ( { h j | j N i r , r = 1 , , R } ) ,
where Fuse denotes a fusion operation, such as concatenation or weighted sum. This multi-relational attention mechanism allows for the model to capture interactions among room nodes across multiple dimensions, enhancing its capability to model complex topological relations in building layouts.

3.2. Iterative Prediction Generator for Complete Room Graph Inference

To infer a complete room relationship graph, we design an iterative prediction generator that progressively refines the topology through multiple prediction–update steps. At each iteration t, node embeddings { h i ( t ) } are updated by aggregating multi-relational attention features, while the generator predicts missing edges between room nodes:
A ^ i j ( t ) = σ ( h i ( t ) ) W h j ( t ) ,
where A ^ i j ( t ) denotes the probability of a relationship between nodes i and j, and W is a learnable parameter matrix.
The predicted adjacency matrix A ^ ( t ) is used to update the current graph structure iteratively:
G ( t + 1 ) = Update G ( t ) , A ^ ( t ) ,
where Update ( · ) integrates predicted edges into the graph. The process continues until convergence, yielding a globally consistent room relationship graph.
To ensure geometric validity and architectural plausibility, the final objective combines relation prediction loss with constraint-aware regularization:
L = L r e l + λ · L c o n s ,
where L r e l supervises edge prediction accuracy, and L c o n s penalizes violations

3.3. Conditional Graph Discriminator with Wasserstein Loss

To enforce global consistency in the generated layouts, we introduce a conditional graph discriminator that evaluates the plausibility of predicted room relationship graphs under architectural constraints. The discriminator takes both the generated graph G g e n and conditioning information c as input, and outputs a scalar score indicating layout realism:
D : ( G , c ) R .
Following the Wasserstein GAN framework, the discriminator is optimized using the Wasserstein loss with gradient penalty:
L D = E G g e n [ D ( G g e n , c ) ] E G r e a l [ D ( G r e a l , c ) ] + λ g p E G ^ [ ( G ^ D ( G ^ , c ) 2 1 ) 2 ] ,
where G r e a l denotes the ground-truth graph, and G ^ is a linear interpolation between G g e n and G r e a l .
The generator is trained to minimize
L G = E G g e n [ D ( G g e n , c ) ] + α · L c o n s ,
where L c o n s incorporates architectural constraints. By combining the conditional discriminator with Wasserstein loss, the model imposes a global consistency constraint, ensuring that the generated layouts achieve realistic spatial connectivity and structural rationality comparable to real architectural designs.

4. Methodology

4.1. Graph-RWGAN Network Framework

The framework of the proposed Graph-RWGAN (Graph Relation Wasserstein GAN), illustrated in Figure 1, is designed to generate reasonable and globally consistent house layouts under weak constraints. To address the limitations of existing methods—such as disordered room placement, lack of iterative refinement, and limited style diversity—this framework consists of three key components: a Multi-Relational Graph Attention module (MR-GAT) [27], an iterative prediction generator, and a conditional graph discriminator.
MR-GAT captures complex multi-relational information between room nodes and learns structural and functional associations through graph attention, providing fine-grained relational representations for layout generation. Building on the attention-encoded graph features, the iterative prediction generator progressively infers the complete room relationship graph, effectively fusing node features with architectural boundary information to produce accurate layouts. It also supports iterative refinement to resolve potential conflicts and improve layout rationality.
The conditional graph discriminator, combined with Wasserstein loss, enforces global consistency constraints on the generated layouts, ensuring spatial connectivity and layout plausibility close to real designs, while enhancing the stability of the generation process and the diversity of layout styles. In practice, given room attributes and partial edge constraints, MR-GAT first encodes node features and relational information, then the iterative prediction generator infers the complete room relationship graph and generates a layout, and finally the conditional graph discriminator performs adversarial training to enforce global consistency. The resulting output is a coherent and realistic house layout under weak constraints. This framework not only improves layout rationality and structural coherence but also significantly enhances style diversity and controllability, providing an efficient, flexible, and adaptable solution for intelligent architectural design and automated planning.

4.2. Relationship Prediction Module

We define the constraint relation graph as G = ( O , E ) , where O = { o 1 , , o N } is the set of room objects, each encoded as a 128-dimensional feature vector, and E represents the relations between room pairs. The adjacency tensor A { 0 , 1 } N × N × M encodes M = 3 edge types (including connections), with self-connections set as A i i m = 1 .
The network input consists of initial room features X = { x i } and adjacency matrix A. The relation prediction module F r e l is a three-layer MLP (64-16-1) that predicts door and wall connection probabilities, denoted as p i j d o o r and p i j w a l l . The overall connection probability between nodes i and j at iteration k is computed as follows:
P i j ( k ) = p i j d o o r + p i j w a l l = σ F r e l ( h i ( k ) , h j ( k ) ) ,
where h i ( k ) is the embedding of node i at iteration k, and σ denotes the sigmoid function.
The adjacency matrix is then updated iteratively:
A i j ( k + 1 ) = 1 , P i j ( k ) τ , 0 , otherwise ,
where τ is a predefined threshold, and self-connections are preserved.
This iterative procedure allows the generator to progressively refine the room relation graph, effectively integrating node features and architectural boundary information to produce accurate house layouts under weak constraints.

4.3. Multi-Relation Graph Attention Module

As shown in Figure 2, the Multi-Relational Graph Attention (MR-GAT) module captures complex relationships between room nodes by adaptively learning attention weights.
The Multi-Relational Graph Attention (MR-GAT) module captures complex relationships between room nodes by adaptively learning attention weights. The constraint graph is decomposed into single-relation subgraphs. For each node i, multi-head attention evaluates the importance of neighbors j N i r under relation r and captures contextual attributes:
q j r = K r o j , k j r = Q r o j ,
α i j r = softmax j ( q j r ) k i r F , j N i r ,
y i r = j N i r α i j r W r o j ,
y i r = W m concat ( y i r 1 , , y i r m ) ,
where Q r , K r , and W r are learnable matrices, and W m projects concatenated vectors back to the original feature dimension D. Relation-specific weights β r adjust the contribution of each relation:
A ˜ r = β r · Attention ( A r ) ,
h i = σ r j N i r A ˜ i j r W o o j ,
where W o is learnable, and σ is an activation function. This mechanism enables MR-GAT to effectively integrate information from multiple relation types while distinguishing key neighbors under different relational contexts.

4.4. Layout Generation Module

The layout generation module consists of two parts. The first part fuses architectural boundary features from a CNN with node features from the graph network to generate boundary box layouts [27]. The second part uses two decoders, similar to the relation prediction module, to predict door and wall connectivity, combining them to compute the connection probability between nodes:
P i j r , ( k ) = f decoder ( h i ( k ) , h i ( 0 ) , A ) ,
where h i ( 0 ) preserves initial node information, and f decoder is the decoding network for relation r.
Binary cross-entropy losses L door , L wall , and L con are applied for door, wall, and overall connectivity, respectively. The total prediction loss is
L pred = k = 1 K r { door , wall , con } λ r L r ( k ) ,
and the overall network loss combines this with the original loss L org :
L total = L org + L pred .
Node features are updated via multi-relation graph attention:
h i ( k + 1 ) = σ r j N i r α i j r W r o j ,
where α i j r refers to attention coefficients and W r to learnable weights. The attention-weighted adjacency matrix is the following:
A ˜ r = r β r A r W r ,
enabling effective aggregation of multi-relation information for accurate layout generation.

4.5. Conditional Graph Discriminator with Wasserstein Loss

The discriminator integrates a Multi-Relational Graph Attention (MR-GAT) module before the Conv-MPN layer to capture node features connected by different relations, allowing it to evaluate both layout realism and room connectivity. Let h i be node features and A the adjacency matrix from real data. MR-GAT updates node features as follows:
h i = σ r j N i r α i j r W r h j , A ˜ r = r β r A r W r ,
where α i j r denotes attention coefficients, and W r denotes learnable weights. The updated features h i are fused with the boundary layout B:
x in = Flatten ( [ h 1 , , h N , B ] ) , x feat = W lin x in R 8192 ,
with W lin as a linear layer. The Conv-MPN layers then process x feat , and the discriminator loss is as follows:
L D = E [ D ( x real ) ] E [ D ( x fake ) ] ,
ensuring both global layout consistency and correct inter-room connections, while the generator is trained to minimize the adversarial loss:
L G = E [ D ( x fake ) ] + λ pred L pred ,
where L pred is the relation prediction loss, and λ pred is a weighting factor. This formulation ensures that the generated layouts not only maintain global structural consistency but also preserve accurate room adjacency and connectivity, closely aligning with real design standards.

4.6. User Input and Weak Constraint Specification

To clarify how users interact with the proposed system, we define the concept of weak constraints and describe the minimum input requirements. In our framework, weak constraints refer to high-level and flexible specifications provided by users rather than precise geometric parameters. These typically include the number and types of rooms, approximate area ratios, and optional adjacency preferences. Such constraints allow users to express design intentions without detailed architectural drawings. Formally, let the input constraint set be denoted as follows:
C = { c i c i C , i = 1 , 2 , , N } ,
where each c i represents a soft constraint describing a semantic or spatial relationship (e.g., room type, size, or adjacency). Unlike hard constraints that must be strictly satisfied, weak constraints are incorporated into the optimization objective as penalty terms or probabilistic priors.
L * = arg max L P ( L C ) = arg max L exp ( L gen ( L , C ) ) ,
where L gen denotes the generation loss, balancing structural consistency and constraint satisfaction. The minimum required input consists of a list of functional rooms and their rough size proportions. Based on these inputs, the system automatically infers reasonable spatial relationships and generates coherent layouts that satisfy the given constraints. Non-expert users can interact with the model using intuitive parameters, while professional architects can optionally provide more detailed spatial or relational hints to refine the design.

5. Experimental Setup

5.1. Dataset Introduction

The dataset used in this study is the real-world large-scale architectural floor plan dataset RPLAN, which serves as a benchmark for house layout generation. Figure 3 illustrates a few sample cases from the RPLAN dataset [28], showing the annotated room types and the locations of doors, windows, and walls. There are nine room types in total: master bedroom, secondary bedroom, living room, balcony, bathroom, kitchen, storage room, study, and dining room. These visualizations are only intended to provide readers with an understanding of the dataset and its typical layouts, rather than representing outputs of our model.

5.2. Experimental Environment

To evaluate whether the proposed algorithm can generate reasonable and realistic layout designs under weak constraints, this section compares both quantitative and qualitative results on the RPLAN dataset against several popular methods, including House-GAN [29], LayoutGAN [30], MR-GAT [31], and LayoutDiffusion [32].
The model is implemented using the deep learning framework PyTorch 2.1.0, with experiments conducted on an Ubuntu 16.04 operating system. The model is optimized using the Adam optimizer with a learning rate of 0.0001 and a batch size of 32. Training and evaluation are conducted on the RPLAN dataset, producing layout images at a resolution of 256 × 256 pixels. The hyperparameters α and β are empirically set to 0.9 and 0.7, respectively, based on experimental calibration.
During fine-tuning, key hyperparameters such as learning rate, batch size, and loss weight coefficients are slightly adjusted within small ranges to maintain stable convergence and balance between reconstruction accuracy and visual realism. When adapting the model to different building types or scales, only lightweight fine-tuning of the decoder and relational reasoning modules is required, while the graph encoder remains largely fixed. All other settings and configurations remain consistent with the original model design described in the paper.

5.3. Evaluation Indicators

When generating house layouts with deep learning, researchers typically evaluate their methods using both qualitative and quantitative assessments. Qualitative evaluation relies on domain experts subjectively judging layout realism, which can vary due to individual perception. To objectively evaluate the results, we employ three quantitative metrics: Frechet Inception Distance (FID) to assess visual fidelity, Structural Similarity Index (SSIM) to measure structural consistency, and Inception Score (IS) to capture layout diversity and clarity.
(1) Frechet Inception Distance.
The Frechet Inception Distance (FID) evaluates the difference between feature distributions of real and generated images, reflecting the visual quality. Lower values indicate higher fidelity. It can be expressed as follows:
FID = μ real μ gen 2 2 + Tr Σ real + Σ gen 2 ( Σ real Σ gen ) 1 / 2
where μ real and μ gen are the mean feature vectors of real and generated images, Σ real and Σ gen are the corresponding covariance matrices, and Tr ( · ) denotes the matrix trace.
(2) Structural Similarity Index.
The Structural Similarity Index (SSIM) is widely used to evaluate the perceptual similarity between two images. In this study, it quantifies how well the generated layouts preserve spatial consistency between rooms or between rooms and building boundaries. An alternative formulation of SSIM can be expressed as follows:
SSIM ( x , y ) = 1 ( l ( x ) l ( y ) ) 2 + ϵ l σ l + ϵ l · ( c ( x ) c ( y ) ) 2 + ϵ c σ c + ϵ c · ( s ( x ) s ( y ) ) 2 + ϵ s σ s + ϵ s
where l ( x ) and l ( y ) denote the average luminance of images x and y; c ( x ) and c ( y ) represent the local contrast; s ( x ) and s ( y ) represent the structural information; σ l , σ c , and σ s are normalization constants; and ϵ l , ϵ c , and ϵ s are small constants added for numerical stability. This formulation preserves the essence of SSIM by combining luminance, contrast, and structure similarity into a single score.
(3) Inception Score.
The Inception Score measures the quality and diversity of generated images. It uses a pretrained classifier to assess how confidently each image can be classified and how diverse the overall set of generated samples is. The IS is defined as
IS = exp ( E x G D KL ( p c ( y | x ) p m ( y ) ) )
where x G denotes a sample drawn from the generator, p c ( y | x ) is the conditional class probability predicted by the classifier, and p m ( y ) = E x G [ p c ( y | x ) ] represents the marginal distribution across all generated samples.
(4) Layout Element Classification Accuracy.
Acc   ( % ) = N correct N total × 100
where N correct is the number of correctly classified elements in the generated layout, and N total is the total number of elements in the layout.
(5) Room Adjacency Score.
Room Adjacency Score = 1 N pairs i , j 1 { ( r i , r j ) A valid } ,
where N pairs is the total number of room pairs in the layout, r i and r j are rooms in the layout, and A valid is the set of valid room adjacency pairs based on architectural logic. 1 { · } is an indicator function that returns 1 when the room pair ( r i , r j ) is valid, and 0 otherwise.

6. Evaluation and Analysis

6.1. Preprocessing of Data

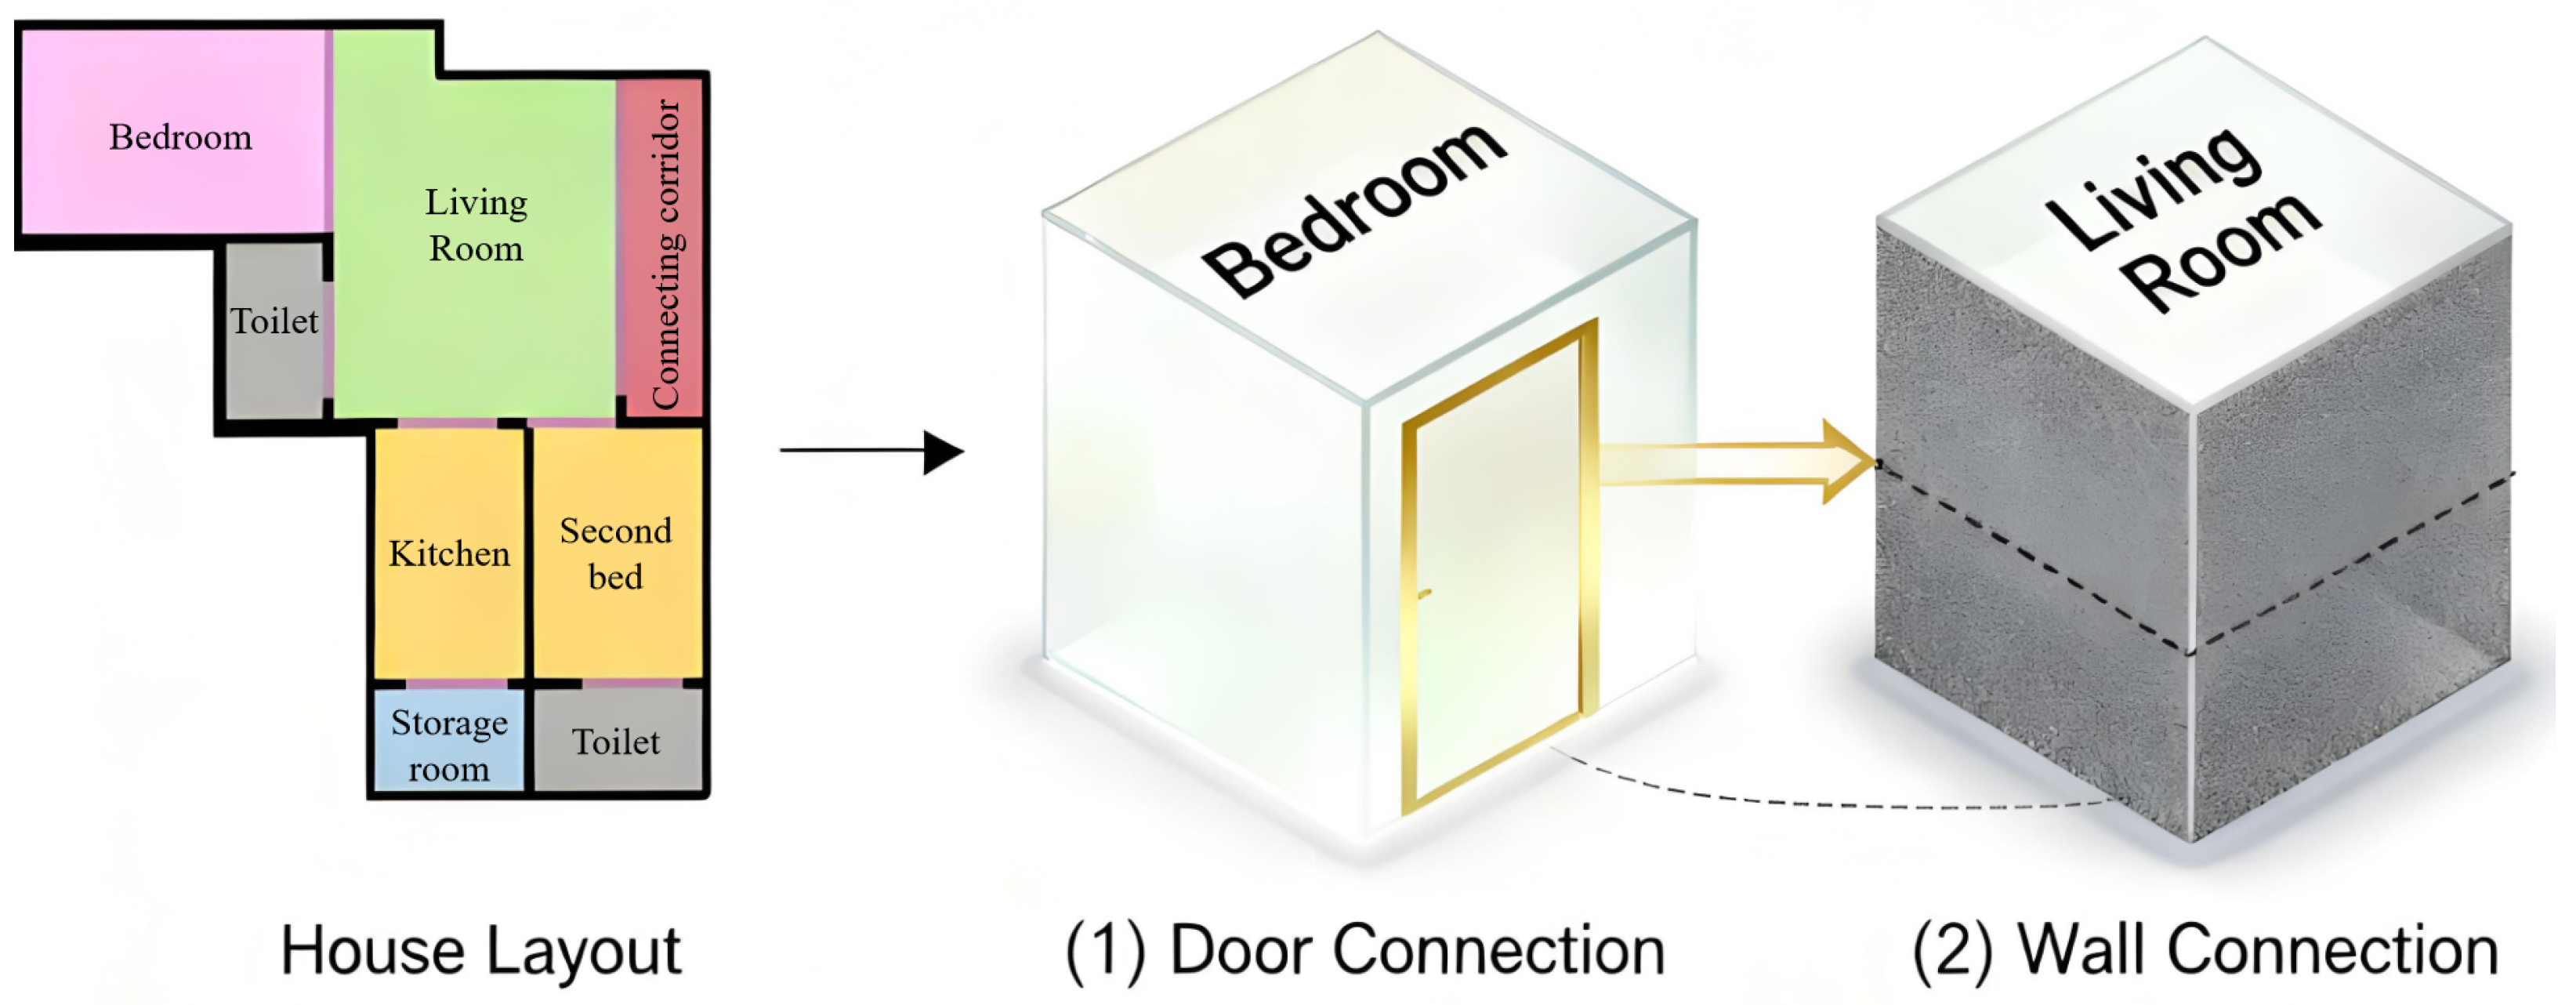
In this approach, the dataset is initially represented as a constraint graph, where nodes correspond to individual rooms, and edges denote their spatial relationships. Each node is annotated with attributes that describe the room’s characteristics, including type, functional properties, and other relevant semantic information. As illustrated in Figure 4, the edges are defined based on adjacency relationships rather than exact spatial orientations, emphasizing the connectivity between rooms rather than their precise geometric positions.
Figure 4 shows the diagram of edge relationships in the dataset-preprocessing stage. To facilitate a clearer understanding, we distinguish three types of edges:
  • Door connections: These edges represent rooms that are directly accessible via a door, allowing for movement or functional interaction between the spaces.
  • Wall connections: These edges signify rooms that share a common wall, indicating a physical separation that prevents direct spatial flow between them but still establishes a structural connection.
  • General connections: This category encompasses both door and wall connections, representing broader neighborhood relationships between rooms that might not necessarily require direct access but still form part of the layout’s overall connectivity.
The graph-based representation thus encodes important structural and functional constraints of the environment. By focusing on connectivity—rather than precise geometrical positioning—the model effectively captures the relationships between rooms, ensuring that the spatial structure aligns with real-world architectural principles. This representation allows for efficient reasoning and analysis in the subsequent layout generation process.
A door connection indicates that two rooms are spatially accessible through a doorway, promoting interaction or movement between them. On the other hand, a wall connection reflects a barrier between two rooms, restricting direct spatial flow but still establishing a functional boundary. Both types of connections, along with the general connections, form the basis for modeling spatial constraints and relationships, enabling the model to produce layouts that respect the necessary functional and structural requirements.

6.2. Experimental Results

On the RPLAN test set, Graph-RWGAN outperforms House-GAN [29], LayoutGAN [30], and MR-GAT [31] across all metrics. Compared to House-GAN, Graph-RWGAN achieves a 15.14% reduction in FID, a 5.6% increase in SSIM, and a 5.68% improvement in Acc. In terms of Inception Score (IS), Graph-RWGAN also shows a superior performance with an increase of 9.47% compared to House-GAN. When compared to MR-GAT, Graph-RWGAN reduces FID by 5.24%, increases SSIM by 1.85%, and improves Acc by 4.36%. Additionally, Graph-RWGAN outperforms both House-GAN and MR-GAT in the Room Adjacency Score, reflecting a better capture of the spatial relationships and architectural consistency in the generated layouts. These results demonstrate that Graph-RWGAN better models room relationships under weak constraints, producing layouts with higher quality and greater structural coherence. The detailed values are provided in Table 1.
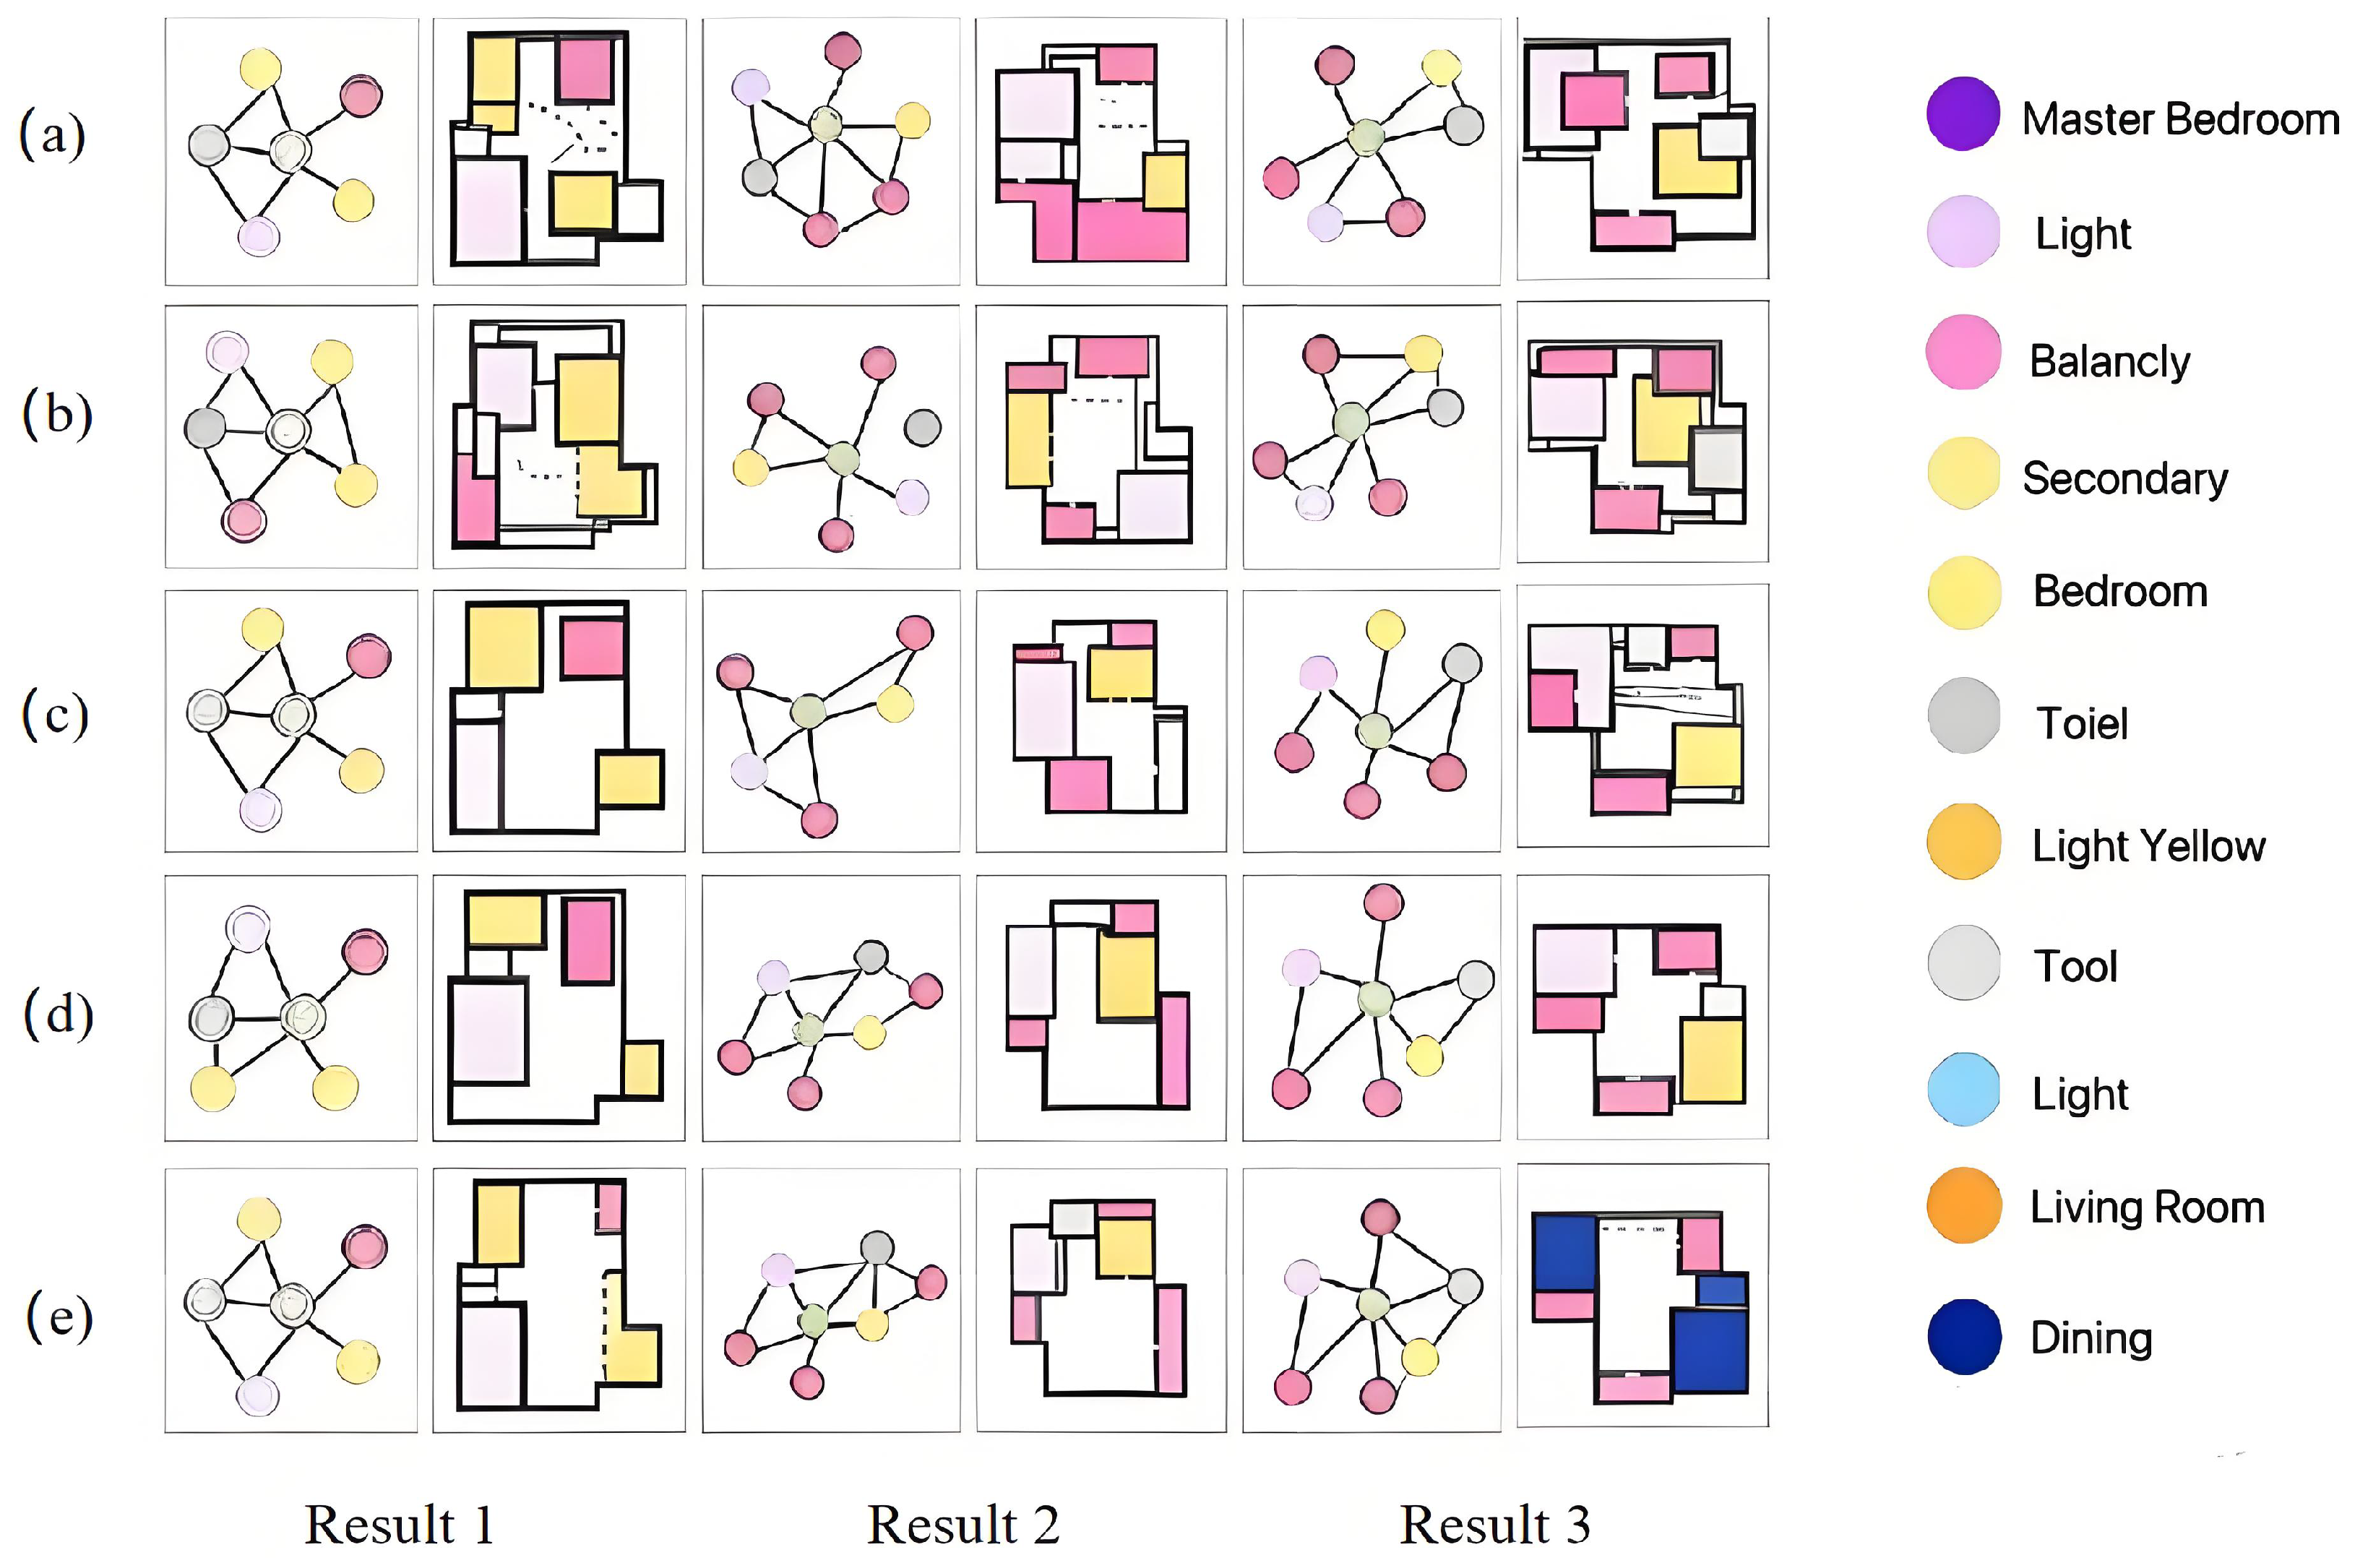
Figure 5 compares house layout generation results from various models: (a) House-GAN, (b) LayoutGAN, (c) MR-GAT, (d) Ground Truth, and (e) Graph-RWGAN. The results are organized into three horizontal sets, each corresponding to the same incomplete graph input scenario, and each set is divided into “graph structure” and “layout” sections. The figure aims to show how different models transform structural graph information into spatial layouts, helping readers understand the generation process.
The graph structure section illustrates room topology using nodes and edges of different colors, representing spatial or functional relationships. Nodes correspond to rooms, and edges encode connectivity, adjacency, or other functional associations. The graph captures relational structure but not precise positions or sizes, so a single graph can correspond to multiple plausible layouts.
The layout section translates the graph into a specific geometric arrangement, with each room type represented by colored squares. The model infers numeric parameters such as room sizes and positions to generate a unique layout consistent with the graph. The legend maps colors to room types. This visualization enables side-by-side comparison, highlighting differences in room relationships, layout fidelity, and structural coherence across models.
Table 2 presents a quantitative comparison of the performance of four models—House-GAN, LayoutGAN, MR-GAT, and Graph-RWGAN—across three evaluation criteria: Room Topology Accuracy, Layout Quality, and Structural Coherence. These criteria are rated on a percentage scale from 0% to 100%, with higher percentages indicating better performance. House-GAN scores 60% in Room Topology Accuracy, meaning it captures the general spatial relationships between rooms, but with some inaccuracies. Its Layout Quality is 70%, suggesting that the generated layouts are functional but could benefit from further optimization. The Structural Coherence score of 65% indicates that the relationships between rooms are somewhat coherent, though there are noticeable inconsistencies.
LayoutGAN performs relatively poorly across all metrics, scoring 45% in Room Topology Accuracy, indicating difficulty in modeling room relationships. Its Layout Quality score is 50%, showing that the generated layouts are of low quality, and the Structural Coherence score of 55% suggests weak structural relationships, resulting in less coherent overall layouts. MR-GAT performs better, achieving 75% in Room Topology Accuracy, reflecting a moderate ability to capture room relationships. It earns 85% for Layout Quality, signifying high-quality, space-efficient layouts, and 80% for Structural Coherence, indicating that the layouts are logically consistent, though not flawless. Finally, Graph-RWGAN outperforms all other models, with a 95% in Room Topology Accuracy, demonstrating its superior ability to model spatial relationships. Its Layout Quality score of 90% indicates that the layouts are highly functional and well-organized, while the Structural Coherence score of 95% reflects strong internal consistency and logical room relationships, making it the most reliable model for generating realistic house layouts.
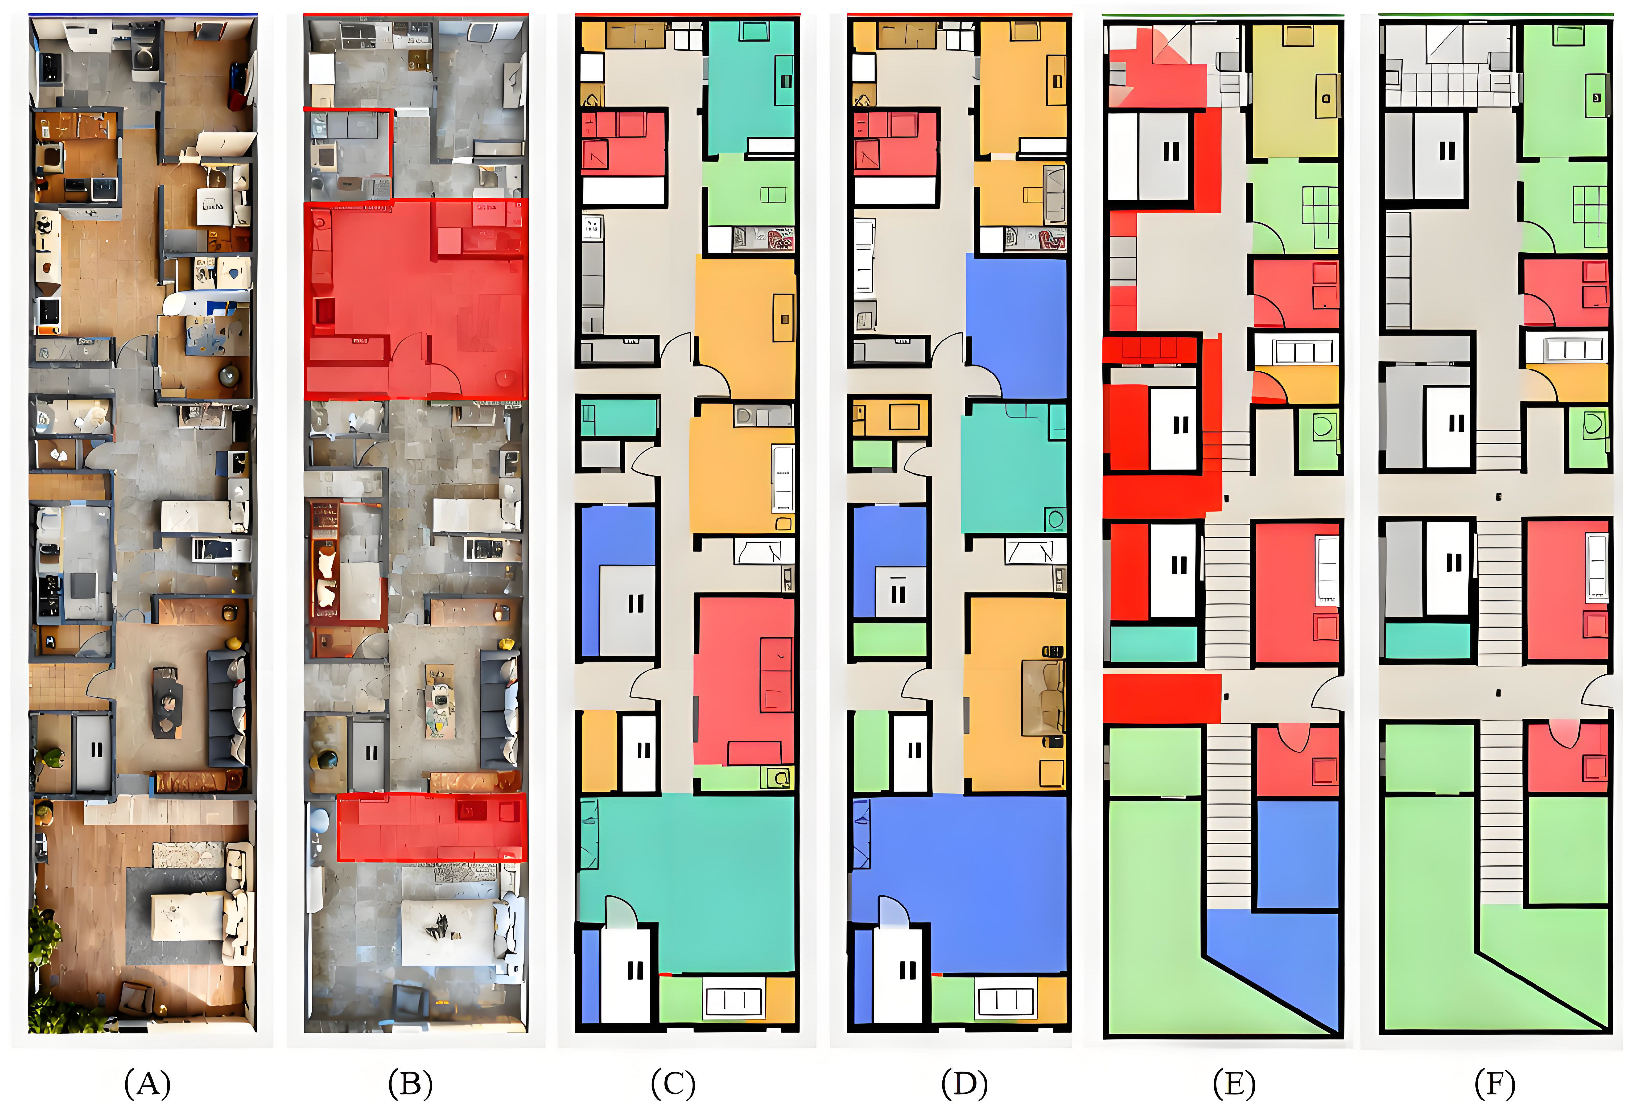
As shown in Figure 6, where (A) represents the ground truth, (B) is generated by MA-GAN, (C) by MR-GAN, (D) by House-GAN, (E) by LayoutDiffusion, and (F) by our method. The layouts produced by both (E) and (F) align closely with the ground truth. However, while LayoutDiffusion (E) generates reasonable layouts, it does not produce a complete image, resulting in some missing details. In contrast, our method (F) not only preserves the overall spatial organization but also captures the detailed relationships among functional areas more accurately, producing fully realized and visually coherent layouts.
Technically, the advantage of our method lies in its precise modeling of spatial relationships, effectively capturing the topological constraints between regions. Through structural optimization and tailored loss functions, our approach enhances the generation of fine-grained details. Additionally, multi-scale feature fusion ensures coherence between local and global layouts. Collectively, these improvements enable our method to produce building layouts that are both more accurate and visually realistic compared to all baseline methods, including LayoutDiffusion.
Table 3 compares different methods on IoU, Position Error, Structural Consistency, and Visual Realism. Our method achieves the best performance across all metrics: IoU reaches 85.6%, which is 14.4% higher than the best baseline (House-GAN). Position Error is reduced to 5.2, nearly half of House-GAN’s 10.3, showing superior accuracy in spatial alignment and object localization.
For Structural Consistency and Visual Realism, our method attains 0.92 and 0.95, outperforming most other methods. LayoutDiffusion achieves slightly higher Visual Realism (0.96), but its overall performance is still below that of our approach. These results indicate that our method provides the best balance between geometric fidelity and perceptual quality, maintaining high structural consistency while generating realistic and visually appealing outputs.

6.3. Ablation Study

In this section, we perform an ablation study to assess the impact of each major component in the Graph-RWGAN model. By selectively disabling or removing specific modules, we examine how these changes influence the model’s overall performance [33]. Specifically, we investigate the effects of omitting:
  • Iterative Learning Mechanism: This mechanism allows the model to progressively improve its predictions over time. By disabling this component, we observe a significant decrease in the model’s ability to predict unknown relationships, as reflected in lower accuracy and poorer layout generation quality.
  • Relation Prediction Module: This module plays a crucial role in predicting spatial relationships between rooms. Without it, the model’s accuracy decreases, indicating the importance of precise relationship prediction for generating realistic and coherent layouts.
  • Multi-Relation Graph Attention Module: This module consolidates information from multiple edge relationship types, improving the model’s capacity to capture intricate spatial dependencies. Its removal results in noticeable performance drops, especially in terms of structural consistency and the accuracy of room topology.
In Table 4, we compare the full model (Graph-RWGAN) with versions where one of the components has been removed. The analysis demonstrates that each module plays an essential role in the model’s overall performance. Removing any of them results in a noticeable decrease in both layout quality and structural consistency.
Table 4 presents the results of the ablation study on the RPLAN dataset, evaluating the contributions of the iterative learning mechanism, the relation prediction module, and the multi-relation graph attention module. When the iterative learning mechanism is removed, the accuracy (Acc) drops significantly, and both FID and SSIM decrease. Specifically, the accuracy decreases to 74.17%, while FID increases to 112.87, and SSIM drops to 0.729. This indicates that iterative learning allows the network to progessively capture more structural and semantic information from the input graph, which is essential for generating coherent and high-quality layouts.
Removing the relation prediction module, which effectively eliminates the prediction loss, leads to a further reduction in prediction accuracy. The accuracy decreases to 72.67%, FID rises to 98.49, and SSIM drops to 0.752, highlighting the critical role of the relation prediction module in modeling accurate edge relationships between rooms. Excluding the multi-relation graph attention module results in additional performance degradation, with an accuracy of 69.29%, FID increasing to 109.15, and SSIM decreasing to 0.693. This demonstrates its effectiveness in aggregating information from different types of edge relationships. Overall, the complete Graph-RWGAN model, which integrates all three components, achieves the best performance across all metrics, with an accuracy of 85.96%, FID of 92.73, and SSIM of 0.828, confirming the complementary nature and importance of these modules in improving layout prediction and visual quality.

6.4. Runtime and Efficiency Evaluation

In layout generation tasks, runtime efficiency is as important as the quality of generated layouts, especially for real-time applications or large-scale data processing, where efficiency and resource consumption are critical. In this evaluation, we compare the efficiency of different models in terms of runtime, memory consumption, and inference speed.
We first compare the computational time required for different models to generate the same layout. Graph-RWGAN performs the best overall, with an average generation time of 1.2 s. LayoutDiffusion requires 1.5 s per layout, slightly slower than Graph-RWGAN but faster than MA-GAN (1.8 s), MR-GAT (2.0 s), House-GAN (2.4 s), and LayoutGAN (3.1 s). This efficiency advantage of Graph-RWGAN is due to its more optimized structure and graph processing capabilities.
In terms of memory usage, LayoutDiffusion consumes 2.0 GB, slightly lower than Graph-RWGAN’s 2.1 GB, indicating better memory efficiency for certain tasks. MA-GAN and MR-GAT consume 2.3 GB and 2.5 GB, respectively, while House-GAN and LayoutGAN require 3.5 GB and 4.2 GB. For inference speed, Graph-RWGAN remains superior, generating layouts in 0.8 s compared to LayoutDiffusion’s 0.9 s, MA-GAN’s 1.0 s, and MR-GAT’s 1.2 s.
When testing large-scale data processing, Graph-RWGAN successfully generates 1000 layouts in 20 min. LayoutDiffusion requires 22 min, MA-GAN 25 min, and MR-GAT 28 min. Although LayoutDiffusion shows some advantages in memory consumption, its overall runtime and efficiency are still slightly behind Graph-RWGAN. The detailed results are presented in Table 5.
Overall, Graph-RWGAN demonstrates superior efficiency in all key areas, including computation time, memory consumption, and inference speed, making it ideal for real-time applications and large-scale data processing tasks. This efficiency allows it to deliver high-quality layouts while consuming fewer computational resources, providing a significant advantage over other models.

7. Conclusions

Graph-RWGAN (Graph Relation Wasserstein GAN) addresses key limitations of existing house layout generation methods, including disordered room arrangements, limited iterative refinement, and low style diversity. It leverages a multi-relational graph attention module, an iterative prediction generator, node-boundary feature fusion, and a conditional graph discriminator with Wasserstein loss to produce layouts with high structural coherence, accurate room connectivity, and diverse styles under weak constraints. While reliance on predefined graph representations may reduce flexibility for highly irregular layouts, and iterative graph inference can increase computational cost, Graph-RWGAN remains a robust and controllable framework, achieving significant improvements over previous methods.
Future research may focus on enhancing the local editability of generated layouts and enabling user interaction, allowing users to make fine-grained adjustments and personalized modifications during the generation process. Additionally, integrating more practical design constraints, such as lighting, ventilation, and furniture placement, could achieve multi-dimensional optimization closer to real-world architectural design. Furthermore, incorporating multi-objective generation and style transfer techniques may enrich layout styles and improve creativity, providing a more flexible, efficient, and controllable generative framework for intelligent building design and automated planning.

Author Contributions

Conceptualization, Z.Y. and J.C.; methodology, J.C.; software, J.C.; validation, Z.Y. and J.C.; formal analysis, Z.Y.; investigation, J.C.; resources, Z.Y.; data curation, Z.Y. and J.C.; writing—original draft, Z.Y., S.L., Z.T., Y.C., L.Z. and J.C.; writing—review and editing, Z.Y., S.L., Z.T., Y.C., L.Z. and J.C.; visualization, J.C.; supervision, Z.Y. and J.C.; project administration, J.C.; funding acquisition, J.C. All authors have read and agreed to the published version of the manuscript.

Funding

This research work are funded by Guangdong Provincial Education Science Planning Project (Higher Education Scientific Research Project): Research on Multisensory Communication of Animation in the Construction of Aesthetic Education in the Greater Bay Area (2021GXJK470); And the project FRG-25-064-FA and granted by the Research Fund of Macao University of Science and Technology (FRG-MUST).

Data Availability Statement

The original data presented in the study are openly available in ACM Digital Library at https://doi.org/10.1145/3528223.3530135.

Conflicts of Interest

The authors declare no conflicts of interest.

References

  1. Zhao, Y.; Dong, J.; Wang, W.; Duan, H. A multi-typed multi-relational heterogeneous graph neural network model for complex networks. Knowl.-Based Syst. 2025, 329, 114291. [Google Scholar] [CrossRef]
  2. Ai, W.; Liu, Y.; Wei, C.; Meng, T.; Shao, H.; He, Z.; Li, K. MFLM-GCN: Multi-Relation Fusion and Latent-Relation Mining Graph Convolutional Network for Entity Alignment. Knowl.-Based Syst. 2025, 325, 113974. [Google Scholar] [CrossRef]
  3. Shakeel, H.M.; Iram, S.; Farid, H.M.A.; Hill, R.; Rehman, H. EPCDescriptor: A Multi-Attribute Visual Network Modeling of Housing Energy Performance. Buildings 2025, 15, 2929. [Google Scholar] [CrossRef]
  4. Wang, F.; Liu, X.; Li, W.; Tian, W.; Jia, Z.; Ran, C. MRGCE: A Multi-Relational Graph Contrastive Enhancement Learning Framework for High-Value Patent Identification. Scientometrics 2025, 130, 10. [Google Scholar] [CrossRef]
  5. Li, W.; Gao, Y.; Li, A.; Zhang, X.; Gu, J.; Liu, J. Sparse Subgraph Prediction Based on Adaptive Attention. Appl. Sci. 2023, 13, 8166. [Google Scholar] [CrossRef]
  6. Zhou, X.; Zeng, Y.; Hao, Z.; Wang, H. A Robust Graph Attention Network with Dynamic Adjusted Graph. Eng. Appl. Artif. Intell. 2024, 129, 107619. [Google Scholar] [CrossRef]
  7. Yin, H.; Zhong, J.; Wang, C.; Li, R.; Li, X. GS-InGAT: An Interaction Graph Attention Network with Global Semantic for Knowledge Graph Completion. Expert Syst. Appl. 2023, 228, 120380. [Google Scholar] [CrossRef]
  8. Li, J.; Yang, J.; Zhang, J.; Liu, C.; Wang, C.; Xu, T. Attribute-Conditioned Layout GAN for Automatic Graphic Design. IEEE Trans. Vis. Comput. Graph. 2020, 27, 4039–4048. [Google Scholar] [CrossRef]
  9. Wang, S.; Zeng, W.; Chen, X.; Ye, Y.; Qiao, Y.; Fu, C.-W. ActFloor-GAN: Activity-Guided Adversarial Networks for Human-Centric Floorplan Design. IEEE Trans. Vis. Comput. Graph. 2021, 29, 1610–1624. [Google Scholar] [CrossRef]
  10. Zhou, Y.; Xia, H.; Yu, D.; Cheng, J.; Li, J. Outlier detection method based on high-density iteration. Inf. Sci. 2024, 662, 120286. [Google Scholar] [CrossRef]
  11. Ong, Y.Z.; Zheng, L.; Feng, C.; Song, K. VG-GAN: Conditional GAN Framework for Graphical Design Generation. In Proceedings of the 2022 IEEE International Conference on Image Processing (ICIP), Bordeaux, France, 16–19 October 2022; IEEE: Piscataway, NJ, USA, 2022; pp. 781–785. [Google Scholar]
  12. Johnson, J.; Gupta, A.; Li, F.-F. Image Generation from Scene Graphs. In Proceedings of the IEEE Conference on Computer Vision and Pattern Recognition, Salt Lake City, UT, USA, 18–23 June 2018; IEEE: Piscataway, NJ, USA, 2018; pp. 1219–1228. [Google Scholar]
  13. Nauata, N.; Chang, K.H.; Cheng, C.Y.; Mori, G.; Furukawa, Y. House-GAN: Relational Generative Adversarial Networks for Graph-Constrained House Layout Generation. In Proceedings of the Computer Vision–ECCV 2020: 16th European Conference, Glasgow, UK, 23–28 August 2020; Part I. Springer International Publishing: Berlin/Heidelberg, Germany, 2020; pp. 162–177. [Google Scholar]
  14. Yao, S.; Guan, R.; Wu, Z.; Ni, Y.; Huang, Z.; Liu, R.W.; Yue, Y.; Ding, W.; Lim, E.G.; Seo, H.; et al. Waterscenes: A multi-task 4D radar-camera fusion dataset and benchmarks for autonomous driving on water surfaces. IEEE Trans. Intell. Transp. Syst. 2024, 25, 16584–16598. [Google Scholar] [CrossRef]
  15. Chang, K.H.; Cheng, C.Y.; Luo, J.; Murata, S.; Nourbakhsh, M.; Tsuji, Y. Building-GAN: Graph-Conditioned Architectural Volumetric Design Generation. In Proceedings of the IEEE/CVF International Conference on Computer Vision, Montreal, QC, Canada, 10–17 October 2021; pp. 11956–11965. [Google Scholar]
  16. Pan, X.; Song, S.; Chen, Y.; Wang, L.; Huang, G. PLAM: A Plug-in Module for Flexible Graph Attention Learning. Neurocomputing 2022, 480, 76–88. [Google Scholar] [CrossRef]
  17. Pan, T.; Zhang, L.; Song, Y.; Liu, Y. Hybrid Attention Compression Network With Light Graph Attention Module for Remote Sensing Images. IEEE Geosci. Remote Sens. Lett. 2023, 20, 6005605. [Google Scholar] [CrossRef]
  18. Feng, Z.; Li, Y.; Chen, W.; Su, X.; Chen, J.; Li, J.; Liu, H.; Li, S. Infrared and Visible Image Fusion Based on Improved Latent Low-Rank and Unsharp Masks. Spectrosc. Spectr. Anal. 2025, 45, 2034–2044. [Google Scholar]
  19. Wu, Y.; Wang, G.; Wang, Z.; Wang, H.; Li, Y. Triplet Attention Fusion Module: A Concise and Efficient Channel Attention Module for Medical Image Segmentation. Biomed. Signal Process. Control 2023, 82, 104515. [Google Scholar] [CrossRef]
  20. Carneiro, P.M.R.; Vidal, J.V.; Rolo, P.; Peres, I.; Ferreira, J.A.F.; Kholkin, A.L.; Soares dos Santos, M.P. Instrumented Electromagnetic Generator: Optimized Performance by Automatic Self-Adaptation of the Generator Structure. Mech. Syst. Signal Process. 2022, 171, 108898. [Google Scholar] [CrossRef]
  21. Du, J.; Li, B.; Yang, J. Boundary-aware Graph Convolutional Network for Building Roof Detection from High-Resolution Remote Sensed Imagery. PFG J. Photogramm. Remote Sens. Geoinf. Sci. 2025, 93, 443–455. [Google Scholar] [CrossRef]
  22. Li, Q.; Sun, X.; Dong, J. Transductive zero-shot learning via knowledge graph and graph convolutional networks. Sci. Rep. 2025, 15, 28708. [Google Scholar] [CrossRef]
  23. Liu, H.; Li, D.; Zeng, B.; Xu, Y. Learning discriminative features for multi-hop knowledge graph reasoning. Appl. Intell. 2025, 55, 468. [Google Scholar] [CrossRef]
  24. Wen, X.; Yang, X.-H.; Ma, G.-F. ConDiff: Conditional graph diffusion model for recommendation. Inf. Process. Manag. 2026, 63, 104303. [Google Scholar] [CrossRef]
  25. Hu, R.; Huang, Z.; Tang, Y.; van Kaick, O.; Zhang, H.; Huang, H. Graph2Plan: Learning Floorplan Generation from Layout Graphs. arXiv 2020, arXiv:2004.13204. [Google Scholar] [CrossRef]
  26. Wang, Z.; Fang, X.; Zhang, W.; Ding, X.; Wang, L.; Chen, C. Multi-relation spatiotemporal graph residual network model with multi-level feature attention: A novel approach for landslide displacement prediction. J. Rock Mech. Geotech. Eng. 2025, 17, 4211–4226. [Google Scholar] [CrossRef]
  27. Nauata, N.; Hosseini, S.; Chang, K.-H.; Chu, H.; Cheng, C.-Y.; Furukawa, Y. House-GAN++: Generative Adversarial Layout Refinement Networks. arXiv 2021, arXiv:2103.02574. [Google Scholar]
  28. Wu, W.; Fu, X.-M.; Tang, R.; Wang, Y.; Qi, Y.-H.; Liu, L. Data-driven interior plan generation for residential buildings. ACM Trans. Graph. 2019, 38, 1–12. [Google Scholar] [CrossRef]
  29. Nauata, N.; Chang, K.-H.; Cheng, C.-Y.; Mori, G.; Furukawa, Y. House-GAN: Relational generative adversarial networks for graph-constrained house layout generation. arXiv 2020, arXiv:2003.06988. [Google Scholar]
  30. Li, J.; Yang, J.; Hertzmann, A.; Zhang, J.; Xu, T. LayoutGAN: Generating graphic layouts with wireframe discriminators. arXiv 2019, arXiv:1901.06767. [Google Scholar] [CrossRef]
  31. Li, Z.; Zhao, Y.; Zhang, Y.; Wang, S.; Liu, H. Multi-relational graph attention networks for knowledge graph completion. Knowl.-Based Syst. 2022, 251, 109262. [Google Scholar] [CrossRef]
  32. Zhang, J.; Guo, J.; Sun, S.; Lou, J.-G.; Zhang, D. LayoutDiffusion: Improving Graphic Layout Generation by Discrete Diffusion Probabilistic Models. arXiv 2023, arXiv:2303.11589. [Google Scholar] [CrossRef]
  33. Tang, H.; Zhang, Z.; Shi, H.; Li, B.; Shao, L.; Sebe, N.; Timofte, R.; Van Gool, L. Graph Transformer GANs for Graph-Constrained House Generation. arXiv 2023, arXiv:2303.08225. [Google Scholar] [CrossRef]
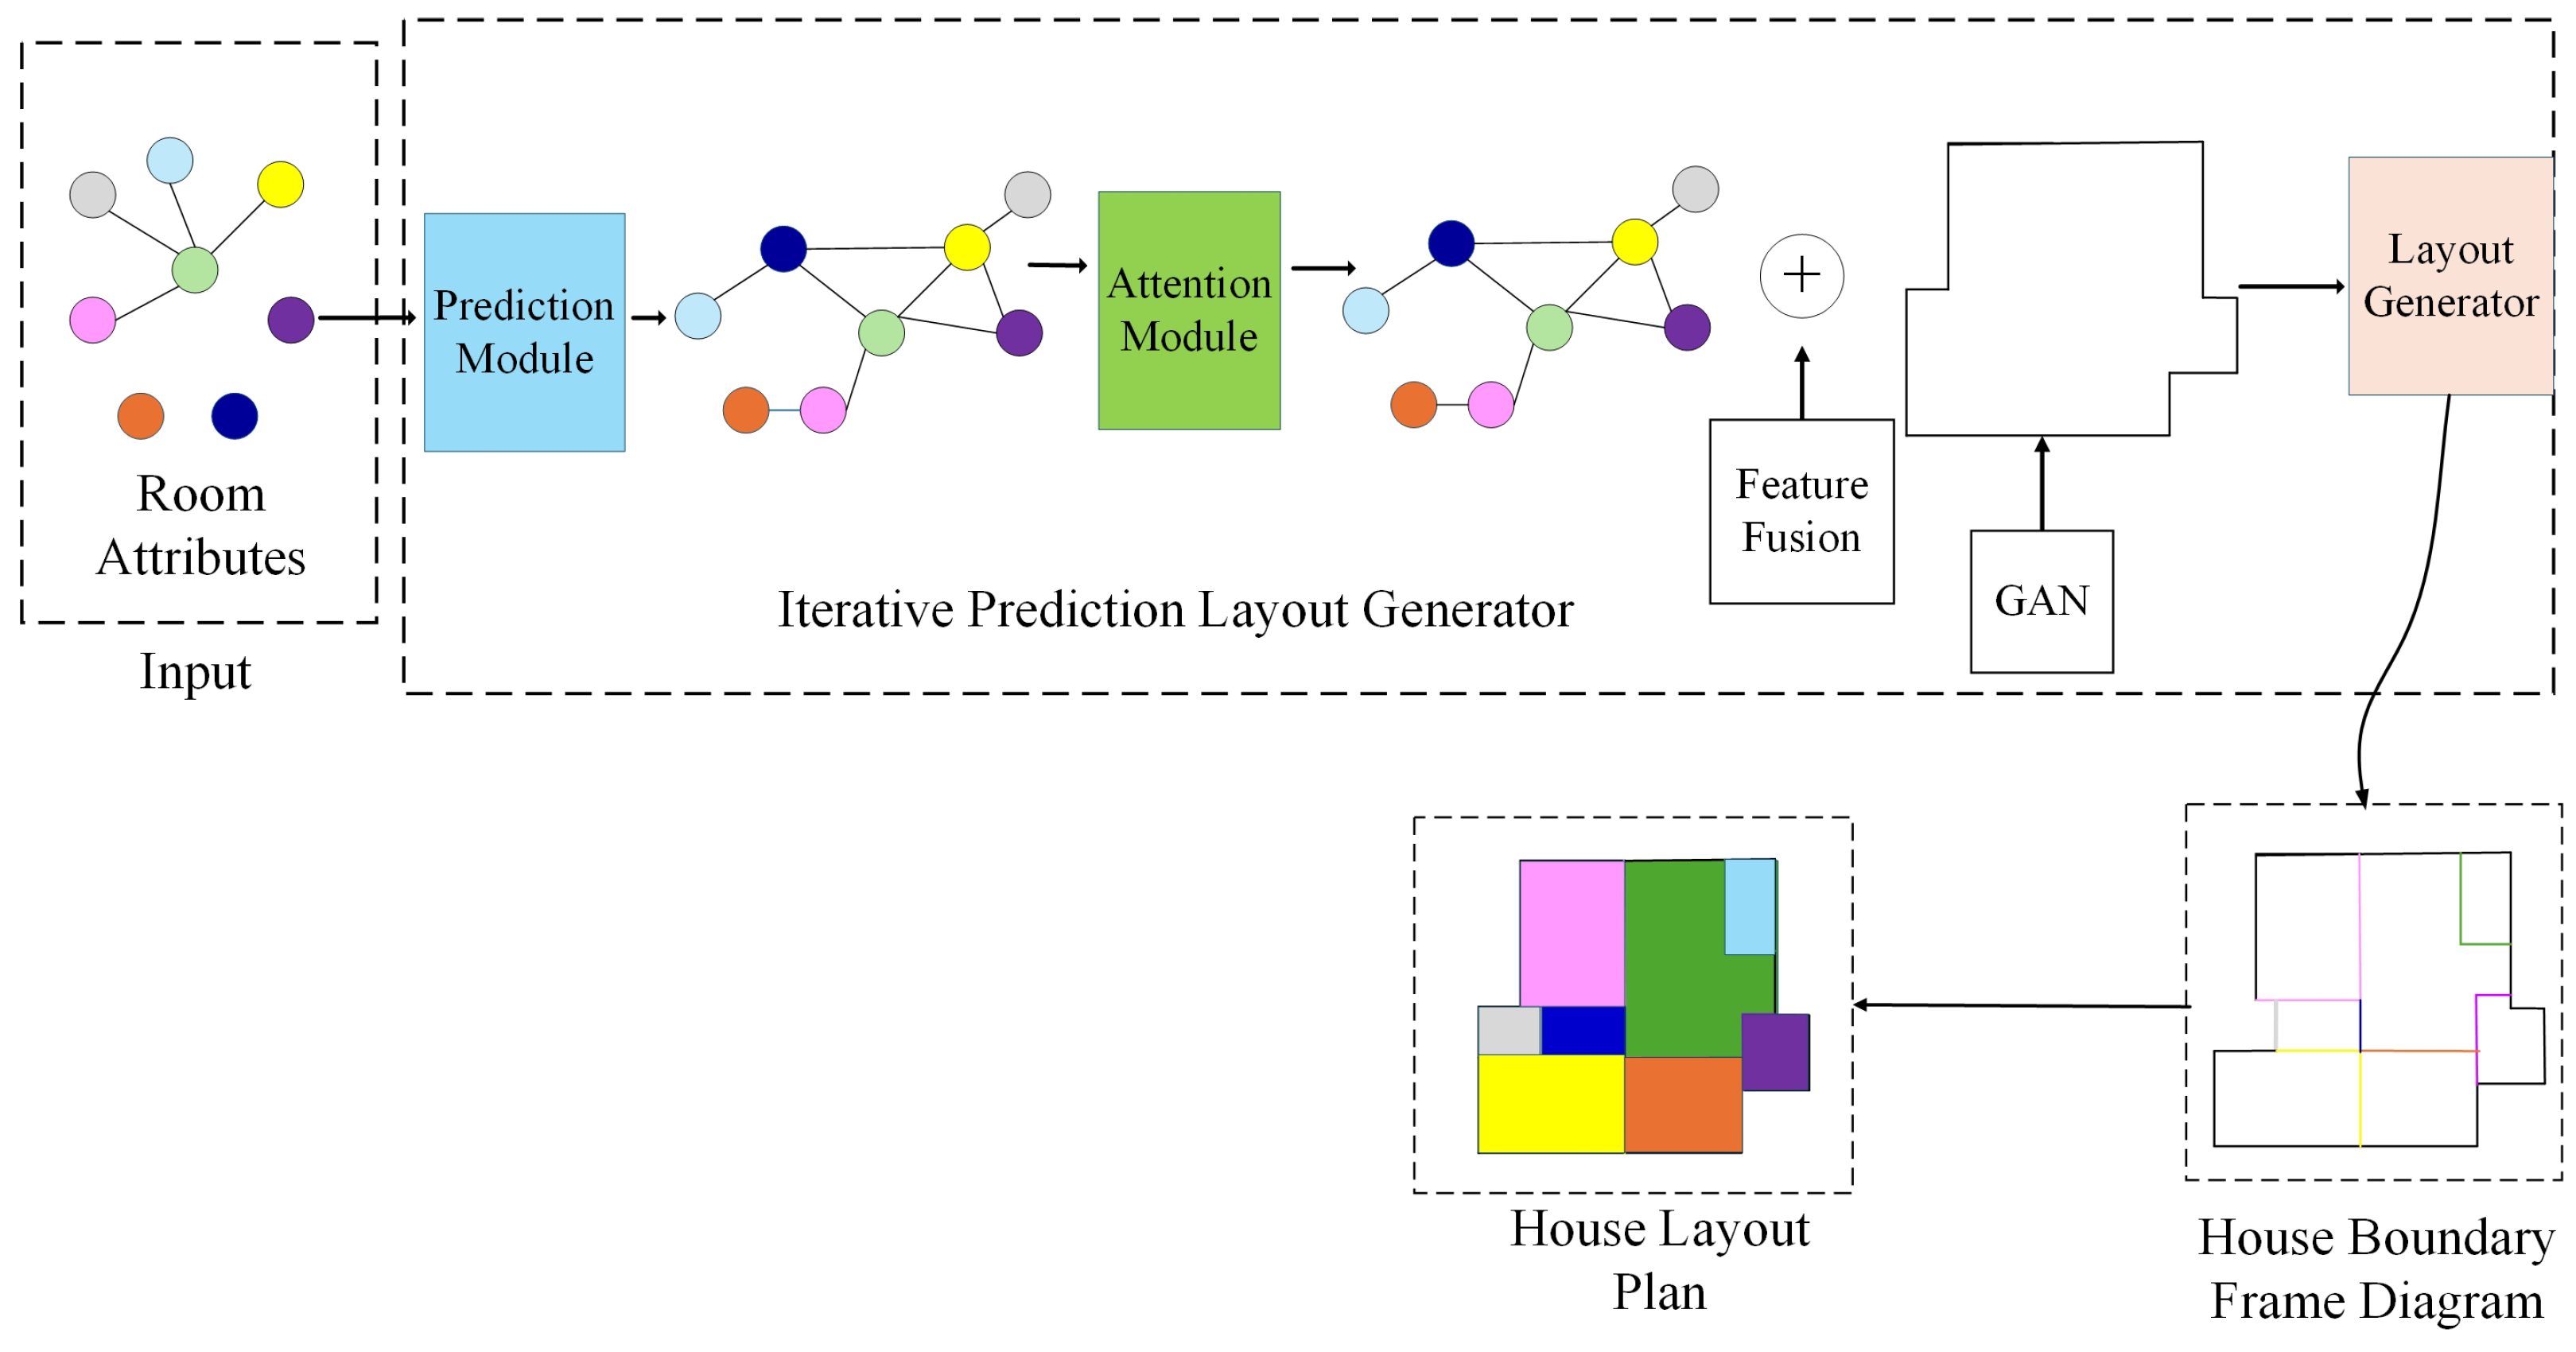
Figure 1. Graph-RWGAN network structure diagram.
Buildings 15 03623 g001
Figure 2. Multi-relational graph attention module.
Buildings 15 03623 g002
Figure 3. Cases in the RPLAN dataset.
Buildings 15 03623 g003
Figure 4. Diagram of edge relationships in dataset preprocessing.
Buildings 15 03623 g004
Figure 5. The results of different methods on the RPLAN dataset. ((a) House-GAN, (b) LayoutGAN, (c) MR-GAT, (d) Ground Truth, (e) Graph-RWGAN).
Buildings 15 03623 g005
Figure 6. Visual comparison of different methods for house layout generation. ((A) The ground truth, (B) MA-GAN, (C) MR-GAN, (D) House-GAN, (E) LayoutDiffusion, (F) Our Method).
Buildings 15 03623 g006
Table 1. Quantitative comparison of different methods on the RPLAN dataset.
ModelFID ↓SSIM ↑Acc (%) ↑IS ↑Room Adjacency Score ↑
House-GAN [29]109.270.78481.342.850.71
LayoutGAN [30]175.360.52568.222.120.60
MR-GAT [31]94.690.81382.373.050.74
Graph-RWGAN92.730.82885.963.120.78
Table 2. Quantitative comparison of layout generation by different models.
ModelRoom Topology Accuracy (%)Layout Quality (%)Structural Coherence (%)
House-GAN60%70%65%
LayoutGAN45%50%55%
MR-GAT75%85%80%
Graph-RWGAN95%90%95%
Table 3. Quantitative comparison of different methods.
MethodIoU (%)Position ErrorStructural ConsistencyVisual Realism
MA-GAN62.315.80.680.72
MR-GAT68.512.50.750.78
House-GAN71.210.30.800.82
LayoutDiffusion83.06.00.900.96
Our Method85.65.20.920.95
Table 4. Ablation study on the RPLAN dataset.
Model VariantFID ↓SSIM ↑Acc ↑
w/o Iterative Learning112.870.72974.17
w/o Relation Prediction Module98.490.75272.67
w/o Multi-Relation Graph Attention109.150.69369.29
Ours (Graph-RWGAN)92.730.82885.96
Table 5. Runtime and efficiency comparison of different models.
ModelGeneration Time (s)Memory Consumption (GB)Inference Time (s)Time for 1000 Layouts (min)
Graph-RWGAN1.22.10.820
MA-GAN1.82.31.025
MR-GAT2.02.51.228
House-GAN2.43.51.630
LayoutGAN3.14.22.040
LayoutDiffusion1.52.00.922
Disclaimer/Publisher’s Note: The statements, opinions and data contained in all publications are solely those of the individual author(s) and contributor(s) and not of MDPI and/or the editor(s). MDPI and/or the editor(s) disclaim responsibility for any injury to people or property resulting from any ideas, methods, instructions or products referred to in the content.