1. Introduction
As the global urbanization process accelerates, urban water resource systems are facing increasingly severe challenges [
1,
2]. On the one hand, rising population density is driving sustained growth in total water consumption, while centralized water supply systems are facing growing operational pressures in terms of resource allocation, infrastructure development, and energy consumption, casting doubt on their sustainability [
3,
4]. On the other hand, the frequent occurrence of extreme rainfall events has caused urban drainage systems to operate beyond their capacity, triggering overflow pollution, flooding disasters, and urban environmental degradation [
5,
6,
7]. Against this backdrop of dual supply and demand pressures, the Rainwater Harvesting Systems (RWH), regarded as green and low-impact decentralized infrastructure, are increasingly acknowledged as effective solutions for mitigating urban water scarcity and enhancing climate resilience. They have been progressively integrated into urban water management strategies and policy instruments [
8,
9,
10,
11].
However, most existing RWH systems are designed as standalone units, operating independently at the scale of individual buildings. This design paradigm poses notable constraints in terms of storage capacity, operational flexibility, and resource complementarity. These limitations become particularly evident under uncertain conditions such as extreme droughts or heavy rainfall events, where systems often suffer from insufficient scheduling capability and heightened performance volatility [
12,
13]. In addition, the lack of integration among individual RWH units leads to inefficient resource use and limited economic performance, posing challenges for aligning with future trends in urban system integration and smart infrastructure [
14,
15]. To address these challenges, regionally coordinated RWH systems have emerged as a growing research focus in recent years. By enabling coordinated operation across multiple buildings, such systems facilitate the spatial and temporal redistribution of rainwater resources, improve supply–demand matching efficiency, and offer enhanced capabilities in resource scheduling and system-wide coordination. For example, Oberascher et al. proposed the establishment of interconnected smart rain barrels, information-sharing mechanisms, and dynamic scheduling networks to support rainwater management in urban and peri-urban areas [
16]. Xu et al. proposed generalized control principles through the real-time coordinated operation of multiple storage reservoirs, offering theoretical guidance for the design of future smart rainwater management networks [
17]. Suprapti et al. introduced the concept of a community-based domestic rainwater harvesting (CDRWH) system for centralized rainwater management at the regional scale. By enabling demand-responsive allocation, this approach contributes to improved system reliability and water resource utilization [
18]. Collectively, these studies have advanced the evolution of RWH systems from isolated, building-level applications toward more integrated, networked, and collaboratively managed systems, laying the groundwork for future large-scale implementation.
However, current studies on coordinated RWH systems exhibit notable limitations. Most studies concentrate on optimization within single-function building clusters—such as residential or commercial zones—while the potential for integrated coordination across functionally diverse buildings has received limited attention. Unlike most prior studies focusing on homogeneous building groups, we target a functionally diverse campus–residential system. In this study based on five years of continuous hourly monitoring of non-potable water demand from a campus RWH system in Japan (
Figure 1), a clear temporal clustering of demand was observed, predominantly occurring during active teaching hours (08:00–17:00). This trend is highly consistent with typical usage patterns of buildings with similar functions and substantiates the synchronization of peak and off-peak loads within single-type building clusters [
19]. Such temporal concentration leads to low utilization of storage capacity in standalone systems. In contrast, the complementary peak and off-peak demand patterns between functionally heterogeneous buildings—such as between campus facilities and dormitory areas—may offer critical opportunities for coordinated operation. Furthermore, most current evaluations of RWH systems emphasize water conservation efficiency or economic feasibility [
13,
19,
20,
21], leading to a narrow performance assessment framework. Although overflow mitigation has been acknowledged as an important outcome of RWH systems, most existing studies still concentrate on efficiency or cost–benefit analysis in homogeneous building clusters. In contrast, limited attention has been given to how coordinated operation across functionally diverse and spatially proximate buildings can enhance overall system performance, particularly in improving water supply reliability and reducing overflow.
To fill this research gap, this study focuses on a campus and its adjacent international student dormitory area in Kitakyushu, Japan. An hourly water balance model was constructed to simulate two typical operating scenarios: (1) a decentralized mode, in which the campus and residential RWH systems function independently; and (2) a coordinated mode, where the systems are jointly scheduled to enhance overall performance. Building upon this, a regional-scale RWH coordination framework was established. The system’s performance under different operational scenarios was comprehensively evaluated using five key performance indicators: Potable water supplementation volume, reliability, non-potable water replacement rate, overflow volume, and overflow days. In addition, monthly trend analyses and differential heatmaps were employed to quantitatively explore the synergistic effects and implementation constraints of coordinated operation, particularly in relation to storage capacity utilization, overflow mitigation, and water replacement efficiency. This study can provide theoretical foundations and practical decision support for the coordinated management of rainwater resources in urban areas with diverse building types.
2. Study Area and Methodology
2.1. Study Area and Climatic Characteristics
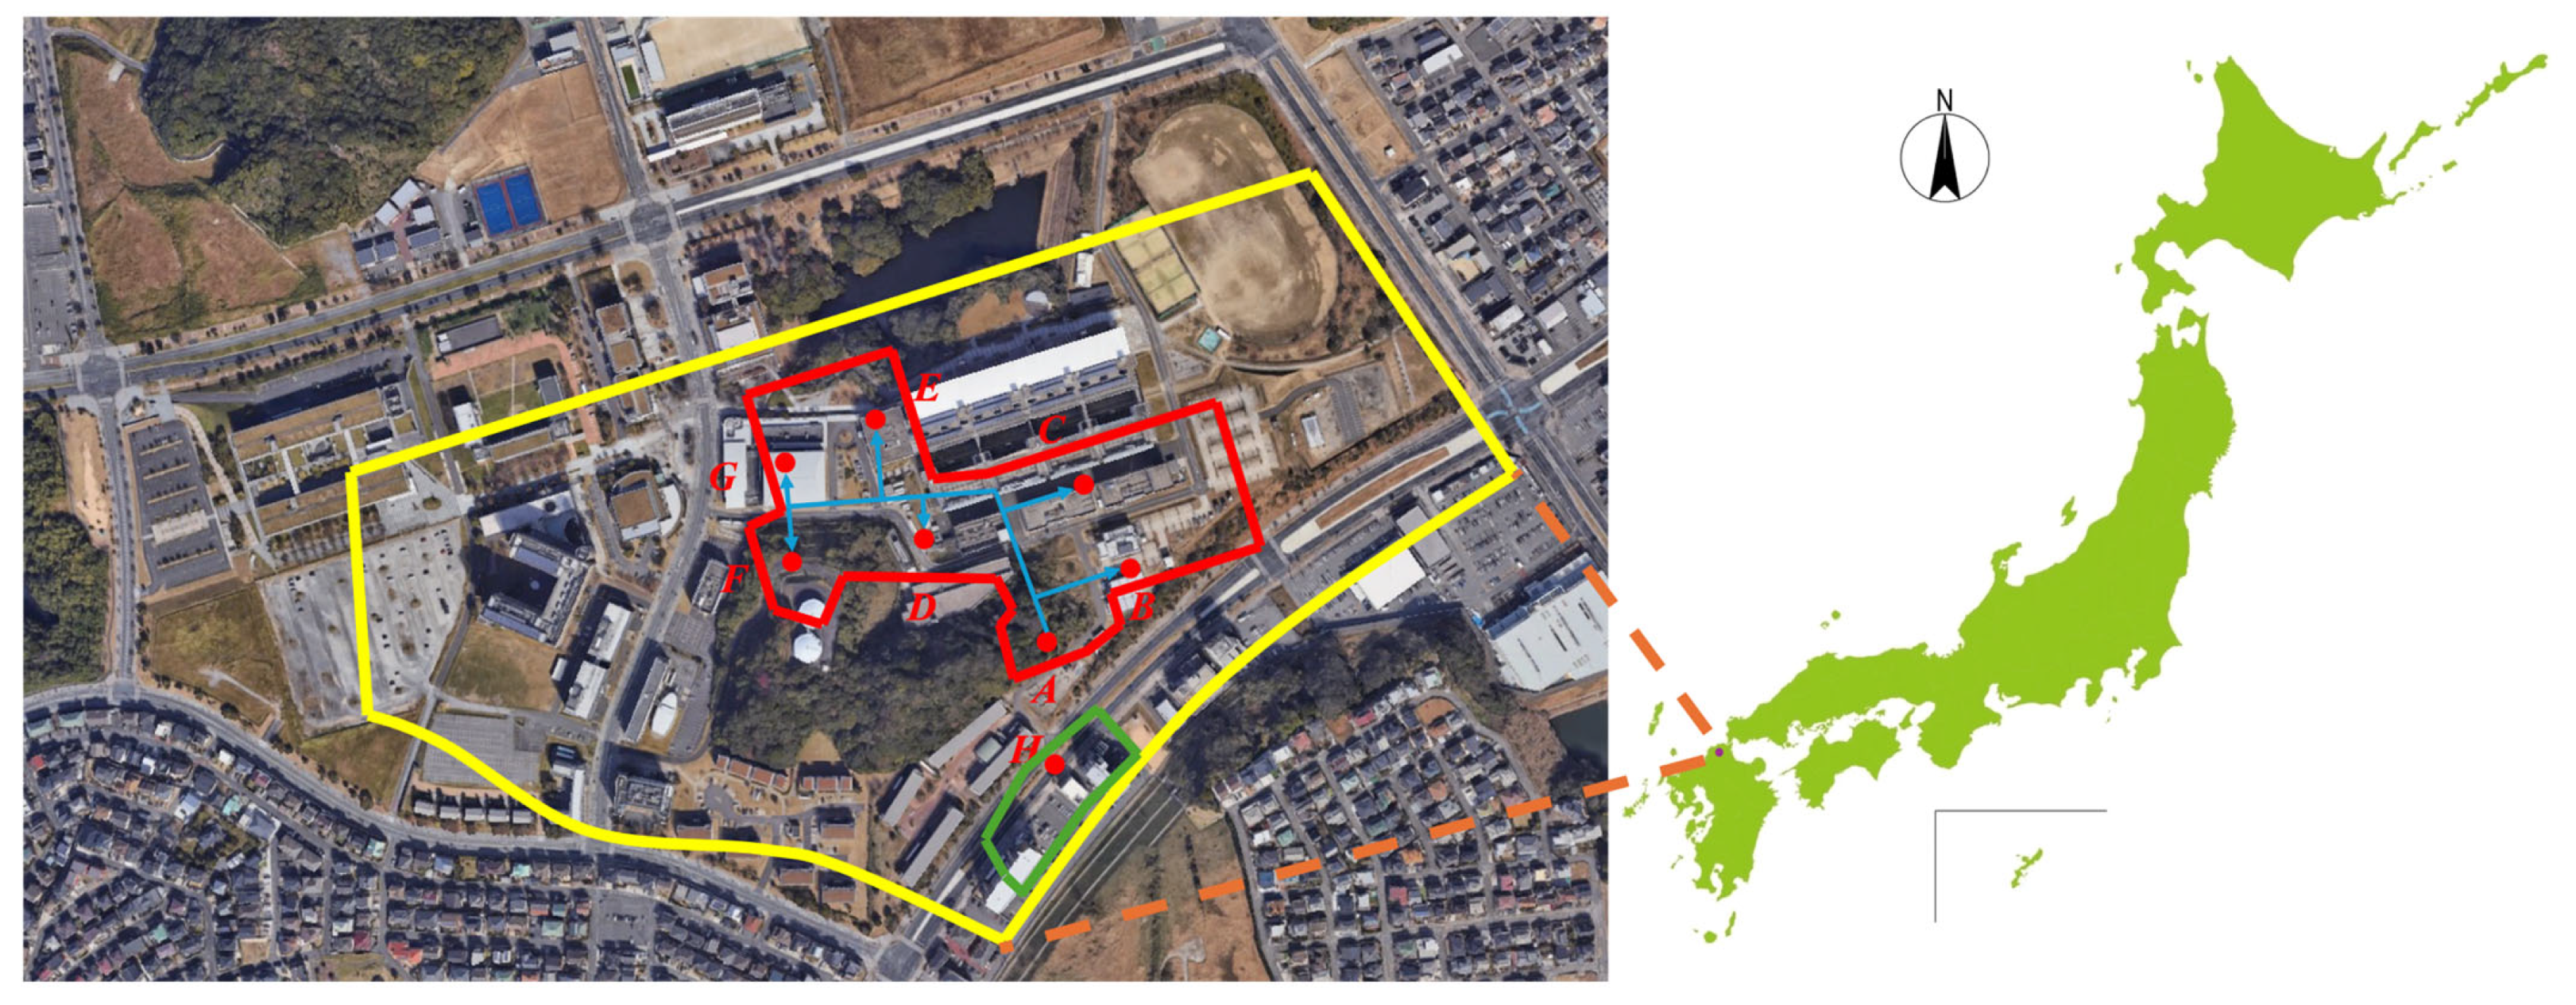
This study focuses on a university campus and its adjacent student dormitory residential area located in Kitakyushu, Japan. The study area is illustrated in
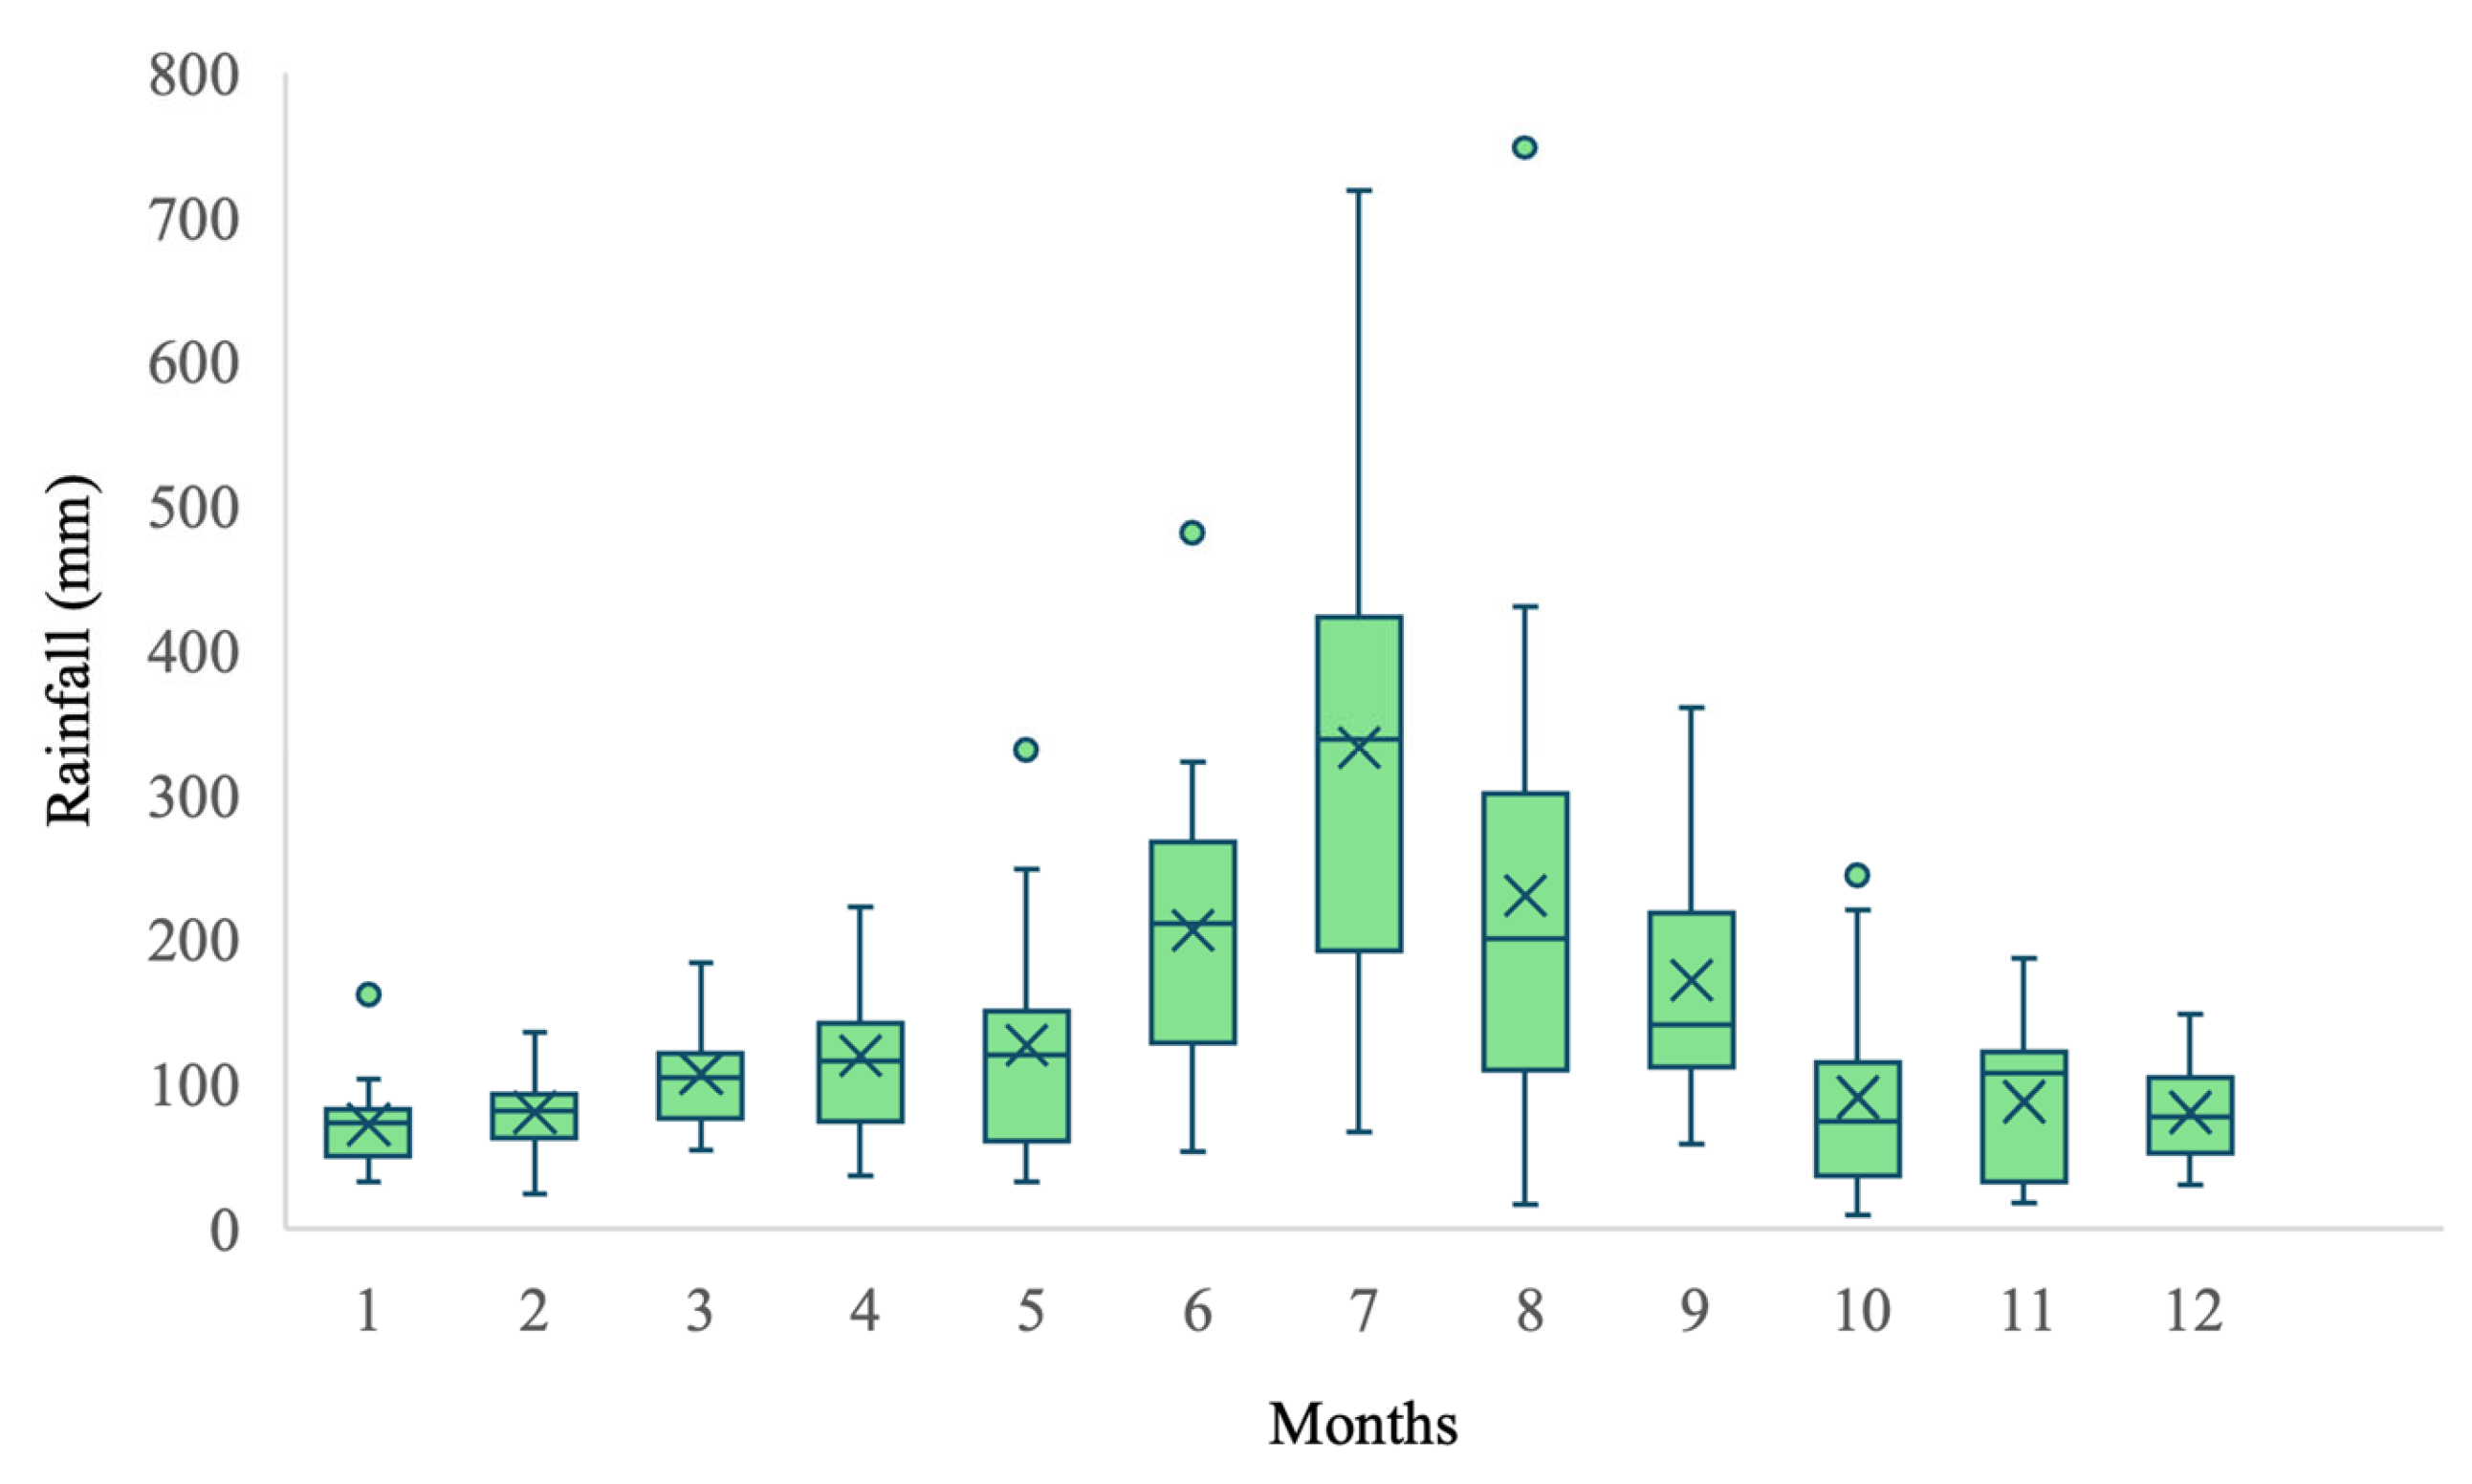
Figure 2. Kitakyushu serves as a key transportation hub between Honshu and Kyushu and belongs to the Sea of Japan climate zone. The region is characterized by hot and humid summers with heavy rainfall, and mild winters with little snowfall. Daily precipitation data from 2003 to 2022 (a 20-year period) were collected from the Japan Meteorological Agency [
22], as shown in
Figure 3. The average annual rainfall is approximately 1707 mm. However, precipitation is unevenly distributed in both space and time, with peaks typically occurring during the summer months (June–July) and the typhoon season (September). This uneven rainfall pattern poses significant challenges for the sizing and operation of urban rainwater harvesting and storage systems. In response, the Kitakyushu municipal government has actively promoted the installation of rainwater harvesting facilities in various buildings, including schools and public institutions, as part of a broader strategy for integrated water resource management. The selected campus and residential area are located within the Kitakyushu Science and Research Park, a newly developed urban district that integrates functions of education, research, and international exchange. Due to its urban planning characteristics and multifunctional structure, the area is considered both representative and scalable for rainwater harvesting research.
The campus represents a typical multi-building public facility complex equipped with a fully operational and mature Rainwater Harvesting System (RWH). The system has long-term, stable monitoring data at an hourly resolution for both rainwater inflow and non-potable water usage. Each campus building is equipped with rooftop catchment inlets that harvest rainwater and channel it through downpipes into underground storage tanks. After primary sedimentation, the harvested rainwater is conveyed to the Campus Energy Center, where it undergoes centralized filtration and disinfection. The treated rainwater is then stored in the main water tank and distributed according to the non-potable water demands of each building. The primary objective of the campus RWH system is to maximize the use of alternative water sources and reduce the consumption of potable water. When the volume of treated rainwater in the main tank is insufficient, potable water is supplied from the municipal system to ensure continuous non-potable water availability. The non-potable water demands of each campus building are summarized in
Table 1.
Adjacent to the campus is an international student housing complex located within the Kitakyushu Science and Research Park. The complex consists of four dormitory buildings and one administrative center, with a total building area of 4975.58 m
2. All dormitory buildings’ rooftops are flat structures. As the residential area is not currently equipped with a rainwater harvesting system, a hypothetical RWH system was modeled and analyzed in this study for simulation purposes. According to statistics from Japan’s Ministry of Land, Infrastructure, Transport and Tourism [
23], the average daily volume of non-potable water that can be substituted by rainwater is approximately 50 L per person, primarily for toilet flushing. Details of the residential area are provided in
Table 2. The volume of rainwater collected was estimated using hourly precipitation data in combination with the measured rooftop catchment area.
2.2. Scenario Setting and Simulation Assumptions
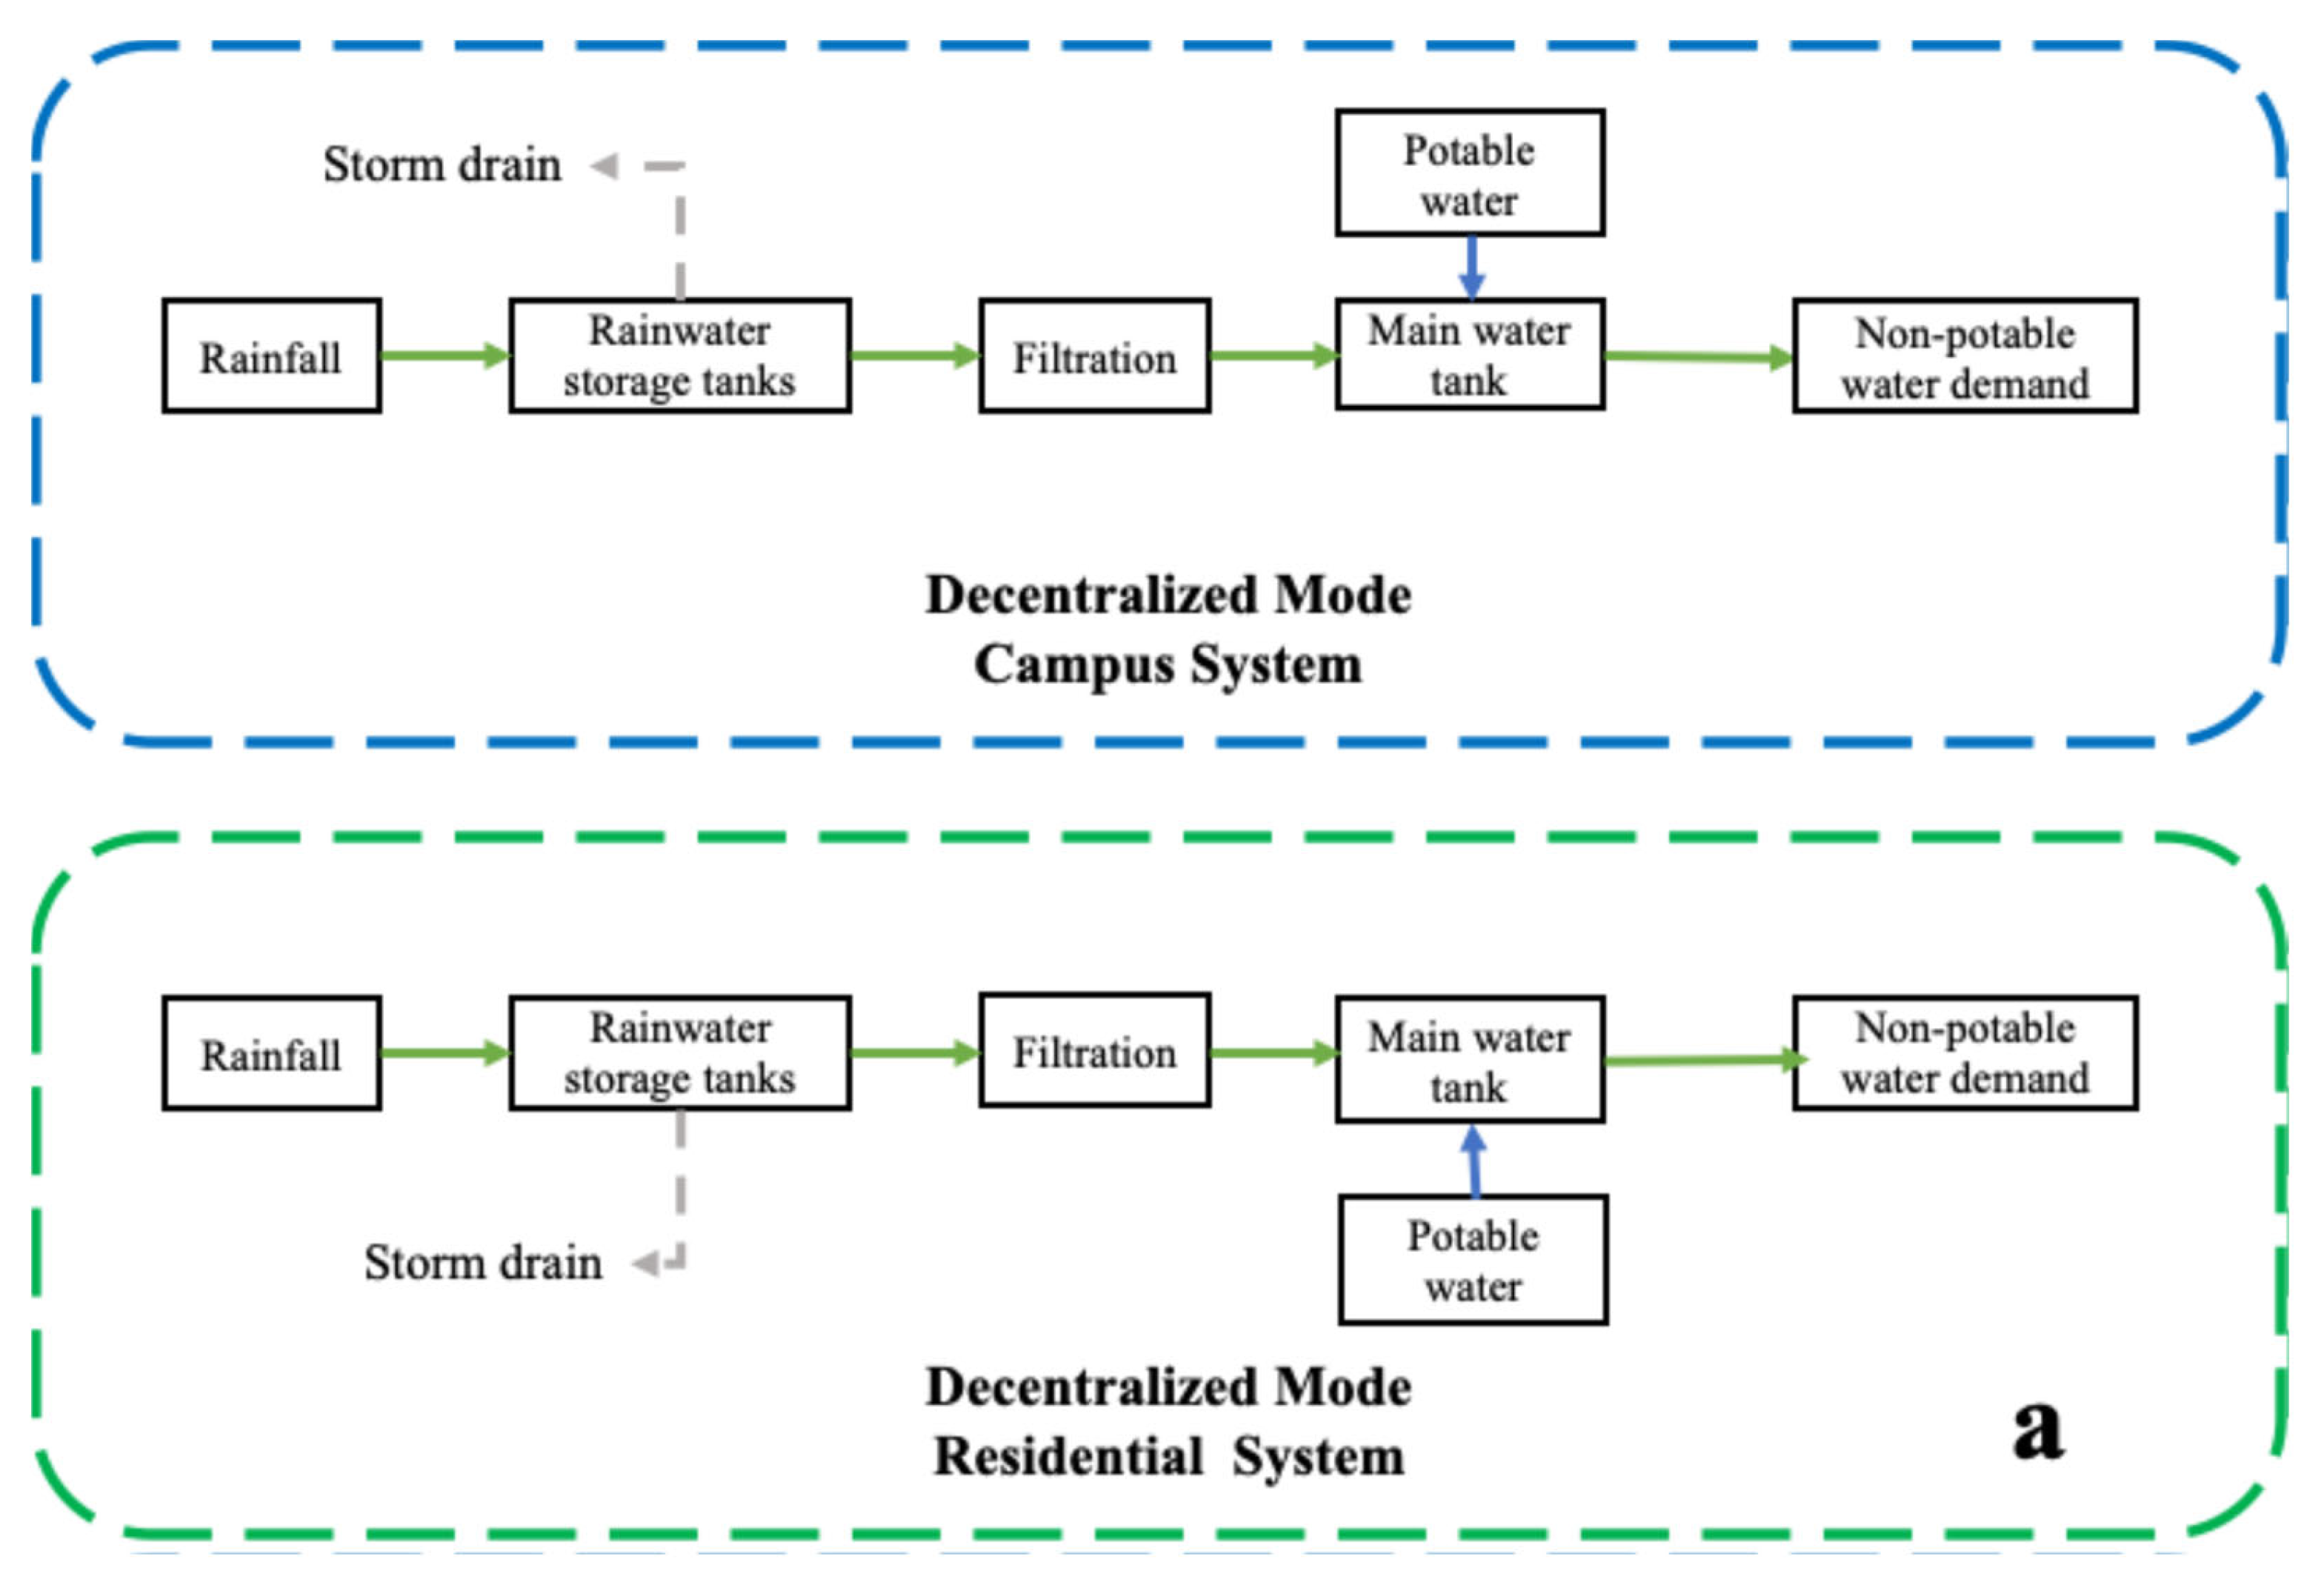
To systematically compare the effectiveness and limitations of rainwater harvesting (RWH) operations at the regional scale, two representative scenarios were defined in this study. The underlying assumptions and rationale for selecting these scenarios are explicitly clarified below, and their schematic workflows are shown in
Figure 4.
Scenario A: Decentralized Mode. This scenario represents the baseline condition. The campus already has a fully operational RWH system, consisting of rooftop catchments, centralized treatment at the Energy Center, and underground storage tanks with predefined capacity. In contrast, the adjacent residential area is not currently equipped with RWH facilities. To enable comparison, a hypothetical standalone system for the dormitory area was modeled, with storage volume determined through water balance simulation. In both systems, rainwater is used as the primary source for non-potable demand, and municipal potable water is supplied as a backup whenever harvested rainwater is insufficient.
Scenario B: Coordinated Mode. This scenario represents a proposed extension of the existing system. In this mode, rainwater collected from both the campus and the residential rooftops is conveyed via additional pipelines to the campus Energy Center for centralized treatment. The treated water is then stored in a shared tank and allocated through coordinated scheduling. When rainwater is limited, campus demands are prioritized, and surplus is distributed to the residential area; any remaining deficit is supplemented by municipal potable water. The coordinated scenario assumes that only pipeline extensions and scheduling integration are required, rather than the construction of a new treatment facility. This design enables an evaluation of whether physically interconnected operation across spatially proximate and functionally diverse buildings can deliver performance advantages over decentralized operation.
To operationalize these scenarios, the simulation workflow was structured as follows: Hourly rainfall and non-potable demand data were prepared as inputs, with campus inflows obtained from monitoring records and residential inflows estimated from rooftop area and runoff coefficient. Rainfall was then converted into effective inflow, added to storage, and overflow resolved when capacity was exceeded. Available rainwater was allocated to non-potable demand under the “rainwater-first, municipal-backup” rule, either independently (decentralized mode) or through shared treatment and storage (coordinated mode). Finally, performance indicators—including potable supplementation, reliability, replacement rate, overflow volume, and overflow days—were calculated from the hourly series.
All simulations were conducted using an hourly time step, based on five years (2019–2023) of hourly rainfall and non-potable water demand data. The year 2022 was selected as the representative year for detailed analysis. The initial condition of the system was set to an “empty tank” state. In all scenarios, rainwater stored in the tank was prioritized for use. When rainfall occurred and the tank was already full, overflow was assumed to occur, and both overflow volume and the number of overflow days were recorded. The simulation did not consider variations in rainwater quality, evaporation losses, or pipeline delay effects. Instead, the focus was placed solely on supply–demand dynamics and the system’s temporal response behavior.
Based on field investigation and an analysis of residential water use behaviors, it was assumed that non-potable water demand in the residential area was extremely low during daytime hours (10:00–17:00), with usage primarily concentrated from evening through the following morning. Daily water demand was divided into three time periods: 60% from 17:00 to 23:00, 20% from 23:00 to 07:00, and 20% from 07:00 to 10:00. Within each time period, demand was evenly distributed on an hourly basis.
2.3. Water Balance Model
To compare and evaluate the operational performance of the campus system, residential system, and the coordinated scenario, this study employs a water balance model to simulate hourly supply–demand dynamics. The water balance model serves as a core analytical tool for simulating the operation of rainwater harvesting (RWH) systems and is widely used in the performance assessment of such systems.
- (1)
Core Water Balance Equation
The classical water balance equation is expressed as follows:
where
Vt is the storage volume at time;
It is the collected rainwater volume;
Dt is the non-potable water demand;
Ot is the overflow volume.
This study employed the Yield After Spillage (YAS) logic as the primary modeling approach. YAS was chosen because it realistically captures tank behavior under short-term, high-intensity rainfall, which is particularly important when using an hourly time step. At this fine resolution, inflow and overflow events can occur within narrow time windows, and the YAS framework—by releasing overflow before allocating remaining storage to demand—ensures a more accurate representation of system dynamics. In this framework, incoming rainwater is first added to storage, any excess beyond the maximum capacity is immediately discharged as overflow, and the remaining volume is then allocated to meet non-potable demand. This stepwise logic has been widely applied in rainwater harvesting studies [
24,
25,
26], ensuring both methodological robustness and comparability with previous research.
- (2)
Calculation of Harvested Rainwater Volume
For the campus RWH system, the volume of harvested rainwater was directly obtained from automatic system records. In contrast, for the residential RWH system, which does not currently exist and was modeled hypothetically, the harvested rainwater volume was calculated using the following formula:
where
Pt is the rainfall depth (m/h),
A is the rooftop catchment area (m
2), and
C is the runoff coefficient, set to 0.9 in this study.
- (3)
Tank Storage Dynamics
The water storage volume in the system is updated on an hourly basis using the following equation:
where
Vmax is the physical limit of the storage tank, beyond which any incoming water results in overflow.
- (4)
Overflow Volume
Overflow occurs when tank capacity is exceeded:
- (5)
Potable Water Supplementation
The volume of rainwater supplied to meet non-potable demand is given by:
- (6)
Supplementary Water Supply
When the stored rainwater volume
Vt at a given time is insufficient to meet the non-potable water demand, the potable water is used to compensate for the deficit, supplementary potable water volume is calculated as:
- (7)
Allocation Logic in the Coordinated Mode
In the coordinated mode, the model follows a sequential allocation strategy in which the non-potable water demand of the campus is prioritized. Any remaining rainwater is then allocated to the residential area. If the residual volume is still insufficient to meet residential demand, potable water is used as a supplementary source. This serial supply logic is implemented by dynamically assessing the remaining volume in the shared storage tank and assigning allocation priority accordingly.
2.4. Performance Evaluation Indicators
To systematically assess the performance of the two rainwater harvesting (RWH) operation scenarios, this study adopts five commonly used quantitative indicators. Among the five indicators, Overflow Volume and Overflow Days are used as environmental performance proxies. Lower overflow volumes and fewer overflow days indicate reduced hydraulic loading on drainage infrastructure and a lower likelihood of pollutant wash-off/combined sewer overflows during storm events [
27,
28]; therefore, our coordinated-operation evaluation explicitly includes these outcomes as part of the performance assessment. These indicators comprehensively evaluate system performance from three perspectives: water substitution efficiency, supply reliability, and rainwater storage regulation capacity. All selected indicators have been widely applied in previous studies and are well-established in the evaluation of RWH systems at both urban and building scales [
14,
25,
29,
30].
- (1)
Potable water supplementation volume
This is the total volume of non-potable water demand not met by the rainwater harvesting system during the simulation period, calculated based on the amount of potable water used for supplementation (in m
3). This indicator reflects the insufficiency of the rainwater supply. A lower value indicates reduced dependence on external potable water and higher self-sufficiency of the system.
- (2)
Reliability
This indicator measures the proportion of time during which the rainwater harvesting system can meet non-potable water demand when such demand exists. A higher reliability means that users can consistently access non-potable water with fewer interruptions. It is defined as follows:
where
DayT is the total number of days with non-potable water demand, and
Dayw is the number of days on which potable water was required to supplement the rainwater supply.
- (3)
Non-potable Water Replacement Rate
The non-potable water replacement rate is a key indicator used to assess the effectiveness of a rainwater harvesting (RWH) system. It represents the proportion of non-potable water demand that is met through harvested rainwater, the higher rate reflects more effective substitution of potable water and greater efficiency of rainwater use, and is defined as follows:
- (4)
Overflow Volume
This is the total volume of rainwater that cannot be collected due to a full storage tank during rainfall events, reflecting the system’s retention capacity under high-intensity precipitation. A lower volume indicates better utilization of storage capacity and reduced burden on drainage systems. It is defined as follows:
- (5)
Overflow Days
This is the number of days during the simulation period in which at least one overflow event occurs. This metric is used to assess the system’s capacity to respond to extreme rainfall events. Fewer overflow days imply lower frequency of environmentally adverse events and improved system resilience during heavy rainfall, and is defined as follows:
where
δ represents the number of days on which an overflow event occurs.
3. Results
3.1. Potable Water Supplementation Volume
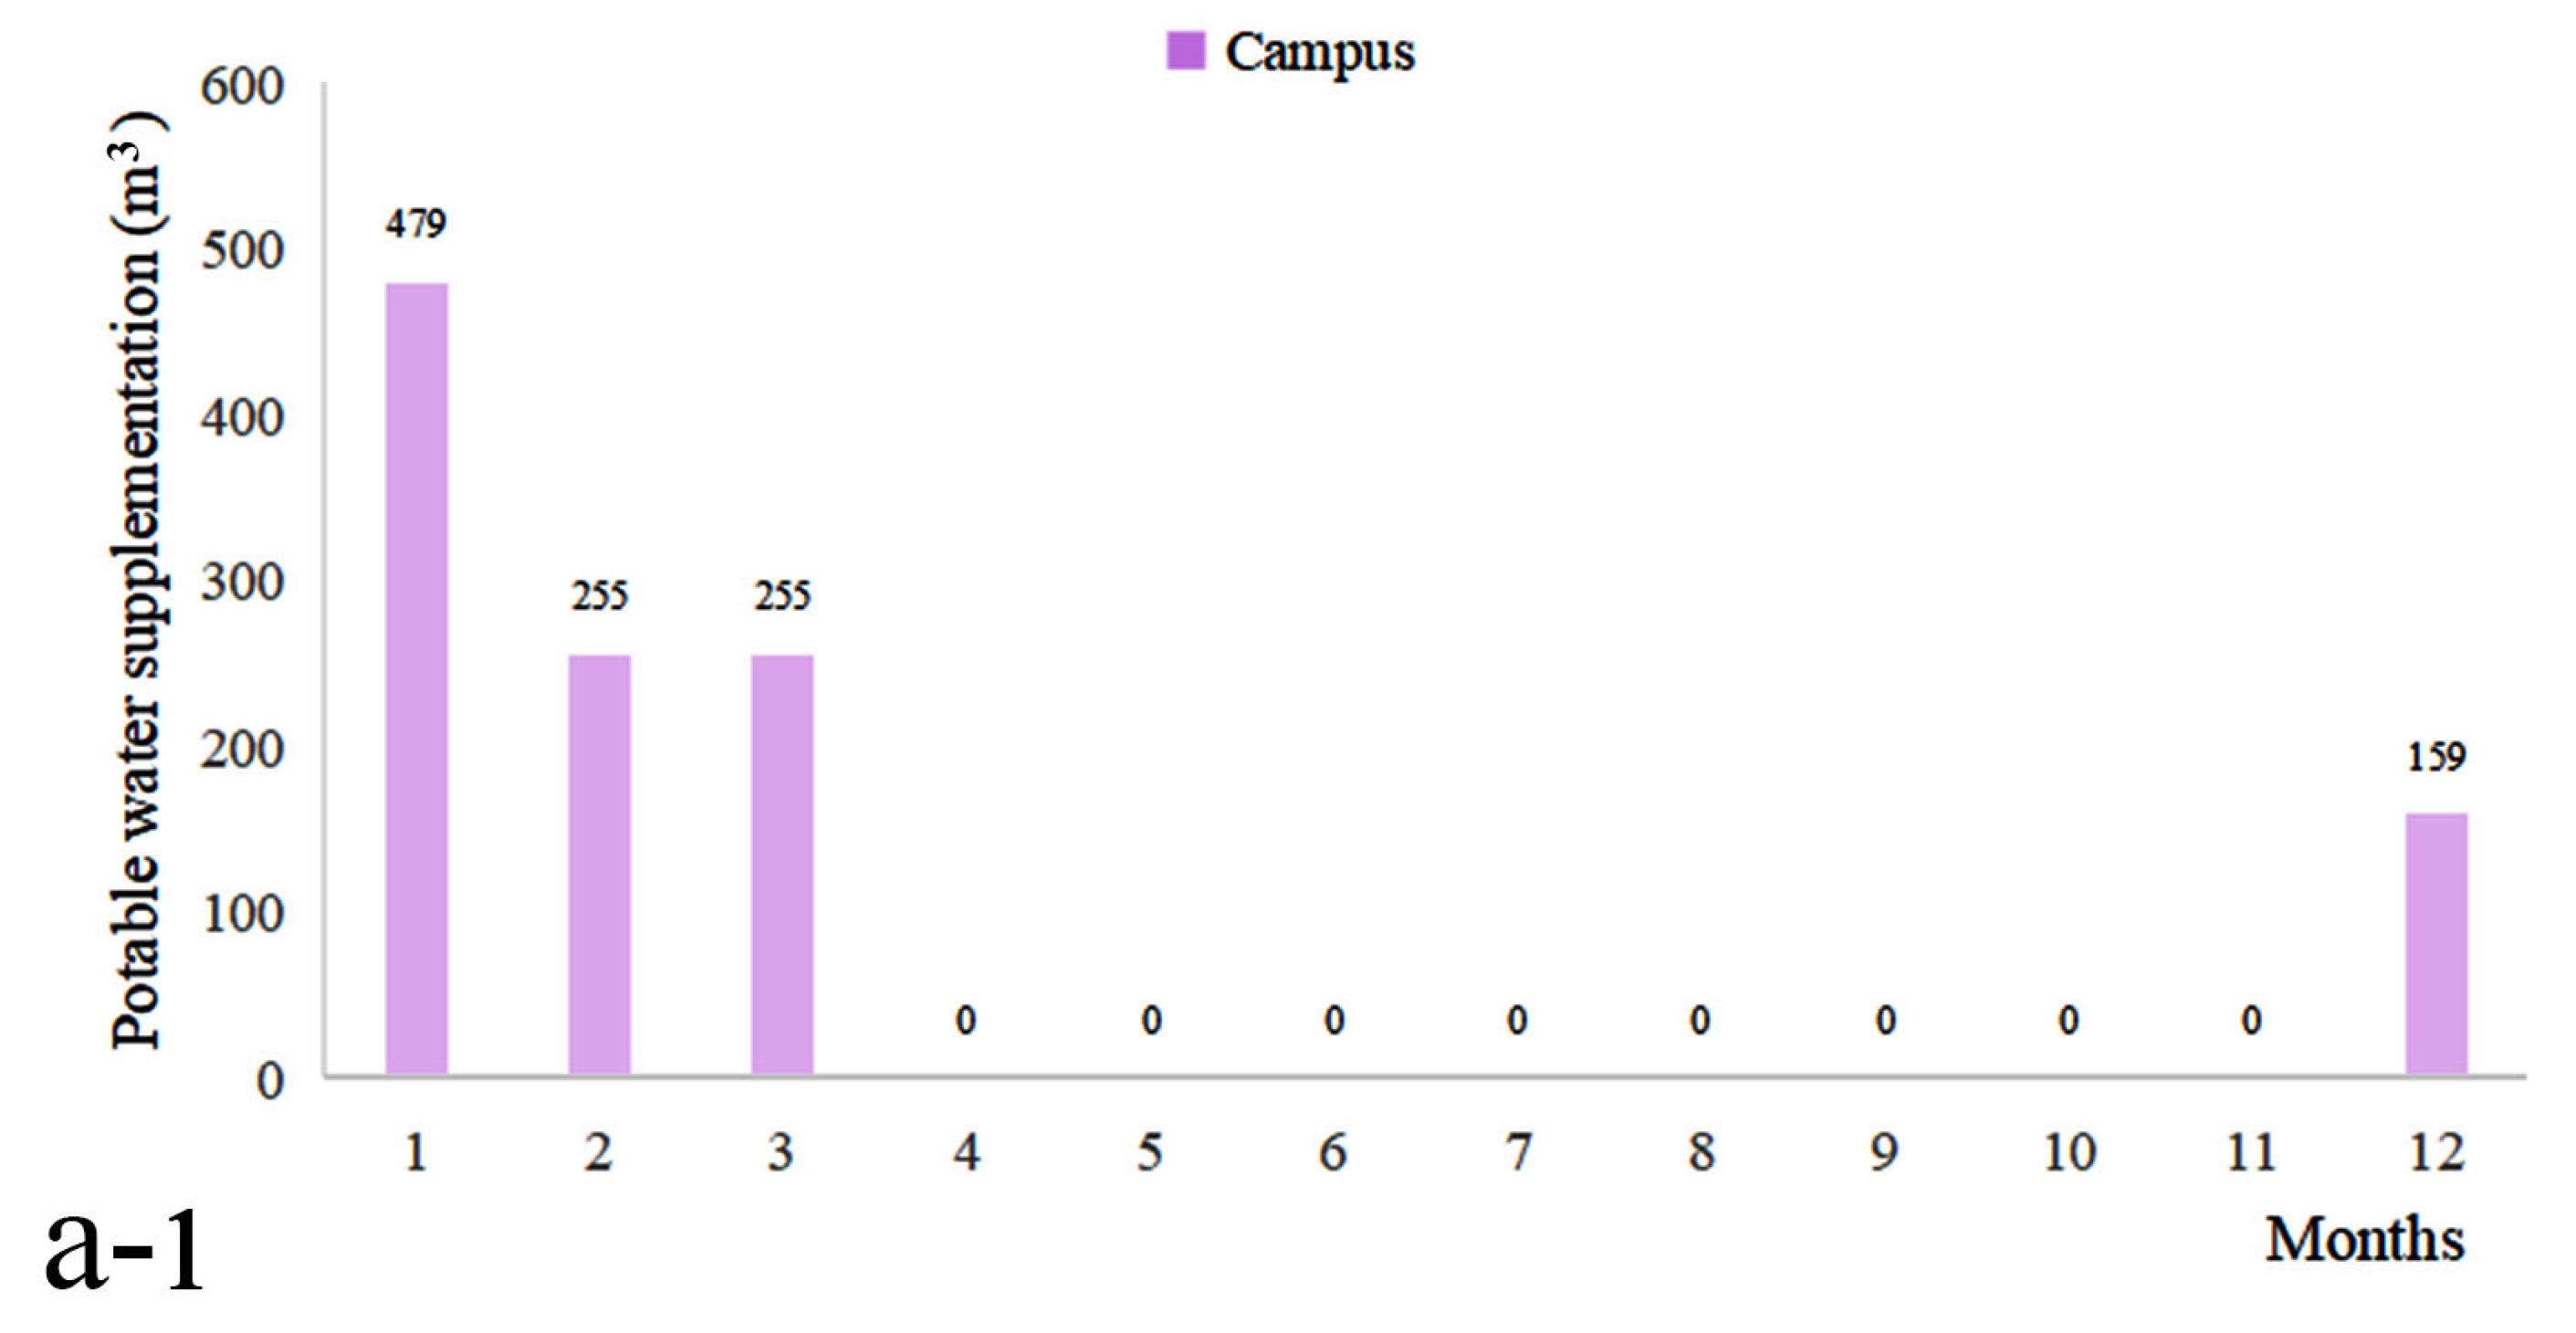
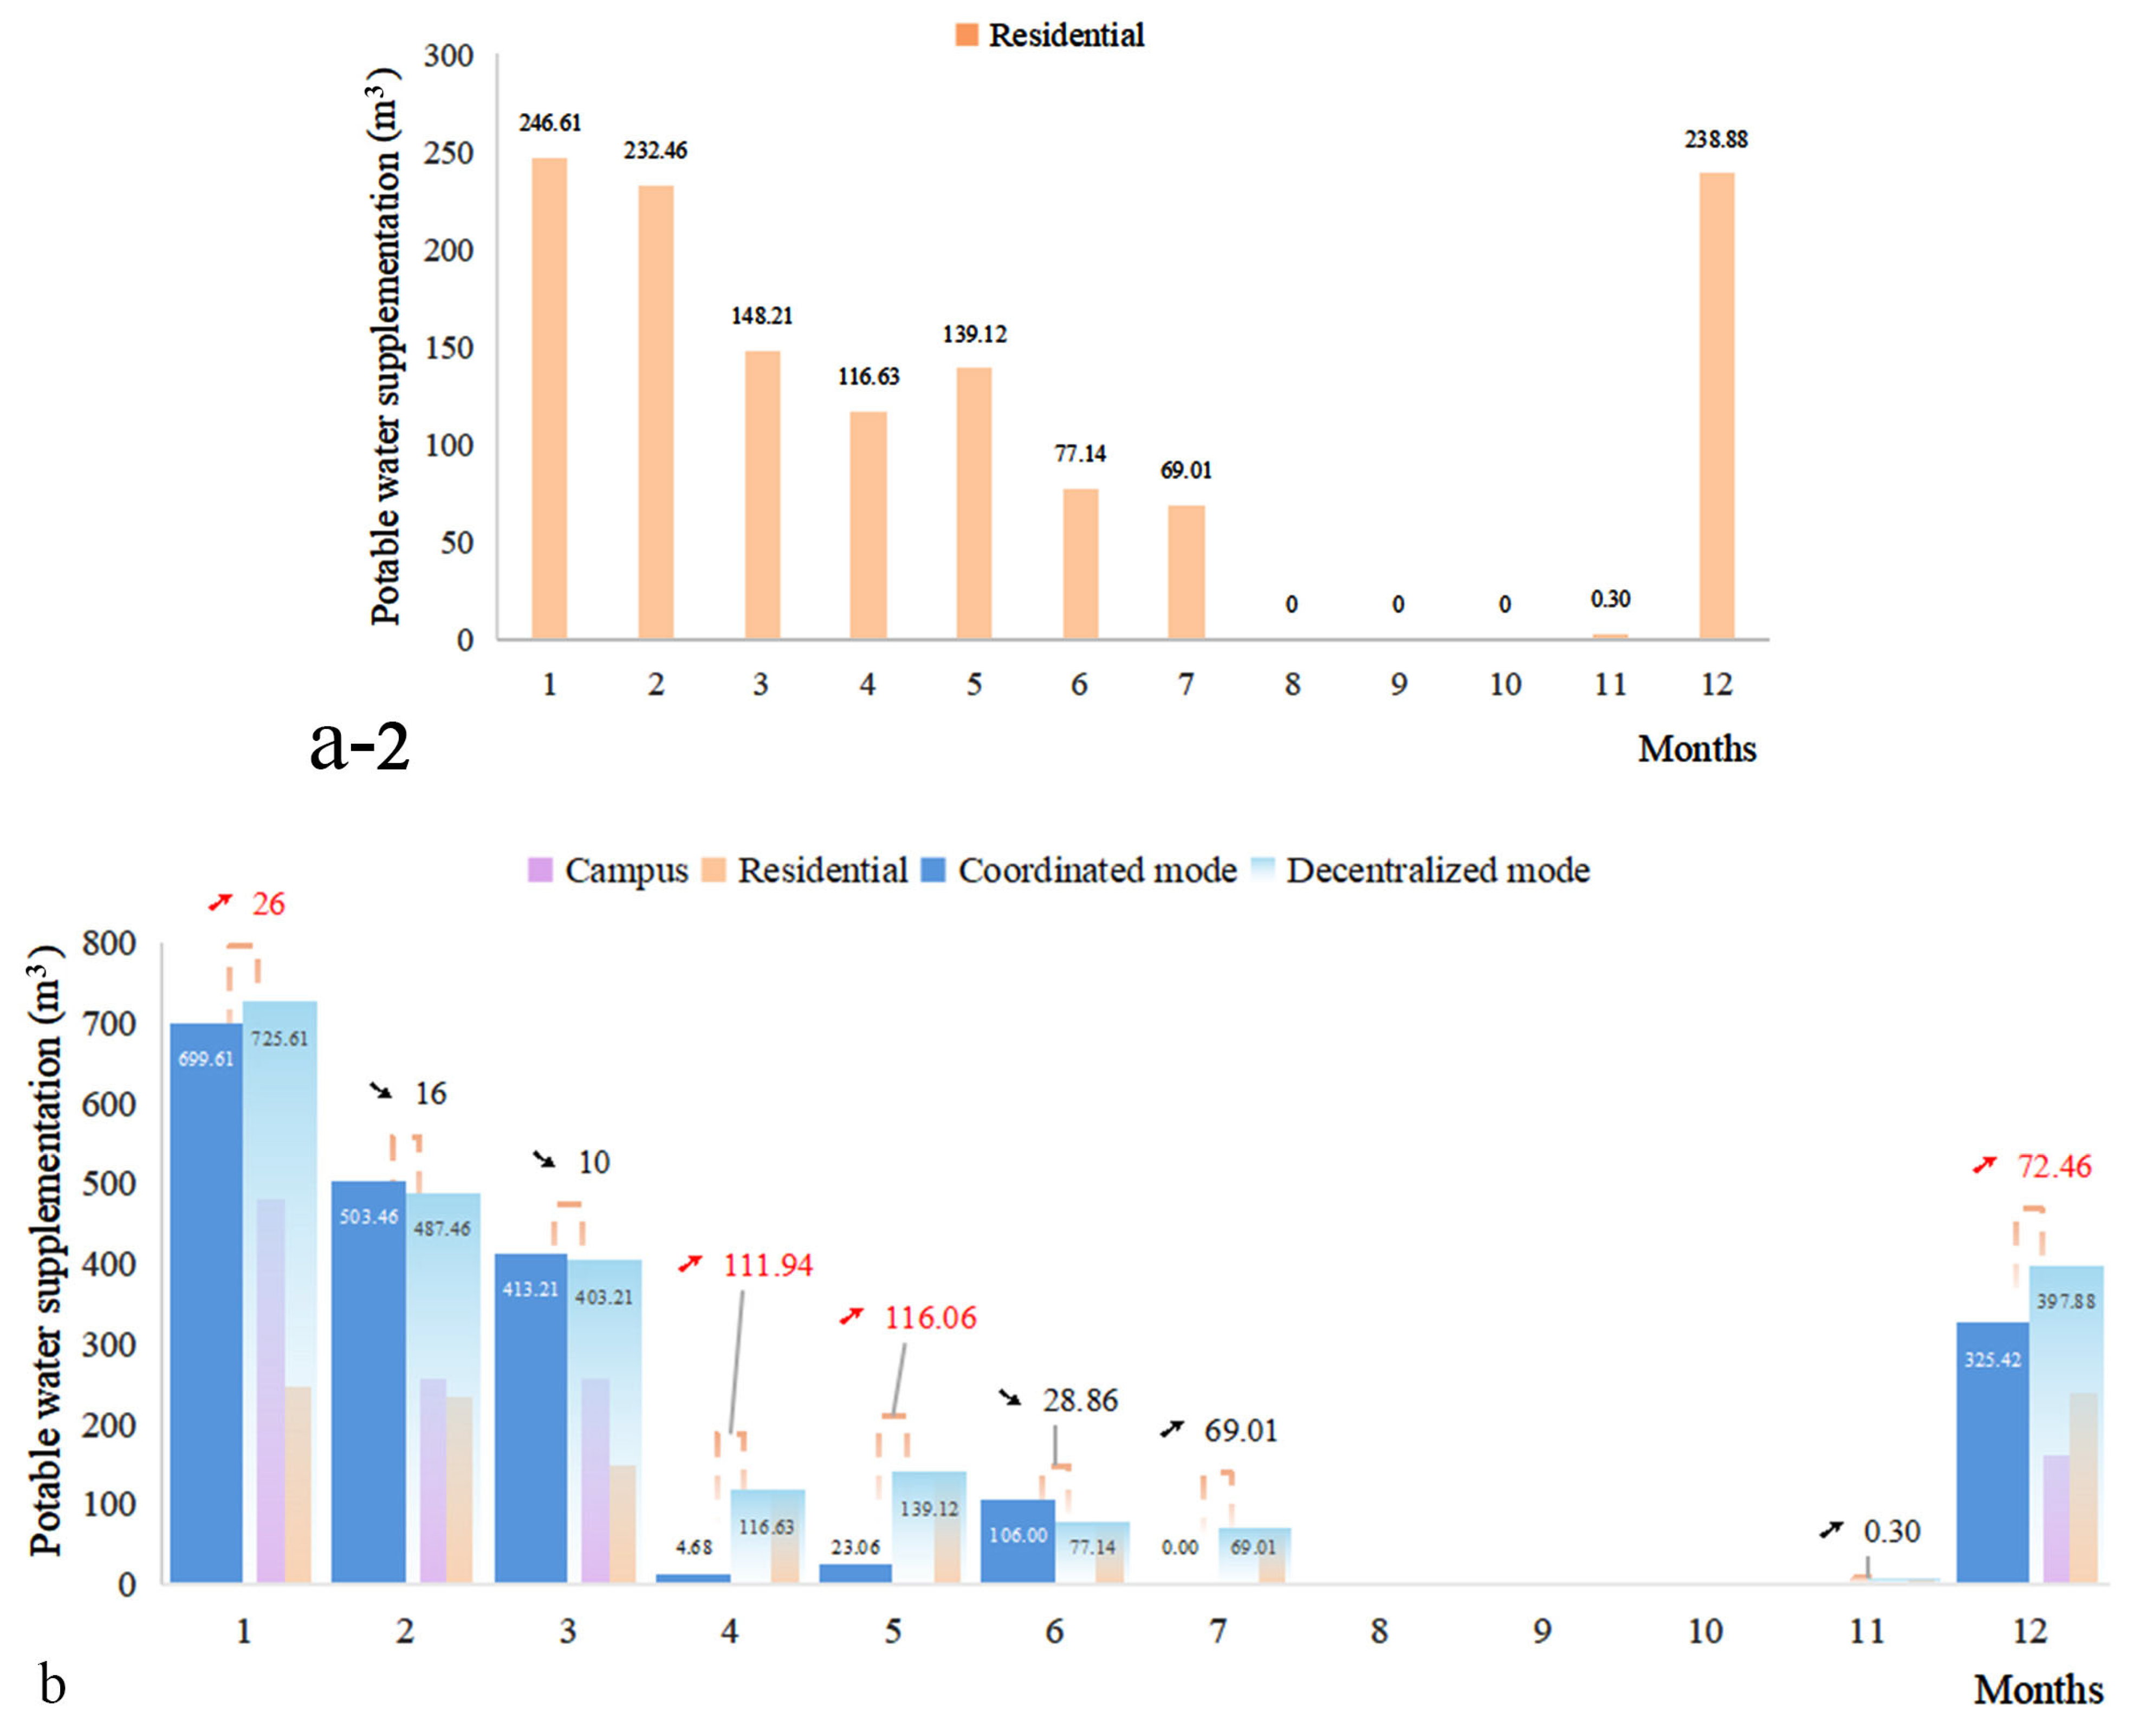
As shown in
Figure 5, during the full-year simulation period, the campus RWH system in the decentralized mode required a total of 1148 m
3 of potable water supplementation, mainly concentrated in the low-rainfall months of January to March and December. The residential RWH system required 1268.35 m
3 of potable water, with supplementation needed in all months except from August to October, during which rainwater was largely sufficient.
In contrast, under the coordinated mode, the total potable water supplementation volume dropped from 2416.35 m3 to 2075.44 m3, achieving a reduction of 340.91 m3, approximately 14.11%. Although the coordinated mode resulted in slightly higher potable water usage than the decentralized mode in a few individual months, the overall monthly distribution was significantly optimized through cross-regional water allocation. Notably, in April and May, potable water savings exceeded 100 m3 in each month compared to the decentralized mode. Even in dry months such as January and December, potable water use was reduced due to the redistribution of stored rainwater across regions.
These findings demonstrate that although the coordinated system may have local limitations at times, it effectively enhances rainwater utilization efficiency and significantly reduces reliance on potable water, thanks to its resource-sharing mechanism.
3.2. System Reliability
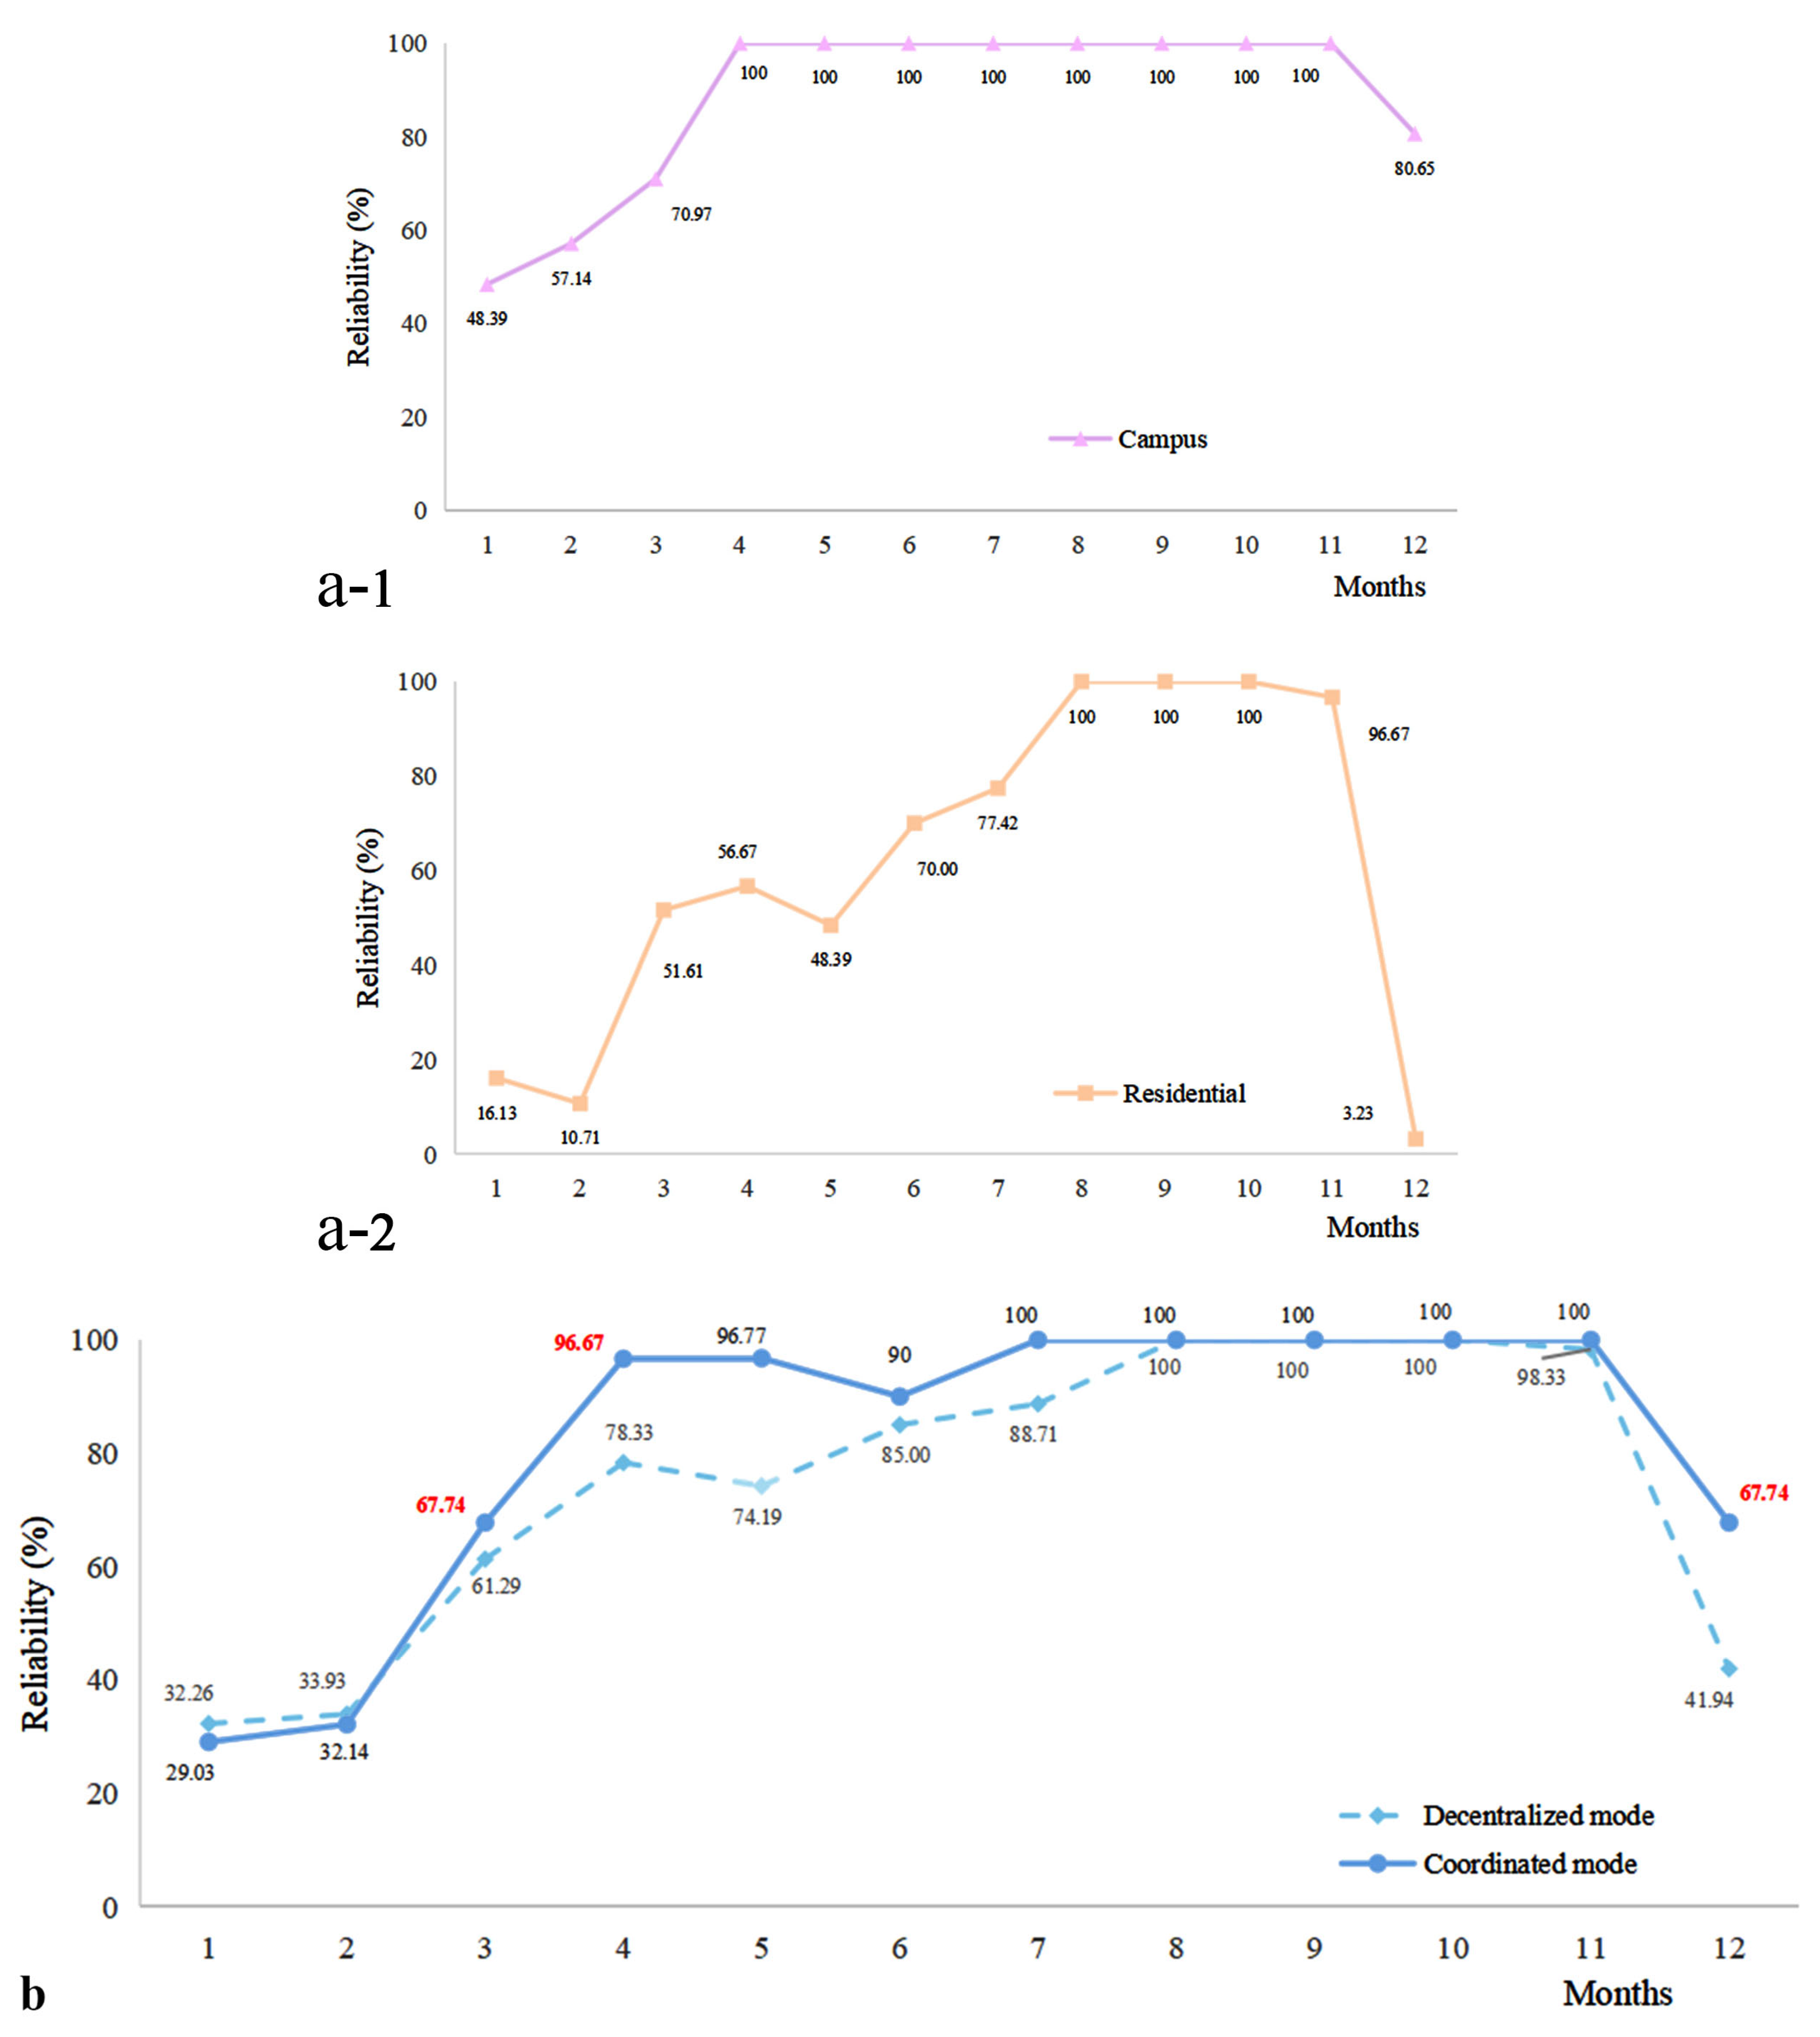
In terms of system supply reliability, as shown in
Figure 6, the campus RWH system under the decentralized mode exhibits an annual average reliability of 88.09%. Reliability increases with rainfall, starting from 48.39% in January and reaching 100% by April, maintaining full reliability through November. In December, reduced rainfall results in less harvested rainwater, which shortens the period during which non-potable demand can be fully met by RWH. As a consequence, the number of days requiring municipal backup increases, and according to Equation (8), the reliability decreases to 80.64%.
In contrast, the residential area under the decentralized mode demonstrates a significantly lower annual average reliability of 60.9%. The water supply reliability shows high fluctuation throughout the year, with reliability below 80% in eight months and reaching a minimum of 3.23% in December. This is primarily due to the limited roof area in the residential system, which restricts rainwater collection capacity.
Under the coordinated mode, the overall annual average reliability is 81.67%. Although this is slightly lower than that of the standalone campus system, it represents a significant improvement over the standalone residential system. Specifically, the coordinated mode increased by 9.64% compared to the annual average reliability of 74.5% under the decentralized mode. Starting in March, the advantages of the coordinated mode become increasingly apparent. Compared to the decentralized mode, the coordinated mode markedly improves the monthly average reliability of both subsystems, maintaining a relatively high level of stability with only four months below 80% throughout the year. Even with the residential area’s limited collection capacity, the cross-regional resource sharing enabled by the coordinated mode can significantly enhance the stability of water supply, thereby improving the overall system’s service performance.
3.3. Non-Potable Water Replacement Rate
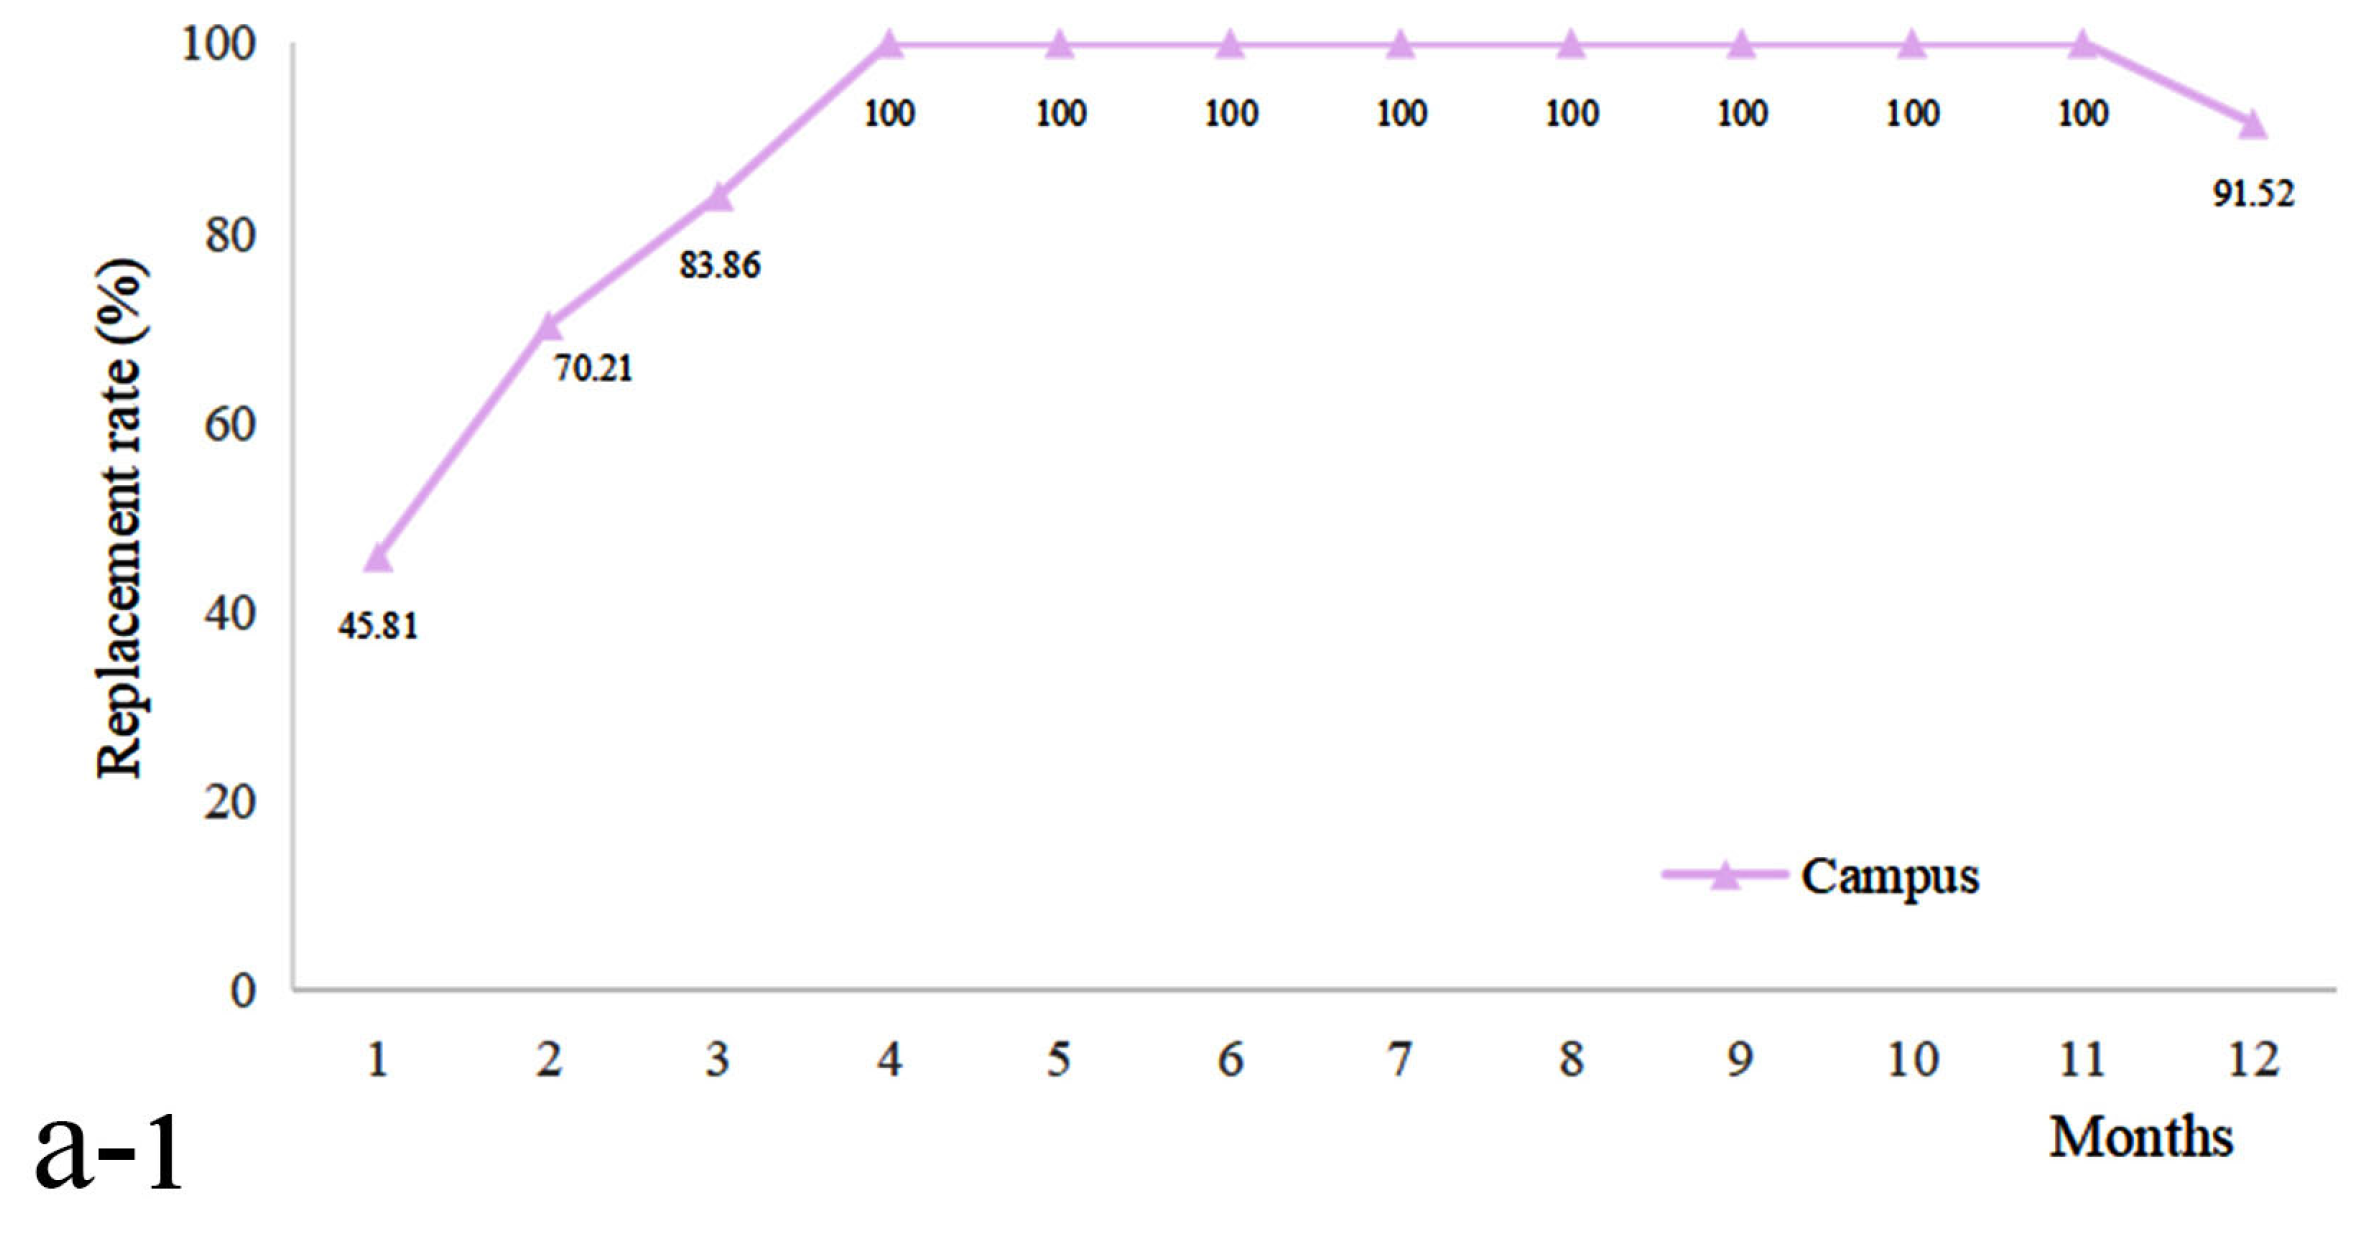
As shown in
Figure 7, the non-potable water replacement rate exhibited clear differences between the decentralized and coordinated modes. Under the decentralized mode, the campus system achieved an annual average replacement rate of 90.95%, with the lowest monthly value of 45.81% in January. The rate increased steadily thereafter, reaching 100% in April and remaining at this level until November, before slightly declining to 91.52% in December due to reduced rainfall. In contrast, the residential system showed a lower annual average replacement rate of 65.06%. Its monthly performance fluctuated more significantly, with the lowest value of 16.98% in February and the highest value of 100% from August to October, followed by a sharp decrease to 22.94% in December. On average, the decentralized mode resulted in an overall replacement rate of approximately 78% across the campus and residential systems.
In the coordinated mode, the system achieved an annual average replacement rate of 87.89%, representing an increase of 9.89 percentage points (12.68%) compared with the decentralized mode. Although this value was slightly lower than that of the campus system in the decentralized mode, it was substantially higher than that of the residential system. Moreover,
Figure 7 illustrates that the monthly replacement rate under the coordinated mode consistently equaled or exceeded that of the decentralized mode throughout the year. These results highlight the advantage of the interlinked system’s cross-regional water allocation mechanism, which significantly enhances the replacement capacity of rainwater. This effect is particularly beneficial for the residential system, where the inherent limitations were mitigated, leading to a substantial reduction in freshwater demand.
3.4. Overflow Volume
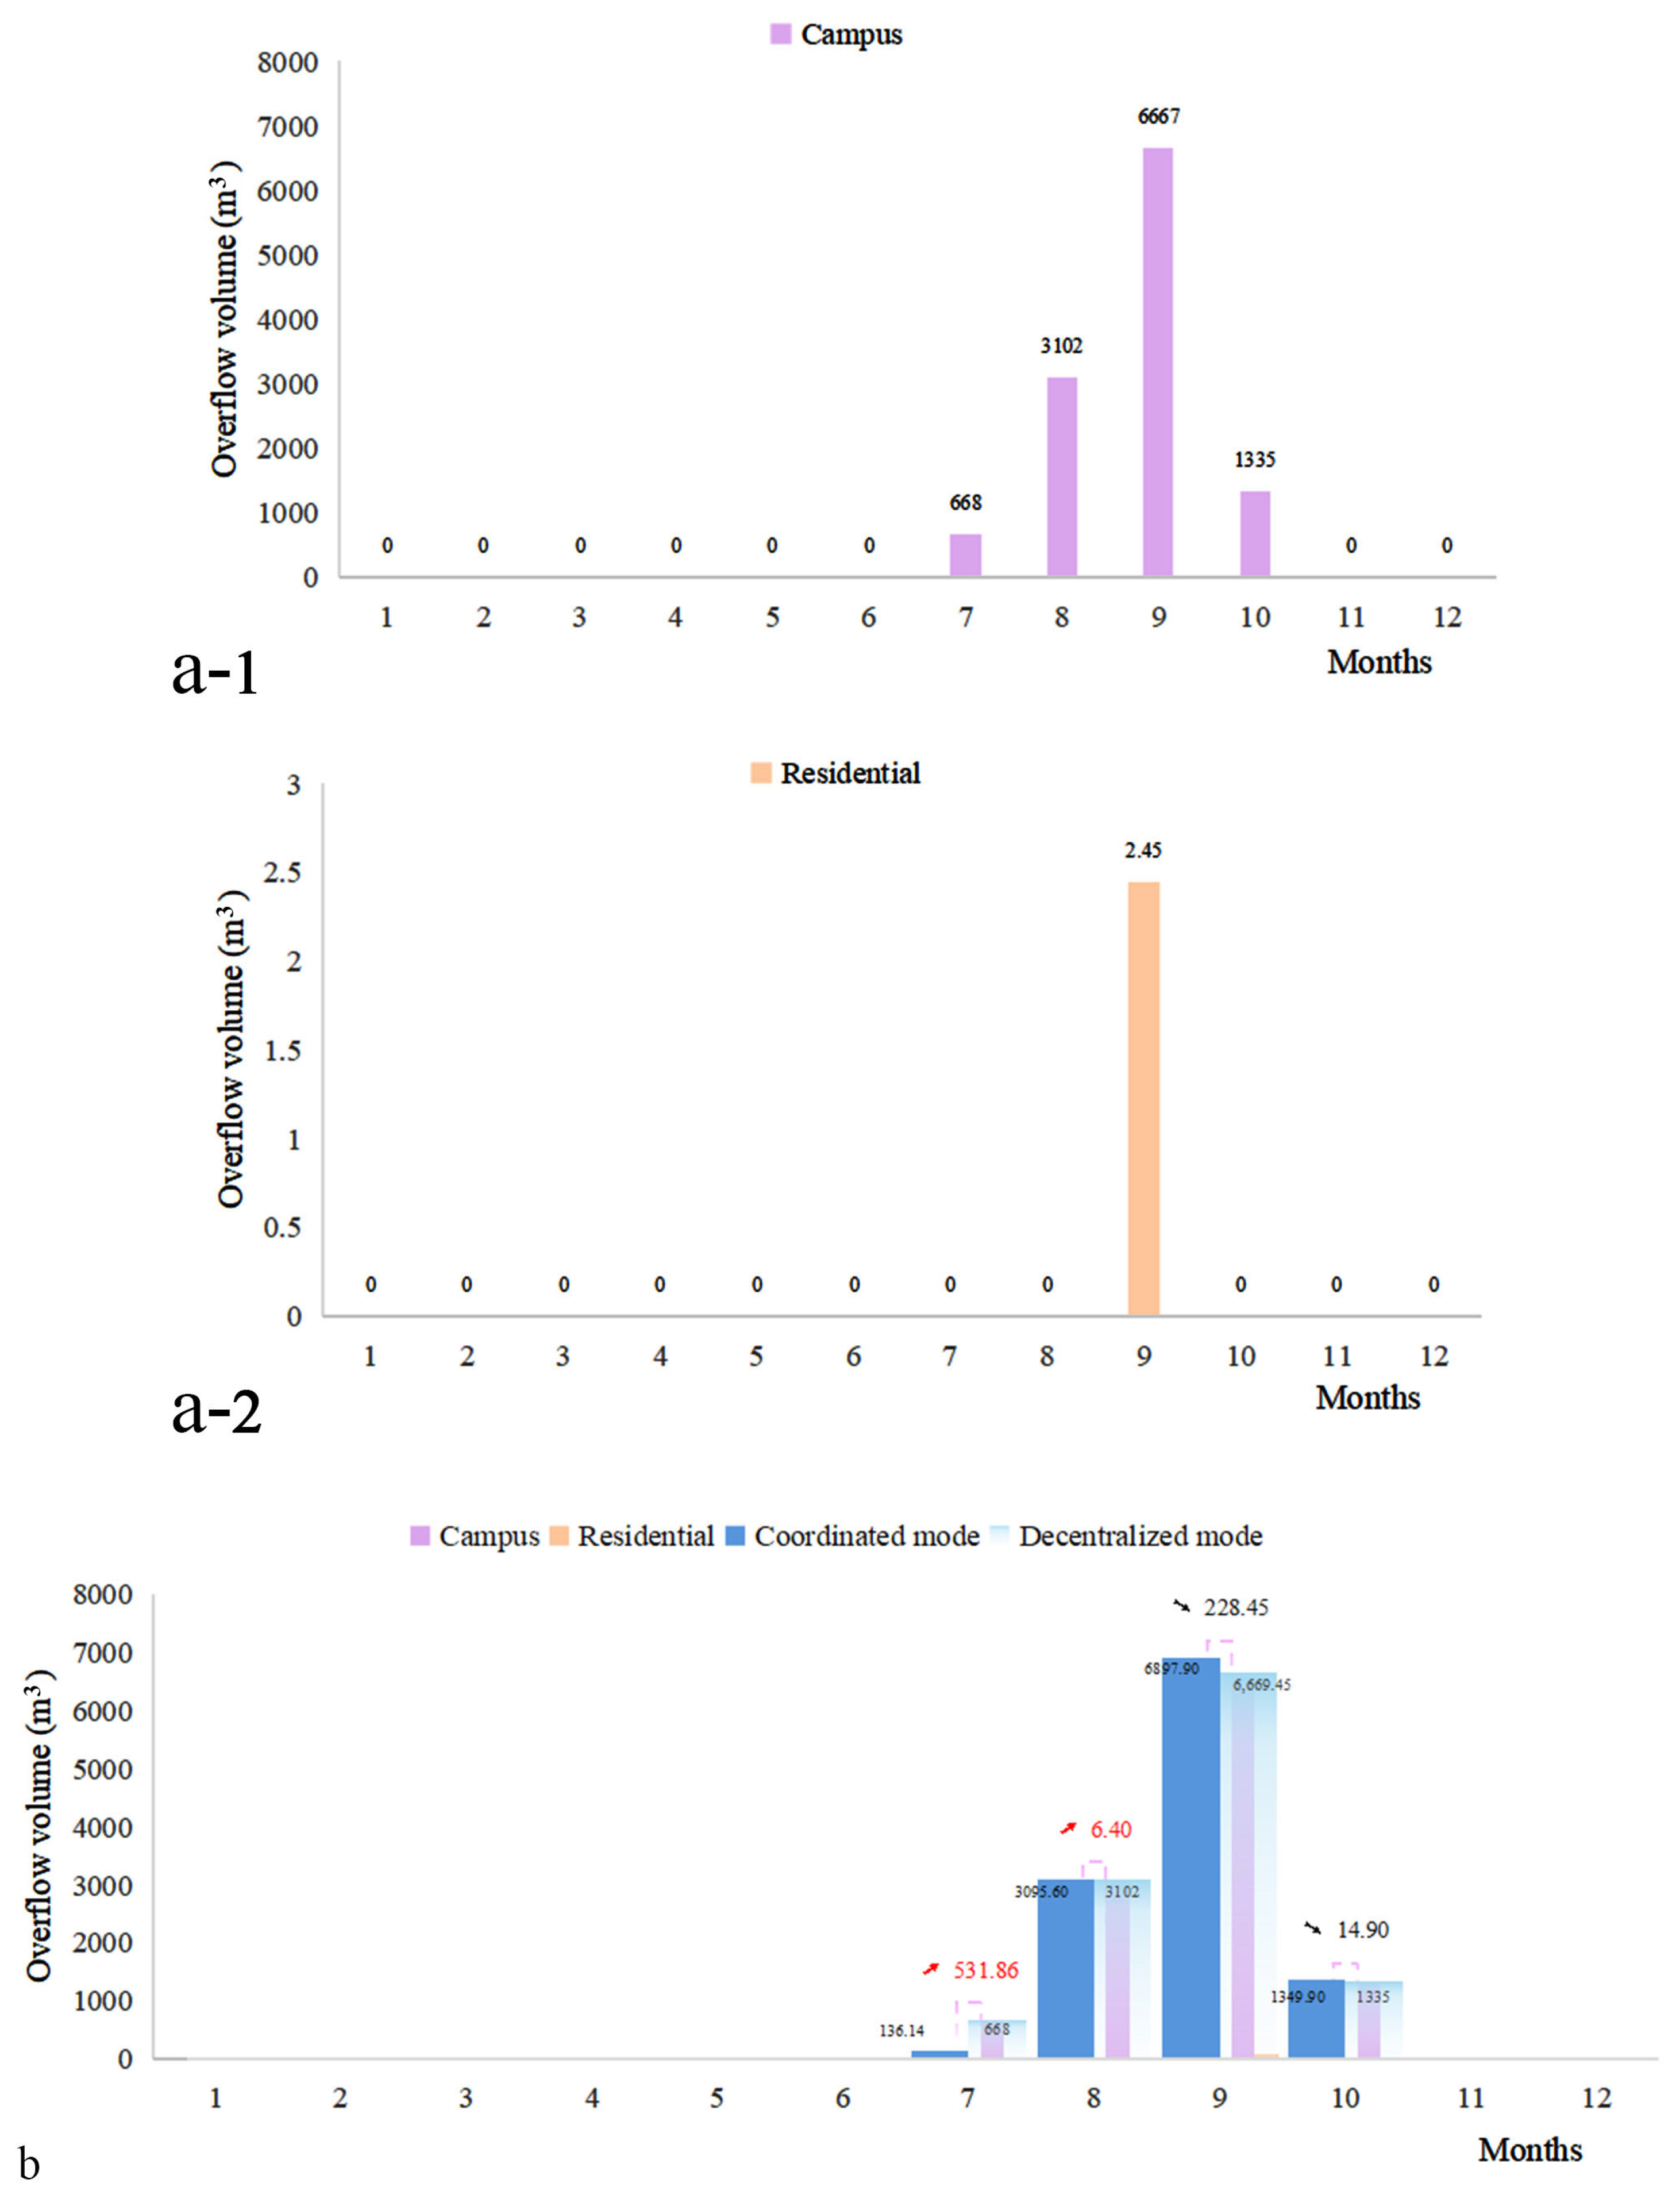
As shown in
Figure 8, in the decentralized mode, the total annual overflow volume of the campus RWH system is 11,772 m
3. From a monthly perspective, there is no overflow from January to June. With increasing rainfall, overflow begins in July (668 m
3) and rises steadily, peaking in September at 6667 m
3. As rainfall decreases, the overflow volume declines month by month, and no overflow occurs in November and December. In the residential area, the total annual overflow volume is only 2.45 m
3, with overflow occurring primarily in September, a period of intense rainfall, while other months see virtually no overflow. In total, the combined annual overflow from both systems in the decentralized mode amounts to 11,774.45 m
3.
In the coordinated mode, the overall system overflow is significantly reduced, with an annual total of 11,479.54 m3, representing a decrease of 294.91 m3 compared to the decentralized mode. The monthly comparison shows that the coordinated system is particularly effective in July and August—months with high rainfall—where it reduces overflow by 538.26 m3, demonstrating its strong regulatory advantage and effectively alleviating drainage pressure during peak rainfall periods. However, in September, as rainfall intensity continues, the linked system temporarily underperforms, and the overflow exceeds that of the decentralized mode. This phenomenon is attributed to a 50.14% surge in rainfall compared to August, surpassing the designed inter-district water redistribution threshold. As a result, the system temporarily lost its capacity for surplus transfer between zones.
In summary, the coordinated mode, through a unified scheduling mechanism, shows outstanding overflow control during periods of normal rainfall. By expanding overall system storage capacity, surplus rainwater in one area can be transferred and utilized in another, significantly reducing overflow risks and enhancing the system’s ability to manage high-intensity rainfall. To further improve resilience under extreme conditions, future strategies should consider dynamically expanding storage facilities or coupling with climate forecasting models to optimize overflow control comprehensively.
3.5. Number of Overflow Days
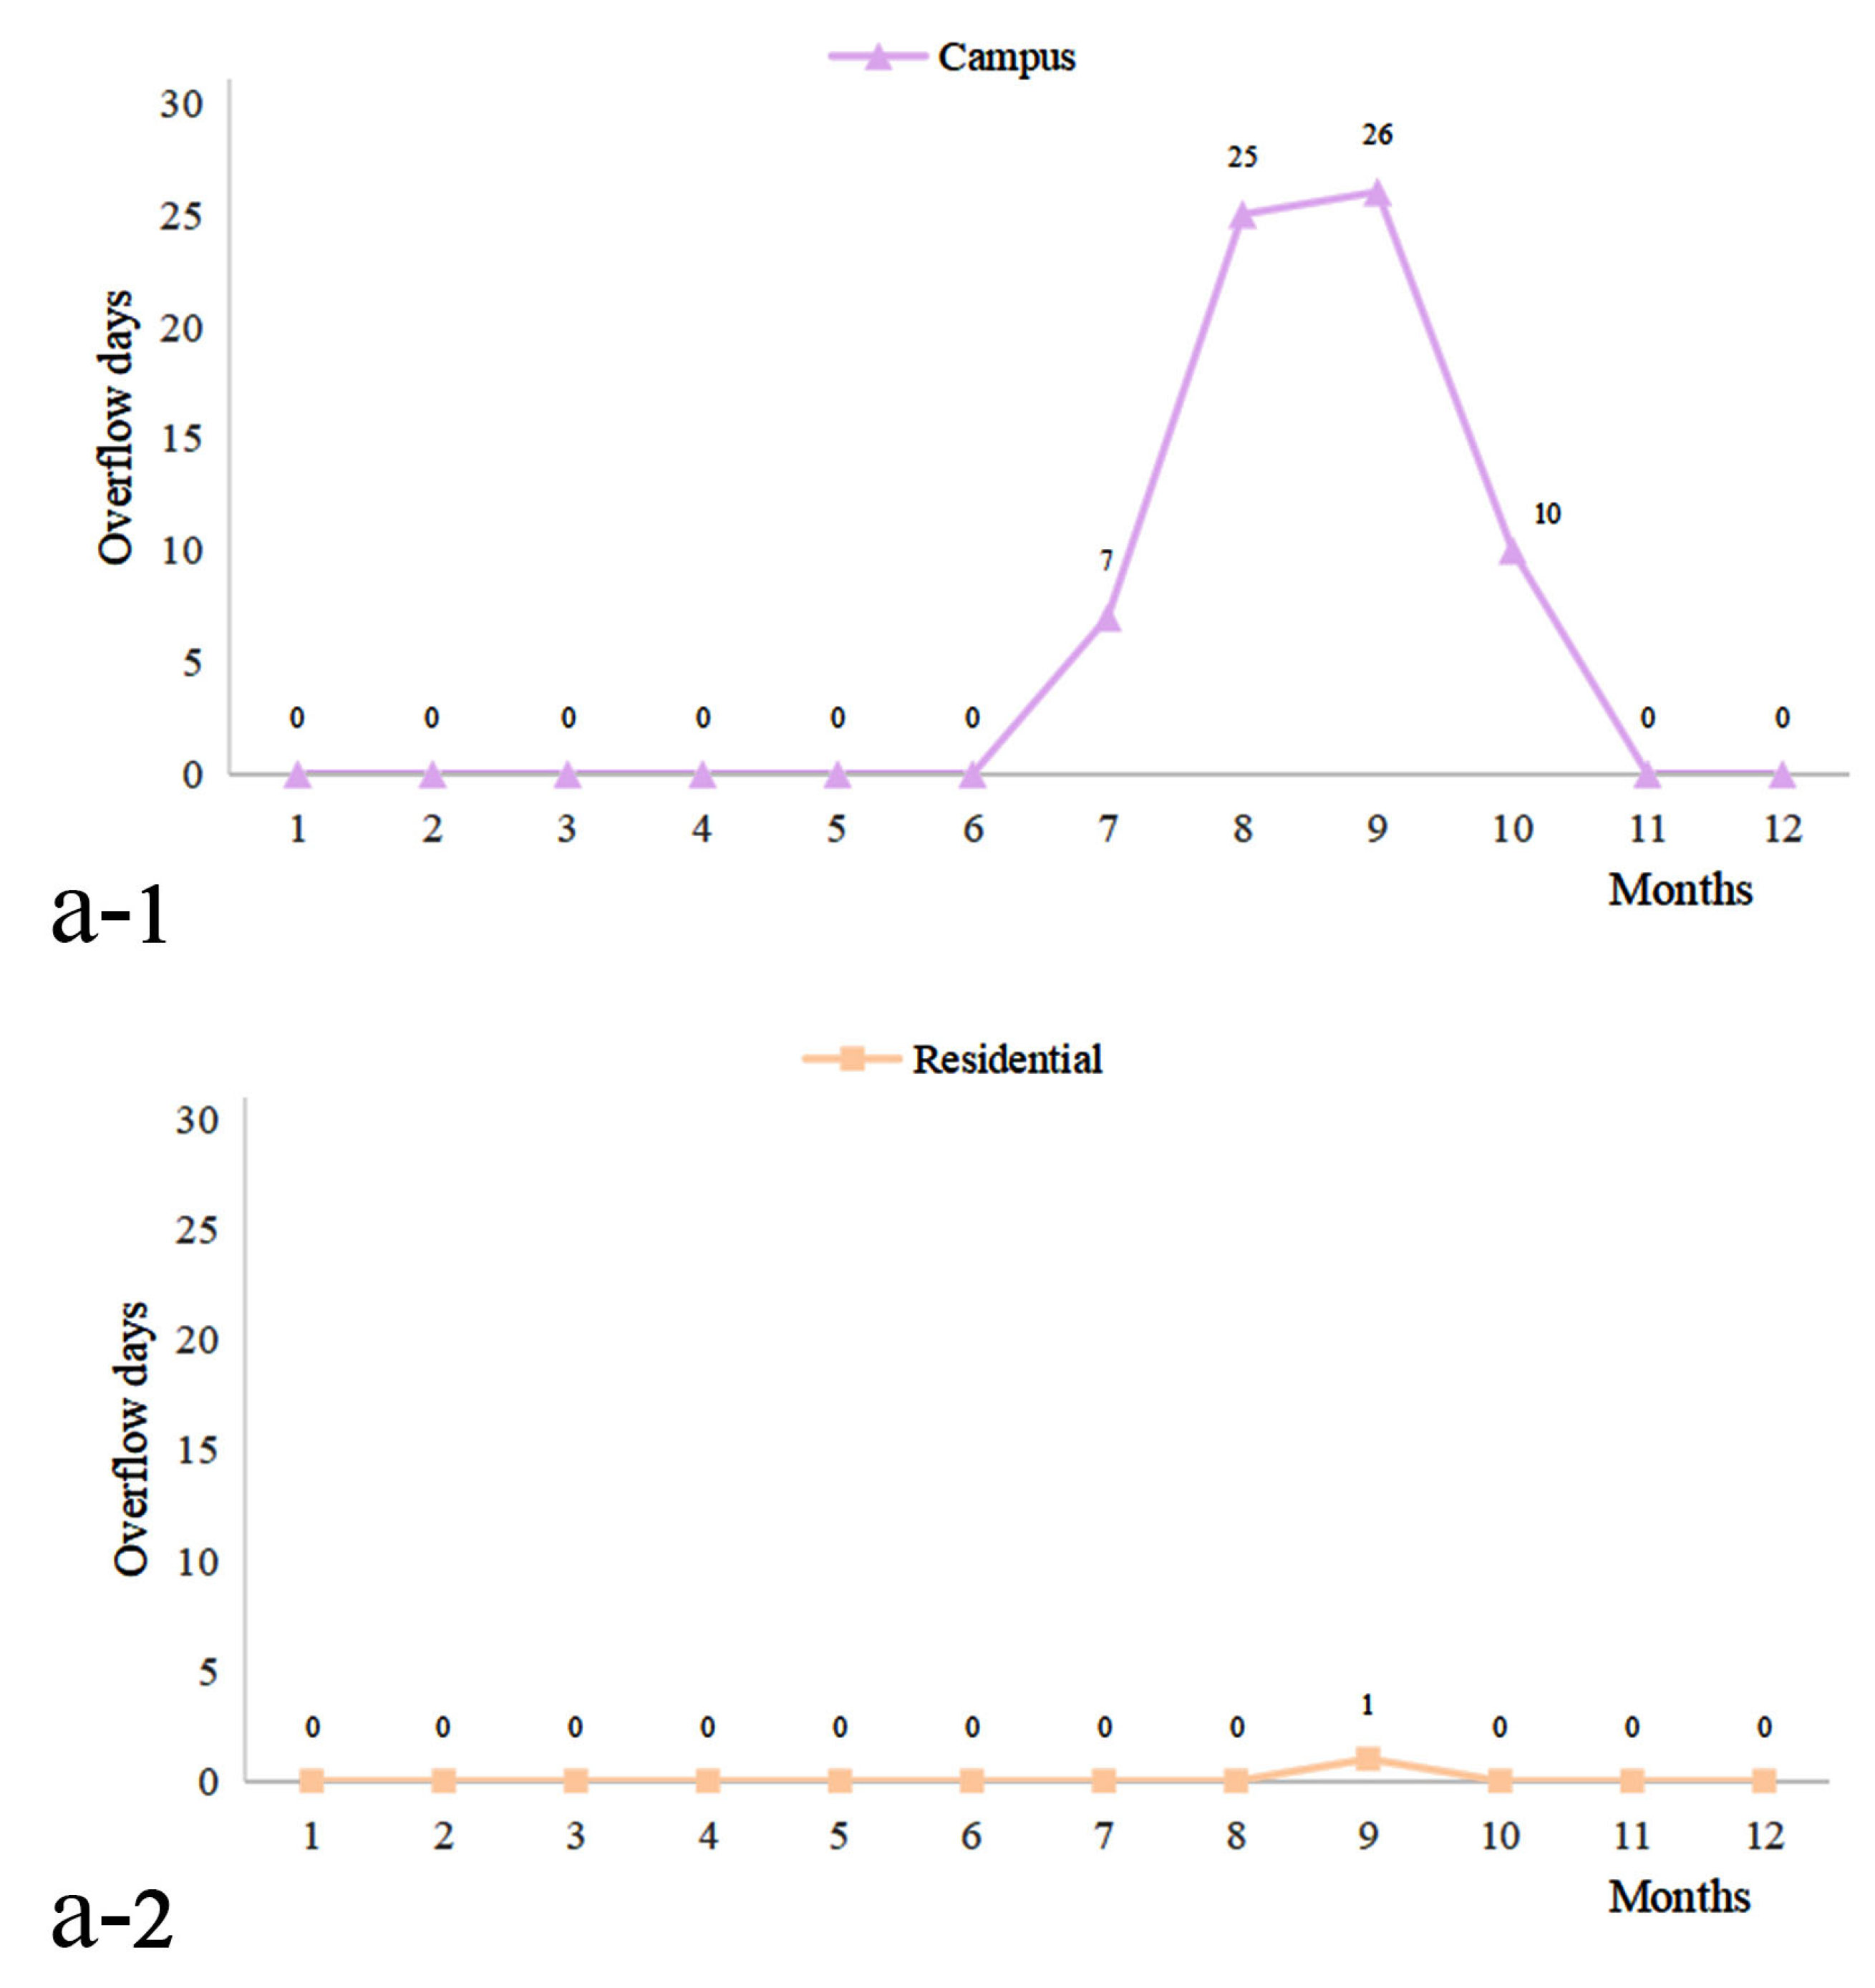
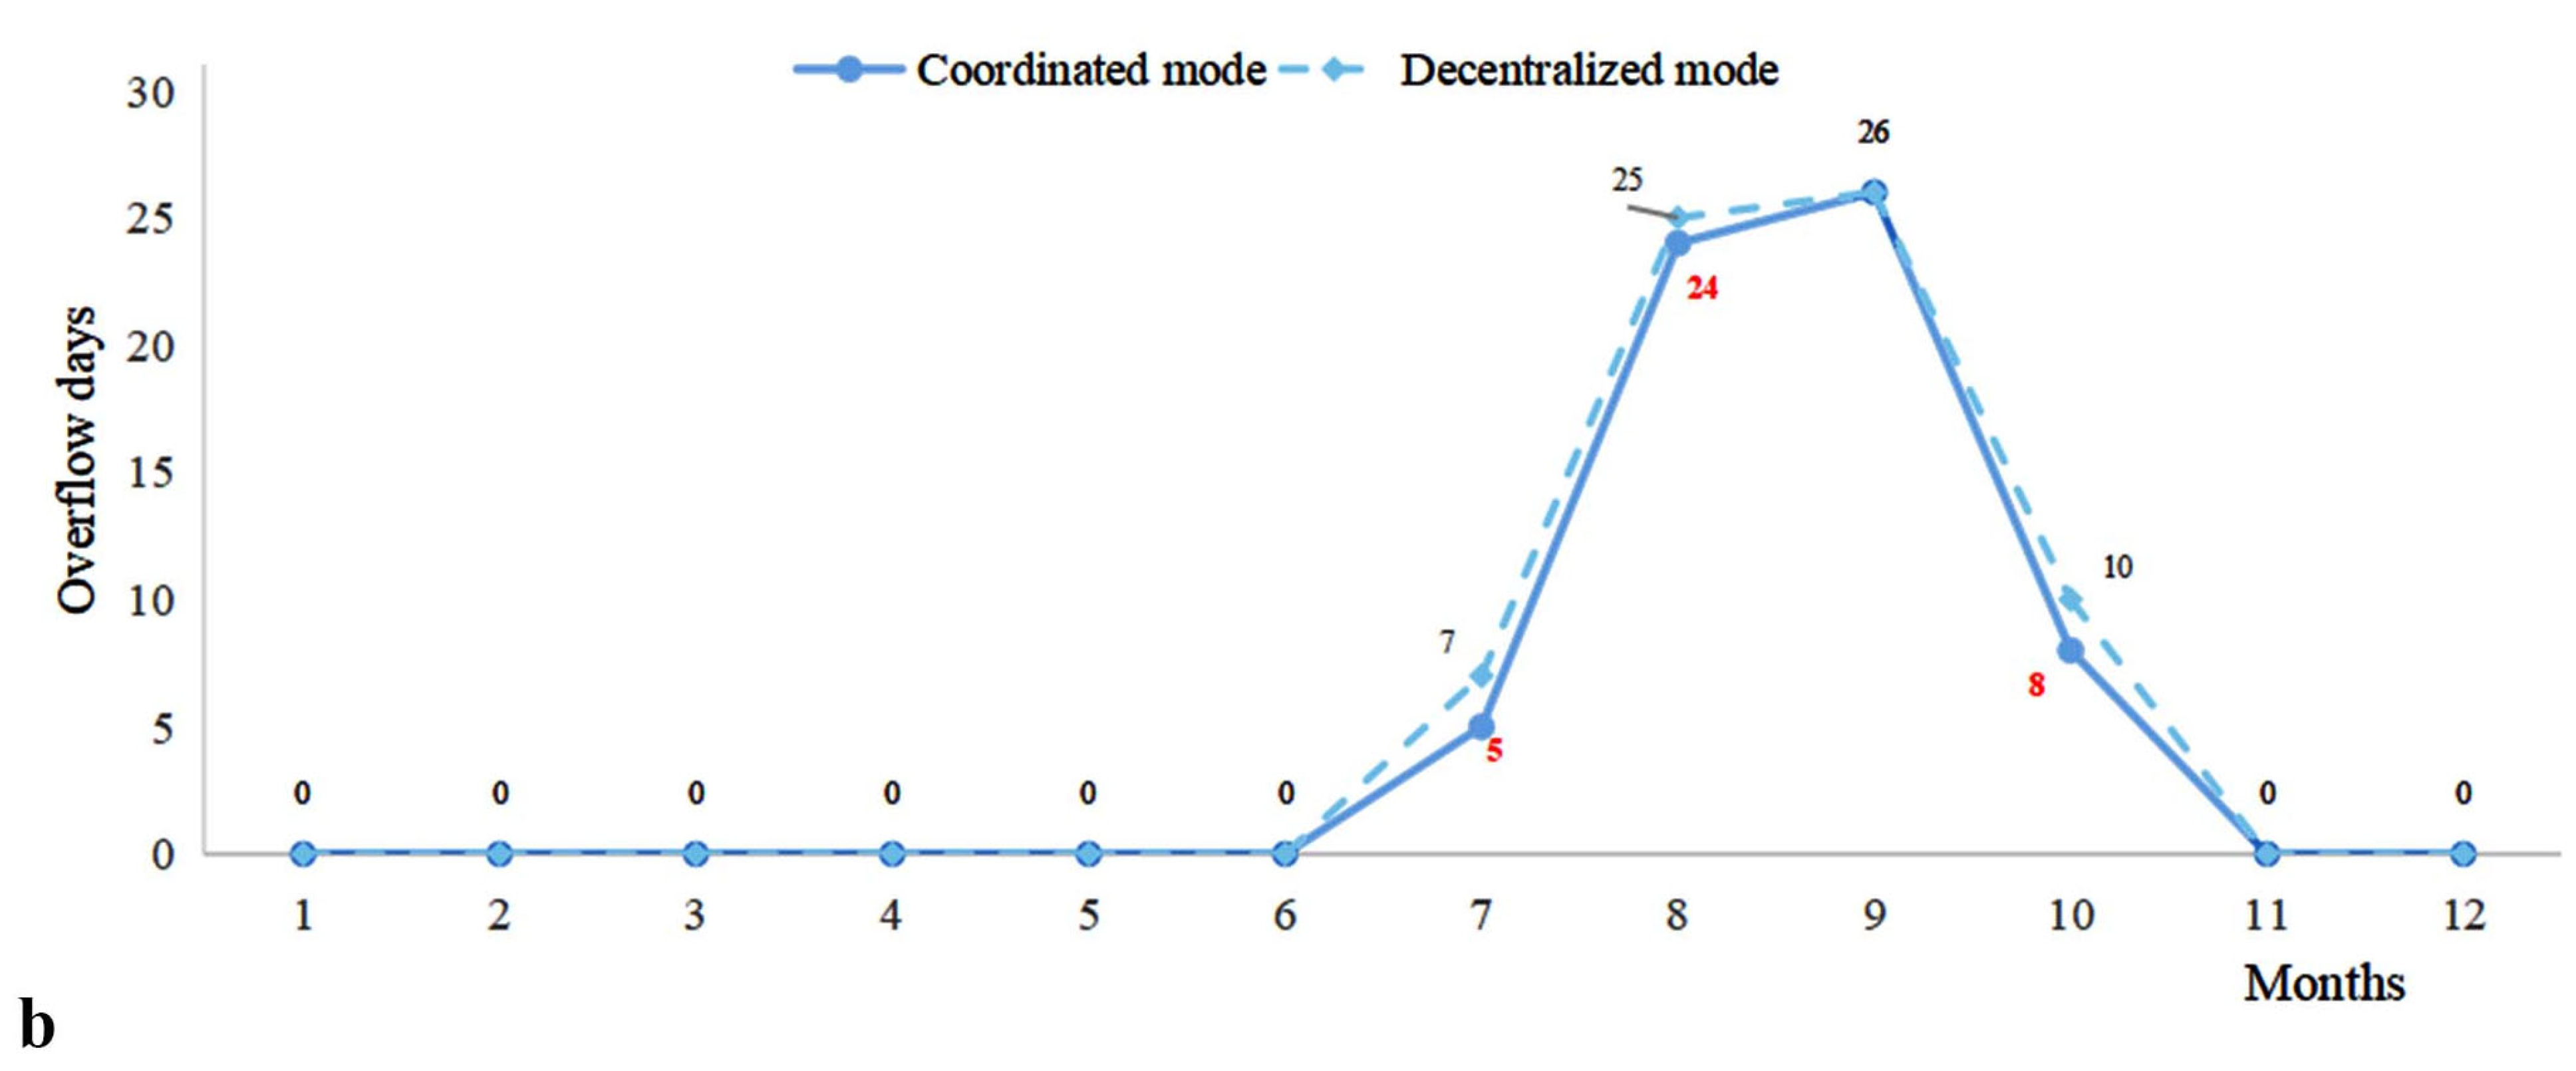
Figure 9 illustrates the comparison of overflow days under different operational modes. In the Decentralized mode, the campus RWH system experienced a total of 68 overflow days throughout the year. Overflows began in July, became frequent in August and September, and peaked in September with 26 overflow days. In contrast, the residential RWH system recorded only one overflow day during the entire year, occurring in September.
Under the Coordinated mode, the total number of overflow days across the entire system decreased to 63 days, representing a reduction of 5 days or 7.35% compared to the Decentralized mode. The distribution of overflow days followed a unimodal pattern, beginning in July and peaking in September with 26 days of overflow. As shown in the monthly distribution chart, the number of monthly overflow days in the Coordinated mode was consistently equal to or fewer than those in the Decentralized mode. This finding demonstrates that the Coordinated mode, by enabling water sharing and synchronized regulation between systems, can effectively mitigate the risk of localized tank overflows during high-intensity rainfall events. Through regional-scale buffering, the coordinated system offers improved resilience in managing extreme weather. Not only does this mechanism enhance daily operational performance, but it also provides greater storage flexibility and disaster mitigation potential during seasonal extreme rainfall periods.
3.6. Overflow Difference Heatmap Analysis
To more intuitively identify the impact of coordinated operation on overflow mitigation,
Figure 10 presents a heatmap illustrating the daily overflow differences between the decentralized mode and the coordinated mode. In the figure, blue cells (value = –1) indicate a reduction in overflow on that day under the Coordinated mode compared to the Decentralized mode; red cells (value = +1) represent increased overflow; and white cells (value = 0) indicate no significant difference between the two modes.
As shown in
Figure 10, the period from mid-July to early October is marked by a high concentration of blue cells, indicating that during the high-rainfall season, the Coordinated mode effectively alleviated overflow risks. This is achieved through inter-regional storage reallocation, which mitigates the rapid saturation of either the campus or the residential tank due to intense rainfall. Notably, the period from mid-August to mid-September exhibits the most concentrated blue zone, suggesting that the system’s interlinked capacity was fully activated during this time, achieving optimal cross-regional water allocation.
However, a few red cells—mainly in early August and early September—indicate instances where the Coordinated mode resulted in increased overflow. This may stem from the dispatching strategy failing to achieve balanced distribution under highly localized extreme rainfall events, thereby imposing excessive load on either the campus or residential subsystem. This highlights the need to refine the operational logic of coordinated systems to avoid imbalanced scheduling or delayed response that could increase localized overflow risks.
In summary, the Coordinated mode demonstrates a significant advantage in overflow management, especially during heavy rainfall periods, by enhancing cross-regional balancing and reducing drainage burdens. The concentration of blue cells during peak rainfall seasons indicates coordinated buffering that can alleviate environmentally relevant overflow events at the system scale. Nevertheless, future research should focus on incorporating high-resolution hydrometeorological data and intelligent control algorithms to improve the precision and reliability of inter-regional water volume management.
4. Discussion
This study employed an hourly water balance model to compare rainwater harvesting (RWH) performance between a campus and an adjacent residential area under decentralized and coordinated operational modes. The results demonstrate that coordinated operation effectively leverages spatial imbalances: the campus, with its large collection area, supplied harvested rainwater to the residential area with limited roof space. This reallocation reduced annual potable water supplementation by 340.91 m3, achieving a 14.11% saving. Benefits were particularly evident during transitional months like April and May, where inter-area transfers alleviated local shortages exceeding 100 m3 per month, helping to mitigate seasonal supply–demand mismatches. Significant differences were also observed in non-potable water replacement rates. Under decentralized operation, the residential system achieved only 65.06% on average due to its small catchment, while the campus reached 90.95%. Coordinated operation raised the system-wide average replacement rate to 87.89%, representing a 12.68% improvement over the decentralized case. Except for January and February, monthly replacement rates under coordination were consistently equal to or higher than decentralized rates. This confirms that integration enhances overall efficiency and provides critical support to areas with weaker harvesting capacity, such as the residential zone. Reliability followed a comparable pattern. Decentralized operation yielded an annual reliability of 60.9% for the residential area, with eight months below 80% reliability and a low of 3.23% in December. The campus alone performed better (88.09% reliability) but could not offset the residential deficits. Linking the systems improved overall reliability to 81.67%. Although slightly lower than the campus-only case, this was 9.69% higher than the residential-only case. Crucially, the number of months with reliability below 80% halved from eight to four, indicating a shift from localized optimization towards a more balanced system-wide performance.
The coordinated mode also offered advantages in managing overflow during heavy rainfall. Annual overflow decreased from approximately 11,774.45 m
3 (decentralized) to 11,479.54 m
3 (coordinated), a reduction of 294.91 m
3. The effect was strongest in July and August, where reductions reached 538.26 m
3, demonstrating that shared storage capacity alleviates drainage pressure during peak rainfall events. In September, however, a sudden 50.1% increase in rainfall intensity temporarily exceeded the coordinated system’s regulatory capacity, resulting in slightly higher overflow compared to decentralized operation. Aside from this exception, the overall pattern indicates that coordination better facilitates “peak shaving and valley filling.” Overflow days also decreased from 68 to 63 (a 7.4% reduction), and notably, did not increase further during the September events.
Figure 10 provides further evidence of this regulatory effect. Between mid-July and early October, the significant reduction in coordinated overflow is clearly visible as dense blue areas. Concurrently, localized red grids in early August and September highlight the limitations of the current scheduling strategy in handling sudden, highly localized storms. Addressing these events requires more refined predictive scheduling to enhance responsiveness under rapidly changing rainfall conditions.
In summary, the findings indicate that coordinated RWH operation extends beyond mere water reallocation; it represents a strategy that strengthens urban water resilience. At the same time, we recognize that the study is based on a single case in Japan, and the transferability of results requires critical reflection. Similarly to carbon-reduction strategies, the effectiveness of water-saving measures is not universal but strongly shaped by local conditions such as climate, infrastructure, and socio-economic context. For example, city-scale studies in Hangzhou, China, have shown how sectoral decarbonization potential is influenced by interactions between construction activities and upstream industries [
31], and how carbon emission trajectories are driven by economic and structural factors [
32]. Likewise, research on Chinese urban households highlights the importance of social and economic aspects in shaping end-use energy consumption patterns [
33]. These findings suggest that, just as carbon-reduction outcomes vary across cities, the performance of coordinated RWH systems should also be expected to depend on specific urban contexts.
Moreover, cross-sectoral lessons can be drawn. Just as construction and demolition (C&D) waste recycling has been evaluated for its carbon contribution in Japanese cities [
34], coordinated RWH can be seen as a complementary pathway in reducing environmental burdens within urban water systems. Limitations should also be acknowledged. The present model did not incorporate certain physical processes, such as variations in rainwater quality, evaporation losses, and pipeline delay effects, as stated in the simulation assumptions. While these simplifications allowed focus on supply–demand dynamics, they may affect accuracy under specific conditions. In addition, the results indicate that the current scheduling strategy has limited responsiveness to sudden, highly localized extreme rainfall events, suggesting the need for more refined predictive control. This comparison strengthens the relevance of our study for international readers and highlights the potential applicability of the modeling framework beyond Japan.
At the same time, it should be noted that the coordinated mode would require additional pipelines to connect the dormitory rooftops to the campus Energy Center. While such installation is relatively straightforward compared with constructing a new treatment facility, the associated construction requirements and implementation challenges were not quantified in this study. Future work should therefore incorporate installation complexity and cost as evaluation parameters to provide a more comprehensive basis for practical decision-making. While the modeling framework is intentionally simple, the cross-functional application with hourly resolution and dual performance lenses (reliability/overflow) provides operational insights for coordinative deployment in similar campus–residential districts. With further development, particularly through predictive control and intelligent scheduling, linked RWH systems hold significant potential for balancing supply and demand, reducing flood risks, and supporting sustainable urban water management.
5. Conclusions
This study focused on a rainwater harvesting system comprising a university campus and its adjacent residential area in Kitakyushu, Japan. It quantitatively evaluated the performance differences between the system operating under decentralized mode and coordinated mode. Utilizing an hourly water balance model, the research specifically analyzed five key performance indicators: potable water supplementation volume, water supply reliability, non-potable water replacement rate, overflow volume, and overflow days. The principal findings are summarized as follows:
- (1)
Significant Reduction in Potable Water Supplementation: Under coordinated operation, the annual system-wide potable water supplementation requirement decreased by 340.91 m3, representing a reduction of 14.11%. This demonstrates that the coordinated mechanism effectively reduces dependence on external water sources such as municipal supply networks.
- (2)
Enhanced System Reliability with Notable Benefits for Residential Area: The overall system water supply reliability increased by 9.62%, reaching 81.67%. Improvement in water security was particularly pronounced for the residential area, which possesses limited catchment capacity.
- (3)
Stable Increase in Non-Potable Water Replacement Rate: The system-wide average non-potable water replacement rate increased by 12.68%, rising from 75.21% under decentralized mode to 87.89% under coordinated mode. Notably, for every month of the year, the monthly replacement rate under coordinated operation was equal to or higher than that under decentralized operation, indicating enhanced operational stability.
- (4)
Improved Overflow Control: Coordinated operation reduced the total annual overflow volume by 294.91 m3 (from 11,774.45 m3 to 11,479.54 m3) and decreased the number of overflow days by 5 days (from 68 days to 63 days). Even during heavy rainfall, the coordinated system demonstrated certain regulation capabilities and flood control potential.
- (5)
Cross-Regional Buffering Capability and Limitations: Analysis revealed that the coordinated system effectively facilitated cross-regional water buffering during high rainfall periods, such as summer months (e.g., July, August). However, during specific extreme rainfall events (e.g., the September incident), instances of uneven water distribution were observed. This highlights the need for future optimization of control logic and enhanced system resilience design.
In summary, this study demonstrates that implementing a coordinated rainwater harvesting system in spatially adjacent areas with interconnected infrastructure (e.g., campus–residential areas) can improve overall system performance to a certain extent. This strategy proves particularly effective for optimizing water resource synergy between resource-constrained zones (e.g., residential areas) and high-performance nodes (e.g., large public buildings). Future research should prioritize the integration of dynamic scheduling mechanisms and real-time information feedback systems. This will strengthen the system’s capacity to respond to uncertainty, such as extreme rainfall events, thereby advancing urban rainwater management towards greater intelligence and resilience.

