Article

Experimental Comparison of Ventilation Strategies for Condensation Risk in Underground Wheat Granaries

School of Civil Engineering, Henan University of Technology, Zhengzhou 450001, China
*
Author to whom correspondence should be addressed.
Buildings 2025, 15(19), 3483; https://doi.org/10.3390/buildings15193483
Submission received: 28 August 2025 / Revised: 19 September 2025 / Accepted: 24 September 2025 / Published: 26 September 2025
(This article belongs to the Special Issue Advances in Green Building and Environmental Comfort)

Abstract

Underground granaries offer natural insulation for long-term grain storage, yet spatial heterogeneity in temperature and humidity can drive condensation and degrade grain quality. To address this issue, mechanical ventilation is commonly employed, yet evidence remains limited on whether pretreating the inlet air before ventilation can further reduce the risk of condensation. In order to bridge this gap, a custom-designed small-scale underground granary was employed, in which temperature and relative humidity of the grain pile, surrounding soil, and ambient air were monitored at 28 sampling points. The effectiveness of mechanical ventilation and ventilation pretreatment in reducing condensation was also assessed. Results demonstrated that during static storage, the granary was minimally affected by external conditions. Yet, a high temperature and humidity area developed at the top of the grain pile over the 24-day period of static storage. Under mechanical ventilation, local relative humidity decreased but grain temperature still responded to ambient conditions. In contrast, ventilation pretreatment stabilized inlet air, lowered peak grain temperature by 1 °C, and improved relative humidity reduction from 6% to 12%. This produced a more uniform temperature–humidity profile and markedly reduced condensation risk.

1. Introduction

Grain serves as the fundamental basis for human survival [1]. According to the United Nations Industrial Development Organization, grain storage losses account for approximately 5% of post-harvest losses [2], making them a major cause of post-harvest grain losses in developing countries [3]. Consequently, effective grain storage with minimal grain losses could significantly contribute toward reducing overall post-harvest grain losses [4]. Underground granaries, with their excellent insulation properties and ability to maintain low temperatures, have garnered significant attention for their potential to preserve grain quality [5]. However, the respiration of grain may lead to non-uniform temperature and humidity distribution within grain piles in underground granaries [6], resulting in condensation. Therefore, maintaining appropriate temperature and humidity levels in underground granaries is crucial for preserving grain quality [7]. Condensation in granaries is not merely a microclimate phenomenon; it directly impacts grain quality and safety. Li et al. [8] have identified the condensation and mildew risks scenario as a key issue in sensor monitoring studies. Furthermore, condensation on grain surfaces in metal silos, caused by sunlight exposure and diurnal temperature differences, has become a typical problem [9]. Studies have shown that condensation leads to the formation of high-humidity spots on the grain surface or walls, increasing local water activity and accelerating mold growth [10]. Once the local water activity reaches approximately 0.9 or higher, the risk of fungal contamination and mycotoxin production during storage increases significantly, leading to grain clumping and quality deterioration [11]. Therefore, addressing condensation is urgent and crucial.
In response to these challenges, numerous scholars have conducted extensive research on the changes in temperature and humidity during grain storage. Some researchers have observed that even under conditions of grain spoilage, lower temperatures and humidity levels within granaries can still limit grain activity and maintain quality [12]. Other studies have demonstrated that the migration and redistribution of temperature and relative humidity within wheat grain piles are caused by conduction and convection effects [13]. Temperature fluctuations are primarily responsible for condensation in conventional metal silos [14]. In most cases, temperature variations at the top of the grain pile exceed those internally, even in small silos, minor temperature differences can induce micro-airflow within the silo [15]. The micro-airflow affects the temperature transfer in the grain pile, resulting in the temperature at the top of the storage structure being higher than that at the bottom [16]. Additionally, grain temperature variations are influenced by airflow velocity and the temperature difference between the air and the grain [17], the grain’s thermal diffusivity decreased with the increase in moisture content, increase in storage time, and decrease in temperature [18]. Further, some scholars have employed various technological means to observe changes in temperature and humidity within granaries. LoVetri et al. [19] and Asefi et al. [20] utilized electromagnetic imaging technology to study overall temperature and humidity and localized high humidity areas within stored grains. Novoa [21] conducted experimental studies on the temperature field within concrete cylindrical silos and developed a two-dimensional finite-difference model to calculate the heat transfer. Shammi et al. [22] applied vertical vacuum drying machines to study changes in temperature and humidity during post rice storage and analyzed their costs.
Furthermore, appropriate ventilation plays a crucial role in altering the distribution of temperature and humidity within grain piles [23]. The most commonly used method involves mechanical ventilation [24]. The heat generated by the grain itself can be controlled by the ventilation process [25]. Numerous studies have investigated the effects of mechanical ventilation on temperature and humidity changes within silos. Experimental findings have indicated that ventilation can maintain a uniformly low temperature throughout the grain pile [26]. Additionally, mechanical ventilation can effectively remove excess heat and moisture, maintaining safe moisture levels for grain [27]. It has also been discovered that airflow velocity is an important factor in the cooling process of grains within the pile [28]. During ventilation, heat and moisture transferred from deeper layers to the upper part of the grain result in increased relative humidity and temperature values in the upper layer and space above the grain [29]. To enhance the ventilation management during grain storage, researchers have developed some novel ventilation strategies. Gao et al. [30] developed a smart mechanical aeration control software based on the operation modes of moisture-decreasing and cooling ventilation. Antunes et al. [31] developed an automated system of aeration to evaluate the development of strategies for controlling the aeration of stored corn. Lopes et al. [32] proposed a new mechanical ventilation control strategy that automatically adjusts initial settings based on different environments to balance temperature differences within silos. Moreover, researchers have optimized ventilation systems. Canizares et al. [33] studied soybean storage in various silos and suggested that incorporating a non-illuminated exhaust system significantly reduced ventilation time and energy consumption. Petravicius et al. [34] examined the limitations and discreteness of air inlets during mechanical ventilation and optimized granary size and inlet configuration.
Fresh-air precooling is a common approach for preconditioning indoor supply air. Studies on temperature regulation and airflow stabilization have shown that pre-cooling inlet air can significantly improve system performance [35]. Dhafer Manea Hachim et al. [36] demonstrated that pre-cooling at boundary ends enhances the performance of photovoltaic solar cells by stabilizing temperature fluctuations. Lei et al. [37] combined ground-source heat exchangers with solar chimneys (SEVS), and the results showed that it could reduce indoor temperatures by approximately 5–9 °C during the summer. Wang et al. [38] combined experimental and numerical simulation methods to compare ambient air with cooled air, finding that cooled air is more suitable for grain storage. Zhong et al. [39] proposed a pretreatment measure for underground pipelines to enhance ventilation performance, resulting in a 7.5 °C temperature reduction during summer ventilation experiments. Although some studies have examined the role of ventilation pretreatment in indoor temperature and humidity regulation, the application of air pretreatment in underground granary ventilation has rarely been reported.
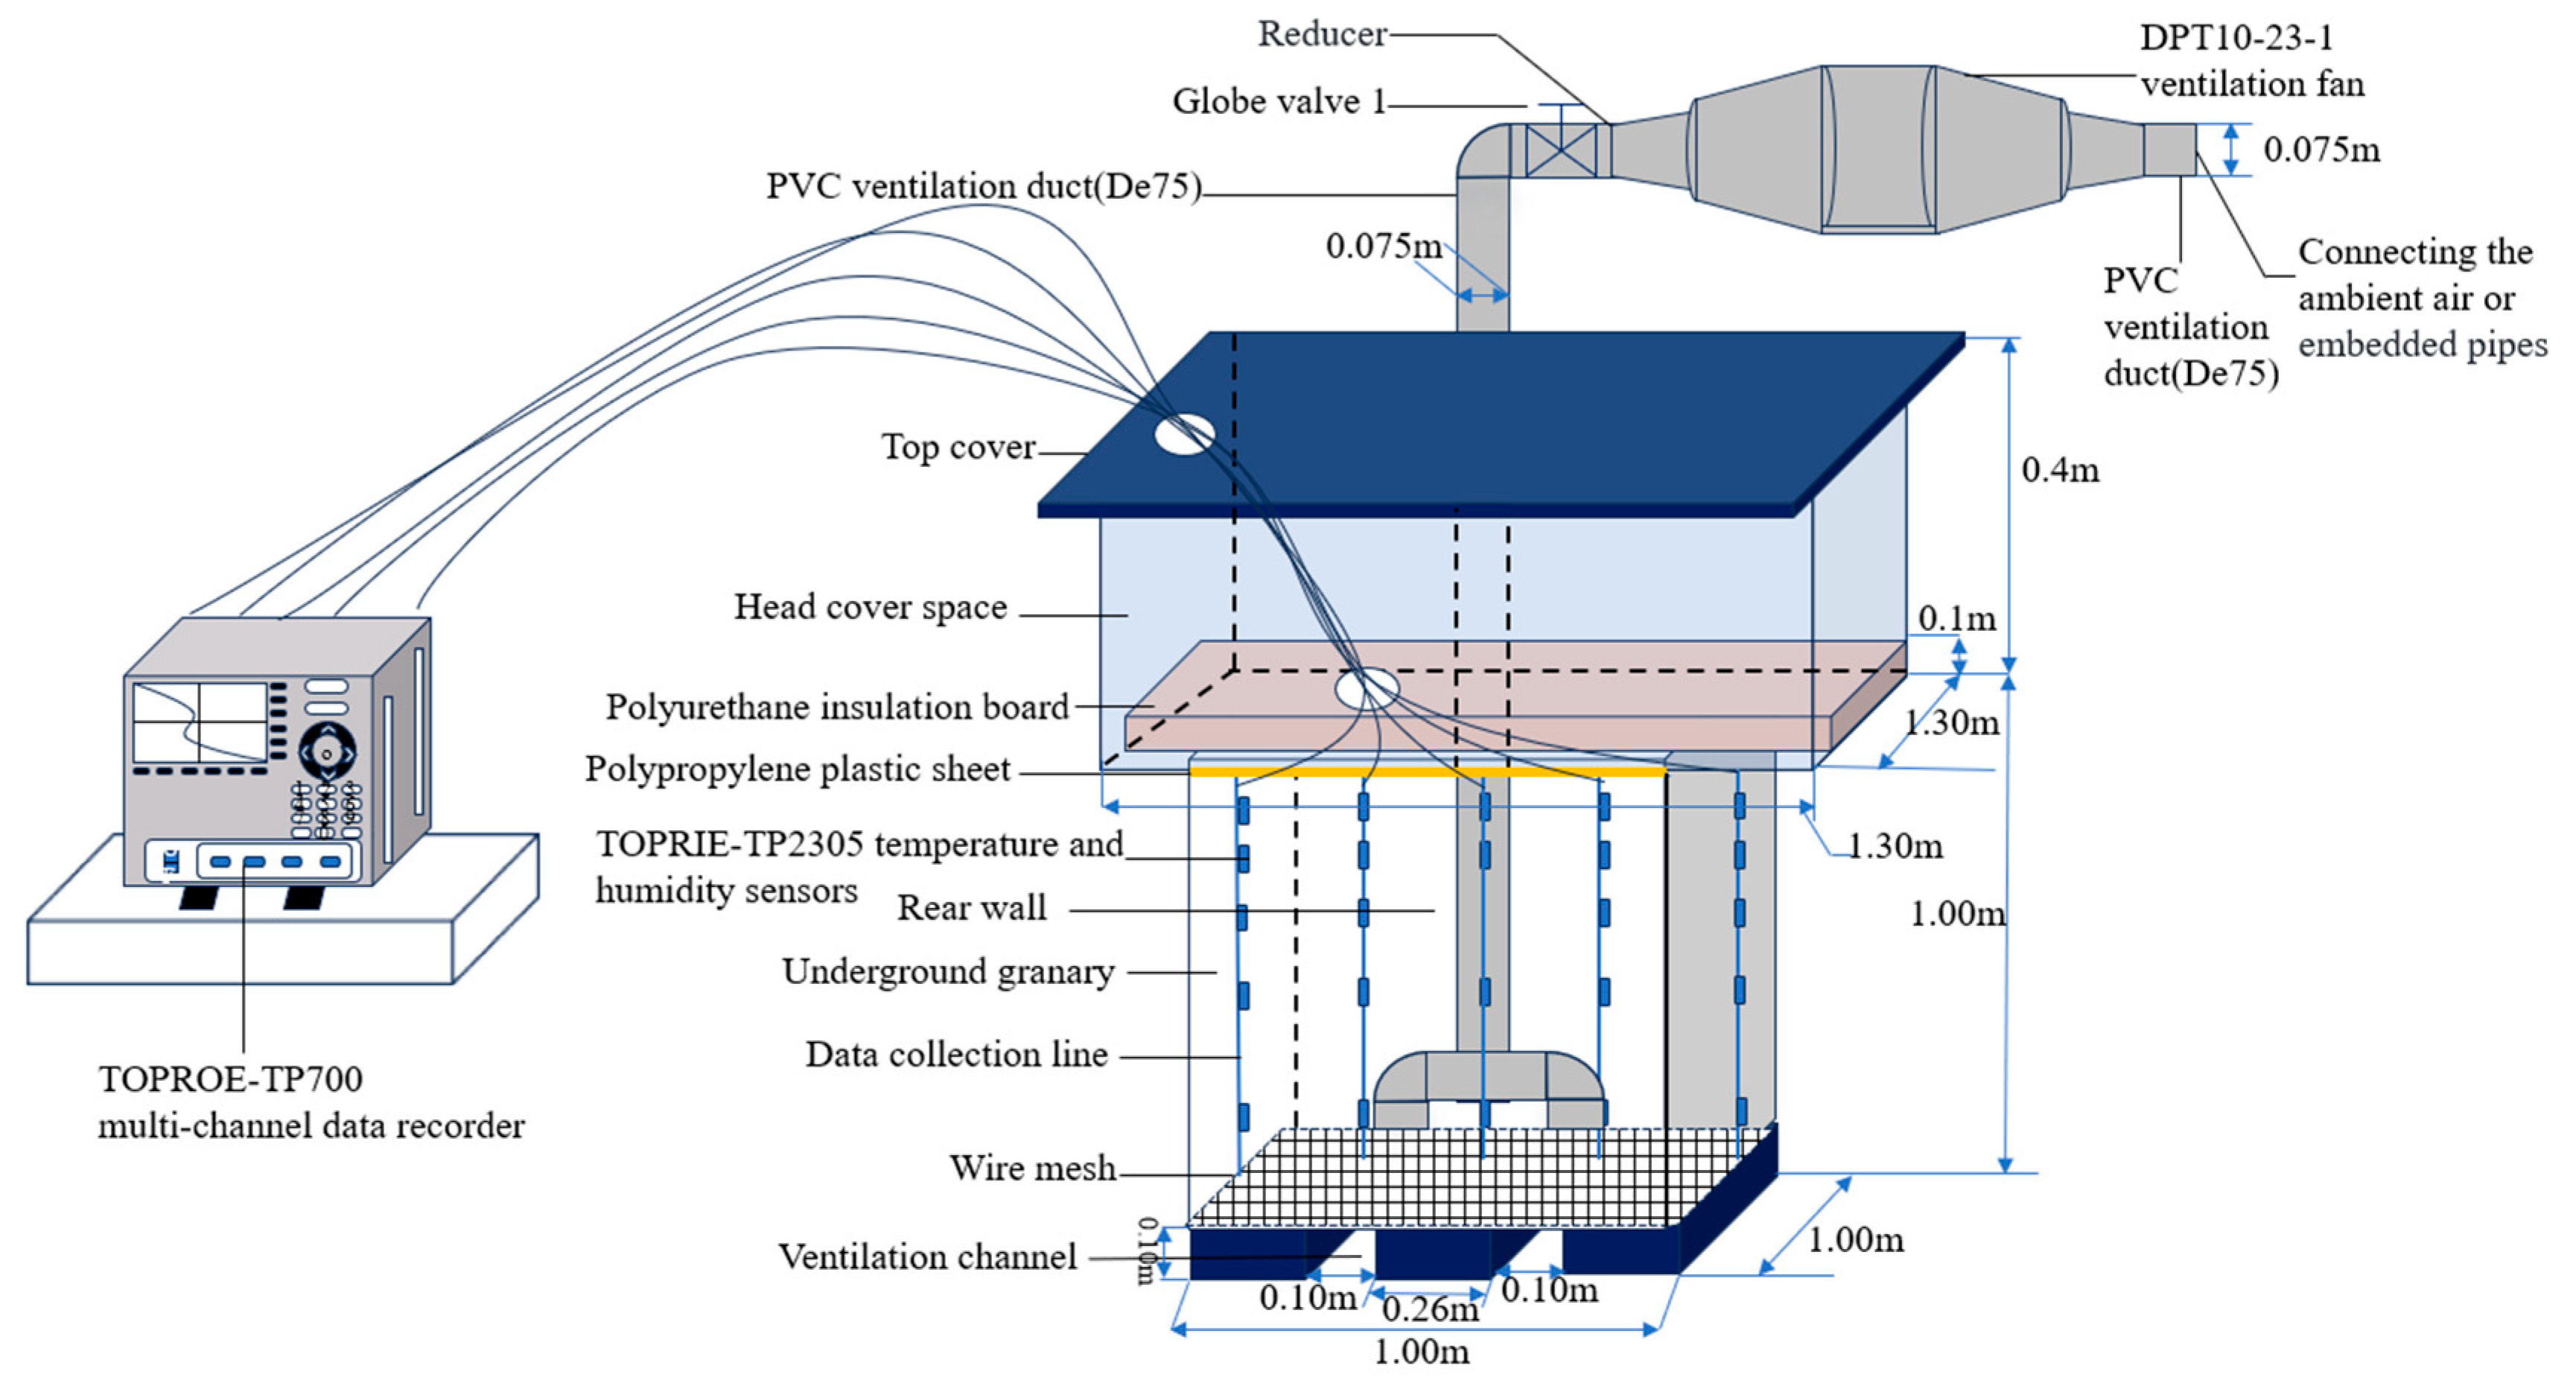
Therefore, this study compares ventilation pretreatment with conventional mechanical ventilation using ambient air, aiming to evaluate its effectiveness in improving the temperature and humidity uniformity within the grain pile, and reduce the risk of condensation. Specifically, we investigated the effects of static storage, mechanical ventilation, and ventilation pretreatment on temperature distribution, humidity uniformity, and condensation risk in wheat grain piles using the same experimental platform (see Figure 1). Static storage refers to sealed grain storage without forced airflow, serving as the baseline for natural temperature and moisture distribution. Mechanical ventilation introduces ambient air into the grain pile to remove moisture and heat, while the pretreatment system uses embedded pipes to cool the inlet air before it enters the grain pile. The selection of these three ventilation strategies creates a continuous comparative framework, ranging from no inlet air to ambient air to pretreatment air. This design allows for an accurate assessment of the effects of ventilation pretreatment and provides practical guidance, especially in improving temperature and humidity uniformity and reducing condensation risk. The findings of this study aim to provide a theoretical basis for designing condensation prevention measures in practical underground granary engineering.

2. Methods

2.1. Experimental Set-Up

This study was conducted in a small-scale underground granary, as illustrated in Figure 2. The underground granary is divided into two sections, both constructed from 0.01 m thick polypropylene plastic sheets. The upper section was designed as a 1.3 m × 1.3 m × 0.4 m head cover space aimed at minimizing the impact of ambient air conditions on the temperature and relative humidity of the stored grains. To prevent surface water from seeping into the granary, the top of the experimental granary extended 0.2 m above ground level. The lower section of the experimental granary was a 1 m × 1 m × 1 m underground granary equipped with temperature and humidity sensors and data collection lines. These lines were connected to the sensors and passed through small holes in the top cover to a multi-channel data recorder. Additionally, three polypropylene plastic blocks, each measuring 1 m × 0.26 m × 0.1 m, were placed at 0.1 m intervals at the bottom of the granary. The gaps between the blocks served as ventilation channels, with dimensions of 0.1 m × 1 m × 0.1 m. A wire mesh with 0.012 m × 0.012 m openings and 0.8 mm wire diameter was laid above the bottom to maximize ventilation area while preventing grain leakage. The granary also featured PVC ventilation ducts with a diameter of De75, positioned along the rear wall (see Figure 2) and extending from the bottom of the granary to external ventilation equipment. At the terminal end of the ventilation duct on the exterior of the grain granary, a globe valve (Globe valve 1 in Figure 2) is installed to prevent ambient air from entering the granary interior. The top cover of the underground granary was made of 0.01 m thick polypropylene plastic sheets, with an additional 0.1 m thick polyurethane insulation board on top to improve temperature stability. The entire experimental granary was buried in a foundation pit of dimensions 1 m × 1 m × 1.3 m. An external ventilation fan (Model DPT10-23-1) from Jinling Exhaust Fan Manufacturing Co., Ltd. (Jiangmen, China), with a rated power of 23 W and an air exchange rate of 3.3 m3/min, provided ventilation for the experiment. The ventilation speed was set at 1.78 m/s, with an outlet pipe diameter of De100. The ventilation pipes were connected to the equipment via a reducer joint, and special glue was applied at the joints to ensure air tightness. During mechanical ventilation experiments, the device exchanges air directly with ambient air entering the granary.
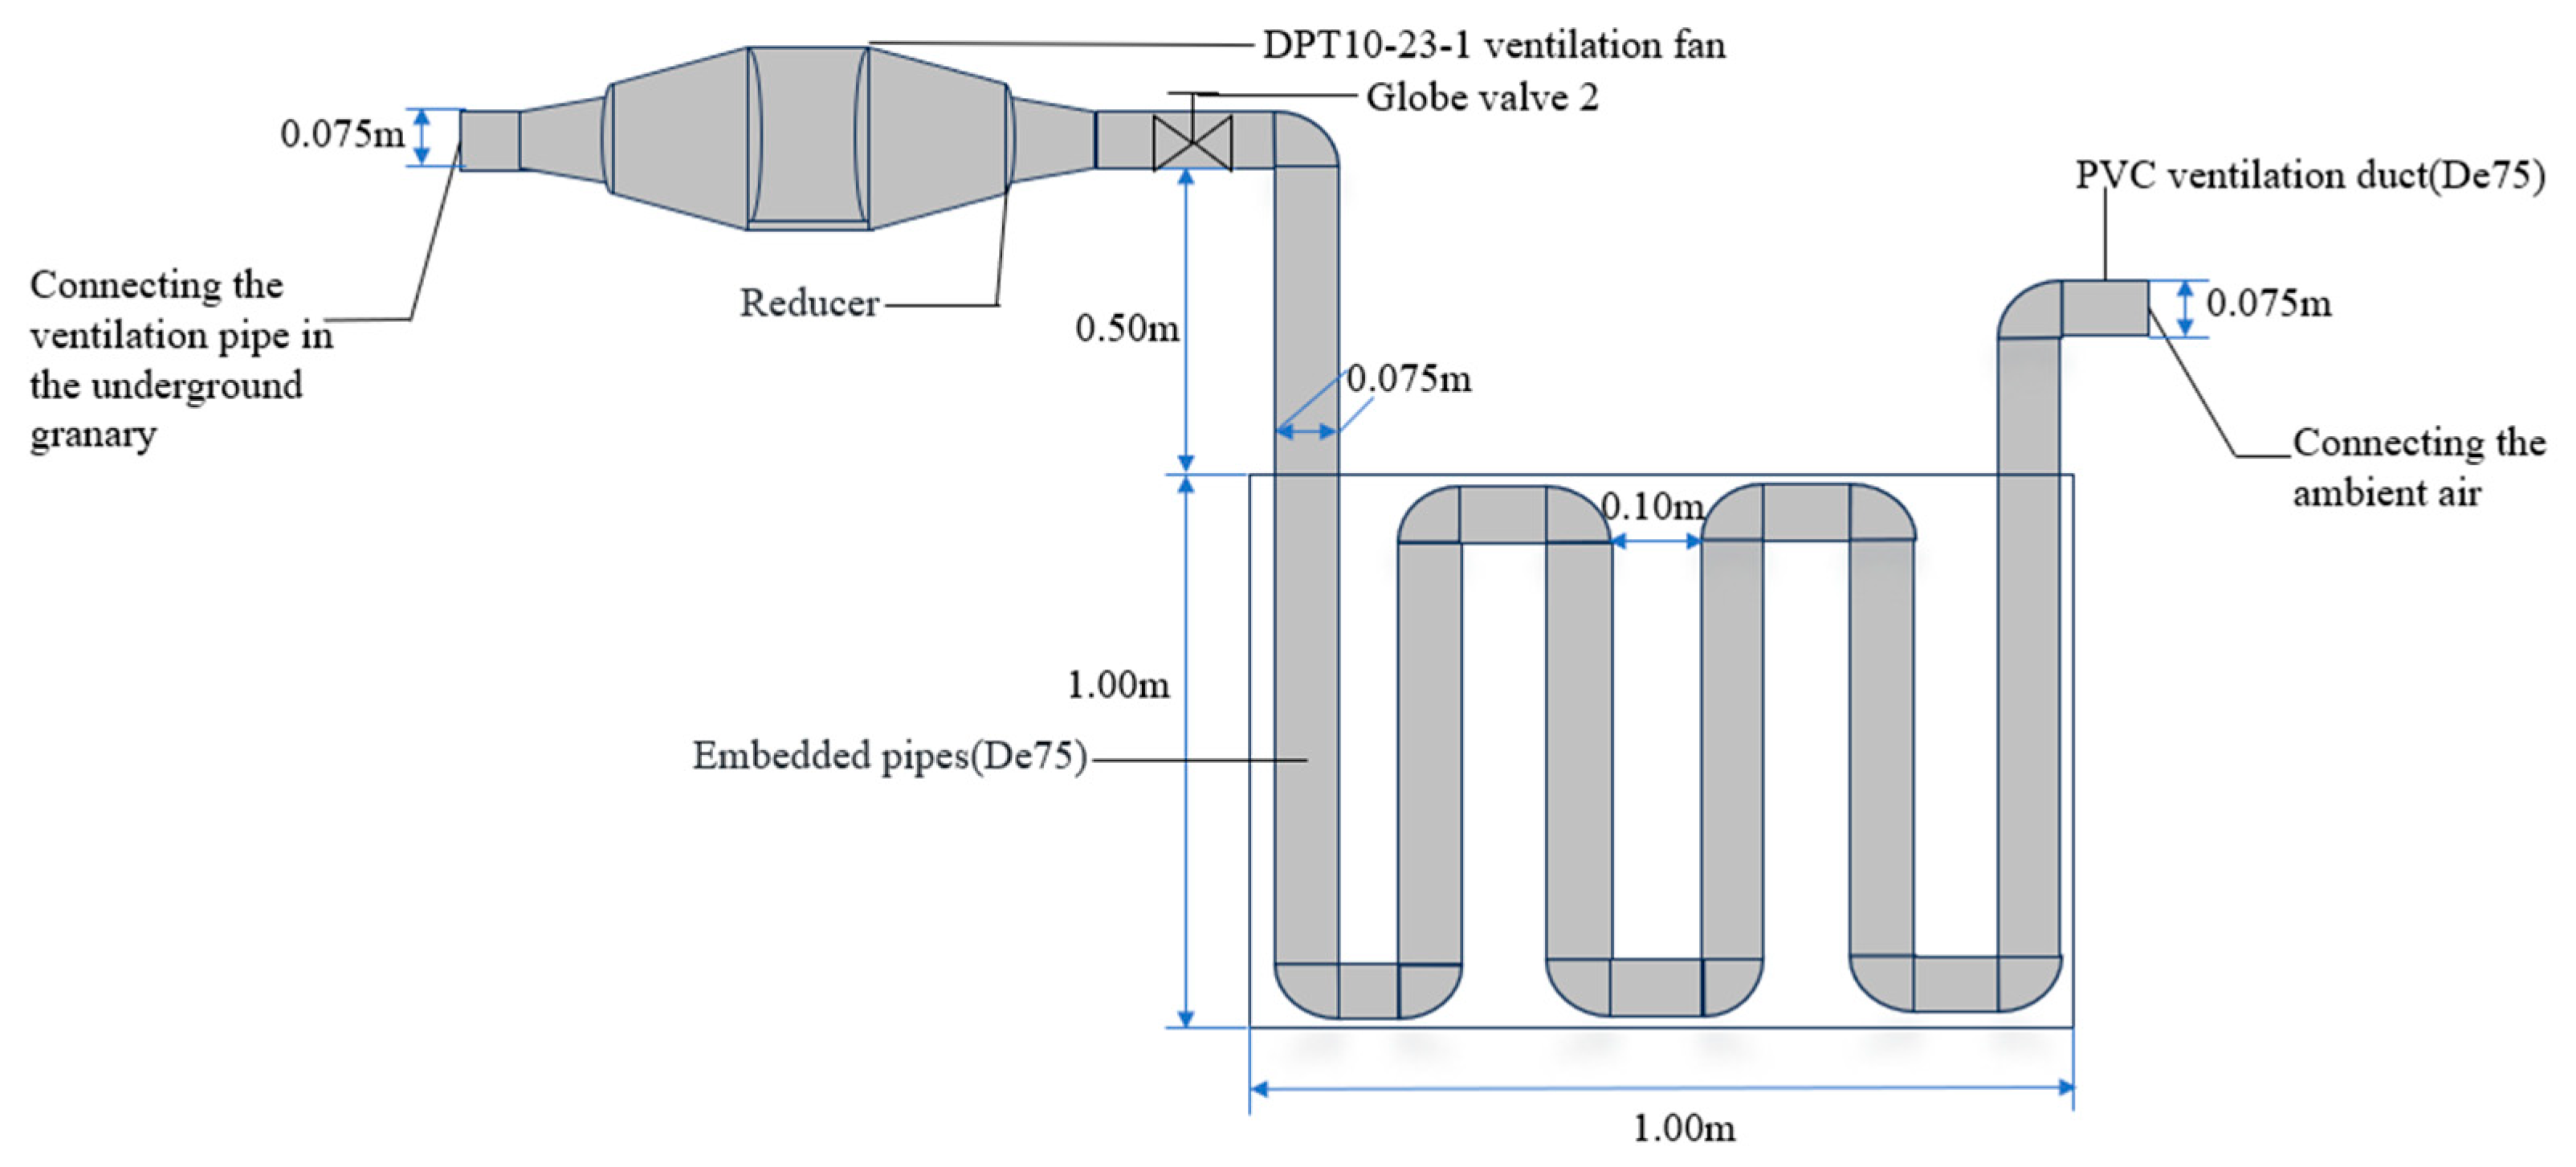
An additional pit measuring 1 m × 1 m × 0.2 m was excavated outside the granary to house the embedded pipes, as shown in Figure 3. PVC pipes (diameter: 75 mm) were placed in the pit at 0.1 m intervals, arranged in an S-shape and connected using bends of the same material and diameter. At the connection point to the ventilation equipment, a globe valve (Globe valve 2 in Figure 3) was installed at the pipe terminal to control the entry of pretreated air into the granary. The joints were sealed with adhesive to ensure air tightness. The pit was compacted with soil to ensure close contact between the soil and the pipes. During the ventilation pretreatment experiments, one end of the pipe was exposed to the air, while the other end was connected to the ventilation equipment, allowing pre-treated air to be directed into the granary.

2.2. Instruments and Parameters Measured

In this experiment, a TP700 multi-channel data recorder, produced by TOPRIE Electronics Co., Ltd., Shenzhen, China, was used to record temperature and relative humidity. This equipment features 64 channels for collecting temperature and relative humidity signals, automatically recording data through modules connected to temperature and humidity sensors. Twenty-eight TOPRIE-TP2305 temperature and humidity sensors from TOPRIE Electronics Co., Ltd., Shenzhen, China. were selected to measure the temperature and humidity at specific points. Temperature measurements of sensors span from −40 °C to 125 °C, with an accuracy of ±0.3 °C. Concurrently, humidity measurements range from 0 to 100% relative humidity (RH), maintaining an accuracy of ±0.3% RH. Lutz et al. [40] demonstrated that an accuracy of 0.5 °C is sufficient to measure changes within grain granaries, and the accuracy of the sensors used in this study met these requirements. The data recorder and the sensors were connected via data collection lines, and data was collected at 15 s intervals throughout the experiment.

2.3. Distribution of Sampling Points

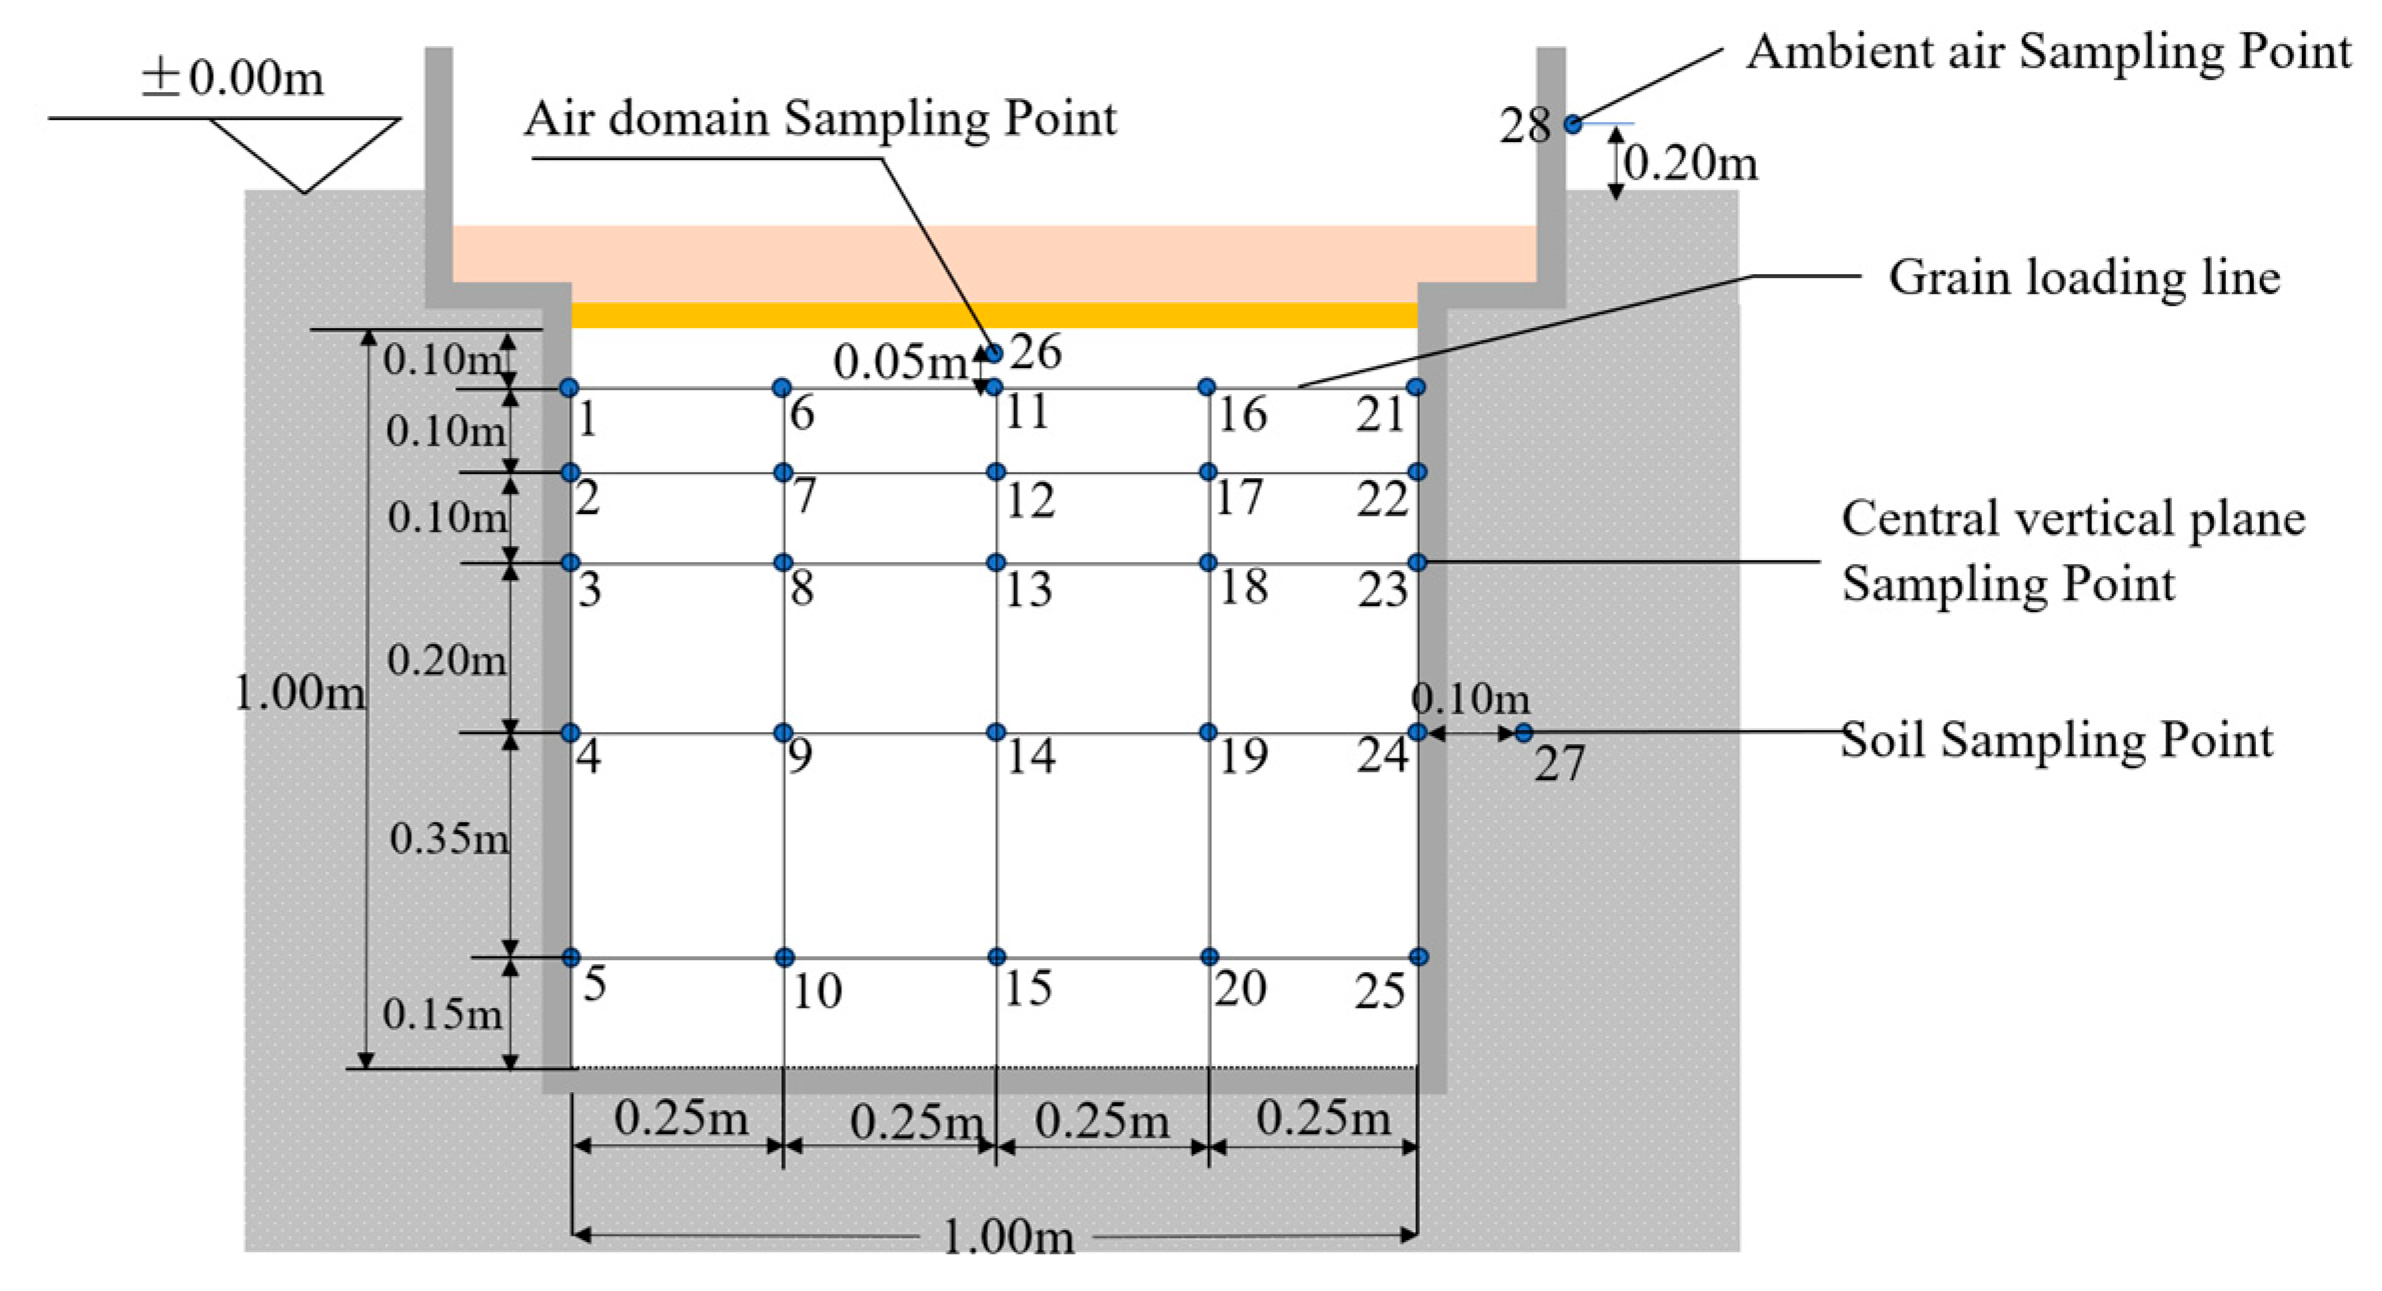
Given the symmetrical structure of the grain storage facility used in this experiment, the central vertical plane effectively reflects the temperature and humidity variations from the top to the bottom and from the center to the edges of the grain pile. A total of 28 sampling points were established, including 25 sensors distributed along the central vertical plane of the underground granary (see Figure 4). Each sampling point was equipped with a sensor. These sensors were distributed across five vertical layers. The uppermost sensor was positioned 0.1 m below the top cover, closely adhering to the surface of the grain pile. The remaining layers were spaced at intervals of 0.1 m, 0.1 m, 0.2 m, and 0.35 m. Horizontally, adjacent sensors were spaced 0.25 m apart, with the left most and right most columns positioned adjacent to the granary walls. The sampling points along the central vertical plane were sequentially numbered from top to bottom as 1–5, 6–10, 11–15, 16–20, and 21–25, as illustrated in Figure 4. Additionally, Sampling Point 26 was situated 0.05 m above Sampling Point 11, used to monitor changes in air domain temperature and humidity; Sampling Point 27 was located 0.1 m to the right of Sampling Point 24 in the soil area, used to monitor soil temperature and humidity; and Sampling Point 28 was positioned 0.2 m above ground level, closely adhering to the upper part of the granary, used to monitor the ambient air temperature and humidity conditions during the experiment.

2.4. Description of Experimental Cases

To elucidate the variations in temperature and humidity distribution within the grain pile and the risk of condensation before and after ventilation in an underground granary, this study designed three experimental cases. Firstly, a static storage experiment was conducted to understand the temperature and humidity distribution within the grain pile under non-ventilated conditions. Subsequently, a mechanical ventilation experiment was performed to investigate the changes in temperature and humidity during ventilation and its effectiveness in mitigating condensation. Finally, an experiment involving embedded pipes connected to one end of the ventilation equipment was conducted to further explore the effects of modified ventilation schemes on temperature and humidity distribution and the risk of condensation. Detailed descriptions of these three experimental cases are provided in Table 1.

2.5. Experimental Procedure

Prior to the commencement of the experiment, the structural integrity and air tightness of the experimental platform were rigorously examined. To maintain experimental integrity, the instruments and wheat were not removed from the granary once placed. Before storing the wheat in the granary, its overall moisture content was measured using a portable grain moisture meter (model HX-018) from Shandong Dezhou Hongxin Electronics Co., Ltd. Shandong, China, with an accuracy of 0.1%, yielding a final moisture content of 13.2%. After the grain was loaded, the surface of the grain pile was leveled, data collection lines were organized, and the top cover and polyurethane insulation board were installed. To mitigate the impact of external environmental and human factors on the experiment, the granary was covered with a plastic rainproof sheet, and warning signs were placed nearby. Additionally, to minimize instrumental errors, all instruments were checked before each measurement, and all sensors were calibrated before starting the experiment.
Before each measurement, the power supply was connected, and the temperature and humidity data collection equipment were activated. The experiment was divided into three phases. A 24-day first phase of static storage trial was executed with Globe valve 1 maintained in the closed position. Continuous monitoring of grain pile environment was performed using the TP700 multi-channel data recorder from TOPRIE Electronics Co., Ltd. Shenzhen, China, collecting temperature and relative humidity data at 15 s intervals. Subsequently, the ventilation equipment was activated, initiating the second phase of mechanical ventilation and the third phase of ventilation pretreatment. During the second and third phases, the airflow velocity and supply air temperature were maintained at similar levels.
To ensure clarity and reproducibility, the following section provides detailed descriptions of the second and third phases. In the second phase, the ventilation equipment was activated to initiate mechanical ventilation, which lasted for 3 days. During this phase, Globe valve 1 was opened (see Figure 5a), and a TP700 multi-channel data recorder was used to monitor the internal temperature and humidity of the grain pile at 15 s intervals over an 8 h period daily (10:00 to 18:00). A 3-day static resting period was implemented between the termination of mechanical ventilation and the initiation of ventilation pretreatment to allow the experimental environment to return to stable baseline conditions. During this interval, the temperature and relative humidity within the granary were systematically monitored until stabilization was achieved. Any significant deviations from the target conditions were corrected by adjusting the ventilation system, thereby ensuring that the initial conditions in Case 3 were consistent with those in Case 2 and enabling a valid comparative analysis. Upon completion of the second phase, the third phase of ventilation pretreatment began, also lasting 3 days, during which both Globe valves 1 and 2 were simultaneously opened (see Figure 5b) at the start of the phase. The monitoring intervals and duration remained identical to those of the second phase. After completing the ventilation pretreatment, the instruments, globe valve and power supply were turned off, and the experimental set-up was dismantled. The collected data were then processed. The flowchart diagram of the experiment is summarized in Figure 5c.

2.6. Definition of Temperature Difference

The definition of dew point temperature is the temperature where water vapor in air condenses into liquid water at the same rate at which it evaporates [41]. In this study, the dew point temperature is calculated using the following formula [42]:
T d = b α T , R H / a α T , R H
α T , R H = ( a T / b + T ) + ln R H / 100
where Td is the dew point temperature (°C), T is the measured temperature (°C), RH is the relative humidity (%), α (T, RH) is a function of T and RH, a and b are constants. In this study, a is assigned a value of 17.27, and b is assigned a value of 237.7 [42].
To analyze the condensation within the grain pile, this study utilizes the temperature difference between the dew point temperature and the measured temperature at each sampling point. The calculation formula is as follows:
Δ T = T T d
where ΔT (°C) is the difference between the measured air temperature T and the dew point temperature Td. By definition, ΔT < 0 indicates that T < Td and condensation is occurring. As ΔT decreases toward zero from positive values, the risk of condensation increases, whereas larger positive ΔT corresponds to a lower risk.

3. Results and Discussions

3.1. Influence of Ambient Air and Soil Conditions on Granary Air Domain

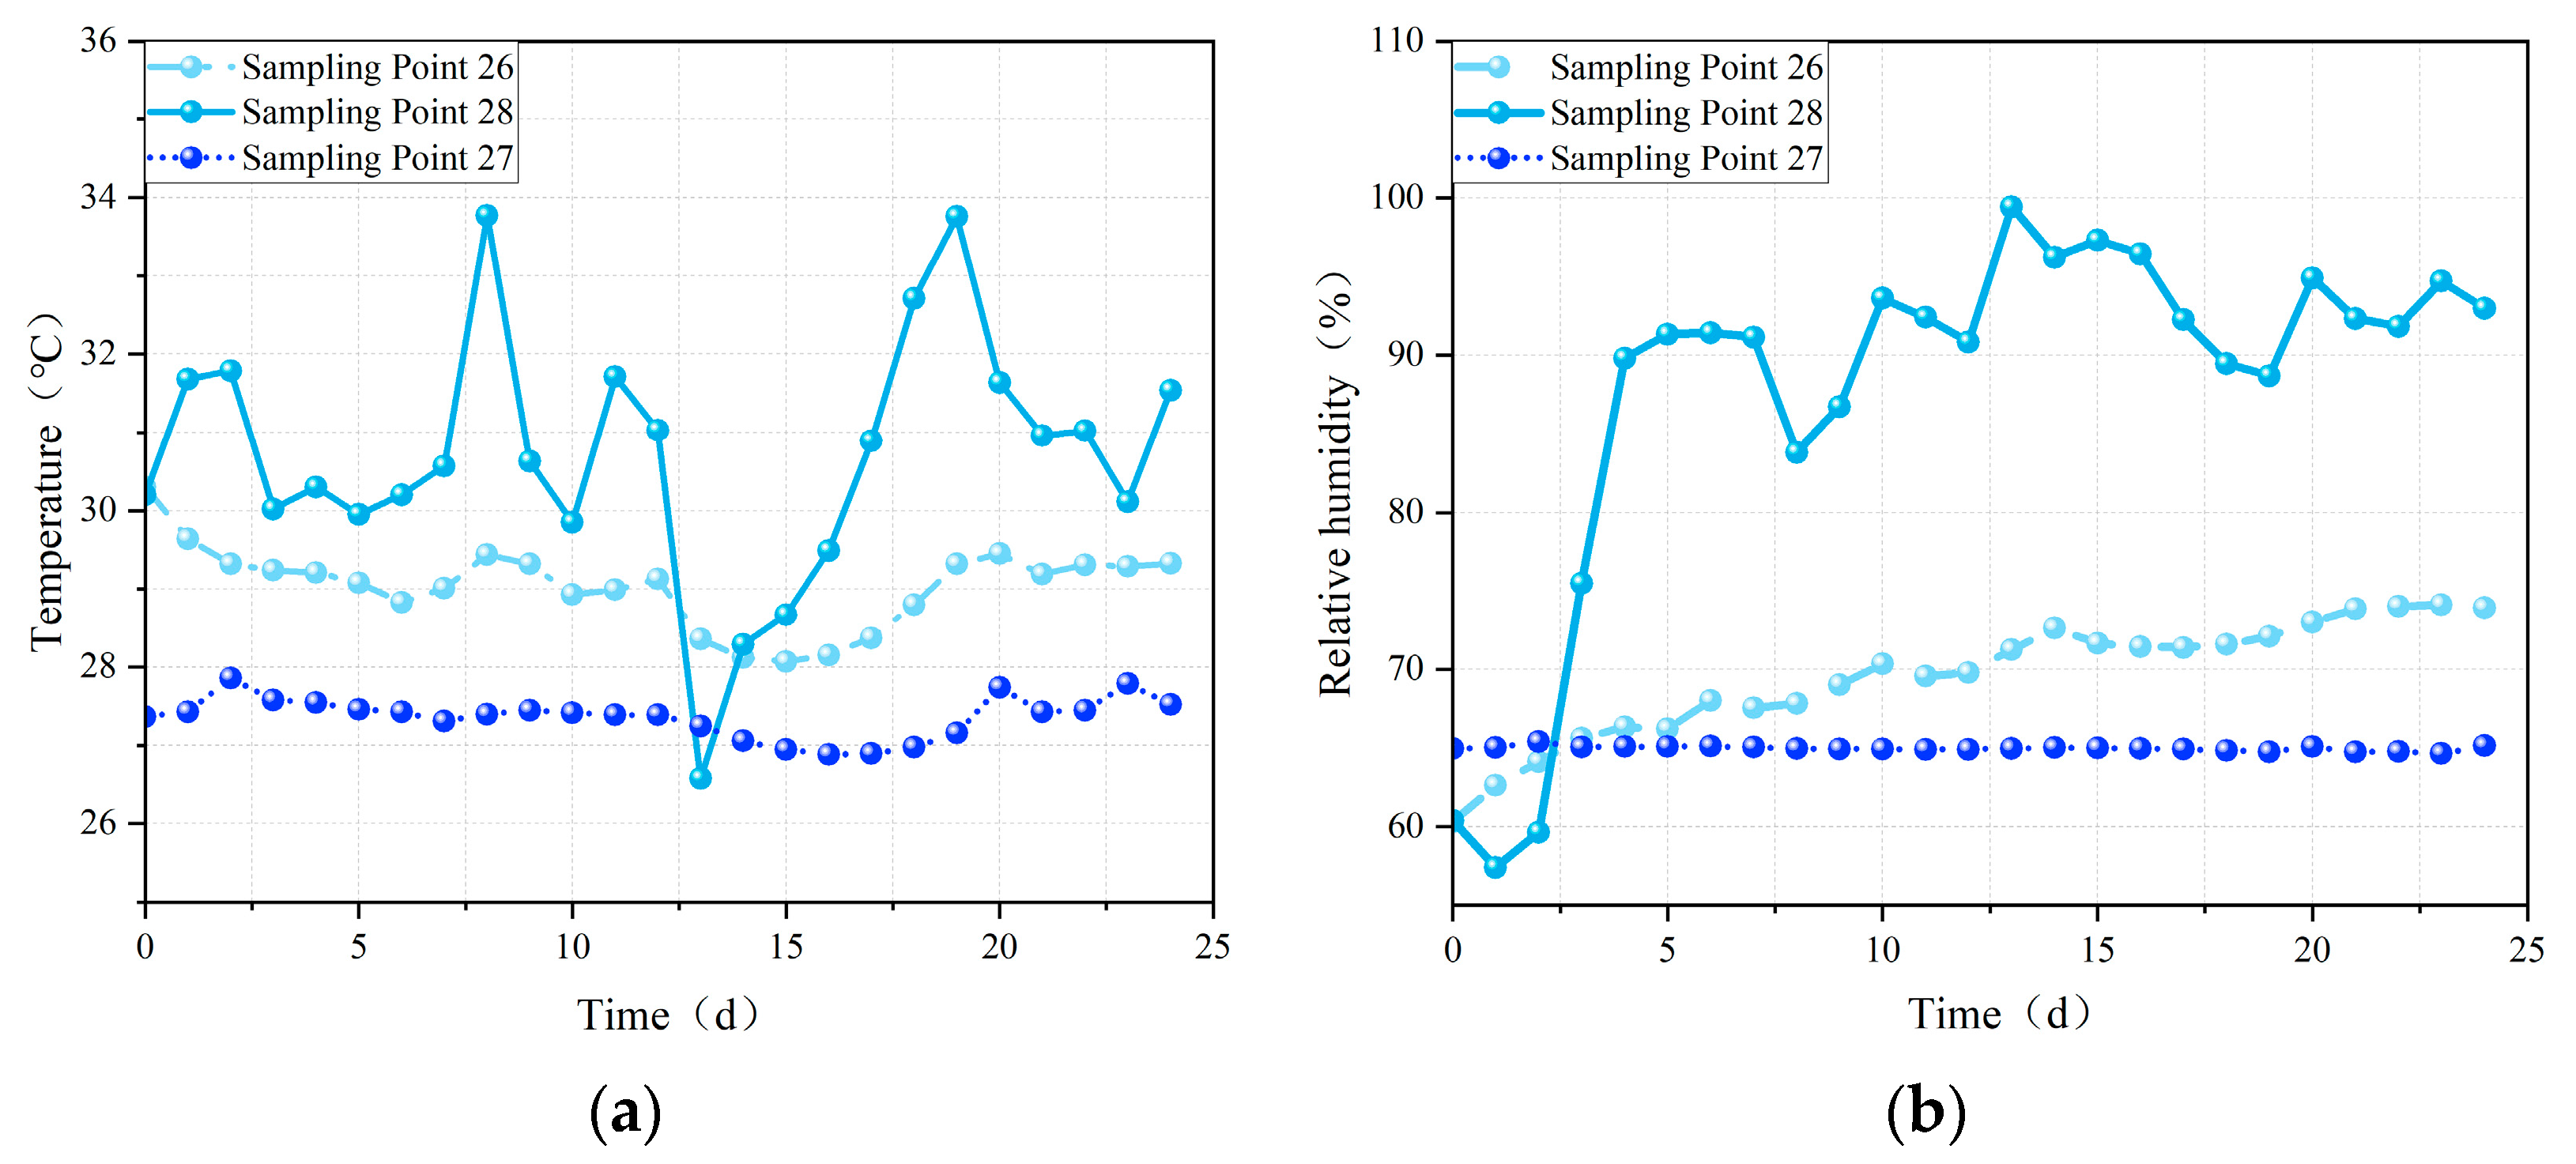
Figure 6 illustrates the variation in temperature and relative humidity at Sampling Points 26, 27, and 28 over the 24-day period from 17 July to 9 August under Case 1. As shown in Figure 6a, during the static storage phase, the maximum and minimum ambient air temperature were 33.8 °C and 26.9 °C, respectively, exhibiting significant fluctuations due to weather conditions. The soil temperature remained relatively stable around 27 °C, indicating minimal influence from ambient air temperature changes. The air domain temperature within the granary exhibited a relatively gradual change, decreasing by an average of 1 °C from beginning to end. This can be attributed to two factors: the presence of an overhead space in the granary, which mitigated the impact of ambient air on the lower grain storage area, and the relatively low soil temperature due to the granary‘s subsurface location. Heat transfer from the granary interior to the surrounding soil through the walls contributed to the decrease in internal temperature. Furthermore, the temperature within the air domain within the granary varied with changes in the ambient air temperature, consistently remaining between the ambient air temperature and the soil temperature. This indicates that while the air domain within the granary was influenced by ambient air, the magnitude of temperature fluctuations was moderated by the stabilizing effect of the soil. This phenomenon is consistent with the findings of Jin et al. [5], who observed through field tests that the temperature within underground granary fluctuates with the ambient air temperature, demonstrating that ambient air temperature influence soil temperature, which in turn affect the grain temperature.
Figure 6b illustrates that the relative humidity of the ambient air fluctuated significantly, ranging from a minimum of 55.57% to a maximum of 99.43%, largely influenced by the continuous rainy weather from 20 July to 25 July. The overall trend was an upward increase. In contrast, the soil relative humidity remained relatively constant, indicating a stable state. The relative humidity in the granary rose by 14% by the 23rd day of the experiment and then stabilized. Although the air domain within the granary also exhibited an upward trend in relative humidity, this trend was less pronounced compared to the ambient air relative humidity. This suggests that the humidity of the ambient air and the soil had minimal impact on the humidity within the underground granary. The primary cause of the increase in relative humidity air domain within the granary is likely due to the respiration of the grain.
In conclusion, the fluctuations in temperature and relative humidity within the underground granary were significantly less pronounced compared to those of the ambient air. This indicates that the granary has good sealing performance during the experiment, simultaneously demonstrating the ability of underground granary to mitigate the effects of ambient air on stored grains.

3.2. Temperature, Humidity, and Condensation in Grain Piles During Static Storage Phase

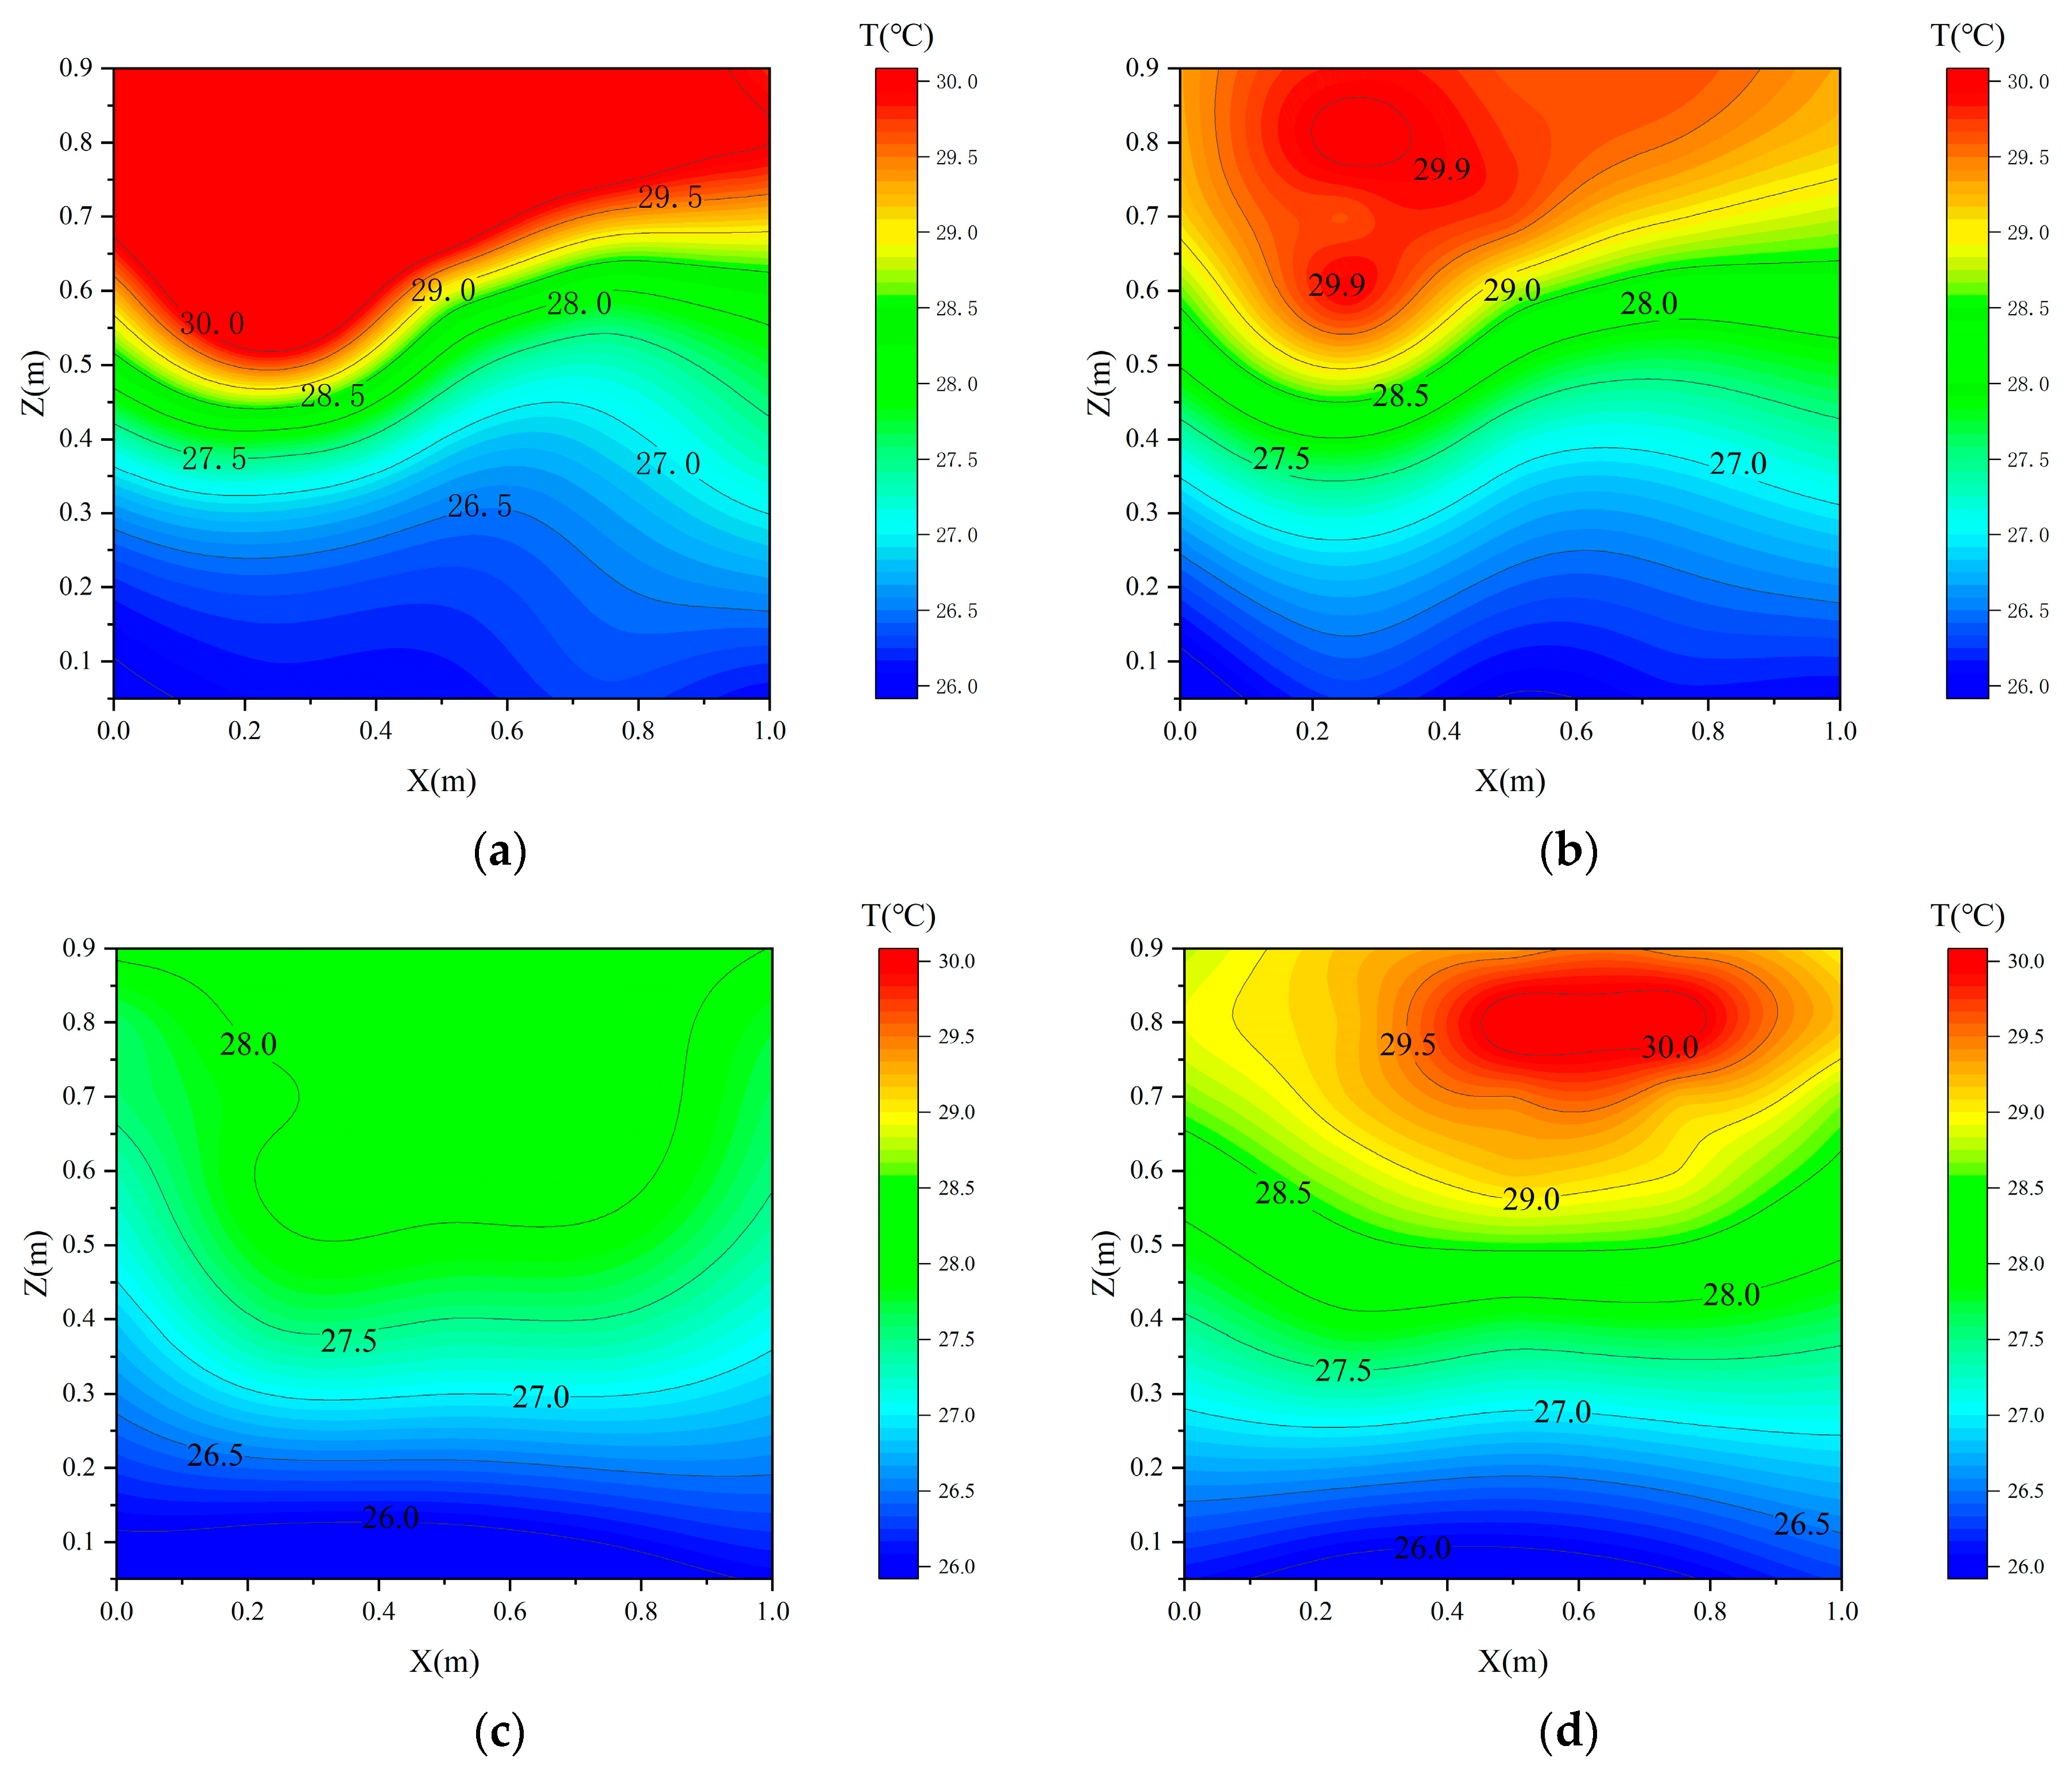
Figure 7 illustrates the temporal variations in temperature along the central vertical plane of the grain pile at the start of the experiment and on Days 1, 9, and 24 under Case 1. Throughout the static storage phase, the grain pile exhibited distinct temperature stratification from top to bottom. Furthermore, the temperature profiles demonstrated an initial decrease followed by a subsequent increase over time. As shown in Figure 7a, at the beginning of the experiment, the temperature stratification within the grain pile was most pronounced, with the bottom layer exhibiting a temperature of 26.5 °C, closely approximating the soil temperature, while the top layer reached 29.5 °C, more closely aligned with the ambient air temperature, resulting in a temperature difference of approximately 4 °C. This is because the bottom of the grain pile is in contact with the soil, which has a stable and minimal temperature variation, while the top of the grain pile is directly exposed to the ambient air, making it more susceptible to ambient temperature fluctuations. This observation aligned with findings by Gasto’n et al. [43], which showed that the temperature change at the top of the granary in summer was greatly affected by the external environment. From Figure 7b, it can be observed that the high temperature area at the top of the grain pile gradually diminishes, with minimal changes at the bottom. The entire grain pile exhibited a trend of decreasing temperature with increasing depth. This phenomenon persisted until Day 9 of the experiment (Figure 7c). As shown in Figure 7c, the high temperature area at the top of the grain pile was no longer apparent, and the temperature distribution at the bottom became more uniform. During the initial stages of the experiment, heat conduction resulted in the gradual transfer of heat from the top to the bottom of the grain pile, where it was absorbed by the colder soil, leading to a more uniform temperature distribution. However, as shown in Figure 7d, a significant temperature increase was observed at the top of the grain pile on the 24th day, with a maximum temperature of 30 °C. This indicates the formation of a distinct high temperature area. Studies have shown that as storage time increases, a temperature gradient is created in grain granary, which generated natural convection [16]. As the warm air rises, it carries heat and transfers it to the top region of the grain pile, gradually increasing the temperature in that area. Additionally, the phenomenon of temperature increase at the bottom of the grain pile was not apparent, as the bottom position, due to its larger contact area with the underground granary floor, allows for greater heat transfer to the soil, resulting in smaller temperature increases.
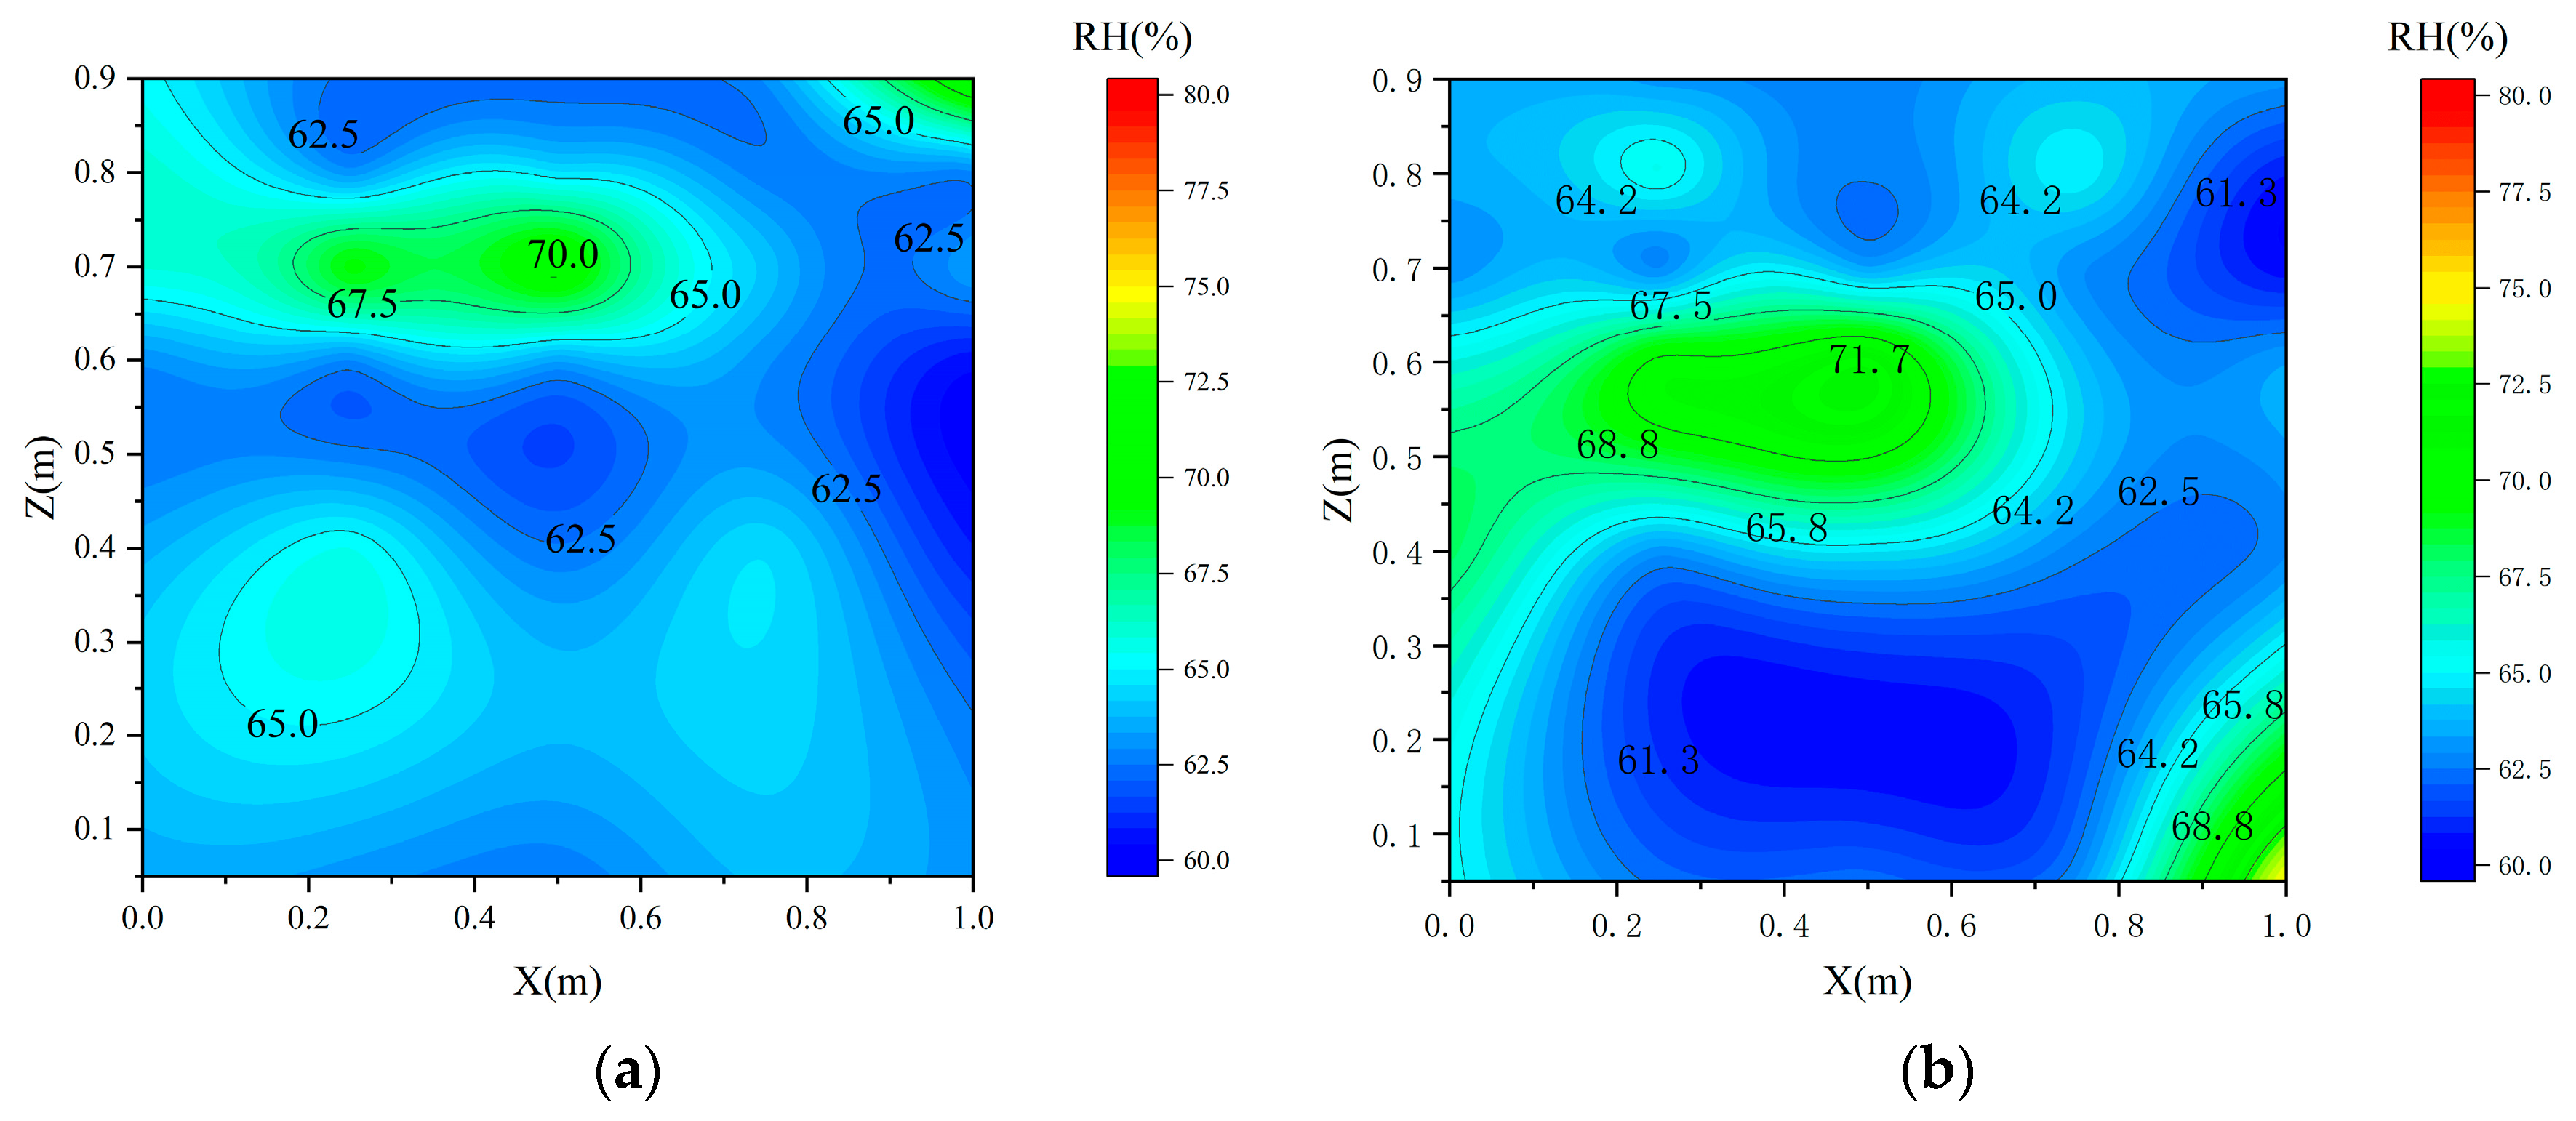
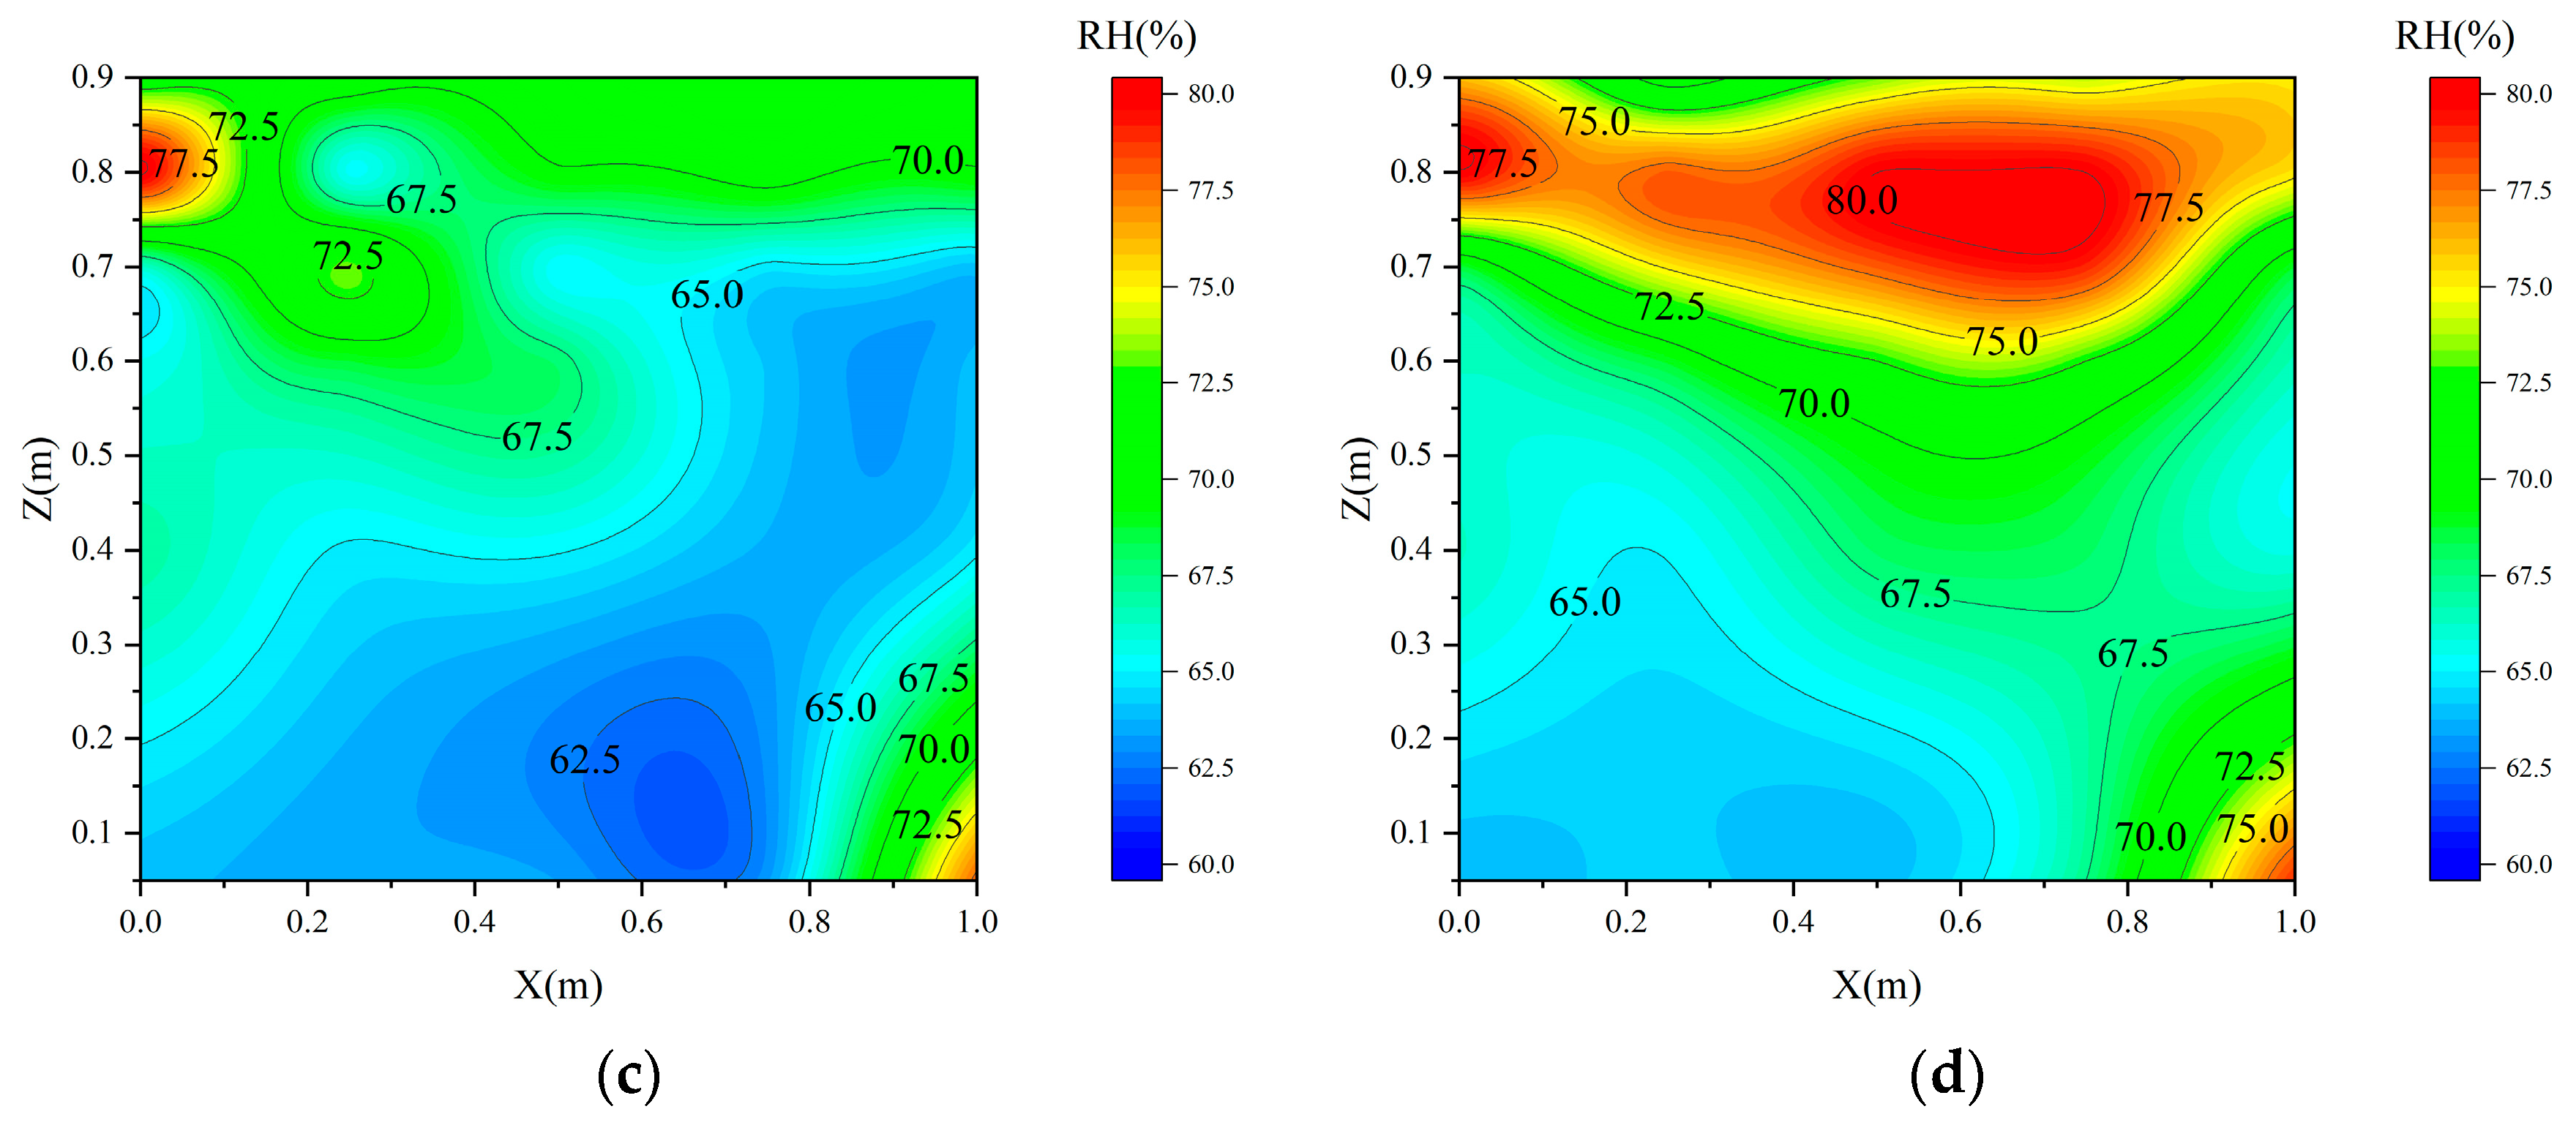
Figure 8 illustrates the temporal variation in relative humidity along the central vertical plane of the grain pile at the start of the experiment and on Days 1, 13, and 24 under Case 1. Figure 8a shows that the internal relative humidity distribution of the grain pile is uneven, with the top of the grain pile exhibiting higher relative humidity, approximately 67.5–70%, while the lower part shows lower relative humidity, around 60–65%. Coupled with data from Figure 8a, this can be attributed to the top of the grain pile being more susceptible to ambient air, which leads to higher temperatures and accelerated moisture evaporation, resulting in higher relative humidity at the top. In contrast, the interior of the grain pile was relatively enclosed, less affected by ambient air, with lower temperatures and slower moisture evaporation, maintaining a relatively lower humidity level. This observation is similar to findings by Wang et al. [38], who noted that the moisture profiles within granaries have indicated that moisture gradients exist in the axial direction. In the axial direction, wheat at the top surface had higher moisture content than that below the surface layer. Figure 8b demonstrates that after one day of experimentation, the high humidity area at the top of the grain pile expanded and shifted downward, while the bottom experienced a decrease in relative humidity. These findings could be due to decreased airflow in the grain pile at the start of the experiment, leading to a gradual moisture buildup. Temperature gradients then induced air movement, promoting the downward diffusion of relative humidity, which in turn increased overall relative humidity. This observation is similar to findings by Jian et al. [15], who noted that temperature gradients in small silos generated sufficient air movement to drive convection and moisture migration. Additionally, the temperature difference between the top and bottom of the grain pile caused moisture migration. Figure 8c shows that by the 13th day, the relative humidity within the granary had changed significantly, with the top of the grain pile experiencing a widespread increase to 70%, a trend that persisted until the 24th day (Figure 8d). Figure 8d indicates a general increase in relative humidity throughout the grain pile, with a high humidity area forming at the top, reaching a maximum of 80%. This increase, as supported by data in Figure 7, is attributed to the rising temperature at the top of the grain pile, which created a temperature gradient that drove moisture upward, contributing to the formation of the high humidity area.
We conducted a statistical analysis of the mean differences and standard deviation changes in the temperature and relative humidity between the top layer (Sampling Points 1, 6, 11, 16 and 21) and second layer (Sampling Points 2, 7, 12, 17 and 28) of the grain during static storage, as shown in Table 2 and Table 3. During static storage, both temperature and relative humidity showed certain trends. The temperature started at 0.68 °C on Day 0, gradually decreased to 0.37 °C (Day 1) and 0.034 °C (Day 13), and finally increased to 0.31 °C on Day 24. The temperature fluctuation was small, and the standard deviation decreased from 0.31 to 0.15, indicating that the temperature variability reduced over time and the internal temperature became more stable. Relative humidity, on the other hand, showed a gradual increase, starting at 0.70% on Day 0 and reaching 2.34% by Day 24, suggesting that moisture within the grain pile gradually released, leading to a continuous increase in relative humidity. The standard deviation of relative humidity was 0.71 on Day 0, gradually decreasing to 1.7 over time. However, on Day 9 and Day 24, the standard deviation increased to 1.37 and 1.7, respectively, indicating greater fluctuations in humidity, especially in the later stages of storage, suggesting uneven relative humidity distribution likely due to moisture migration and evaporation within the grain pile.
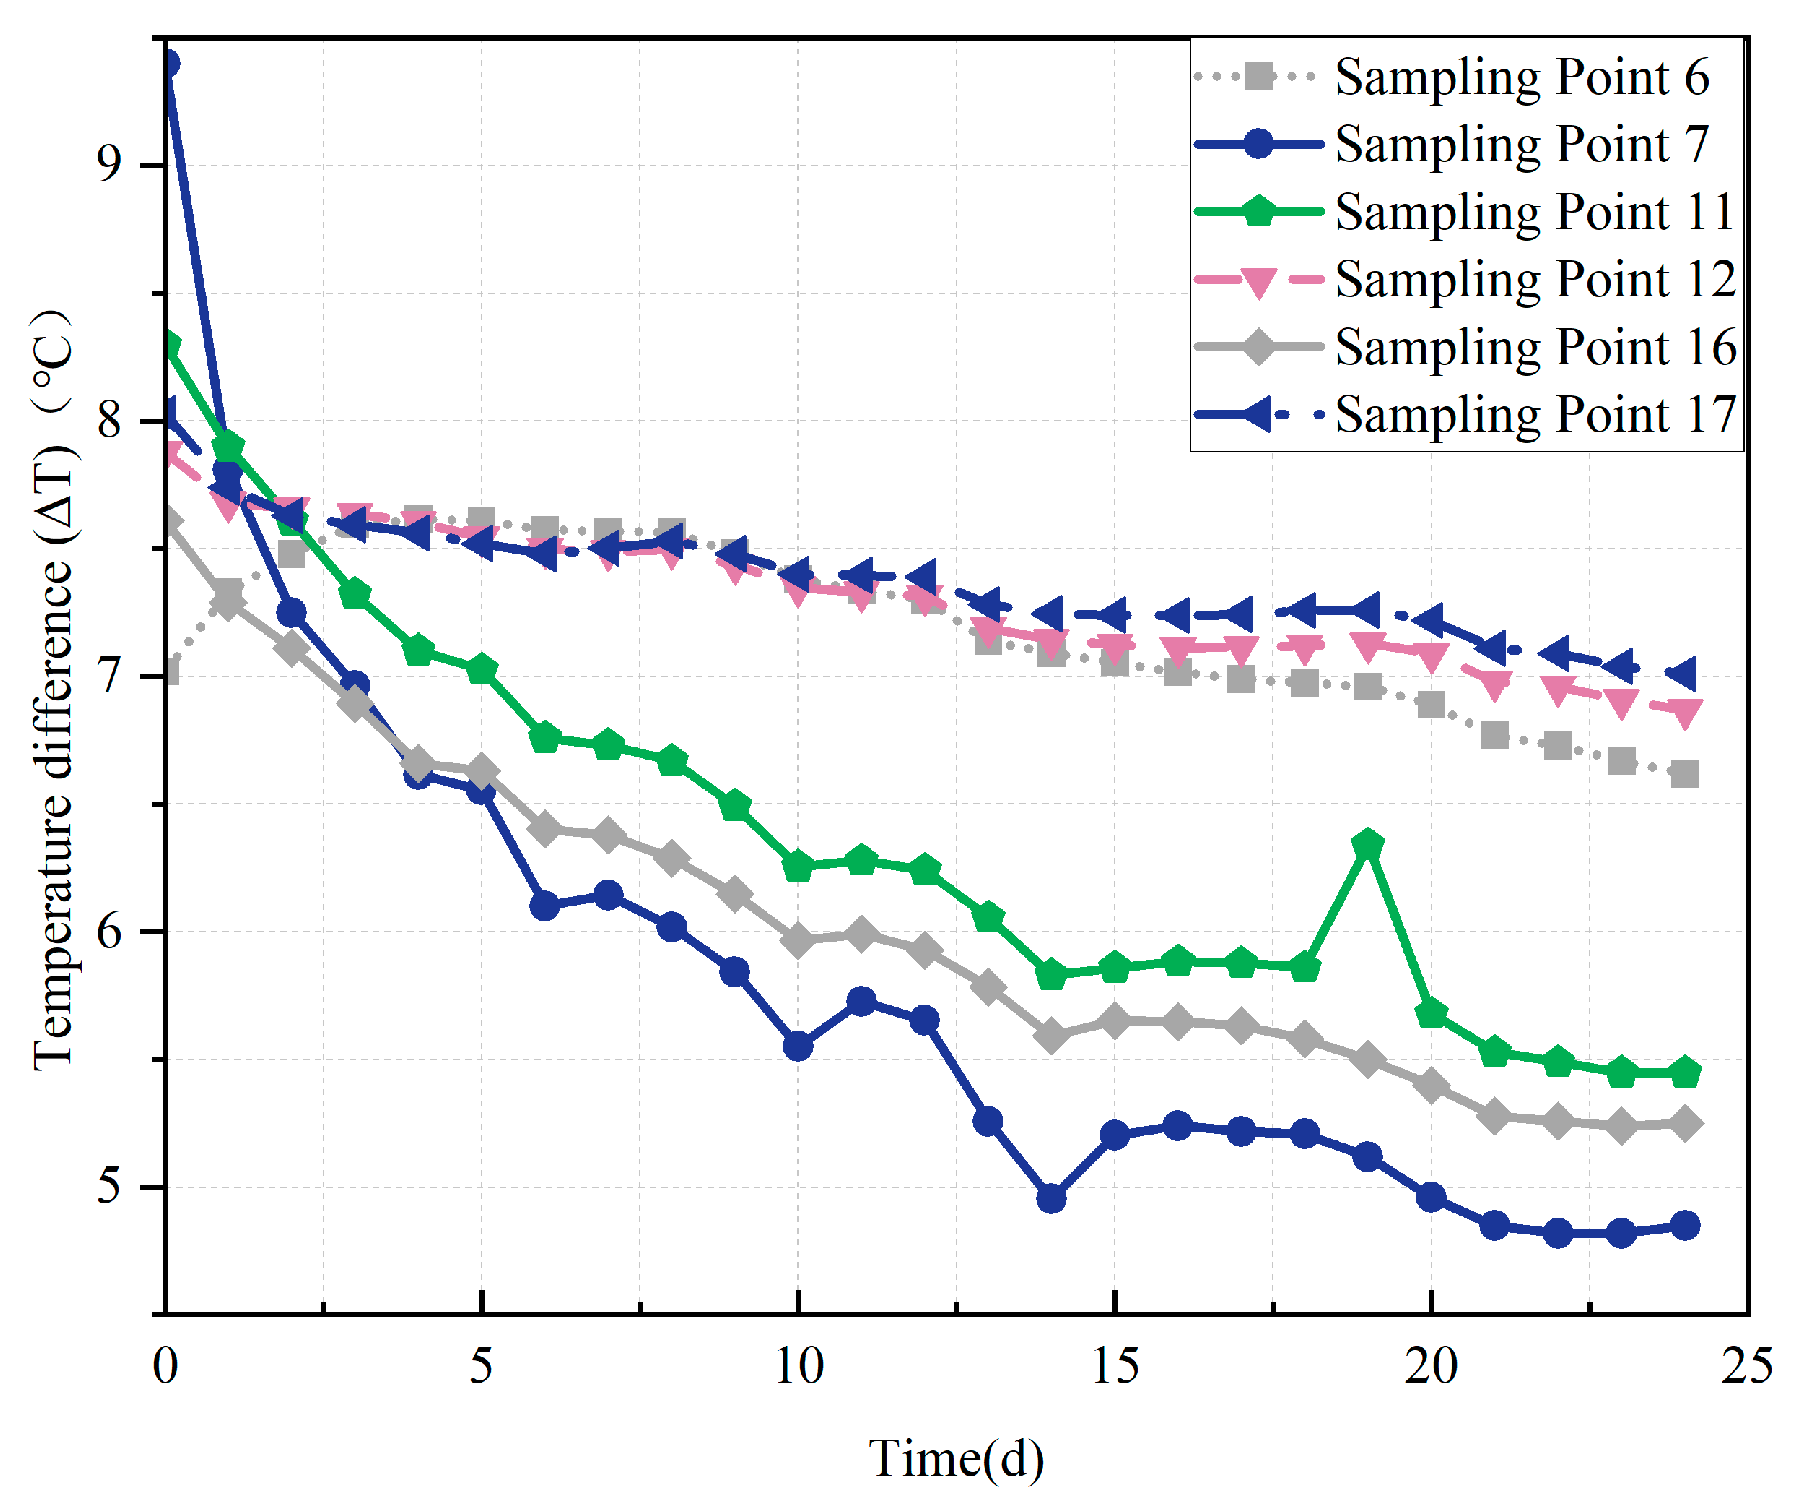
Based on the analysis of data from Figure 7d and Figure 8d, it is evident that by the 24th day of the experiment, a high temperature and humidity area had formed at the top of the grain pile. As the relative humidity of the grain pile increased, the moisture content in the air also rose, leading to a higher likelihood of condensation at the top of the pile. Consequently, Sampling Points 6, 7, 11, 12, 16, and 17 were selected as representative points for an in-depth analysis of the difference between the measured temperature and the dew point temperature over time. Figure 9 illustrates the variation in the difference between the measured temperature and the dew point temperature at Sampling Points 6, 7, 11, 12, 16, and 17 under Case 1. Throughout the static storage phase, measured temperatures consistently exceeded dew point temperatures at all six sampling points. Notably, Sampling Points 7, 11, and 16 exhibited smaller temperature differences compared to Sampling Points 6, 12, and 17. Over time, the temperature difference gradually stabilized. Analyzing the data from Figure 7 and Figure 8, it is noted that Sampling Point 6 exhibited minimal temperature fluctuations throughout the experiment. Sampling Points 12 and 17, located on the second layer of the grain pile, experienced relatively weak air convection and minimal heat exchange, resulting in insignificant temperature changes. In contrast, Sampling Point 7, although also on the second layer, showed greater temperature fluctuations. When the relative humidity of the air is constant, locations with rapid temperature changes are more prone to condensation [14]. Therefore, Sampling Point 7 has a higher risk of condensation compared to Sampling Points 12 and 17. At Sampling Points 11 and 16, the relative humidity increased significantly over time, elevating the risk of saturation and condensation. In summary, to avoid interference from the 28 sensors while retaining the key risk factors, we selected Sampling Points 7, 11, and 16 as representative points. These points are located in the upper layers, where condensation is most likely to occur, with lateral position sat the same depth. Compared to Sampling Points 6, 12 and 17, they exhibit the smaller ΔT and higher relative humidity. Accordingly, the subsequent internal comparisons between Cases 2 and 3 are conducted using Sampling Points 7, 11, and 16 as representative points.

3.3. Effects of Ventilation Strategies on Grain Pile Temperature and Humidity

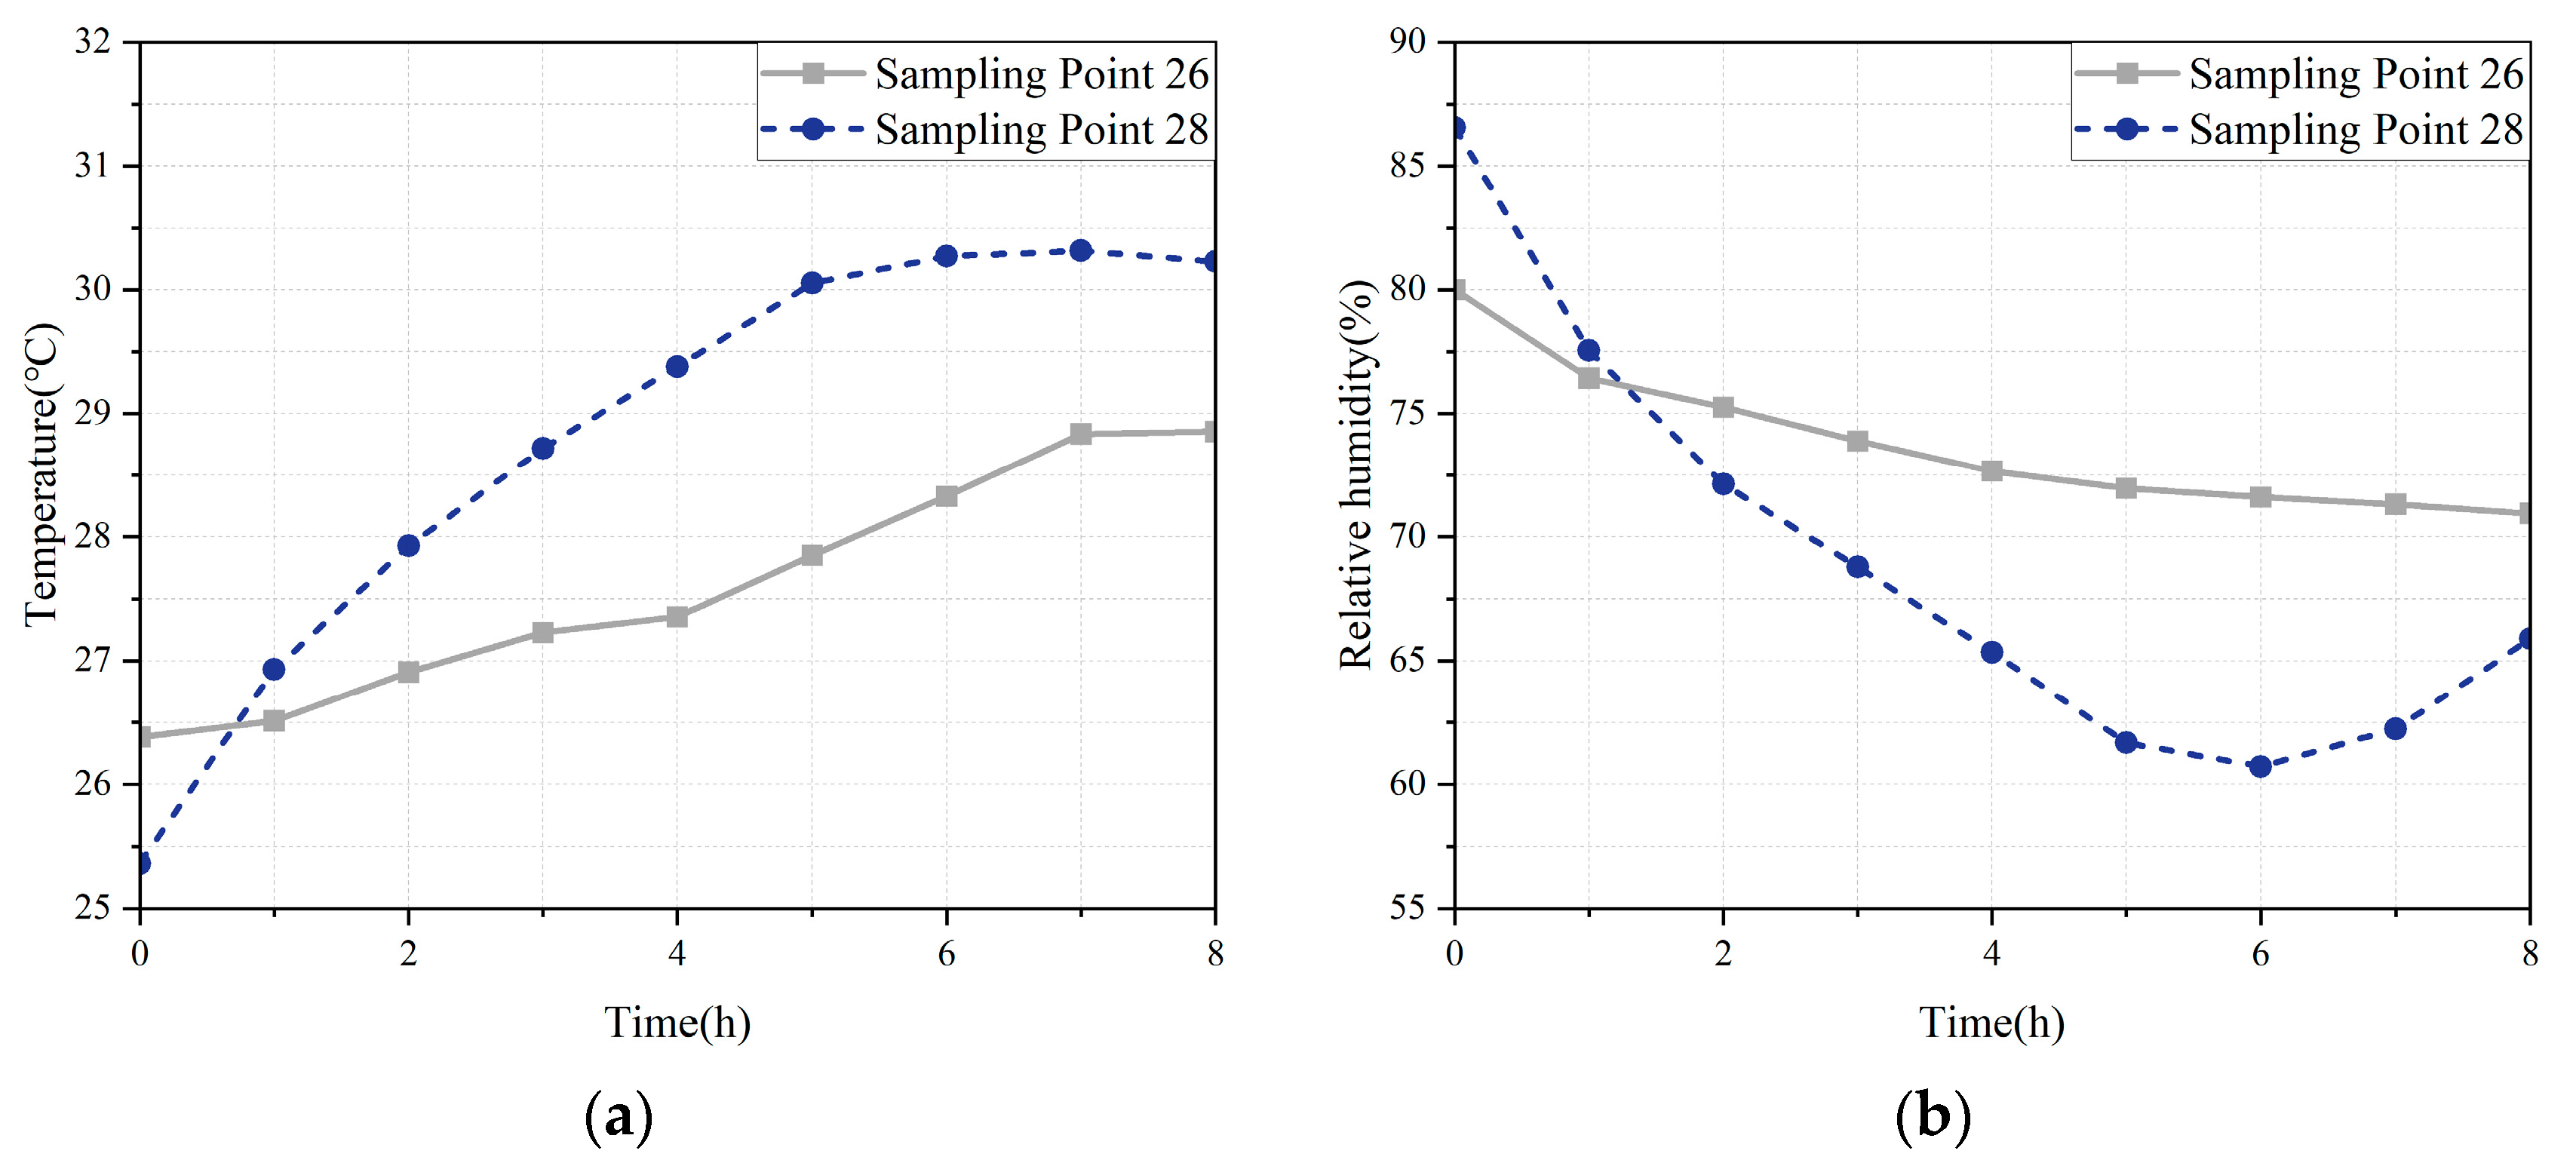
To further explore methods for reducing condensation within grain piles, additional studies were conducted on mechanical ventilation and ventilation pretreatment. Figure 10 illustrates the temporal variations in temperature and humidity at Sampling Points 26 and 28 during an 8 h ventilation process (from 10:00 to 18:00) under Case 2. From Figure 10a, we observe that at the start of ventilation, the ambient air temperature was 25.4 °C, slightly lower than the air domain temperature within the grain (26.4 °C). As ventilation progressed, both external and internal temperatures increased. This can be attributed to the introduction of warmer ambient air into the bottom of the granary via the ventilation system, leading to heat transfer and subsequent temperature increases in the upper air area. The ambient air temperature reached a maximum of 30.3 °C after 7 h, while the air domain temperature within the granary peaked at 28.8 °C one hour later. Thereafter, the internal temperature fluctuated around this value. This behavior can be attributed to the asynchronous propagation and response rates of air flow and temperature–humidity changes in different areas, as well as the presence of lag effects.
Figure 10b shows the corresponding relative humidity changes. Initially, the ambient air relative humidity exceeded that of the air domain temperature within the granary, likely due to fluctuations in the ambient air caused by factors such as plant respiration and nighttime cooling. As the ambient air temperature increased, evaporation led to a decrease in relative humidity. The introduction of this drier air into the granary resulted in a corresponding decrease in internal relative humidity. This decreasing trend gradually leveled off after approximately 7 h of ventilation. By the end of the 8 h ventilation period, the relative humidity in the grain had stabilized at around 72%, with minor fluctuations. These findings suggest that an 8 h ventilation duration is sufficient to induce and maintain a relatively stable state of temperature and humidity within the grain granary.
In summary, significant changes in temperature and humidity occurred during the initial and middle stages of ventilation, particularly in the first few hours. After 8 h of ventilation, both temperature and humidity stabilized. The ambient and internal temperatures gradually increased, ultimately stabilizing at 28.8 °C and approximately 72% relative humidity. This indicates that the ventilation cycle, designed for three consecutive days with 8 h of ventilation each day and with the ventilation temperature set to the ambient temperature, is sufficient to induce and maintain temperature and humidity changes, allowing the internal environment of the granary to stabilize.
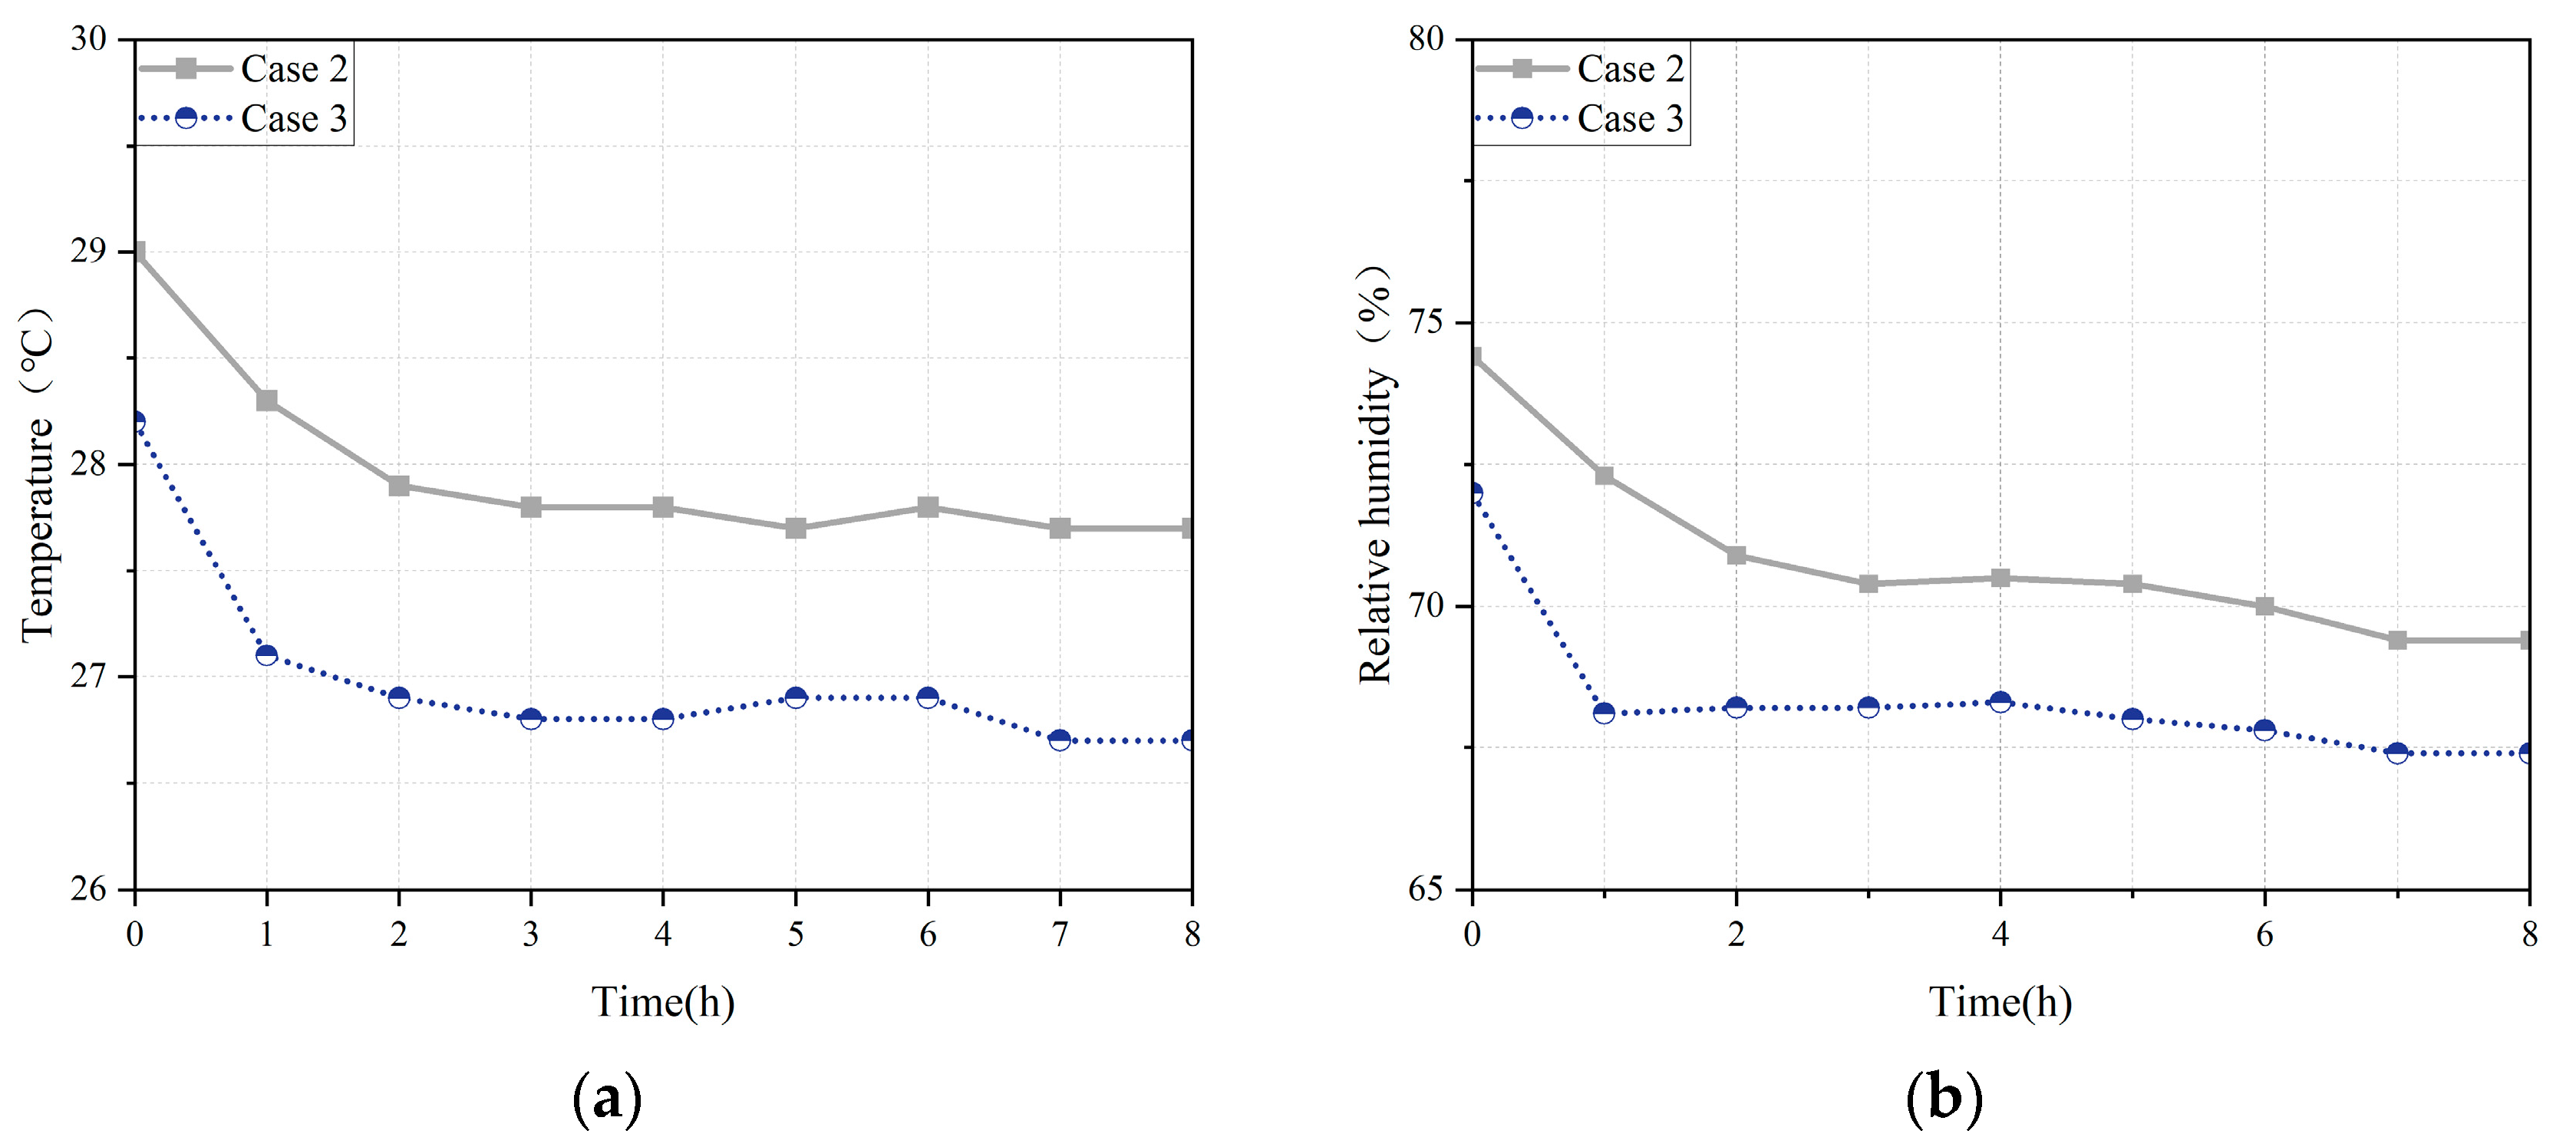
To better examine the effects of different ventilation strategies on the temperature and humidity of the air supplied to the granary, we selected the parameters at Sampling Point 10, located near the ventilation inlet, for analysis. Figure 11 illustrates variations in temperature and relative humidity at Sampling Point 10 for Cases 2 and 3 with respect to ventilation time. From Figure 11a, it can be observed that the temperature first decreased under both cases and then tended to remain relatively stable. In Case 2, where ambient air was introduced directly into the granary without any pretreatment, the temperature dropped from an initial 29.2 °C to 27.7 °C, a decrease of 1.5 °C. In contrast, in Case 3, the temperature of the pretreated inlet air decreased from 28.4 °C to 26.7 °C, a drop of 1.7 °C, indicating that the pretreatment of the inlet air through the embedded pipe system resulted in more effective cooling. Figure 11b shows the changes in relative humidity at Sampling Point 10 in Cases 2 and 3. In Case 2, the relative humidity started at a relatively high value of 74.4% and gradually decreased to approximately 69.4%. In Case 3, the relative humidity gradually decreasing from 71.5% to 67.4%. Compared to Case 2, the relative humidity fluctuations in Case 3 were smaller, demonstrating that the pretreatment air not only cooled the environment but also more effectively stabilized the relative humidity.
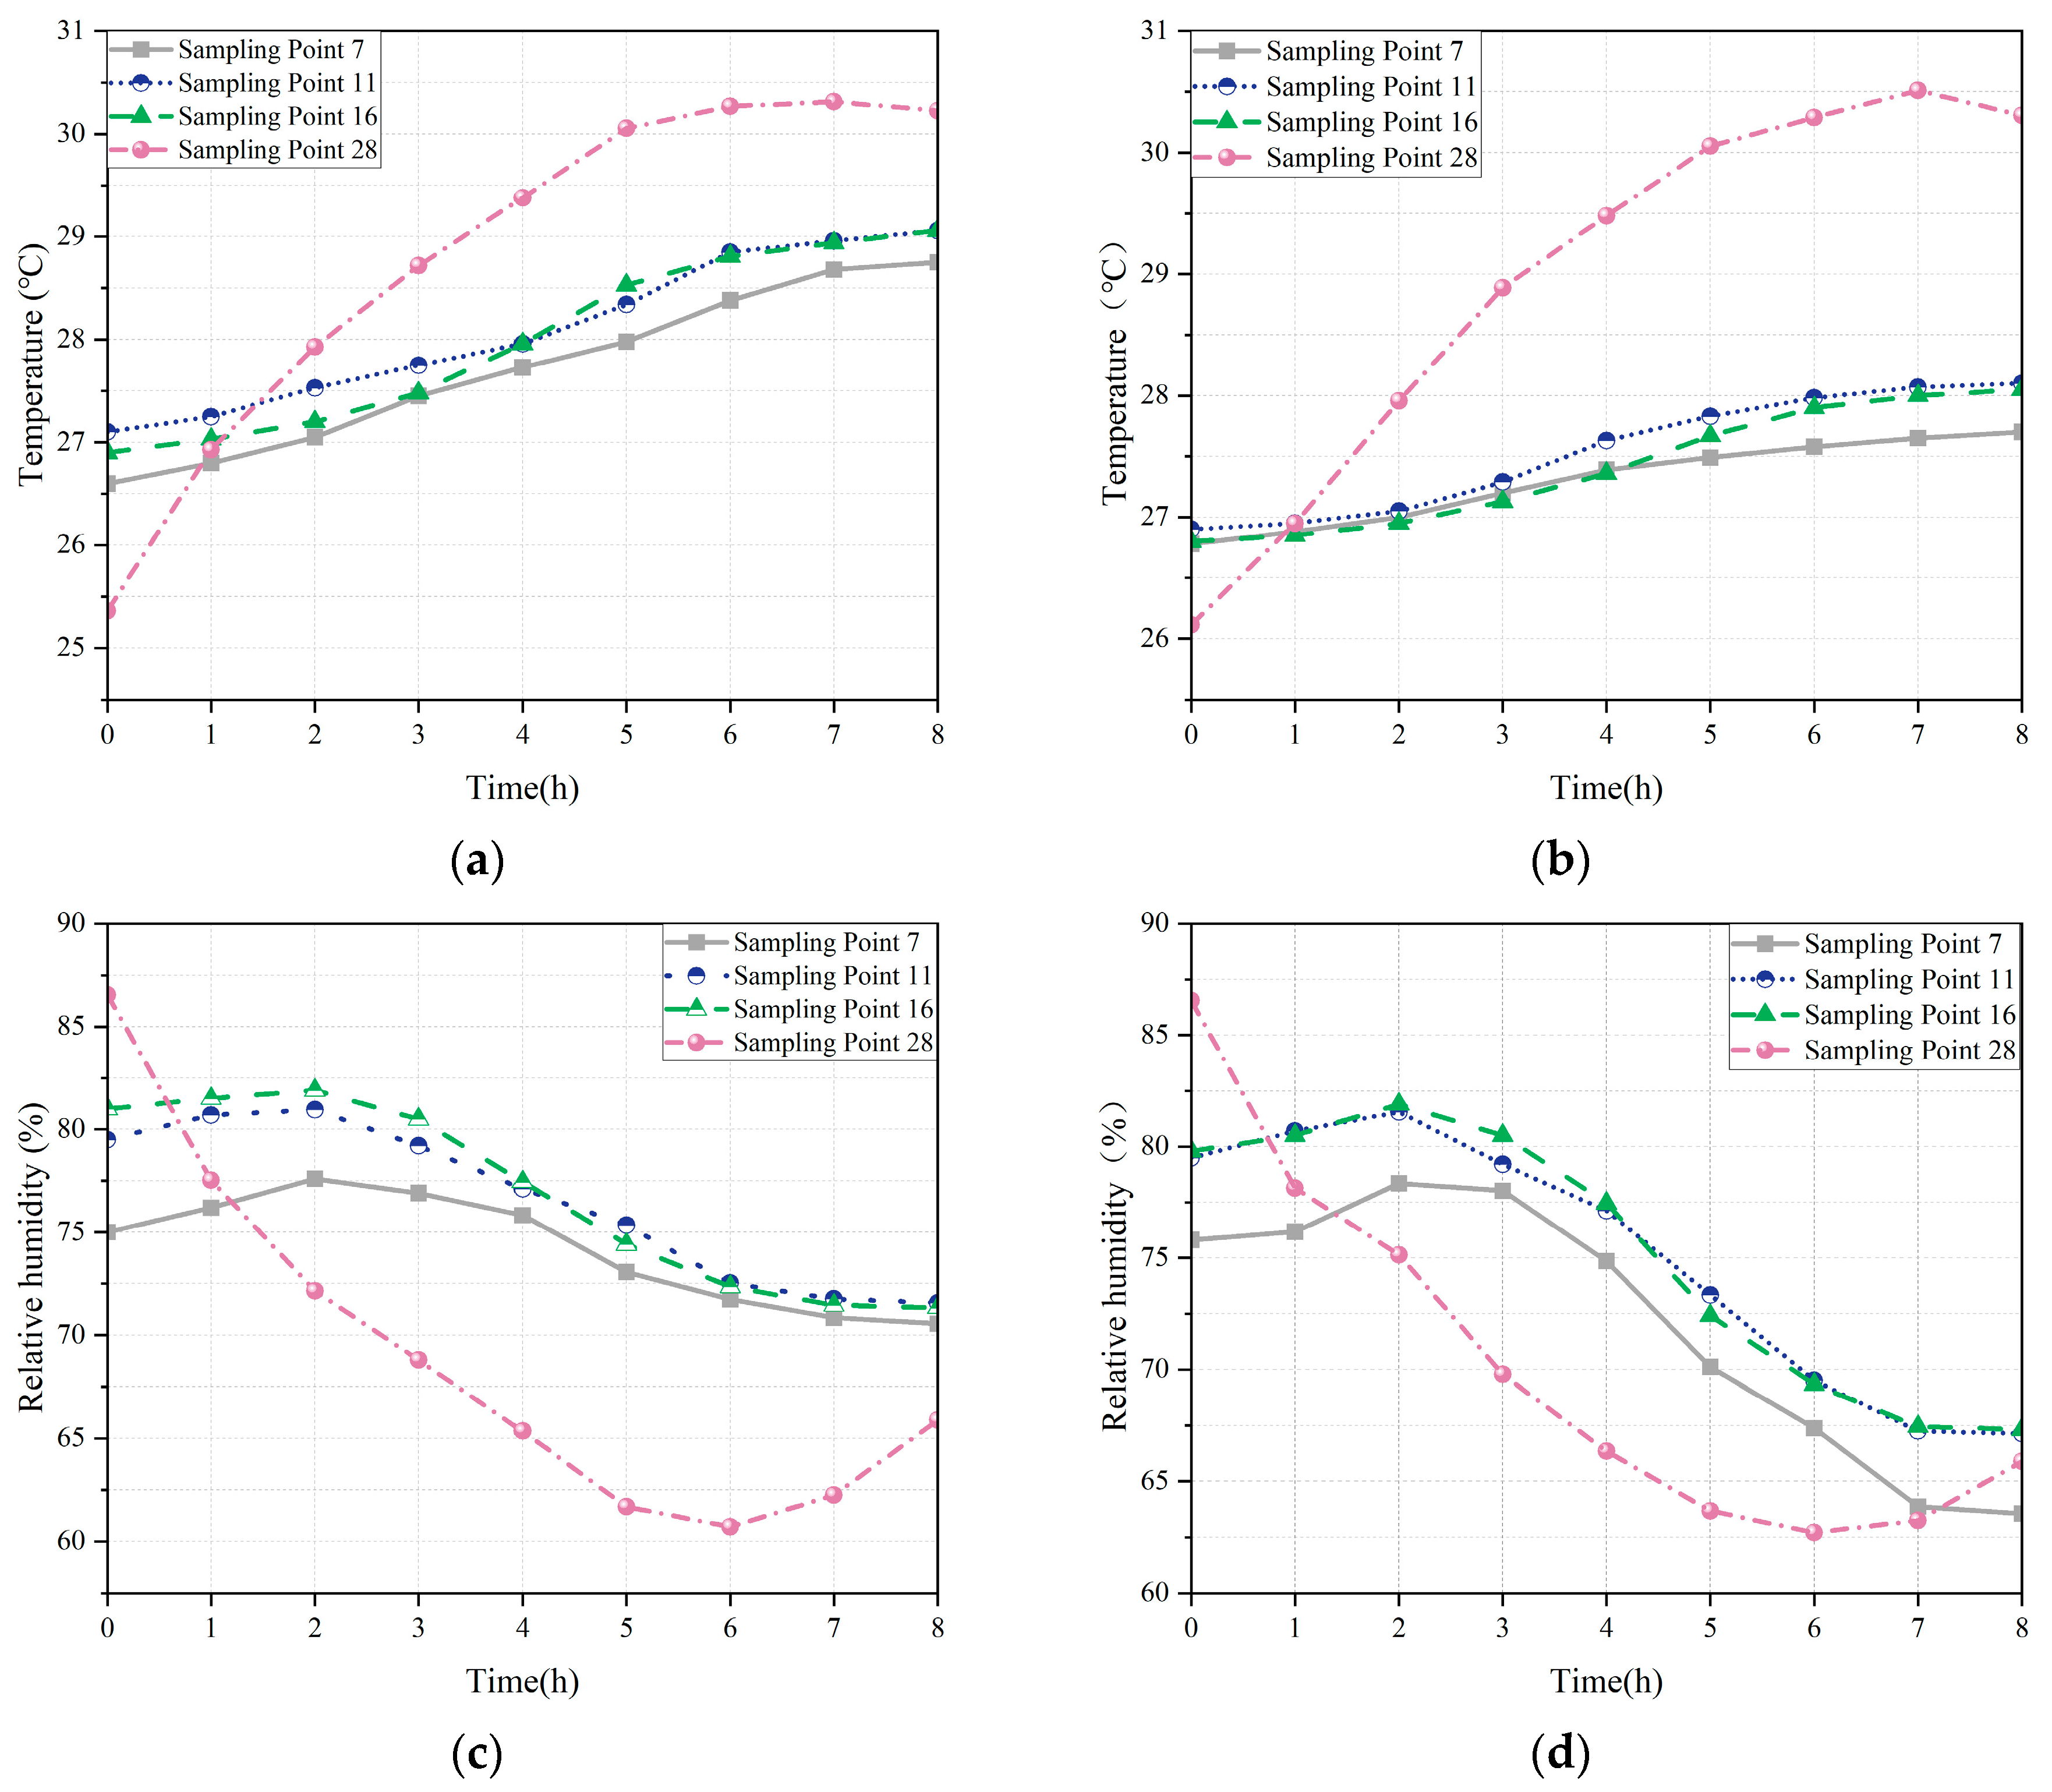
Figure 12 illustrates the temporal variations in temperature and relative humidity at Sampling Points 7, 11, 16, and 27 under Cases 2 and 3. In Figure 12a,b, the temperature variations at Sampling Points 7, 11, 16, and 27 are depicted for Cases 2 and 3, respectively. In both cases, temperature trends exhibited an initial increase followed by stabilization. This behavior was consistent across all sampling points under both Cases 2 and 3. In Case 2, the temperature rose steadily until the 6th hour, primarily due to the introduction of warmer ambient air from the bottom of the granary. Subsequently, the temperature stabilized. This stabilization is attributed to the gradual decline in ambient air temperature around 16:00, resulting in cooler air entering the grain and reducing the temperature differential responsible for heat exchange. In Figure 12a, the highest temperature recorded at Sampling Points 7, 11, and 16 upon ventilation completion was 29.1 °C. Notably, the internal temperature distribution within the grain pile remains uneven, with elevated temperatures persisting at the top. In contrast, under Case 3 (Figure 12b), the temperature increase was less pronounced due to pre-cooling treatment of the ambient air. The maximum temperature in Case 3 was 28.1 °C, 1 °C lower than in Case 2. Furthermore, the temperature differences among the sampling points were smaller in Case 3, suggesting a more uniform temperature distribution. This improvement stems from the increased thermal conduction efficiency driven by the augmented soil–air temperature gradient, enabling more effective heat transfer to the subsurface layers.
Figure 12c,d illustrate the temporal variation in relative humidity at Sampling Points 7, 11, and 16 under Cases 2 and 3, respectively. Both cases exhibited an initial increase in relative humidity followed by a decrease and eventual stabilization. During the initial 2 h of the ventilation experiment, relative humidity at all three sampling points in both cases reaches its maximum. This phenomenon is attributed to the upward movement of warm air from the base of the grain granary, which drives internal moisture accumulation toward the top, resulting in elevated humidity levels at the grain pile’s uppermost layer. Figure 12c demonstrates that, as the experiment progresses, relative humidity at Sampling Points 7, 11, and 16 begins to decline between 2 and 6 h, exhibiting a pronounced downward trend. This reduction stabilizes after the 6 h mark due to decreasing ambient air relative humidity. The ventilation airflow gradually influences the relative humidity distribution within the grain pile from bottom to top, leading to a decrease in internal relative humidity. In contrast, Figure 12d shows that relative humidity at Sampling Points 7, 11, and 16 stabilizes only after 7 h of ventilation experiment. This delay is attributed to pre-cooling treatment, which lowers the ambient air temperature, necessitating additional time for moisture absorption or release by the grain pile. The average decrease in relative humidity was 6.7% in Case 2 and 12.37% in Case 3, indicating that the pre-cooling treatment in Case 3 led to a more significant reduction in humidity. This may be attributed to the fact that the cooler air from the ventilation pretreatment process promotes a uniform air distribution inside the granary, thus accelerating the removal of moisture from the grain pile. Furthermore, at the end of the experiment, the maximum difference in relative humidity among the three sampling points was 4.01% in Case 3 and 2.5% in Case 2, indicating a more uniform distribution of humidity in Case 3. The pre-cooled ventilation air in Case 3 effectively reduced the overall humidity within the granary, minimizing the formation of high humidity areas.
We performed t-tests to examine the differences in temperature, relative humidity, and temperature difference between Cases 2 and 3 (see Table 4). The results showed that the temperature difference had a mean value of 0.365, with a standard deviation of 1.117 and a t-value of 1.667, with a p-value less than 0.05, indicating a significant difference. Similarly, the humidity difference had a mean of 0.238, standard deviation of 2.060, and a t-value of 0.590, also showing a significant result (p < 0.05). The ΔT had a mean of 0.043, standard deviation of 0.504, and a t-value of 0.437, with a p-value less than 0.05, demonstrating a significant difference. These findings confirm that the ventilation pretreatment system significantly improves temperature and humidity uniformity compared to mechanical ventilation.

3.4. Comparison of Ventilation Strategies for Condensation Prevention in Grain Piles

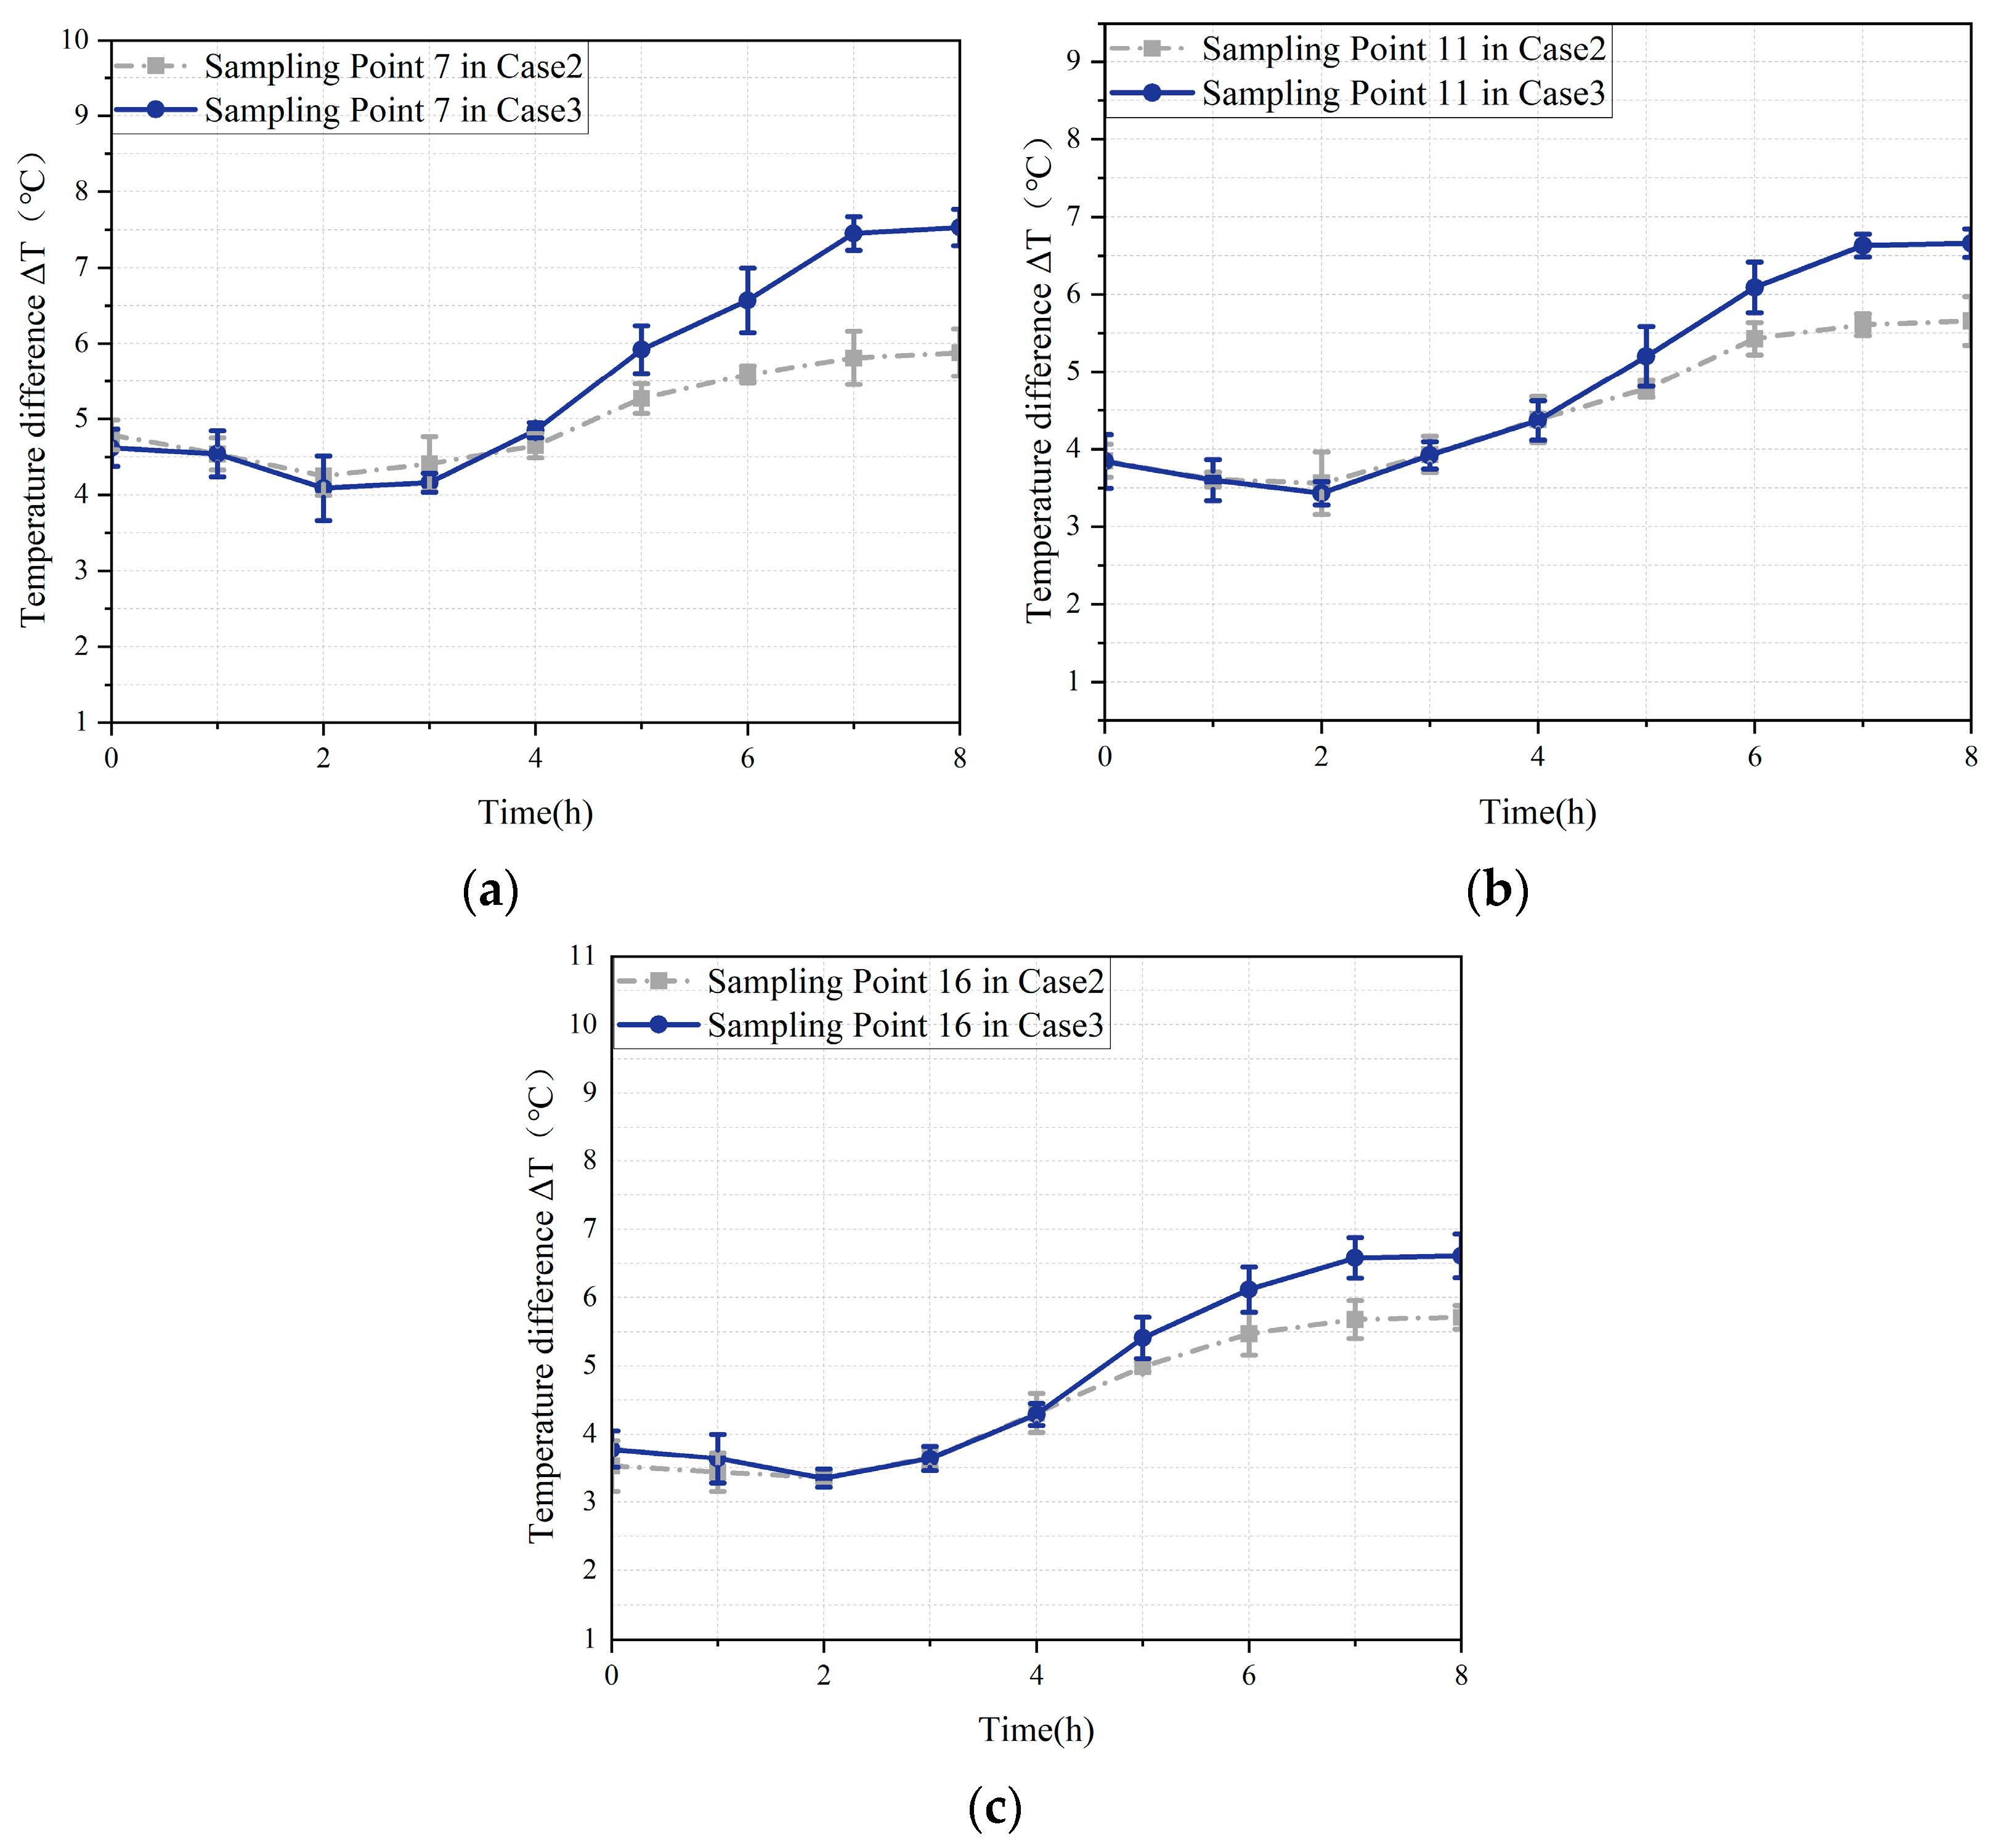
Figure 13 presents the temporal variation in the difference between measured temperature and dew point temperature at Sampling Points 7, 11, and 16, located at the top of the grain pile, under Cases 2 and 3. Notably, in both cases, the temperature difference initially decreases, followed by an increase, ultimately stabilizing. The initial decrease, observed within the first two hours, can be attributed to the upward migration of moisture within the grain pile driven by warm, incoming air, leading to an increase in dew point temperature. Subsequently, after the second hour, the temperature difference begins to increase. This trend corresponds to the gradual decrease in relative humidity within the grain granary. As the temperature rises, the dew point temperature decreases, leading to an expanding temperature difference. The temperature difference continued to increase until the 7th hour, with Case 3 exhibiting a larger increase compared to Case 2, indicating a more effective distribution of relative humidity and reduced local humidity fluctuations under pre-cooling treatment. Continuing ventilation for an additional hour shows minimal changes in the temperature difference. At this point, the internal temperature and relative humidity distribution have become more uniform, rendering further ventilation ineffective in significantly altering the grain granary’s conditions. Upon experiment completion, the maximum temperature difference at Sampling Points 7, 11, and 16 after pre-cooling treatment is 7.53 °C, compared to 5.88 °C without pre-cooling treatment. The difference arises from the pre-cooling treatment in Case 3, which reduces temperature fluctuations within the grain pile. This leads to decreased internal temperature differences, thereby weakening the micro-airflow and slowing moisture diffusion. Consequently, the measured difference between temperature and dew point temperature increases. This finding is consistent with Yin et al. [13], who experimentally demonstrated that temperature differences in grain induce micro-airflow. The density of this micro-airflow varies with temperature. Moisture migration occurs during these airflow changes. Additionally, compared to Case 2, the temperature difference between the sampling points in Case 3 was noticeably smaller, indicating better thermal uniformity. The underlying reason for this improvement is that pre-cooled air has a higher density, which reduces buoyancy-driven flow instability and promotes more uniform penetration throughout the grain pile, thus weakening the preferential channel effect. Although pre-cooled ventilation lowered the relative humidity, its primary mechanism for dew point prevention comes from thermal uniformization, rather than just humidity reduction. This is because temperature non-uniformity (with sustained micro-convective currents) induces Soret-effect moisture accumulation in cooler zones—elevating local relative humidity despite global humidity reduction. By suppressing buoyancy-driven micro-flows, the pre-cooled regime disrupts this moisture focusing process, thereby maintaining safer difference between measured temperature and dew point temperature [44]. In summary, pre-cooling the ambient air before mechanical ventilation effectively reduces condensation risk in the upper layers of the grain pile.
In addition, we did an error analysis. As can be seen from Figure 13, the errors are relatively average, with a maximum error of 0.426 °C and a minimum error of 0.096 °C, neither of which exceeds 1° C. These errors are likely attributed to uncertainties introduced by the measurement instruments used during the experiment.
It should be noted that there are differences between the small-scale model grain granary used in this study and the real full-size underground grain granary in terms of geometry, airflow distribution and environmental boundary conditions, so the experimental results cannot be completely extrapolated to the engineering reality, but their comparative analyses still provide valuable references for understanding the mechanism of the action of different ventilation methods.

4. Conclusions

This study conducted experiments on the underground granary using a laboratory platform to investigate the effects of static storage, mechanical ventilation, and ventilation pretreatment on the air area and temperature–humidity distribution within the grain pile. This investigation aimed to elucidate the influence of internal temperature and relative humidity on condensation patterns at various locations within the grain pile. The primary conclusions of this study are as follows:
(1)
During static storage, temperature stratification developed within the grain pile, with temperatures in the vertical profile initially decreasing and then increasing over time. Concurrently, relative humidity exhibited a continuous upward trend, resulting in a region of high temperature and humidity at the top center of the pile.
(2)
Mechanical ventilation effectively reduced relative humidity but was susceptible to fluctuations in ambient air temperature, thereby influencing the internal temperature distribution and the effectiveness of condensation control.
(3)
Pre-cooling the ambient air further enhanced the effectiveness of mechanical ventilation by reducing the internal temperature and creating a more uniform temperature distribution. This resulted in a lower relative humidity within the grain pile.
(4)
Ventilation pretreatment using embedded pipes is a highly effective strategy that significantly outperforms standard mechanical ventilation. By delivering cooler and more stable inlet air, it ensures a more uniform internal environment within the granary, effectively reducing the risk of condensation, particularly at the critical top layer of the grain pile. This method not only improves temperature and humidity control but also offers a practical solution for enhancing grain storage conditions, with direct implications for reducing spoilage and improving storage efficiency.
This study’s novelty lies in the systematic evaluation of ventilation pretreatment for underground granaries, where the embedded pipe system modulates the inlet air to improve grain pile temperature and humidity distribution, reducing condensation risk. We developed a practical evaluation framework to assess the impacts of static storage, mechanical ventilation, and ventilation pretreatment on temperature and humidity changes and condensation prevention. This framework not only provides a theoretical basis for condensation control in underground granaries but also offers practical guidance for implementing ventilation pretreatment strategies in engineering applications, with practical value. The experimental set-up is a small-scale model, which may underestimate the spatial heterogeneity in actual granaries. The experiment used a constant airflow rate, while real-world systems typically use variable or demand-controlled ventilation. The experimental period was short, not covering seasonal variations. Additionally, the sensors primarily focused on a limited number of vertical sampling points, making it difficult to fully capture the three-dimensional non-uniformity. No comparison with other pretreatment strategies was made, and the study was limited to wheat in a single experimental granary, without testing different crops, granary types, or climate conditions.
To make this study more practical for industrial applications, we recommend conducting large-scale, long-term field experiments to validate these findings. Testing different types of crops, granary configurations, and varying climatic conditions would provide more comprehensive insights. Additionally, comparing pre-cooling strategies with other ventilation methods in real-world settings could help optimize ventilation systems for grain storage. Integrating these findings with energy consumption and cost-effectiveness analyses will enable industry professionals to adopt more efficient and effective strategies for grain storage. Additionally, conducting sensitivity analysis of system parameters, alongside computational fluid dynamics and energy balance analysis, will contribute to developing widely applicable design and control standards.

Author Contributions

Conceptualization, X.C.; methodology, X.C. and Y.L. (Yaning Li).; formal analysis, Y.L. (Yaning Li). and S.J.; writing—original draft preparation, X.C., Y.L. (Yaning Li). and S.J.; writing—review and editing, X.C., L.Y. and Y.L. (Yang Liu).; funding acquisition, X.C., L.Y. and Y.L. (Yang Liu).; investigation, Y.G. and H.Z. All authors have read and agreed to the published version of the manuscript.

Funding

This work was supported by the National Natural Science Foundation of China (No. 51708180); Henan Province Higher Education Youth Backbone Teacher Training Program (No. 2024GGJS058); the funding supported from The Department of Science and Technology of Henan Province, China (No. 242103810076, 232102111126 and No. 242102111174).

Data Availability Statement

The original contributions presented in the study are included in the article, further inquiries can be directed to the corresponding author.

Conflicts of Interest

The authors declare no conflicts of interest.

References

  1. Li, E.; Hou, R.; Yu, J.; Niu, S.; Chen, X.; Han, B.; Zhang, P. Historical vicissitudes of grain storage environment of granaries in the North China Plain. J. Asian Archit. Build. 2024, 23, 220–244. [Google Scholar] [CrossRef]
  2. Olorunfemi, B.J.; Kayode, S.E. Post-harvest loss and grain storage technology a review. Turk. J. Agric.-Food Sci. Technol. 2021, 9, 75–83. [Google Scholar] [CrossRef]
  3. Kumar, D.; Kalita, P. Reducing postharvest losses during storage of grain crops to strengthen food security in developing countries. Foods 2017, 6, 8. [Google Scholar] [CrossRef] [PubMed]
  4. Manandhar, A.; Milindi, P.; Shah, A. An overview of the post-harvest grain storage practices of smallholder farmers in developing countries. Agriculture 2018, 8, 57. [Google Scholar] [CrossRef]
  5. Jin, L.; Li, C.; Duan, H.; Wang, Z.; Xue, Y.; Wu, Q. On-site test and numerical analysis on temperature field of an underground grain silo under static storage. J. Food Process Eng. 2023, 46, e14306. [Google Scholar] [CrossRef]
  6. Mukhtarovna, N.R.; Kizi, R.D.T.; Kholdorovich, A.K.; Botiraliyevich, U.N. Breathing of grain during storage and factors affecting the intensity of respiration. Acad. Int. Multidiscip. Res. J. 2021, 11, 290–296. [Google Scholar] [CrossRef]
  7. Zhang, X.; Zhang, H.; Wang, Z.; Chen, X.; Chen, Y. Research on the temperature field of grain piles in underground grain silos lined with plastic. J. Food Process Eng. 2022, 45, e13971. [Google Scholar] [CrossRef]
  8. Li, X.; Wu, W.; Guo, H.; Wu, Y.; Li, S.; Wang, W.; Lu, Y. Smart Grain Storage Solution: Integrated Deep Learning Framework for Grain Storage Monitoring and Risk Alert. Foods 2025, 14, 1024. [Google Scholar] [CrossRef]
  9. Müller, A.; Nunes, M.T.; Maldaner, V.; Coradi, P.C.; de Moraes, R.S.; Martens, S.; Marin, C.K. Rice drying, storage and processing: Effects of post-harvest operations on grain quality. Rice Sci. 2022, 29, 16–30. [Google Scholar] [CrossRef]
  10. Priesterjahn, E.M.; Geisen, R.; Schmidt-Heydt, M. Influence of Light and Water Activity on Growth and Mycotoxin Formation of Aspergillus flavus and A. parasiticus. Microorganisms 2020, 8, 2000. [Google Scholar] [CrossRef]
  11. De Melo Nazareth, T.; Pérez, E.S.; Luz, C.; Meca, G.; Quiles, J.M. Comprehensive Review of Aflatoxin and Ochratoxin A Dynamics: Emergence, Toxicological Impact, and Advanced Control Strategies. Foods 2024, 13, 1920. [Google Scholar] [CrossRef]
  12. Aqil, M. The effect of temperature and humidity of storage on maize seed quality. IOP Conf. Earth Environ. Sci. 2020, 484, 012116. [Google Scholar] [CrossRef]
  13. Yin, J.; Zhang, Z.; Wang, X.; Yao, Q.; Wu, Z. The Temperature and Relative Humidity Change in Wheat Bulk under the Condition of Temperature Differences. In Proceedings of the International Conference of Fluid Flow, Heat and Mass Transfer, Toronto, ON, Canada, 21–23 August 2017; p. 147. [Google Scholar] [CrossRef]
  14. Ajayi, E.S.; Omodara, M.A.; Owoyele, S.N.; Ade, A.R.; Babarinsa, F.A. Temperature fluctuation inside inert atmosphere silos. Niger. J. Technol. 2016, 35, 642–646. [Google Scholar] [CrossRef]
  15. Jian, F.; Jayas, D.S.; White, N.D. Temperature fluctuations and moisture migration in wheat stored for 15 months in a metal silo in Canada. J. Stored Prod. Res. 2009, 45, 82–90. [Google Scholar] [CrossRef]
  16. Ge, M.; Chen, G.; Liu, C.; Zheng, D.; Liu, W. Effect of Vertical Pressure on Temperature Field Distribution of Bulk Paddy Grain Pile. Appl. Sci. 2022, 12, 10392. [Google Scholar] [CrossRef]
  17. Kechkin, I.; Ermolaev, V.; Belyaeva, M.; Tarakanova, V.; Gurkovskaya, E.; Buzetti, K. Processes of Heat and Mass Transfer During Grain Mass Storage in Metal Silos of Large Capacity. KnE Life Sci. 2021, 6, 206–214. [Google Scholar] [CrossRef]
  18. Jian, F.; Jayas, D.S.; White, N.D. Specific heat, thermal diffusivity, and bulk density of genetically modified canola with high oil content at different moisture contents, temperatures, and storage times. Trans. ASABE 2013, 56, 1077–1083. [Google Scholar] [CrossRef]
  19. LoVetri, J.; Asefi, M.; Gilmore, C.; Jeffrey, I. Innovations in electromagnetic imaging technology: The stored-grain-monitoring case. IEEE Antennas Propag. Mag. 2020, 62, 33–42. [Google Scholar] [CrossRef]
  20. Asefi, M.; Gilmore, C.; Jeffrey, I.; LoVetri, J.; Paliwal, J. Detection and continuous monitoring of localised high-moisture regions in a full-scale grain storage bin using electromagnetic imaging. Biosyst. Eng. 2017, 163, 37–49. [Google Scholar] [CrossRef]
  21. Novoa-Muñoz, F. Simulation of the temperature of barley during its storage in cylindrical silos. Math. Comput. Simul. 2019, 157, 1–14. [Google Scholar] [CrossRef]
  22. Shammi, S.; Hossen, M.A.; Al Mamun, M.R.; Soeb, M.J.A. Temporal and spatial representation of temperature and moisture in drying chamber and its impact on vertical vacuum dehumidifying rice seed dryer performance. J. Agric. Food Res. 2022, 10, 100424. [Google Scholar] [CrossRef]
  23. Pӑun, A.; Stroescu, G.; Zaica, A.; Khozamy, S.Y.; Zaica, A.; Cristea, O.; Stefan, V.; Bălţatu, C. Storage of grains and technical plants through active ventilation for the purpose of maintaining the quality of stored products. E3S Web Conf. 2021, 286, 03010. [Google Scholar] [CrossRef]
  24. Coradi, P.C.; de Oliveira, M.B.; de Oliveira Carneiro, L.; de Souza, G.A.C.; Elias, M.C.; Brackmann, A.; Teodoro, P.E. Technological and sustainable strategies for reducing losses and maintaining the quality of soybean grains in real production scale storage units. J. Stored Prod. Res. 2020, 87, 101624. [Google Scholar] [CrossRef]
  25. Da Silva, W.S.V.; Vanier, N.L.; Ziegler, V.; de Oliveira, M.; Dias, A.R.G.; Elias, M.C. Effects of using eolic exhausters as a complement to conventional aeration on the quality of rice stored in metal silos. J. Stored Prod. Res. 2014, 59, 76–81. [Google Scholar] [CrossRef]
  26. Johnselvakumar, L.; Maier, D.E. Aeration strategies for wheat bulk storage in North India. In Proceedings of the ASABE Annual International Meeting, Providence, RI, USA, 29 June–2 July 2008; p. 084505. [Google Scholar] [CrossRef]
  27. Hammami, F.; Ben Mabrouk, S.; Mami, A. Modelling and simulation of heat exchange and moisture content in a cereal storage silo. Math. Comput. Model. Dyn. 2016, 22, 207–220. [Google Scholar] [CrossRef]
  28. Behaeen, M.A.; Mahmoudı, A.; Ranjbar, S.F. An Evaluation of the Performance of Forced Air Cooling on Cooling Parameters in Transient Heat Transfer at Different Layers of Pomegranate. J. Agric. Sci. Sri Lanka 2018, 24, 12–21. [Google Scholar] [CrossRef]
  29. Kechkin, I.; Ermolaev, V.; Ivanov, M.; Yakovchenko, M.; Gurkovskaya, E.; Glebova, I. Ventilation of grain in metal silos of large capacity in the South of Russia. Earth Environ. Sci. 2021, 659, 012135. [Google Scholar] [CrossRef]
  30. Gao, G.; Wang, X.; Wu, J.; Li, X.; Xu, R.; Zhang, X. An adaptive grain-bulk aeration system for squat silos in winter: Effects on intergranular air properties and grain quality. Smart Agric. Technol. 2023, 3, 100121. [Google Scholar] [CrossRef]
  31. Antunes, A.M.; Devilla, I.A.; Neto, A.C.B.; Alves, B.G.X.; Alves, G.R.; Santos, M.M. Development of an automated system of aeration for grain storage. Afr. J. Agric. Res. 2016, 11, 4293–4303. [Google Scholar] [CrossRef]
  32. De Carvalho Lopes, D.; Martins, J.H.; Lacerda Filho, A.F.; de Castro Melo, E.; de Barros Monteiro, P.M.; de Queiroz, D.M. Aeration strategy for controlling grain storage based on simulation and on real data acquisition. Comput. Electron. Agric. 2008, 63, 140–146. [Google Scholar] [CrossRef]
  33. Cañizares, L.D.C.C.; da Silva Timm, N.; Lang, G.H.; Gaioso, C.A.; Ferreira, C.D.; De Oliveira, M. Effects of using wind exhausters on the quality and cost of soybean storage on a real scale. J. Stored Prod. Res. 2021, 93, 101834. [Google Scholar] [CrossRef]
  34. Petravicius, D.; Binelo, M.O.; Binelo, M.D.F.; Faoro, V.; Da Silva, J.A. Genetic algorithm in the design of soybean silos for airflow homogenization. Rev. Bras. Eng. Agric. Amb. 2023, 27, 531–538. [Google Scholar] [CrossRef]
  35. Ahmad, S.N.; Prakash, O. Thermal performance of earth–air heat exchanger using an experimental test rig. Arab. J. Sci. Eng. 2023, 48, 11665–11678. [Google Scholar] [CrossRef]
  36. Hachim, D.M.; Al-Manea, A.; Al-Rbaihat, R.; Abed, Q.A.; Sadiq, M.; Homod, R.Z.; Alahmer, A. Enhancing the performance of photovoltaic solar cells using a hybrid cooling technique of thermoelectric generator and heat sink. J. Sol. Energy Eng. 2025, 147, 021011. [Google Scholar] [CrossRef]
  37. Lei, W.; Liu, J.; Zhao, J.; Qi, X.; Tai, C.; Zhang, L.; Li, A. Study of the application of solar chimneys combined with earth-air heat exchangers ventilation system (SEVS) in a solar greenhouse. Energy 2025, 334, 137537. [Google Scholar] [CrossRef]
  38. Wang, Y.; Duan, H.; Zhang, H.; Fang, Z. Modeling on heat and mass transfer in stored wheat during forced cooling ventilation. J. Therm. Sci. 2010, 19, 167–172. [Google Scholar] [CrossRef]
  39. Zhong, K.; Meng, Q.; Liu, X. A ventilation experimental study of thermal performance of an urban underground pipe rack. Energy Build. 2021, 241, 110852. [Google Scholar] [CrossRef]
  40. Lutz, É.; Coradi, P.C. Applications of new technologies for monitoring and predicting grains quality stored: Sensors, internet of things, and artificial intelligence. Measurement 2022, 188, 110609. [Google Scholar] [CrossRef]
  41. Chabane, F.; Moummi, N.; Brima, A. Forecast of relationship between a relative humidity and a dew point temperature. J. Power Technol. 2018, 98, 183. [Google Scholar]
  42. Murray, F.W. On the computation of saturation vapor pressure. J. Appl. Meteorol. Climatol. 1967, 6, 203–204. [Google Scholar] [CrossRef]
  43. Gastón, A.; Abalone, R.; Bartosik, R.E.; Rodríguez, J.C. Mathematical modelling of heat and moisture transfer of wheat stored in plastic bags (silo bags). Biosyst. Eng. 2009, 104, 72–85. [Google Scholar] [CrossRef]
  44. Cai, W.; Zhu, L.; Dong, S.; Xie, G.; Li, J. Effect of Thermophysical Properties on Coupled Heat and Mass Transfer in Porous Material during Forced Convective Drying. Adv. Mech. Eng. 2014, 6, 830387. [Google Scholar] [CrossRef]
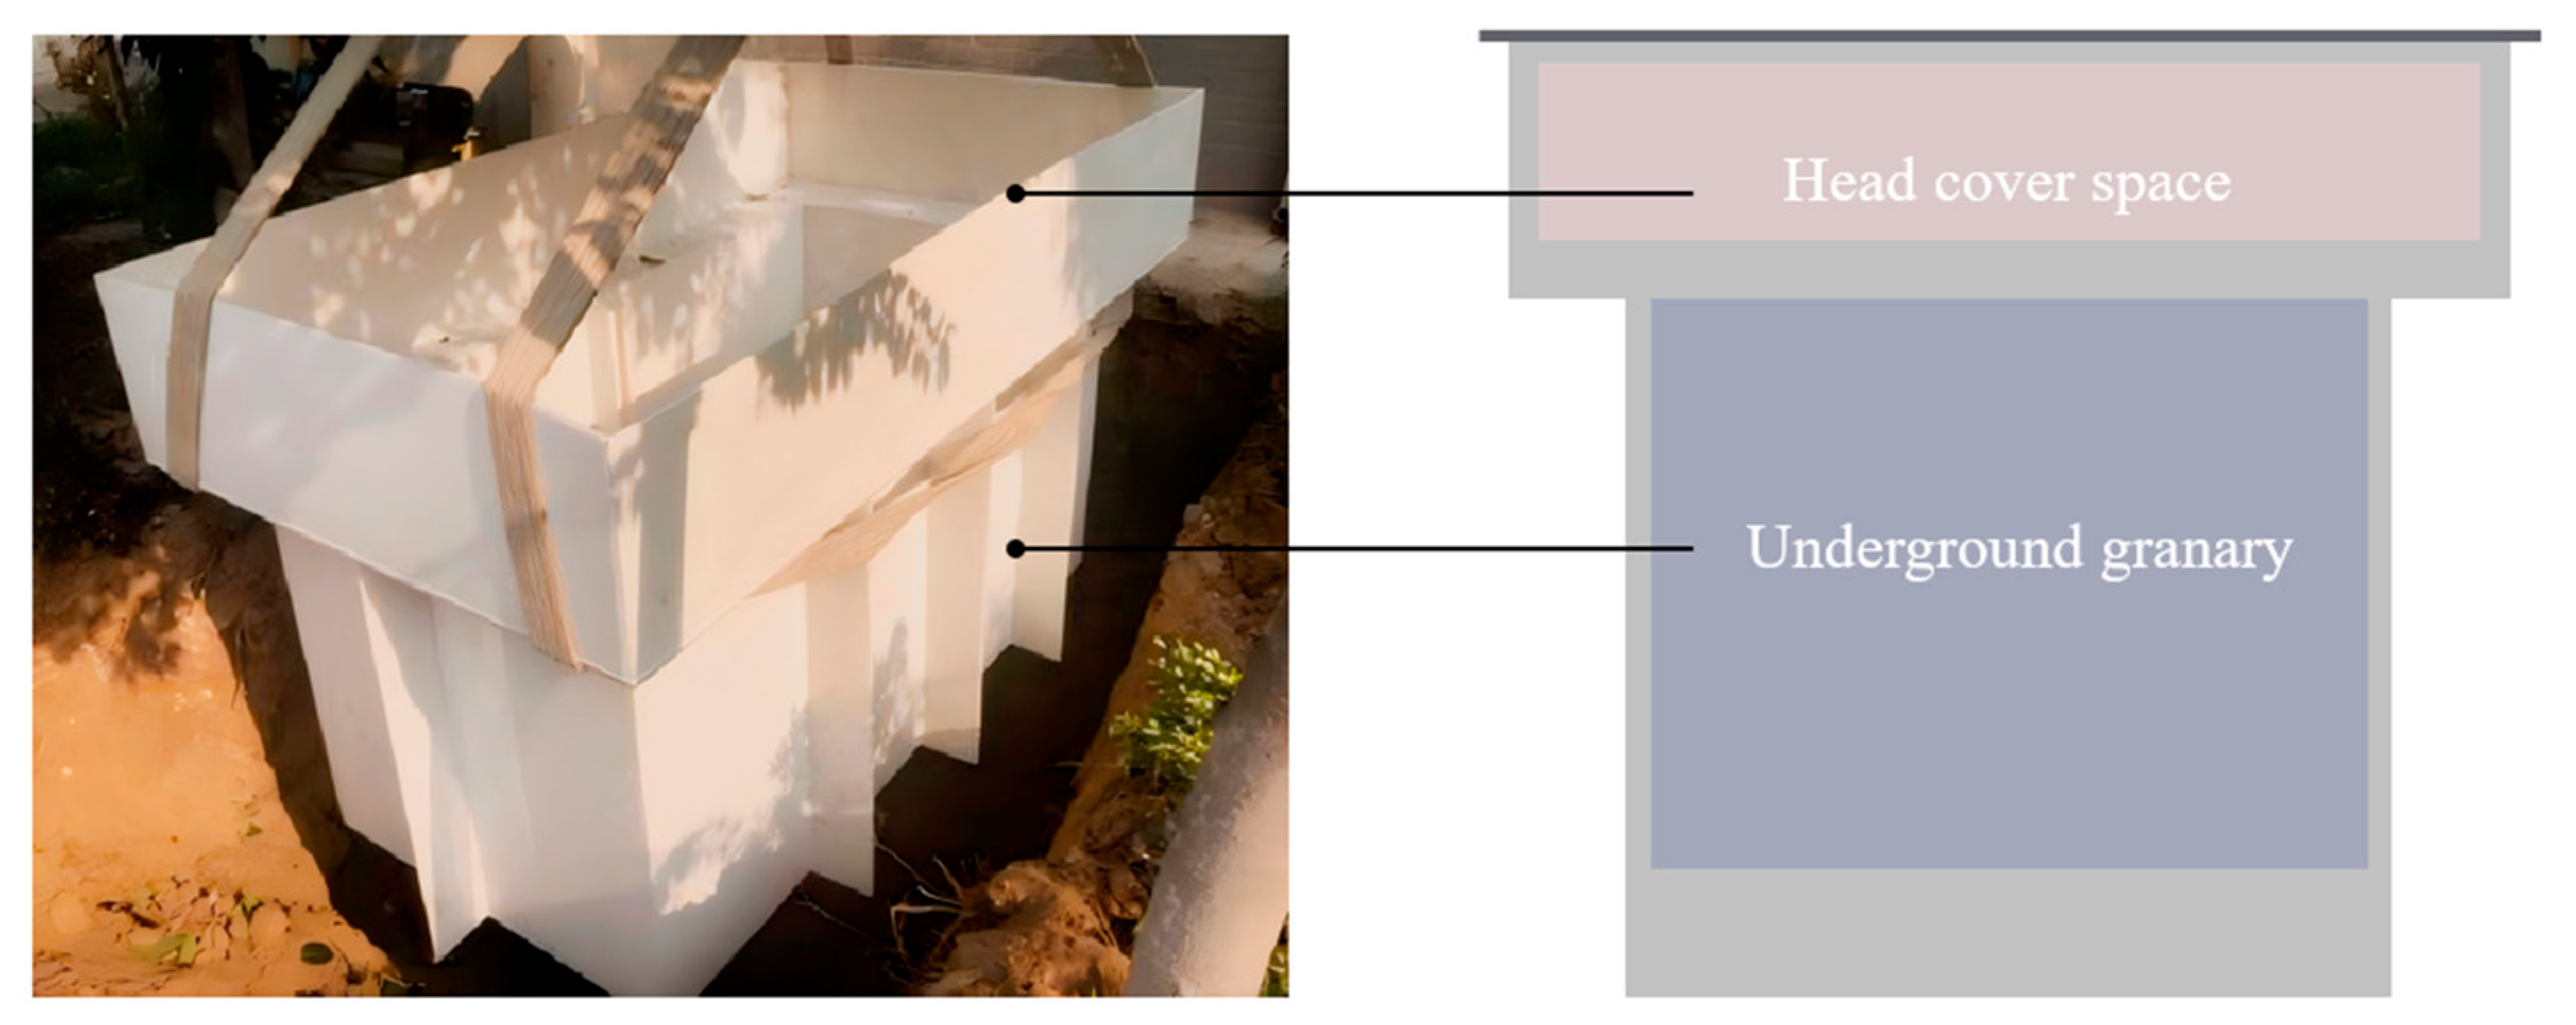
Figure 1. Components of underground granary.
Buildings 15 03483 g001
Figure 2. Sketch of the experimental set-up.
Buildings 15 03483 g002
Figure 3. Arrangement of embedded pipes.
Buildings 15 03483 g003
Figure 4. Schematic of sampling points.
Buildings 15 03483 g004
Figure 5. Schematic diagram of the experimental procedure. (a) Schematic diagram of the airflow path in Case 2; (b) Schematic diagram of the airflow path in Case 3. (c) Flowchart diagram of the experiment.
Buildings 15 03483 g005aBuildings 15 03483 g005b
Figure 6. Temporal variations in temperature and relative humidity at Sampling Points 26, 27, and 28 under Case 1. (a) Temperature. (b) Relative Humidity.
Buildings 15 03483 g006
Figure 7. Temperature distribution along the central vertical plane of the grain pile over time under Case 1. (a) Day 0. (b) Day 1. (c) Day 9. (d) Day 24.
Buildings 15 03483 g007
Figure 8. Temporal variations in humidity distribution along the central vertical plane of the grain pile under Case 1. (a) Day 0. (b) Day 1. (c) Day 13. (d) Day 24.
Buildings 15 03483 g008aBuildings 15 03483 g008b
Figure 9. Temporal variations in the difference between measured temperature and dew point temperature at Sampling Points 6, 7, 11, 12, 16, and 17 under Case 1.
Buildings 15 03483 g009
Figure 10. Variations in temperature and relative humidity at Sampling Points 26 and 28 under Case 2 with respect to ventilation time. (a) Temperature. (b) Relative Humidity.
Buildings 15 03483 g010
Figure 11. Variations in temperature and relative humidity at Sampling Point 10 for Cases 2 and 3 with respect to ventilation time. (a) Temperature. (b) Relative humidity.
Buildings 15 03483 g011
Figure 12. Temporal variation in temperature and humidity distribution at Sampling Points 7, 11, 16, and 28 in Cases 2 and 3. (a) Temperature at sampling points under Case 2. (b) Temperature at sampling points under Case 3. (c) Relative humidity at sampling points under Case 2. (d) Relative humidity at sampling points under Case 3.
Buildings 15 03483 g012
Figure 13. Temporal variations in the difference between measured temperature and dew point temperature at Sampling Points 7, 11, and 16 under Cases 2 and 3. (a) Sampling Point 7. (b) Sampling Point 11. (c) Sampling Point 16.
Buildings 15 03483 g013
Table 1. Experimental cases.
CasesStagesDuration of Each CaseTotal Days per CaseAirflow RatesVentilation Equipment Configuration
1Static storage576 h24 d0None
2Mechanical ventilation8 h3 d3.3 m3/minUtilization of conventional ventilation equipment
3Ventilation pretreatment8 h3 d3.3 m3/minUtilization of conventional ventilation equipment with ambient air pre-cooled via the embedded pipe system
Table 2. Changes in mean difference and standard deviation of temperature between the top layer and second layer at different times in Case 1.
Time (d)011324
Mean differences (°C)0.680.370.0340.31
Standard deviation0.310.160.180.15
Table 3. Changes in mean difference and standard deviation of relative humidity between the top layer and second layer at different times in Case 1.
Time (d)01924
Mean differences (%)0.700.861.532.34
Standard deviation0.710.301.371.7
Table 4. Statistical analysis.
Temperature DifferenceRelative Humidity DifferenceΔT
Mean differences0.3650.2380.043
Standard deviation1.1172.0600.504
t-tests1.6670.5900.437
p<0.05<0.05<0.05
Disclaimer/Publisher’s Note: The statements, opinions and data contained in all publications are solely those of the individual author(s) and contributor(s) and not of MDPI and/or the editor(s). MDPI and/or the editor(s) disclaim responsibility for any injury to people or property resulting from any ideas, methods, instructions or products referred to in the content.