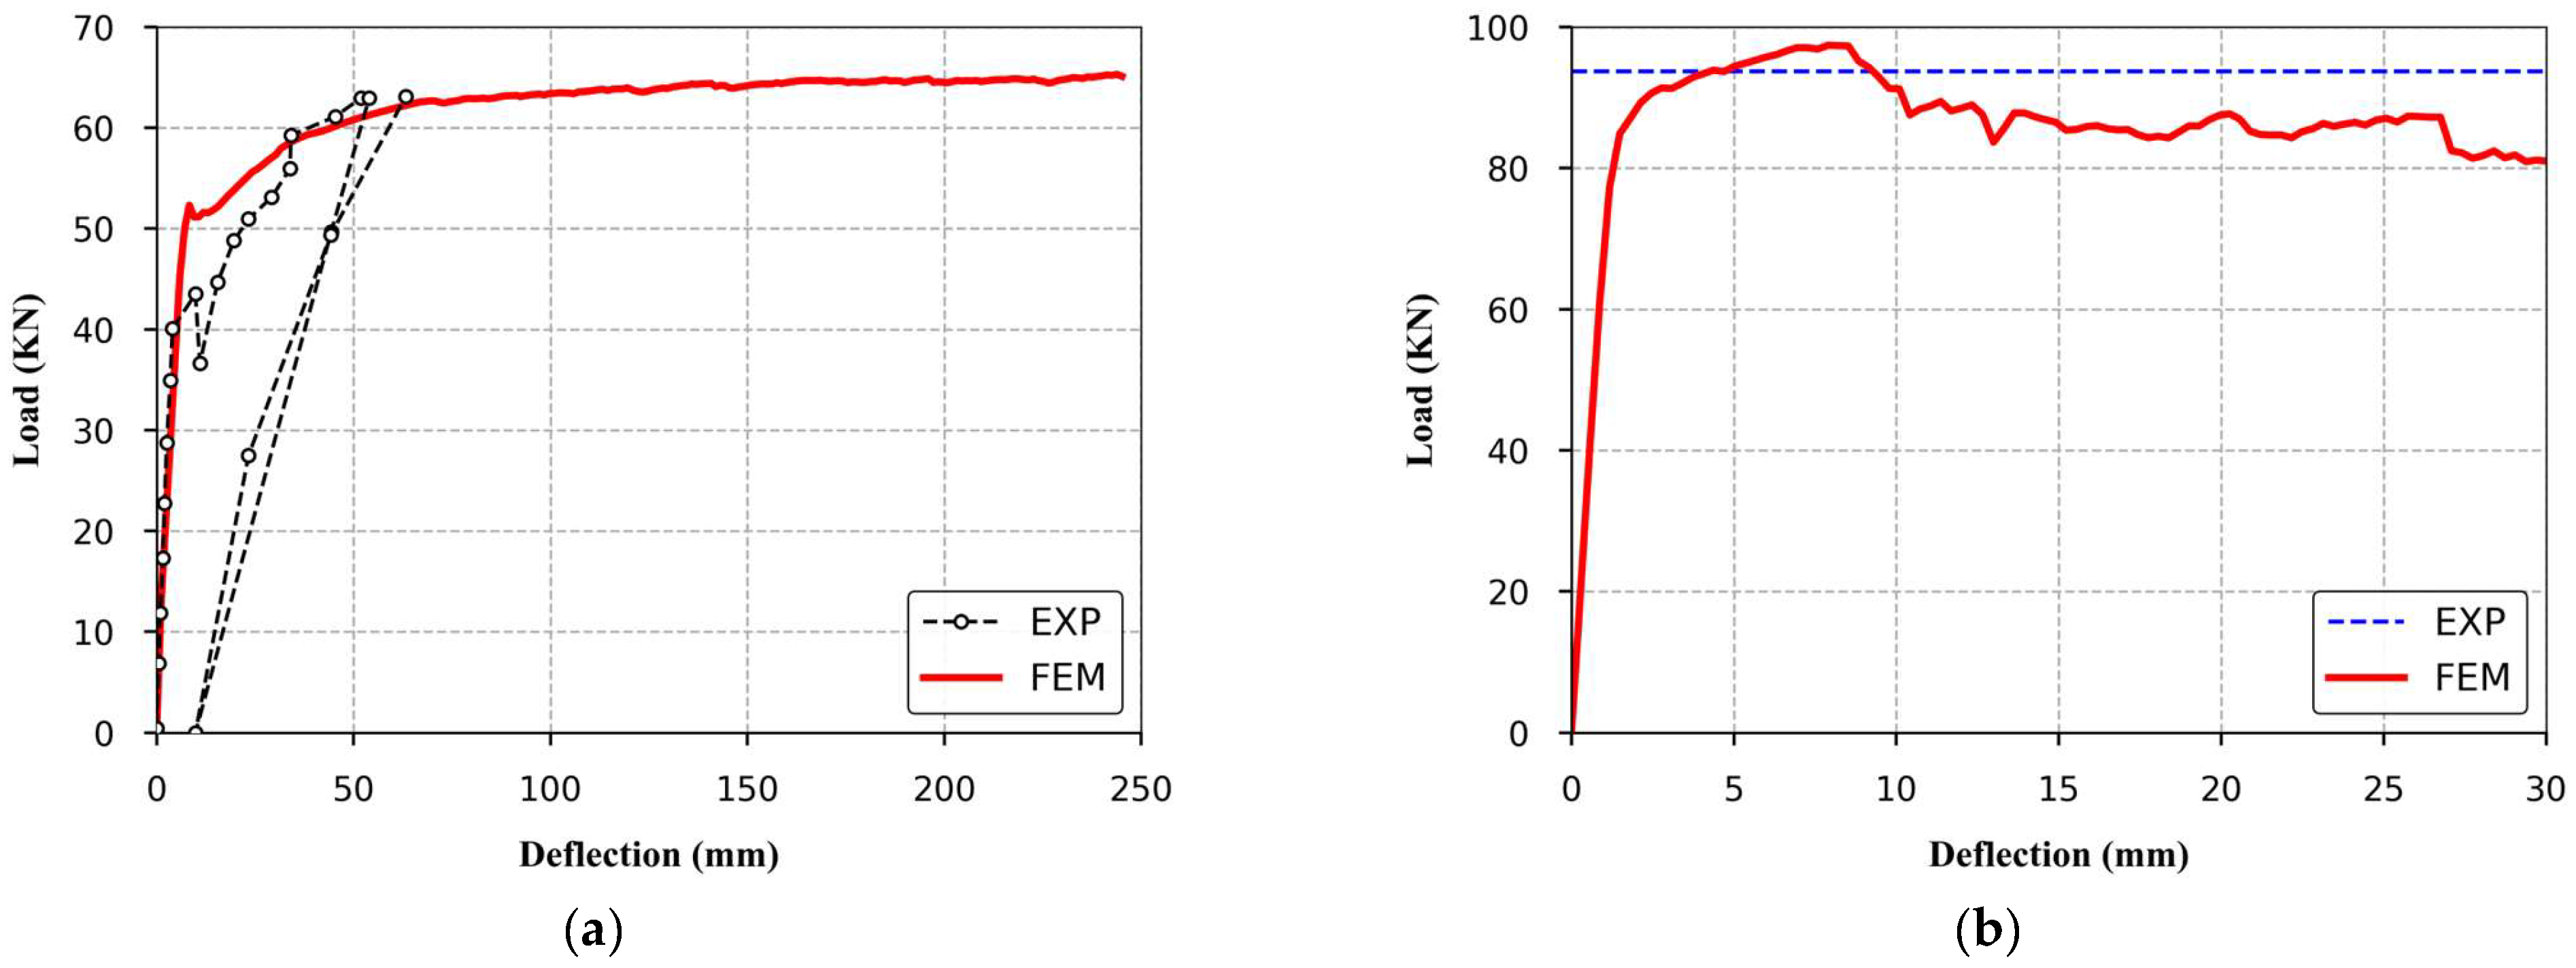
1. Introduction
Precast, prestressed, Hollow Core Slabs (HCSs) have become a popular choice for floor and roof systems in many modern multi-story buildings due to their durability, resilience, economy, and ease of placement. The design of HCSs includes continuous voids, separated by thin webs, running longitudinally through the slabs, effectively reducing the weight of the structure without compromising its strength compared to solid concrete slabs. There are three basic geometries commonly used for HCSs with (1) the oldest one featuring circular cores, (2) another one featuring closely spaced openings with an oval shape that is topped by a peaked crown (such as the Spancrete system), and (3) a newer system featuring wider, rectangular shaped cores with radiused corners (such as the Elematic system). While most common in the US, the Spancrete system has also been introduced to other countries through Spancrete Global Services. Being prefabricated off-site, they can be quickly and efficiently installed on-site, significantly reducing construction time and labor costs. HCS units are integrated with longitudinal prestressing strands which effectively delay cracking. As a result, service loads are primarily supported by uncracked concrete [
1].
HCS floors are typically designed as an assembly of single, one-way, simply supported units primarily intended to resist uniformly distributed loads. The floor system is constructed by connecting adjacent units through cast-in-place concrete longitudinal joints at the keyways, facilitating force transfer between slabs. However, in many applications, individual units are also subjected to concentrated and line loads. In such cases, non-uniform loads applied to a single unit are transversely distributed to surrounding units via shear keys, which function as hinges, redistributing a portion of the applied load and reducing the demand on the directly loaded element.
The manufacturing process of HCS restricts the inclusion of shear or other transverse reinforcement, limiting their structural response to rely exclusively on the tensile strength of the concrete. Due to concrete’s inherently low tensile capacity and its complex behavior under concentrated loading, which induces transverse bending moments and localized shear forces, HCS systems appear to be susceptible to punching shear failure, as they are not explicitly configured to resist such effects.
Although extensive research has addressed individual HCS units [
2,
3,
4,
5,
6,
7,
8,
9,
10,
11,
12,
13,
14], only a small amount of work has been conducted on full-scale HCS floor assemblies, where the effects of load distribution could be examined [
15,
16,
17,
18,
19,
20,
21,
22,
23,
24,
25]. Tests on 400 mm (16 in.) deep HC floors under concentrated loads at Technical Research Centre of Finland (VTT) [
18,
19] revealed brittle modified form of punching failures, characterized by longitudinal cracks on both top and bottom surfaces, with failure occurring under different loading positions. Aswad and Jacques [
22] examined 200 mm (8 in.) deep single and double-unit assemblies, finding that slabs loaded at midspan, and one-third of the span failed in modified punching, while those loaded closer to supports exhibited a combined shear–torsion failure. Pajari [
24] investigated a 400 mm (16 in.) deep HC floor with pre-cracked longitudinal joints, where tests under varying transverse load positions showed that while a single point load led to modified punching failure, load redistribution using a spreader beam resulted in shear–torsion failure, significantly increasing load capacity. Lucio and Castilho [
25] studied the local failure of single HC slabs, noting that slabs without filled cores initially developed longitudinal cracks before experiencing brittle shear failure, whereas edge-loaded slabs failed without longitudinal cracking. Their findings demonstrated that filling the cores improved modified punching resistance by approximately 30% under different loading conditions.
While the above-mentioned studies have examined the overall failure mechanisms of HCSs subjected to concentrated loads, a dedicated focus on their punching shear behavior remains lacking. As a consequence of the resulting gap in the knowledge base, the PCI design manual [
26] does not provide specific guidance for evaluating punching shear capacity. Moreover, according to EN 1168 [
27], the applied concentrated load must not exceed a calculated punching load, which is based on the effective width of the webs, slab height, and concrete properties. However, analysis of experimental tests on HCS floors performed by Jeziorski and Derkowski [
28] suggest that the actual modified punching capacity is significantly higher than current code estimates. Their findings indicate that defining the control perimeter using a stress dispersion angle of 35°, rather than the conventional 45°, offers a more accurate representation of the failure mechanism. Using numerical analyses, Broo [
29] examined torsion and shear–torsion interaction in HCS and showed that presence of adjacent slabs enhances the ultimate capacity of the directly loaded unit. These discrepancies highlight the constraints of existing design provisions, which are compounded by the shortage of well-documented experimental data and the relatively small number of numerical studies [
29,
30,
31] addressing modified punching shear in full-scale HCS floor systems under point loads. Therefore, this topic remains insufficiently explored, and this failure in hollow-core slabs is still not fully understood, particularly because it differs significantly from conventional punching shear observed in solid slabs. This underscores the need for more detailed and targeted finite element (FE) analyses to better predict the structural response and ensure safe design under concentrated loading conditions.
While most existing studies focus on HCSs with circular or rectangular voids, research on Spancrete units is lacking. Due to their unique core geometry, which modifies stress flow and crack development under concentrated loading, they may exhibit a potentially distinct failure response. For this purpose, this study investigates the structural response of Spancrete hollow-core slabs using a detailed numerical approach, based on a 3D non-linear FE model developed in ABAQUS [
32] for formulating a conceptual framework of the modified punching shear phenomenon in HCSs. The modeling approach also considers more realistic construction scenarios, such as the absence of joint reinforcement and the use of high-strength grout, both of which are common in modern precast floor systems in the US. In addition, the present study explores the effect of loading area size and load location, providing further insights into the structural response and failure characteristics of these slabs.
2. Numerical Simulations
A numerical approach using the software ABAQUS/Explicit 2024 was formulated to simulate the prestressed precast hollow-core concrete slabs for FE analysis. In the following, it is described in relation to the Spancrete hollow-core sections. However, the same modeling approach was applied to sections with circular and rectangular cores (e.g., Elematic) used for numerical validation, notwithstanding changes in the HCS sections. The next section describes the experimental verification of the FE approach used here. The principal difference in the analysis of the three types of HCS section is the mesh which has distinct geometric features for each. In the experimental studies considered, different prestressing strand layouts and support conditions were also used.
2.1. Geometry and Mesh Considerations
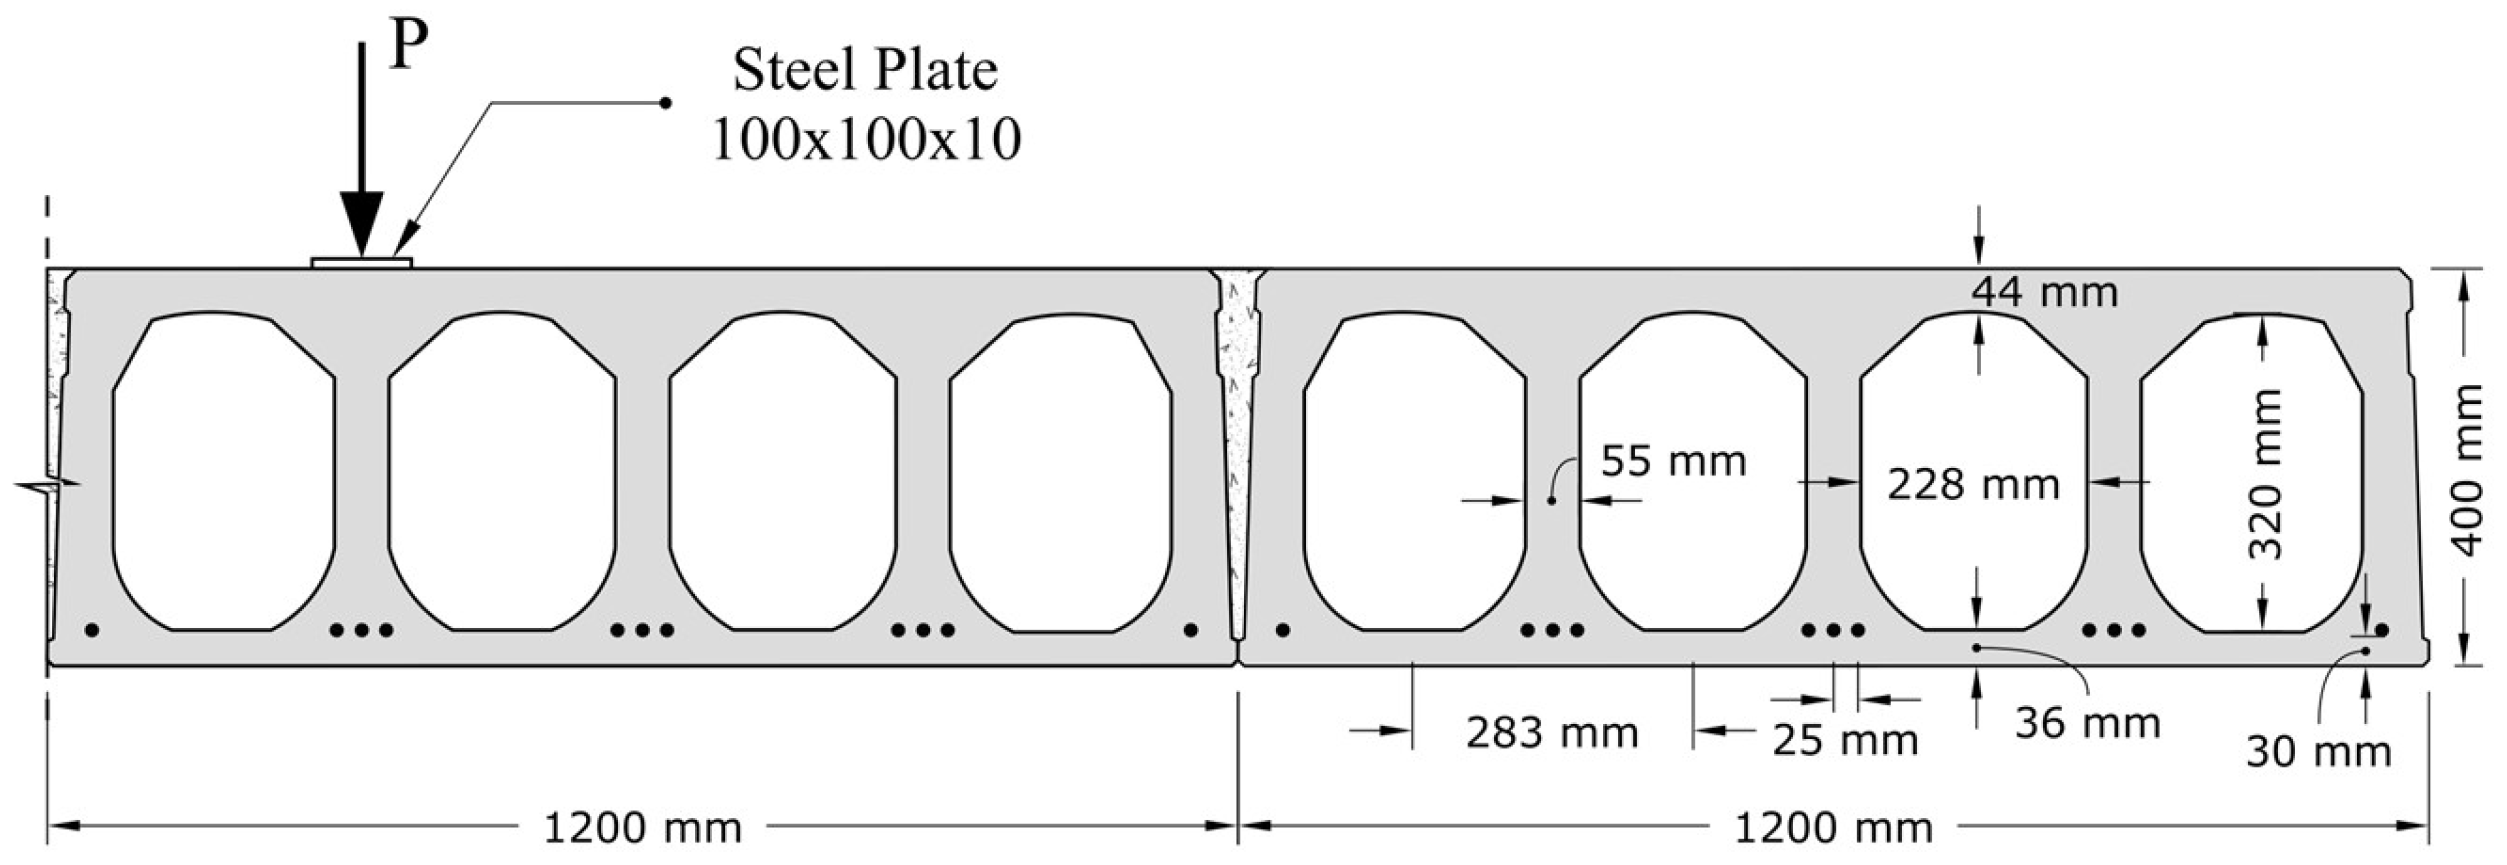
The FE mesh was developed based on the dimensions of each HCS section, with
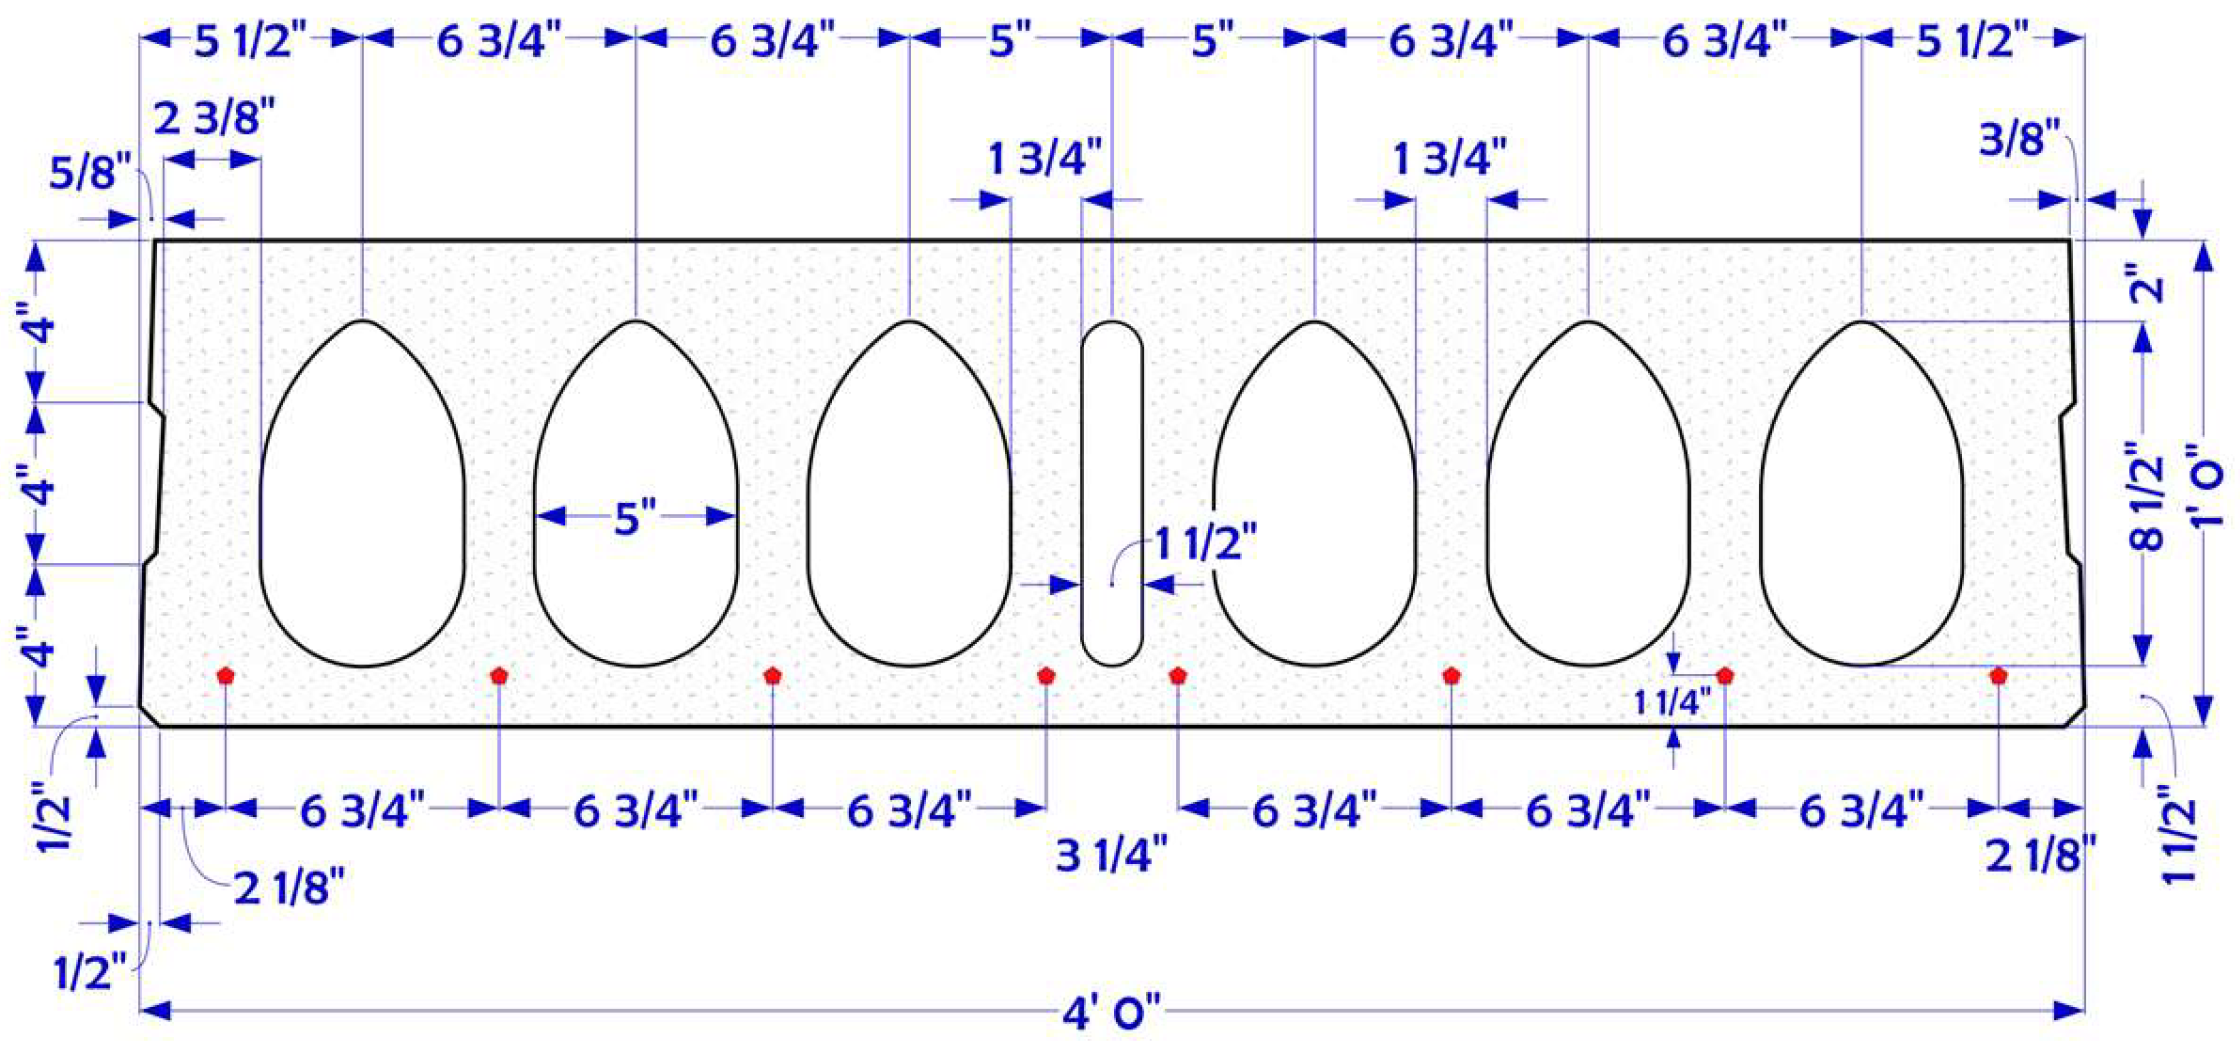
Figure 1 illustrating the Spancrete section used in this study. Individual slabs were connected via cast-in-place concrete longitudinal joints, functioning as shear keys, to form the complete floor system. The longitudinal joint consists of a narrow keyway located between adjacent units. During assembly, this keyway is filled with grout to interlock the units and enable shear transfer across the floor system.
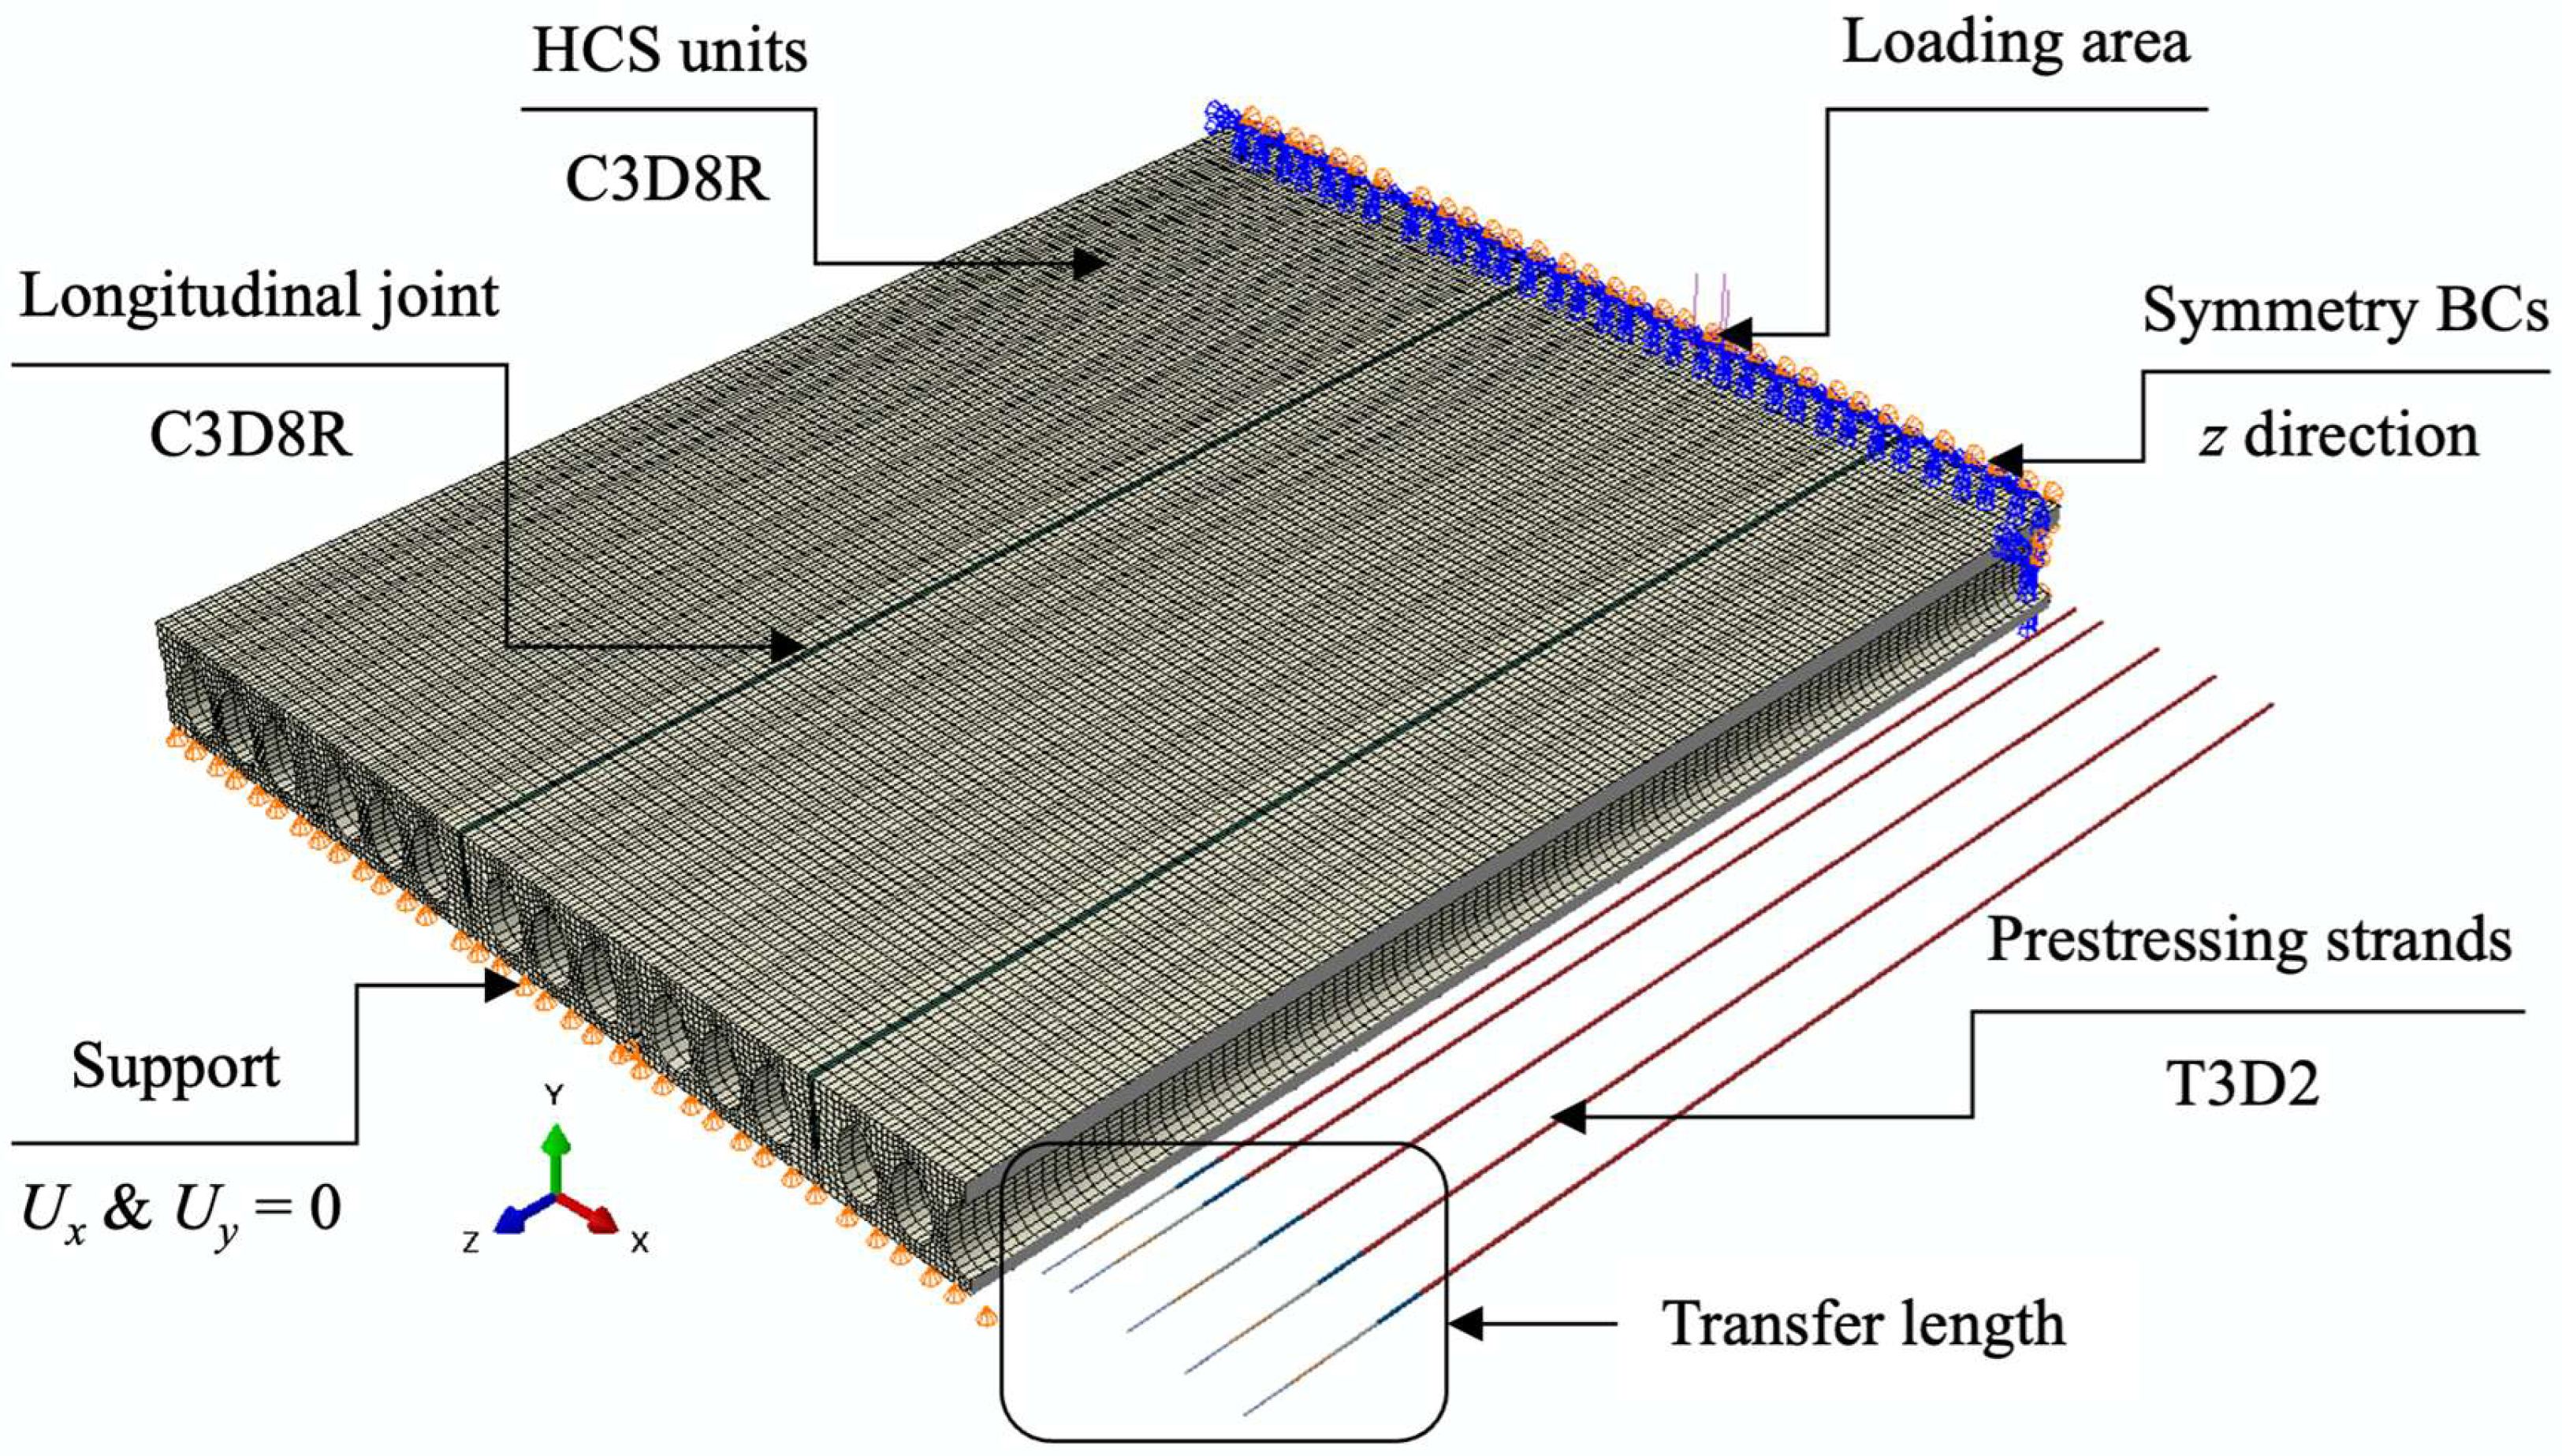
The concrete in the HCS units and longitudinal joints were modelled using 8-node solid brick elements with reduced integration (C3D8R). The 8-node solid brick elements can introduce shear locking during the bending of thin members, leading to a stiffer response. To mitigate this issue, reduced integration was applied, in which the number of integration points were reduced from eight to one. However, the use of a single integration point introduces kinematic modes, and this challenge was addressed using the hourglass control technique. Mesh sensitivity analysis was used to determine the dimensions of the elements, with
Figure 2 showing the mesh for the Spancrete section.
The prestressing strands were represented by two-node linear 3D truss elements (T3D2). Perfect bond between strands and concrete was assumed through embedding. The transfer length was assumed to be 50 times the strand diameter (
db), as suggested by the ACI Code [
33]. To accurately model the transfer length, the strands in the end regions were subdivided into five longitudinal segments, with the cross-sectional area gradually increasing from strand tip along the transfer length.
2.2. Boundary Conditions and Load Application
Due to floor symmetry with respect to the mid-span, only one-half of the HCS was modeled. Symmetry boundary conditions were applied along the longitudinal direction (
z-axis) on the mid-span surface. The end of the slabs was constrained against vertical and transversal displacement (
y and
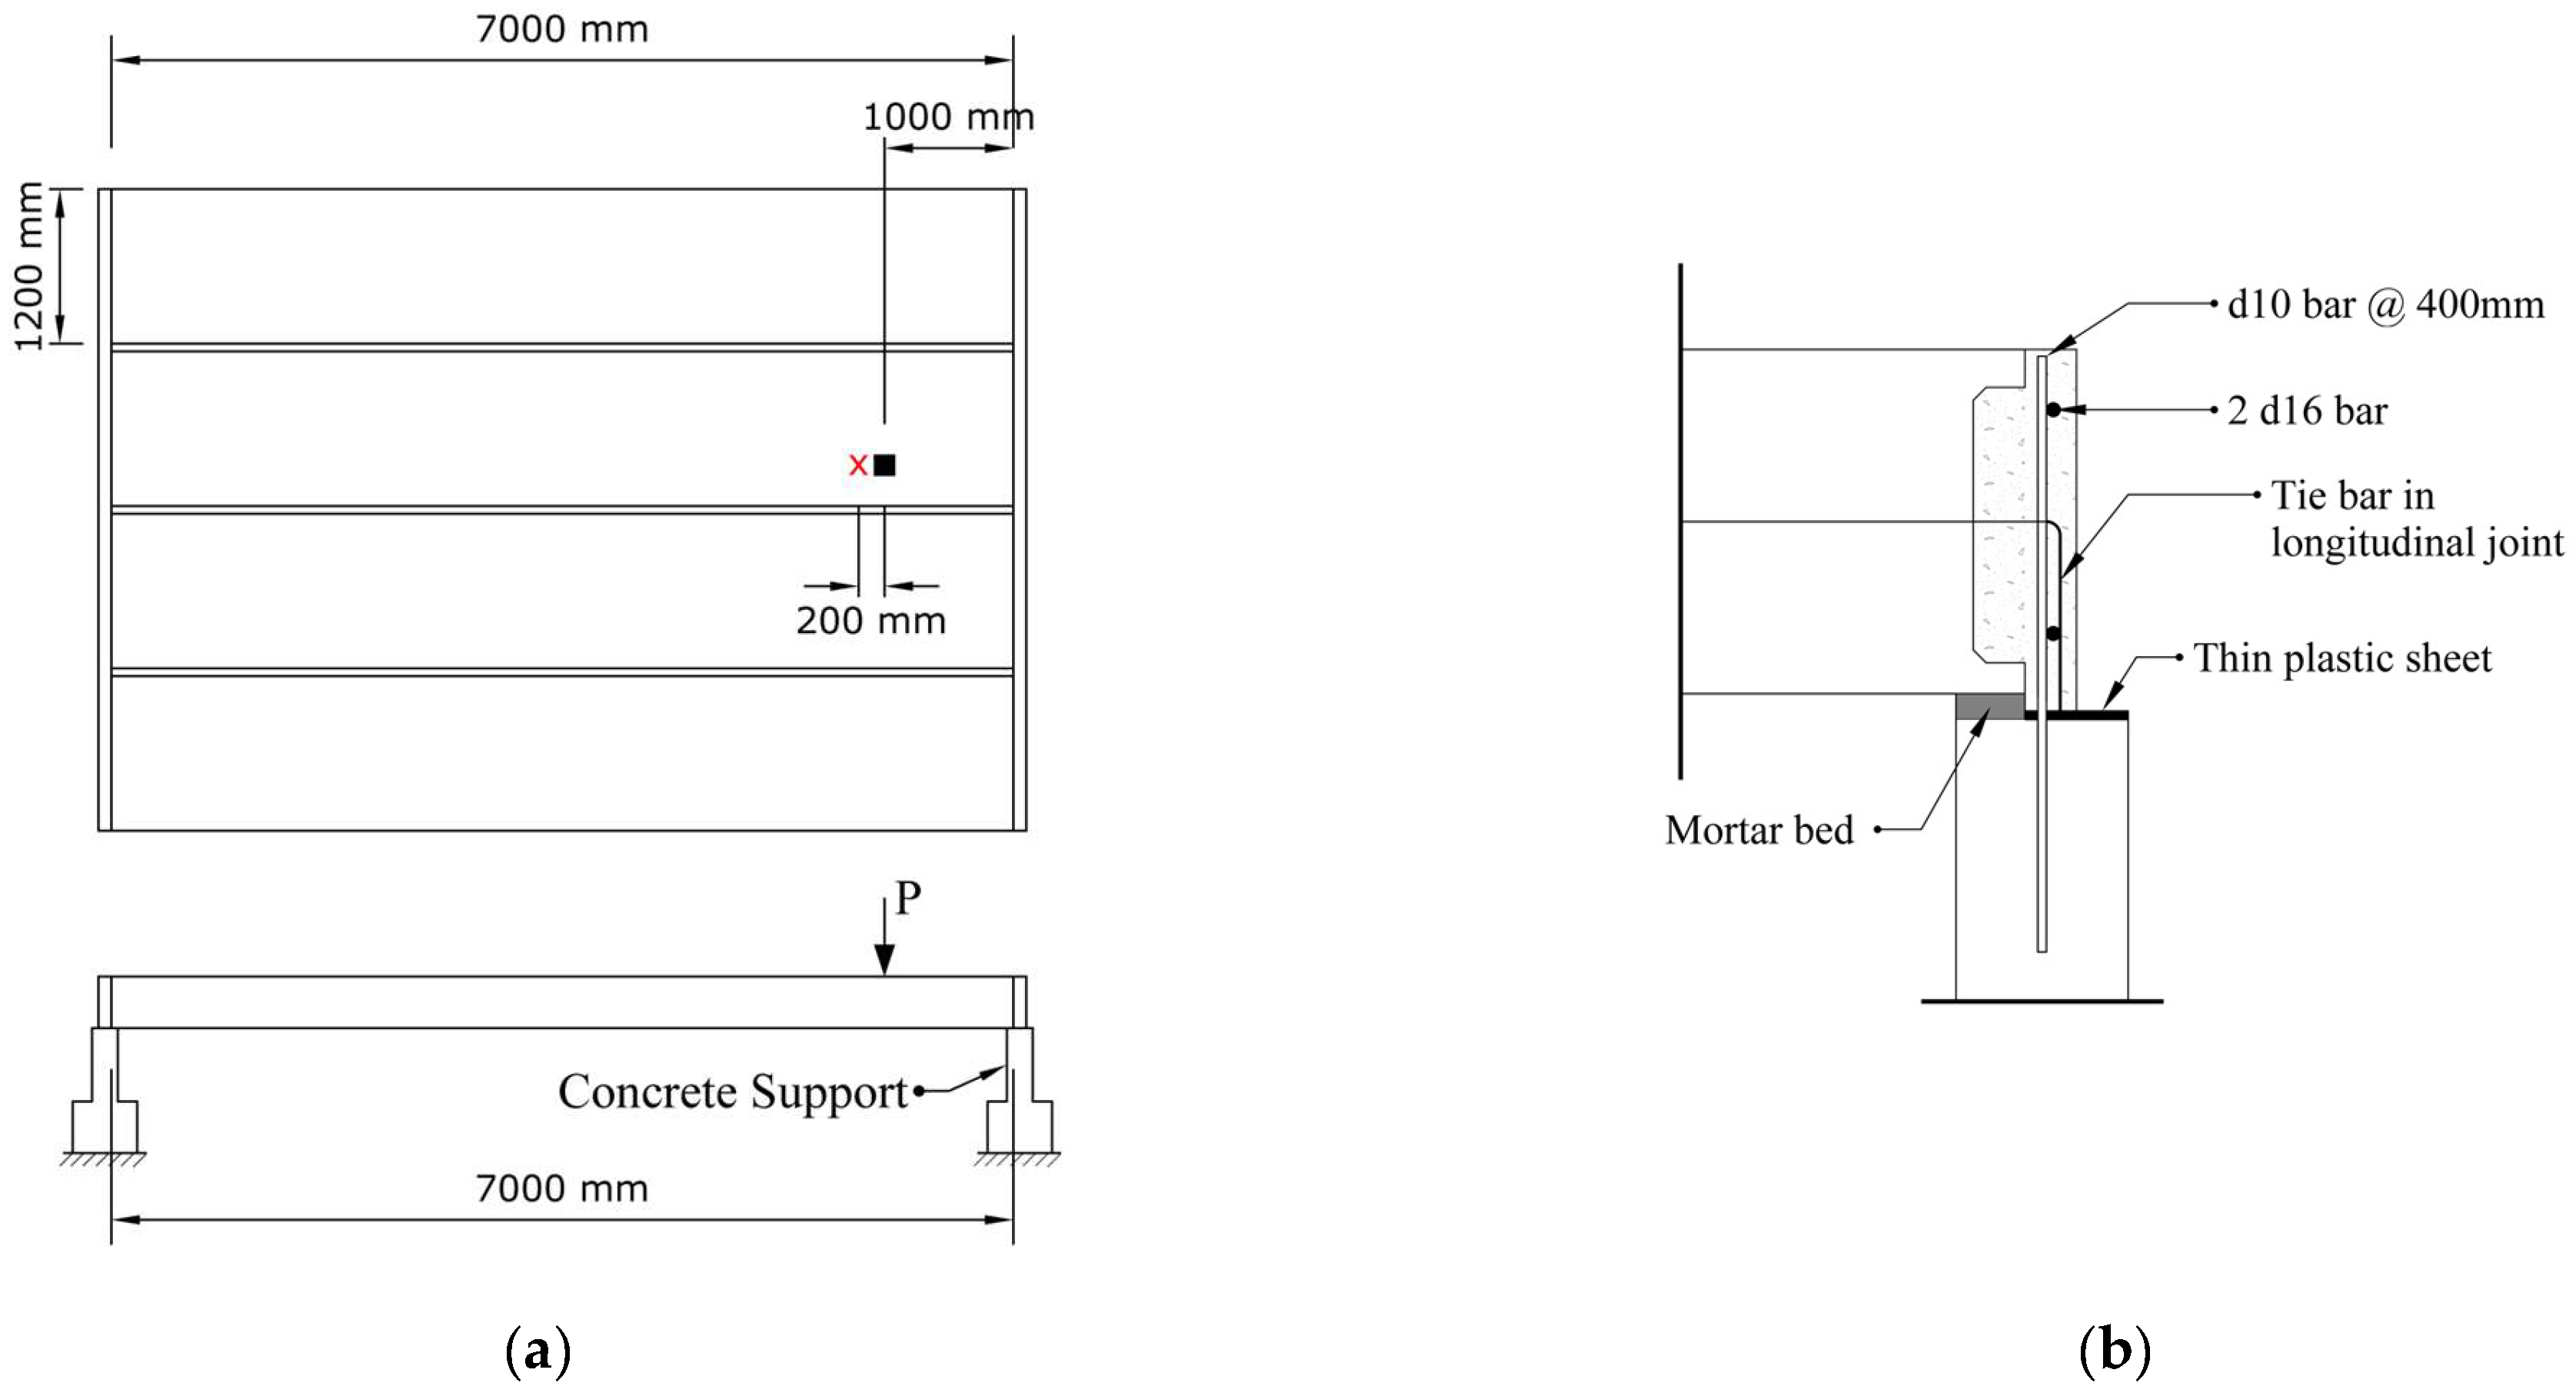
x-axes) along a line spanning the entire width at the support area. The details of elements type and boundary conditions are depicted in
Figure 3.
A multi-step dynamic explicit analysis was performed. The initial loading step was designed to simulate the transfer of prestressing forces from the strands to the surrounding concrete, effectively representing the process of strand release and the resulting camber along the slab length. The prestressing forces were introduced by defining a negative temperature to the 3D truss elements representing the strands through the “predefined field” option available in ABAQUS. The second step accounted for the self-weight of the floor system. In the final step, a concentrated load was applied to represent the assumed external loads or experimental loading protocol. In this study, a smooth step amplitude was used to apply load gradually, minimizing inertial effects and ensuring stable results to achieve quasi-static solutions. To further verify quasi-static behavior, the ratio of kinetic energy to internal energy was monitored throughout all simulations and remained consistently below 0.5%. This is well under the commonly accepted 5% threshold, confirming that inertial effects did not influence the results.
2.3. Material Properties
2.3.1. Concrete
The Concrete Damage Plasticity (CDP) model was employed to simulate the concrete behavior of both the slab and the cast-in-place shear keys. The CDP model in ABAQUS relies on the yield function models proposed by Lubliner et al. [
34], with the modifications suggested by Lee and Fenves [
35], incorporating concepts from both plasticity and damage mechanics. This model assumes a non-associated plastic flow based on the Drucker-Prager hyperbolic function.
To fully define the plastic behavior of concrete within this model, five parameters, are needed:
,
ε,
σb0/σc0,
Kc, and
μ. In addition, the uniaxial stress–strain relationship of the concrete must be specified. The dilation angle (
), which is a term defining inelastic volumetric change in granular materials, can be interpreted as an internal friction angle. A dilation angle between 30° and 40° is typically recommended for normal-strength reinforced concrete [
36]. However, various studies have applied a wider range of values depending on specific modeling needs [
37,
38,
39,
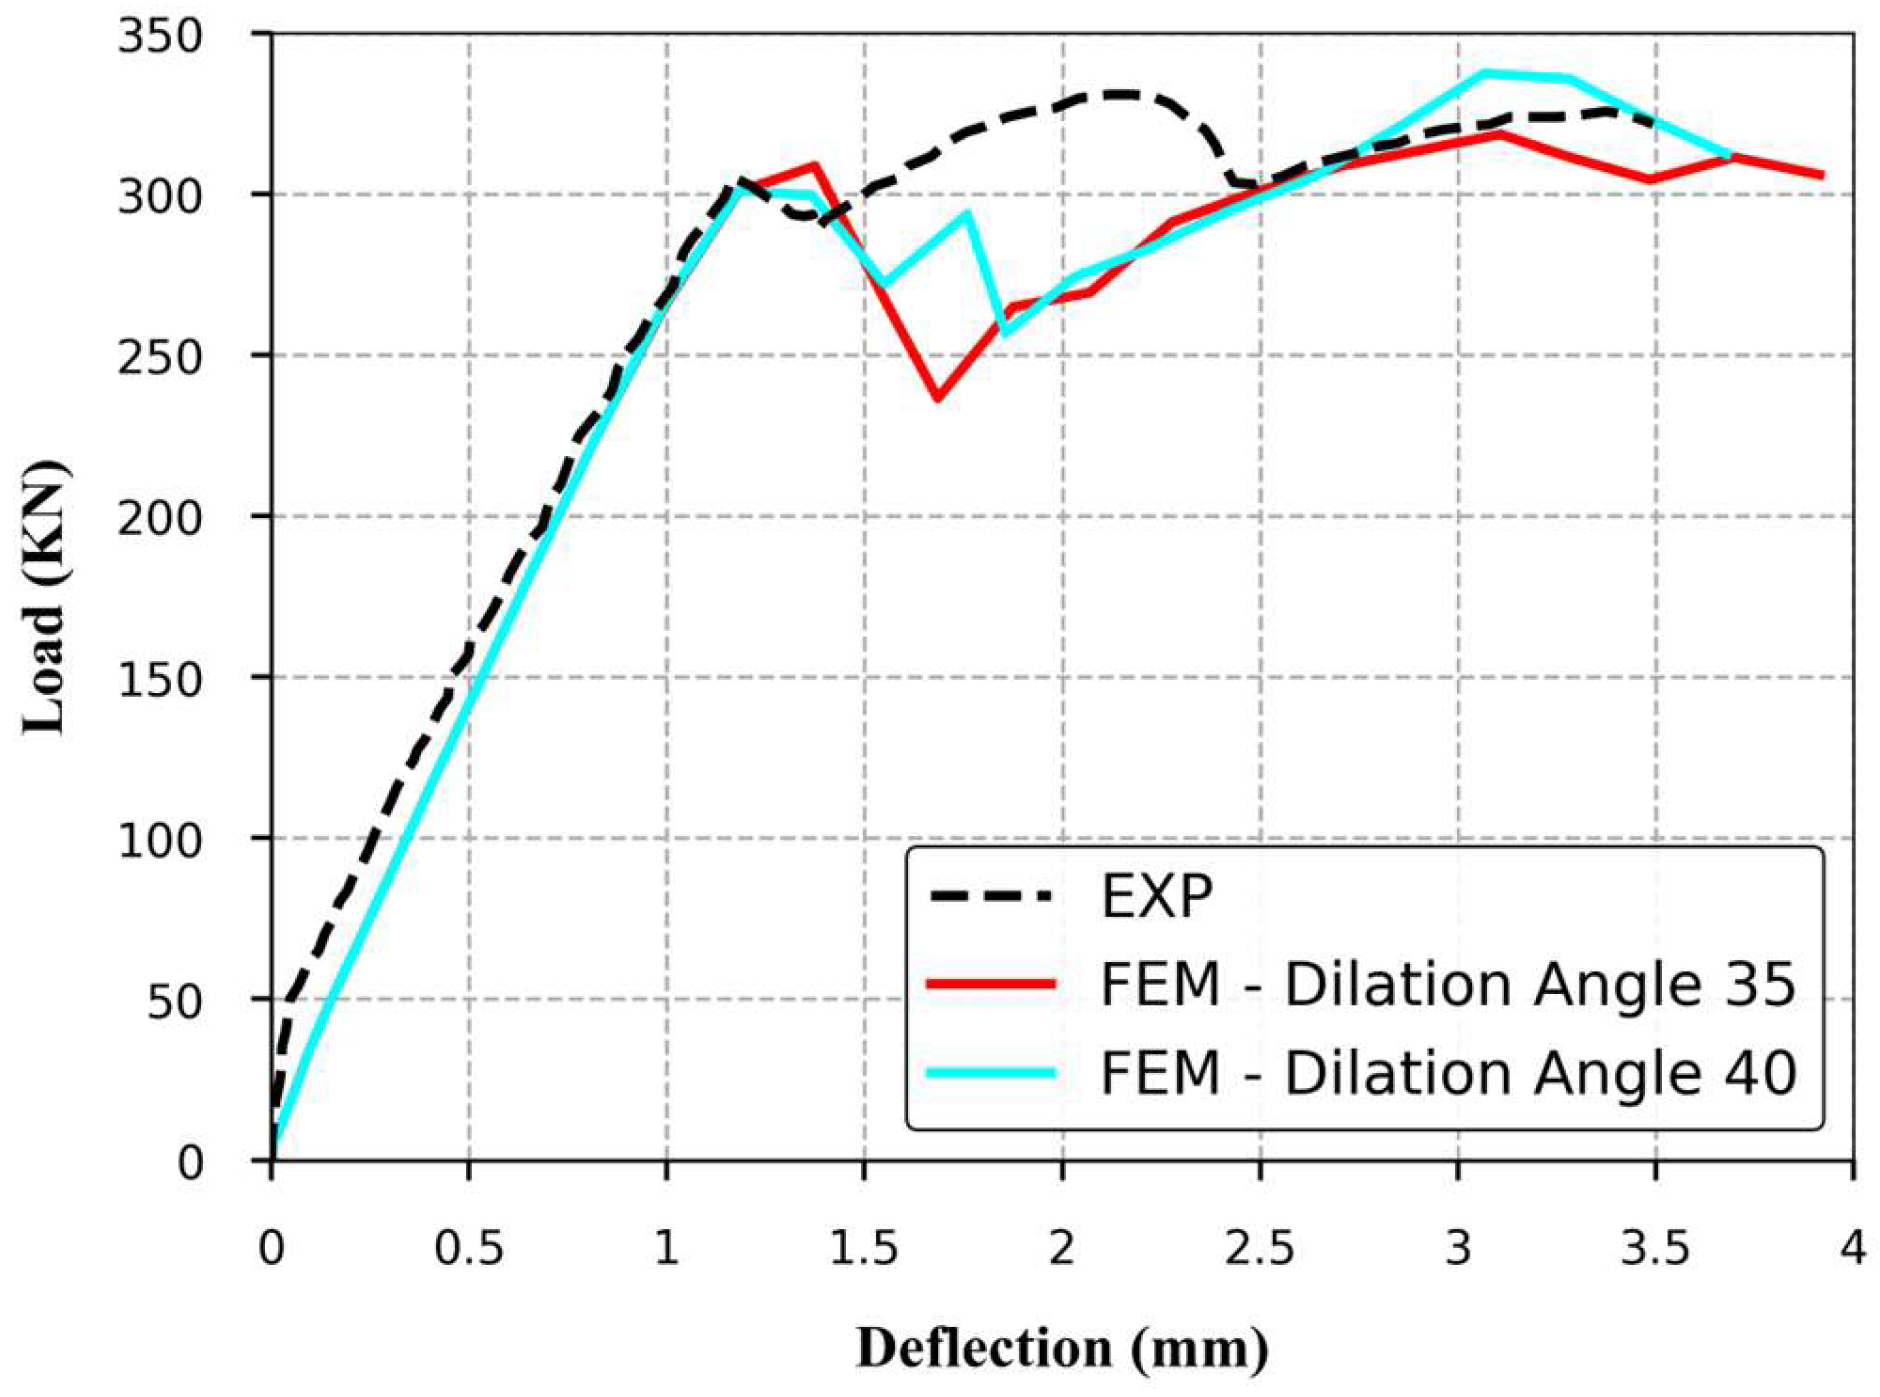
40]. In this study, a broader range from 25° to 40° was initially considered, and sensitivity analysis was performed. The maximum load varied slightly, with less than 6% difference across the range and about 1% between 35° and 40°. This confirms that the model response was not highly sensitive to the dilation angle. A value of 35° was selected, accounting for the self-confinement effect within the HCS floor system due to the placement of adjacent units.
The eccentricity parameter (
ε) affects the yield surface’s curvature within the deviatoric stress space. Following ABAQUS recommendations, a value of 0.1 was adopted for
ε in this study, suggesting that the material exhibits nearly constant dilation across a broad range of confining pressures. The ratio
σb0/σc0, which reflects the relationship between initial equibiaxial and uniaxial compressive yield stresses, was set to the default value of 1.16, as recommended by Lubliner et al. [
34]. The parameter
represents the ratio of the second stress invariant on the tensile meridian to that on the compressive meridian at initial yield, was set to the default value of 2/3. The viscosity parameter (
μ) was set to zero to avoid introducing artificial viscosity. These values have been widely adopted in previous studies of prestressed concrete, including HCS systems, and have been shown to have no significant influence on the overall behavior [
37,
38,
39,
40,
41,
42].
Table 1 summarizes the CDP model parameters used in this analysis.
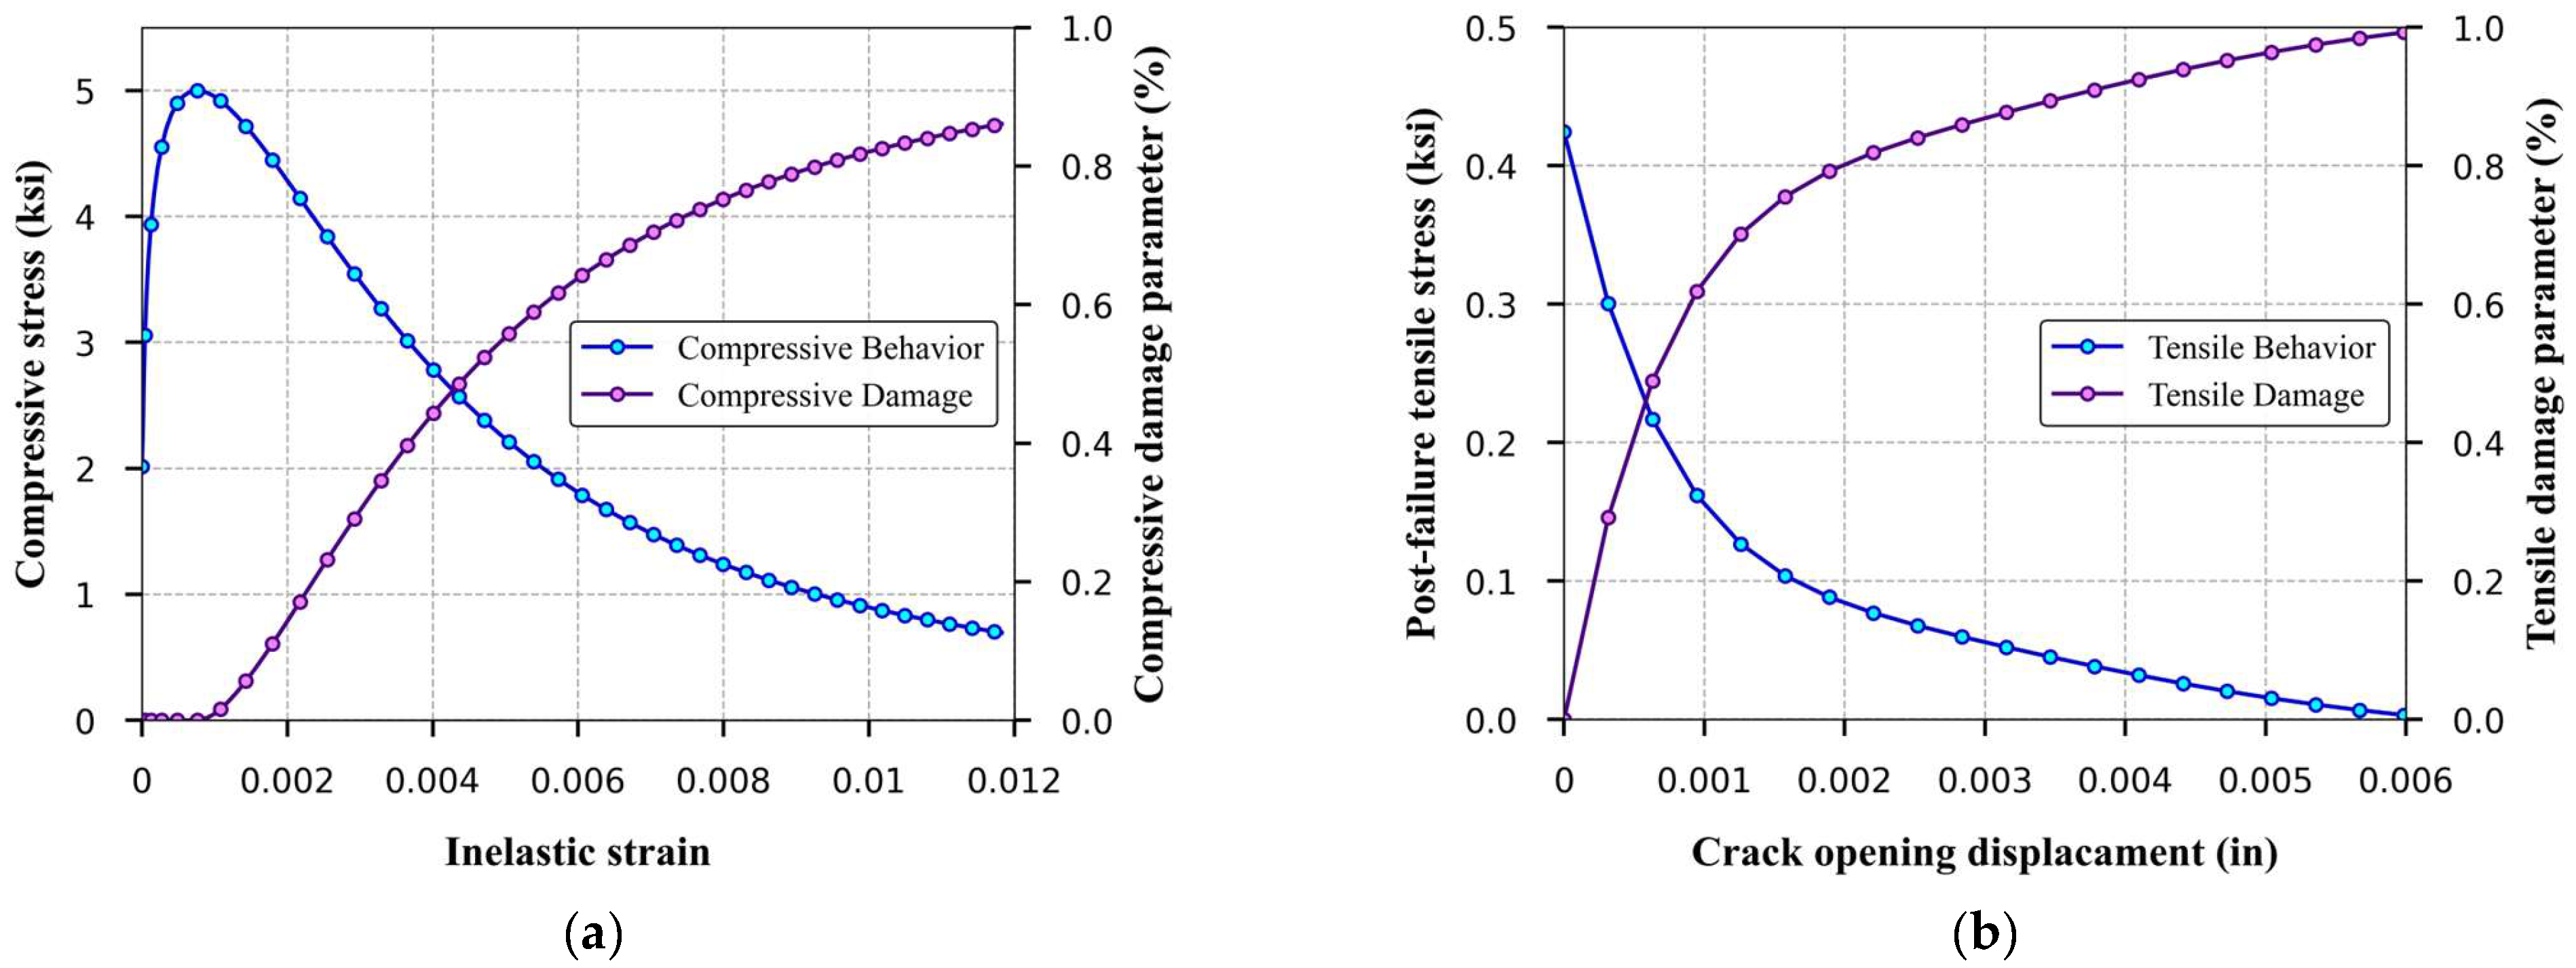
The CDP model represents the compressive behavior of concrete under uniaxial loading as initially linear until the material reaches its yield point. Beyond this point, the model captures stress hardening up to the ultimate stress, followed by strain softening as the material begins to fail. The uniaxial stress–strain behavior for concrete under compression was determined in accordance with the model proposed by Mander et al. [
43].
Figure 4a exhibits the uniaxial stress–inelastic strain curve in compression, along with the corresponding compressive damage evolution.
The response of the CDP model under uniaxial tensile loading is characterized by an initial linear–elastic stress–strain relationship until the peak stress is reached, at which micro–cracks begin to form within the concrete matrix and merge into larger, macro-cracks. As they continue to open, the model captures this transition through a softening stress–strain relationship. This softening behavior reflects the tensile cracking process of concrete and is typically represented by a “tension stiffening” mechanism, which can be defined using either a post-failure stress–strain relationship or a fracture energy cracking criterion. In this study, the tension softening model by Reinhardt et al. [
44], which describes the tensile stress vs. cracking displacement behavior, was used.
Figure 4b shows the uniaxial tensile stress-crack opening displacement curve used as input in ABAQUS, as well as the relationship between the damage variable and displacement in tension. The interaction between cracked concrete and reinforcement, known as “bond-slip”, was indirectly considered through the ‘tension stiffening’ effect for concrete under tension.
2.3.2. Prestressing Steel Strand
The model incorporated 7-wire low relaxation strands with an ultimate tensile strength of 1860 MPa (270 ksi). The density of steel used for prestressing strands was equal to 7850 kg/m
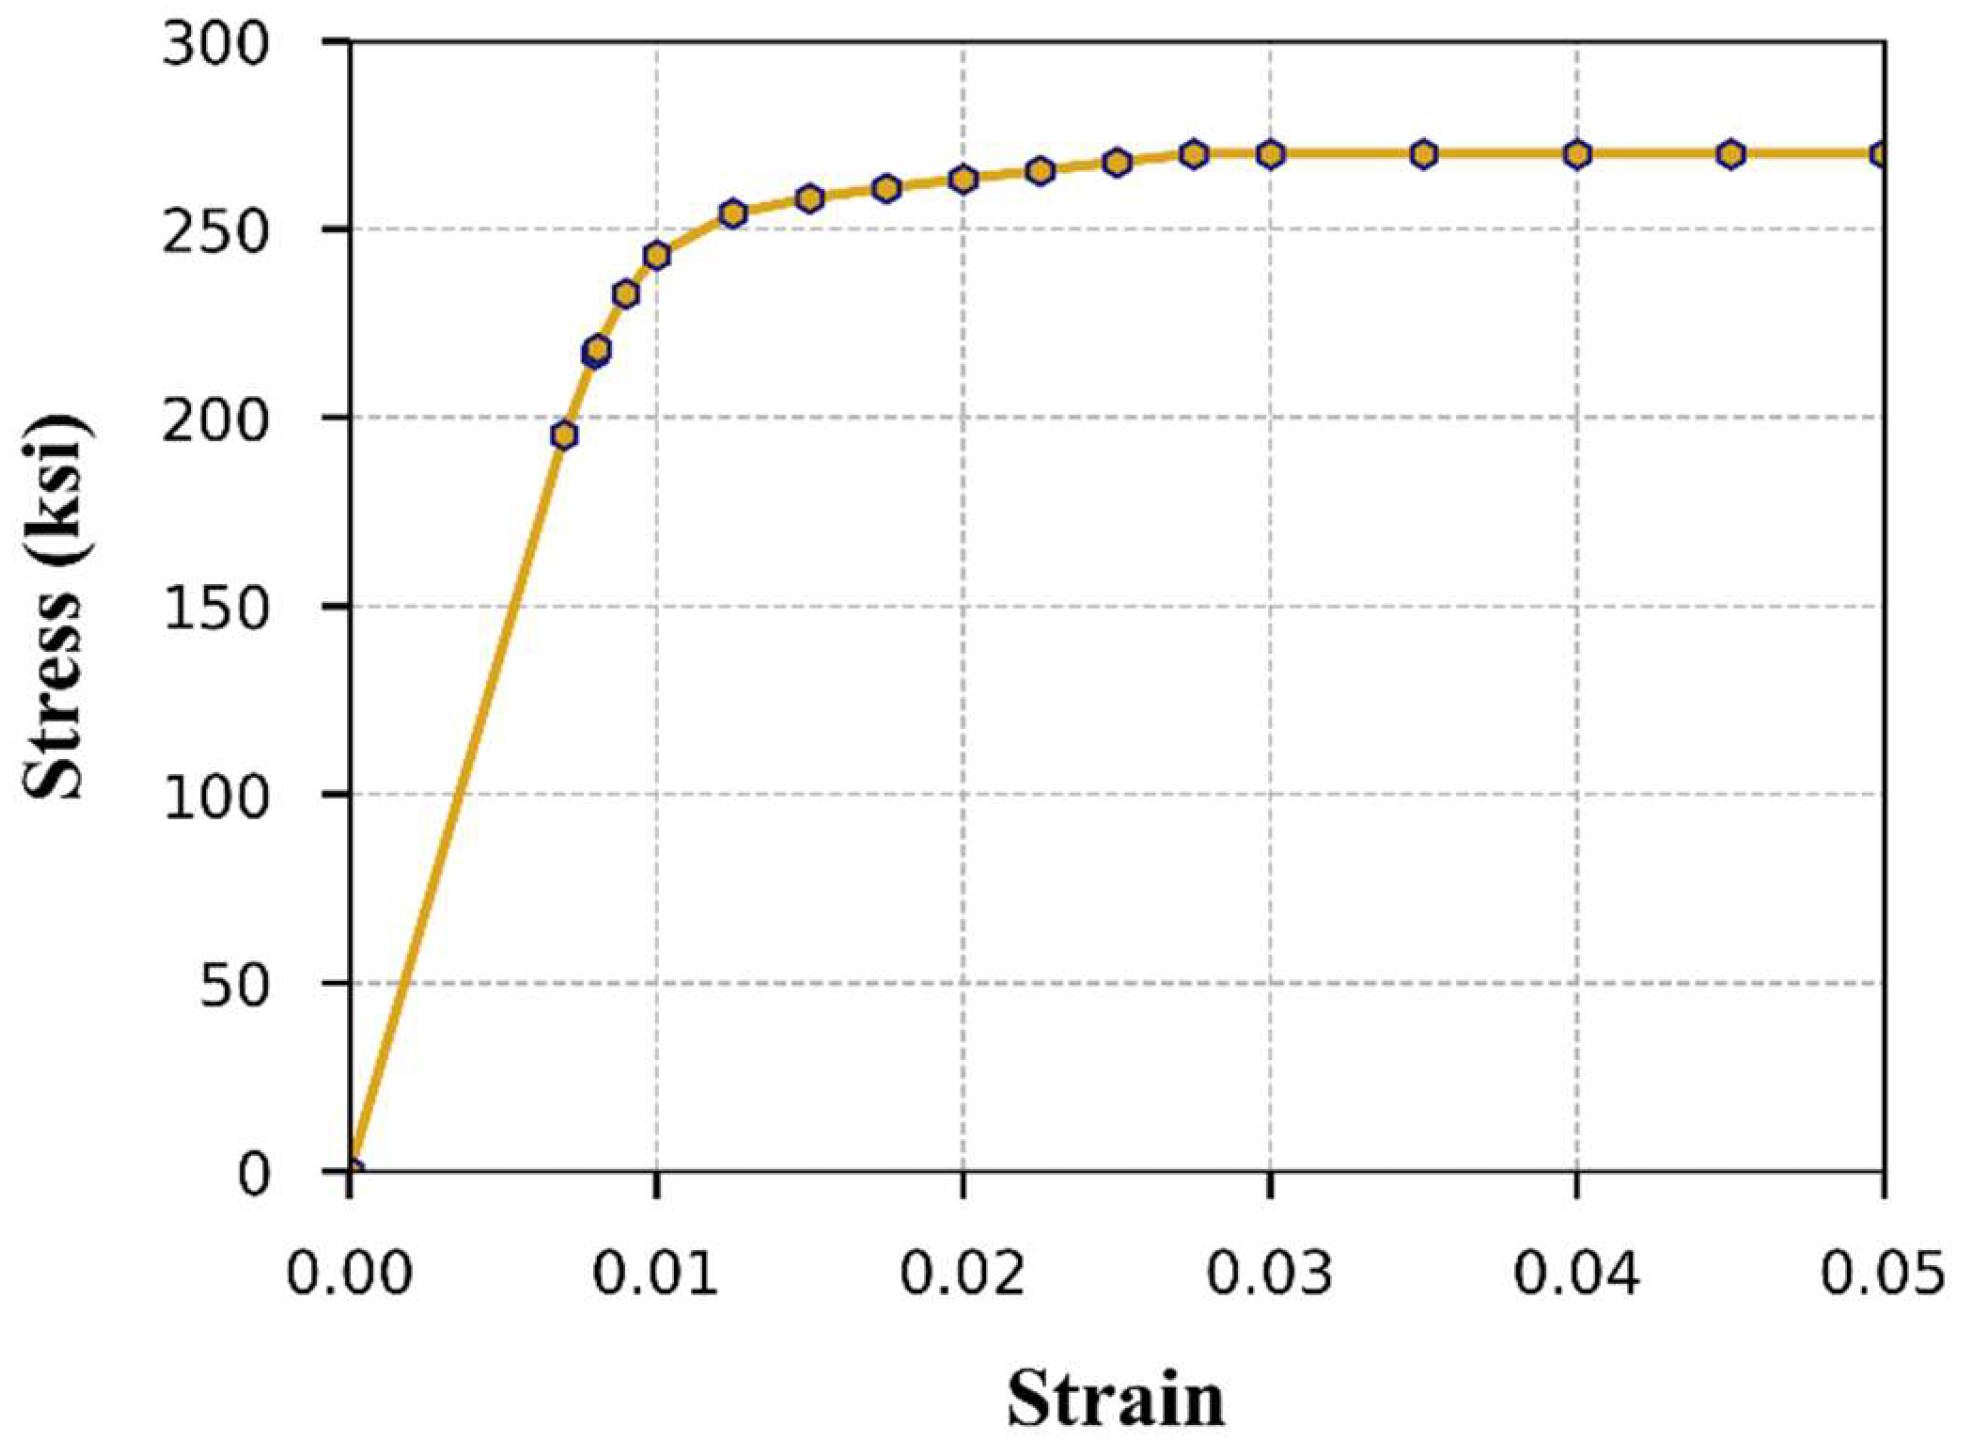
3 (490 pcf). The elastic modulus for the strands was set to 196.5 GPa (28,500 ksi), with a Poisson’s ratio of 0.3 applied in the modeling process. To capture the steel material behavior of the strands, a non-linear elastoplastic model was employed. This model follows the stress–strain relationship proposed by Devalapura and Tadros [
45], which refines the power formula originally developed by Skogman et al. [
46]. According to ASTM A-416 [
47], the minimum yield stress
fpy at 1 percent strain for this type of strand should be equal to 0.9 times the ultimate tensile strength
fpu. Figure 5 shows the obtained stress–strain response of the prestressing strands chosen for this study.
2.4. Interactions Between Contact Surfaces
The FE model of the precast prestressed HCS floor system was composed of three HCS units with cast-in-place concrete acting as shear keys between them. This configuration created four contact surfaces between the slabs and the longitudinal joints, which were subject to both normal and shear stresses, leading to a mixed-mode response. To accurately capture this behavior, a surface-based contact cohesive behavior was implemented at the interface between the precast and in situ concrete, allowing for mixed-mode debonding through the application of a traction-separation law.
The failure mechanism consists of two components: a damage initiation criterion and a damage evolution law. Prior to damage, cohesive behavior follows a linear traction-separation law. As the bond stiffness progressively degrades, bond failure arises. Damage initiation marks the onset of degradation in the cohesive response at the contact interface. Following damage initiation, the cohesive stiffness undergoes gradual degradation, described by the damage evolution process. This process can be specified using either the total fracture energy or the post-damage initiation effective separation at failure. The scalar damage variable D represents the overall damage at the contact point, evolving from 0 to 1 as loading progresses. This evolution was modeled using a linear softening law based on effective separation. Bond failure in ABAQUS can be tracked using two output variables: the maximum contact stress damage initiation criterion (CSMAXSCRT) and the damage variable for cohesive surfaces (CSDMG). Damage initiation is considered to occur when the first variable reaches a value of 1, and full debonding is assumed to take place when the second variable also reaches unity.
Barbieri et al. [
48] mentioned that all three stiffness components typically range from 5.0 MPa/mm (18.4 ksi/in.) to 15.0 MPa/mm (55.3 ksi/in.), with the ratio of displacement at complete damage (
D = 1) to displacement at damage initiation (
D = 0)
ranging from 1.5 (indicating brittle fracture) to 3.0 (indicating extended rupture) for all three directions. Hu et al. [
49] simulated hinge joints to transfer shear stress between HCSs, finding a tangential shear stress stiffness of 10 MPa/mm (36.8 ksi/in.) for undamaged joints through a trial-and-error process to match the predictions of the hinge-joint plate method and minimize the difference in the lateral load distribution coefficients. Based on the information, contact interaction stiffness values in all three directions were assumed to be 10 MPa/mm (36.8 ksi/in).
Based on laboratory tests, Ye et al. [
50] proposed a formula for calculating the shear strength of concrete hinge joints with a smooth interface in HCSs, with a 95% assurance rate:
. Additionally, the normal strength of the interface can be expressed as
, where the cohesion coefficient
c is assumed to be 0.7. Here,
and
represent the minimum compressive and tensile strengths of the concrete between the HCSs and joints, respectively. However, according to EN 1992-1-1 [
51],
c ranges from 0.025 to 0.1 for very smooth interfaces and up to 0.2 for smooth surfaces typical of precast concrete elements, although 0.5 can be obtained on machine finished HCSs [
52]. A sensitivity analysis was conducted using varying the cohesion coefficient and comparing the results against experimental data. The results demonstrated that different values of
c had a negligible impact on the load–deflection behavior, with minimal variation observed in the maximum deflection, so a value of 0.7 was used recognizing Ye’s laboratory test results.
Finally, the PCI HCS manual [
26] recommends a shear capacity of 0.55 MPa (80 psi) for grouted keyways between HCS units to transfer longitudinal shear from one slab to the next. Consequently, maximum normal and shear stresses were assumed to be 2.05 MPa (296.8 psi) and 0.55 MPa (80 psi), respectively, with a
value of 2 for all three components in the traction-separation law.
4. Evaluation of Spancrete HCS Floor System Behavior
After validating the FE modeling technique against two experimental studies, the behavior of Spancrete HCS floors was evaluated for a system consisting of three interconnected units with longitudinal joints, each with characteristics described in
Section 4.1. The performance of the system was assessed in terms of load–deflection response, extent of cracking damage, failure modes, strain and stress distribution in concrete and prestressing strands, and the integrity of longitudinal joints. Furthermore, the influence of both loading area and load location on the response of the HCS floor was also investigated.
4.1. Details of the Spancrete Floor System
The Spancrete HCS section has a depth of 305 mm (12 in.), a width of 1219 mm (48 in.), and a span length of 7.3 m (24 ft). It includes eight prestressing strands with an effective depth of 273 mm (10.75 in.) and an eccentricity of 128 mm (5 in.). The strands, with a diameter of 12.7 mm (0.5 in.), were stressed to 70% of their ultimate strength, with a 15% prestressing loss assumed. Pajari [
11,
24] considered prestress losses of 5%, 10%, and 15%, in resistance calculations and noted that exact value is of little importance. After performing mesh sensitivity analysis, the element size for the concrete elements was set to 19 mm (0.75 in.) across the width and 38 mm (1.5 in.) along the length. Furthermore, a mesh size of 127 mm (5 in.) was selected for prestressing strands elements. Assumed external loading was a concentrated force applied to a 152 mm (6in.) square area at the center of the slabs to simulate a column load in a building system. Concrete properties used for both the HCS, and longitudinal joints are detailed in
Table 6 with the latter having higher strength than the former. These properties are typical of Spancrete HCS construction in the USA. The modulus of elasticity of the concrete and tensile strength were calculated according to ACI 318 [
33].
4.2. Load-Deflection Behavior
The load versus midspan deflection curve is presented in
Figure 12. As the load increased, the slab initially exhibited a linear response, reflecting the elastic behavior of the system. The curve starts to deviate from linearity as microcracks formed (A), leading to a gradual increase in the deflection with the continued load. At roughly 169.94 kN (38.20 kips), longitudinal cracks began to form at the midspan on the bottom surface, reducing the stiffness of the slab. With continued loading, these cracks propagated toward the support regions. Upon reaching a load of approximately 374.43 kN (84.18 kips), transverse flexural cracks initiated at the bottom of the middle slab (B). Beyond this peak, the curve plateaued (C), indicating the onset of damage propagation, with additional cracks developing and extending into the side slabs. Subsequently, a longitudinal crack formed (D) and rapidly advanced along the top surface (compression zone) of the slab, resulted in the penetration of the loaded column through the slab depth within the defined loading patch. During column penetration, crushing of the concrete due to the large stresses and strains in all three directions (longitudinal, transverse, and vertical) occurred in the loading area, leading to numerical instability and non-convergence of the analysis.
4.3. Failure Modes and Damage Progression
In HCS floor systems subjected to heavy concentrated loads, several failure modes, such as flexural failure, web shear failure, longitudinal joint failure, and punching shear failure, can occur. However, due to the large cavities, HCSs may be more susceptible to punching shear failure under concentrated loads. The lack of reinforcement in the transverse direction increases the risk of this brittle failure mode. This is a localized failure that occurs when shear stresses from loading exceed the slab shear stress capacity around the perimeter of a concentrated load. In this mode for solid flat slabs, a cone-shaped or truncated pyramid-like failure surface forms around the loaded area, as the slab “punches” through. For HCS, this mechanism develops in a different manner and is referred to here as modified punching shear, which is investigated in the following using the analysis results from ABAQUS.
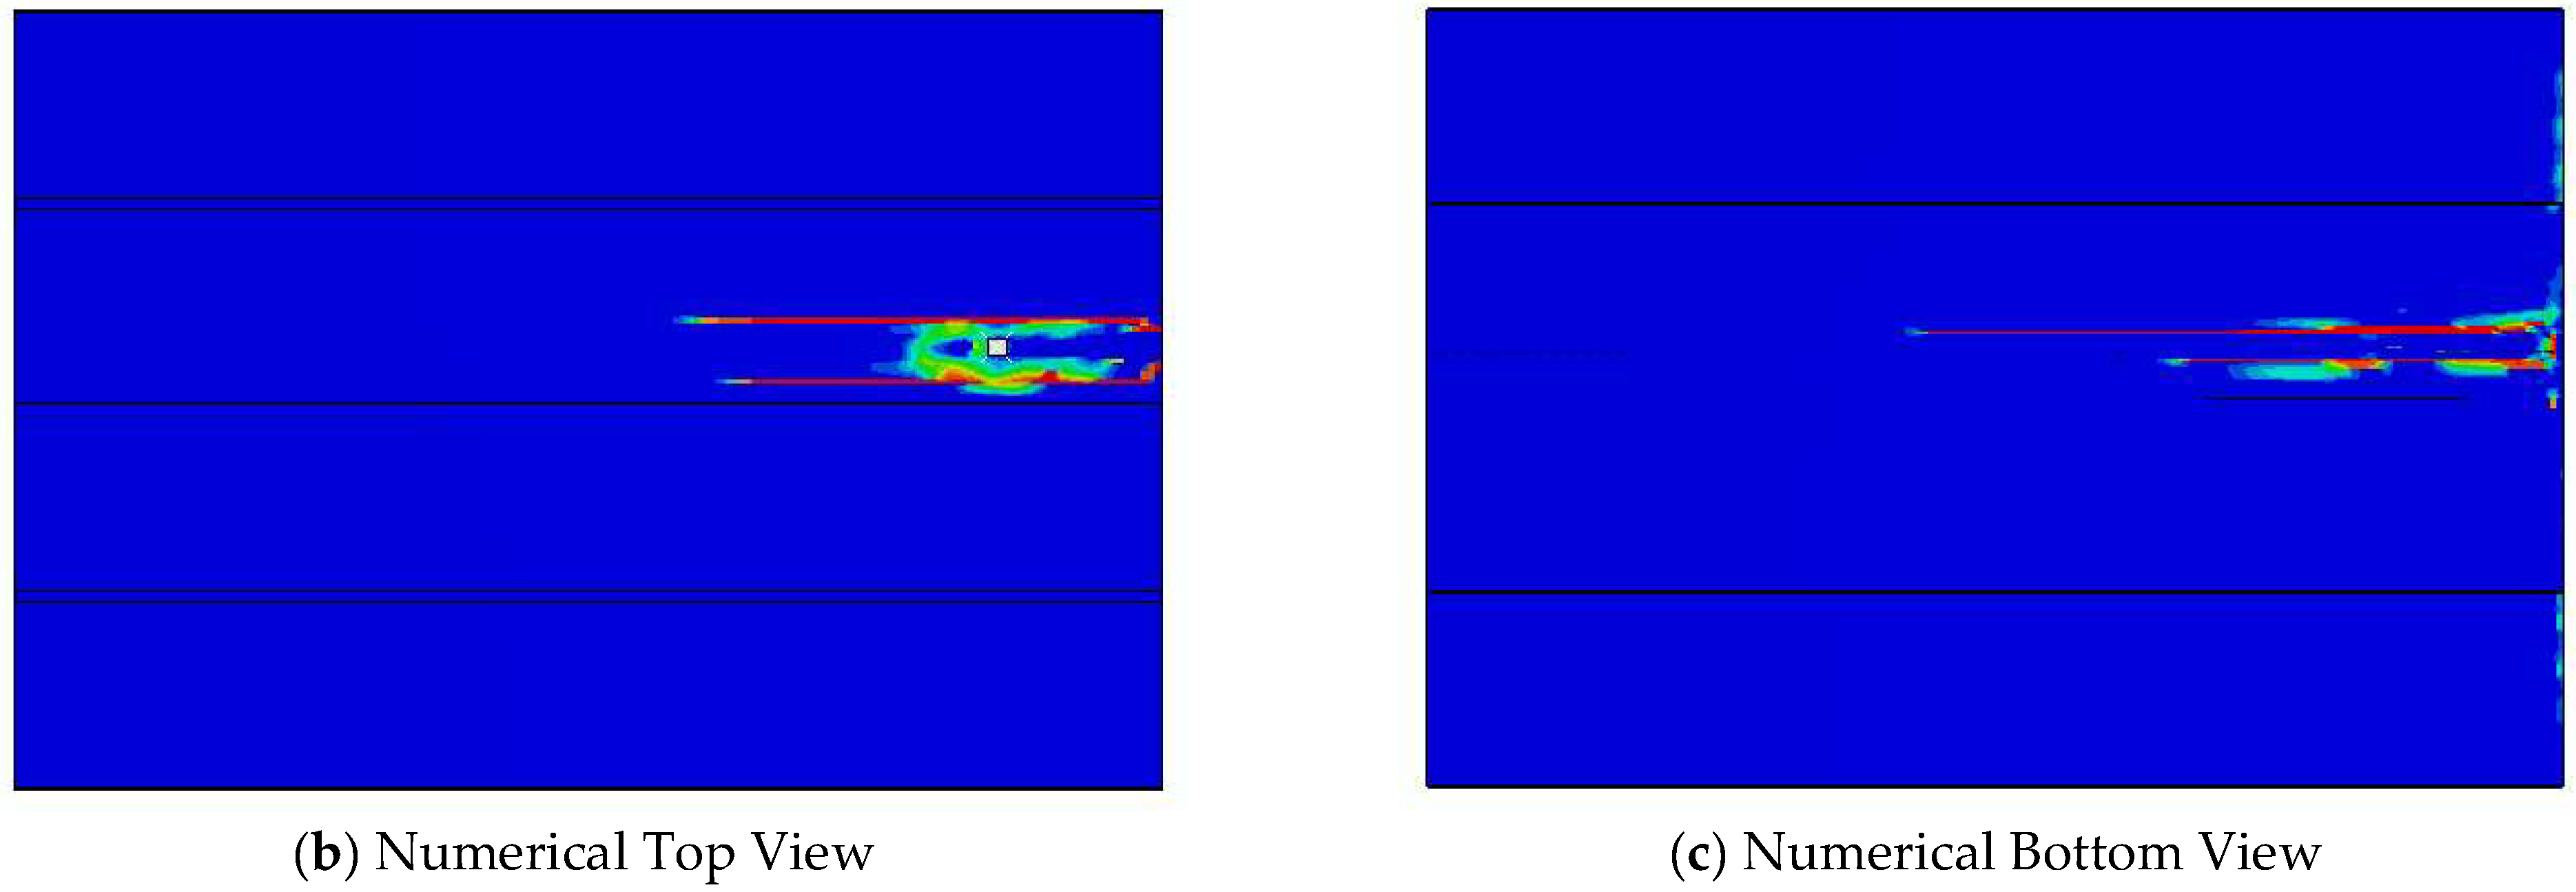
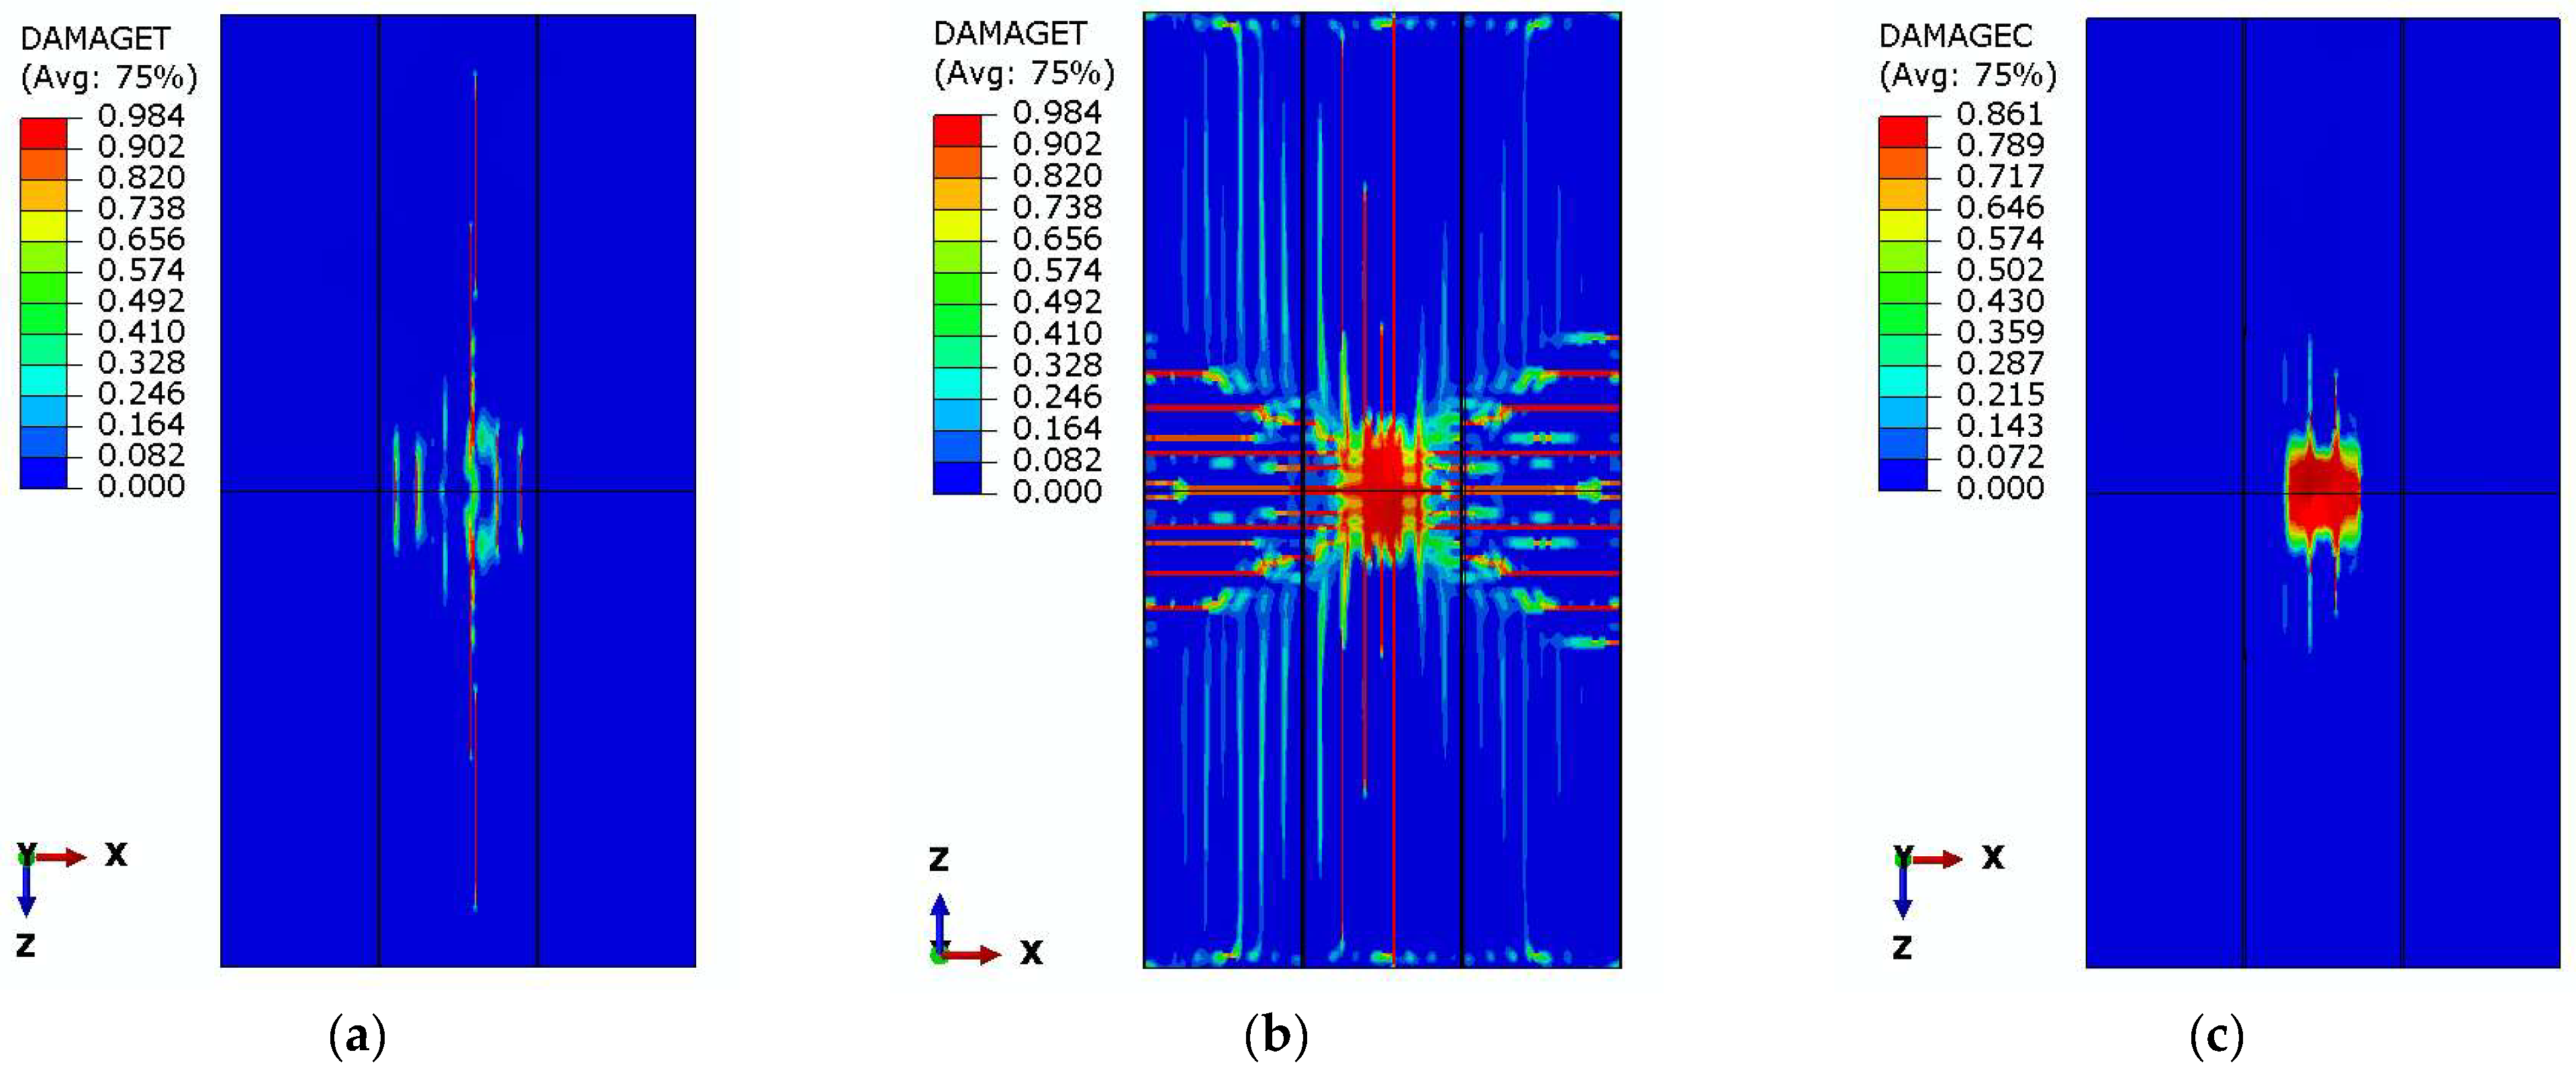
The crack propagation of the system on the top surface is depicted in
Figure 13a, which aligns with the findings of other studies regarding the formation of wide longitudinal cracks under the load on the top surface of the slab.
Figure 13b shows extreme damage on the bottom surface around loading area. In the CDP model, these variables evolve between 0 (undamaged) and the maximum value defined by the stress–strain laws in
Section 2.3.1 (
Figure 4), with higher values indicating more severe cracking or crushing. Based on
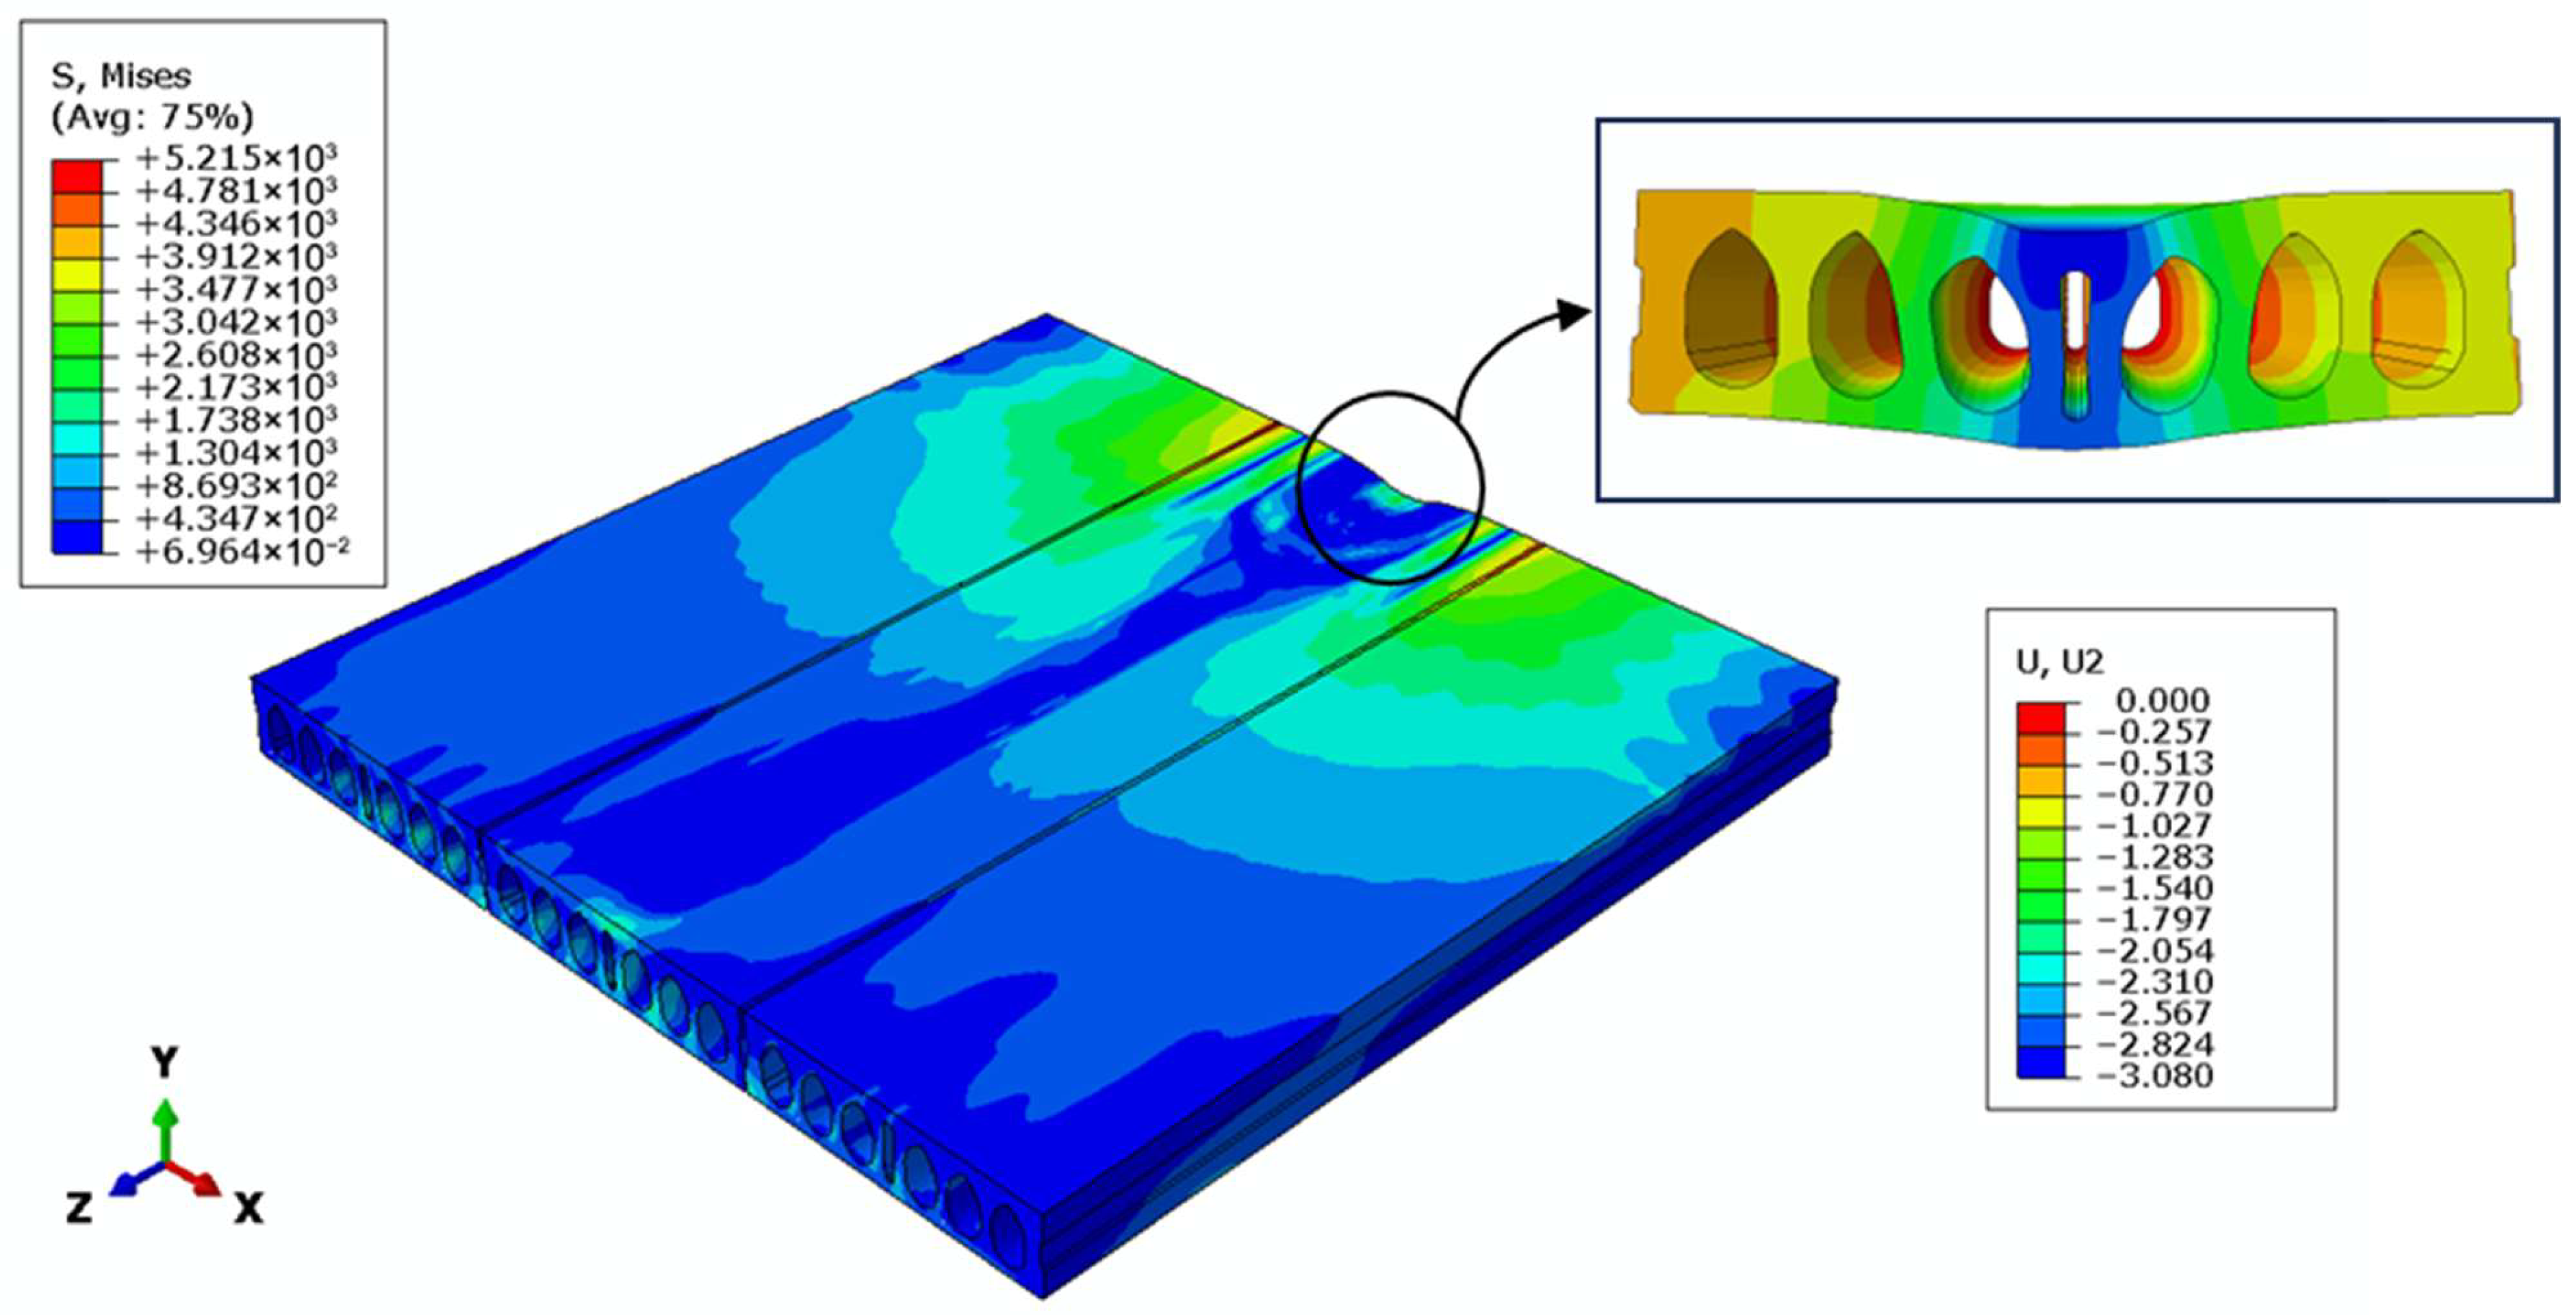
Figure 13c the failure mode was characterized by concrete crushing near the loading point, causing the simulation in ABAQUS to fail by column penetration through the slab. The failure mechanism observed here consisted of two sequential events: the formation of shear cracks, followed by crushing resulting from large compression stresses and strains concentrated in the loaded region. This process was initiated by the slab’s susceptibility to shear cracking due to its hollow-core configuration and lack of transverse reinforcement and ultimately resulted in localized concrete crushing caused by the highly concentrated load, that led to the larger displacements observed in the analysis. In
Figure 14, the deflected shape of the model at the end of the analysis is shown, which is consistent with modified punching shear failure, where the failure surface of the slab “punches” along inclined longitudinal shear planes, and the longitudinal crushing completes the mechanism along the transverse faces through around the loading device.
4.4. Deflection Response
The overall deflection curves of the HCS model at different load levels along a transverse line at the load point are plotted in
Figure 15. The horizontal axis represents the distance across the width of the slabs from the center. At the cracking load (169.94 kN (38.20 kips)), deflection across the slab is minimal and uniform, reflecting elastic behavior. As the load increases, the deflection becomes more pronounced, suggesting the onset of cracking and reduced stiffness. At failure, the central deflection sharply increases, reaching 35 mm (1.4 in.). The shape of the curve shows that most of the deflection is concentrated in the center, which suggests significant localized deformation, indicating a potential progression toward failure, likely due to modified punching shear and significant cracking in the middle region.
4.5. Shear Stress
Figure 16 shows the vertical shear stress distribution at the peak load in the HCS. The shear stress pattern started from the periphery of the loaded area and extended downward through the slab, primarily confined to the top flange, with an approximate propagation angle of 45° which is consistent with dispersion angle recommended by EN1168 [
27] and differ from those of Jeziorski and Derkowski [
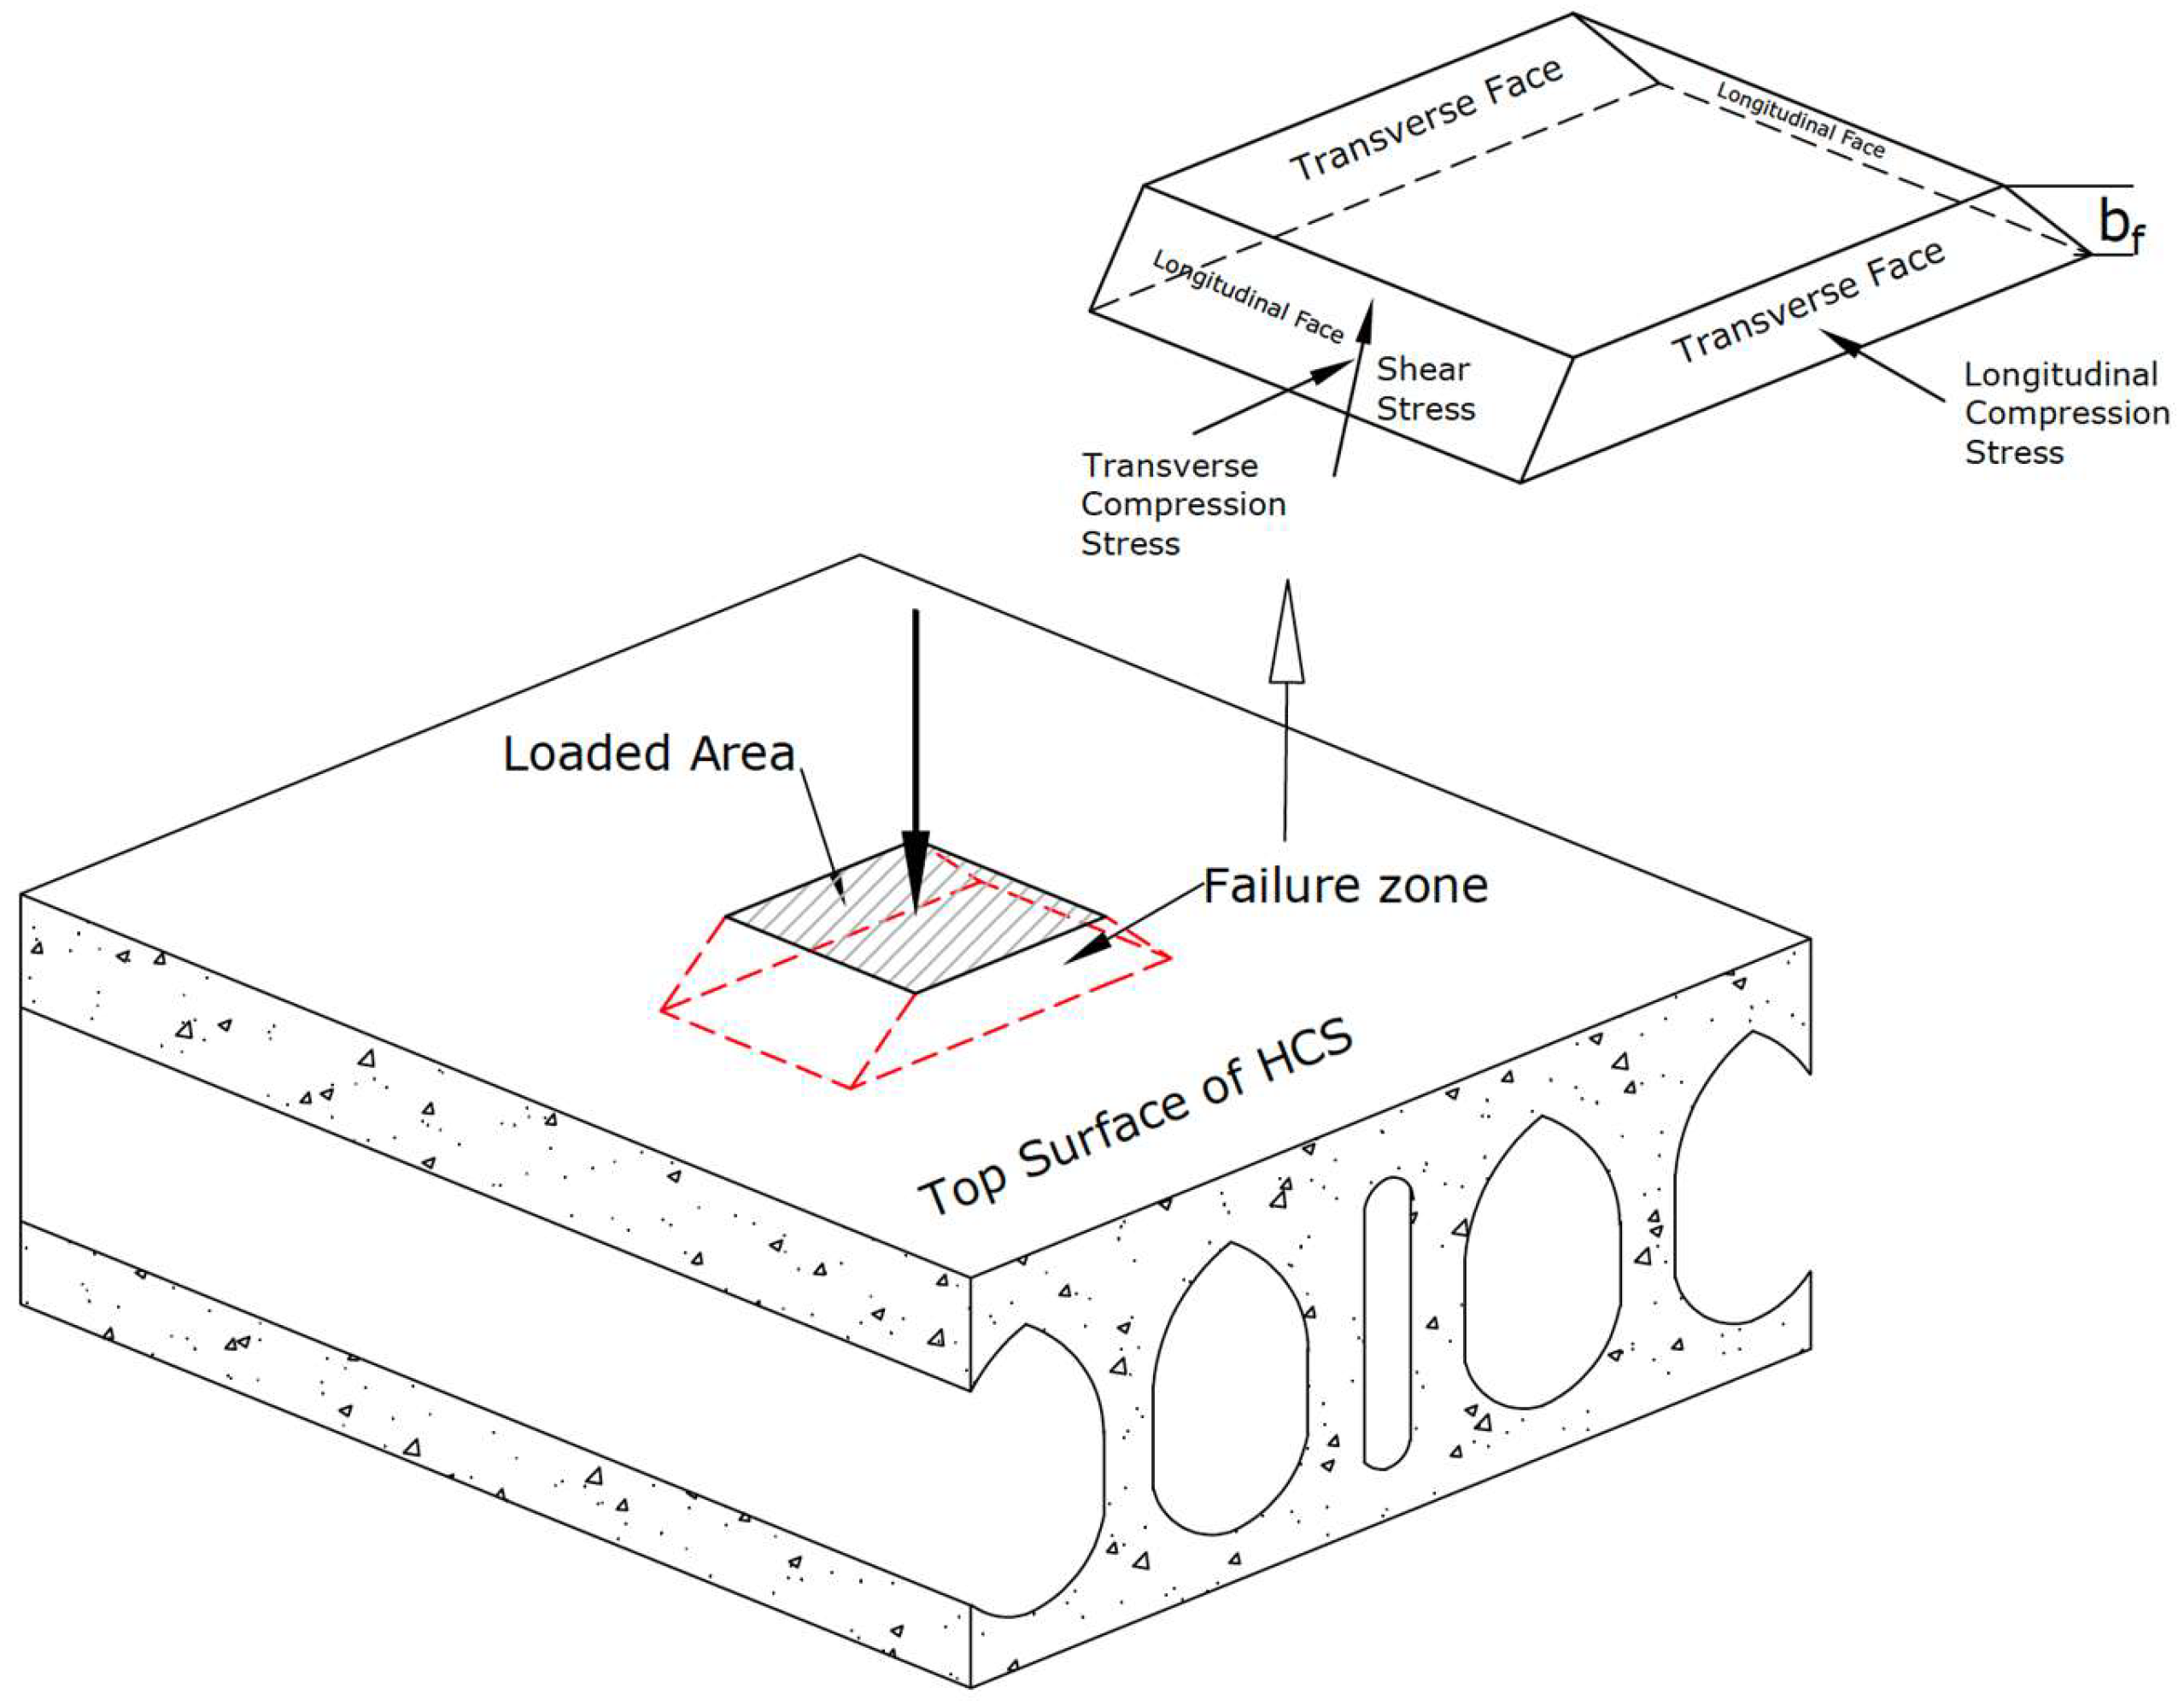
28]. However, unlike the symmetric stress distribution typically observed in punching shear failure of solid slabs, the stress in the HCS is concentrated along two faces, on either side of the loaded area of the top flange, in the longitudinal direction. The observed pattern differs from punching shear in solid reinforced concrete flat slabs in which the shear cracks generally initiate around all faces of the loaded area and radiate outwards diagonally through the entire depth of the slab, forming a truncated cone or pyramid-shaped failure surface around the loaded area as we see in
Figure 17.
The modified punching shear behavior of the HCS, as observed in this study, deviates significantly due to its unique structural configuration. The high shear stress was confined primarily to the top flange and concentrated in a single direction, extending transversely only as far as the nearest row of cores in the longitudinal direction, the failure surface extends until failure from a different mode is generated, as observed by Pajari [
24] and McGinnis et al. [
14]. It is noted here that as a consequence of the inclined cracks, there is a rapid increase in longitudinal compressive stress in the top flange. After shear cracking, these stresses are concentrated over a small portion of the width of the section, namely between the longitudinal crack faces produced by the vertical shear stresses because the full magnitude of the vertical load is applied within this segment. The longitudinal compressive stress continues to increase until the concrete crushes and the column punches through the top flange.
The presence of voids in the slab not only reduces the effective cross-sectional area available to resist shear forces but also alters the stress distribution, and the shape of the punched surface has a longer longitudinal dimension than the transverse one, leading to a modified form of punching shear failure. Consequently, the failure perimeter and critical section in the HCS exhibits a distinctly different shape compared to those in solid slabs. Thus, this indicates that revised procedures need to be developed to evaluate the shear resistance of HCSs under concentrated loads.
4.6. Concrete Strain and Stress Distribution
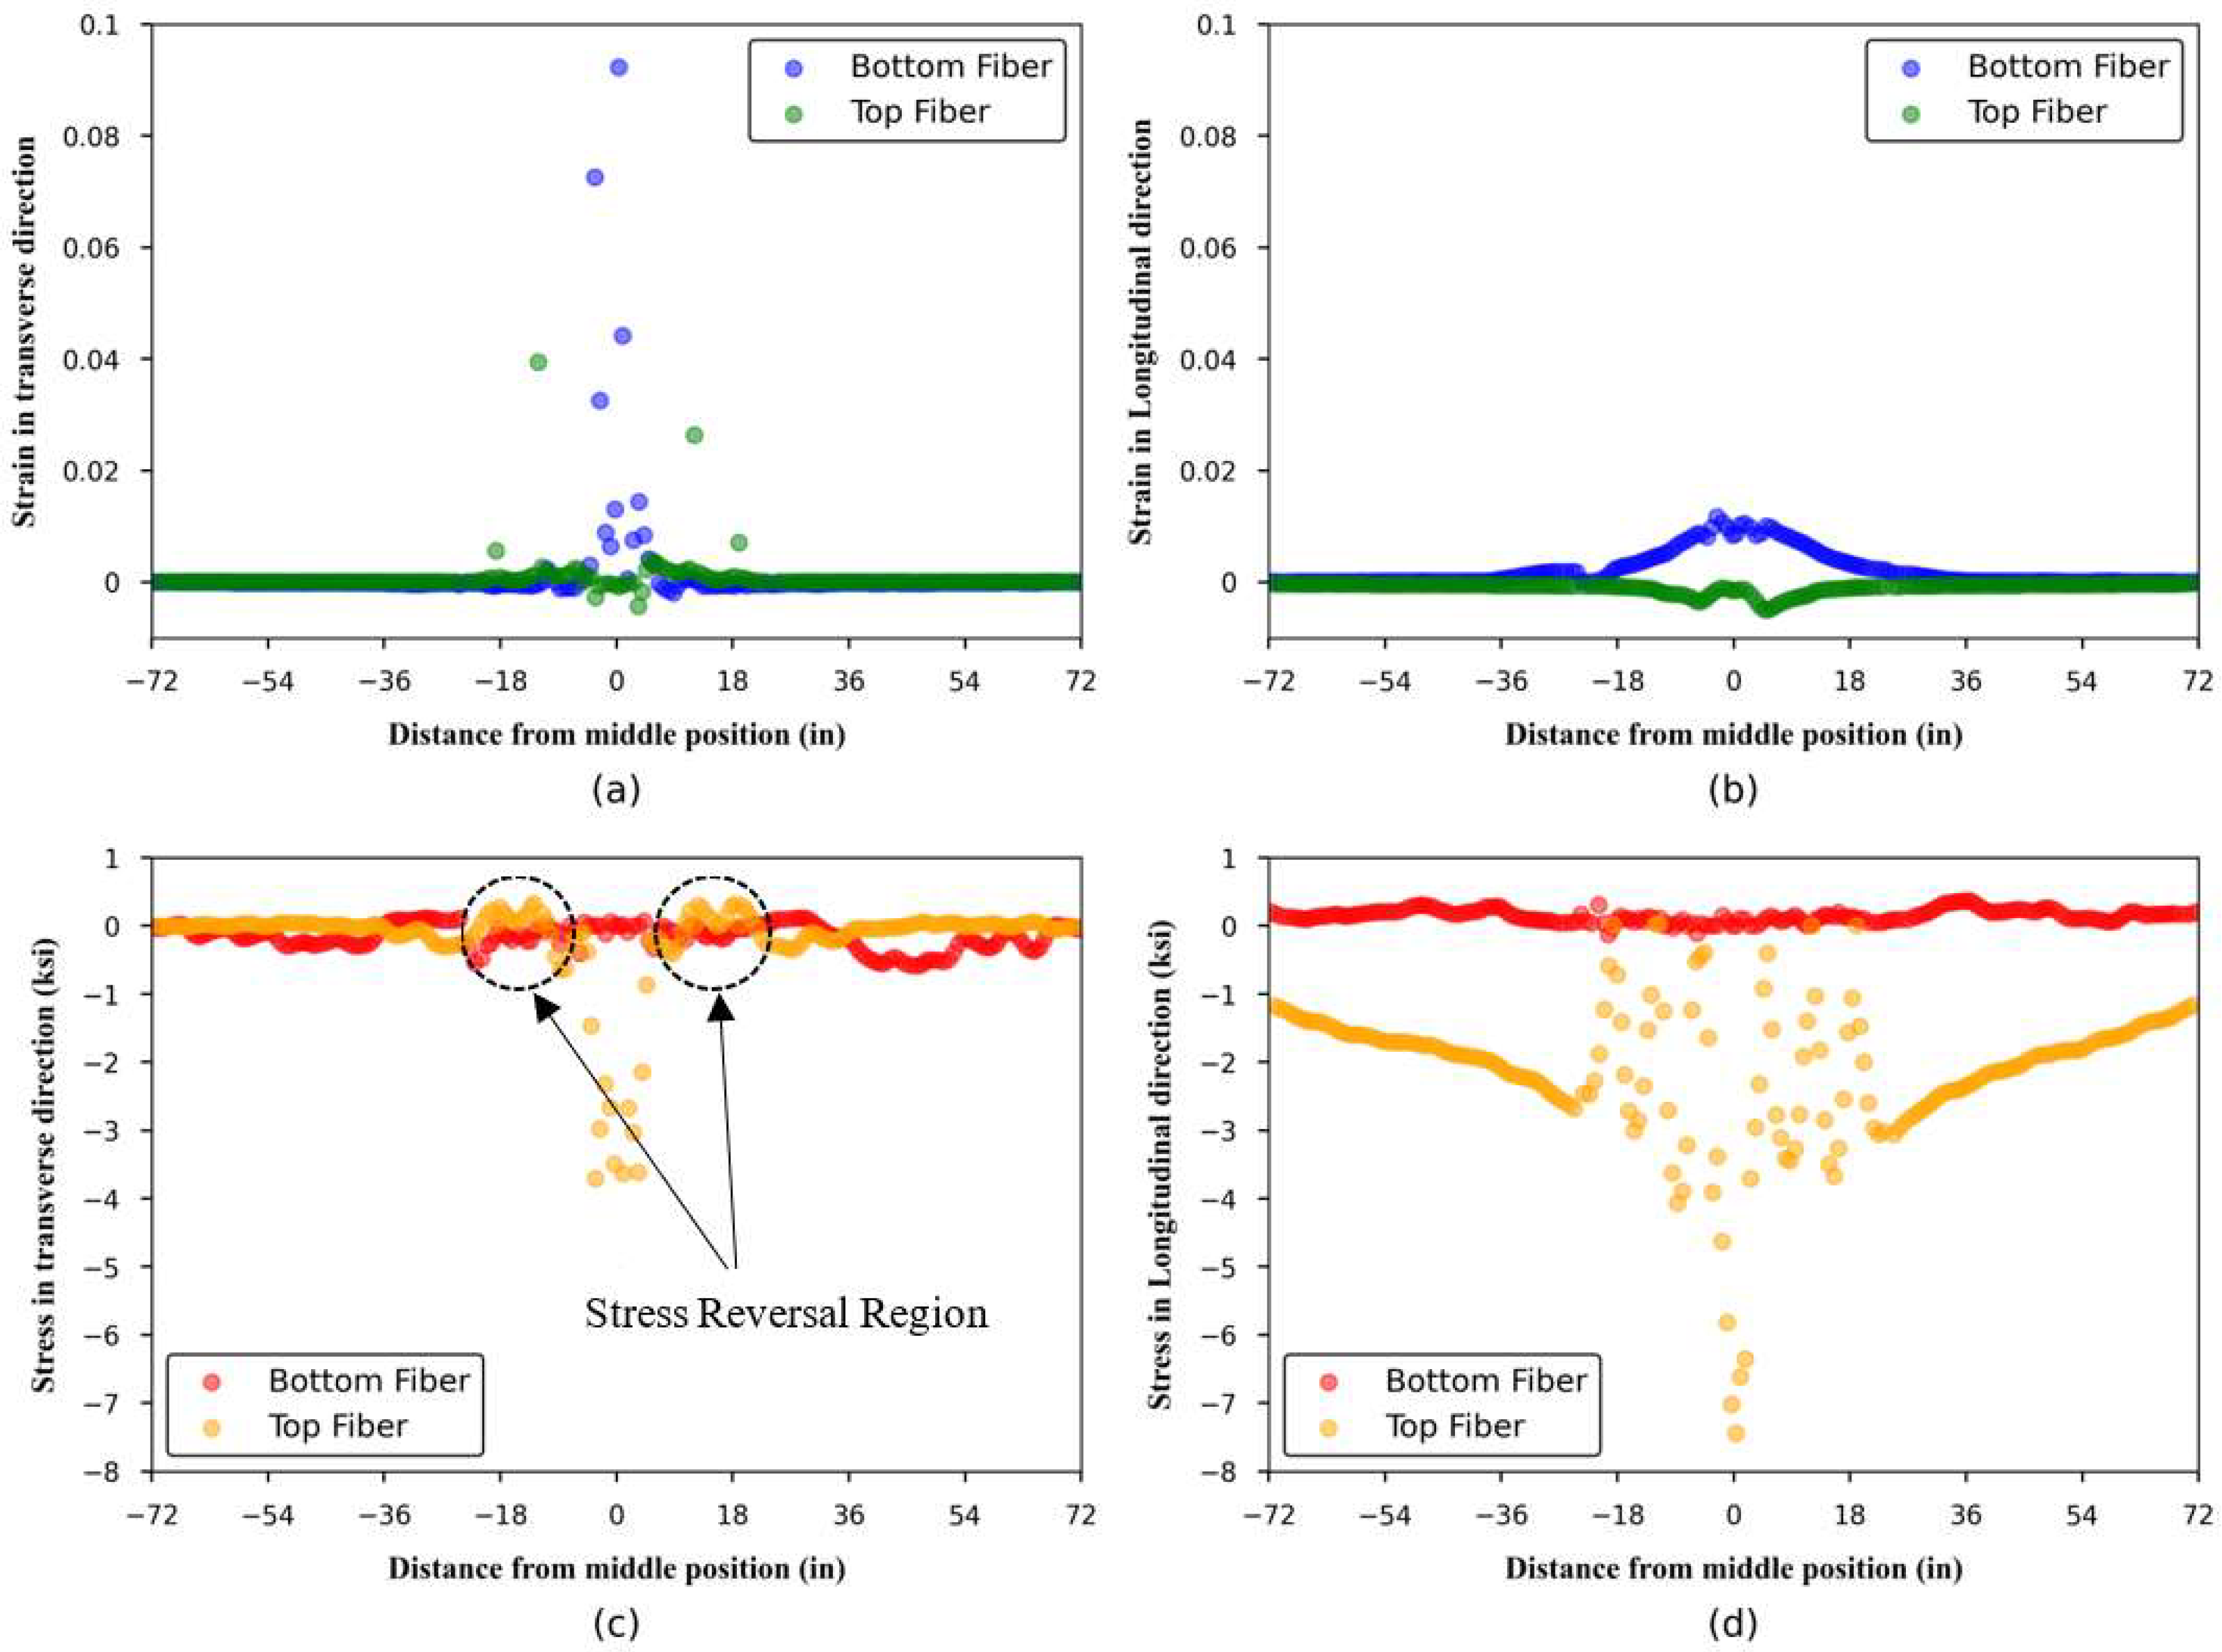
To further investigate the failure mode of the HCS floor system under a concentrated load, the strain and stress distributions at different locations are illustrated in
Figure 18 and
Figure 19. These plots depict the strain and stress values in both transverse and longitudinal directions at the extreme top and bottom concrete fibers across the width and along the span length of the model, respectively. In all these plots, negative values show compression and positive ones show tension.
Figure 18a shows significant transverse strain in the transverse direction at the bottom fiber in a few elements near the center of the cross-section, associated with longitudinal cracking due to transverse bending moments. Since these slabs lack transverse reinforcement, crack opening is controlled solely by confinement between the slabs, as noted by Lucio [
25]. By examining tensile strain values in both directions, it is observed that the region of high longitudinal strain is wider than the region of high transverse strain. Another notable observation is the presence of high tensile strain in the transverse direction at the top fiber, which is indicative of longitudinal cracking potentially associated with modified punching shear failure.
In terms of stress distribution,
Figure 18c,d reveal that the top fiber experiences pronounced stress concentrations in both transverse and longitudinal directions near the slab center, directly beneath the applied load. These large compressive stresses occur at relatively small strains which in the longitudinal direction are primarily affected by flexure and influenced by Poisson’s effect and transverse bending in the transverse direction. The most significant of these results are the transverse tensile stresses at the top fiber, as well as the reversal of strain and stress patterns, which are characteristic of punching shear behavior. Another insight from these figures is that in the transverse direction, only top and bottom flanges are actively engaged in resisting stresses across the width, whereas along the span, the webs also contribute, allowing for stress redistribution and enhanced load-carrying capacity until failure. This distinction highlights the fact that the HCS is structurally weaker in the transverse direction.
Figure 19 further supports this behavior, showing that both strain and stress remain largely uniform along most of the slab length, with minimal variation, except near the center, where a sharp increase (both negative and positive) is observed. This spike near the loading point suggests localized deformations due to stress concentrations. However, while significant strain and stress across the width are confined to a small central region, along the length of the slab, elevated values extend more gradually away from the load point. This distribution allows cracks to propagate farther in the longitudinal direction.
4.7. Strands Strain and Stress Distribution
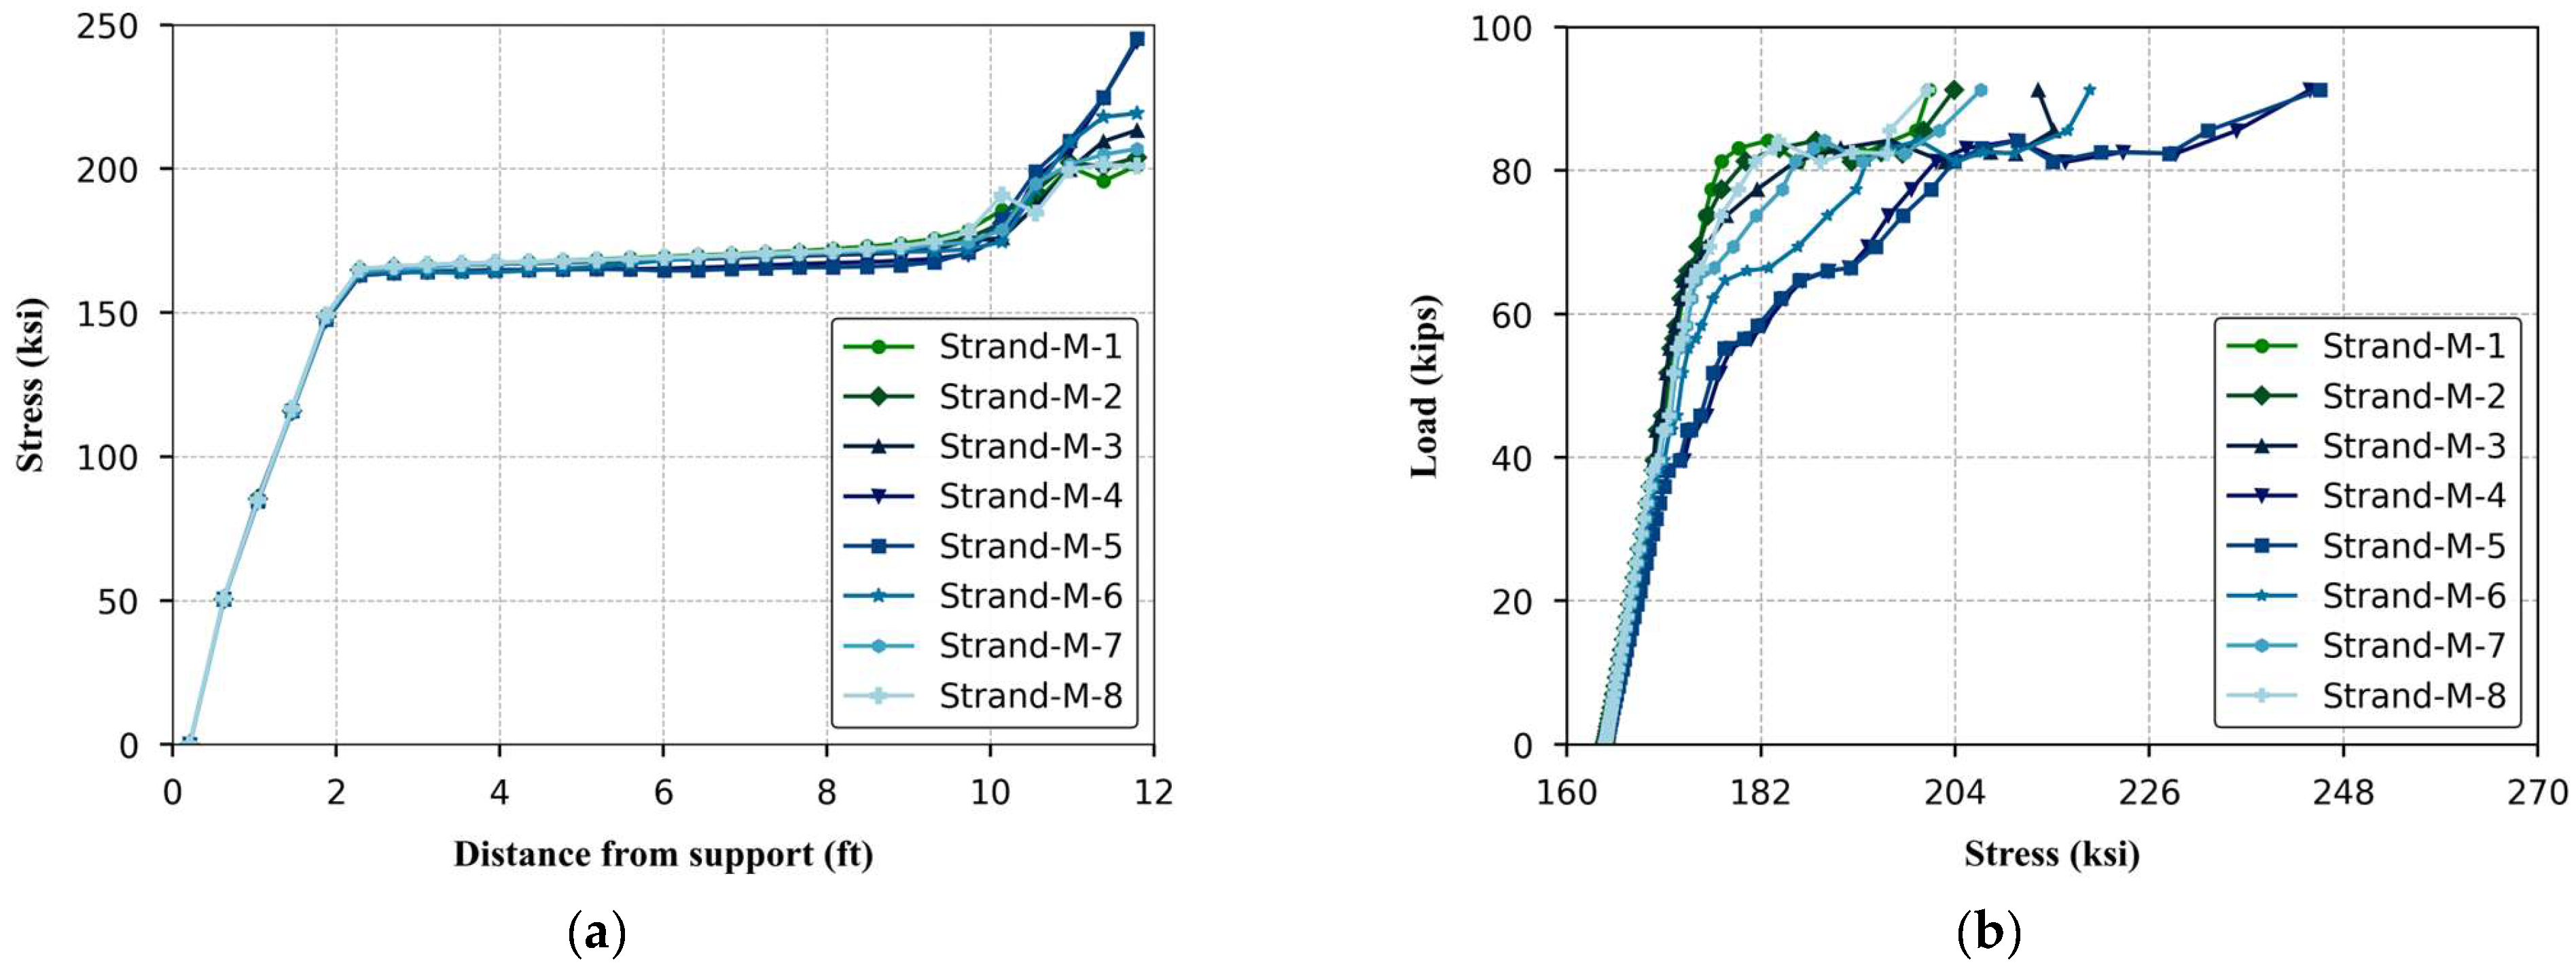
Figure 20a illustrates the stress distribution along the length of different prestressing strands in the middle slab of the HCS system at failure and
Figure 20b portrays the relationship between applied load and strand stress. The numbering of strands ranges from 0 to 8, corresponding to the first strand on the right edge of the slab to the last one on the left as shown in
Figure 1. The initial region of
Figure 20a corresponds to the transfer length. Beyond this region, the stress became relatively constant, indicating uniform prestress along the span. The strands were in a state of equilibrium, carrying the applied load evenly, with no significant changes in stress.
Near the slab center, there was a noticeable rise in stress, particularly for the central strands (M-4 and M-5), reflecting localized stress concentrations beneath the applied load and these strands were taking on a larger portion of the load. Only these two strands reached the proportional limit of the strand material (1689 MPa (243 ksi)). This indicates that concrete crushing occurred before the strands became nonlinear. So, when modified punching shear failure developed, the concrete in the top flange lost its load-carrying capacity, requiring the strands to carry additional internal stress to resist bending.
4.8. Damage in Longitudinal Joints
Figure 21 exhibits the impact of the contact damage criterion (CSMAXSCRT), highlighting the initiation of damage in red at the conclusion of the analysis for the symmetrical surfaces between the middle slab and the longitudinal joints. From the figure, it is evident that there was negligible damaged area close to midspan and loading area, indicating that shear key failure did not happen before the modified punching shear failure in this model. The shear keys were still functioning and capable of transferring load between the slabs. This observation confirms that, despite the presence of localized stress concentrations, the shear keys retained their load-bearing capability, allowing for load redistribution across the slab system until modified punching shear failure became the dominant failure mode in this model with mentioned configuration. The influence of geometry and material properties should be further investigated in future studies.
4.9. Effect of Loading Area
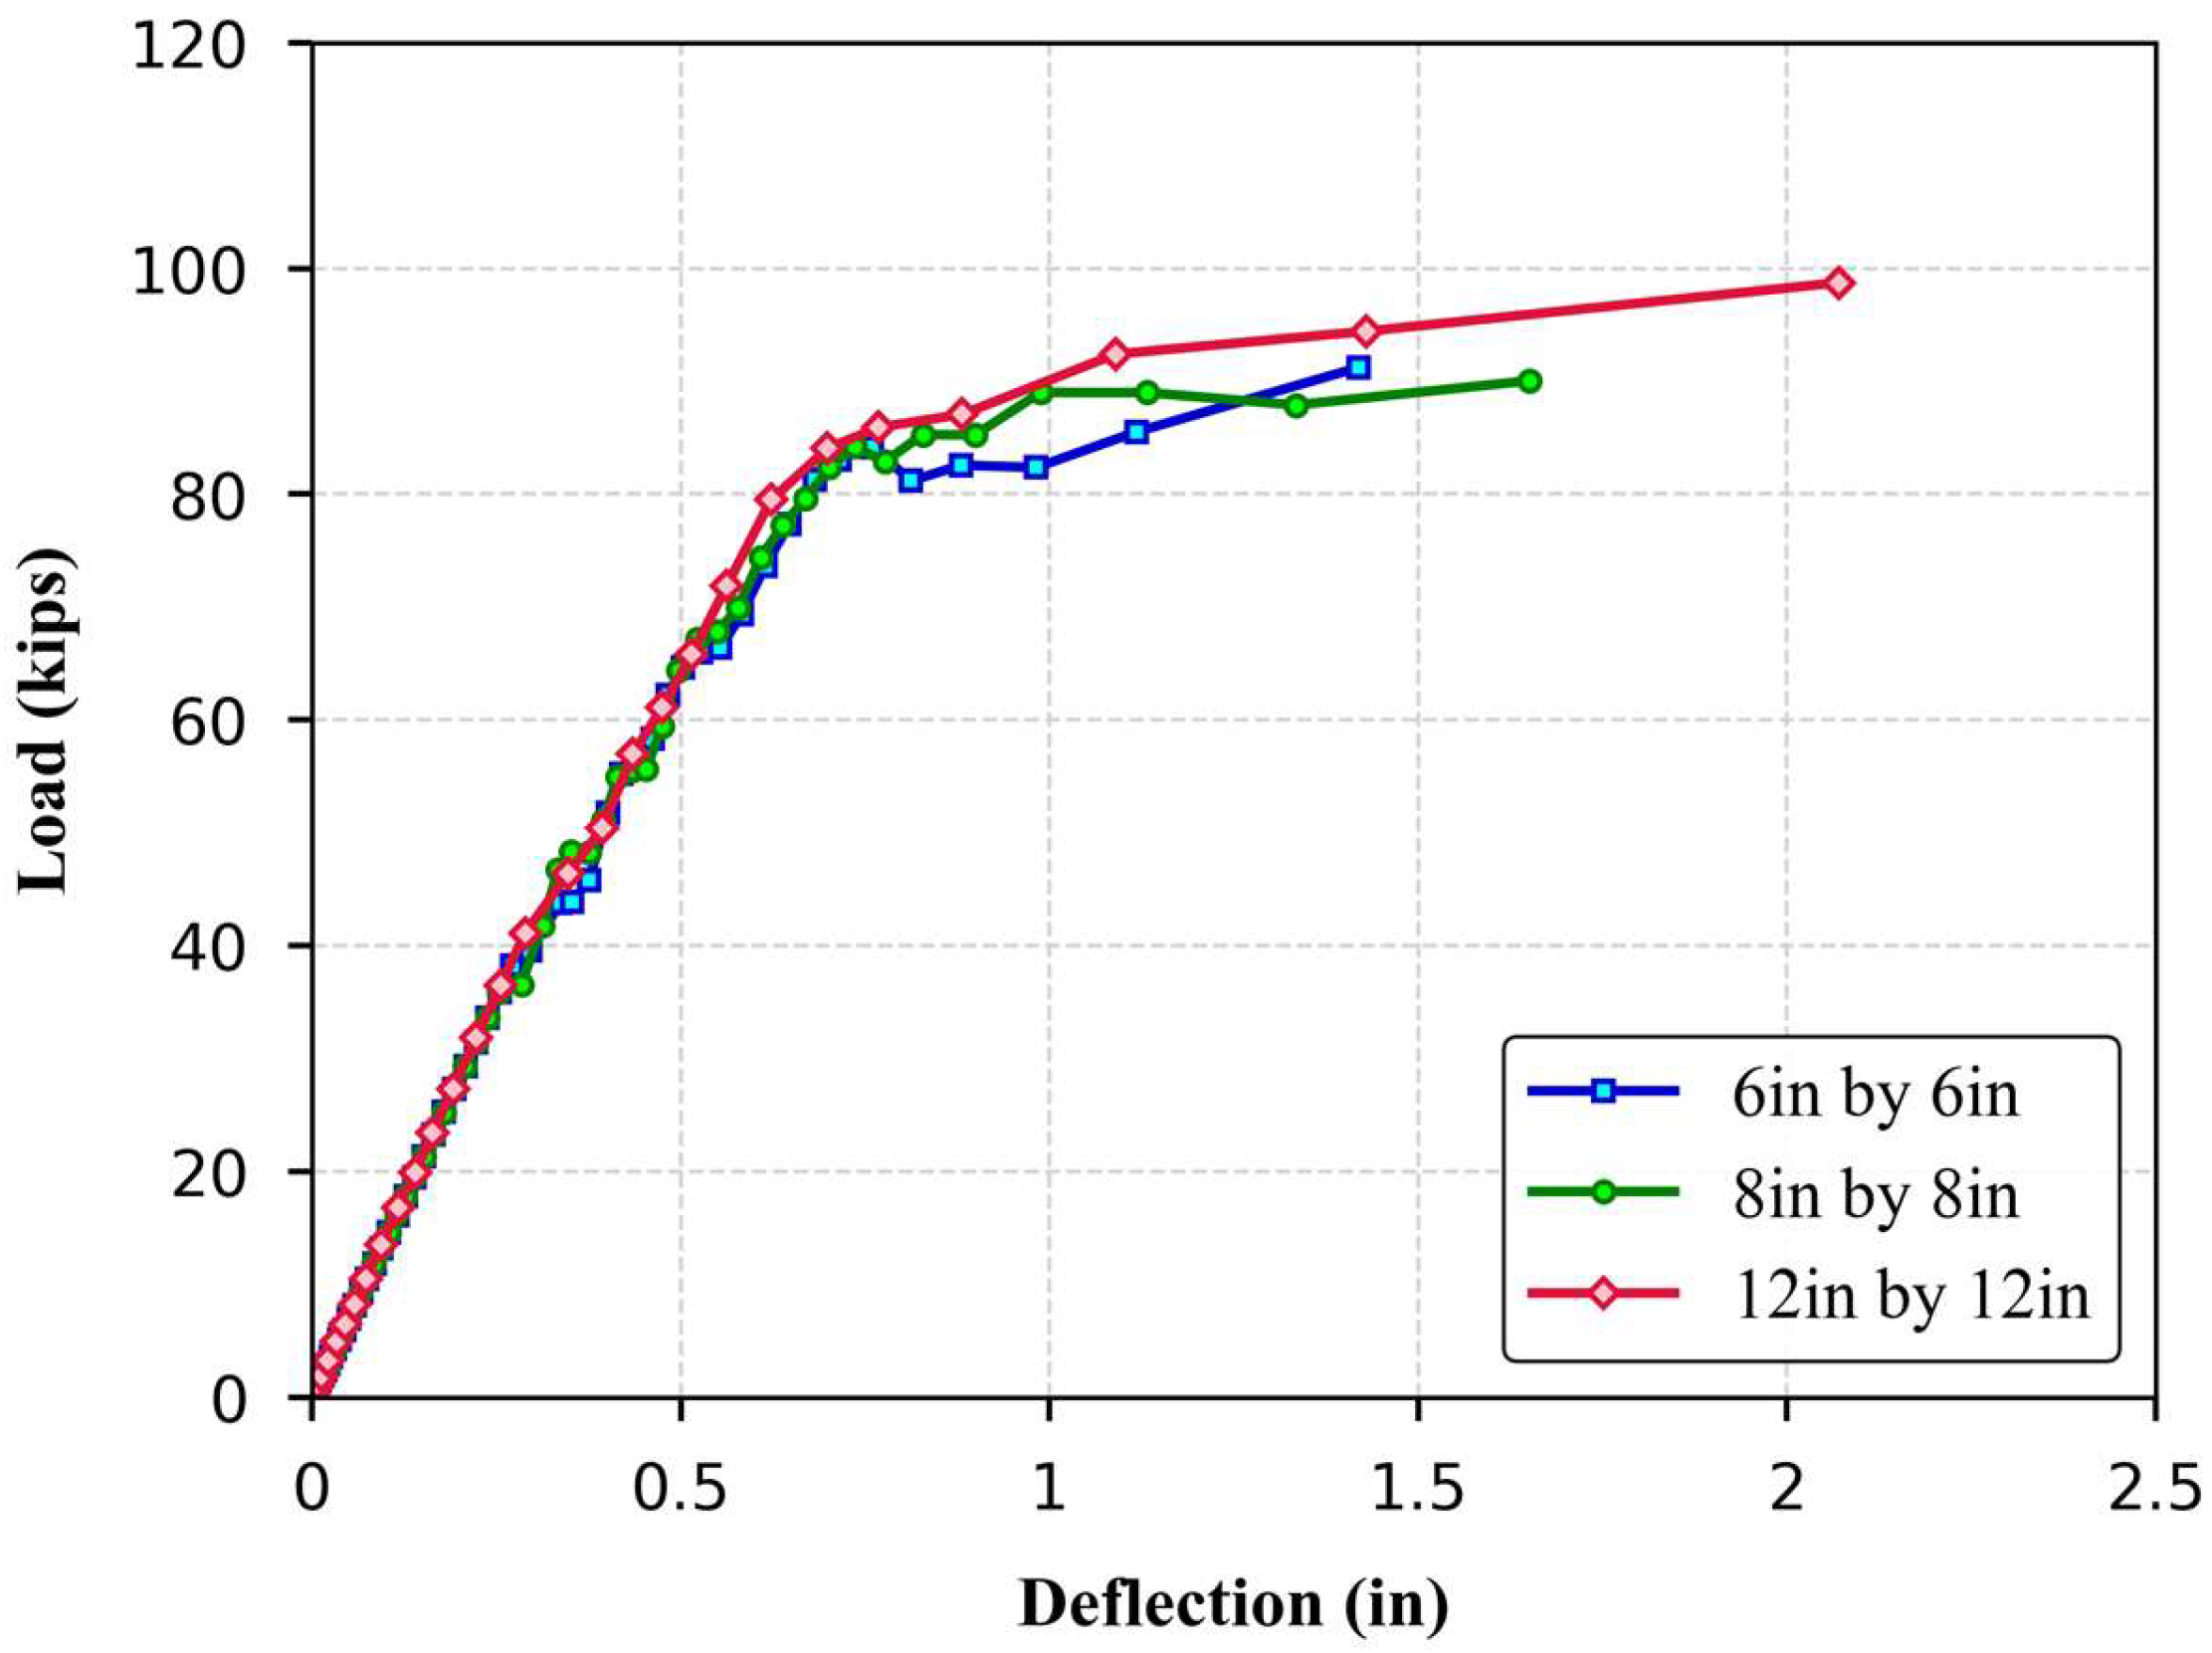
The sensitivity of the HCSs response to various loading areas is illustrated in
Figure 22. During the initial loading phase, all specimens exhibited a similar linear trend, indicating comparable initial stiffness and elastic behavior regardless of the load area. However, divergence became apparent at higher load levels. The slab subjected to the 203 × 203 mm (8 in × 8 in) load area reached a peak load similar to that of the 152 × 152 mm (6 in × 6 in) patch but exhibited better post-peak performance, suggesting marginal improvements in ductility. In contrast, increasing the load area to 305 × 305 mm (12 in × 12 in) resulted in approximately an 8% increase in ultimate capacity, along with an extended deflection range. The slab continued to carry increasing loads beyond 50 mm (2 in.) of deflection, indicating a more ductile response and enhanced post-peak performance. The observed behavior can be attributed to the distribution of stresses over a wider region in the larger loading areas, which reduces the intensity of localized stresses and delays modified punching shear failure. In the case of the 152 mm (6 in.) loading area, the concentrated stress led to an earlier onset of modified punching shear, limiting both the load capacity and post-peak ductility. Furthermore, increasing the patch size was observed to promote the formation of shear cracks at the supports, suggesting a potential transition in the failure mechanism.
4.10. Effect of Loading Point
To bridge the gap of knowledge regarding the performance of longitudinal joints in HCS floors under concentrated loads, the present study includes a preliminary investigation on the influence of load location. Specifically, the effect of shifting the point load closer to the joint was assessed to evaluate its impact on the structural response and failure mode.
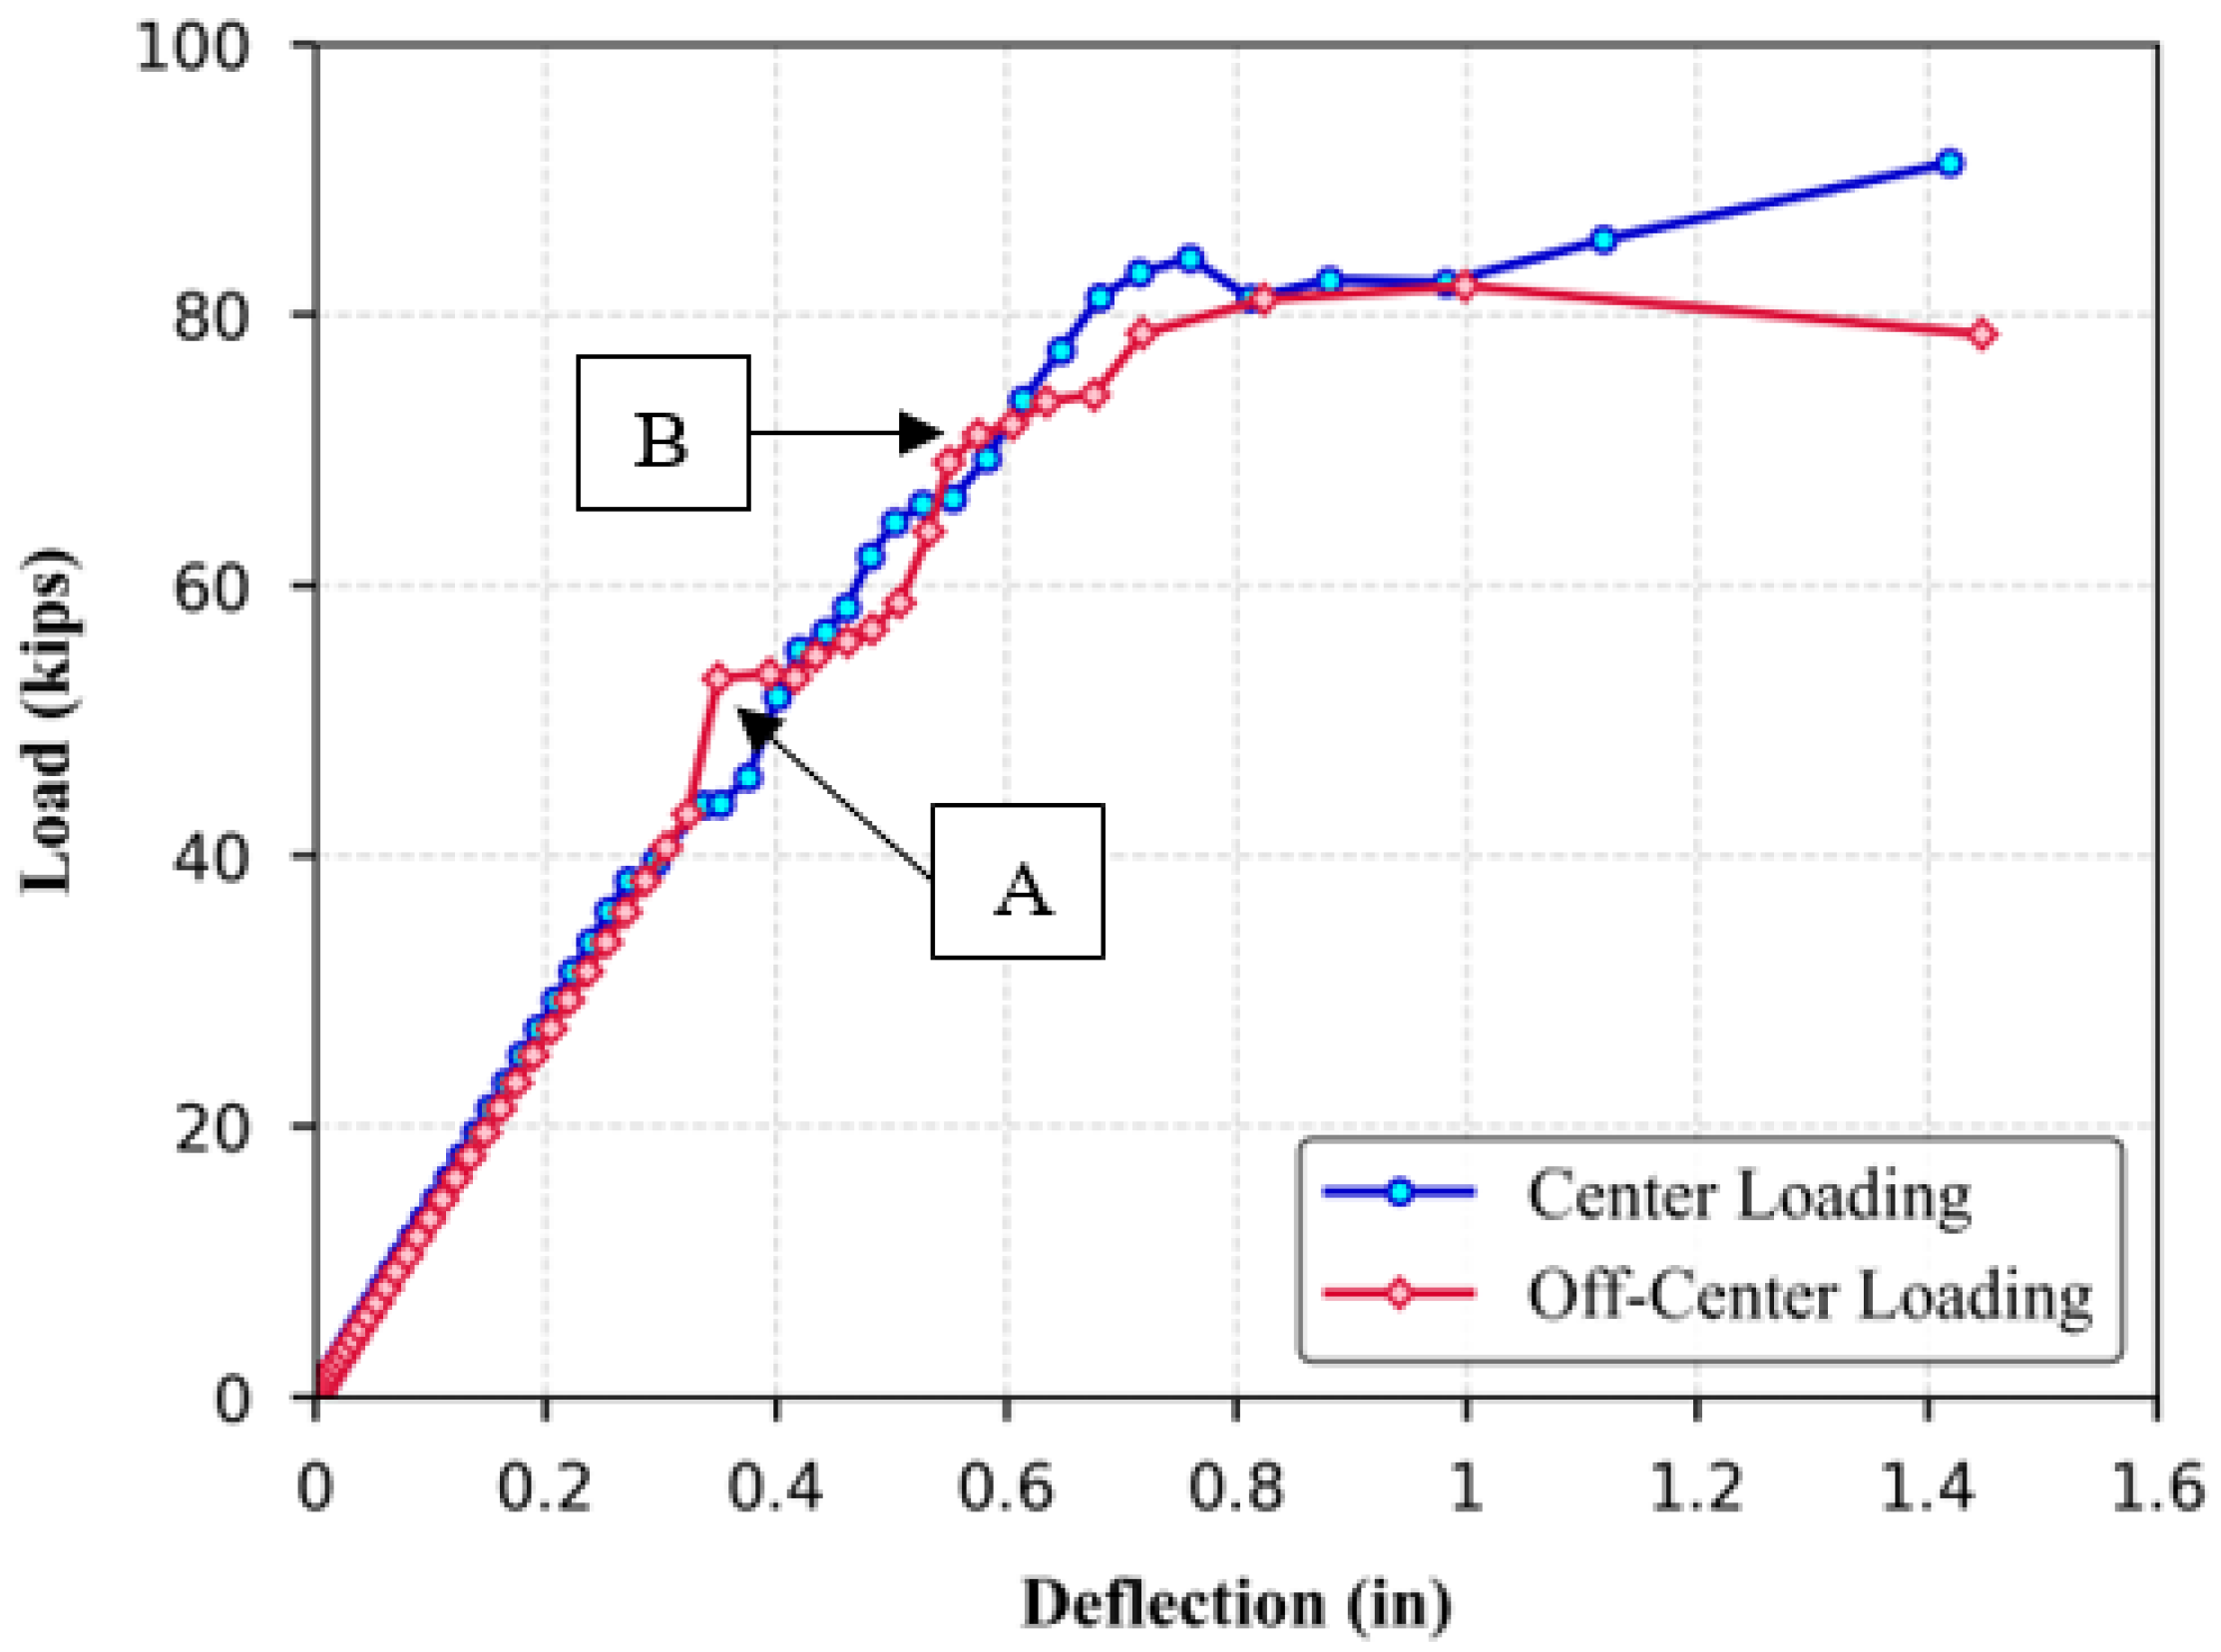
Figure 23 presents the two loading configurations considered: one at the slab center and another near the inside edge adjacent to the joint. The resulting load–deflection curves, shown in
Figure 24, reveal how load location influences overall performance, including load-carrying capacity, crack propagation, and failure patterns.
At Point A on the load-deflection curve for off-center loading, a wide crack forms on the bottom surface of the middle slab directly beneath the loading point. Simultaneously, damage initiates at the interface between the joint surface (near the loading point) and the adjacent side slab. As the load increases further, Point B is reached, marking the onset of debonding between the joint surface and the loaded slab. These two points signify the initiation of local failure driven by contact debonding at the joint. The peak load attained in this configuration is approximately 365.27 kN (82.12 kips), representing about 97% of the capacity recorded under center loading. At this stage, a longitudinal crack propagates along the top surface of the slab from the load application point toward the support. Beyond the peak load, the response softens due to continued crack propagation and joint degradation. The system ultimately fails through a combined mechanism involving joint debonding and modified punching shear failure. The resulting crack patterns closely resemble those observed in center loading, particularly the development of wide longitudinal cracks on the top surface beneath the loading point, indicating similar failure progression but triggered earlier due to proximity to the joint.
Figure 25 and
Figure 26 illustrate the deflected shape and joint debonding area for the off-center loading configuration at the end of the analysis. In
Figure 26, the red-highlighted regions indicate the debonded interfaces between the joint and the adjacent slabs. In this case, the response is dominated by torsional deformation of the loaded slab about its longitudinal axis. This torsion arises from the limited torsional stiffness, primarily due to the proximity of the longitudinal joint whose shear stiffness is significantly lower than that of the slab. The resulting twisting induces premature joint debonding on the loaded side, triggering failure through a torsion-driven mechanism that precedes—or replaces—the modified punching shear sequence observed under centered loading. The joint farther from the load remains intact, confirming that the failure is localized near the loading region. These findings highlight that, under off-center loading, the longitudinal joint integrity is critical to the structural performance and can significantly influence both the load-carrying capacity and failure mode of the system.
