Article

A Case Study on the Energy Efficiency of Windows in Institutional and Residential Buildings

1
Wood Science and Technology Centre, University of New Brunswick, Fredericton, NB E3C 2G6, Canada
2
Building Efficiency Technology Access Centre, Red River College, Winnipeg, MB R3H 0J9, Canada
*
Author to whom correspondence should be addressed.
Buildings 2025, 15(19), 3478; https://doi.org/10.3390/buildings15193478
Submission received: 19 August 2025 / Revised: 16 September 2025 / Accepted: 24 September 2025 / Published: 26 September 2025

Abstract

Building energy consumption occupies an increasing proportion of the total energy consumption of society, and the use of energy-efficient windows can have great significance for energy saving. This case study examined the energy efficiency of various types of windows of the buildings on the University of New Brunswick campus, Fredericton, Canada. The energy performance of these windows was monitored by an infrared thermal camera from November 2021 to April 2022 and assessed in terms of the heat loss between different types of windows. The main findings were that (1) the temperature distribution of a window was strongly influenced by the indoor and outdoor temperature; (2) wood frame windows showed better insulation properties than metal frame ones; (3) fixed windows had a better energy performance than sliding windows and single-hung windows; and (4) the east orientation of a building and the use of Low-E glazing were the most effective expedients to reduce the winter energy required. By comparing these findings with earlier research, this study contributes new insights for cold climates, underscoreing the importance of Low-E glazing and configuration choice in building retrofits for energy-efficient, sustainable construction.

1. Introduction

With the increasing energy demand, the power sector was reported to emit almost 13 Gt CO2 emissions in 2020, contributing more than 40% of the total global energy-related CO2 emissions [1]. About 47% of the greenhouse gas emissions are related to construction, 33% to transportation, and 19% to industry [2]. High-performing building envelopes are the parts of a building that separate the indoors from the outdoors, including exterior walls, foundations, roofs, windows, etc., which play a critical role in the reduction in energy consumption of the building. For example, in cold climates, windows can be responsible for 10% to 25% of the heat loss of a house during the winter and heat gain in the summer [3].
Windows provide light, visibility, and ventilation, but they also affect thermal performance. It usually consists of a window frame and glazing and has different ways of opening. Windows are often considered to be one of the weakest structural elements due to high heat losses [3]. In a building, the heat loss through windows depends on many factors, such as frame materials, configurations, and orientation. Windows made with materials that can reduce heat exchange and air leak have a better energy performance, saving energy to heat or cool a space, resulting in a better energy efficiency [4]. The window frame materials that have a high thermal resistance commonly include vinyl, wood, aluminum, fiberglass, and other composites [5]. When metal window frames are used, a proper thermal break should be installed to prevent heat loss, which is a continuous barrier between the inside and outside window frames that prevents conductive thermal energy loss [4]. The insulation of plastic strips between the inside and outside of a window frame and sash is another solution assisting the reduction in heat flow [6].
The widely used window configurations are awning, hopper, sliding, fixed, double-hung, and casement (Figure 1). The fixed-pane windows are air-tight but are not suitable in places where natural ventilation is desired. The casement, awning, and hopper windows provide good ventilation when opened and are moderately air-tight when closed, because they have compression seals. The sliding, double-hung, and single-hung windows are the leakiest and provide minimal ventilation when opened [3]. The thermal performance ranking for different window shapes, from higher to lower, was horizontal rectangular, square, circular, and vertical rectangular window configurations, respectively.
Another consideration to the energy efficiency of a window is given to the orientation of a window in a building. It was found that there was an improved effect for the south orientation, which was the best performing in winter [7].
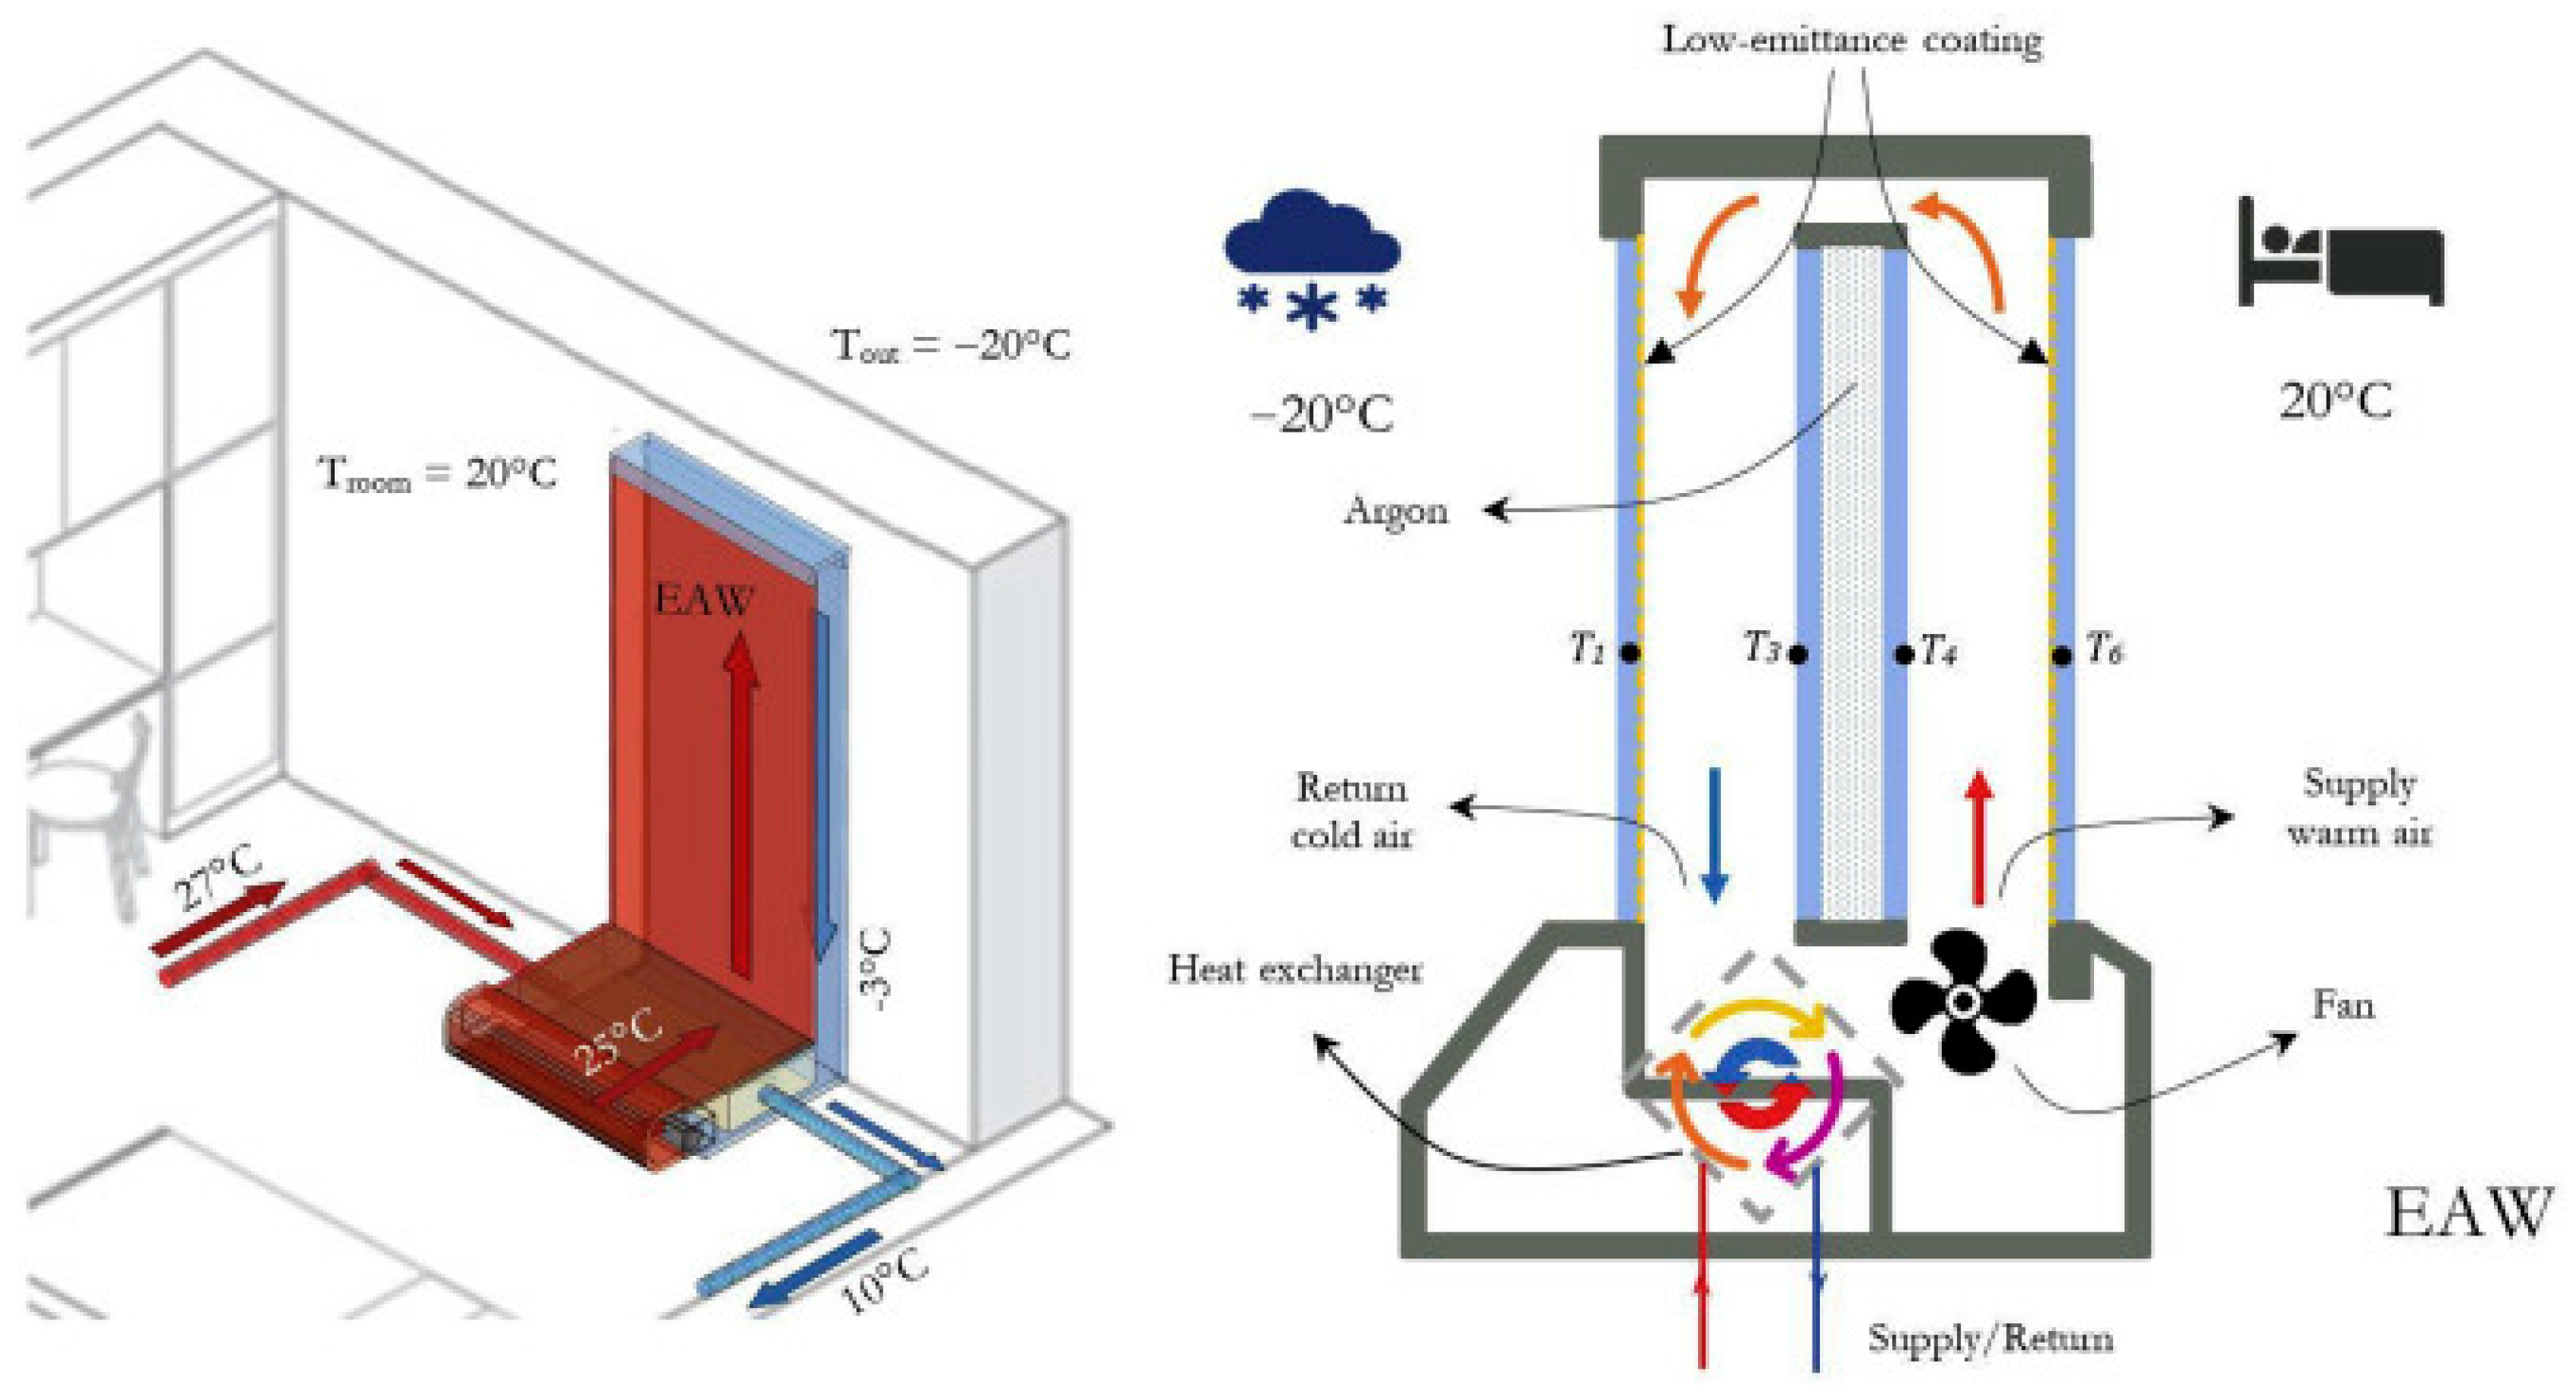
The U-value is defined as the heat transfer per time per area and per degree of temperature difference in W/(m2∙°C) or Btu/(h∙ft2∙°F), which is a measure of quantifying the energy efficiency of a window [8]. A window with a lower U-factor tends to be more energy efficient than one with a higher U-factor. Many advanced technologies have been developed to minimize the U-value of windows, with the aim of reducing the heating and cooling loads of a building [9]. The use of AR (Anti-Reflection) coatings in switchable glazing can significantly increase the light transmittance in the transparent state [10]. The innovative energy-active window (EAW) (Figure 2), which is composed of a double-slot glazing configuration and a closed air loop, can utilize low-grade energy, such as waste heat in a sealed air loop between the windowpanes [11].
In the last decade, scholars have performed many substantial studies on how different window parameters could affect energy efficiency. Gasparaella et al. demonstrated that larger glazing systems (from 16% to 41%) improved winter performance but slightly increased peak winter loads, reducing the energy need up to 10 kW h/m2 for south-facing windows in Milan [7]. Arıcı et al. reported that about 50% or 67% of energy savings could be made if the double-pane window could be replaced by triple- or quadruple-pane windows, respectively [12]. They also found that the most reasonable gap width was 12 mm, compared to 6 mm, 9 mm, 15 mm, and 18 mm [13]. Elghamry et al. (2020) reported that controlling window parameters could reduce the annual cooling load by about 30% and the lighting power, CO2 emissions, annual energy consumption, and energy cost by about 39%, 22%, 24%, and 21%, respectively [14].

2. Methods

This case study was conducted at the University of New Brunswick, Fredericton, NB, Canada. Fredericton is located at approximately 45.96° north latitude and 66.64° west longitude, which has a humid continental climate with short, warm summers and long, cold winters. There are seven months with average temperatures below 10 °C over a year, and the annual mean temperature is 6 °C [15]. Thus, windows with a high energy efficiency are very important in Fredericton in the winter to reduce the heating cost. This case study investigated the energy efficiency of windows with different parameters in a typical cold climate during the heating seasons. The experimental characterization of windows was carried out by considering frame materials, configurations, and orientation, etc. Inside and outside temperatures of each window examined were measured by means of an infrared camera from 18 November 2021 to 28 April 2022. Meteorological data (wind speed, humidity) were obtained from Environment Canada and used in the analysis [16]. In this work, performance of the chosen windows was first compared by calculating the heat loss and insulation rate. Then, the energy performance was evaluated based on the calculated values φ, and finally, the influence of different factors was discussed in terms of the energy efficiency of windows. It is acknowledged that solar radiation effects could not be fully eliminated and are discussed in the Limitations.

2.1. Study Buildings

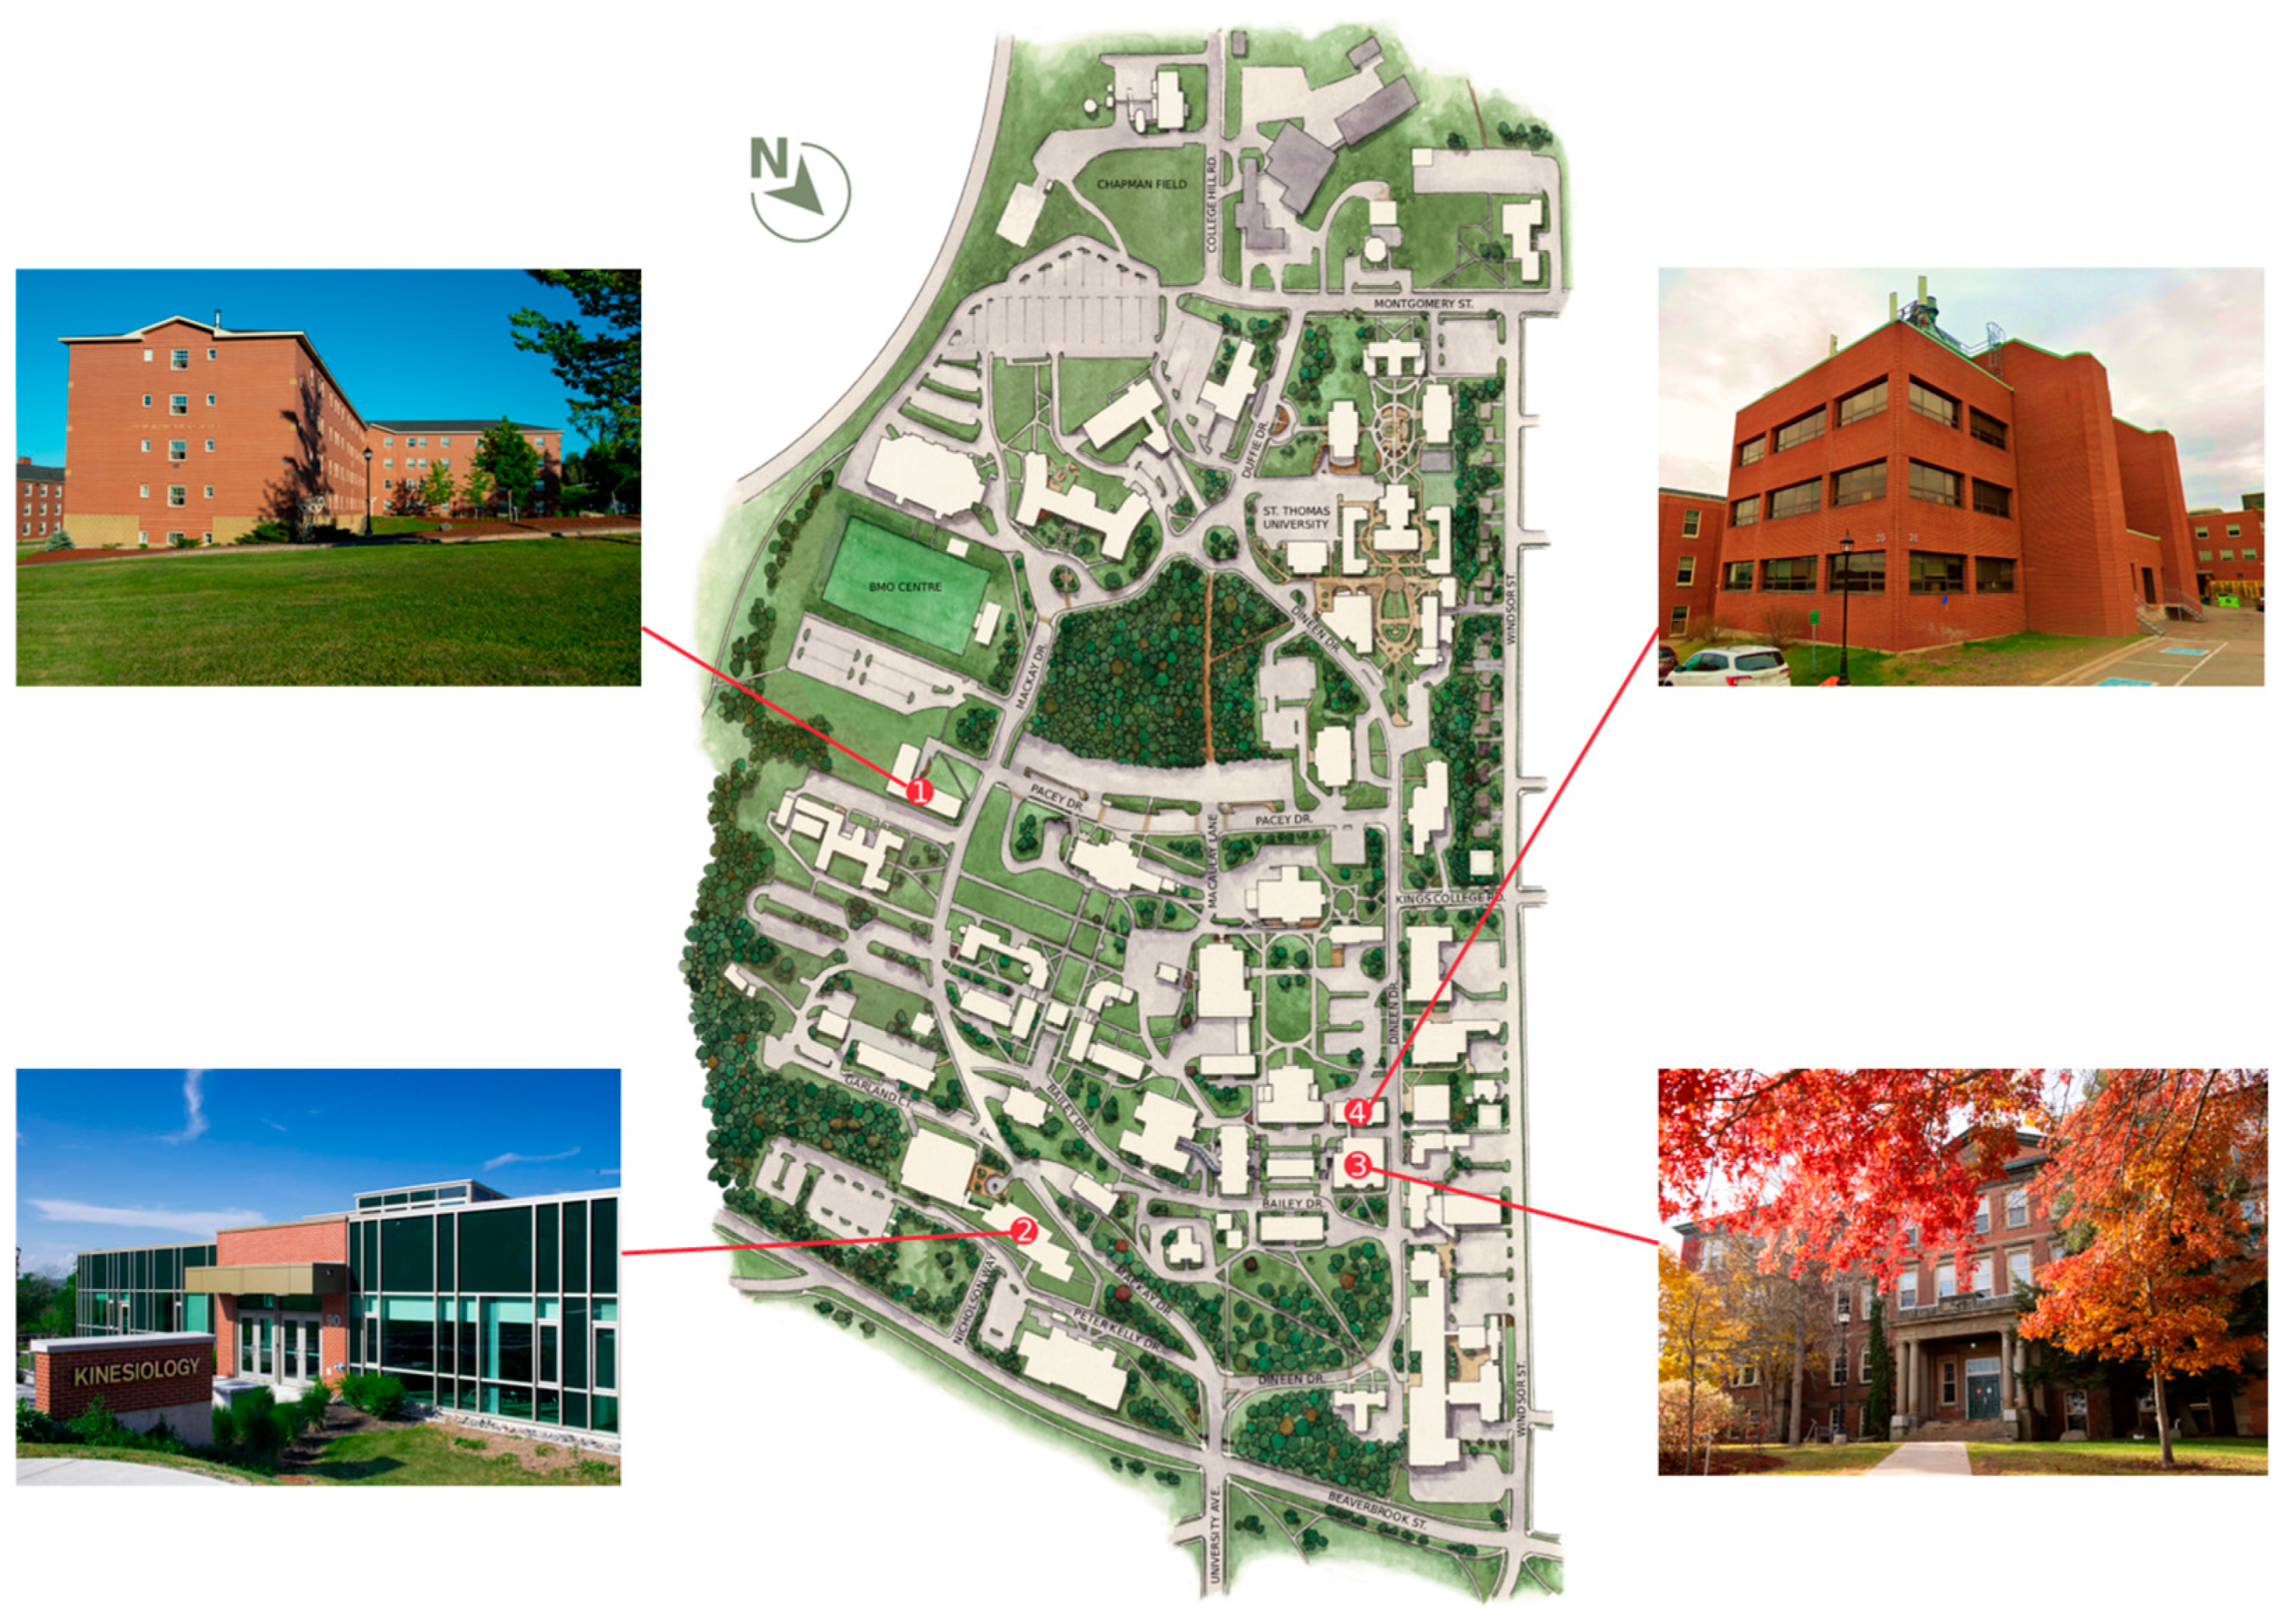
Four buildings were selected from the University of New Brunswick, Fredericton, NB, Canada, including three institutional buildings and one residential building. The Forestry and Geology Building (Building 3) is the oldest one, which was built in 1928 (Geology part) and 1968 (Forestry part). The I.U.C. Forestry Building (Building 4) is relatively new, which was constructed in 1976. The Elizabeth-Parr Johnston Residential Building (Building 1) was placed in use in 2011, and the Kinesiology Building (Building 2) is the newest one on the campus, which was erected in 2017. Figure 3 shows the location of the four buildings on the map and the four buildings themselves [17]. Pictures of each window can be found in Supplementary Materials. The buildings constructed in different years employed different window technologies, which could satisfy the needs of this study. Indoor air temperature was maintained at 20–22 °C and relative humidity at 30–40%, with central heating systems [18]. For Building 1 to Building 4, at least three windows were chosen in terms of floor level, direction, and frame material (Table 1). Information about the windows, such as dimensions and materials, was obtained from the architectural drawings. The measured windows in this case study were selected in unoccupied rooms within buildings with functioning ventilation system, minimizing the impact of activity on air circulation. Windows are all double-pane, and Building 4 uses Low-E glass with coating applied to the inner surface of outer pane.

2.2. Instruments and Software

The infrared thermal camera “FLIR C2” (North Billerica, MA, USA) was used to capture the temperature distribution of each window selected in this study. The FLIR C2 Compact Thermal Camera is a thermal camera designed to find hidden heat patterns that signal energy waste, structural defects, plumbing issues, and more in the building industry. The radiometric image stores 4800 pixels capable of capturing thermal measurements from −10 °C to 150 °C (accuracy ±2 °C or ±2% of reading) [19]. It saves thermal images as JPEG files, then the pictures can be adjusted and analyzed with FLIR Tools to isolate temperature measurements on any pixel and create reports.
FLIR Thermal Studio is the software used in this research to extract specific temperatures from the images [19]. It is an analysis and reporting software designed to manage thermal images and videos from thermal cameras, unmanned aircraft systems (UAS), or optical gas imaging (OGI) cameras. It can accurately extract the temperature of a specific point, as well as the maximum temperature, minimum temperature, and average temperature of an area of interest (accuracy ±0.1 °C). Measurement uncertainty is addressed in the Limitations section.

2.3. Collection and Analysis of Data

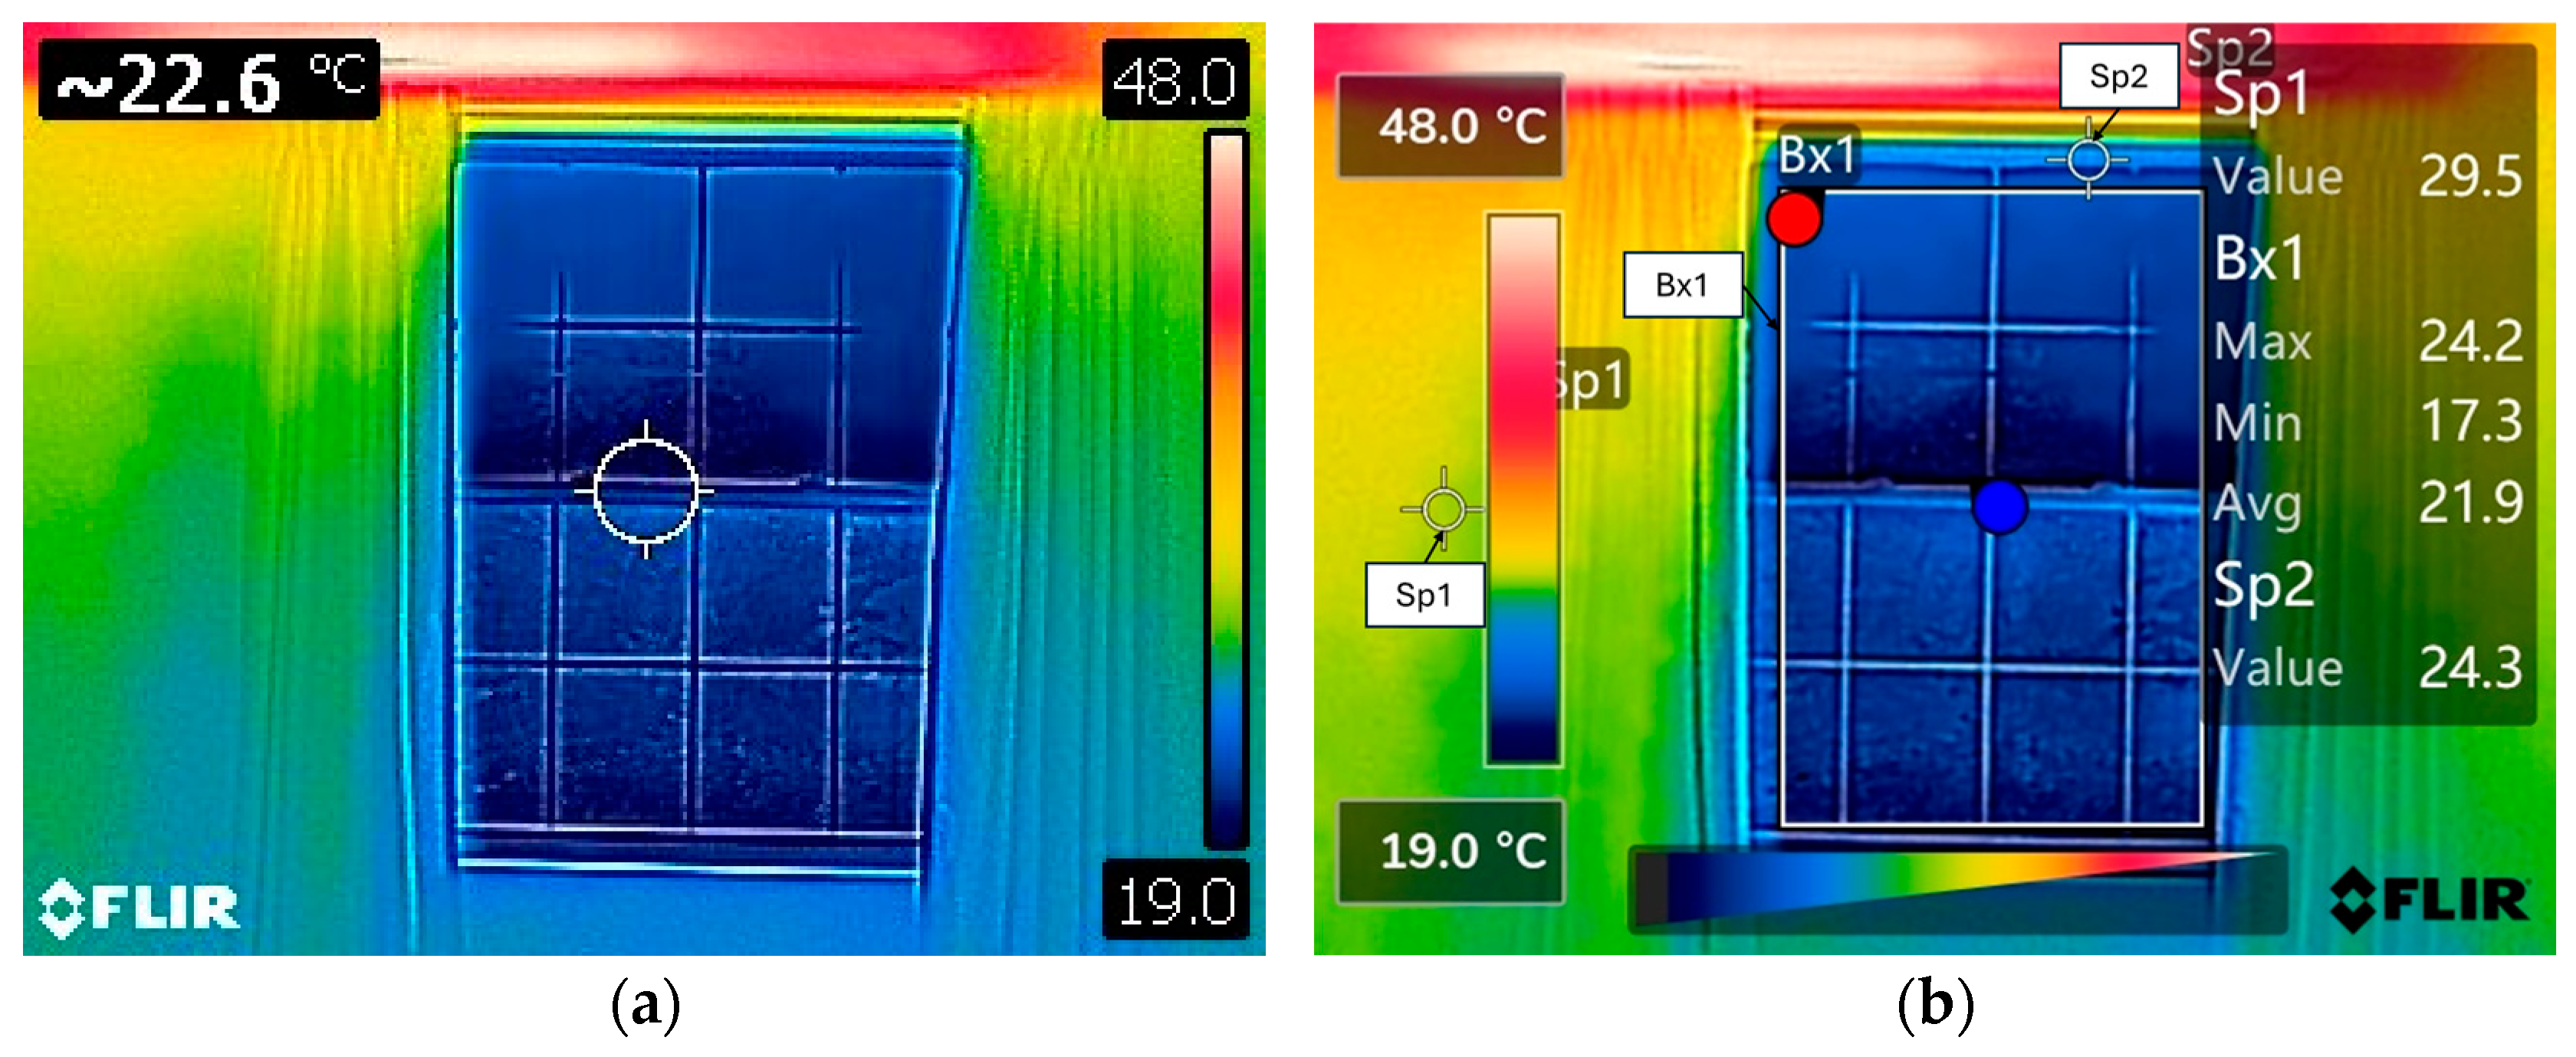
The temperature images of the inside face of each window were recorded as well as the outside face of walls. The air temperature was recorded using Thermocouples (Eupry, Raleigh, NC, USA). The images were taken once a week on Thursday mornings at 10 a.m. during the heating season, starting on18 November 2021 and ending 28 April 2022. The images were taken as fast as possible to reduce the effect of the temperature change. It was found that morning was better than afternoon because solar radiation was relatively lower in the morning, so the heat loss could be calculated more accurately. Estimation of the energy efficiency was mainly based on heat loss. For each window, the temperatures extracted from the points and areas of a window were kept the same because the distribution of temperature in a window was uneven. The temperatures were recorded to draw the graph and calculate the heat loss. Figure 4 shows how the temperature was extracted from the raw thermal image using the software FLIR Thermal Studio. Box 1 is the window area showing the maximum, minimum, and average temperature of window glazing. Spot 1 is the indoor wall temperature and spot 2 is the frame temperature. For each window, the wall and frame temperature were recorded at the same location.

2.4. Evaluation of Energy Efficiency

In this study, the energy efficiency of a window was evaluated by the heat loss (HL), which was calculated using Equation (1) [20]. In Equation (1), the U-factor is a measure of the rate at which a window conducts non-solar heat flow. A window with a lower U-factor means to be more energy-efficient than one with a higher U-factor. The U-factor of windows generally ranges from 0.2 to 1.2 [21]:
H L = A × ( T i T o ) R τ = A × U × ( T i     T o ) ,
where HL is the rate of heat loss, W; A is the area, m2; Ti is the indoor temperature, °C; To is the outdoor temperature, °C; U is the U-factor of the window, W/(m2·K); and Rτ is the total resistance, (m2·K)/W.
The U-value of multi-layer glass can be calculated by the total thermal resistance (Rτ), which is the sum of the heat transfer thermal resistance of each layer of glass, gas interlayer, and glass internal and external surfaces [6], as seen in Equation (2). The Rτ indexes are referred from the standard material value [22]:
R τ = 1 h o u t   +   R n   +   n = 1 2 R g , n   +   1 h i n ,
where Rg,n is the thermal resistance of the glass in the nth layer, (m2·K)/W; Rn is the thermal resistance of the gas interlayer between panes, (m2·K)/W; and hin and hout are the heat transfer coefficients of the inner and outer surface of the glass, W/(m2·K).
Parameters used are glass thickness 3 mm, air gap width 12 mm, emissivity 0.84, indoor convection coefficient 8.3 W/(m2·K), and outdoor convection coefficient 25 W/(m2·K), based on ASHRAE Handbook 2017 and NFRC standards. U-values were validated against published ASHRAE/NFRC data (Table 2).

3. Results

3.1. Energy Performance

3.1.1. Timeline Analysis

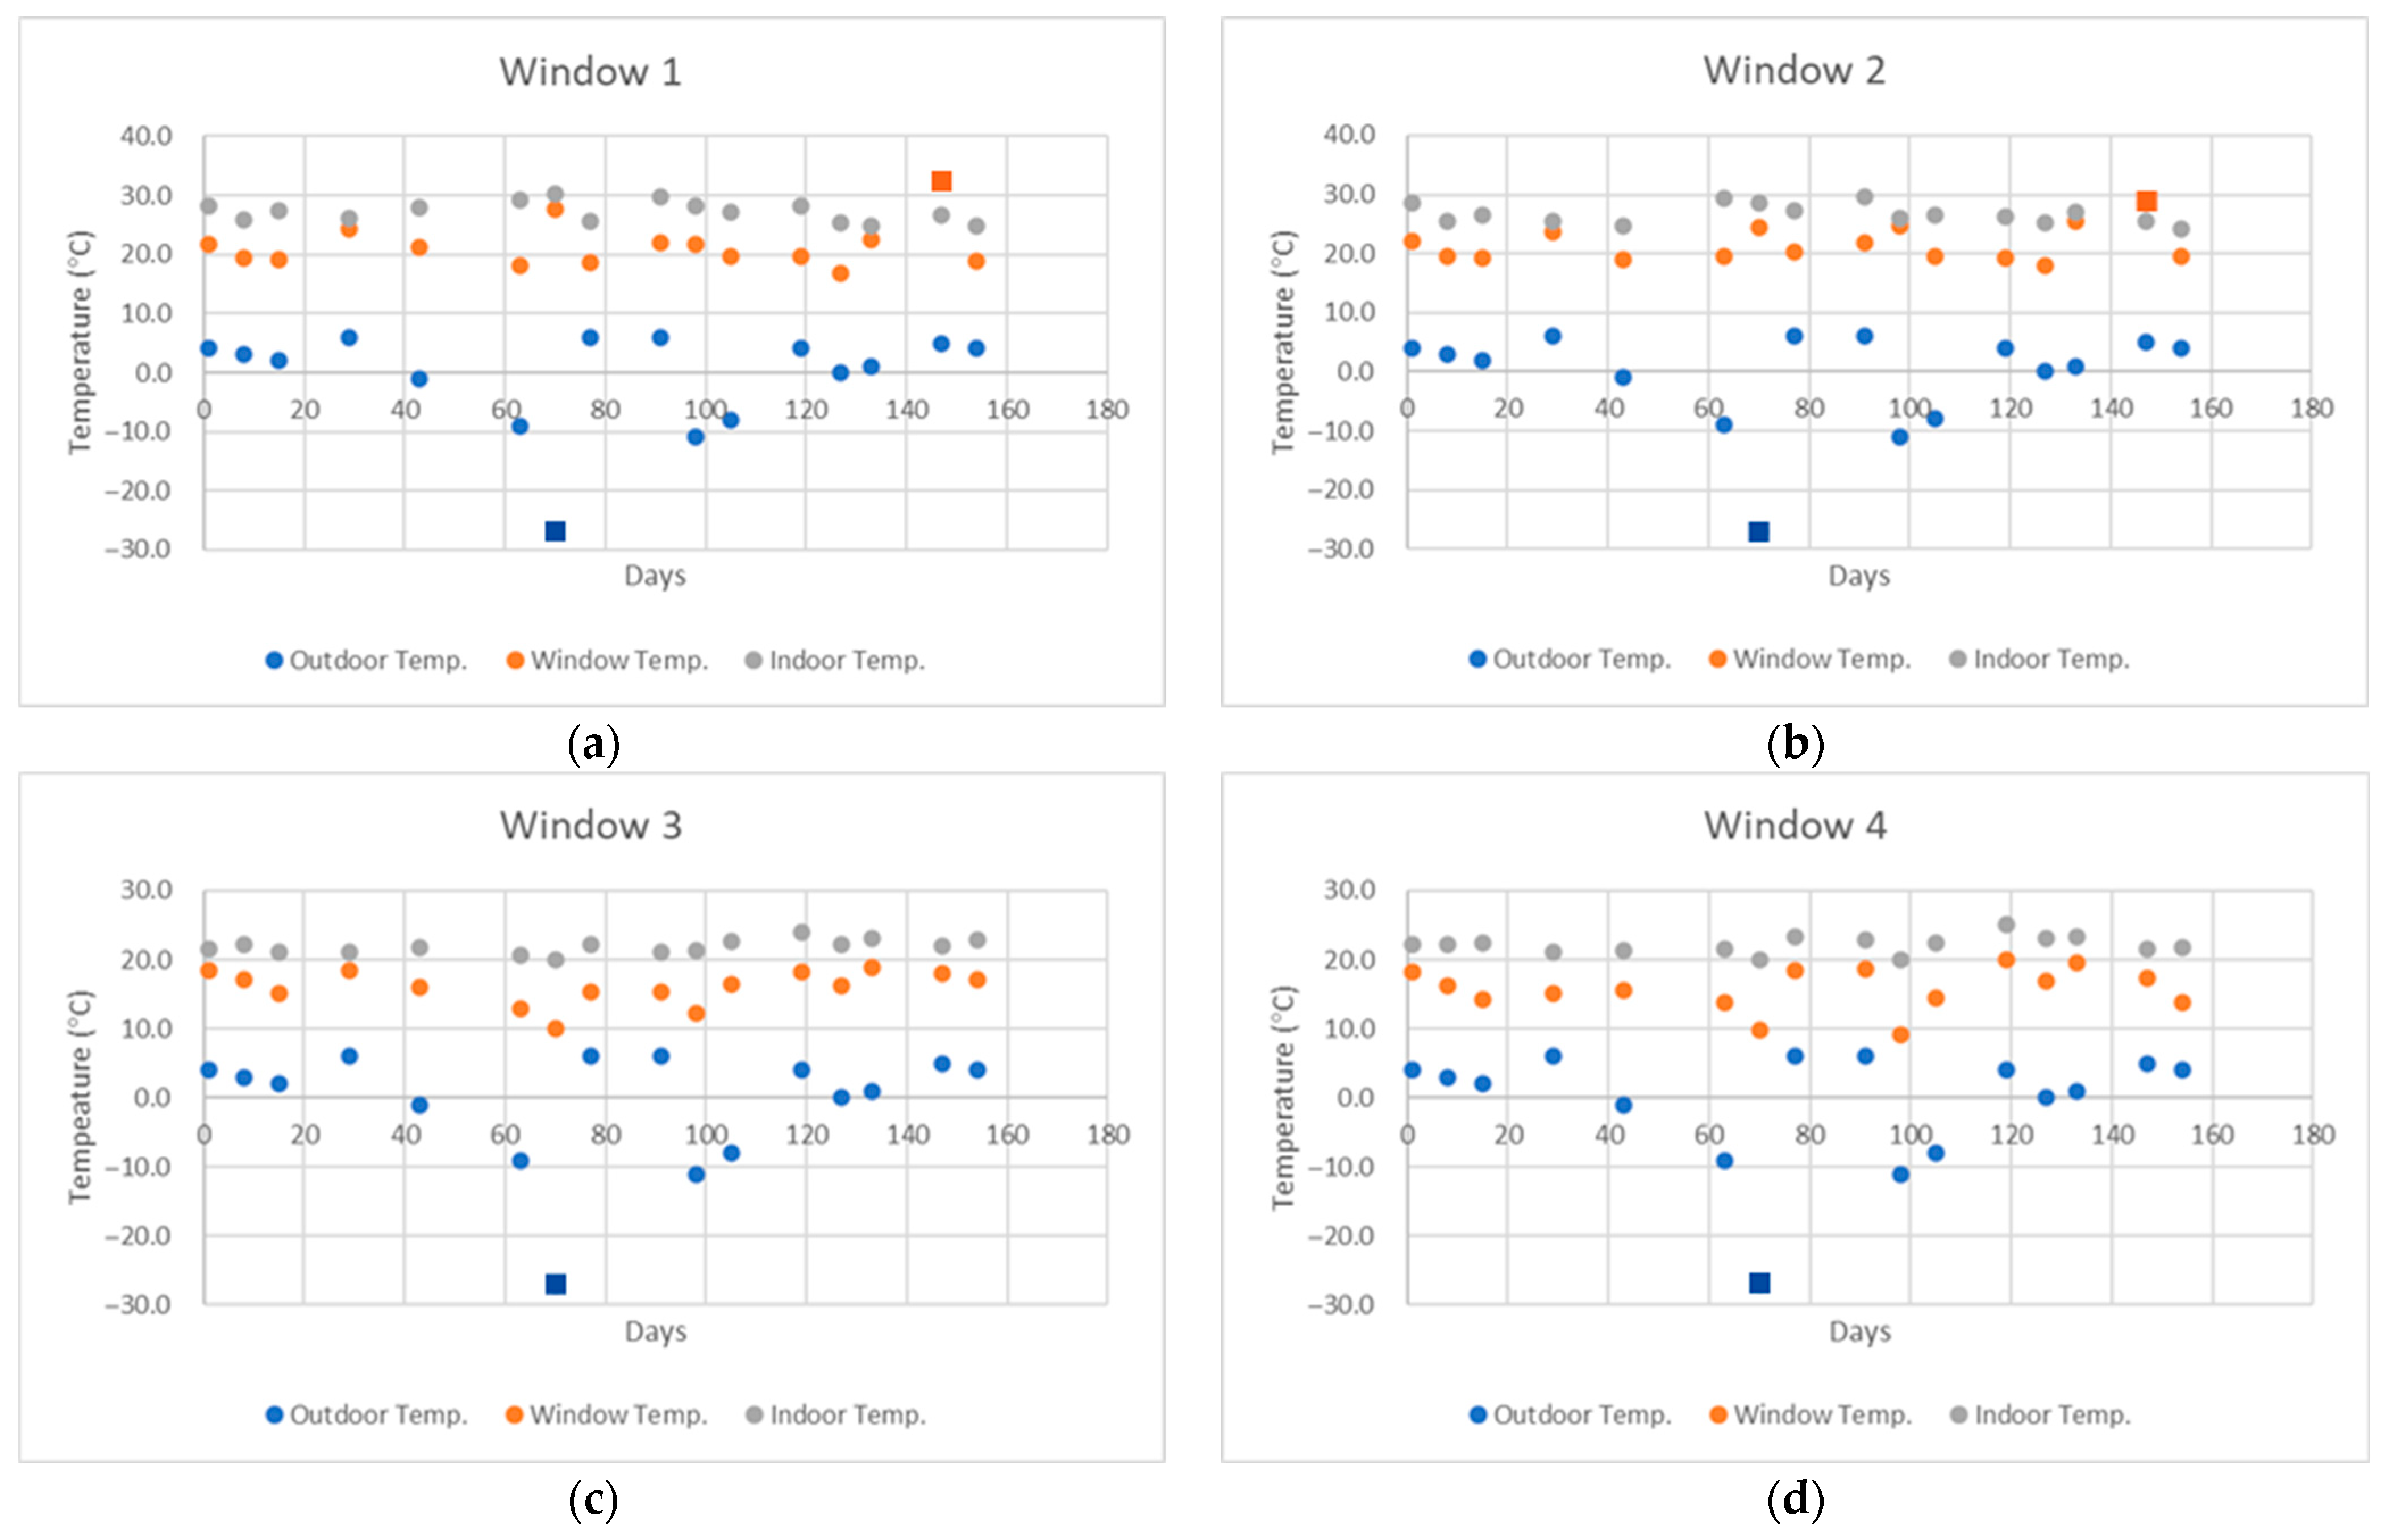
Of all the windows, the four windows of Building 1 were the most suitable for comparison on the timeline because of privacy. Building 1 is a residential building with limited access, which minimizes the possibility that irrelated people entered. Figure 5 shows the outdoor air temperature, the average temperature of the whole windowpane calculated in the FLIR Thermal Studio, and the indoor air temperature of windows 1 to 4 during this time. It can be found that the window temperature and indoor temperature increased with the increasing outdoor temperature. This is not surprising. Some outliers of the temperature are discussed below.
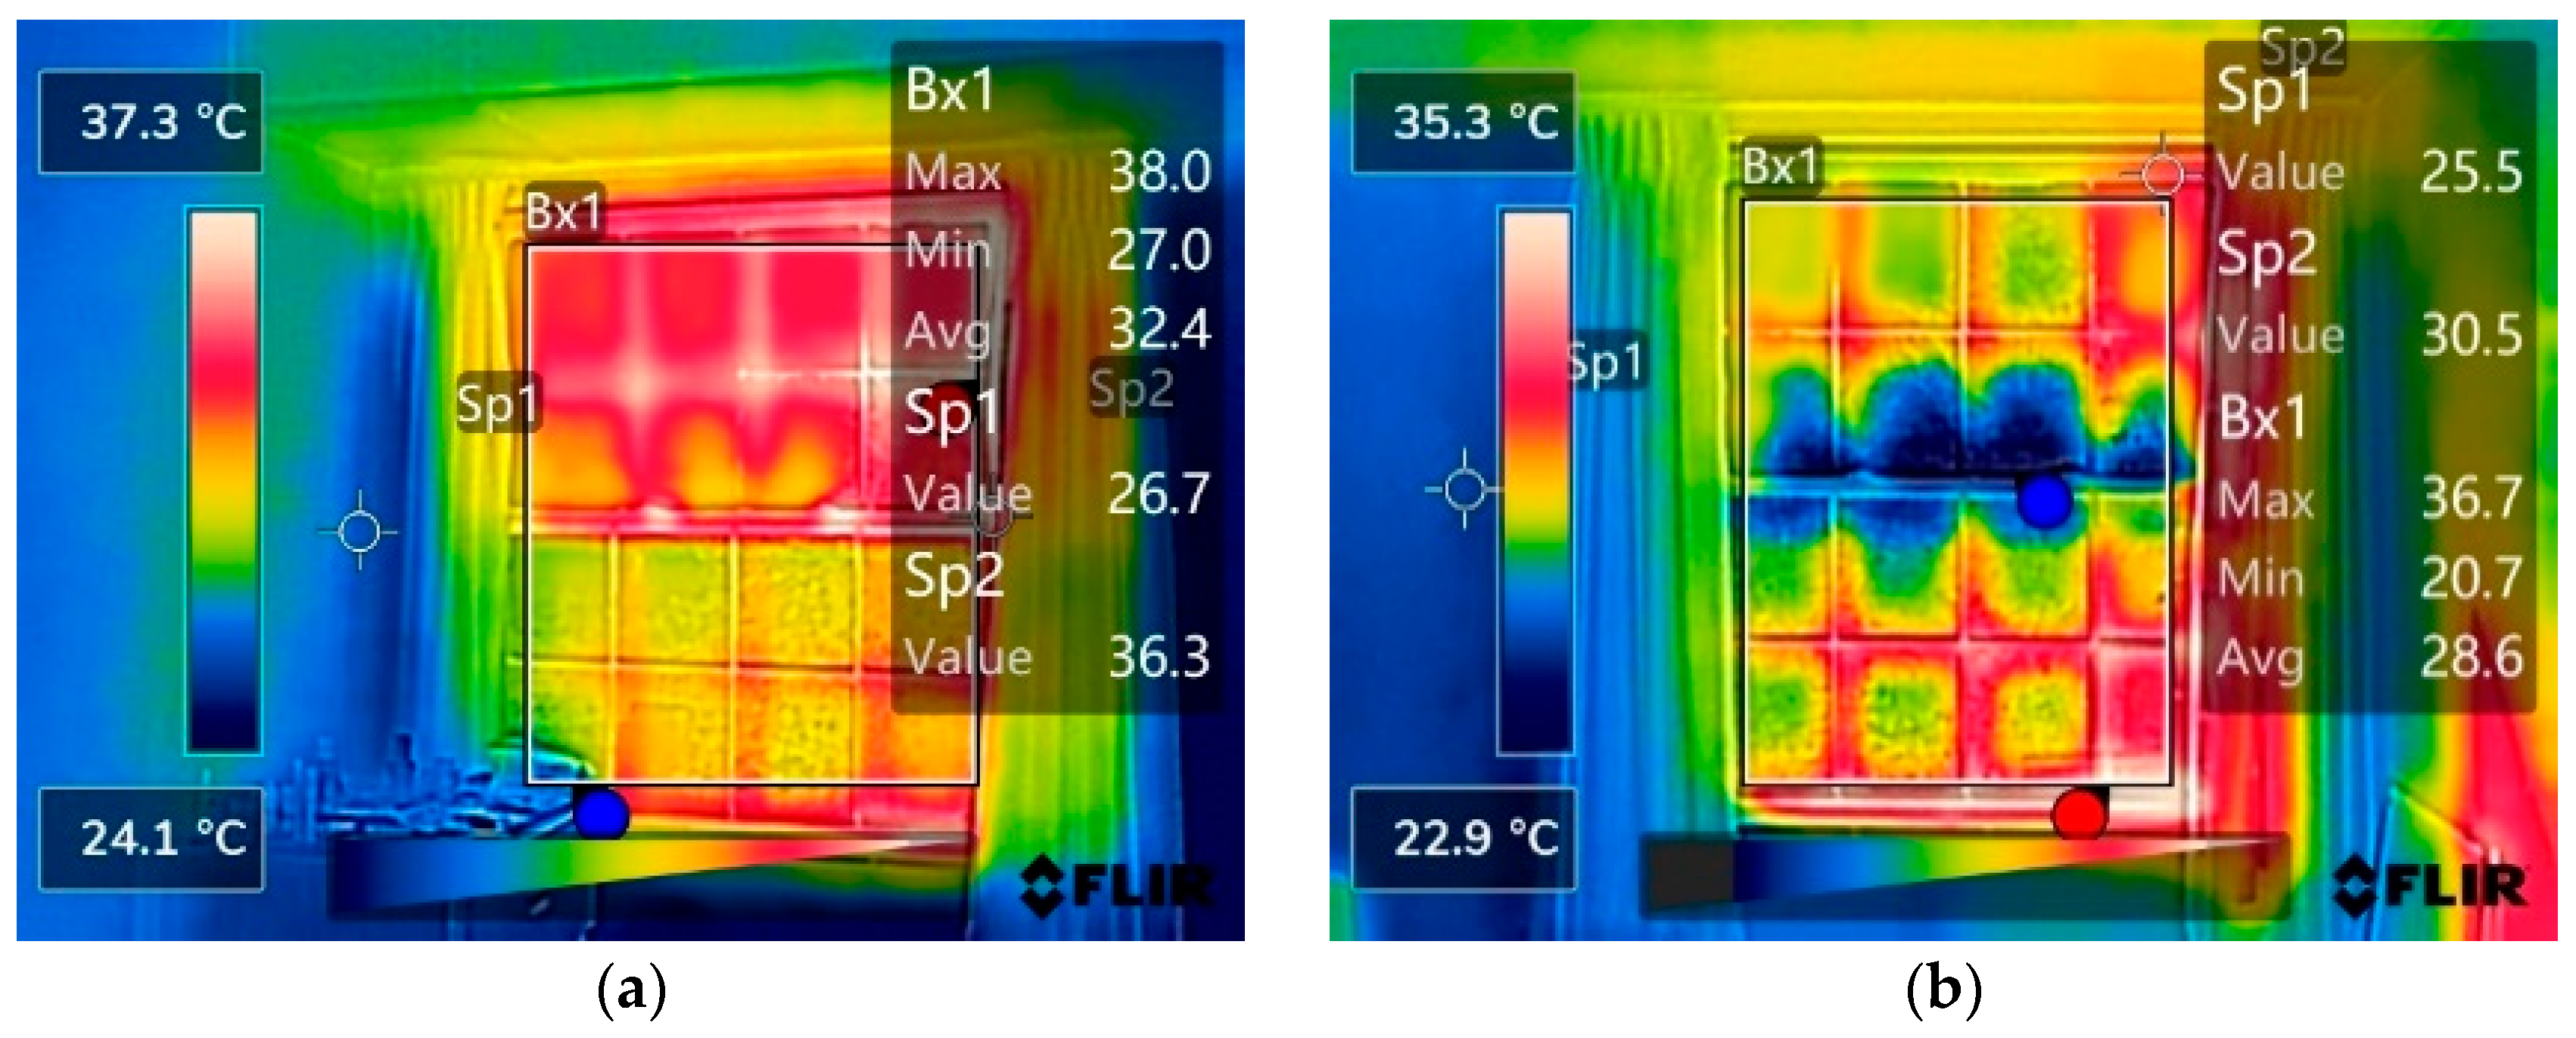
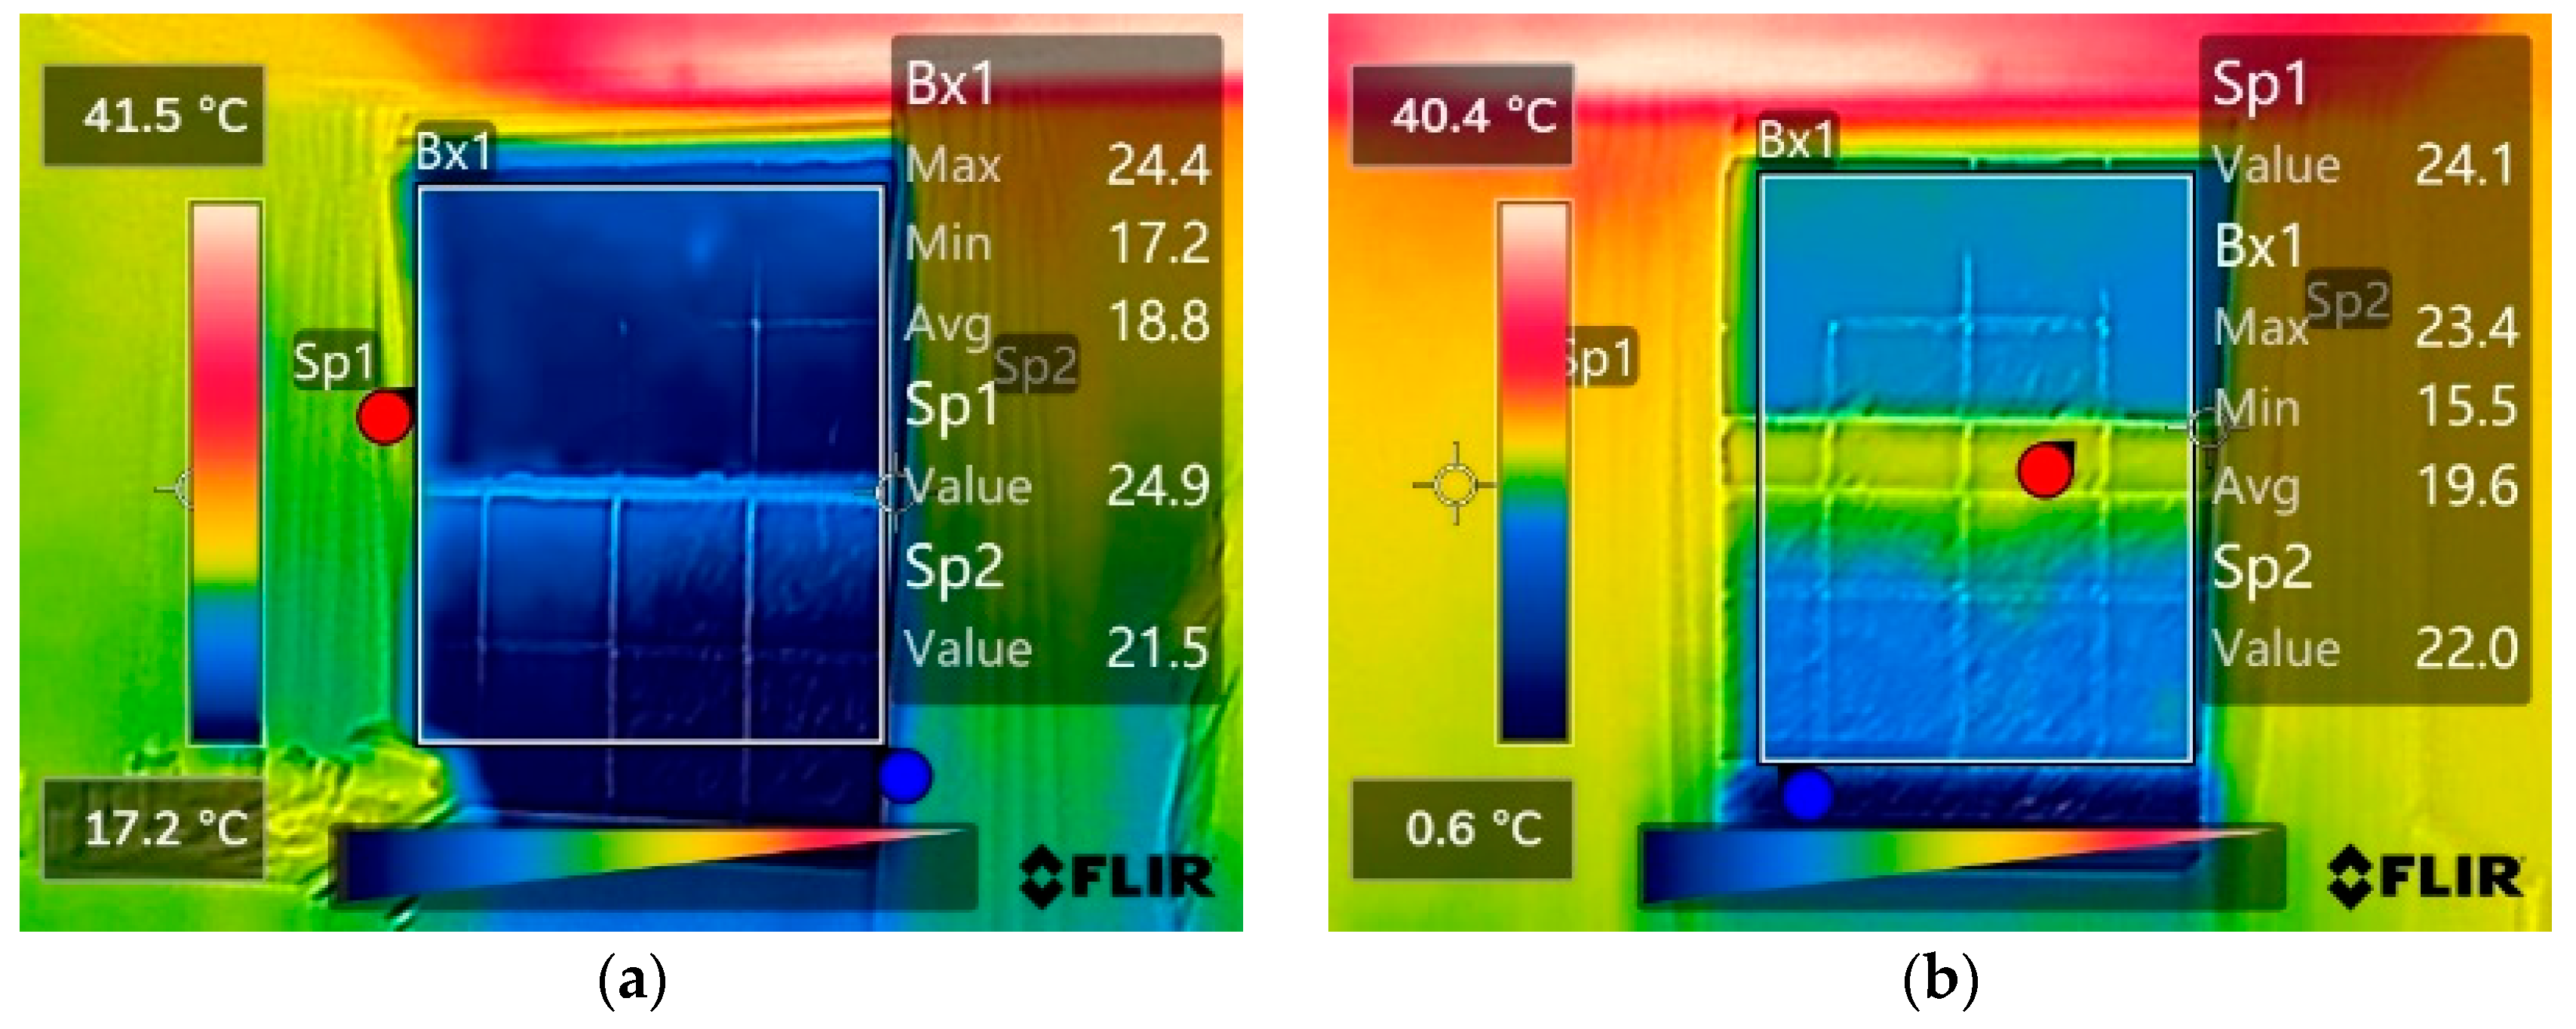
For windows 1 and 2, on day 70, the outdoor temperature was −27 °C, but the window temperature was significantly higher. It might be because the room heating was significantly adjusted at a low temperature. For the heating system in this building, a second pump came on to increase the flow of heat if the outside air was below −15 °C [18]. On day 147, the window temperature was higher than the indoor temperature and outdoor temperature; this is probably because the solar radiation was very strong, since these two windows face the southeast. The thermal image on day 147 shows that the temperature of the vinyl strips in the window had an outstanding increase (Figure 6). Figure 7 shows the normal situation of the strip temperature.

3.1.2. Heat Loss

The temperature of different windows was recorded and the data on 3 December was chosen for comparison purposes. This could be because the weather was cloudy with light rain on this day, which minimized the effect of solar radiation [24]. Also, the temperature was not too high or too low. Table 3 lists the temperatures of each window on this day, including the outdoor temperature [25], window temperature, frame temperature and wall temperature.
To compare the effect of frame materials, configurations, and the orientation of a window, the heat loss was calculated using Equation (1). Thermal conductivity for the window can be calculated by the thermal conductivity of glass and air through Equation (2), which was used to calculate the heat loss of each window. Table 4 summarizes the results.
From Table 4, some patterns can be observed. For windows 1–4, it is clear that the heat loss for windows 1 and 2 in the rooms is higher than windows 3 and 4 in the corridors, which is mainly due to the difference in room temperature and window orientation. The higher the indoor temperature is, the larger the heat loss is. For windows 13 and 14 in the same room, the east window shows a better energy efficiency than the north one, probably because of the solar radiation. However, as the heat loss was calculated from the U-factor, window area, and the temperature difference between the interior and exterior, the results are strongly affected by these three factors. For example, window 11 has a significantly larger heat loss than other windows because its area is much larger than the others. So, no appropriate conclusion for materials can be drawn from the heat loss because the conclusions are drawn among the windows of the same type to control for variables such as the U-value.
Therefore, a new parameter can be introduced here as a supplementary indicator to directly compare the window’s energy efficiency. This is because in this case study, the outdoor temperature, convection, and impact of the wind outside for different windows recorded at one time are considered as the same, while the indoor temperatures are different. If environmental conditions are identical, windows showing better thermal resistance will have a higher interior surface temperature, because it resists the heat flow more effectively. A window with high thermal resistance prevents heat from escaping from the inside to the outside, keeping the interior surface warmer. Wilson A. G. used the temperature index to calculate different surface temperatures on a window, as seen in Equation (3) [26]. The advantage of the temperature index is that values for any point are independent of the actual air temperature conditions if the surface conductance remains the same.
T = T o + I N D E X ( T i T o )
where T is the surface temperature (°C); To is the outside room temperature (°C); and Ti is the inside room temperature (°C).
In this study, to compare thermal resistance under different indoor temperatures, the ratio (φ) dividing the difference between the interior temperature and the interior surface temperature by the difference between the interior temperature and exterior temperature was introduced, as seen in Equation (4):
φ = T i T w T i T o × 100 %
where To is the outside environment temperature (°C); Ti is the inside room temperature (°C); and Tw is the average of the interior glazing surface temperature of a window (°C).
φ is used to describe the ability of the window to preserve the interior room heat based on temperature differences. The lower the φ is, the less the temperature difference between the interior windowpane and room temperature is, and the better insulation the window provides. Thus, the energy efficiency of windows can be compared. Table 5 shows the φ values of different windows.
Based on the above results and discussion, it can be summarized as follows. First, the use of wood frames in the Forestry and Geology Building shows a good insulation performance at an average of 12.58%, because the use of a wood frame can decrease the U-factor of the window. However, the vinyl frame in Building 1 did not show good insulation properties like the wood frame did, with the average φ at 33.20%, while the windows in Building 4 with an aluminum frame is 30.69% on average.
Second, the windows in the Kinesiology Building had the lowest φ, with an average of 8.09%. This verifies that the use of fixed windows and Low-E glass can greatly improve the energy efficiency of windows, even though it uses aluminum frames. This also suggests that the window frame material has less impact on the heat loss compared to the window configuration and glazing material. With less air leakage, fixed windows can reduce the air exchange through the window to a minimum level, showing good energy efficiency. This result is also in agreement with Fasi [27], who found that a 14% reduction in total building energy consumption was obtained with daylight integration for the double-glazed clear glass windows, and a 16% reduction was obtained for double-glazed Low-E windows. The use of Low-E glass could help improve the energy efficiency of windows. By coating the glass surface with multiple layers of metal or other compounds, the coating layer has the characteristics of high transmission of visible light and high reflection of middle- and far-infrared rays, which makes it have excellent heat insulation and good light transmission compared with ordinary glass.
Third, the windows facing east had the best performance in energy efficiency in the winter. For windows in the same room, such as windows 5 and 6, windows 7 and 8, and windows 16 and 17, the east direction showed the lowest φ, suggesting more energy efficiency. But for windows 13 and 14 in office 208, the window facing the west had a higher φ than the window facing north. It might be because the areas for extracting the temperature of the two windows were not the same, which led to the measurement error of the window temperature of the east window, as seen in Figure 8.

3.1.3. Other Findings

Comparing windows 10 and 11, the larger glazing system shows worse ability to keep the indoor temperature, which results in a higher heating load. It does not look consistent with Elghamry’s finding that increasing the Window–Wall Ratio (WWR) increases the cooling load, interior temperature, energy consumption, and cost and decreases the lighting and heating loads [14]. That is because her research is based on the evaluation of energy performance in New Borg El-Arab City, Alexandria, Egypt, which has much more sunshine and smaller indoor/outdoor temperature differences than Fredericton in the winter. In another study on two Multi-Unit Residential Buildings (MURBs) in Toronto, Taileb et al. provided similar findings that reducing window areas by 20% and 30% resulted in approximately 9% of energy savings [28]. This points out that the best WWR can be different (even opposite) for different locations, and window design should always consider the location’s climate. For cold climates, the heat gain of solar radiation cannot compensate for the heat loss caused by a large window area and temperature difference.

3.2. Implications

The results did not agree with the findings by Gasparella et al. [7], who discovered that the windows facing the south showed the best performance in energy efficiency. In their study, the east and west directions were, based on the measurements of the full day, discussed together as an average compared to the south and north separately. In this case study, the images were taken at 10 a.m., which could cause some differences due to the sunrise every day from the east. As lower temperatures inside the building by 2 °C reduce heat losses by 10.6% [5], these two findings contribute a good understanding of how the orientation of a window affects the energy efficiency of the window, which may provide some insights into adjusting different heating temperature settings for windows facing different directions from the morning to afternoon and pave a path for further research in this field.
The energy efficiency of windows plays a critical role in energy saving. The use of Low-E glass was found to be remarkable in terms of the improvement of thermal insulation in a building. Since 1990, the use of Low-E glass has been increasing at an annual rate of 5% in the United States [3]. This study further verified that increasing the use of Low-E glass is beneficial to energy saving and the further protection of the environment. At the same time, reasonable control of indoor temperatures and the use of curtains can also be beneficial to the reduction in electricity bills.

4. Conclusions

This study assessed the energy efficiency of windows in cold-climate institutional and residential buildings. Key findings include the following:
  • The temperature distribution of a window was influenced by the indoor and outdoor temperature of a room, which affected the heat consumption of a window. The larger the temperature difference was, the higher the heat loss was. Setting an appropriate room heating temperature could reduce the heat loss of the window.
  • The performance of wooden-framed windows in older buildings generally exceeds that of metal-framed windows in newer buildings with regard to thermal insulation.
  • Fixed windows had a better energy performance than sliding windows and single-hung windows, controlling the air leakage well.
  • In winter, the windows which face east had a significantly better energy efficiency than other directions in the morning in a cold climate.
  • Increasing the WWR was not good for saving the winter heating load in a cold climate, which was different from the results from a hot climate.
  • Using Low-E glazing could greatly improve the energy efficiency of a window. In cold areas like Fredericton, Canada, it was necessary to use Low-E glazing for the window.
Limitations include a restricted sample of sliding windows, lack of consideration for solar radiation and window frame heat loss, and uncertainty when measuring the temperature in the software. Future work will expand the dataset, perform an uncertainty analysis, and incorporate solar gain modeling. Overall, this study not only confirms the established principles but also introduces new cold-climate insights, strengthening the knowledge base for energy-efficient construction.

Supplementary Materials

The following supporting information can be downloaded at: https://www.mdpi.com/article/10.3390/buildings15193478/s1.

Author Contributions

M.G. provided critical supervision, reviewed the manuscript, and contributed to refining the methodology and the validation of the results. X.Q. was responsible for data curation, formal analysis, and writing the original draft, and A.K. provided feedback during the drafting and revision process. All authors have read and agreed to the published version of the manuscript.

Funding

This research was partially supported by the New Brunswick Innovation Research Chair Initiative, New Brunswick Innovation Foundation, Canada.

Data Availability Statement

All the data used in this article can be provided by contacting the authors.

Conflicts of Interest

The authors declare no conflicts of interest.

Abbreviations

The following abbreviations are used in this manuscript:
ARAnti-Reflection
ASHRAEAmerican Society of Heating, Refrigerating and Air-conditioning Engineers
EAWEnergy-Active Window
EDElectric-Driven
HLHeat Loss, W
LFALaser Flash Apparatus
NFRCNational Fenestration Rating Council
OGIOptical Gas Imaging
PVCPolyvinyl Chloride
RThermal Resistance, (m2·K)/W
RANSReynolds Averaged Navier–Stokes
TTemperature, °C
UU-value, W/(m2·K)
UASUnmanned Aircraft Systems

References

  1. International Energy Agency. Global Energy Review 2020. Available online: https://www.iea.org/reports/global-energy-review-2020 (accessed on 1 July 2023).
  2. Green, M. Why We Should Build Wooden Skyscrapers. Available online: https://www.youtube.com/watch?v=Xi_PD5aZT7Q (accessed on 1 July 2023).
  3. Building Technologies Program (U.S.). Window Selection: Modern Windows Provide Energy Savings, Durability, and Comfort; Technology Fact Sheet; Building Technologies Program, Office of Energy Efficiency and Renewable Energy, U.S. Department of Energy: Washington, DC, USA, 2003. [Google Scholar]
  4. American Window Company. What Is a Thermal Break in Windows? Available online: https://www.americanwindowcompany.com/what-is-a-thermal-break-in-a-window/ (accessed on 10 September 2025).
  5. Kowalczyk, Z.; Tomasik, M. Economic and Energy Analysis of the Operation of Windows in Residential Buildings in Poland. Energies 2023, 16, 6810. [Google Scholar] [CrossRef]
  6. Shen, X.; Wang, W.; Chen, L.; Zhang, Y. Influences of Glass Layers on Thermal Performance of Windows. Build. Energy Effic. 2017, 2, 61–65. [Google Scholar] [CrossRef]
  7. Gasparella, A.; Pernigotto, G.; Cappelletti, F.; Romagnoni, P.; Baggio, P. Analysis and modelling of window and glazing systems energy performance for a well-insulated residential building. Energy Build. 2011, 43, 1030–1037. [Google Scholar] [CrossRef]
  8. Carpenter Stephen, C.; Elmahdy, A.H. Thermal performance of complex fenestration systems. ASHRAE Trans. 1994, 100, 1179–1186. [Google Scholar]
  9. Gorgolis, G.; Karamanis, D. Solar energy materials for glazing technologies. Sol. Energy Mater. Sol. Cells 2016, 144, 559–578. [Google Scholar] [CrossRef]
  10. Roos, A. Visual and energy performance of switchable windows with antireflection coatings. Sol. Energy 2010, 84, 1370–1375. [Google Scholar] [CrossRef]
  11. Nourozi, B.; Ploskić, A.; Chen, Y.; Chui, N.W.; Wang, J.; Wang, Q. Heat transfer model for energy-active windows—An evaluation of efficient reuse of waste heat in buildings. Renew. Energy 2020, 162, 2318–2329. [Google Scholar] [CrossRef]
  12. Arıcı, M.; Karabay, H.; Kan, M. Flow and heat transfer in double, triple and quadruple pane windows. Energy Build. 2015, 86, 394–402. [Google Scholar] [CrossRef]
  13. Arıcı, M.; Kan, M. An investigation of flow and conjugate heat transfer in multiple pane windows with respect to gap width, emissivity and gas filling. Renew. Energy 2015, 75, 249–256. [Google Scholar] [CrossRef]
  14. Elghamry, R.; Hassan, H. Impact of window parameters on the building envelope on the thermal comfort, energy consumption and cost and environment. Int. J. Vent. 2020, 19, 233–259. [Google Scholar] [CrossRef]
  15. Timeanddate. Past Weather in Fredericton. Available online: www.timeanddate.com/weather/canada/fredericton/historic (accessed on 1 July 2023).
  16. Government of Canada. Historical Data. Available online: https://climate.weather.gc.ca/historical_data/search_historic_data_e.html (accessed on 1 September 2025).
  17. University of New Brunswick. University Tour. Available online: https://unb.university-tour.com/fredericton-campus# (accessed on 1 September 2025).
  18. UNB Department of Facilities Management (The University of New Brunswick (UNB), Fredericton, NB, Canada). Personal communication, 2022.
  19. FLIR C2 Description. FLIR. Available online: www.flir.com (accessed on 1 July 2023).
  20. Lechner, N. Heating, Cooling, Lighting: Sustainable Design Methods for Architects, 4th ed.; John Wiley & Sons: Hoboken, NJ, USA, 2015. [Google Scholar]
  21. Rubin, M. Calculating heat transfer through windows. Energy Res. 1982, 6, 341–349. [Google Scholar] [CrossRef]
  22. Building Material R-Values. Available online: https://efficiencymatrix.com/building-material-r-values/ (accessed on 1 July 2023).
  23. ASHRAE. ASHRAE Handbook—Fundamentals; American Society of Heating, Refrigerating and Air-Conditioning Engineers: Atlanta, GA, USA, 2017. [Google Scholar]
  24. Șerban, S.E.; Catalina, T.; Popescu, R.; Popescu, L. The Intersection of Architectural Conservation and Energy Efficiency: A Case Study of Romanian Heritage Buildings. Appl. Sci. 2024, 14, 4835. [Google Scholar] [CrossRef]
  25. Timeanddate. December 2021 Weather in Fredericton. Available online: https://www.timeanddate.com/weather/canada/fredericton/historic?month=12&year=2021 (accessed on 1 July 2023).
  26. Wilson, A.G.; Brown, W.P. Thermal Characteristics of Double Windows; Division of Building Research, National Research Council of Canada: Ottawa, ON, Canada, 1964. [Google Scholar] [CrossRef]
  27. Fasi, M.A.; Budaiwi, I.M. Energy performance of windows in office buildings considering daylight integration and visual comfort in hot climates. Energy Build. 2015, 108, 307–316. [Google Scholar] [CrossRef]
  28. Taileb, A.; Sherzad, M.F. Energy Audits and Energy Modeling as a Tool towards Reducing Energy Consumption in Buildings: The Cases of Two Multi-Unit Residential Buildings (MURBs) in Toronto. Sustainability 2023, 15, 13983. [Google Scholar] [CrossRef]
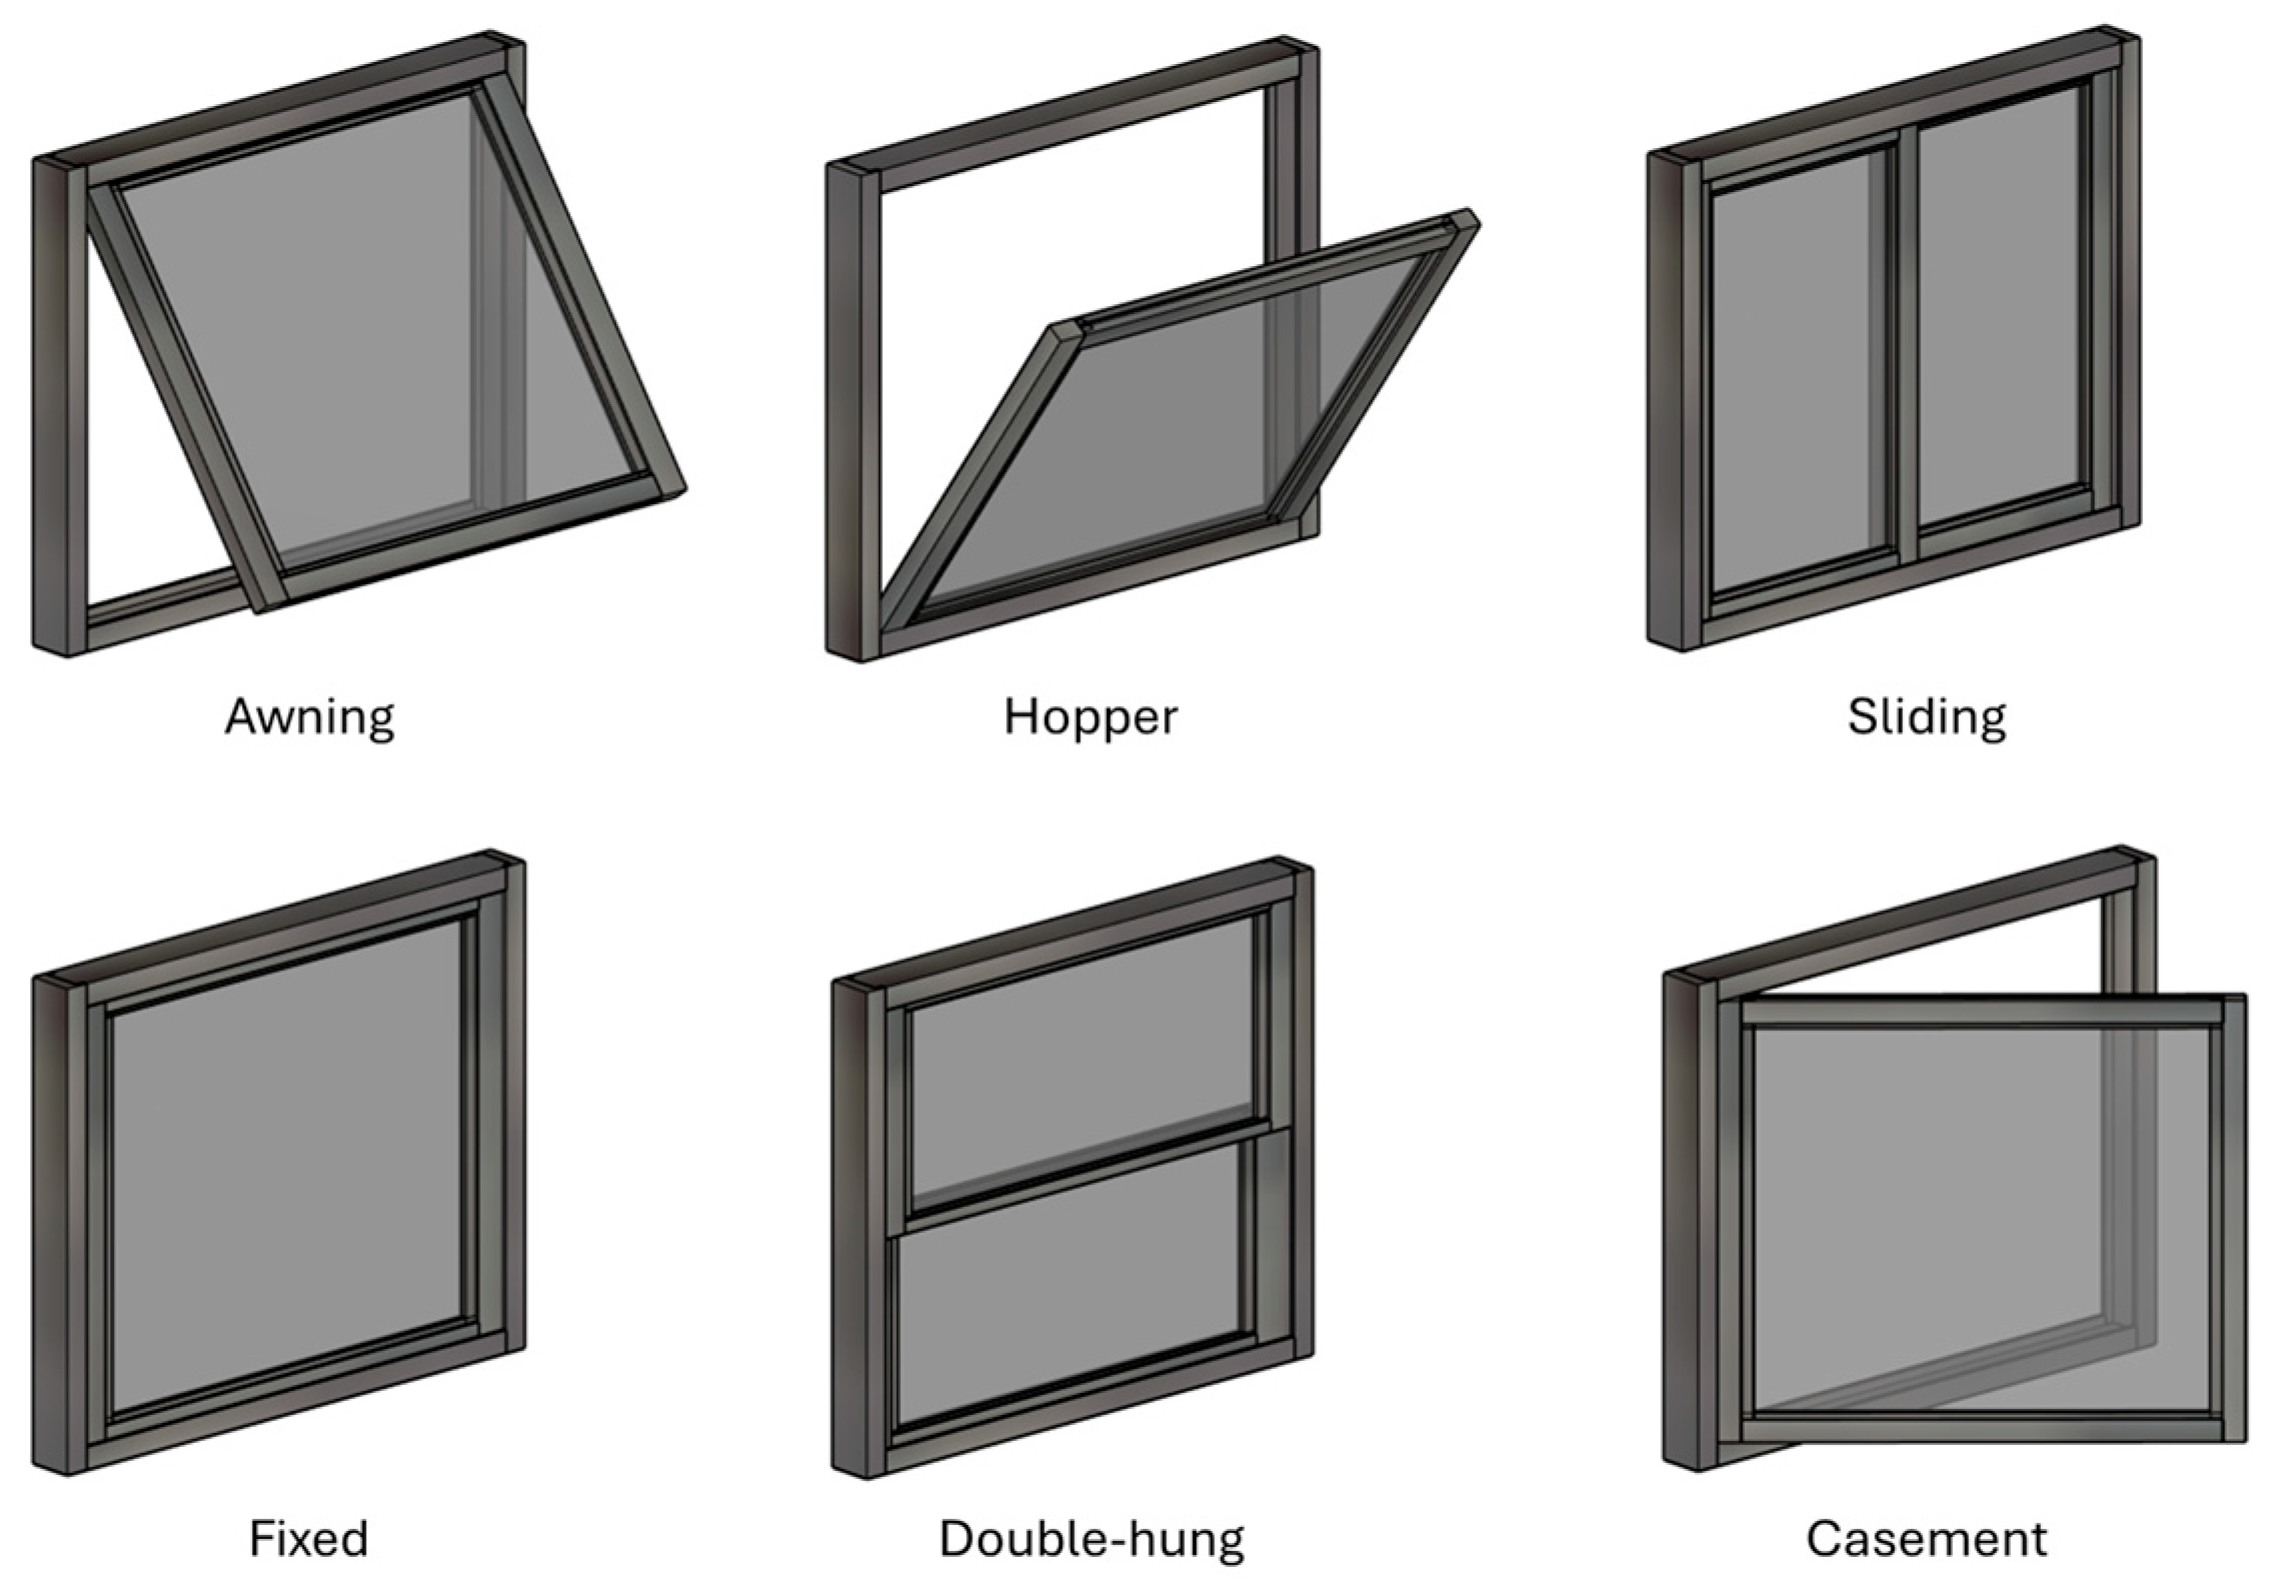
Figure 1. Window types.
Buildings 15 03478 g001
Figure 2. EAW construction [11].
Buildings 15 03478 g002
Figure 3. Buildings shown in University of New Brunswick campus map [17].
Buildings 15 03478 g003
Figure 4. Extraction of the temperatures around a window: (a) raw image; (b) processed image.
Buildings 15 03478 g004
Figure 5. Temperature recorded during the timeline of measurement: (a) window 1; (b) window 2; (c) window 3; and (d) window 4.
Buildings 15 03478 g005
Figure 6. Temperature increases in strips on day 147: (a) window 1; (b) window 2.
Buildings 15 03478 g006
Figure 7. Typical temperature distribution on day 154: (a) window 1; (b) window 2.
Buildings 15 03478 g007
Figure 8. Areas for extracting temperature of the two windows: (a) window 14 facing east; (b) window 13 facing north.
Buildings 15 03478 g008
Table 1. Information on selected windows.
BuildingNo.LocationSizesDir.MaterialsType
Width (m)Height (m)Area (m2)
1. Elizabeth Parr-Johnston Residence1Bedroom1.2191.3721.672SEVinylSingle-hung
2Living room1.2191.3721.672SEVinylSingle-hung
3Corridor1.2191.3721.672SWVinylSingle-hung
4Corridor1.2191.3721.672NWVinylSingle-hung
2. Kinesiology Building5Classroom 2011.5002.2003.300EAl.Fixed
6Classroom 2011.5002.2003.300SAl.Fixed
7Public area1.5002.2003.300EAl.Fixed
8Public area1.5002.2003.300NAl.Fixed
3. Forestry and Geology
Building
9Office FG3072.0831.9814.126SEWoodSingle-hung
102nd floor1.1432.1342.439SEWoodSingle-hung
111st floor3.0002.1406.420SEWoodSingle-hung
4. I.U.C. Forestry Building12Office 219A1.5241.6262.478SAl.Awning
13Office 2081.5241.6262.478NAl.Awning
14Office 2081.5241.6262.478EAl.Awning
15Classroom 3151.5241.6262.478WAl.Sliding
16Bridge0.6101.9811.208EAl.Fixed
17Bridge0.6101.9811.208WAl.Fixed
Table 2. U-factor of sample windows (3 ft wide by 5 ft high) in ASHRAE Handbook [23].
Aluminum Frame w/o Thermal BreakAluminum Frame with Thermal BreakWood or Vinyl Frame
Single glass1.301.07n/a
Double glass, ½” air space0.810.620.48
Double glass, Low-E, (E * = 0.2), and ½” air space0.700.520.39
Double glass, Low-E, (E * = 0.1), and ½” air space0.670.490.37
Double glass, Low-E, (E * = 0.2), and ½” space with argon0.640.460.34
Triple glass, Low-E, on two panes, and ½” paces with argon0.530.360.23
Quadruple glass, Low-E (E * = 0.1) on two panes, and ¼” spaces with kryptonn/an/a0.22
* E is the emittance of the low-E coated surface.
Table 3. Temperatures of the windows examined on 3 December.
BuildingNo.LocationWindow Temp. (°C)Indoor Temp.
(°C)
Frame Temp.
(°C)
Max.Min.Avg.
1. Elizabeth Parr-Johnston Residence1Bedroom21.915.519.227.320.5
2Living room21.914.619.326.623.6
3Corridor19.313.315.121.115.2
4Corridor16.97.814.322.415.4
2. Kinesiology Building5Classroom 20118.415.217.518.516.7
6Classroom 20118.114.916.720.115.5
7Public area20.813.817.918.717.0
8Public area21.017.919.820.919.0
3. Forestry and Geology Building9Office FG30716.313.915.016.815.6
102nd floor18.416.817.519.318.8
111st floor22.418.119.923.122.5
4. I.U.C. Forestry Building12Office 219A14.25.512.420.313.2
13Office 20819.915.918.321.318.8
14Office 20818.414.916.020.716.7
15Classroom 31515.48.413.118.612.1
16Bridge11.47.49.011.68.7
17Bridge9.73.27.511.76.2
Table 4. Heat loss and window information on 3 December.
BuildingNo.LocationDir.MaterialsWindow
Configuration
Heat Loss (W)Heat Loss/Area (W/m2)
1. Elizabeth Parr-Johnston Residence1BedroomSEVinylSingle-hung13.818.26
2Living roomSEVinylSingle-hung13.898.30
3CorridorSWVinylSingle-hung10.526.29
4CorridorNWVinylSingle-hung9.875.90
2. Kinesiology Building5Classroom 201EAl.Fixed25.067.60
6Classroom 201SAl.Fixed23.777.20
7Public areaEAl.Fixed25.717.79
8Public areaNAl.Fixed28.788.72
3. Forestry and Geology Building9Office FG307SEWoodSingle-hung25.756.24
102nd floorSEWoodSingle-hung18.157.44
111st floorSEWoodSingle-hung55.168.59
4. I.U.C. Forestry Building12Office 219ASAl.Awning17.276.97
13Office 208NAl.Awning27.0610.92
14Office 208EAl.Awning24.249.78
15Classroom 315WAl.Sliding18.437.44
16BridgeEAl.Fixed5.674.69
17BridgeWAl.Fixed4.453.69
Table 5. Ratio φ of windows on 3 December.
BuildingNo.LocationDir.MaterialsWindow
Configuration
Area (m2)H/W Ratioφ
1. Elizabeth Parr-Johnston Residence1BedroomSEVinylSingle-hung1.6721.1332.02%
2Living roomSEVinylSingle-hung1.6721.1329.67%
3CorridorSWVinylSingle-hung1.6721.1331.41%
4CorridorNWVinylSingle-hung1.6721.1339.71%
2. Kinesiology Building5Classroom 201EAl.Fixed3.3001.476.06%
6Classroom 201SAl.Fixed3.3001.4718.78%
7Public areaEAl.Fixed3.3001.474.79%
8Public areaNAl.Fixed3.3001.475.82%
3. Forestry and Geology Building9Office FG307SEWoodSingle-hung4.1260.9512.16%
102nd floorSEWoodSingle-hung2.4391.8710.40%
111st floorSEWoodSingle-hung6.4200.7115.17%
4. I.U.C. Forestry Building12Office 219ASAl.Awning2.4781.0743.17%
13Office 208NAl.Awning2.4781.0715.54%
14Office 208EAl.Awning2.4781.0725.13%
15Classroom 315WAl.Sliding2.4781.0733.13%
16BridgeEAl.Fixed1.2083.2527.08%
17BridgeWAl.Fixed1.2083.2543.30%
Disclaimer/Publisher’s Note: The statements, opinions and data contained in all publications are solely those of the individual author(s) and contributor(s) and not of MDPI and/or the editor(s). MDPI and/or the editor(s) disclaim responsibility for any injury to people or property resulting from any ideas, methods, instructions or products referred to in the content.