1. Introduction
Sports venues serve as multifunctional facilities for competitions, training, and public events. The lighting environment within these spaces significantly influences both broadcast quality and the visual experience of athletes and spectators. Natural light offers notable advantages, including health benefits, the absence of stroboscopic effects, and high color rendering. During non-event hours, introducing daylight enhances visual comfort and reduces lighting energy consumption. Light pipes provide an effective means of channeling external natural light indoors, overcoming limitations associated with conventional windows—such as limited coverage, non-uniform illumination, and glare. Their application has expanded across various building types in recent years [
1,
2,
3,
4].
The selection and configuration of light pipe systems directly affect indoor illuminance distribution. Due to their high ceilings and unique structural features, sports venues are subject to specific lighting standards [
5,
6] that differ from those of conventional buildings. Thus, dedicated research on the optimization of light pipe system design and placement is essential. Moreover, to address the variability of natural light, we propose a collaborative control strategy between light pipe and artificial lighting systems to maintain lighting performance while improving energy efficiency.
Recent studies have explored energy-saving applications of light pipe systems in buildings. Verso et al. [
7] evaluated daylight performance based on transmission efficiency, facilitating an informed placement of light pipes. Other studies demonstrated significant energy savings when combining light pipes with artificial lighting in gymnasiums and underground structures, with annual energy reductions of 2514 kWh and 22,186 kWh, respectively [
8]. Another comparison revealed that energy equivalence between natural and artificial light under varying weather conditions led to average savings of 70–560 Wh [
9]. Research in Beijing [
10] and India [
11] further confirmed the annual energy-saving potential and practicality of light pipe systems, with reported savings between 16% and 50% on sunny days. Despite these advances, existing studies have largely focused on conventional buildings [
12].
In smaller spaces, light pipe placement is relatively straightforward, and research emphasis has been on parameter selection. In contrast, large facilities such as sports venues require numerous light pipes, necessitating optimized placement and specification—a challenge yet to be thoroughly addressed. This study focuses on sports venues due to their scale, stringent illuminance and uniformity requirements, and complex lighting design demands. We aim to develop a practical framework for the design and optimization of light pipe systems in such environments.
Daylighting performance of light pipes is commonly assessed using the daylight penetration factor (DPF) and transmission efficiency [
13,
14,
15,
16,
17]. DPF measures the ratio of indoor illuminance at a reference point to external illuminance. Although useful, DPF alone cannot evaluate overall work plane illumination [
18,
19,
20,
21]. Transmission efficiency, defined as the ratio of output to input luminous flux, serves as another critical metric. Previous research [
22,
23,
24,
25,
26] introduced design methods based on transmission efficiency, including predictions of the number of light pipes required. To estimate illuminance distribution, the point-source method—applied widely in artificial lighting design—can be employed by treating the diffuser as a point source. Software such as HOLIGILM supports the modeling of sky conditions and system parameters, enabling the derivation of transmission efficiency and luminous intensity distributions [
27]. This allows light pipes to be designed using luminaire design principles.
Due to the instability of natural light, artificial lighting remains essential [
28,
29,
30,
31]. Its design involves determining luminaire positions and types, often with the aid of software such as DIALux evo, which has been used to optimize lighting in venues like sports halls. However, such simulations are time-consuming and experience-dependent, often falling short of achieving fully optimized solutions, especially in large venues with stringent standards and numerous luminaires. Recent efforts have incorporated optimization algorithms to improve artificial lighting design for sports venues [
32,
33,
34].
Natural light is suitable for daily training sessions, though illuminance stability demands often require supplemental artificial lighting. An integrated control strategy is essential to minimize energy use—activating artificial lighting only when necessary and adjusting based on available daylight [
35,
36,
37,
38,
39]. However, current methods lack effective solutions for the coordinated control of hybrid systems in complex venues [
40]. This study introduces optimized design and control methods for integrated light pipe and artificial lighting systems in sports venues. To our knowledge, it is the first to address the design, optimization, and control of light pipe systems in such contexts, with the goal of ensuring compliance with illuminance standards while reducing energy consumption.
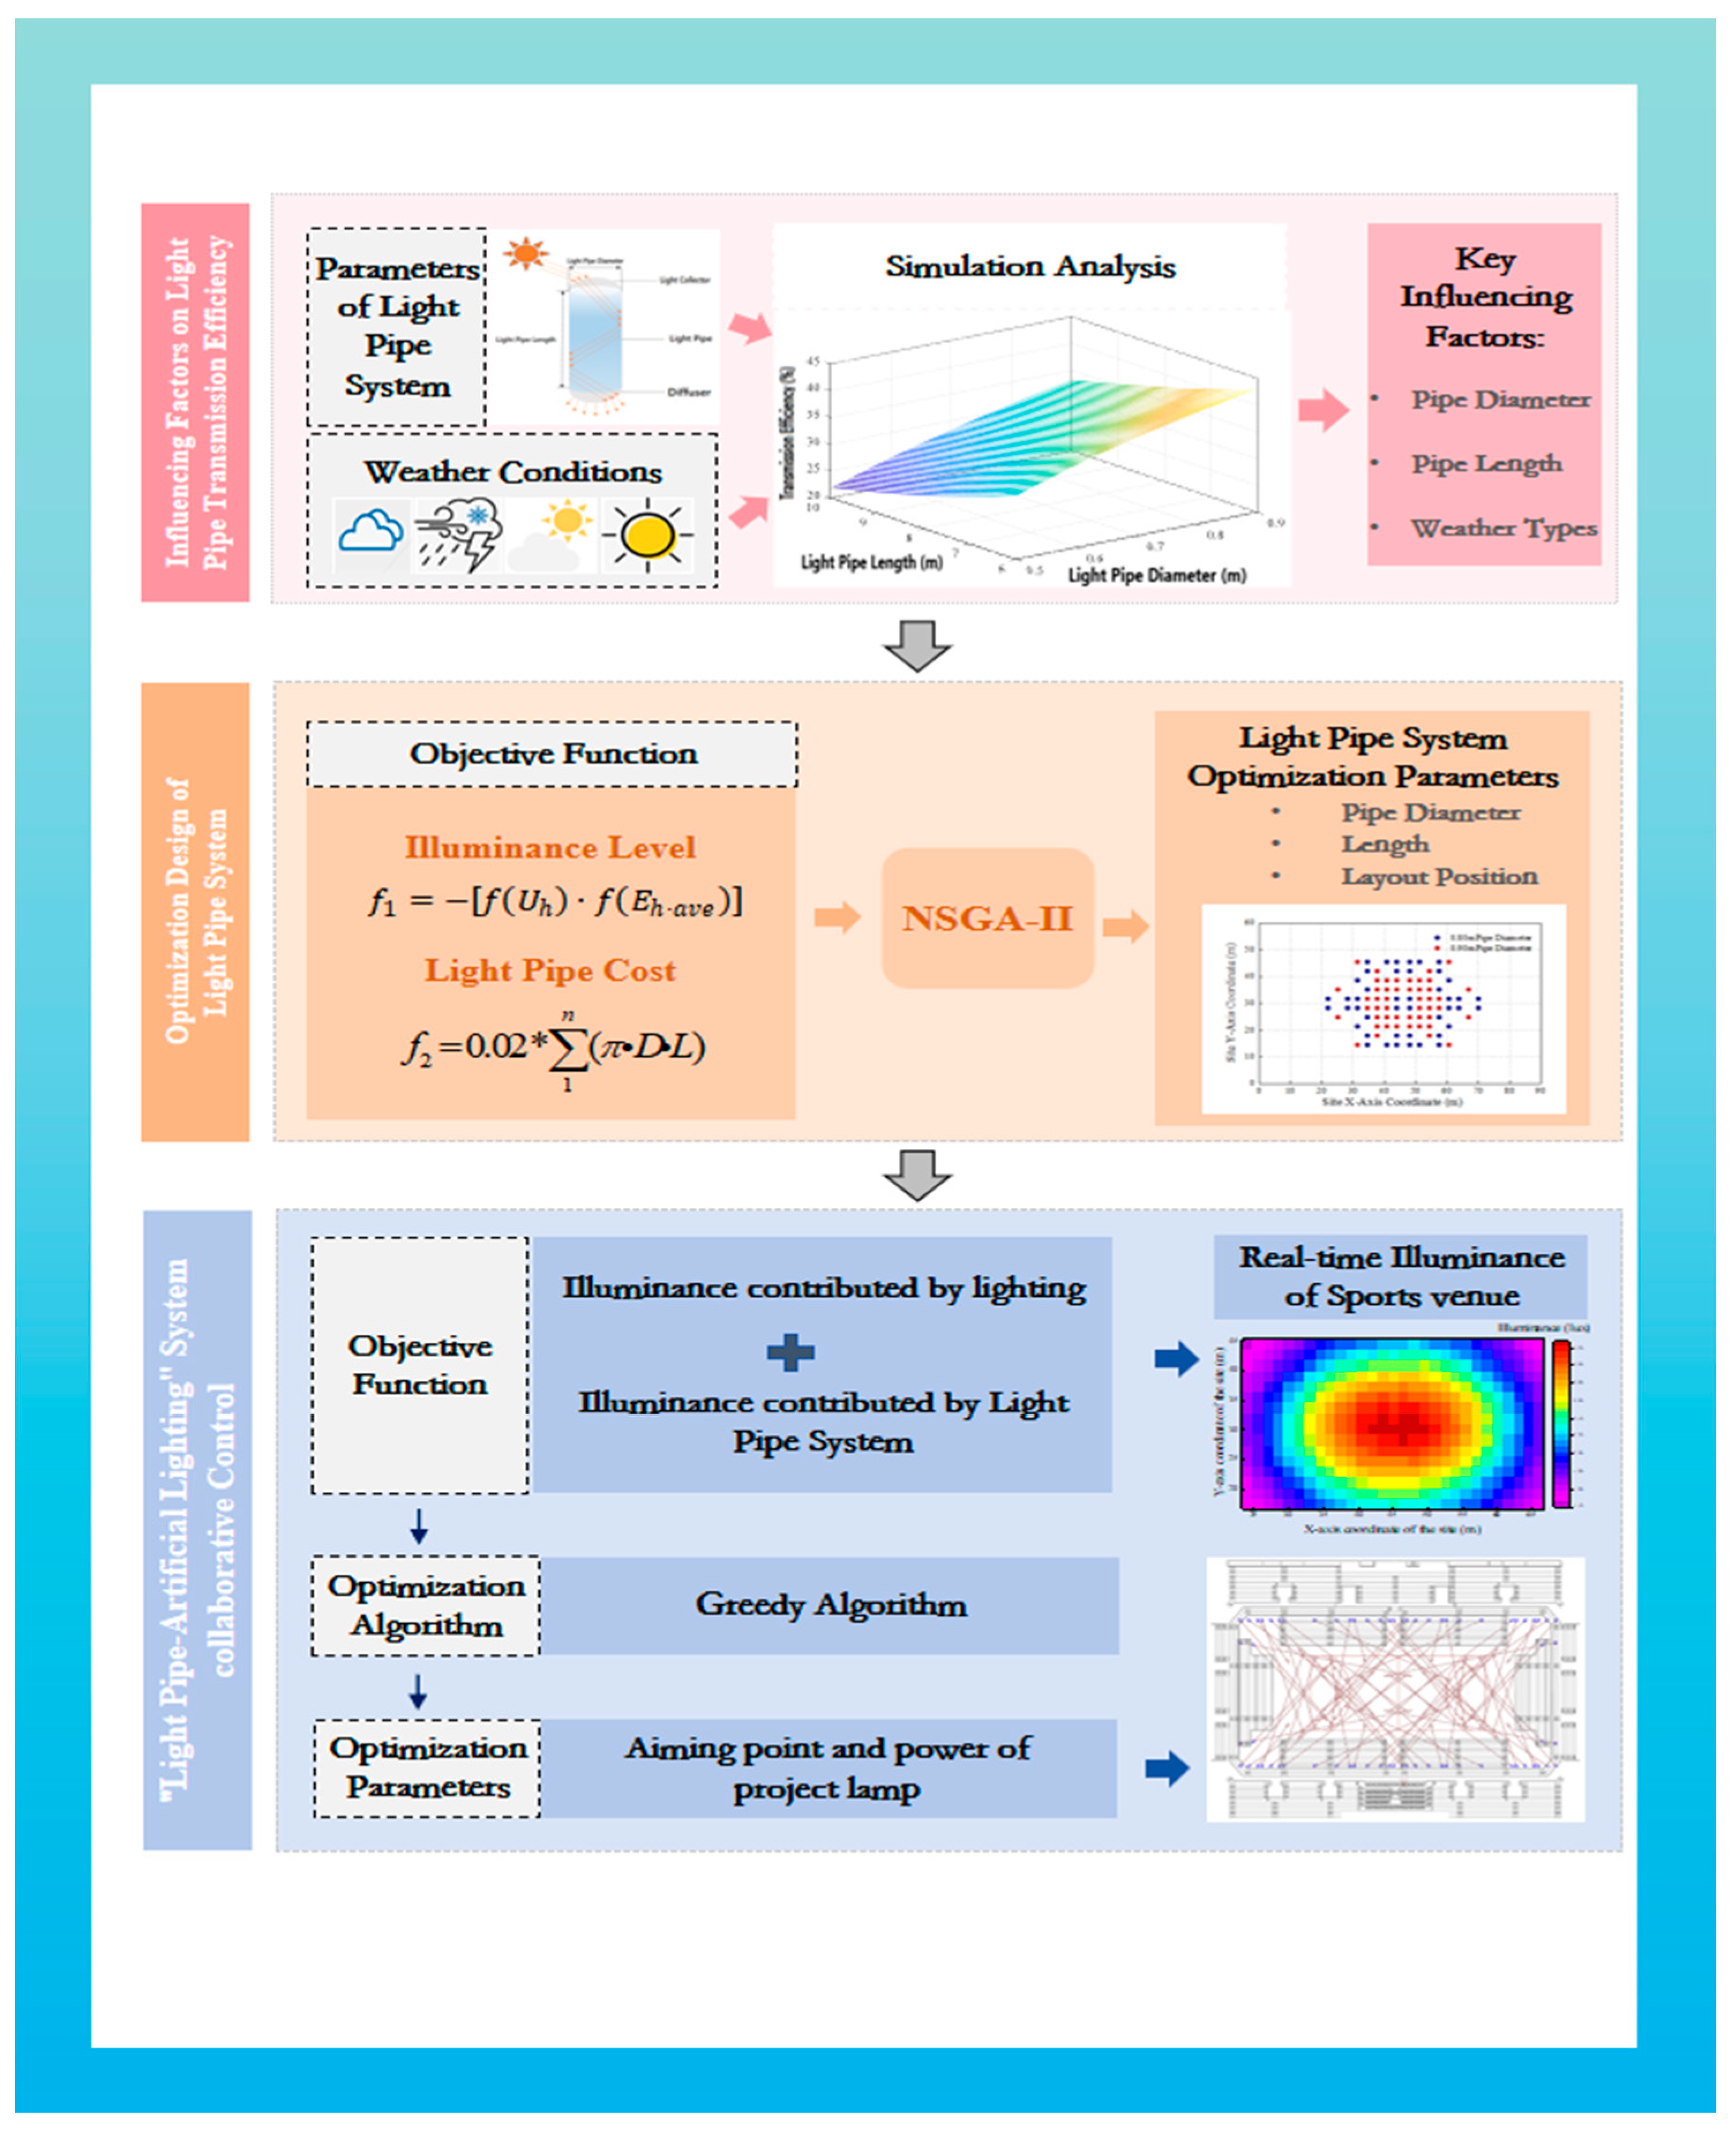
The paper is structured as follows: First, HOLIGILM simulations identify key factors (e.g., diameter, length, weather) affecting light pipe transmission efficiency. Second, a multi-objective optimization using NSGA-II determines optimal pipe diameter, length, and layout based on illuminance levels and cost. Third, a real-time collaborative control strategy between natural and artificial lighting is proposed, supported by an energy efficiency analysis. The research framework is summarized in
Figure 1.
2. Methodology
Pre-experiments were conducted to analyze the factors affecting the transmission efficiency of light pipe systems by using the HOLIGILM software package, which has been developed as a research tool to simulate light pipe systems. Different exterior weather conditions can be configured to simulate the distribution of interior illuminance from light pipes accurately at various times and locations. Key system parameters such as the transmittance of the light collector, pipe diameter, pipe length, reflectivity, and transmittance of the diffuser can all be specified. The results of the calculations performed by the software are highly consistent with those from EnergyPlus. In these pre-experiments, we examined the influence of pipe diameter, length, and sky conditions on transmission efficiency in light pipe systems to provide a theoretical basis to develop some important considerations for designing and optimizing such systems. Additionally, we also propose a method to calculate illuminance for light pipe systems to support their optimization.
2.1. Pre-Experiment
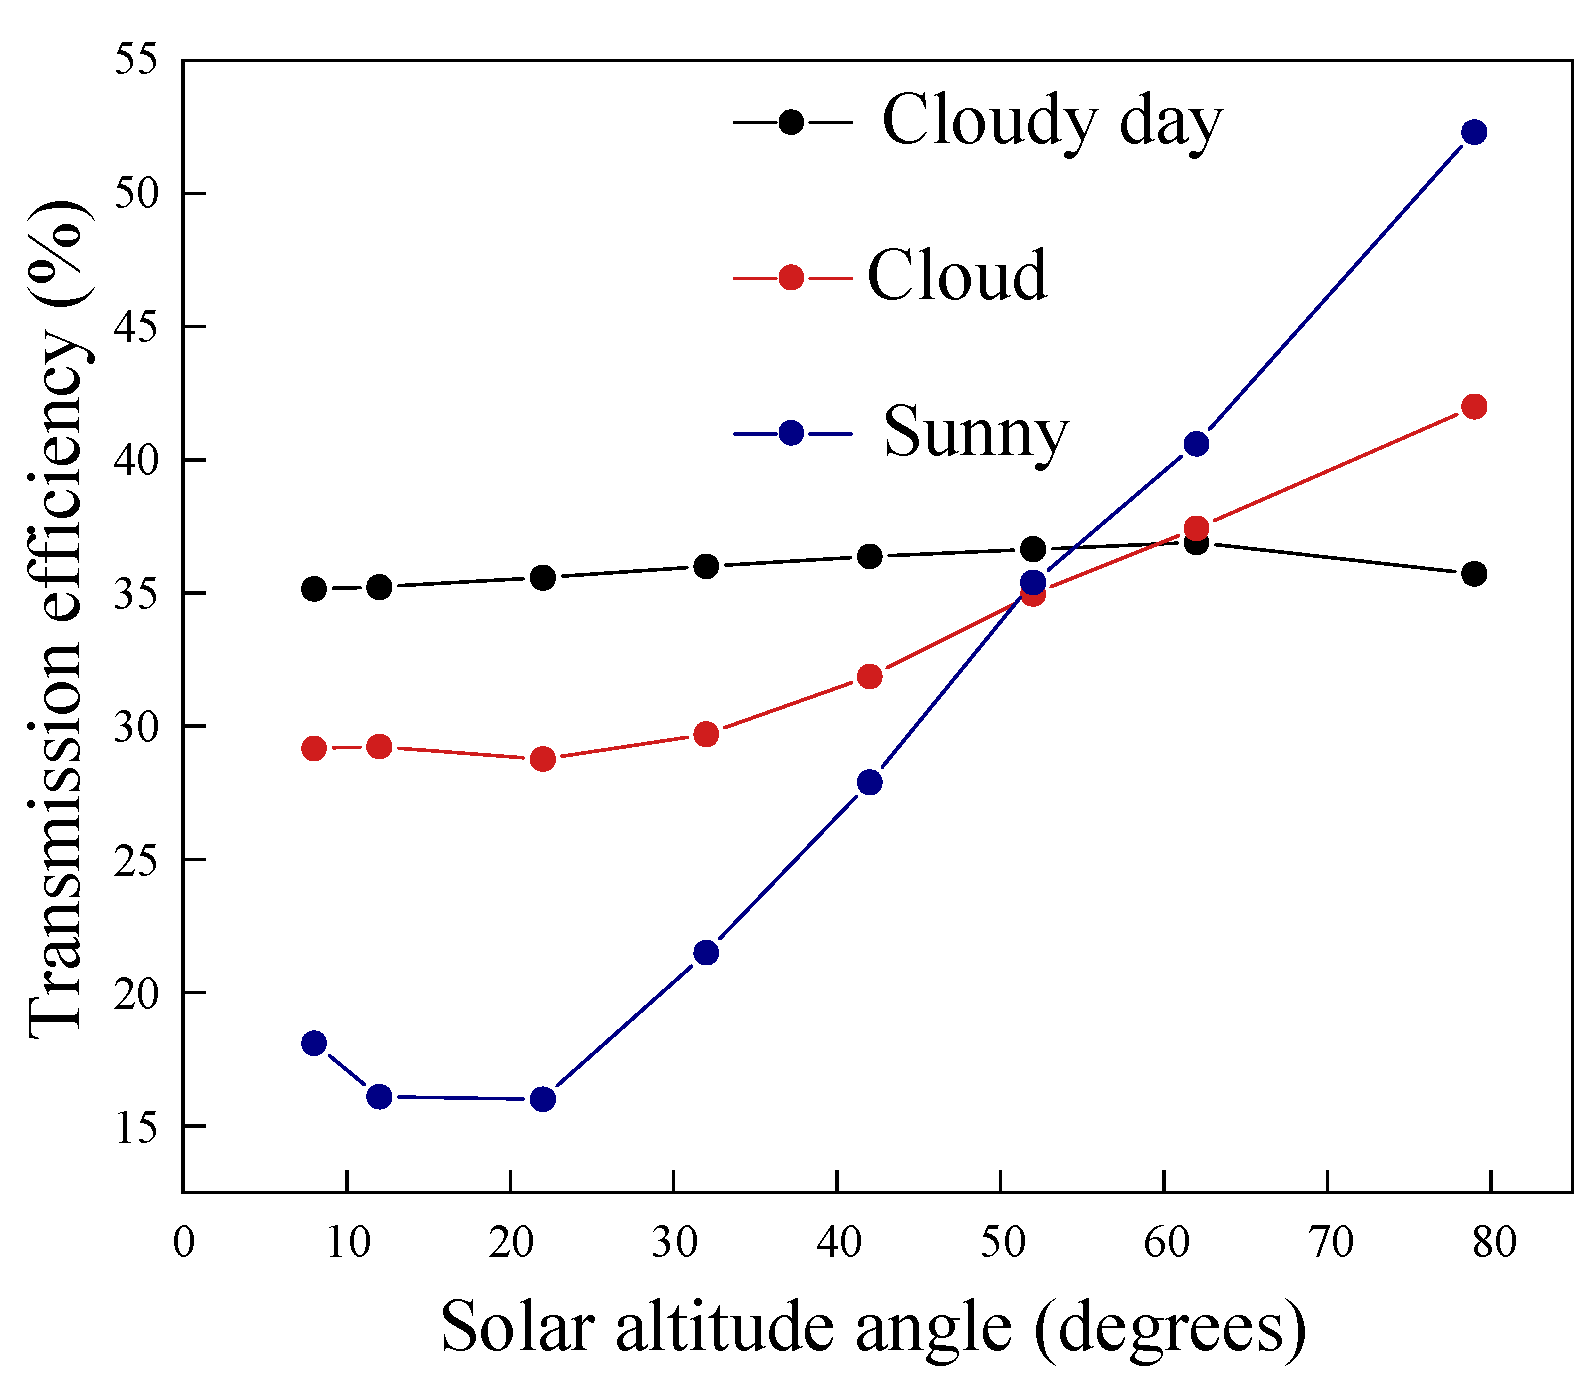
Within the range of pipe diameters and lengths applicable to light pipe systems in sports venues, pipe diameters were set from 0.5 to 0.9 m in increments of 0.1 m, and lengths were set from 6 to 10 m in increments of 1 m. The reflectivity of the inner wall of the light pipe was set to 0.934, and the bottom diffuser was modeled as a Lambertian diffuser with a transmittance of 0.75. Simulations of light pipe systems with multiple parameter combinations were conducted using HOLIGILM. The average transmission efficiency under three sky conditions, namely, overcast, partly cloudy, and clear, was analyzed as a function of the solar altitude angle, as shown in
Figure 2. We observed that the transmission efficiency of the light pipe system was significantly influenced by the type of weather. The transmission efficiency was the most stable under the overcast condition, where daylight was mainly diffused and uniform, followed by the partly cloudy condition. On clear days, the transmission efficiency was very low at low solar altitude angles but increased with higher solar angles owing to increased light intensity. We inferred that the transmission efficiency under clear skies fluctuated significantly. Therefore, in the design optimization of light pipe systems, overcast, which offered the most stable transmission efficiency, was selected as the exterior weather condition.
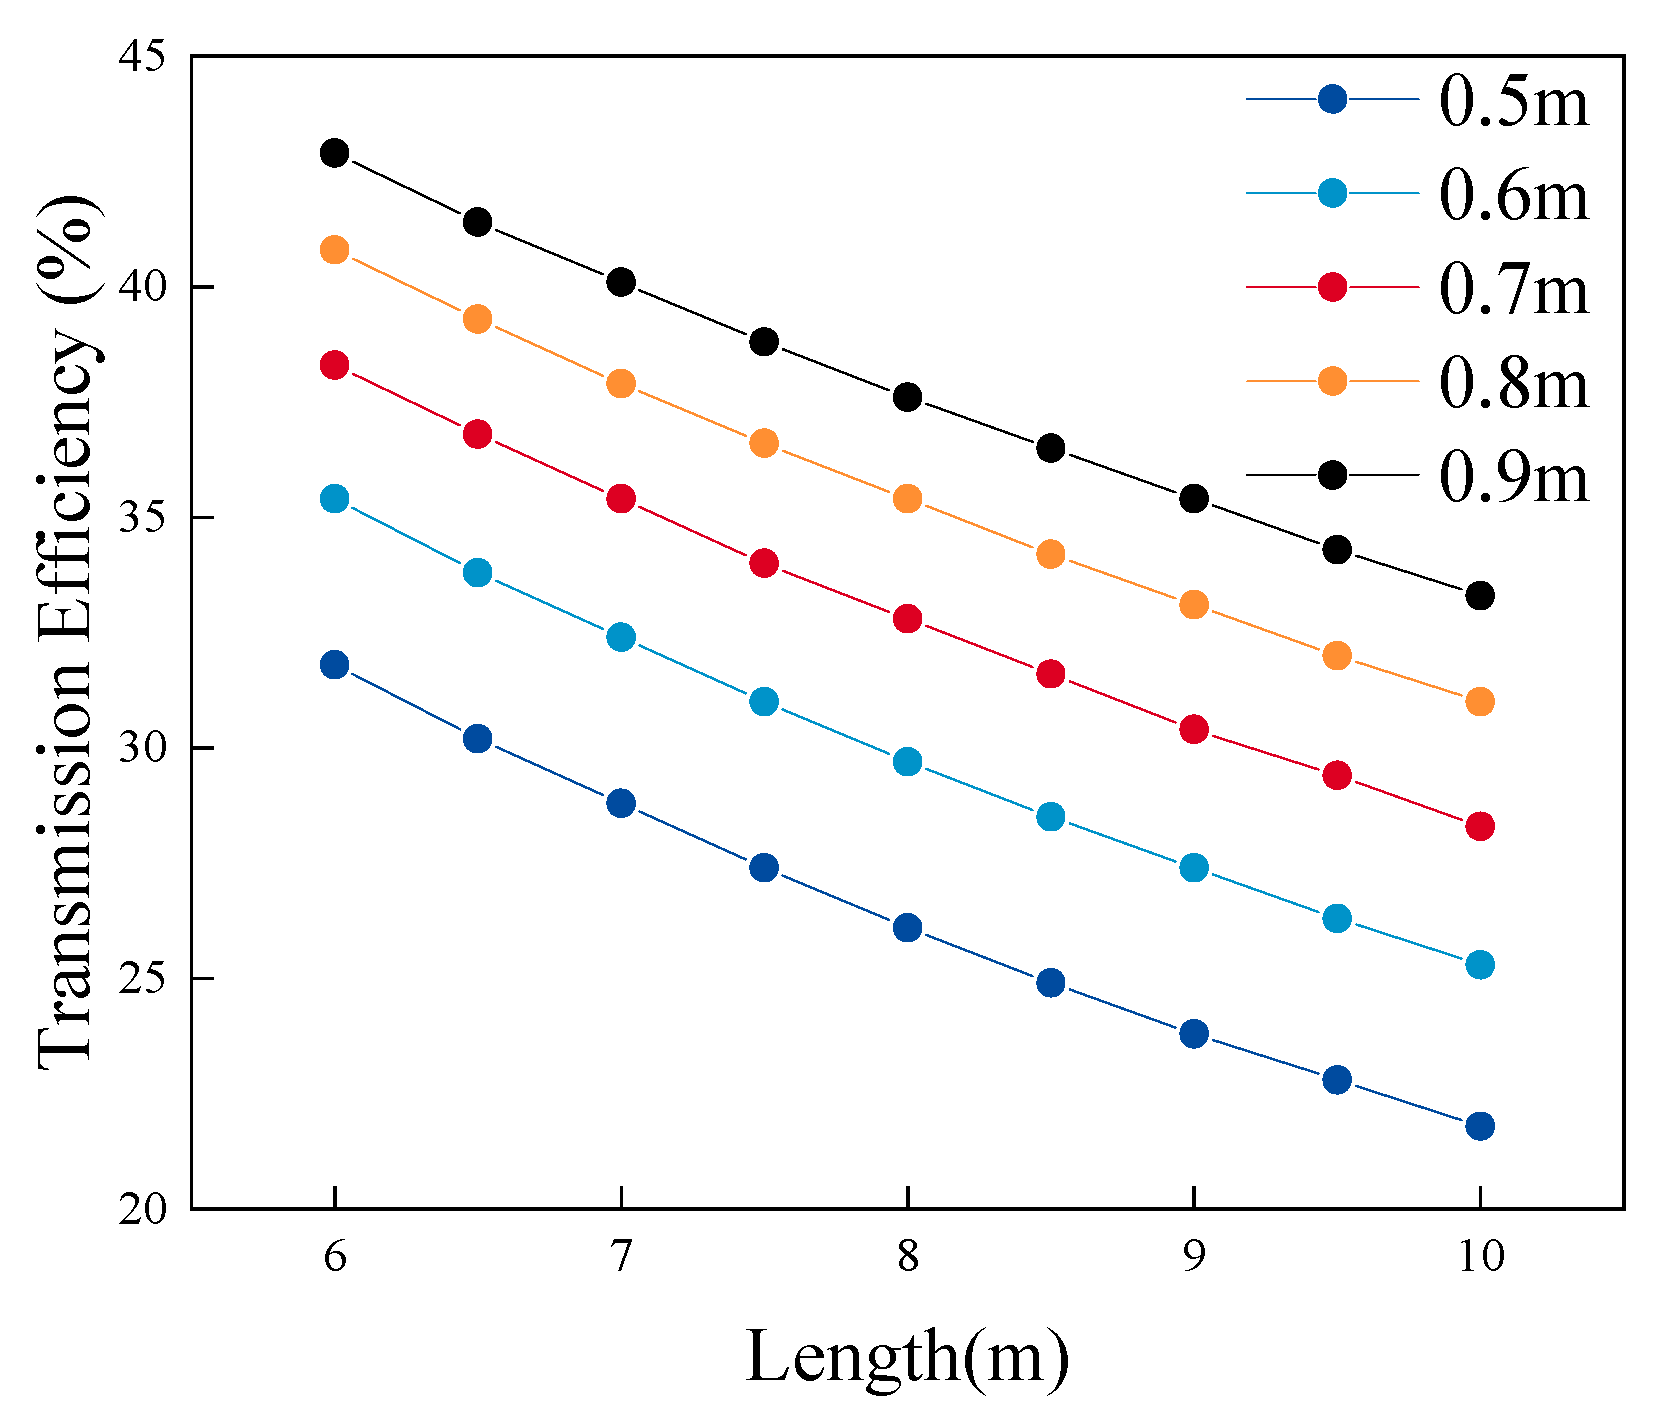
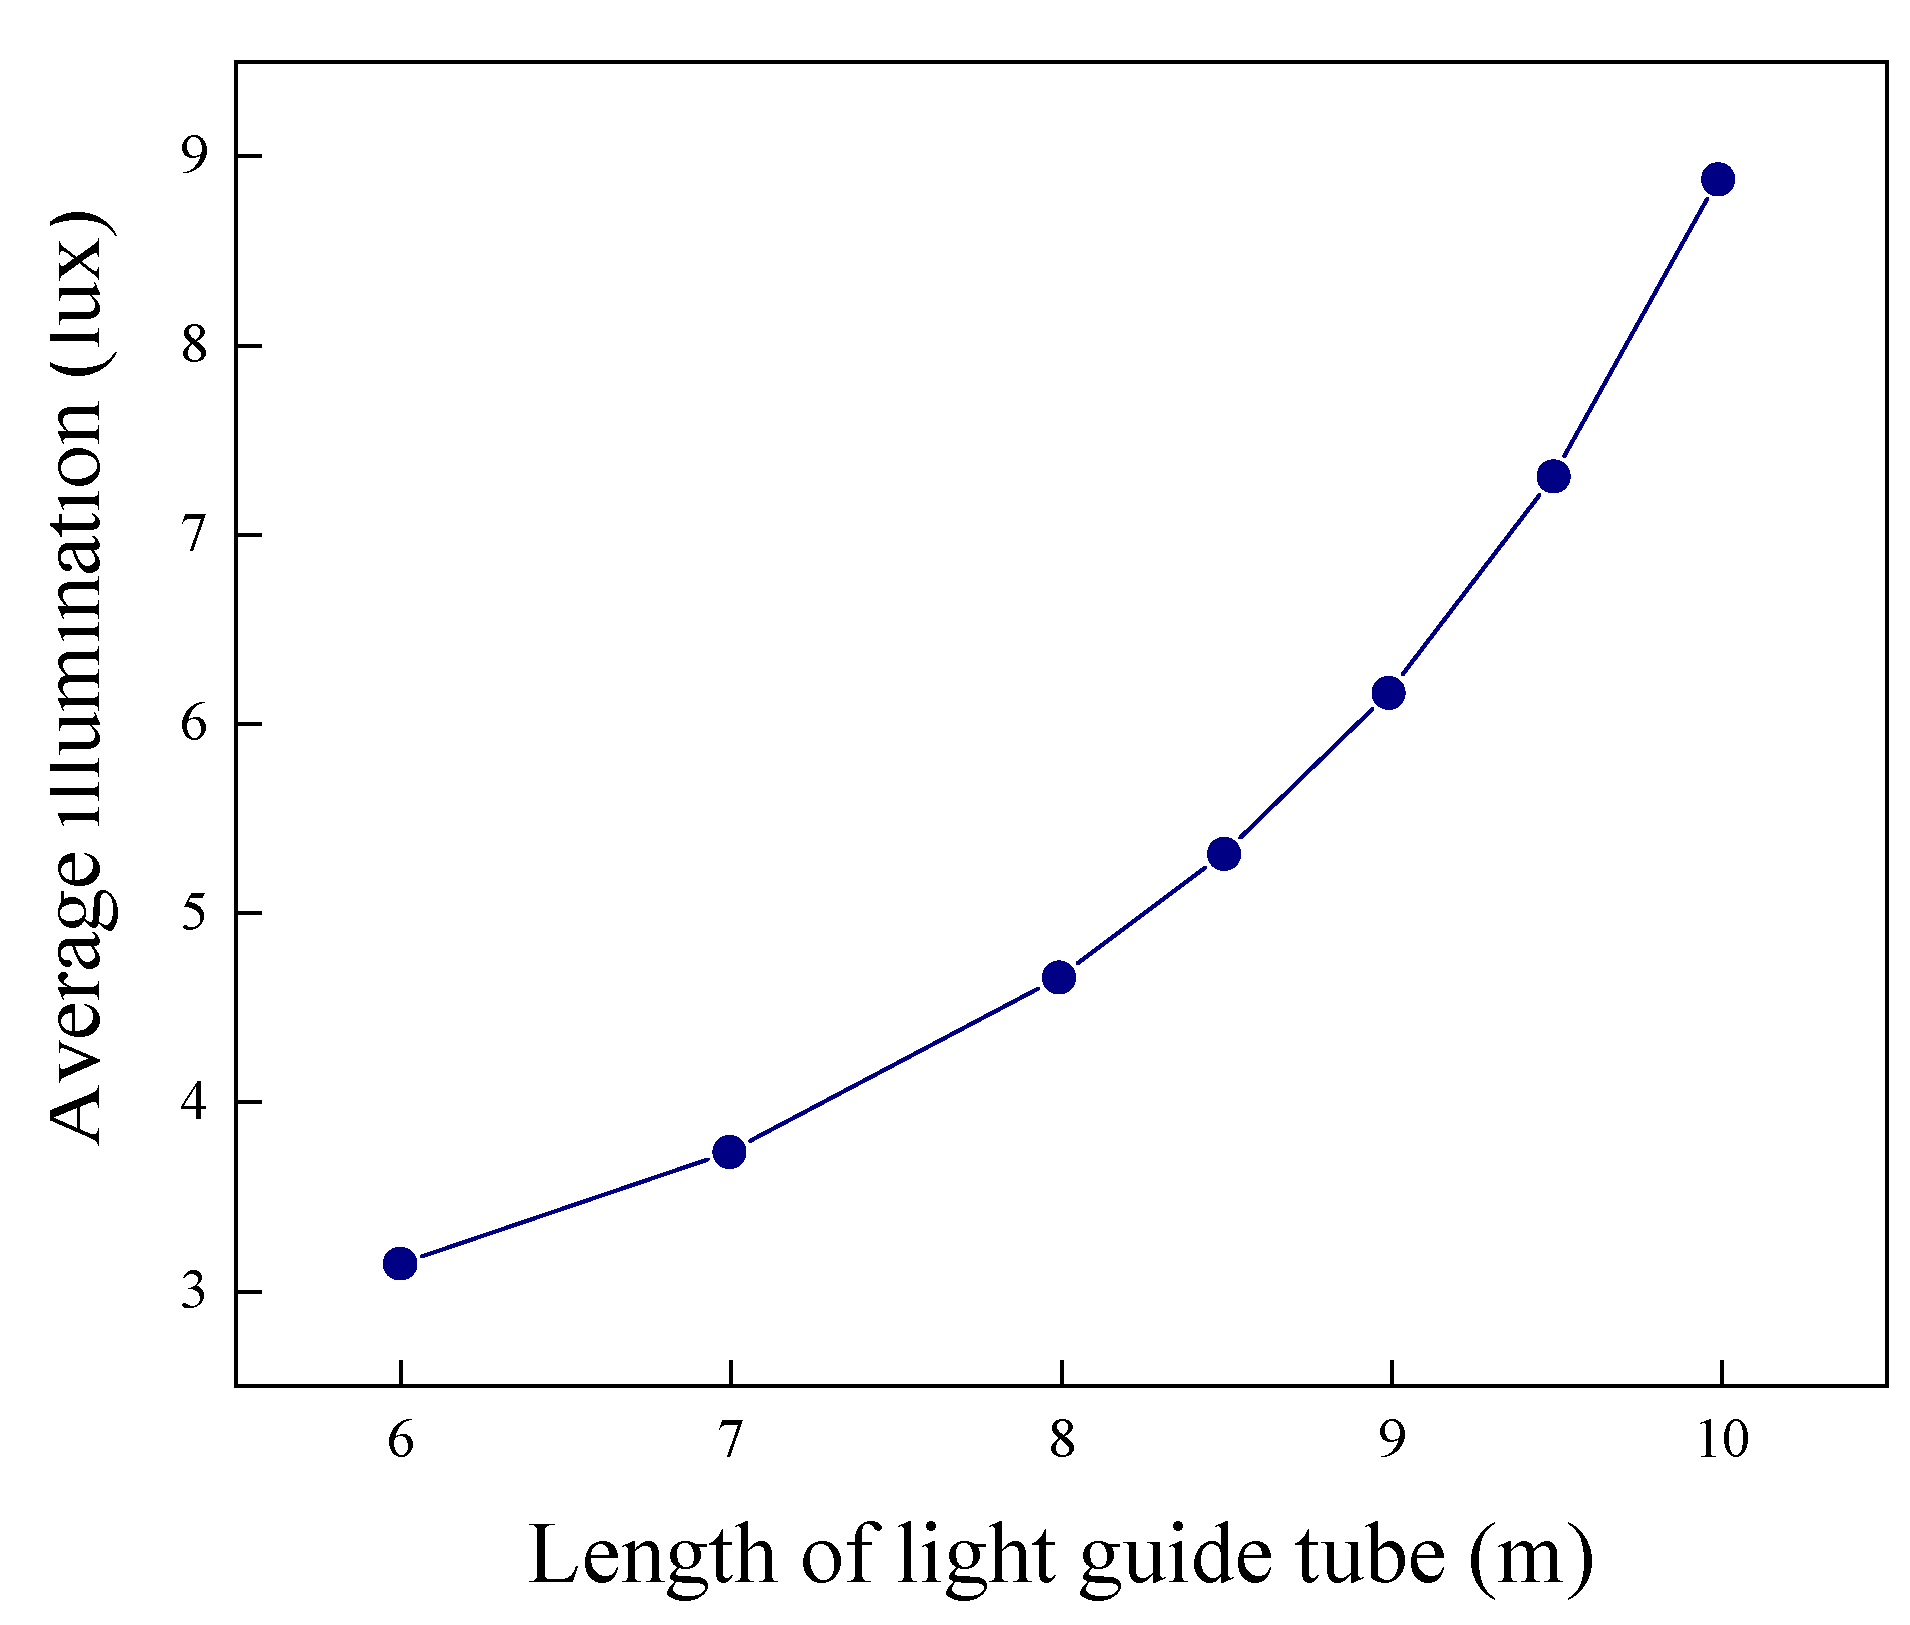
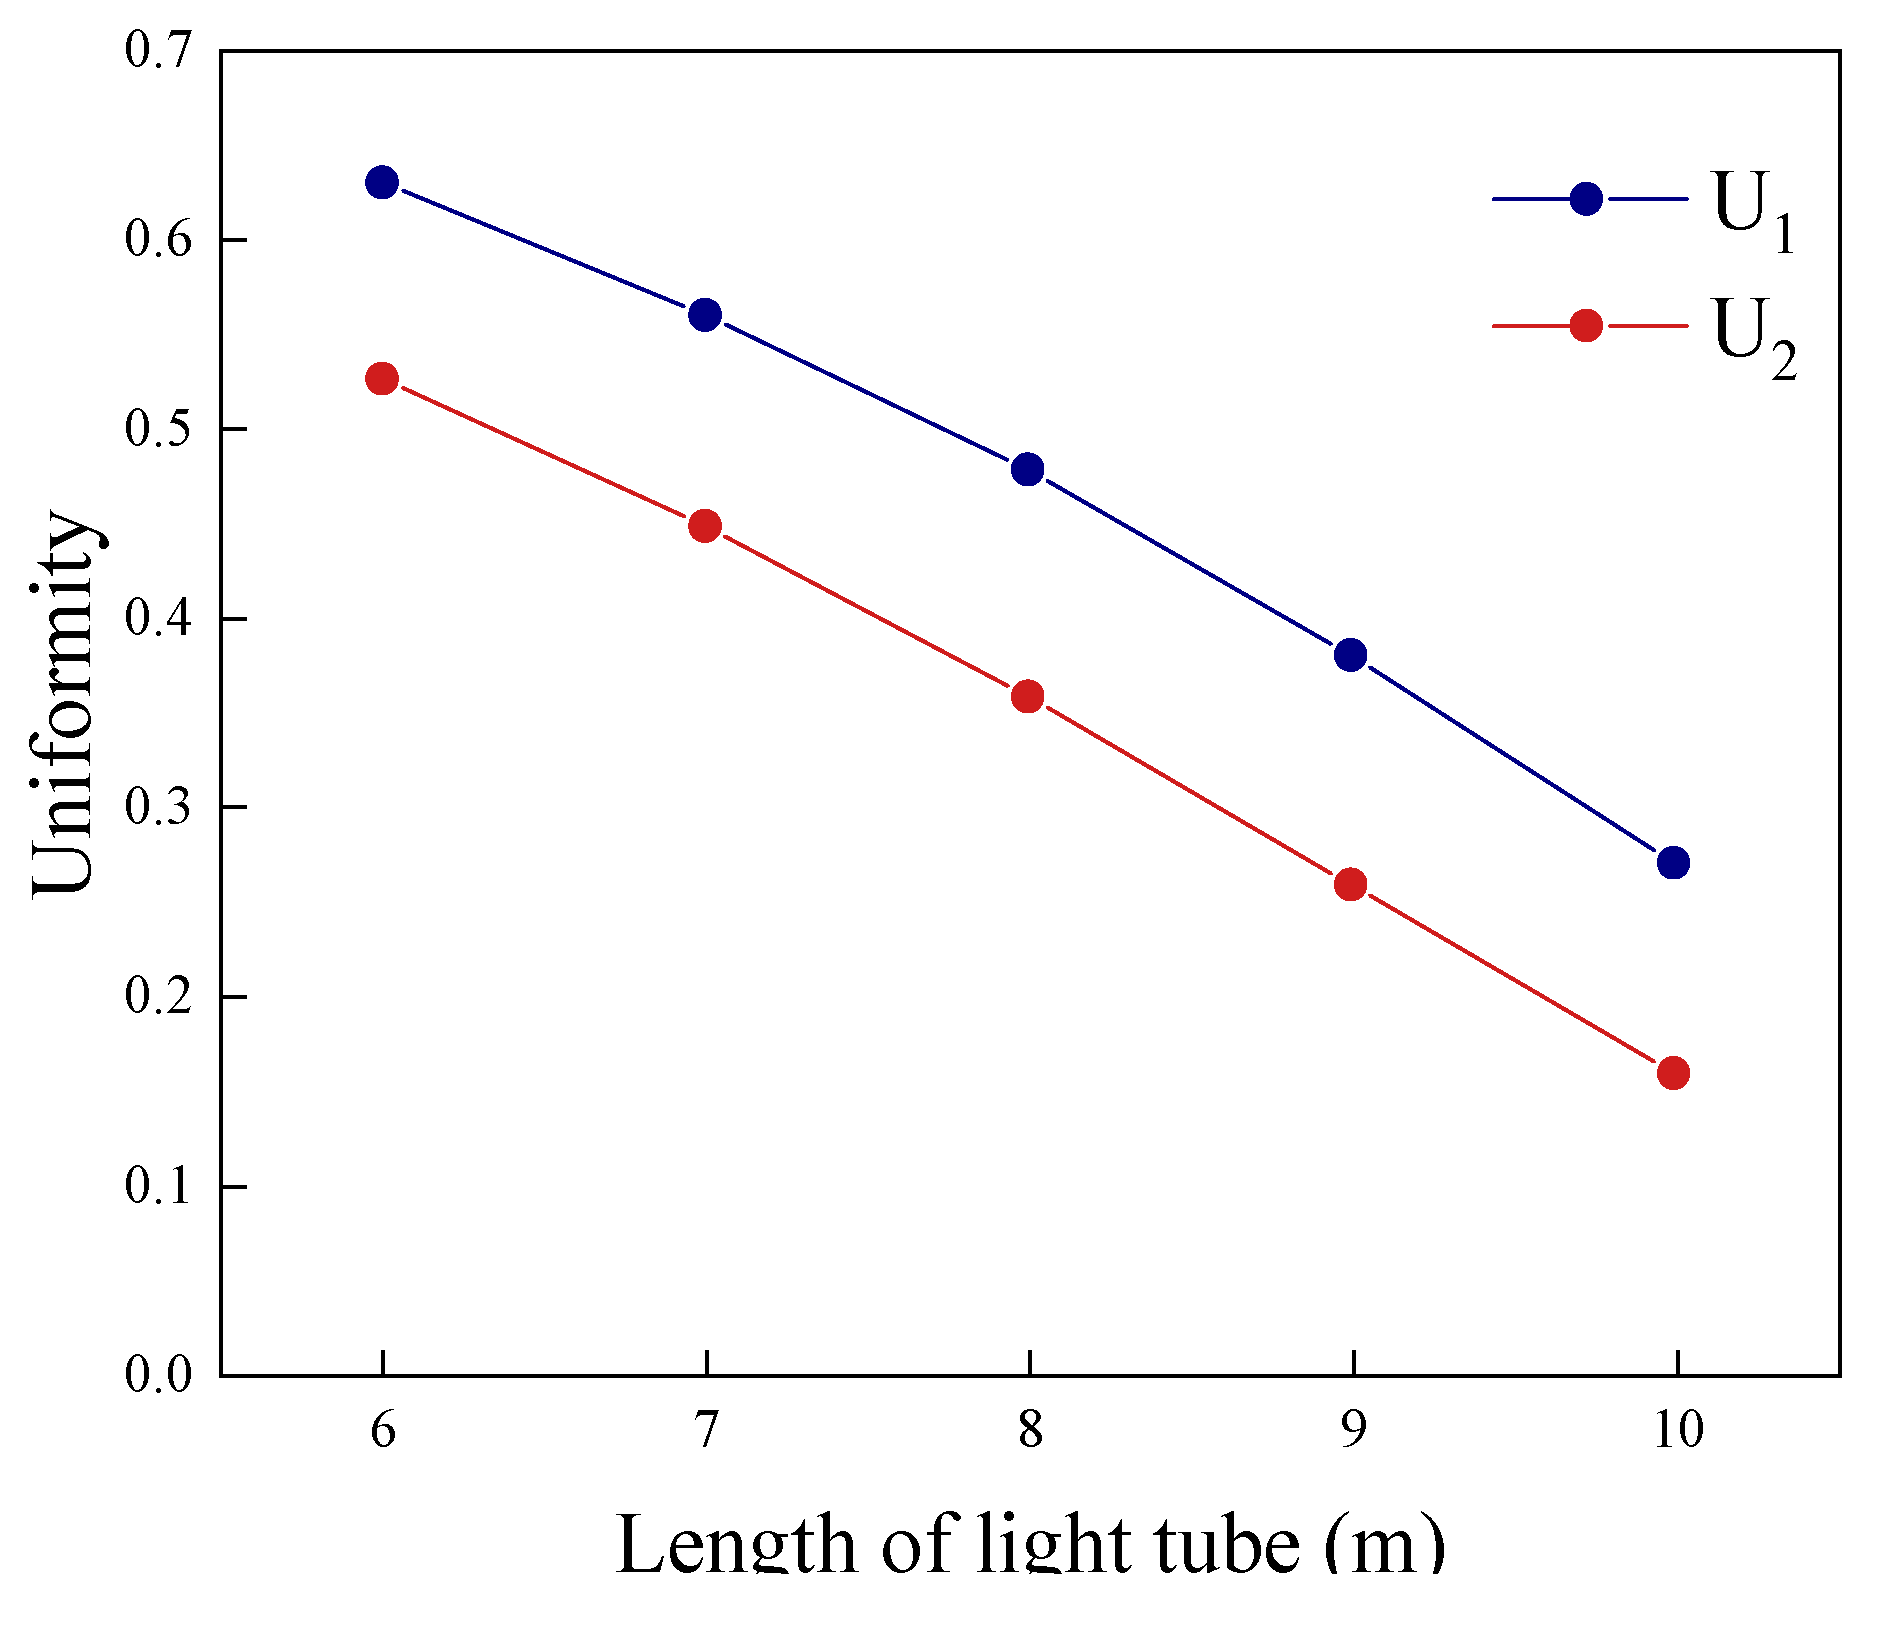
Figure 3 shows the relationship between light pipe length and transmission efficiency at different pipe diameters. Apparently, transmission efficiency is positively correlated with the pipe diameter and negatively correlated with the pipe length. Transmission efficiency is only one of the considerations in selecting light pipes. The illuminance level of the field of play is also an important factor to be considered in the selection of light pipes. Taking a light pipe having a 0.5 m diameter as an example, with the overcast sky condition, we conducted an experiment to study how changes in the pipe length affected the illuminance level of the field.
The results are shown in
Figure 4 and
Figure 5. As the length of the light pipe increases, the average illuminance and uniformity of illuminance of the field exhibit completely opposite trends. In summary, when optimizing the design of light pipe systems in sports venues, both the transmission efficiency and the field’s illuminance level must be considered in determining the pipe length and diameter.
2.2. Illuminance Calculation for Light Pipe System
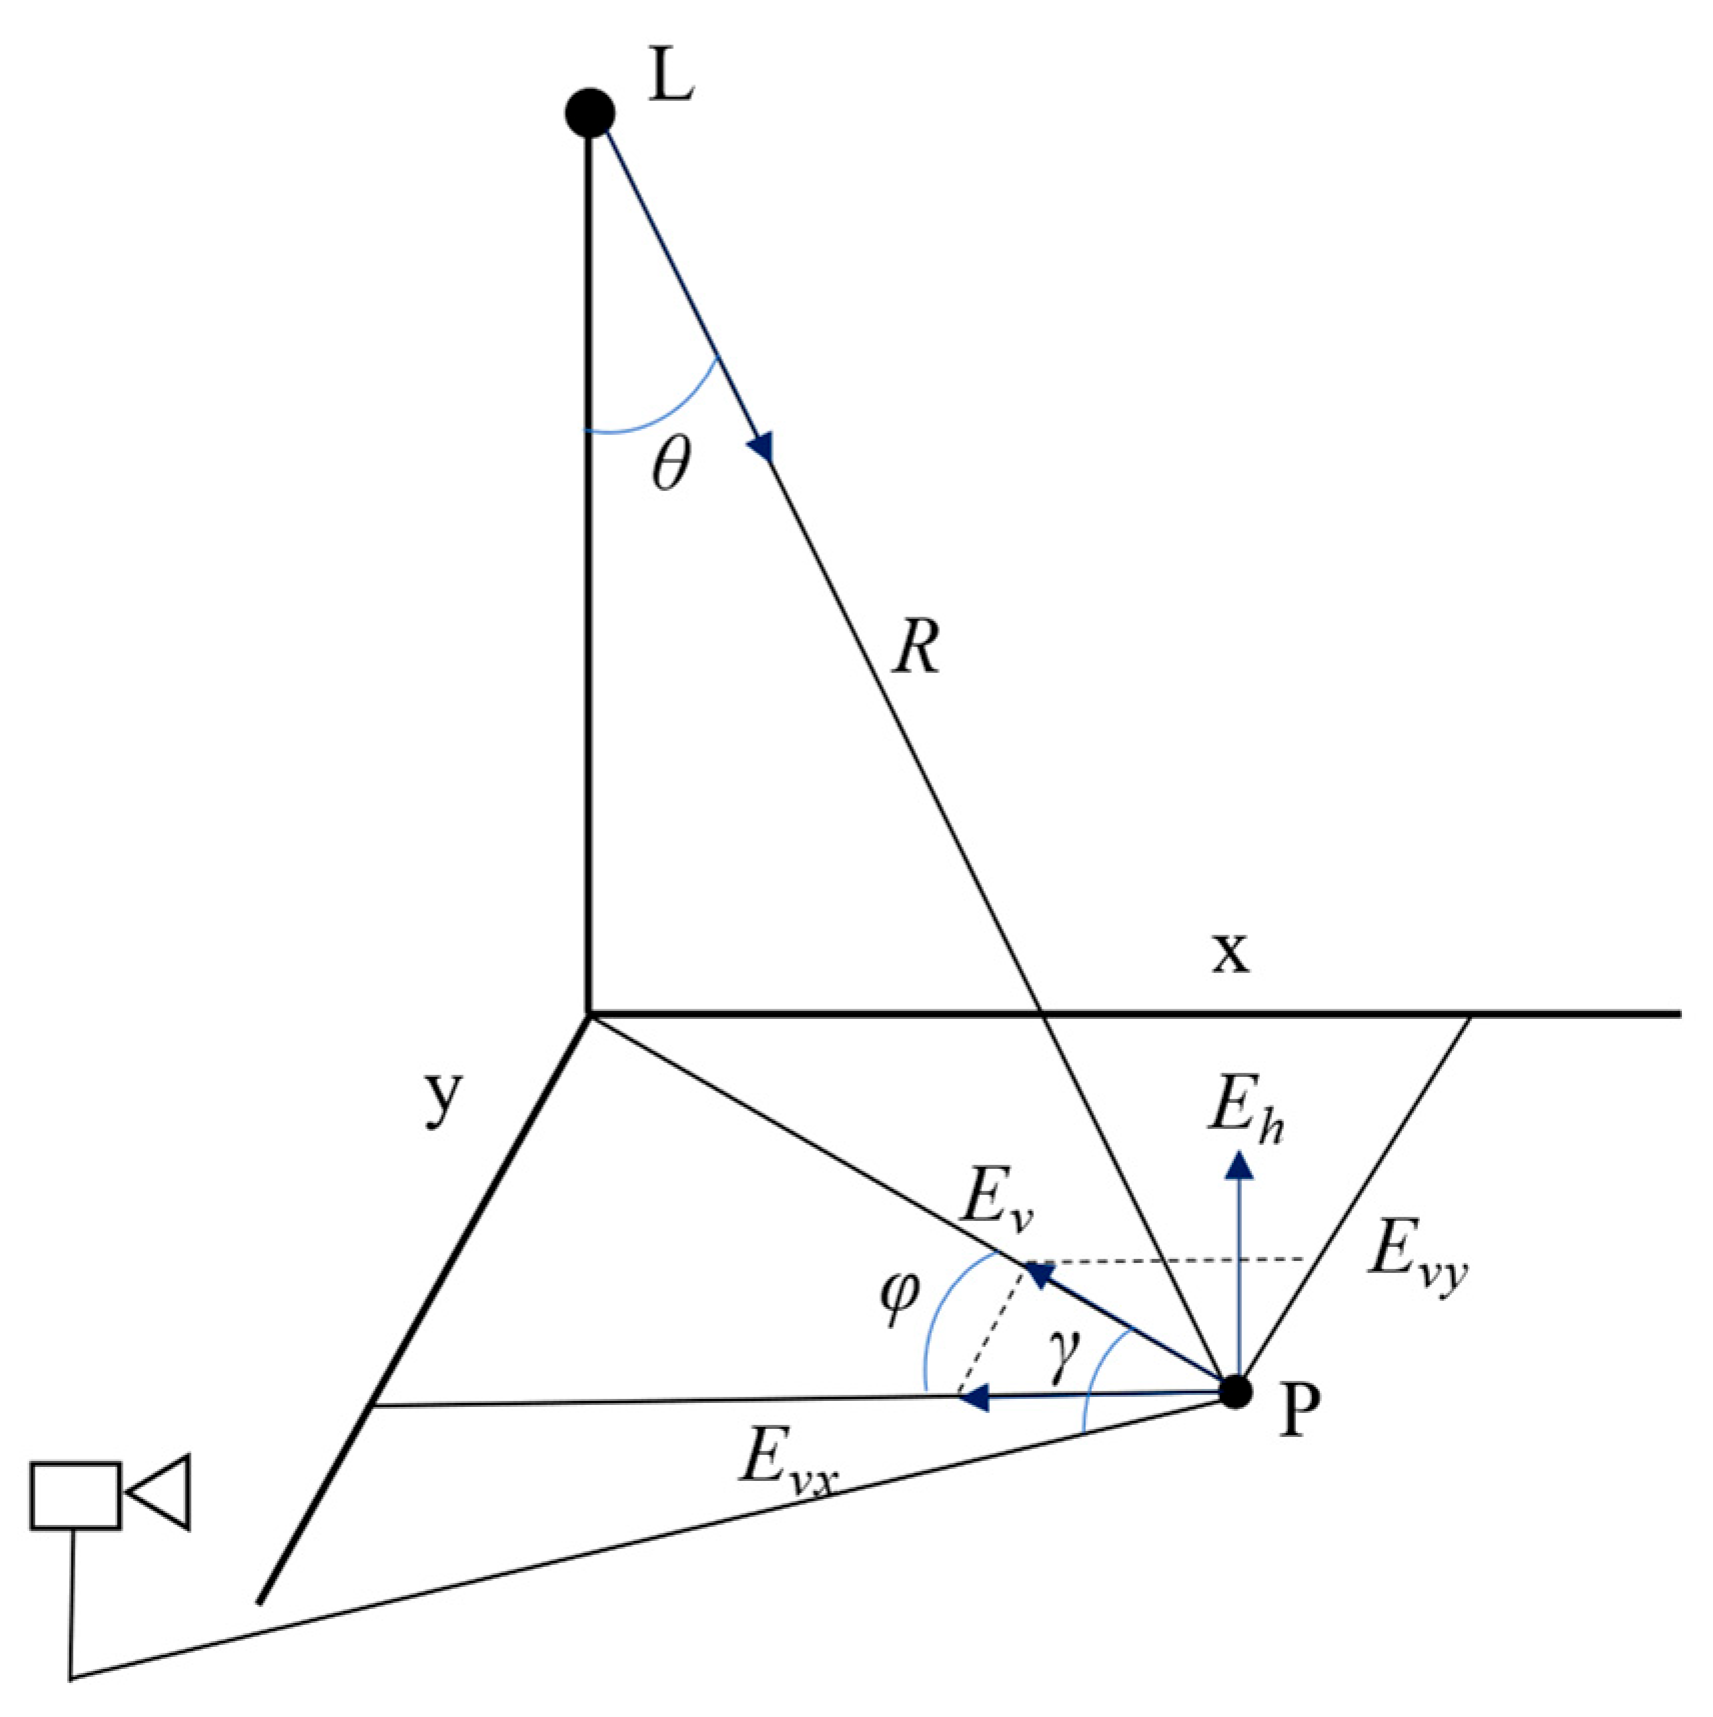
When optimizing the design of the light pipe system, evaluating the illuminance level on the work plane provided by the system is necessary. Thus, illuminance calculations are required for the light pipe system. The diffuser is considered as a luminaire, which has a corresponding luminous intensity distribution curve. When the exterior weather conditions are fixed, the luminous flux emitted by this “luminaire” is also fixed. Because the bottom diffuser of the light pipe in sports venues is generally located far from the work plane, it meets the definition of a point light source. Therefore, the illuminance at various points beneath the diffuser can be calculated using the point-source illuminance method based on its luminous intensity distribution curve.
The relationship between the point light source and illuminance calculation point is illustrated in
Figure 6, where
p denotes the illuminance calculation point, and L denotes the luminaire position.
The relevant formulas are as follows:
where
Eh is the horizontal illuminance (lx),
Ev is the vertical illuminance (lx),
Evx is the vertical illuminance in the x-direction (lx),
Evy is the vertical illuminance in the y-direction (lx), Evmai is the vertical illuminance in the direction of the main camera (lx),
I is the luminous intensity of the point light source in the direction of the calculation point (cd), and
R is the distance between the point light source and the calculation point (m).
HOLIGILM provides luminous intensity distribution curves for the bottom diffusers of light pipe systems, which can be used in illuminance calculations. Under the same weather conditions, for light pipe systems having different dimensions, variations in luminous flux are mainly determined based on the transmission efficiency. The illuminance calculation method for the light pipe system is expressed in Equation (6).
where
and
are the transmission efficiencies of the reference and target light pipe systems, respectively,
and
are the diameters of the reference and target light pipe systems, respectively.
3. Optimized Design of Light Pipe Systems for Sports Venues
Optimizing the design of light pipe systems for sports venues is a multi-objective problem. In addition to the parameters of the light pipe system itself, the number of lights must be optimized along with their layout. Notably, the two natural objectives of minimizing the cost to construct a given system and maximizing its lighting performance are generally contradictory. In this section, we consider applying the widely used non-dominated sorting genetic algorithm (NSGA-II) to perform optimization. Unlike conventional genetic algorithms, NSGA-II has been widely applied to multi-objective optimization problems with conflicting objectives. It adopts non-dominated sorting to allow better solutions to be ranked and passed on with higher probability to subsequent generations. In this study, we set the exterior daylight condition for the lighting design at 12:00 noon under overcast sky conditions. We considered a conventional sports venue as a case study. We defined the non-event scenario daylighting standard and the cost of the light pipes as optimization objectives. Based on the NSGA-II algorithm, we optimized designs for a light pipe system with respect to pipe diameter, length, and layout.
3.1. Fitness Functions and Chromosome Coding
Given that natural light imposes no requirements on vertical illuminance or on the uniformity of horizontal average illuminance defined as U1 (the ratio of minimum illuminance to maximum illuminance), these were not considered in this study. Therefore, for the system optimization problem given here, the horizontal average illuminance together with the illuminance uniformity U2 (the ratio of minimum illuminance to average illuminance) is defined as an optimization objective. These two indicators are combined into a single objective by multiplication. As noted above, the cost of the light pipe system is defined as the other optimization objective; it naturally varies with pipe diameter and length. The cost of the light pipe system was evaluated in terms of the total inner surface area of all of the pipes. The fitness functions used in the optimization are defined in Equations (7) and (8).
where
n is the number of light pipes in the system,
is the length of the light pipe, and
is the diameter of the light pipe. A coefficient was applied to the cost fitness value to scale down its range, thus avoiding excessively high values that could compromise the congestion calculation. To ensure consistency in the direction of objective functions, the fitness function for the illuminance level was taken as a negative value.
We considered a handball court within a sports venue as a case study. The available installation area for light pipes was 47 m × 31 m, slightly larger than the standard 40 m × 20 m size of a handball court. A maximum of 160 light pipes could be placed within this area, with a spacing of approximately 3 m between adjacent pipes. The minimum and maximum pipe diameters were set to 0.5 and 0.9 m, respectively. Considering the ceiling height of the venue, we set the minimum and maximum lengths of the pipes to 6 and 8 m, respectively. With the building height of the venue being 26 m, the minimum distance from the bottom diffuser of the light pipe to the ground was 18 m. For practical implementation, the entire venue was limited to using a maximum of two different light pipe specifications in combination. To simplify calculations and enhance visual aesthetics, the light pipes were symmetrically arranged about the center of the field.
3.2. Optimized Results
The genetic algorithm was configured with a population size of 200. After 1500 iterations, the solution set converged and yielded a series of feasible solutions.
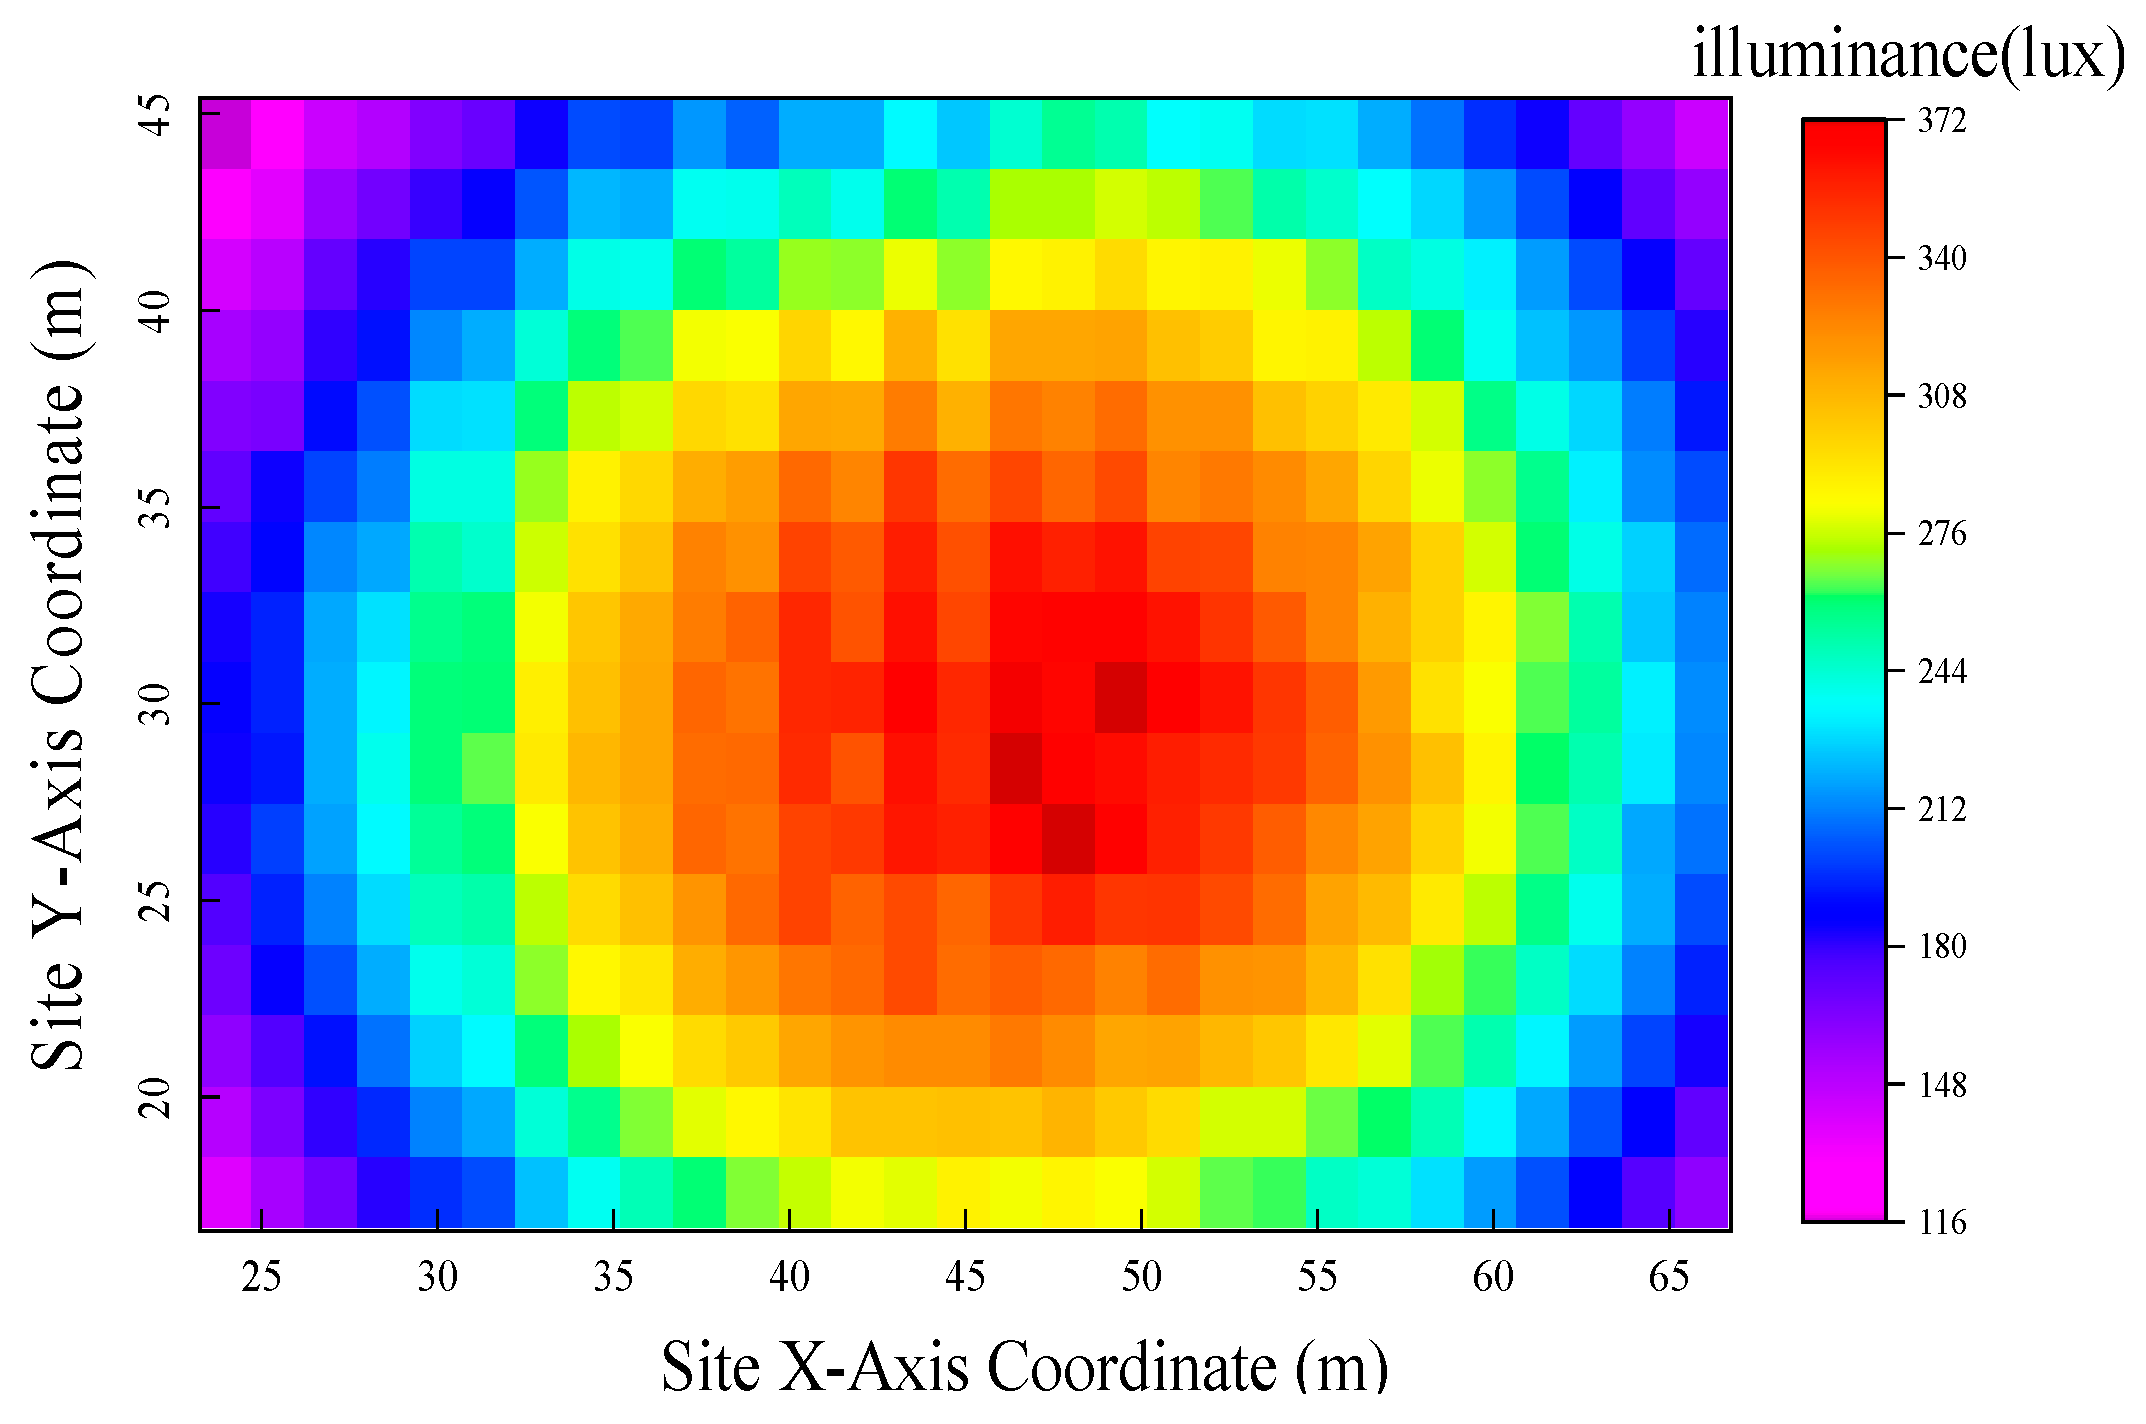
In
Figure 7, the horizontal axis represents the fitness value related to the illuminance level of the light pipe system, whereas the vertical axis represents the fitness value related to the system cost. Because the illuminance level fitness function is defined as a negative value, the solutions located further to the left correspond to higher illuminance levels. As previously mentioned, both indicators are normalized and multiplied. When all constraints are satisfied, the product should be less than or equal to –1. Therefore, solutions with values of ≤–1 are considered valid and marked in red in the figure. This series of valid solution sets reflects different preferences between the two objectives. In this study, the solution with a higher illuminance level is selected as the final light pipe system design for the sports venue. Under an exterior illuminance of 26,000 lx on an overcast day, the interior illuminance distribution on the field of play is shown in
Figure 8, where the X and Y axes represent the X and Y coordinates of the field’s coordinate system, respectively. The optimized illuminance distribution across the field is largely centrosymmetric. The minimum illuminance is approximately 150 lx, and the maximum illuminance in the center exceeds 400 lx. The average illuminance reaches 150 lx, meeting the daylighting requirements set by the standard for daylighting design of sports venues.
The optimized results for the sports venue are compared with those for a conventional engineering design. The comparison of the illuminance level and system cost is presented in
Table 1.
In the original design of the sports venue, the uniformity of illuminance is not measured, and all designs are based on the indoor Class I (non-tournament) lighting standard for amateur training. Under the outdoor overcast condition with 26,000 lx, the optimized scheme increases the interior illuminance transmitted through the light pipe to 265.3 lx. The uniformity (U2) reaches 0.44, exceeding the required standard value of 0.3. The daylight factor reaches 1.02%, meeting the required 1% standard.
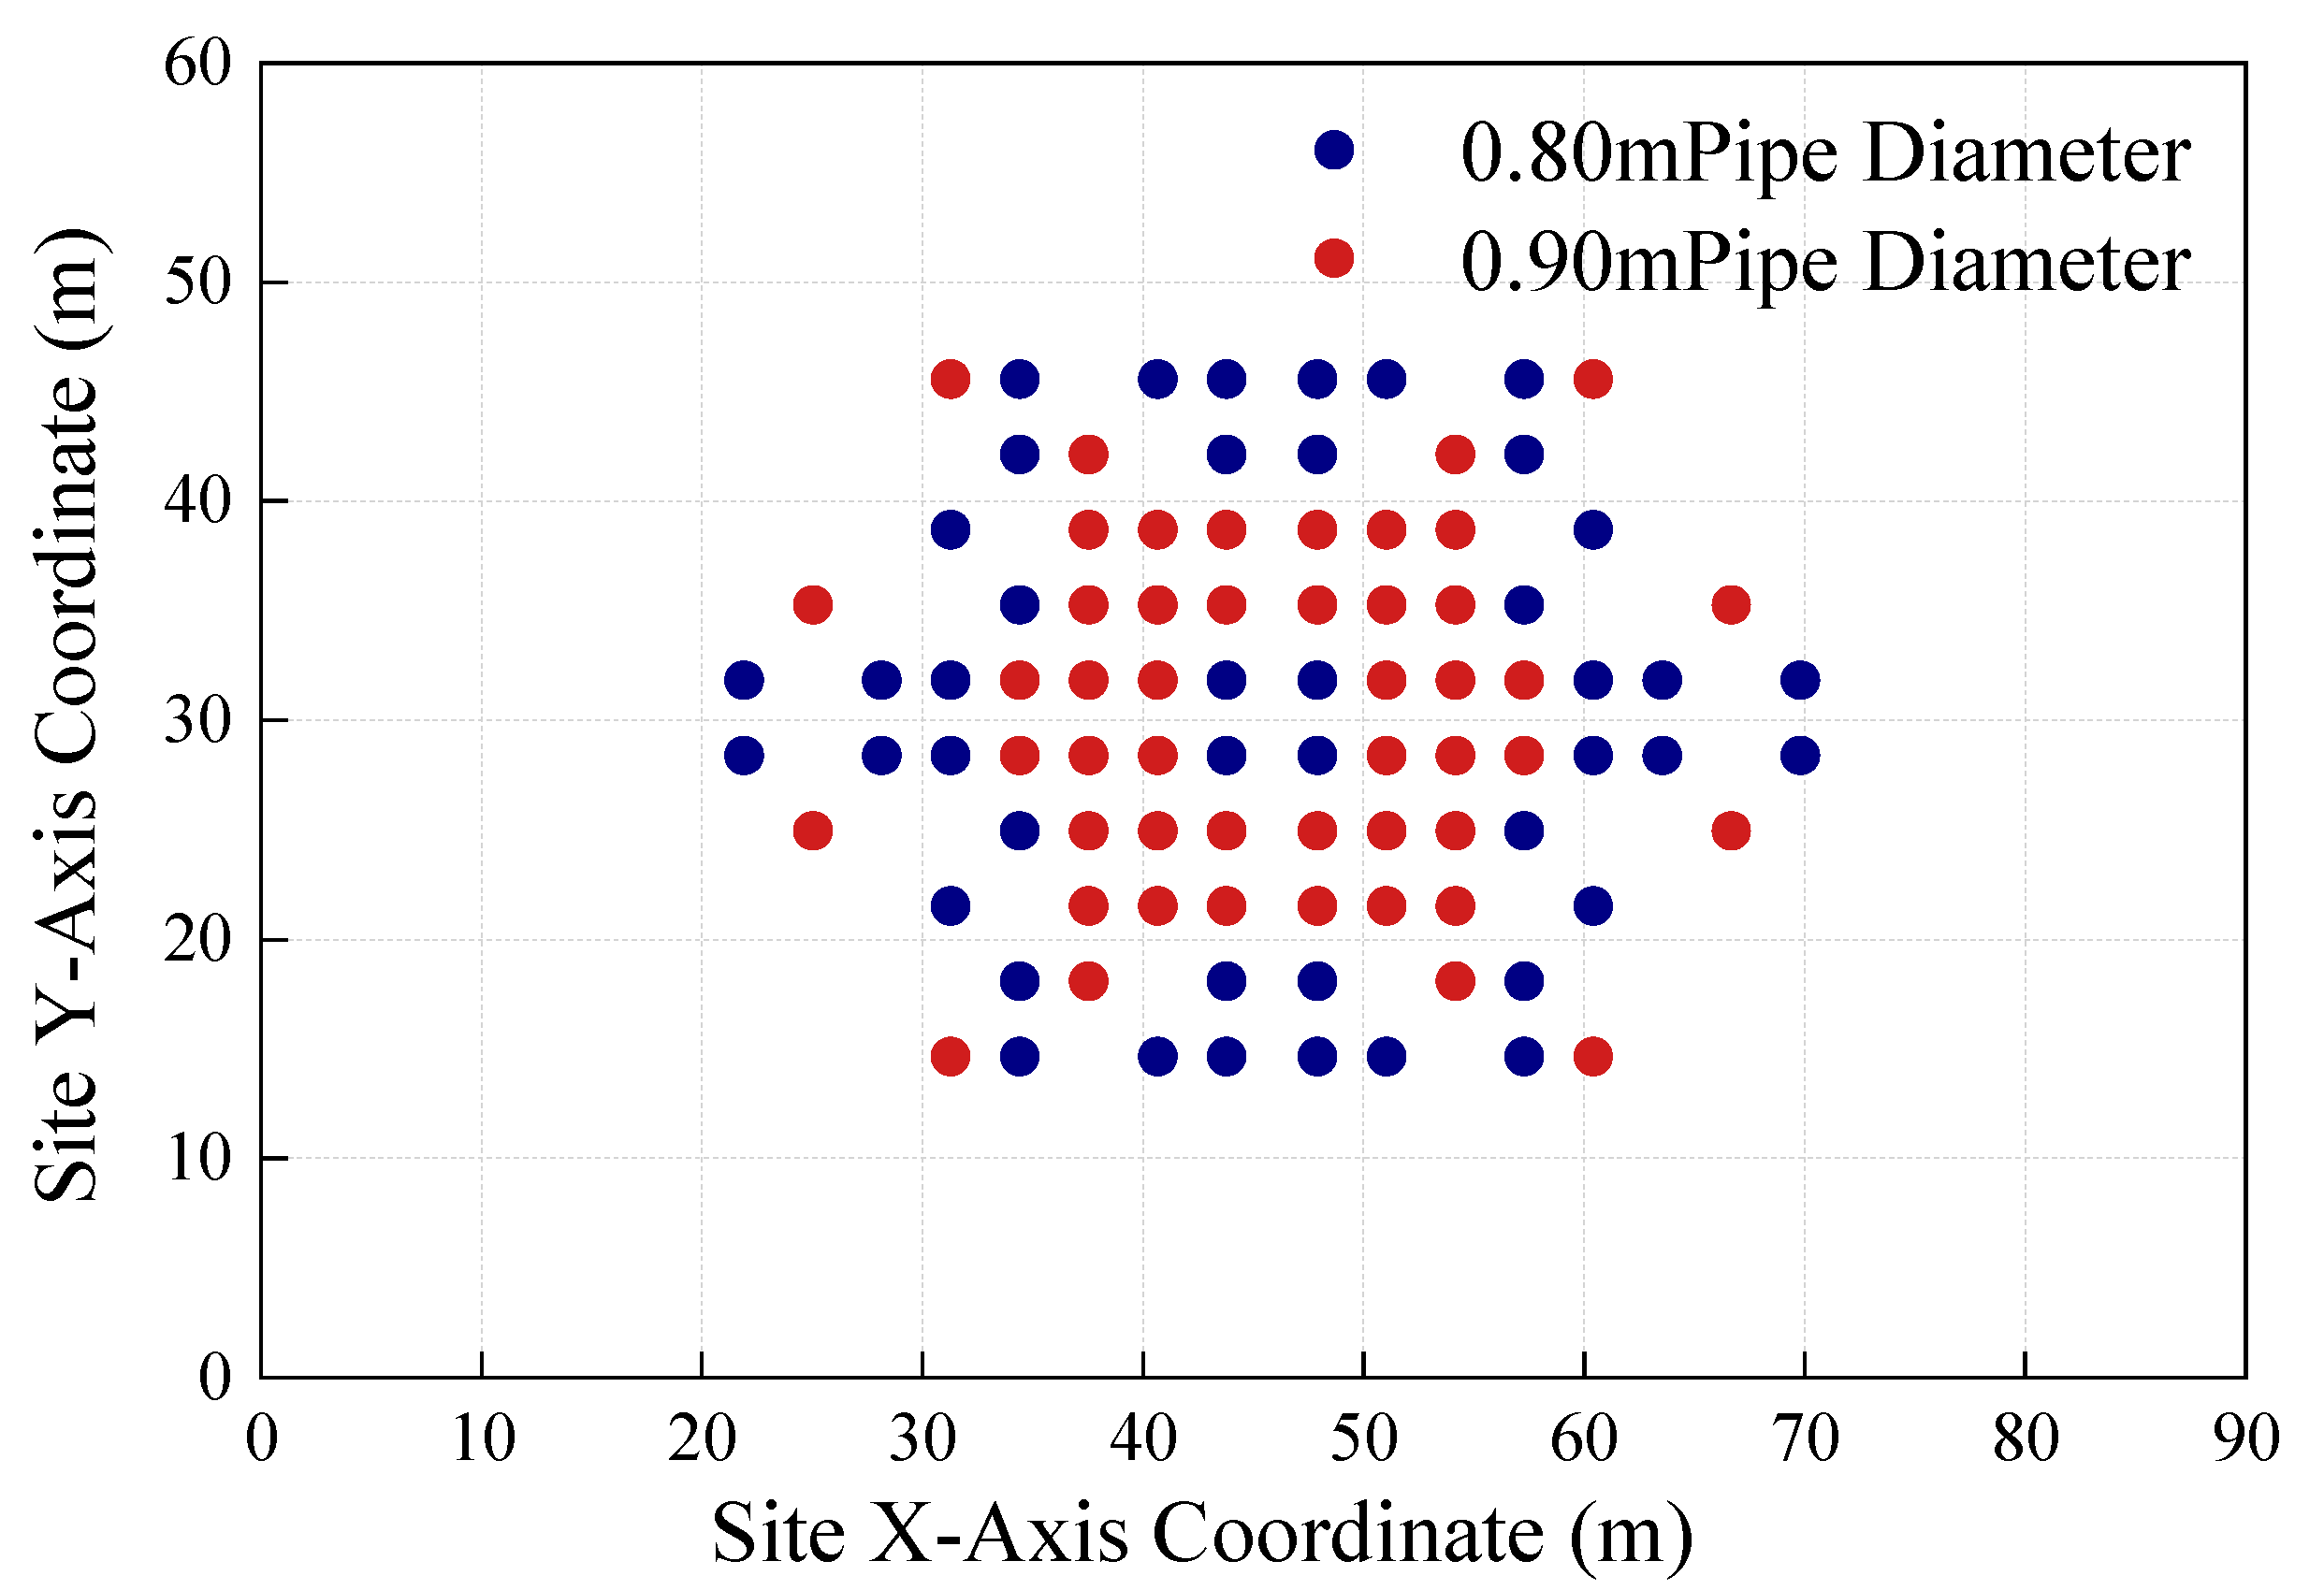
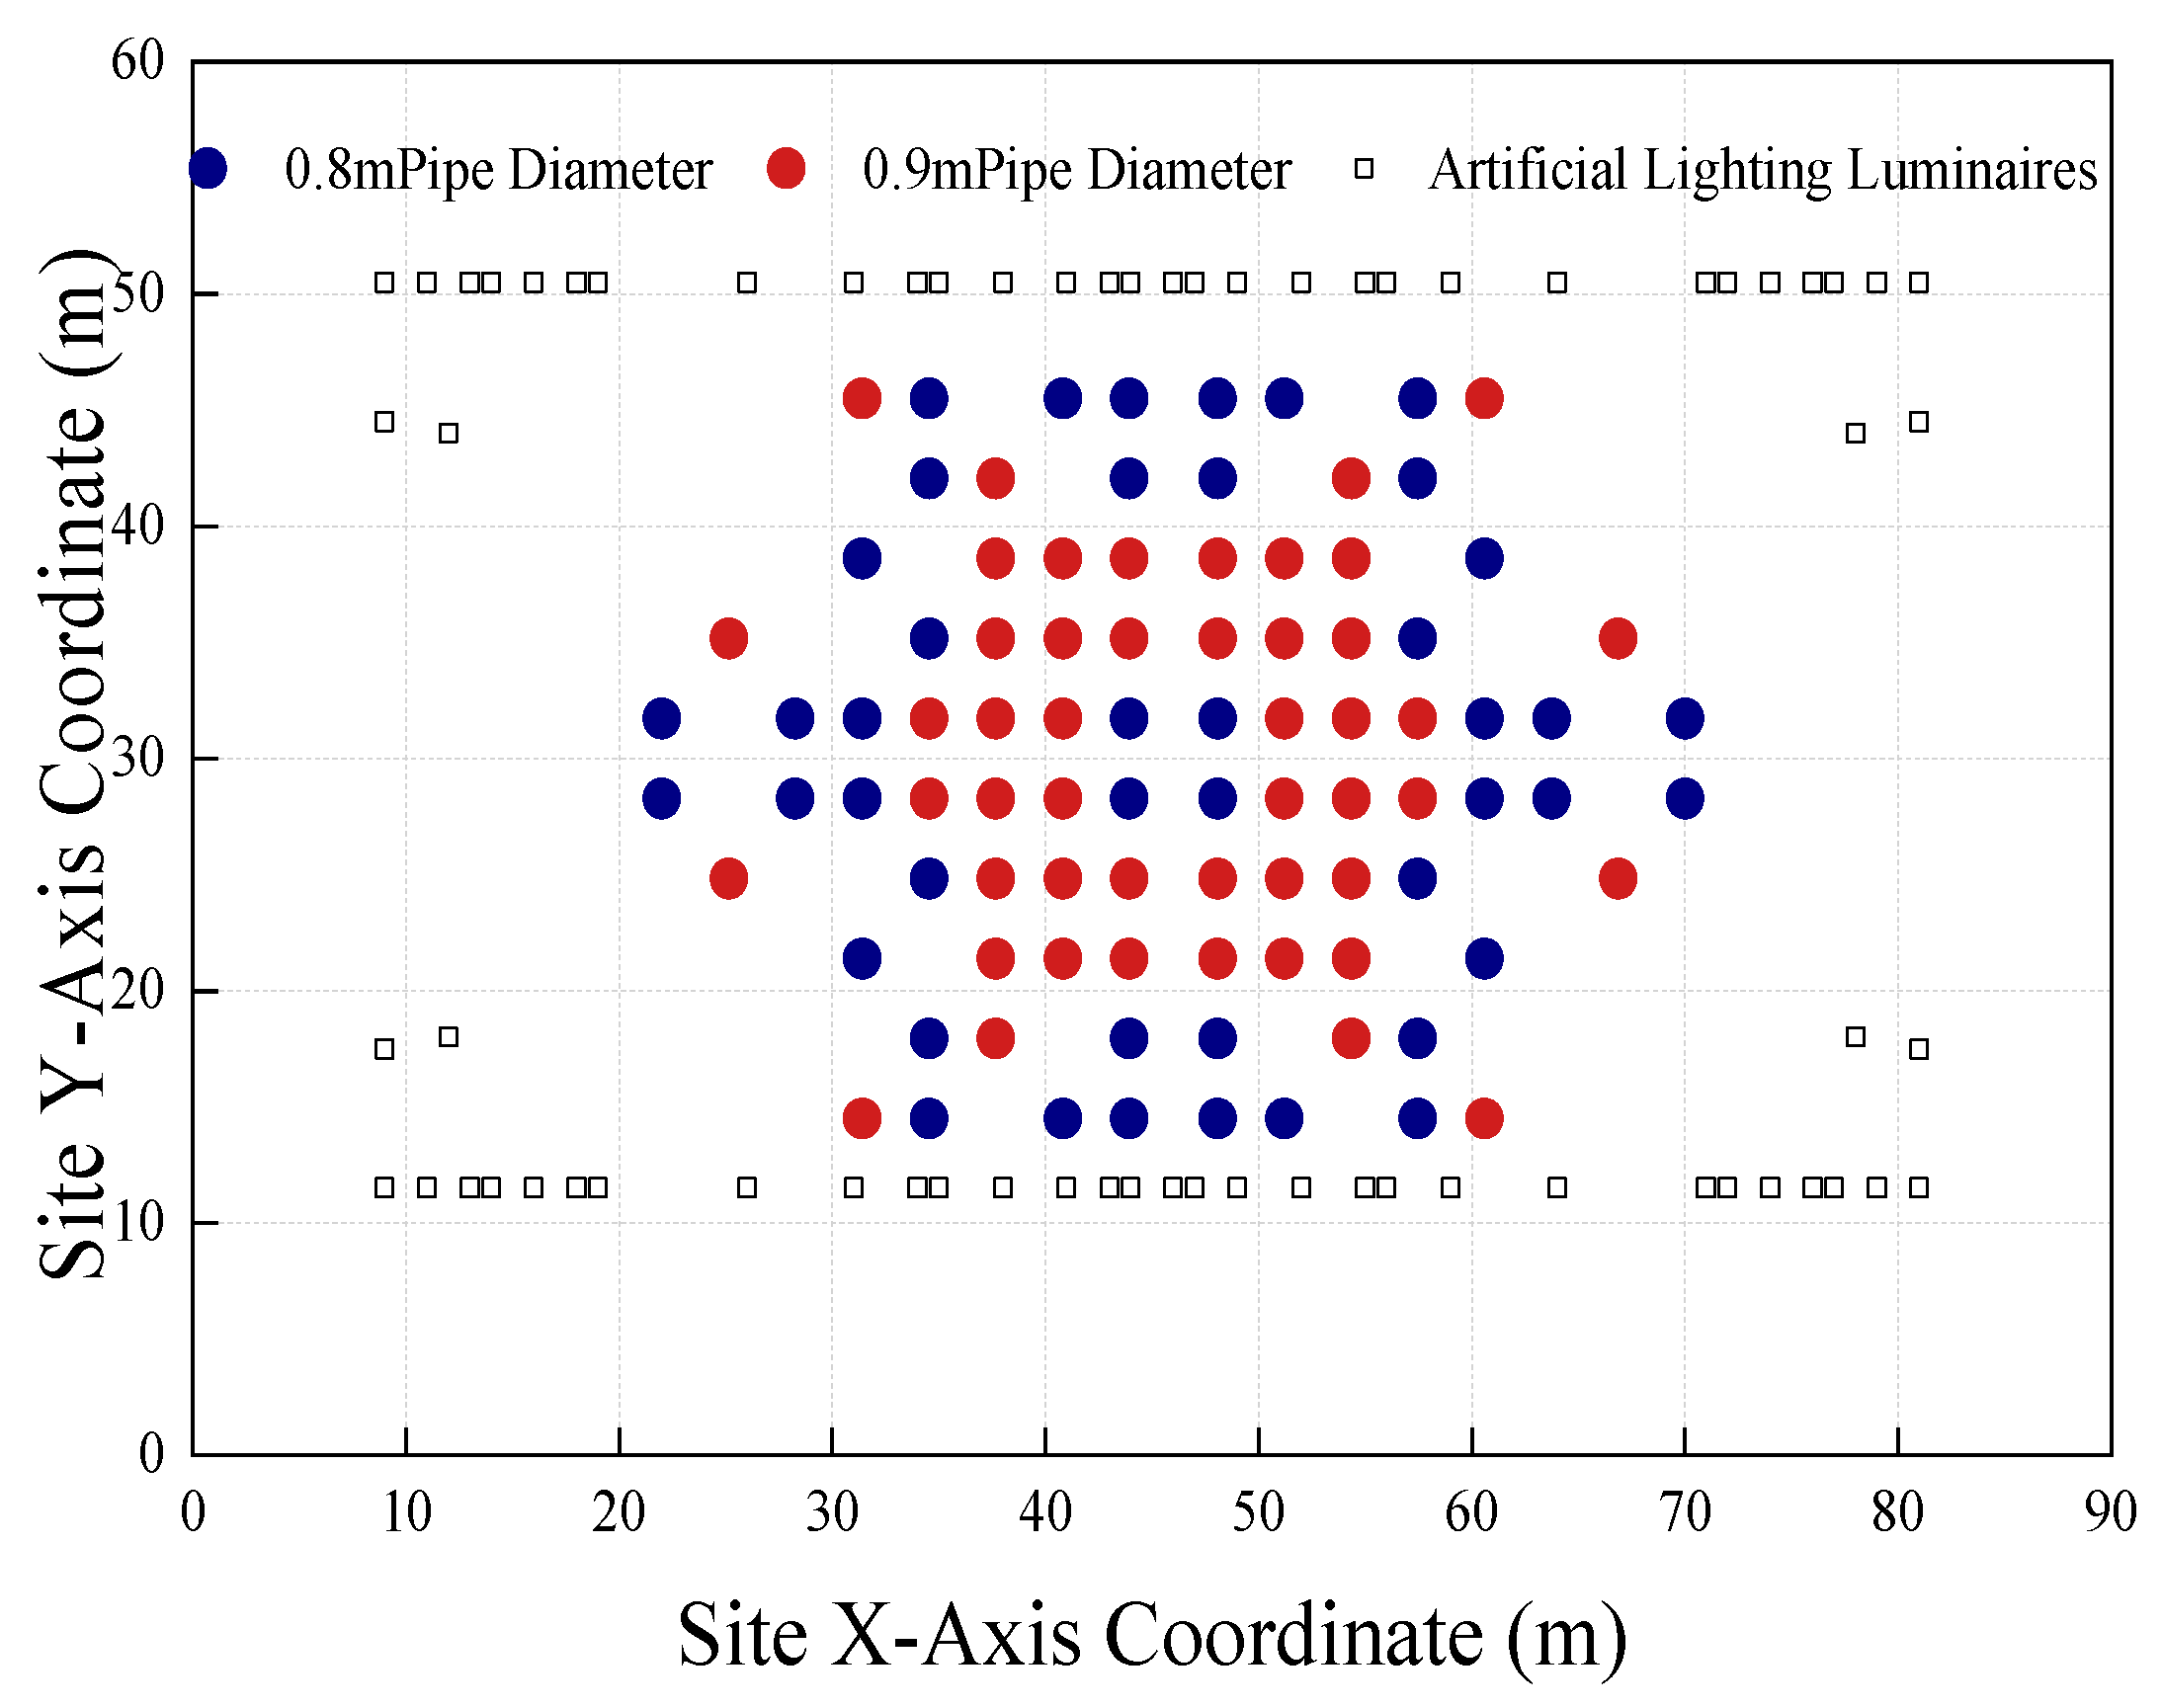
The optimized placement of the light pipe system is shown in
Figure 9. In the original design, 148 light pipes with the same size are used, each with a diameter of 550 mm and a length of 8 m. As per the cost estimation method proposed in this study, the system cost is calculated to be 408,900 yuan. In the optimized scheme, only 92 light pipes are used, with a calculated cost of 295,400 yuan. Thus, compared with the original design, the optimized scheme achieves a higher illuminance level while reducing the construction cost of the light pipe system by approximately 27.8%. The number of light pipes is reduced by 56, thereby significantly decreasing the number of roof openings and installation costs. This proves the superiority of the proposed optimization design method over conventional methods.
4. Optimal Control of Light Pipe Systems with Artificial-Lighting Systems
Owing to the inherent instability of natural lighting provided by light pipe systems, the indoor natural illuminance does not always meet the lighting requirements during routine activities in sports venues. Therefore, the light pipe system must be collaboratively controlled with the artificial-lighting system within the venue to meet the required illuminance levels for regular use, and the energy consumption of the artificial-lighting system must be minimized.
In this sports venue, the artificial-lighting system is installed along the catwalks (height: 18 m) on both sides of the field. The light pipe system is arranged above the field as per the optimization design described earlier. The layout is shown in
Figure 10.
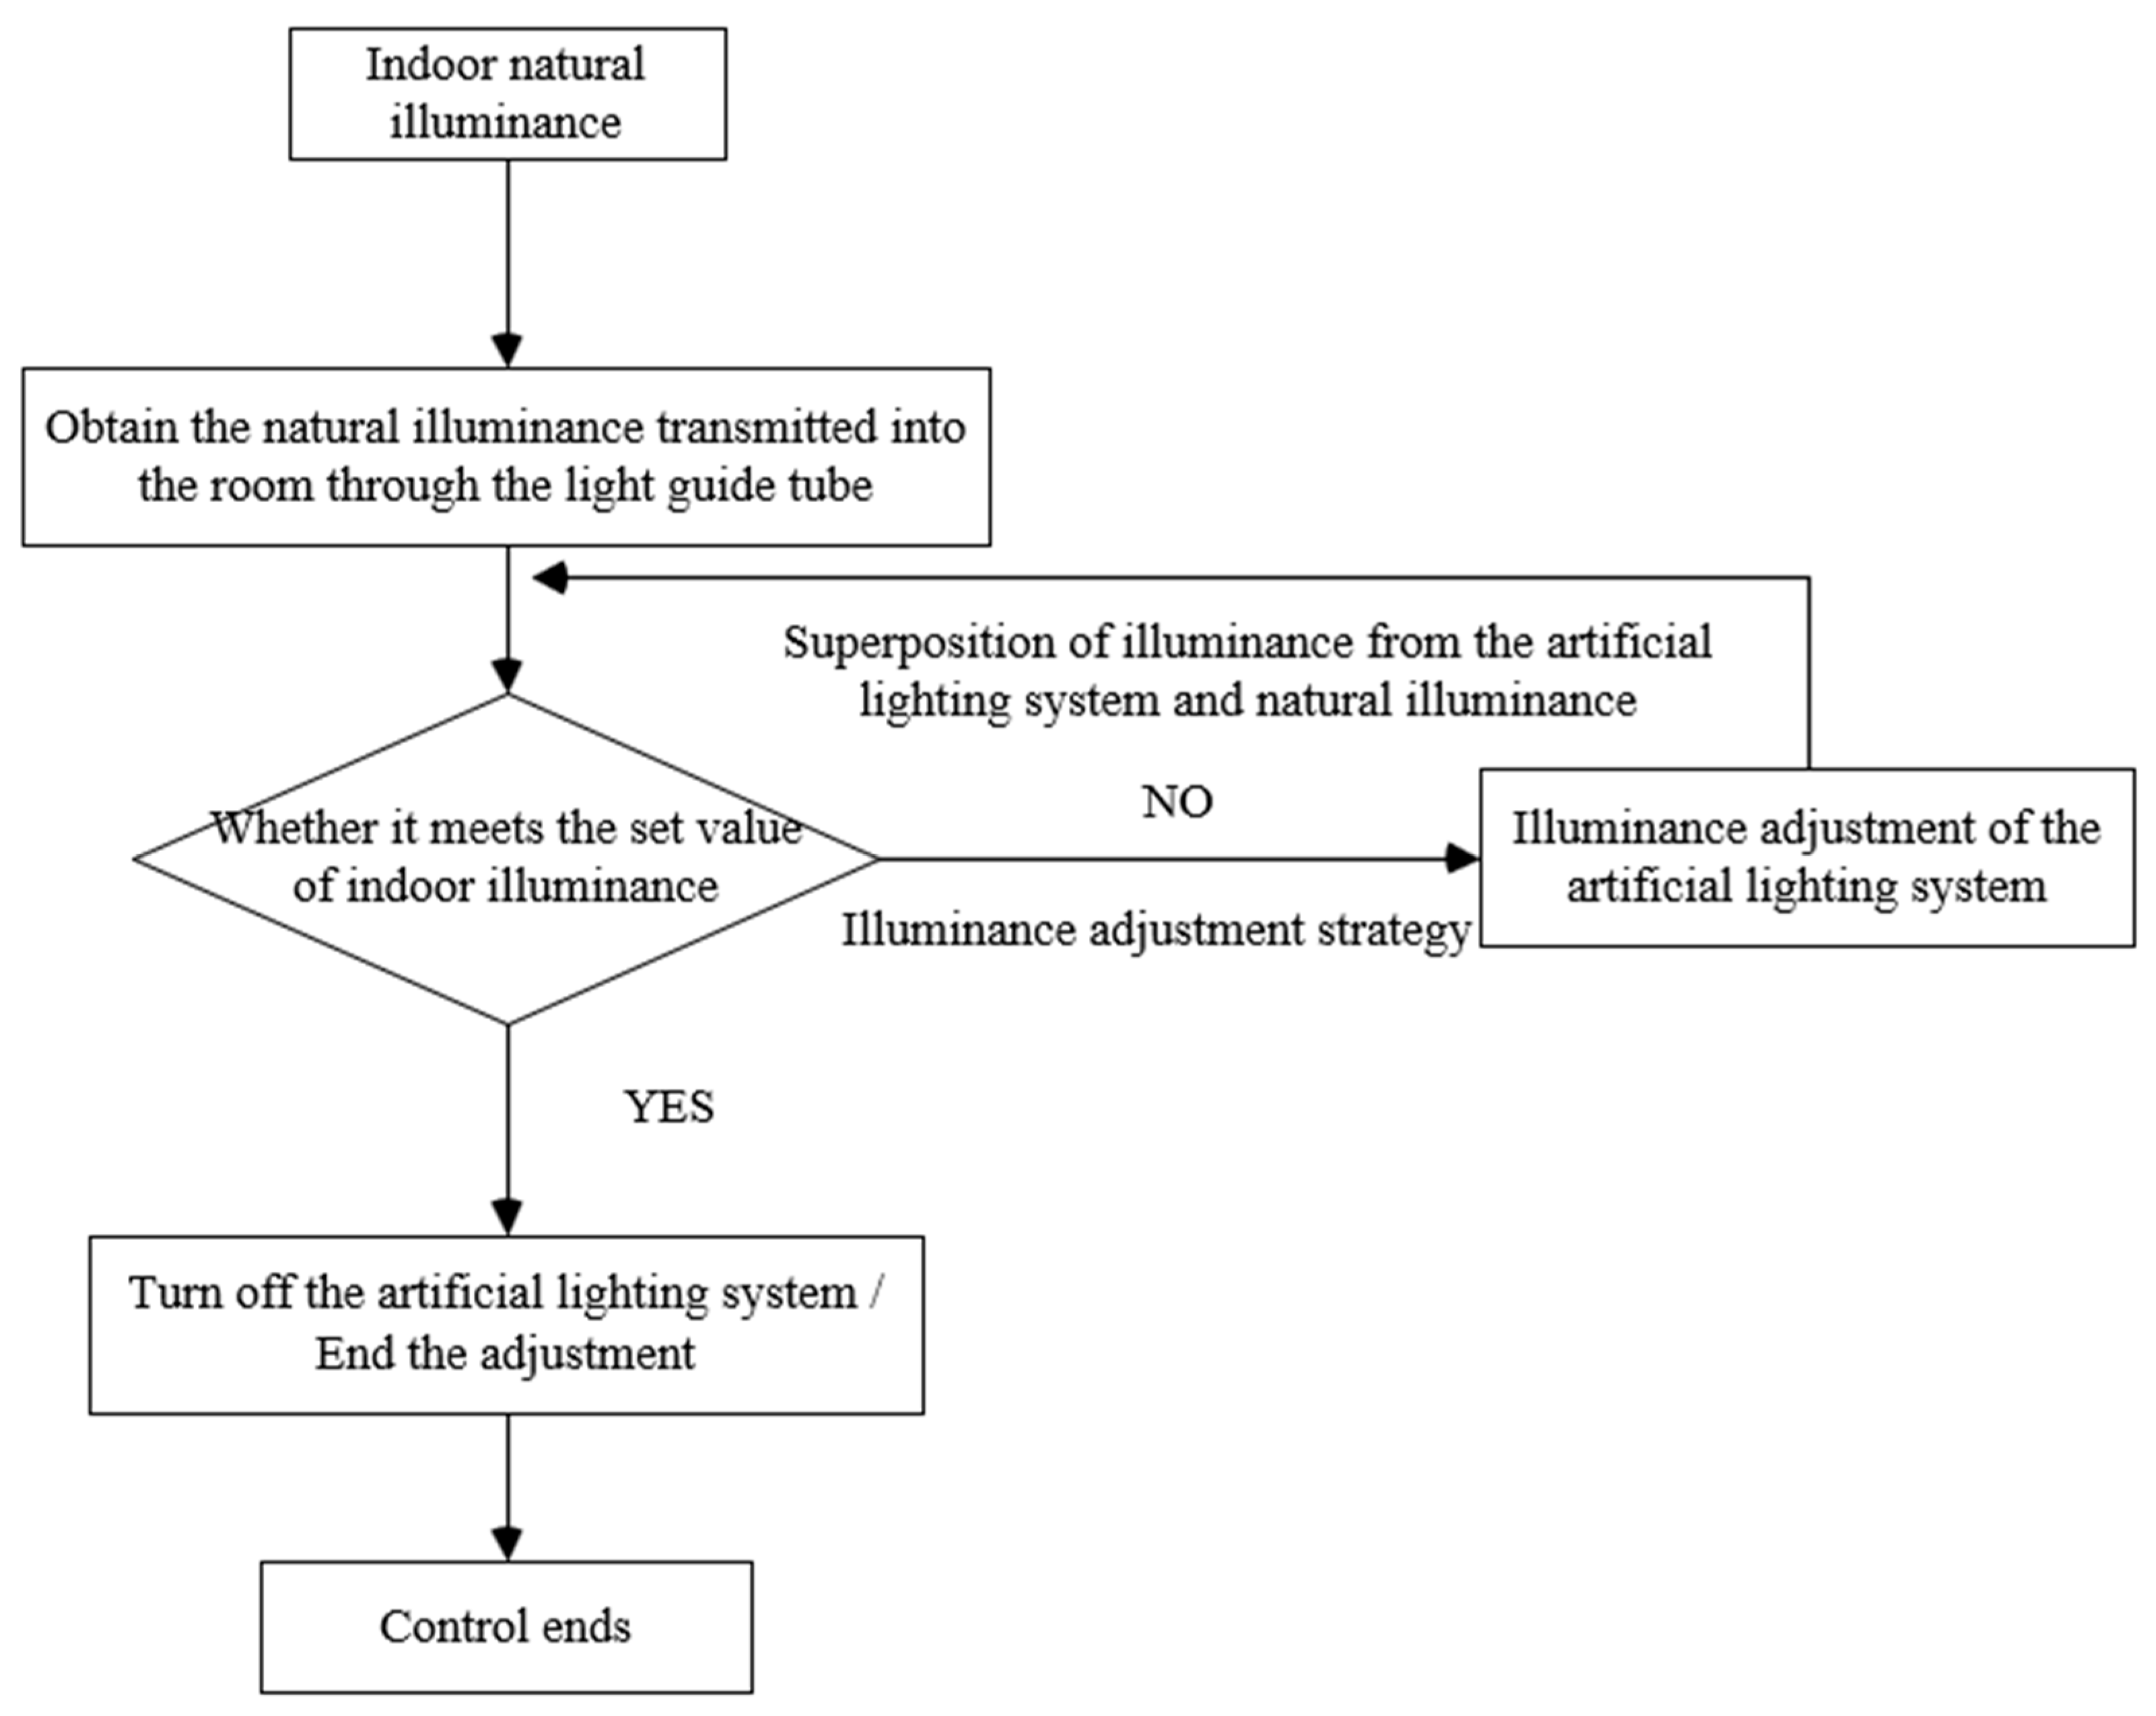
The flowchart of the collaborative control strategy between the light pipe system and the artificial-lighting system is illustrated in
Figure 11. When the exterior natural illuminance changes, it affects the interior natural illuminance delivered through the light pipe system. After the interior natural illuminance is computed, it is compared with the preset interior illuminance level. If it falls below the required level, supplementary lighting must be provided by the artificial-lighting system on the catwalks. The artificial-lighting system compensates for the illuminance deficit by adjusting the aiming angle and luminous flux of the luminaires, thereby ensuring that the interior illuminance level meets the standard. This strategy maximizes the utilization of natural light while ensuring compliance with lighting standards for the intended application, thereby effectively reducing the electricity consumption of artificial lighting.
4.1. Real-Time Illuminance Calculation Model for Light Pipe Systems
For light pipe systems, the primary reason for dynamic variations in the transmitted indoor natural light lies in changes in the transmission efficiency. Therefore, to perform real-time illuminance calculations, determining the real-time transmission efficiency of the light pipe system is necessary.
Simulation experiments were conducted using the HOLIGILM software for light pipes having various sizes under three sky conditions: overcast, partly cloudy, and clear. A total of 480 datasets of light-pipe-system transmission efficiency under these conditions were collected. The nlinfit function in MATLAB2018a can be used to perform nonlinear regression fitting on the data. This function enables nonlinear fitting based on a specified model. Before iteration, the initial values for the parameters of the nonlinear model must be defined. In this study, all initial parameter values were set to 1. The nonlinear model is expressed as follows:
where
y is the output, i.e., the transmission efficiency, and the other variables are the solar altitude angle, diameter of the light pipe, and length of the light pipe, respectively. Coefficients vary according to the sky conditions. The specific values for different sky conditions are listed in
Table 2.
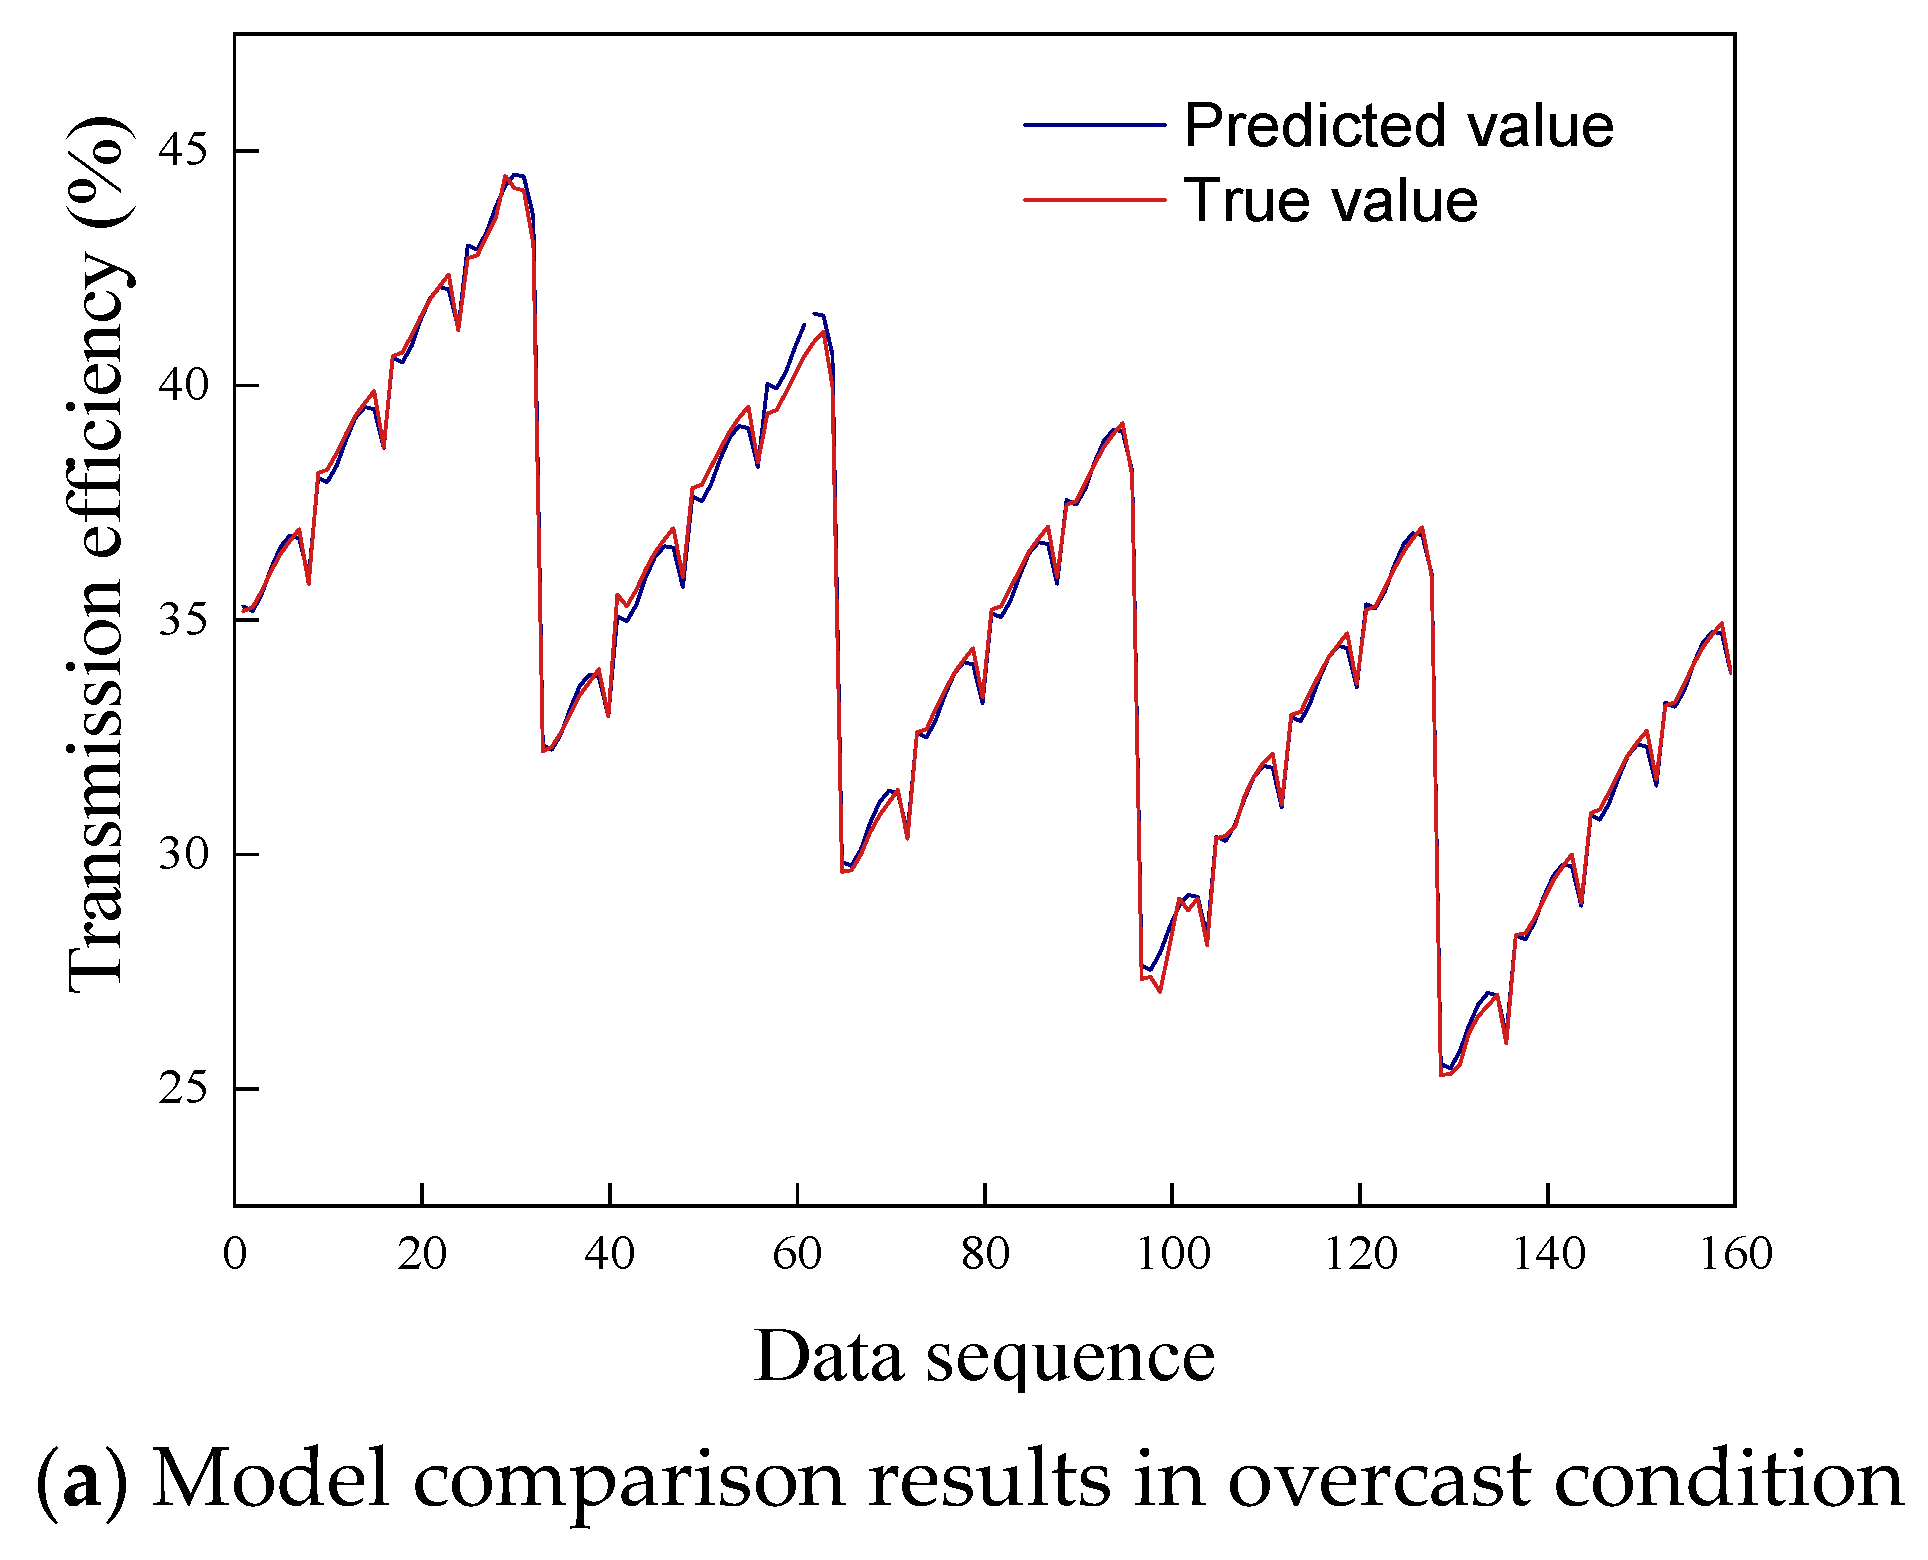
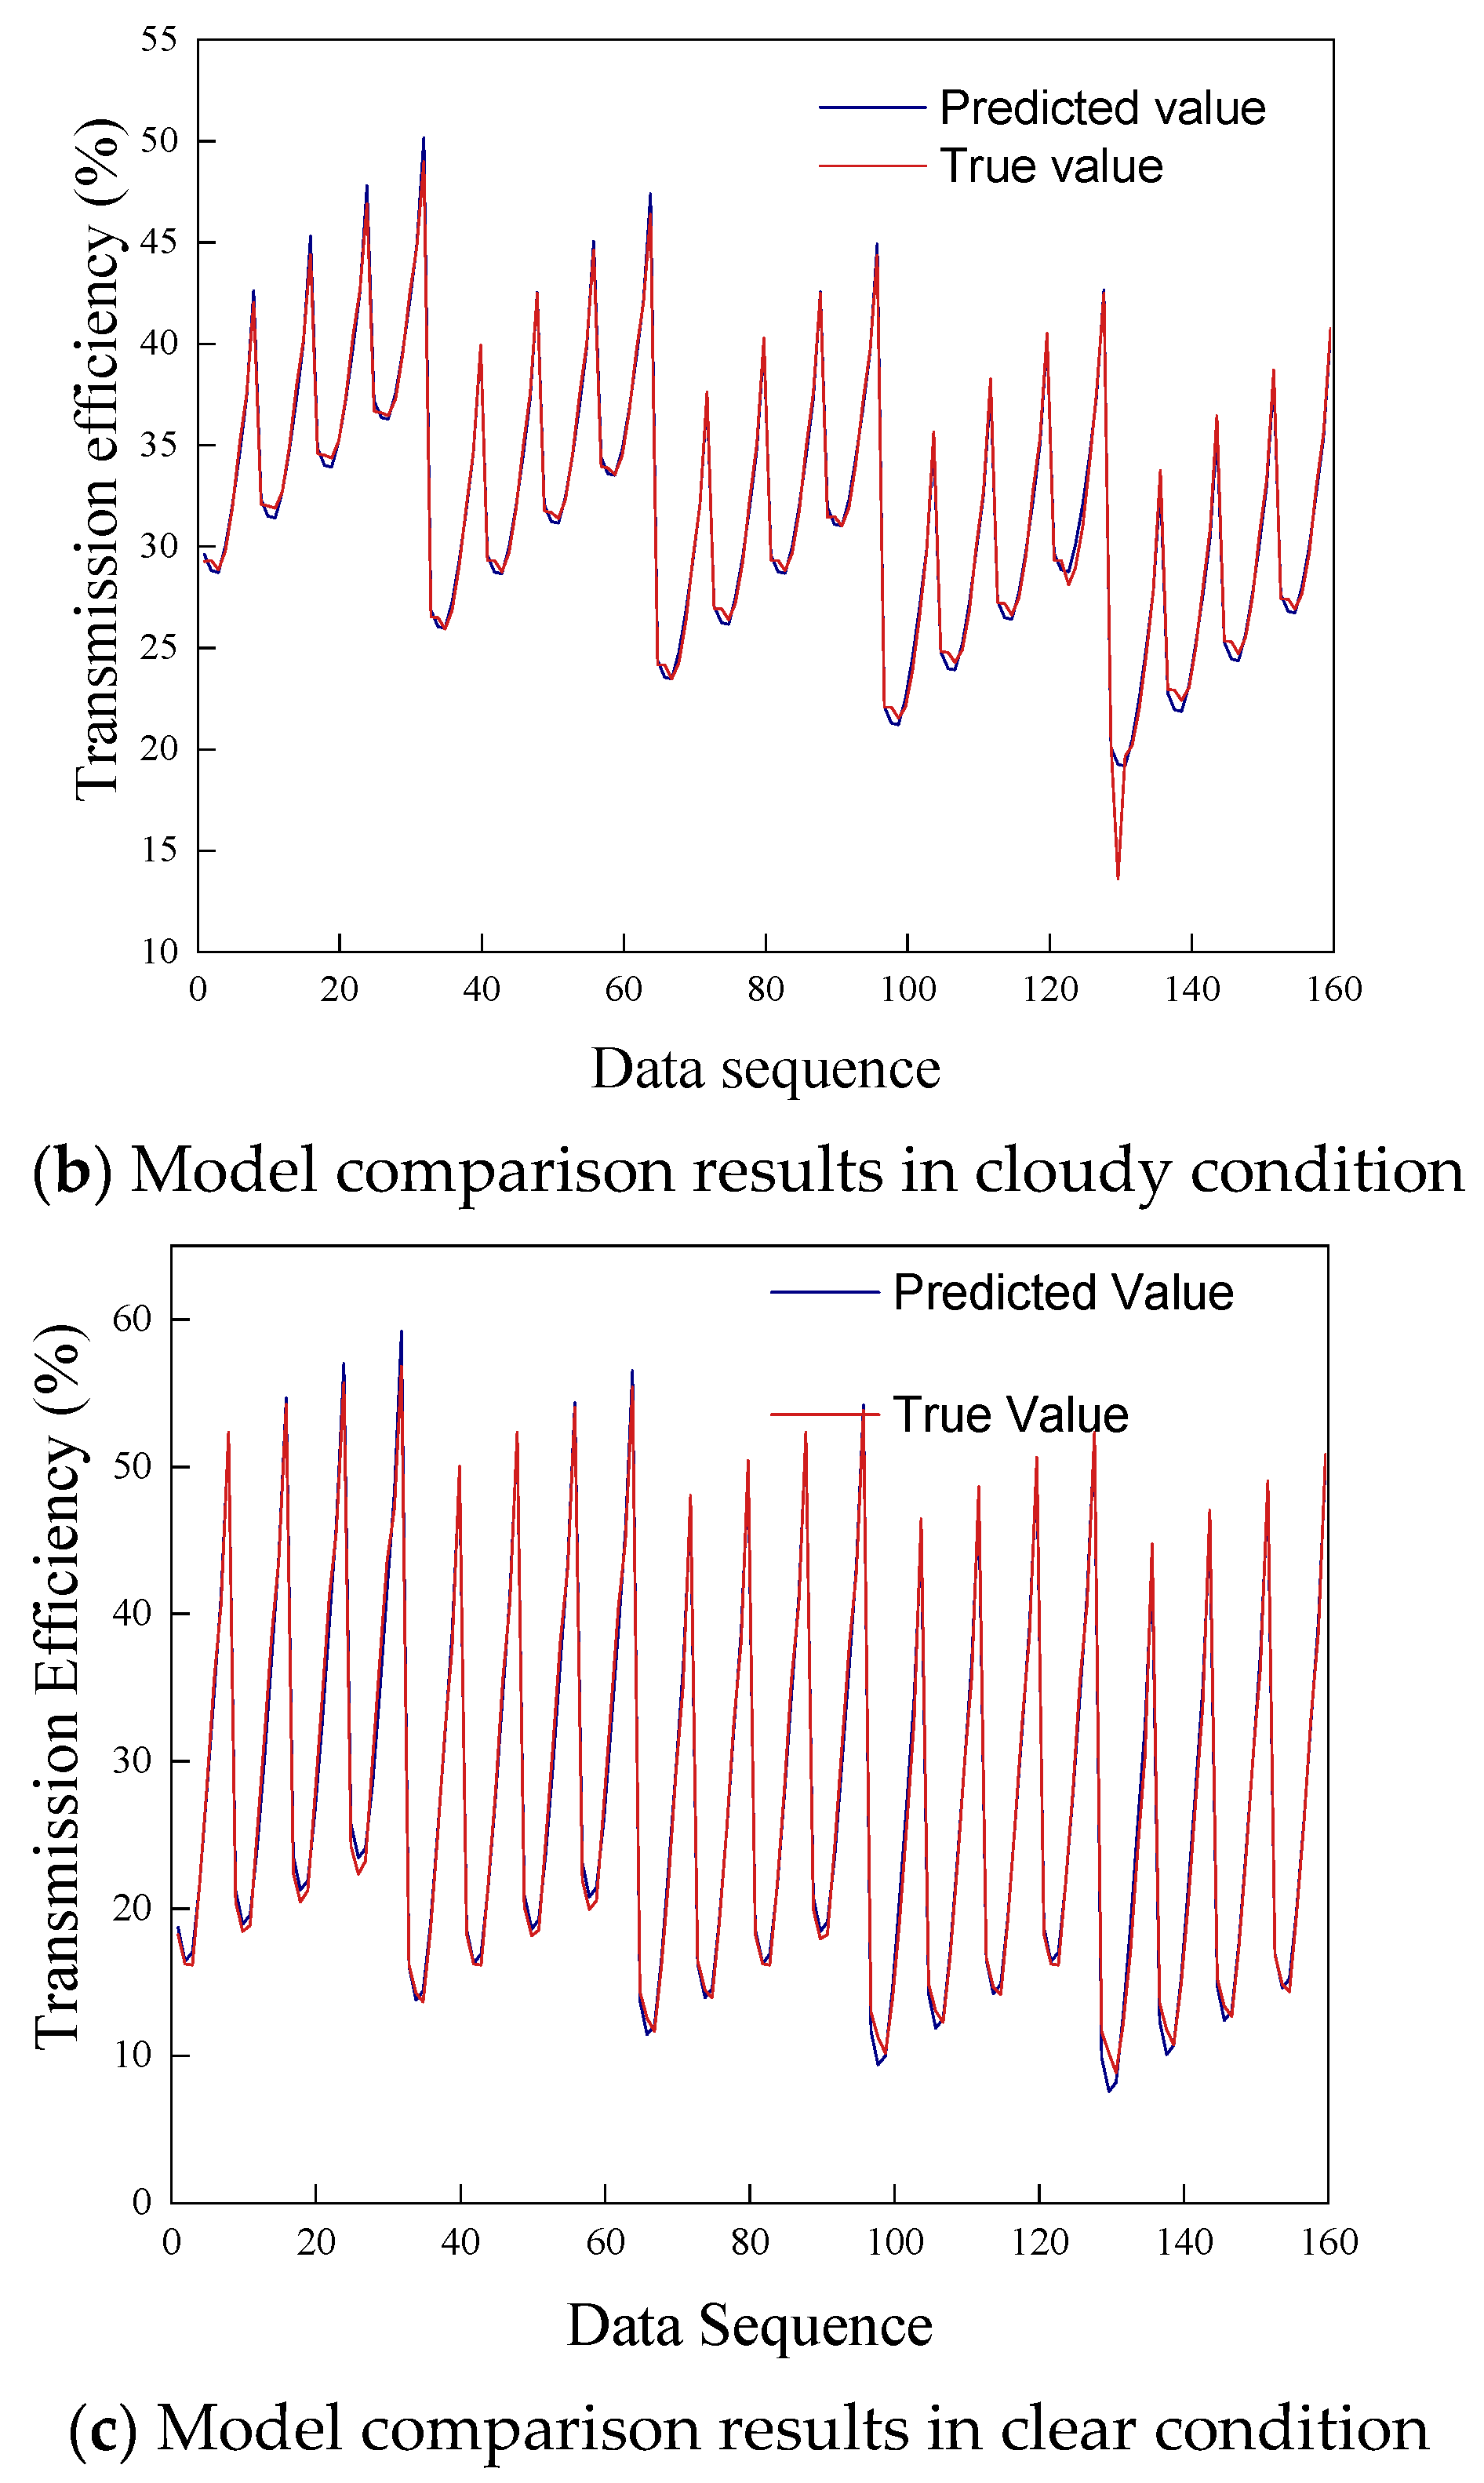
The predicted values and the simulation results are compared in
Figure 12.
In
Figure 12, the horizontal axis represents the statistical data, and the vertical axis represents the transmission efficiency. Under the overcast condition, the model yields an R2 value, a measure of goodness-of-fit, of 99.74% and a mean square error (MSE) of 0.0543. Under the partly cloudy condition, the R2 value is 99.09% and the MSE is 0.3754. Under the clear condition, the R2 value is 99.45% and the MSE is 0.9102. Therefore, this model achieves a good fitting effect and is suitable for predicting the transmission efficiency of light pipe systems under various exterior weather conditions.
With the real-time transmission efficiency of the light pipe system, real-time illuminance calculations can be performed. Thus, the light pipe system can be considered as a luminaire with a variable luminous flux. Therefore, based on a known luminous intensity distribution curve of a light pipe system, the luminous intensity can be calculated according to the changing transmission efficiency, as shown in Equation (10).
4.2. Controlling Illumination in Artificial Lighting Systems
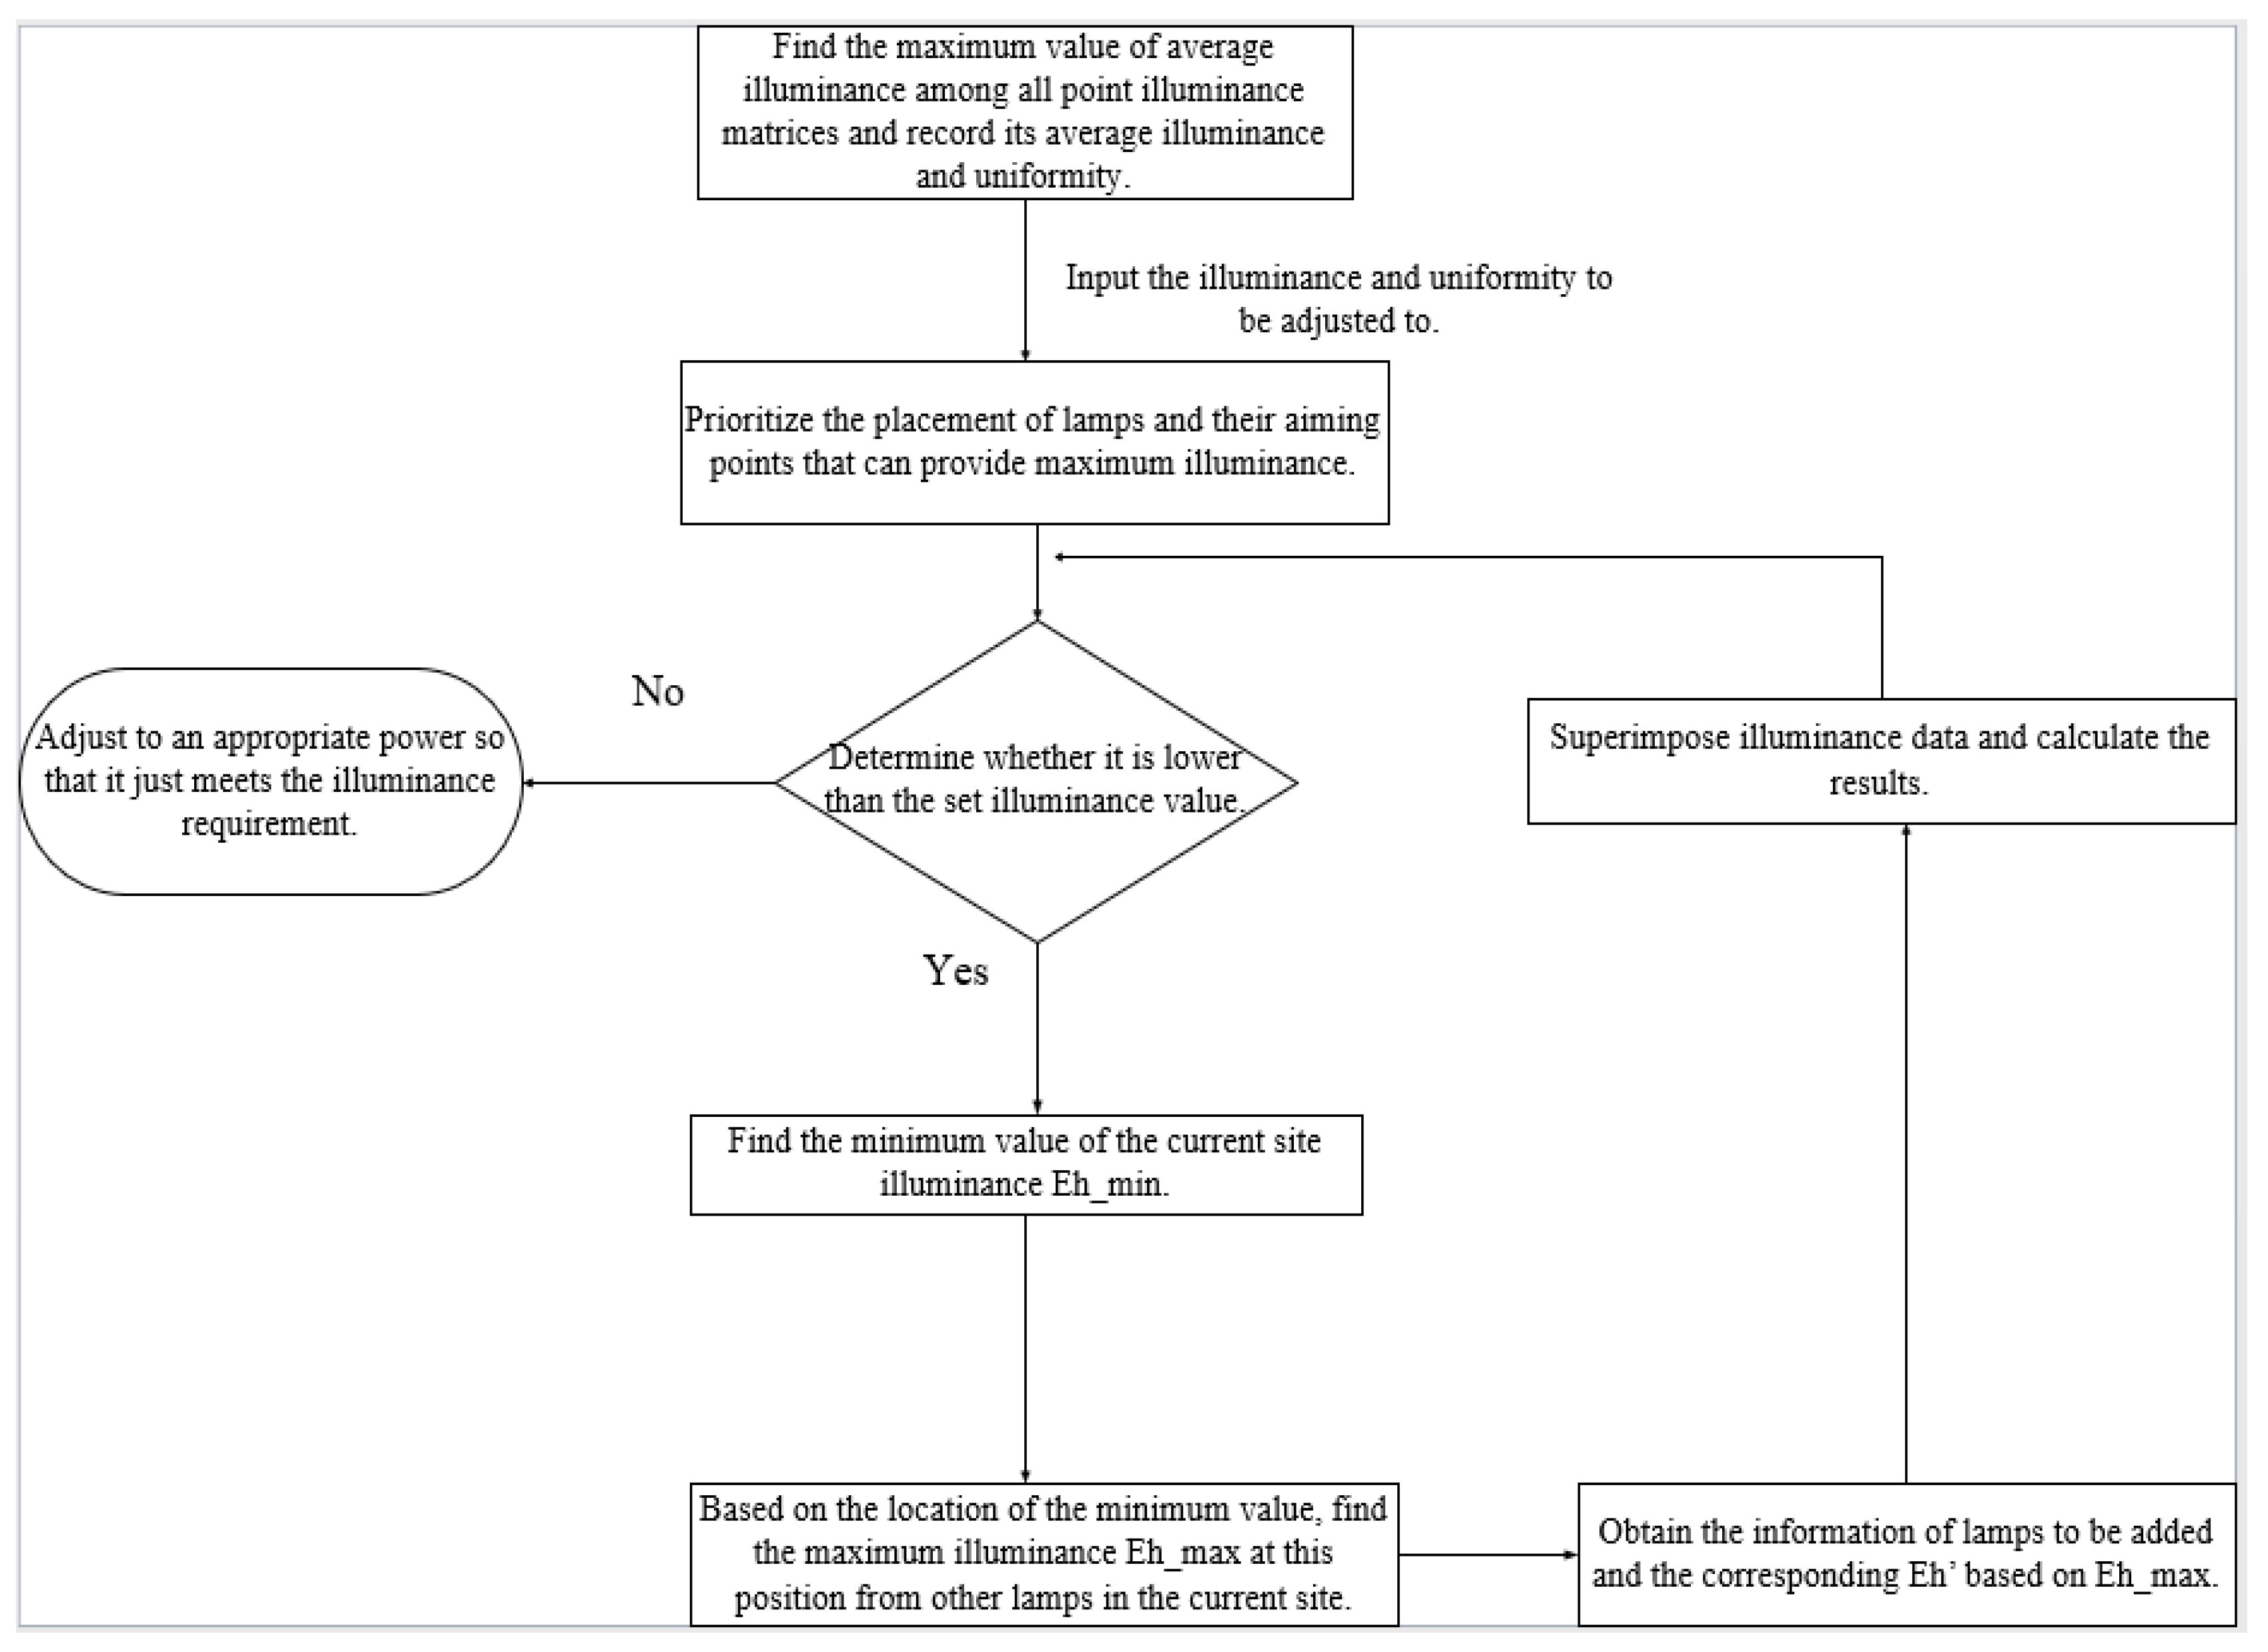
Sports venues commonly use artificial lighting systems with adjustable illuminance output to the field of play by controlling parameters such as the aiming angle of luminaires (aiming point) and their luminous flux. This can be modeled as an optimization problem of achieving the target illuminance as quickly as possible with the fewest luminaires and the lowest energy consumption. Classical optimization algorithms include particle swarm optimization, genetic algorithms, and simulated annealing. Although these algorithms can theoretically achieve globally optimal solutions with sufficient iterations, in practice, control systems for artificial lighting systems must adapt in real time to variations in the amount of natural light supplied by light pipe systems. This requires rapid decision-making; the algorithms listed above all involve lengthy iterative processes and are therefore unsuitable. In contrast, the greedy algorithm, also known as the hill-climbing algorithm, offers a simple and fast strategy for optimization problems, albeit with some notable limitations. In principle, this algorithm approaches the optimum iteratively, step by step. The problem of controlling the illumination provided by artificial lighting systems in sports venues is analogous to the classic “coin change” problem in greedy strategies: luminaires that provide higher illuminance levels are preferentially selected to meet the required illuminance, which also minimizes the number of luminaires that need to be switched on. A flowchart showing our approach to control the illuminance provided by an artificial lighting system based on the greedy strategy is shown in
Figure 13 below.
For daily non-event scenarios, the average horizontal illuminance (Eh) was set to 300 lx. No requirement was imposed on uniformity U1, whereas uniformity U2 was set to 0.3. These set values were input into the greedy algorithm. All luminaires were arranged by the serial number, and the output included key information such as the serial numbers of the selected luminaires, aiming points, average horizontal illuminance Eh_av, uniformity, and the adjusted power of the selected luminaires.
If the natural illuminance transmitted by the light pipe system is assumed to be zero, the artificial-lighting system must provide an average horizontal illuminance of 300 lx within the venue, with uniformity U2 of no less than 0.3, as per the specified illuminance criteria. The luminous flux control accuracy of the luminaires was set at 1%. As the luminous flux is directly proportional to the interior illuminance and does not affect uniformity, the current average illuminance can be calculated based on the variation in the luminous flux. The control results at this stage are presented in
Table 3.
The results show that when the target interior illuminance level is set to 300 lx, only luminaire No. 17 and three other luminaires that are centrally symmetrical to it are activated. According to the previously described greedy strategy, the horizontal illuminance achieved at the aiming point of luminaire No. 17 is higher than that of other luminaires. As the dimming control precision of the luminaires is set to 1%, the power ratio of the luminaries is adjusted to 89% to match the target horizontal illuminance level of 300 lx as closely as possible. Thus, the current illuminance is 302.6 lx on the field. Because the indoor Class I (non-tournament) lighting standards only require U2 and do not specify a minimum for U1, the requirement is considered to be fulfilled as long as U2 is satisfied even if U1 remains low. If the overall uniformity needs to be higher, more luminaires must be added.
4.3. Energy Efficiency Analysis of Field Lighting Under Optimal Control
We implemented the collaborative control method through programmed simulation and conducted an energy efficiency analysis of field lighting. Many studies have demonstrated the correlation between clear-sky indices and different weather conditions. The clear-sky index is generally below 0.3 under the overcast condition and below 0.6 under the partly cloudy condition. Accordingly, the clear-sky index (kt) can be categorized under three types of sky conditions: overcast (0 ≤ kt ≤ 0.3), partly cloudy (0.3 < kt ≤ 0.6), and clear (0.6 < kt ≤ 1.0). Based on this, the current sky condition can be determined by monitoring changes in the clear-sky index.
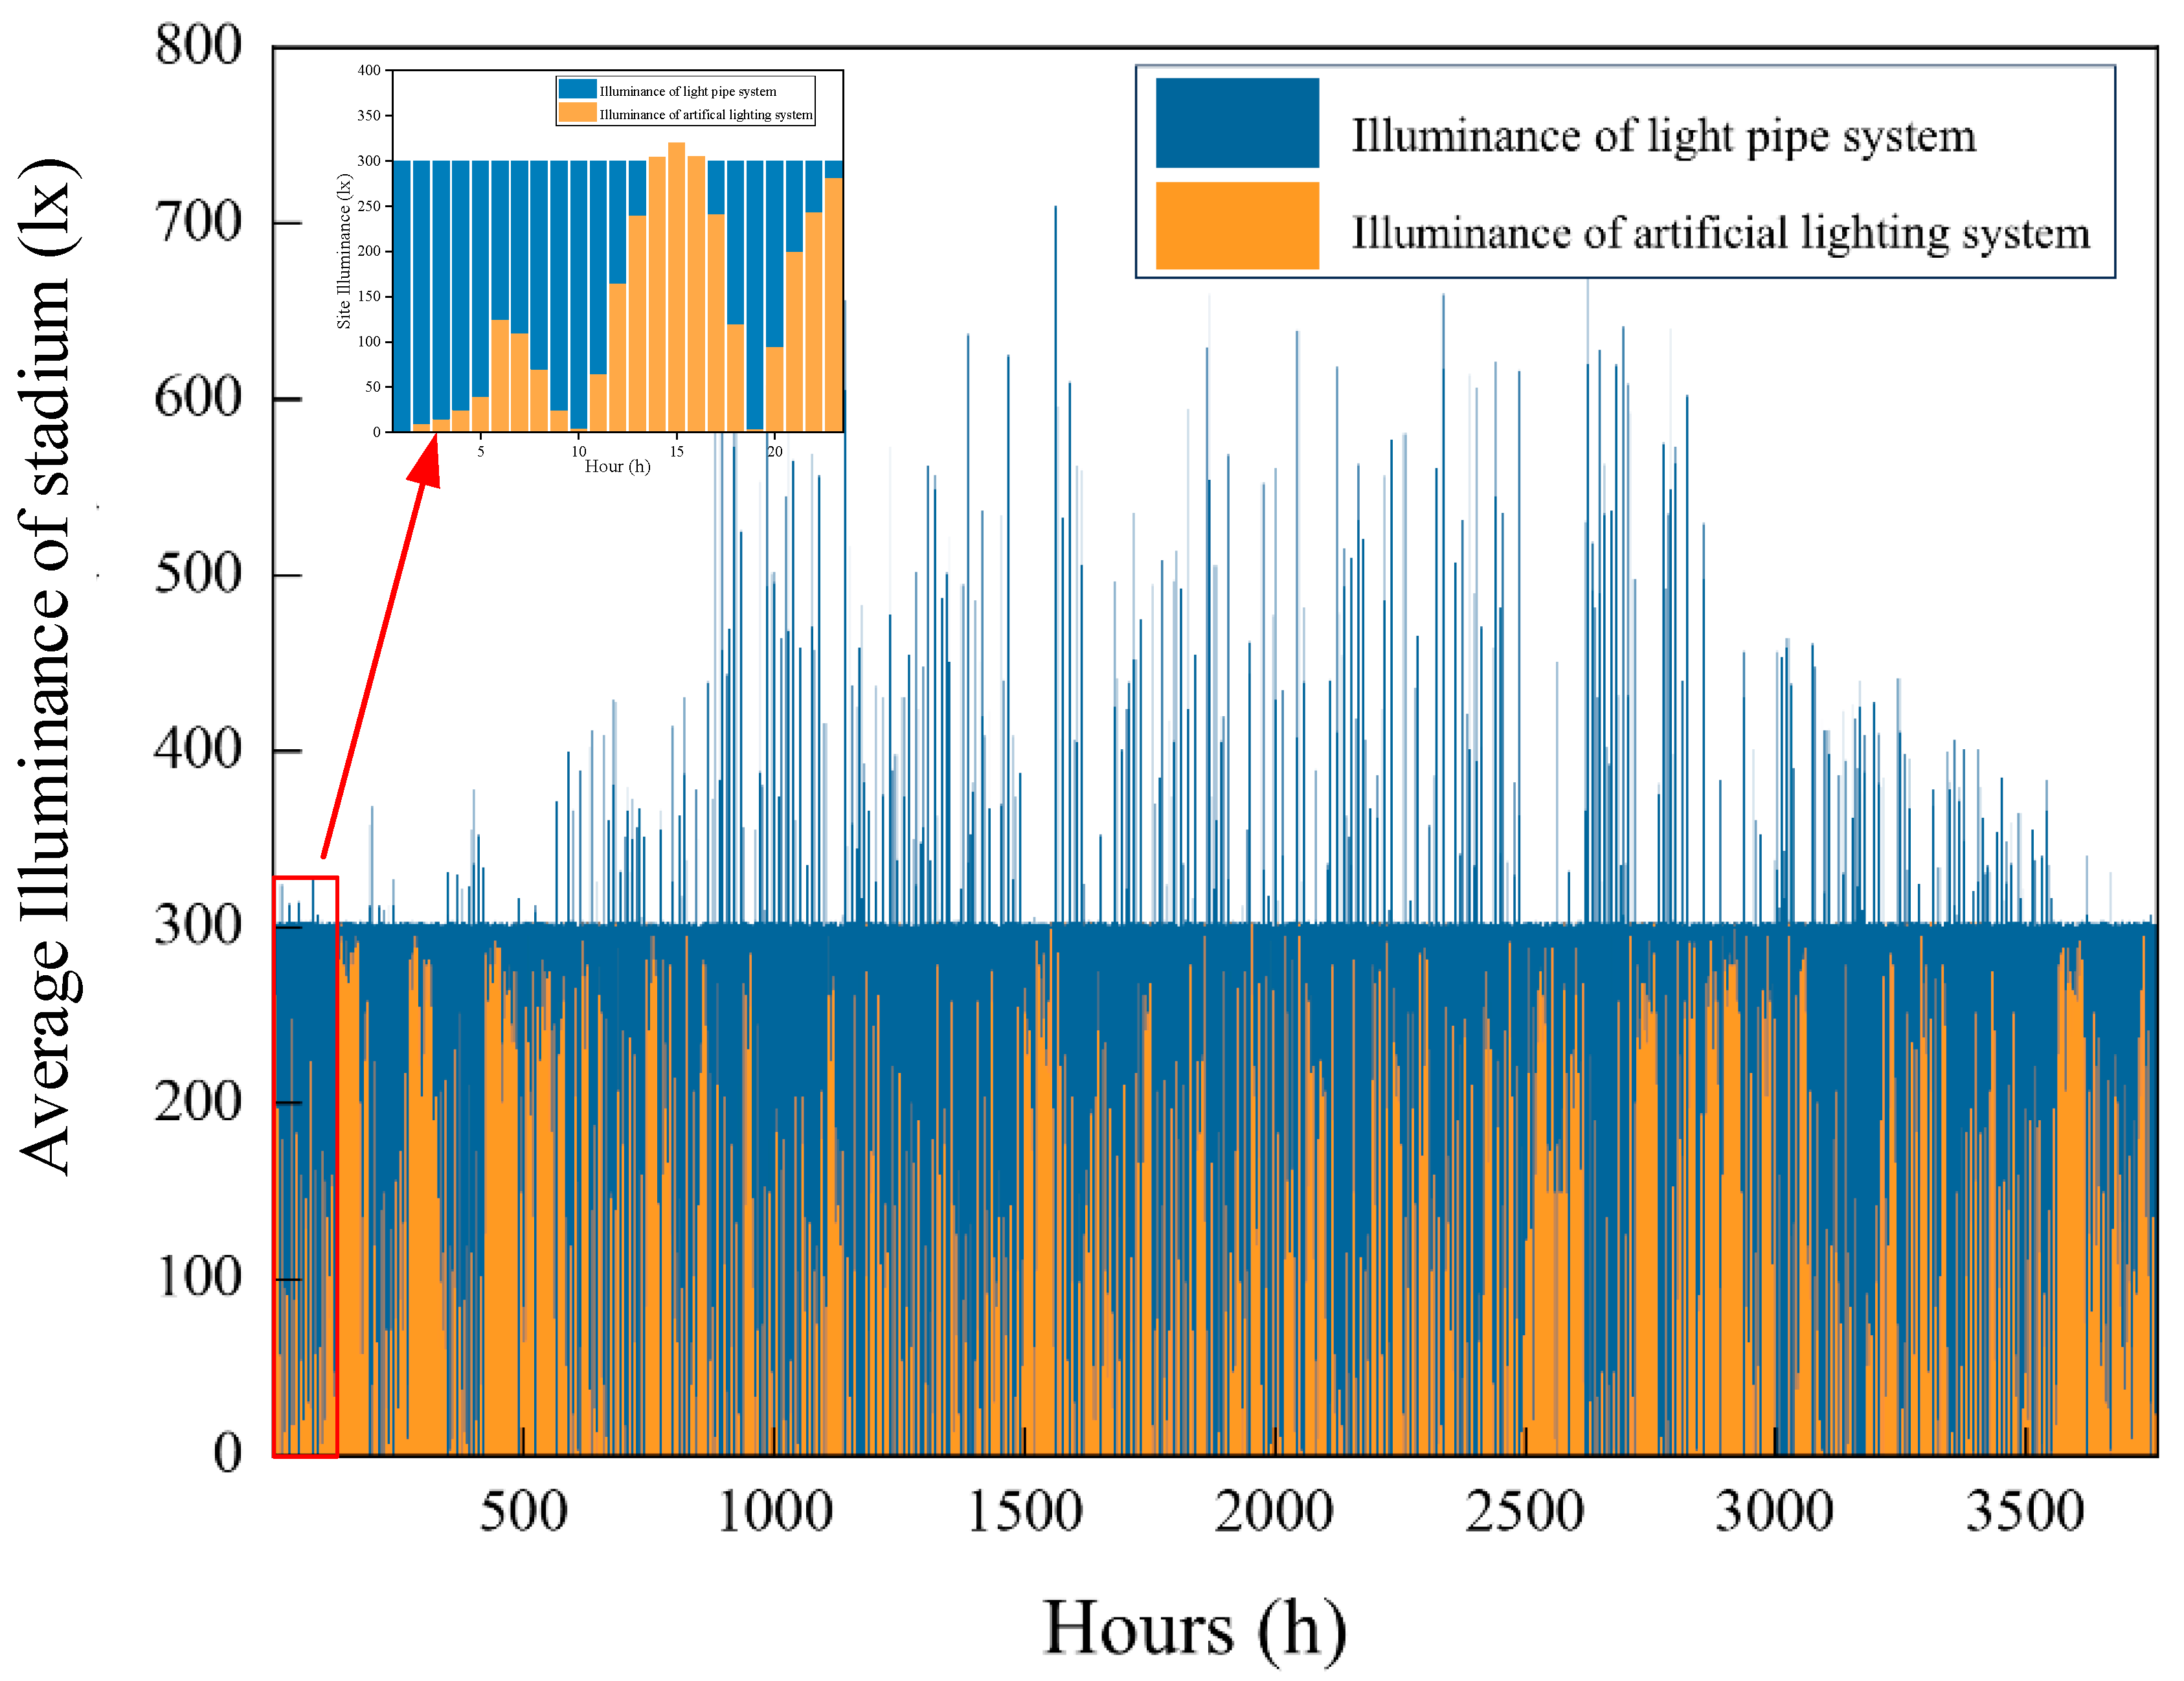
The meteorological data measurement facility is located on the rooftop of a stadium in Xi’an and can perform hourly monitoring of the current exterior illuminance, clear-sky index, and other parameters. We calculated the solar altitude angle based on the latitude, longitude, and time of the location. To ensure rigorous simulation validation, meteorological data for 1 year was collected from Xi’an. Data points corresponding to night hours (when the exterior illuminance is zero) and non-operating hours of the stadium were excluded, resulting in 3760 valid hours. We assumed that no major events occurred in the stadium during the year and that the stadium remained open for daily training activities. During this period, the light pipe and artificial-lighting systems operated in the collaborative control mode to maintain stable field illuminance that complied with the Class I (non-tournament) lighting standards. The average horizontal illuminance standard of the field was set at 300 lx, with a uniformity of illuminance (U2) of 0.3. The collaborative control algorithm for the light pipe and artificial-lighting systems was developed in MATLAB and simulated using the 3760 h of annual meteorological data from Xi’an. The results are shown in
Figure 14. To present the results more clearly, the first 24 h of the annual data are extracted for detailed analysis.
In
Figure 14, the horizontal axis represents the cumulative number of hours across the year, whereas the vertical axis represents the average horizontal illuminance within the field. The blue bars indicate the natural illuminance provided by the light pipe system, and the red bars represent the illuminance provided by the artificial-lighting system. The result indicates that the light pipe system provides more than 300 lx of illuminance to the field for 771 h throughout the year. During these periods, artificial lighting should be turned off to save energy. During all other times, the combined illuminance from the artificial-lighting and light pipe systems consistently meets the 300 lx standard. This suggests that the collaborative control method effectively integrates both systems, maintaining stable illuminance levels while achieving energy savings.
Select the 12th hour from the partial enlarged view in
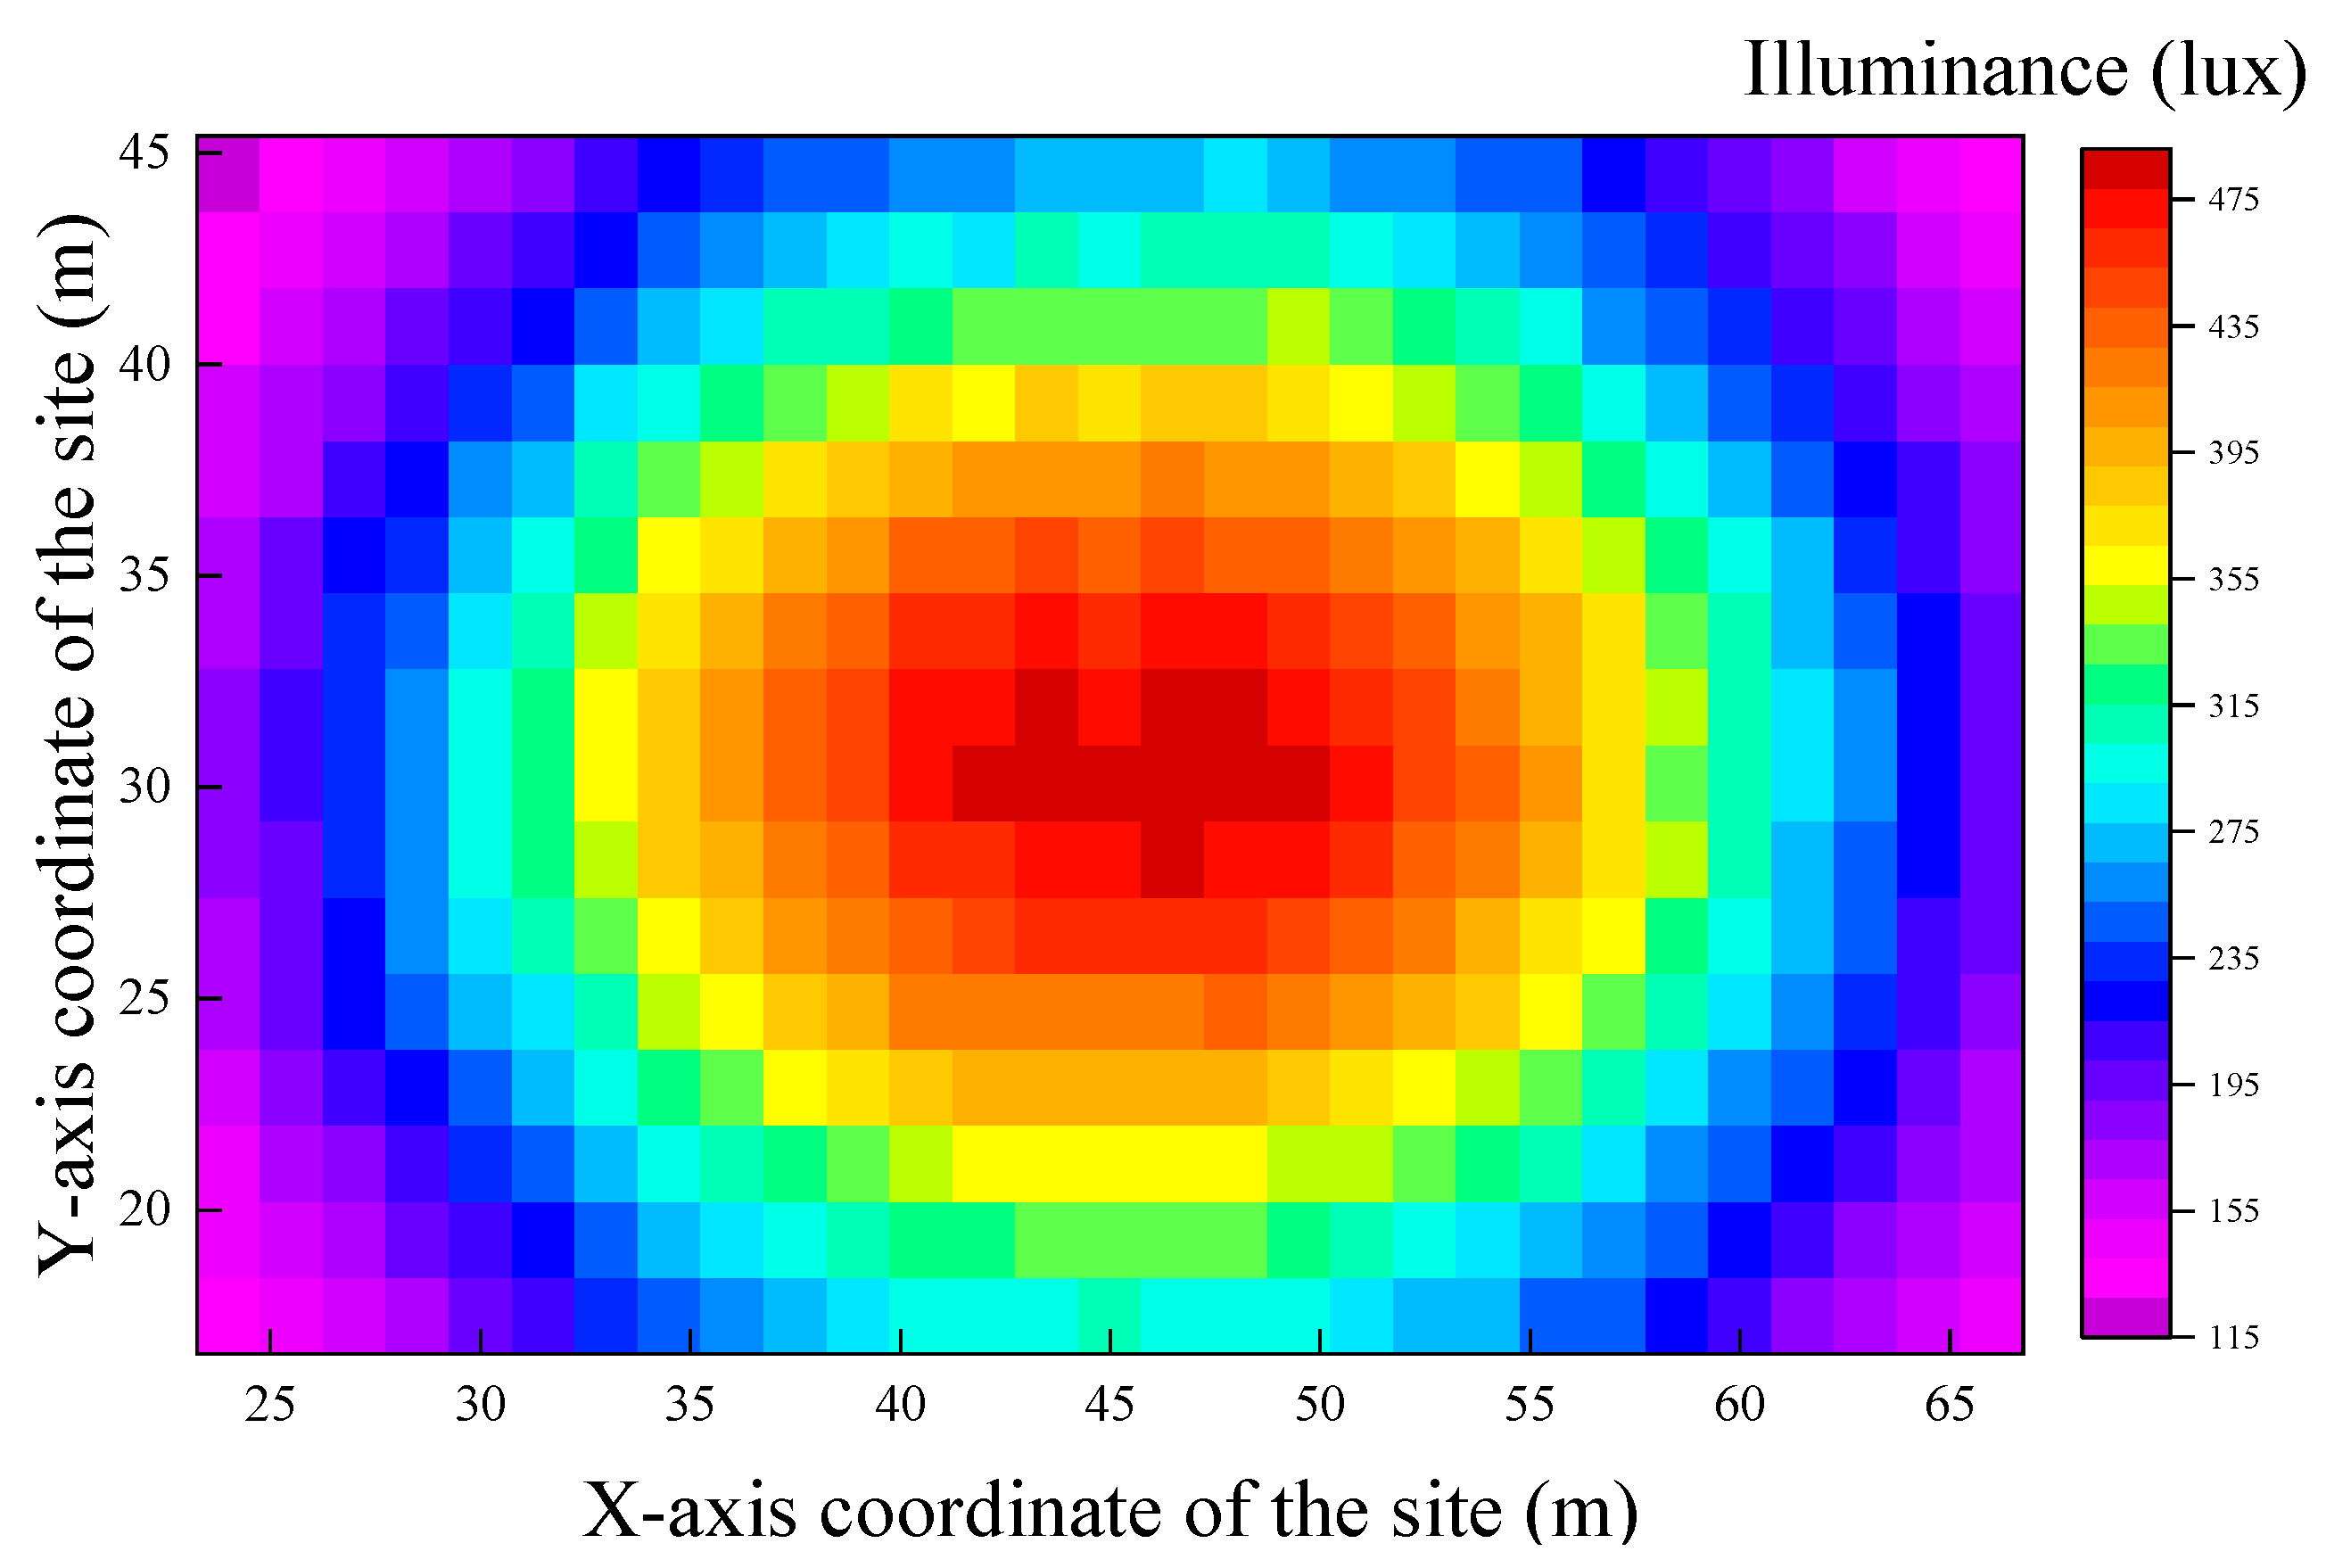
Figure 14. During this period, both the light pipe and artificial-lighting systems contribute comparable average illuminance levels to the field. The illuminance distribution across the field in the sports venue during this period is shown in
Figure 15.
As shown in
Figure 15, the illuminance distribution is approximately symmetrical around the center of the field. The illuminance values are the highest at the center, exceeding 475 lx, and gradually decrease with the distance from the center. The minimum value is approximately 115 lx. The specific illuminance and uniformity values for each system are listed in
Table 4.
As presented in
Table 4, the uniformity of illuminance (U2) provided by the light pipe system is slightly higher than that provided by the artificial-lighting system. Both values satisfy the standard requirement (0.3). The overall uniformity of illuminance (U2) within the field, taken as the average of the two, also meets the required standard. These results confirm that the proposed collaborative control method can meet the lighting requirements for daily activities in sports venues.
If no light pipe system were used in sports venues and artificial lighting were used throughout the year to maintain a field illuminance level of 300 lx, the annual operating hours of the venue, based on the control scheme discussed in this study, would be approximately 3760 h. The energy consumption in this scenario was compared with that in the “light pipes + artificial lighting” collaborative control strategy. The results are revealed in
Table 5. The “light pipes + artificial lighting” collaborative control strategy reduces the artificial-lighting system’s operating hours and power consumption by approximately 21% and 35%, respectively. Thus, introducing light pipe systems in sports venues is both feasible and highly necessary.
5. Conclusions and Discussion
In this study, we developed an optimized design method for light pipe systems in sports venues, along with an integrated control strategy for hybrid operation with artificial lighting. Compared to conventional design approaches, the proposed scheme achieved improved daylighting performance at a lower construction cost—reducing light pipe expenses by approximately 27.8% while maintaining a daylight factor of 1%. A novel concept was introduced by analogizing light pipes of different diameters and lengths to artificial light sources with varying power levels. This optimization framework provides practical guidance for selecting pipe dimensions and spatial layout tailored to sports venues.
To compensate for the variable availability of natural light, we further proposed a collaborative control strategy between light pipe and artificial lighting systems. Using actual annual radiation data from Xi’an, energy consumption was simulated under daily training lighting conditions. The results demonstrate that, while maintaining a horizontal illuminance of 300 lx and a U
2 uniformity of at least 0.3, the integrated strategy reduced annual lighting energy use by approximately 35% compared to artificial lighting alone (
Table 5).
A key feature of our approach is the separate calculation of natural illuminance from light pipes and artificial illuminance from electric lighting. This method facilitates real-time compensation by the artificial system in response to natural light fluctuations and is readily implementable in actual lighting controllers. It offers a practical solution for sports facilities to meet lighting standards with significantly lower energy consumption. The proposed illuminance-based design method offers practical value by delivering optimized lighting solutions for designers. The substantial energy savings it achieves directly support the strategic decisions of venue management and operators.
Although this study focused on a sports venue in Xi’an, the proposed design and control methods are applicable to other building types and sports settings—such as basketball, badminton, and table tennis courts. The illuminance calculations rely on the transmission efficiency of the light pipe system and the luminous intensity distribution of the diffuser. While inaccuracies in these parameters had limited impact on the overall illuminance distribution in this study, higher precision would enhance the reliability of artificial lighting control. Future work should integrate multi-point illuminance sensors to refine the spatial illuminance model and support more accurate real-time control.
