Optimizing User Distributions in Open-Plan Offices for Communication and Their Implications for Energy Demand and Light Doses: A Living Lab Case Study
Abstract
1. Introduction
1.1. Behavioral Dynamics in Open-Plan Offices
1.2. Lighting-Related Implications of Behavioral Dynamics
1.3. Problem Definition
1.4. Purpose of This Study
2. Related Work
2.1. Hot-Desking
2.2. Computer-Aided Methods for User Distribution in the Room
3. Methodology
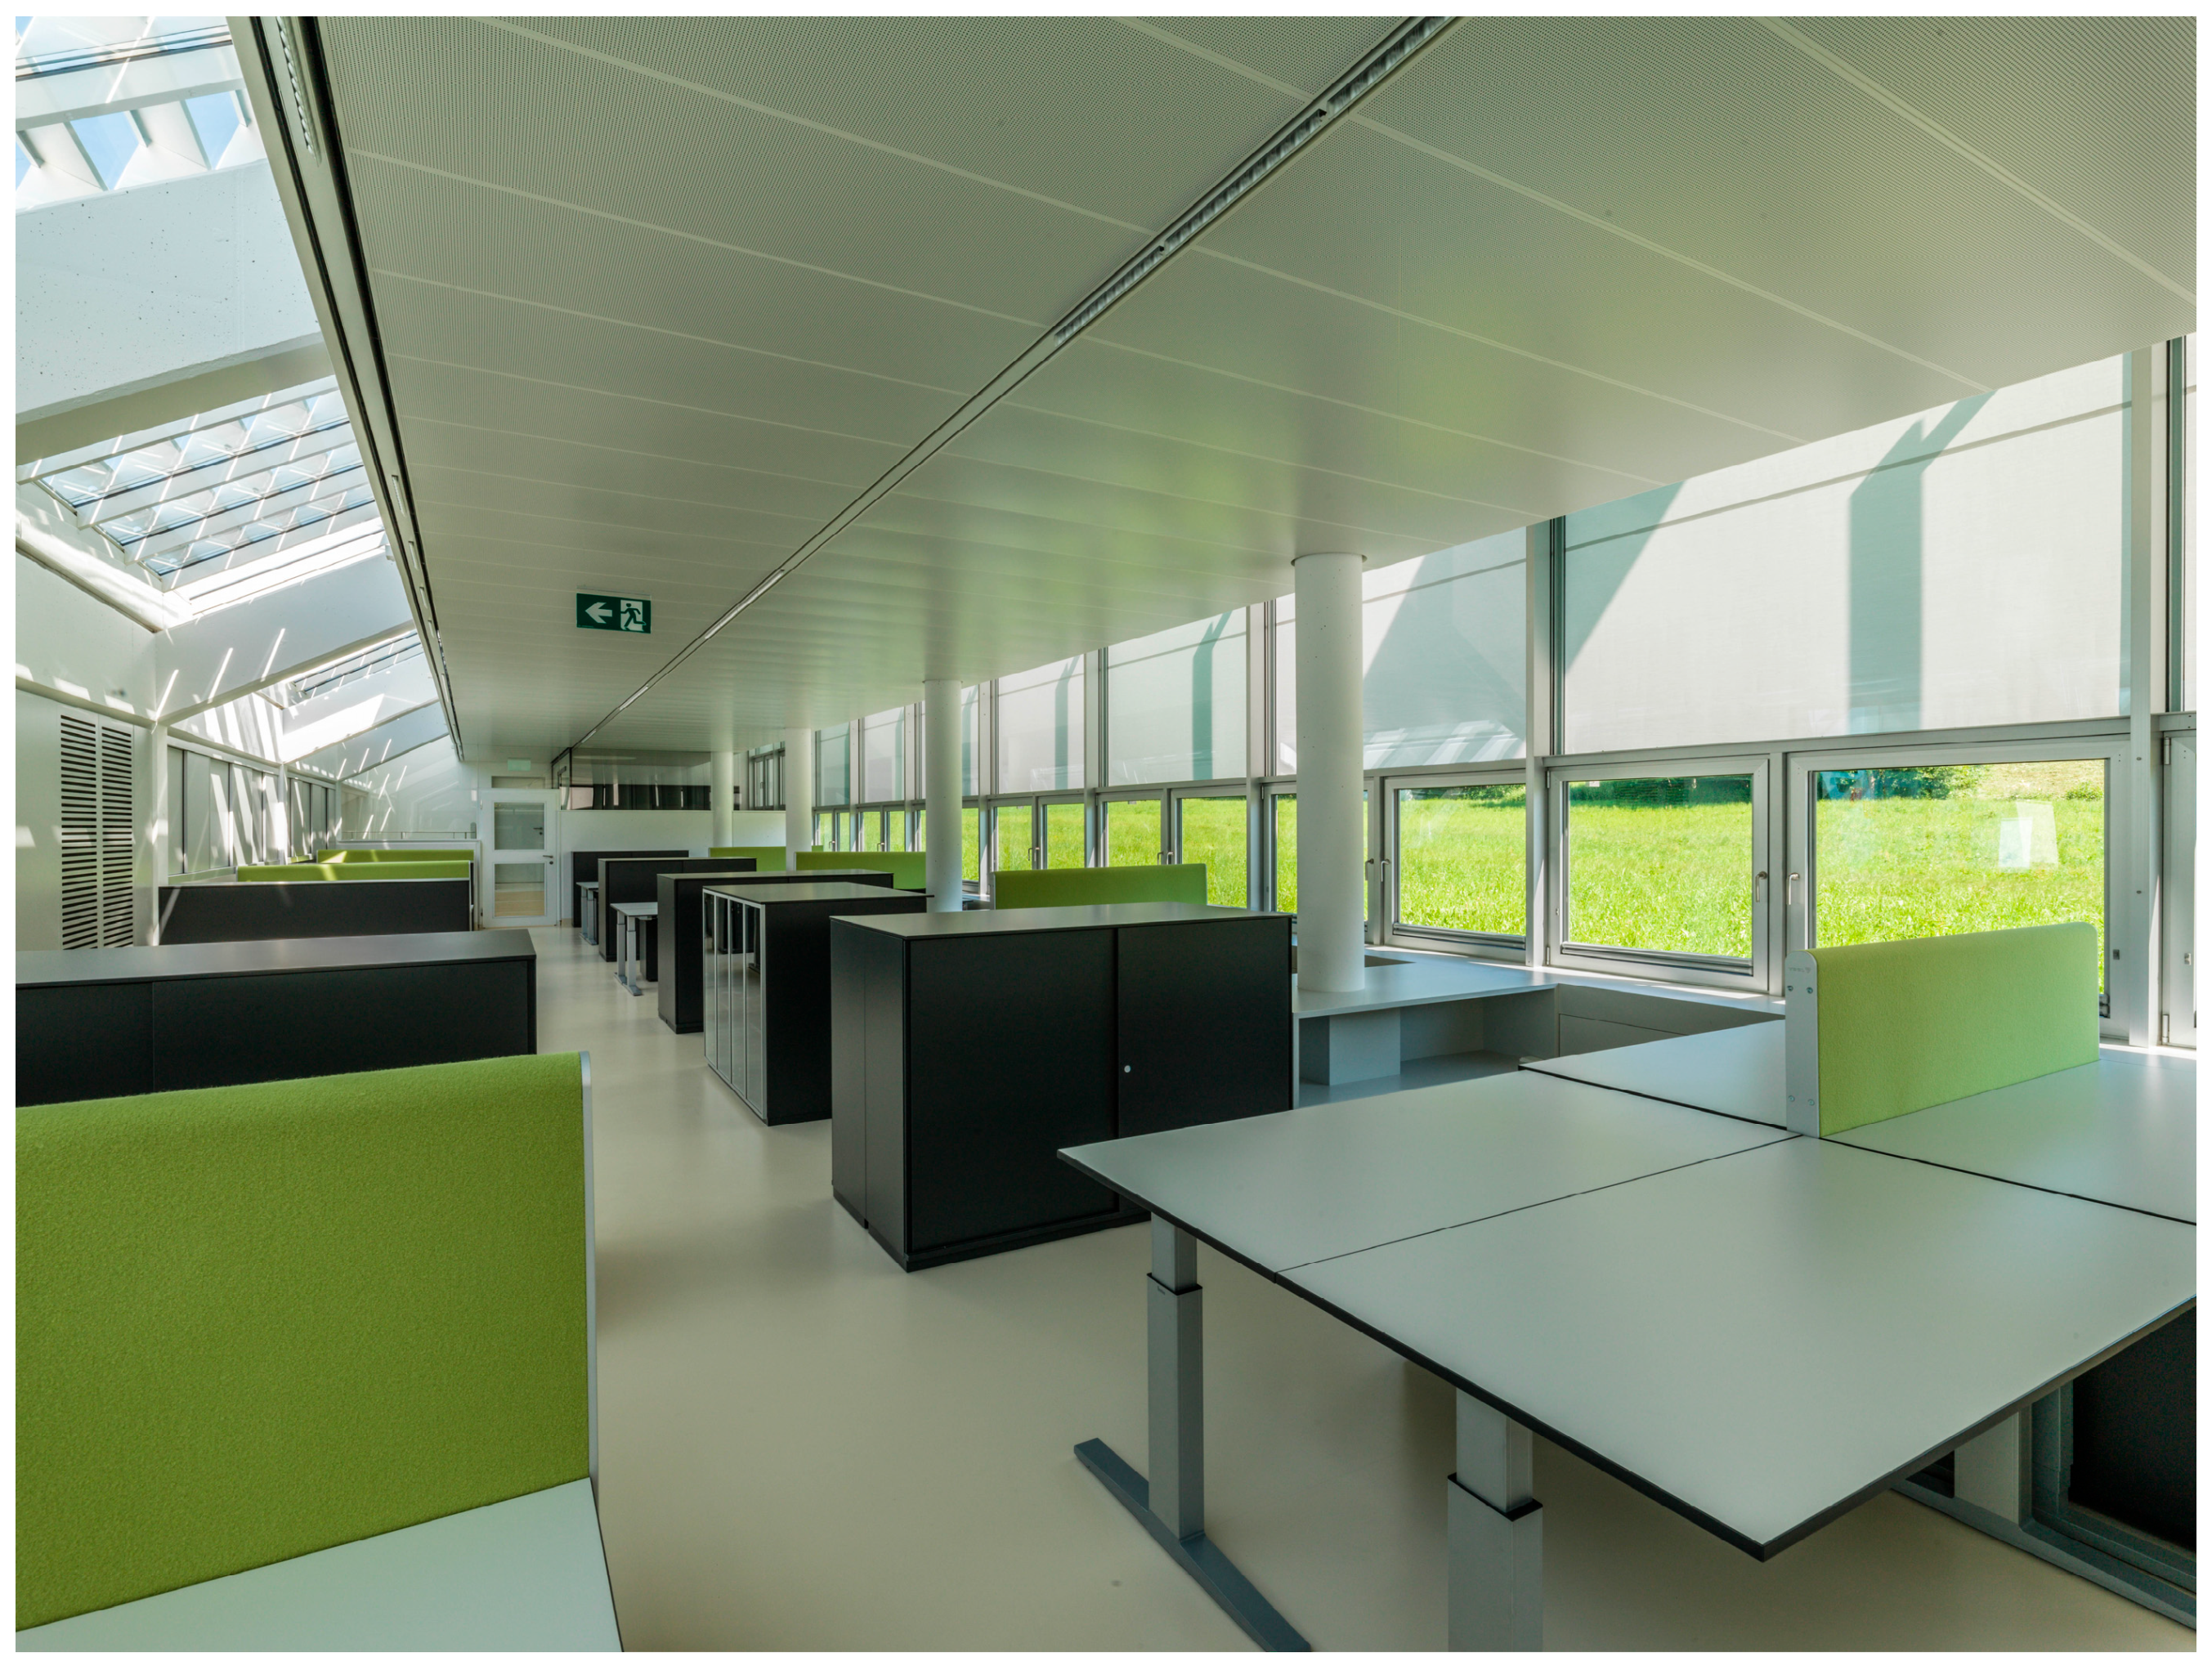
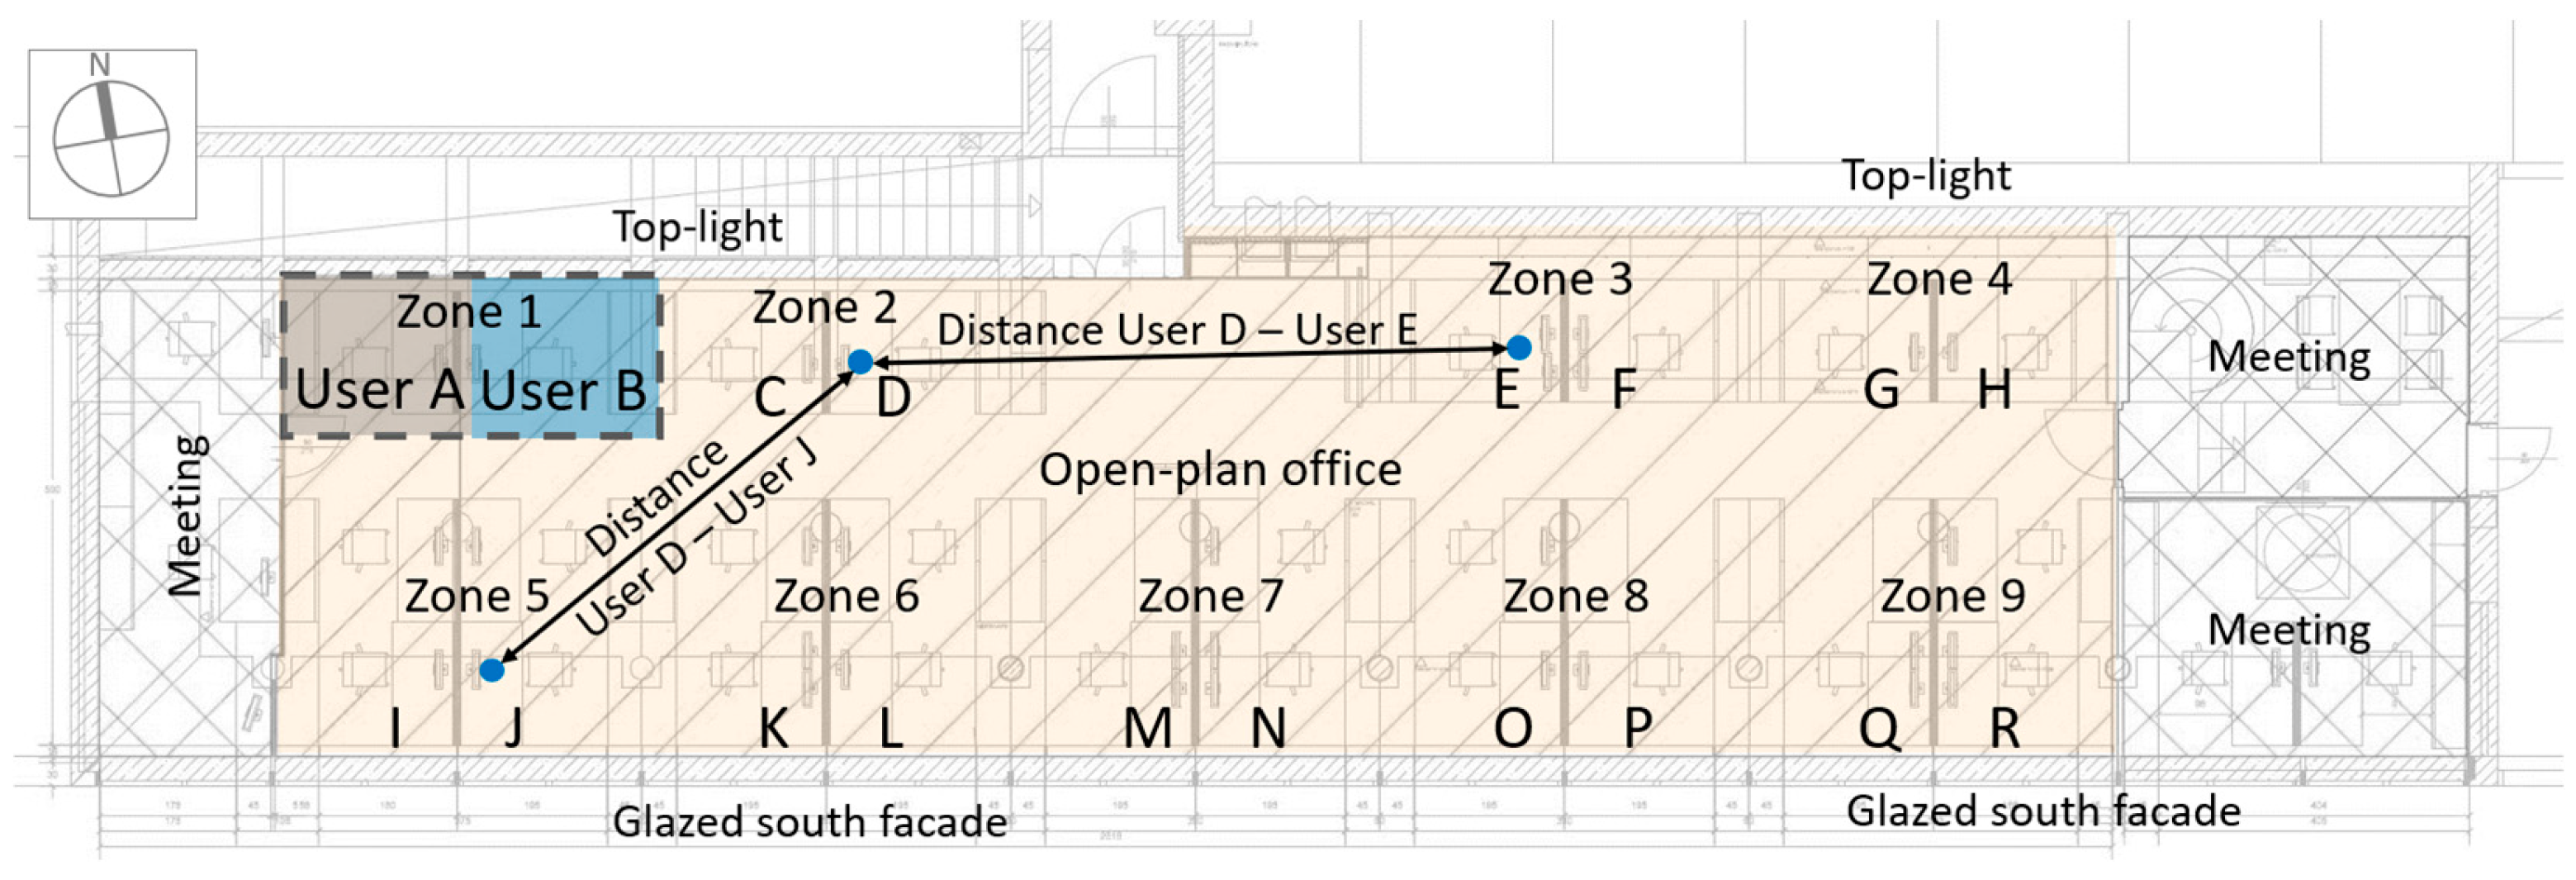
3.1. Study Object
3.2. Data Acquisition and Processing
3.2.1. Deriving Optimized User Distributions Depending on Target Variables
3.2.2. Algorithm Selection
3.2.3. Synergy Effects Between the Target Criteria
3.2.4. Outcome Measures
3.2.5. Data Normalization
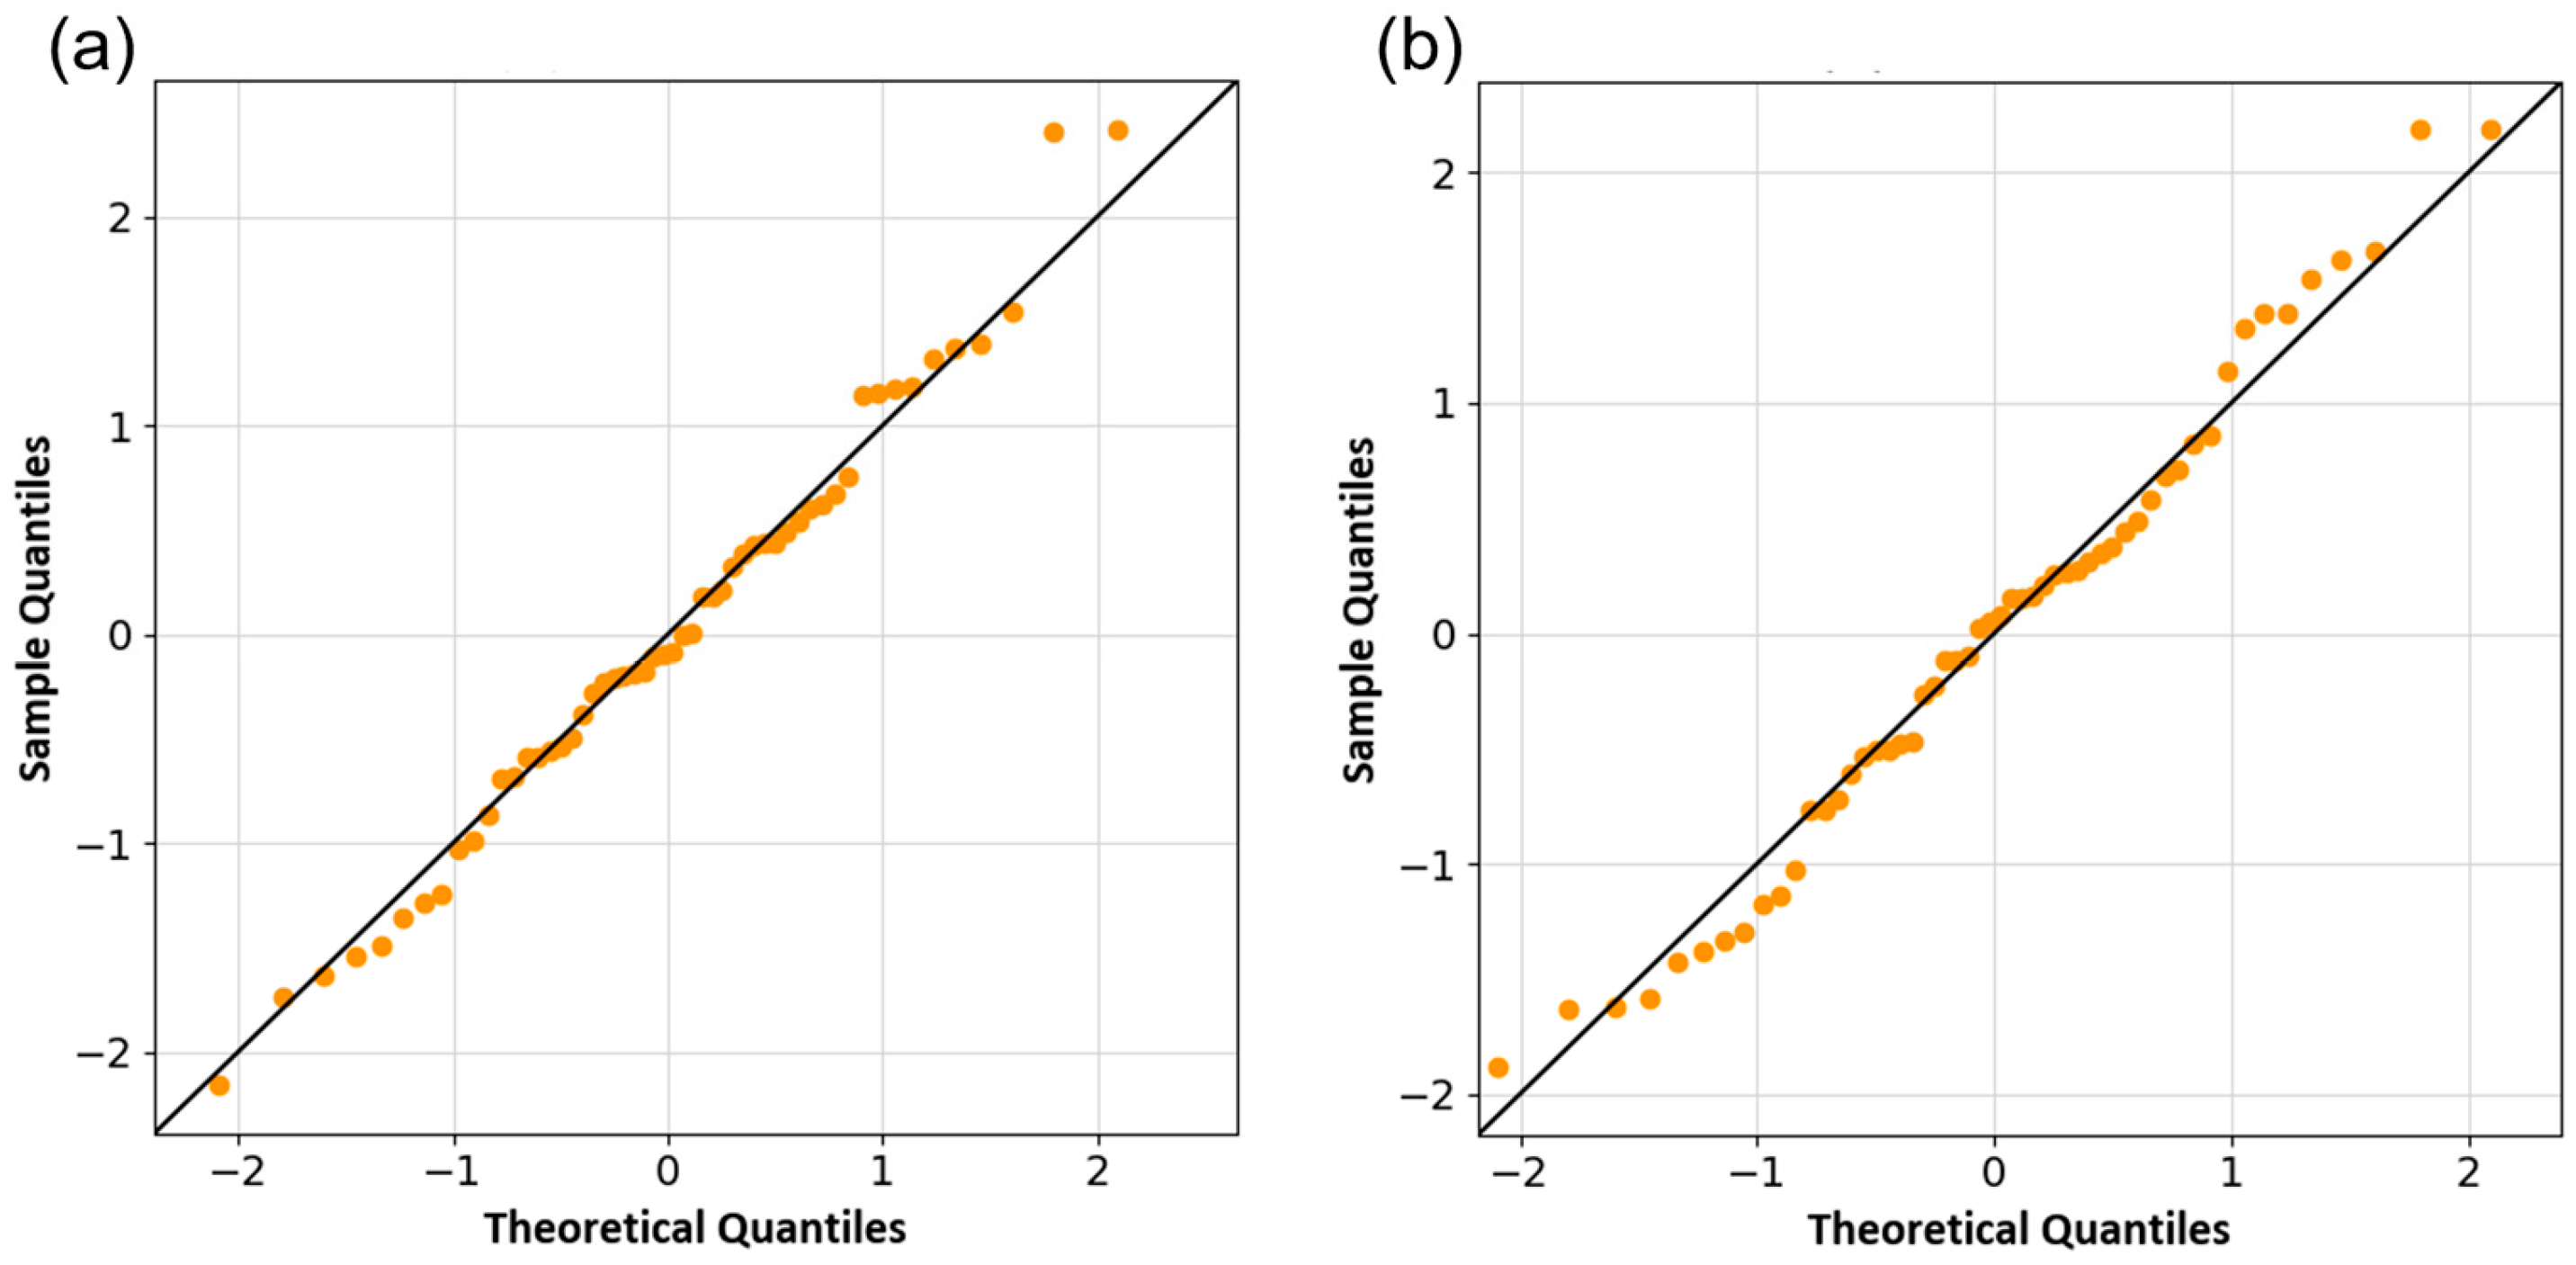
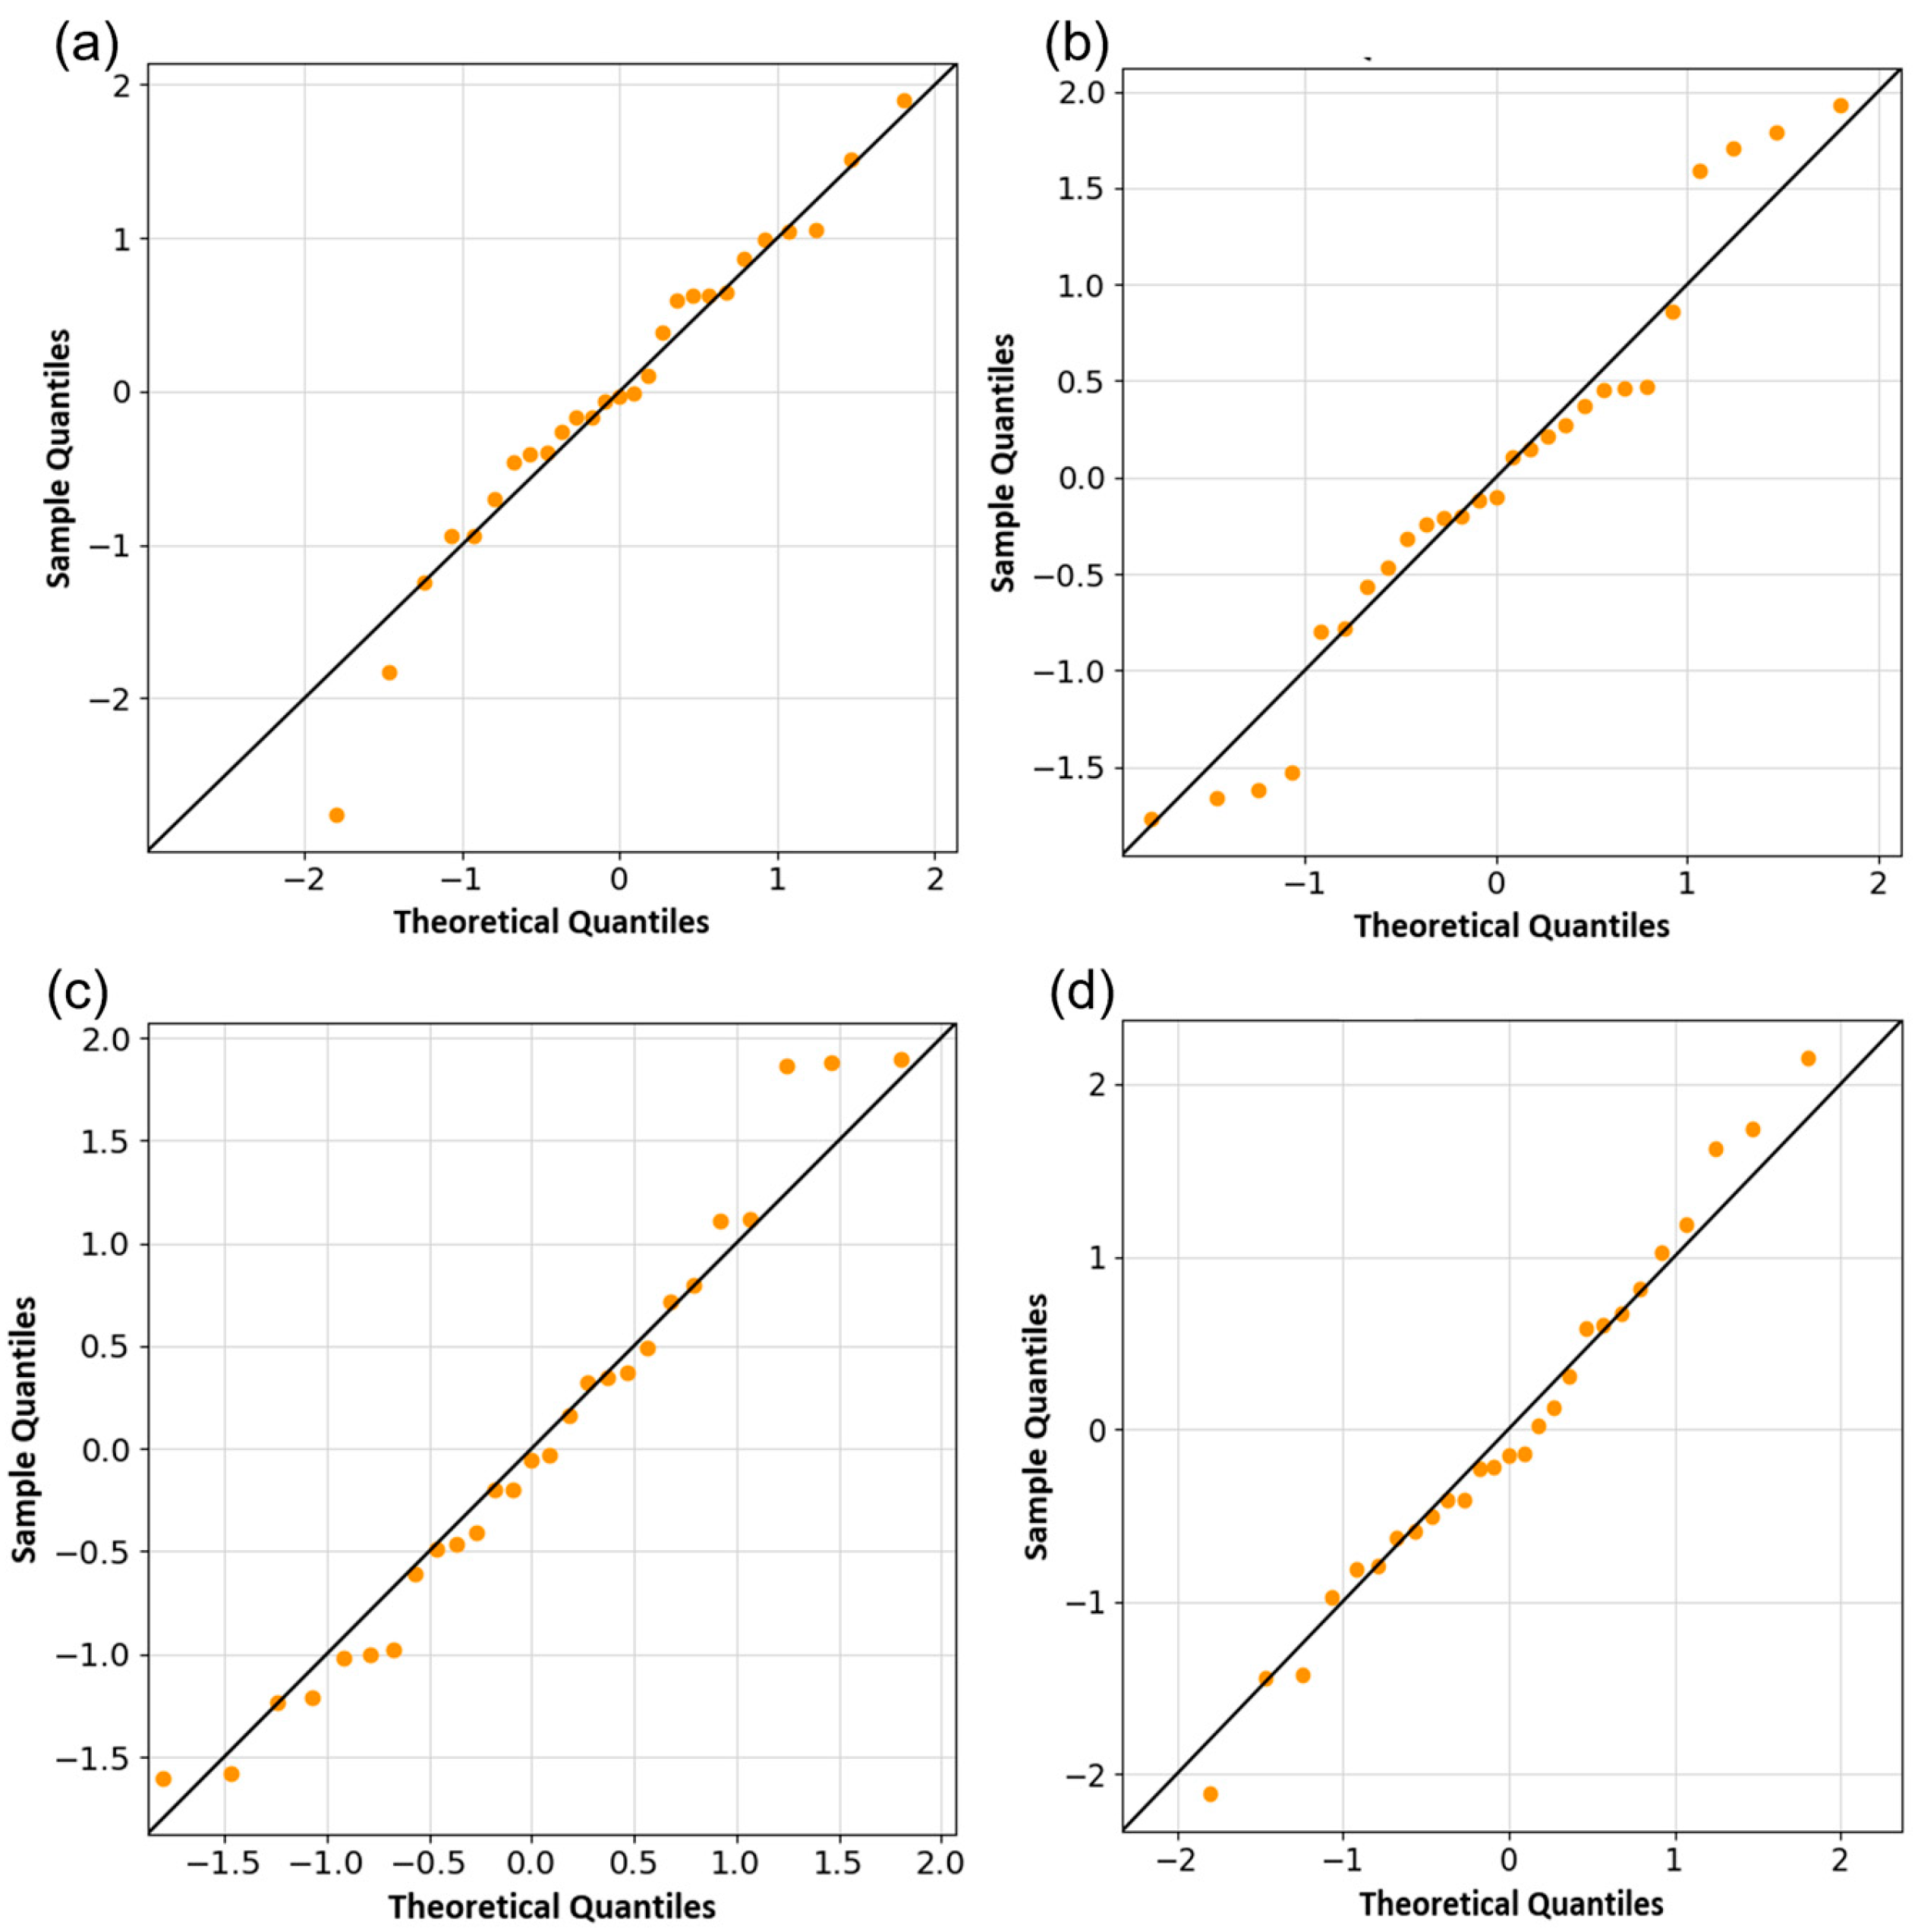
3.3. Statistical Analysis
4. Results
4.1. Comparison of Performance Indicators Between Objective-Specific Optimization Strategies
4.1.1. Communication Distances
4.1.2. Daily Light Doses
4.1.3. Lighting Energy Demand
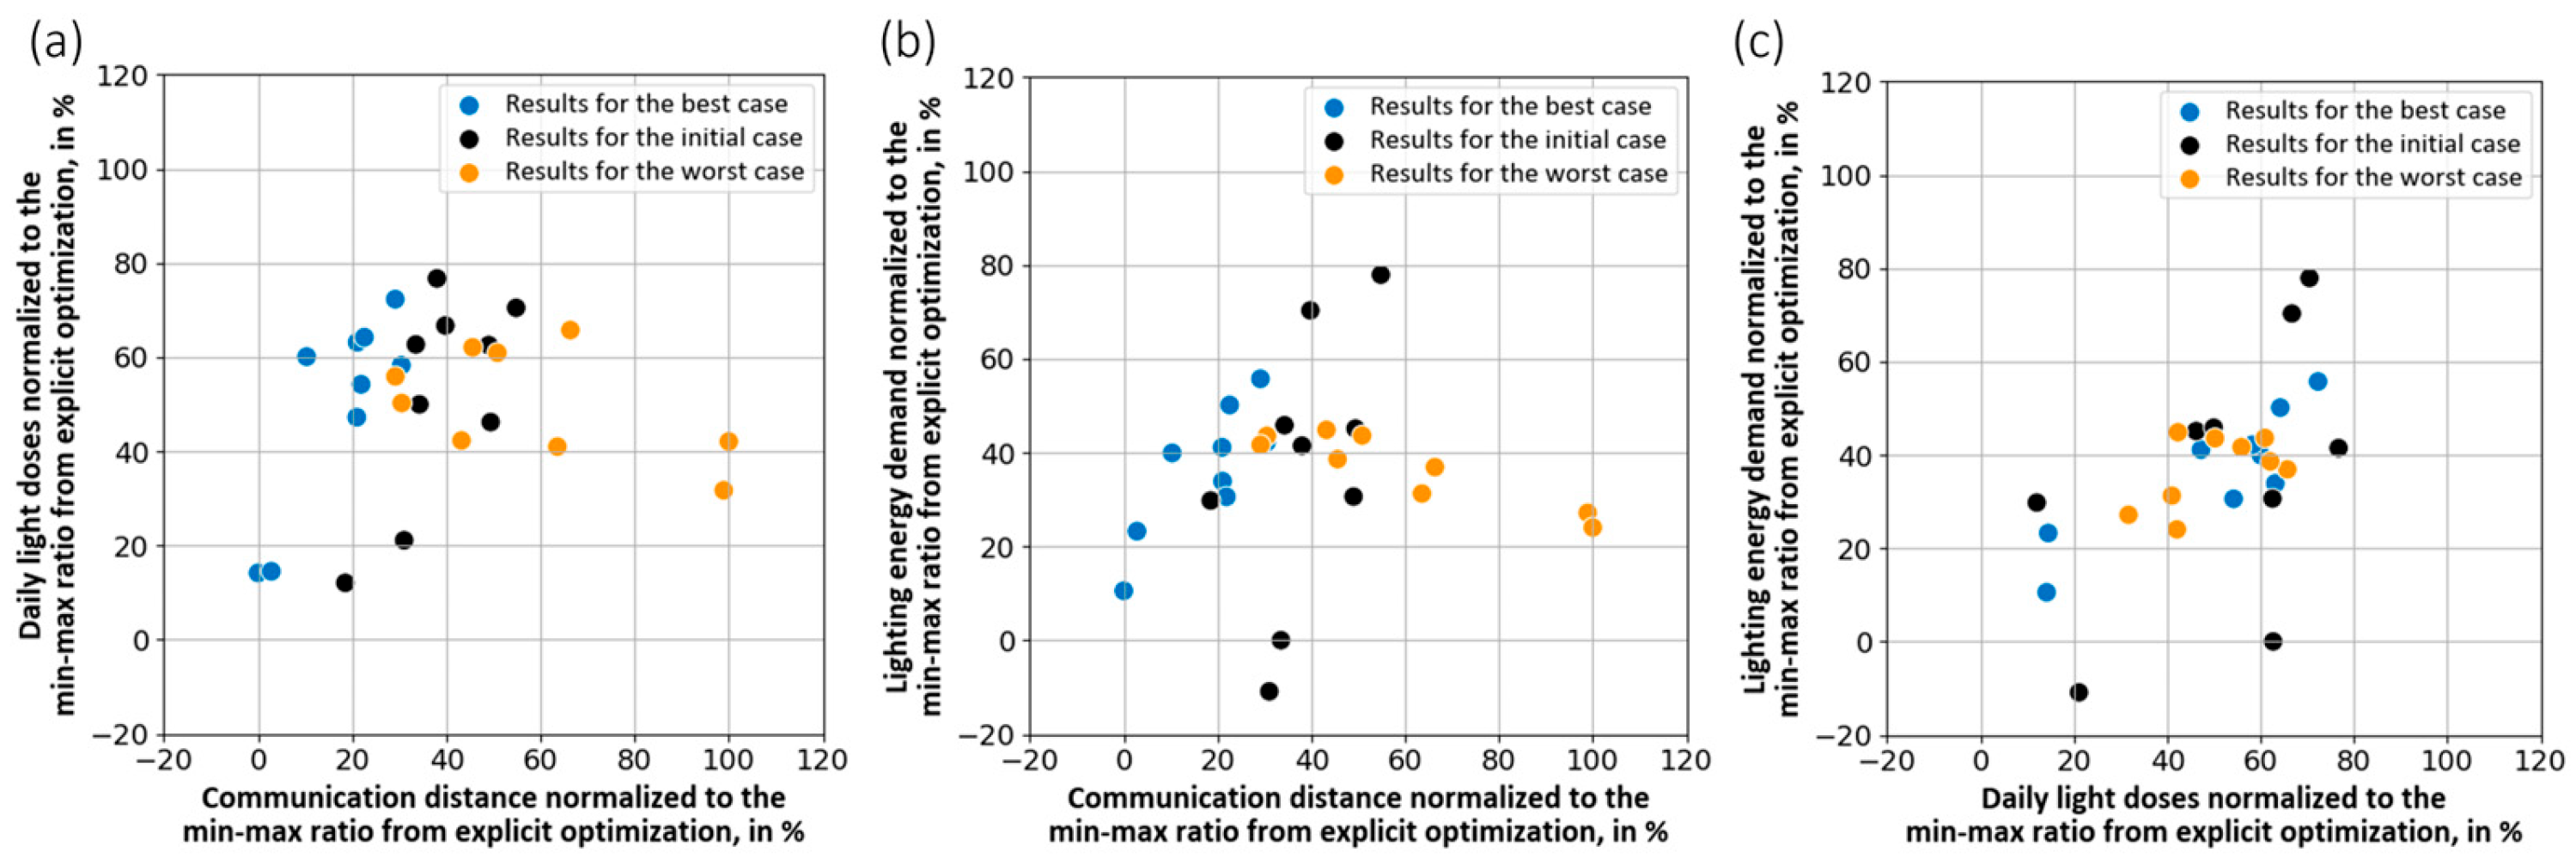
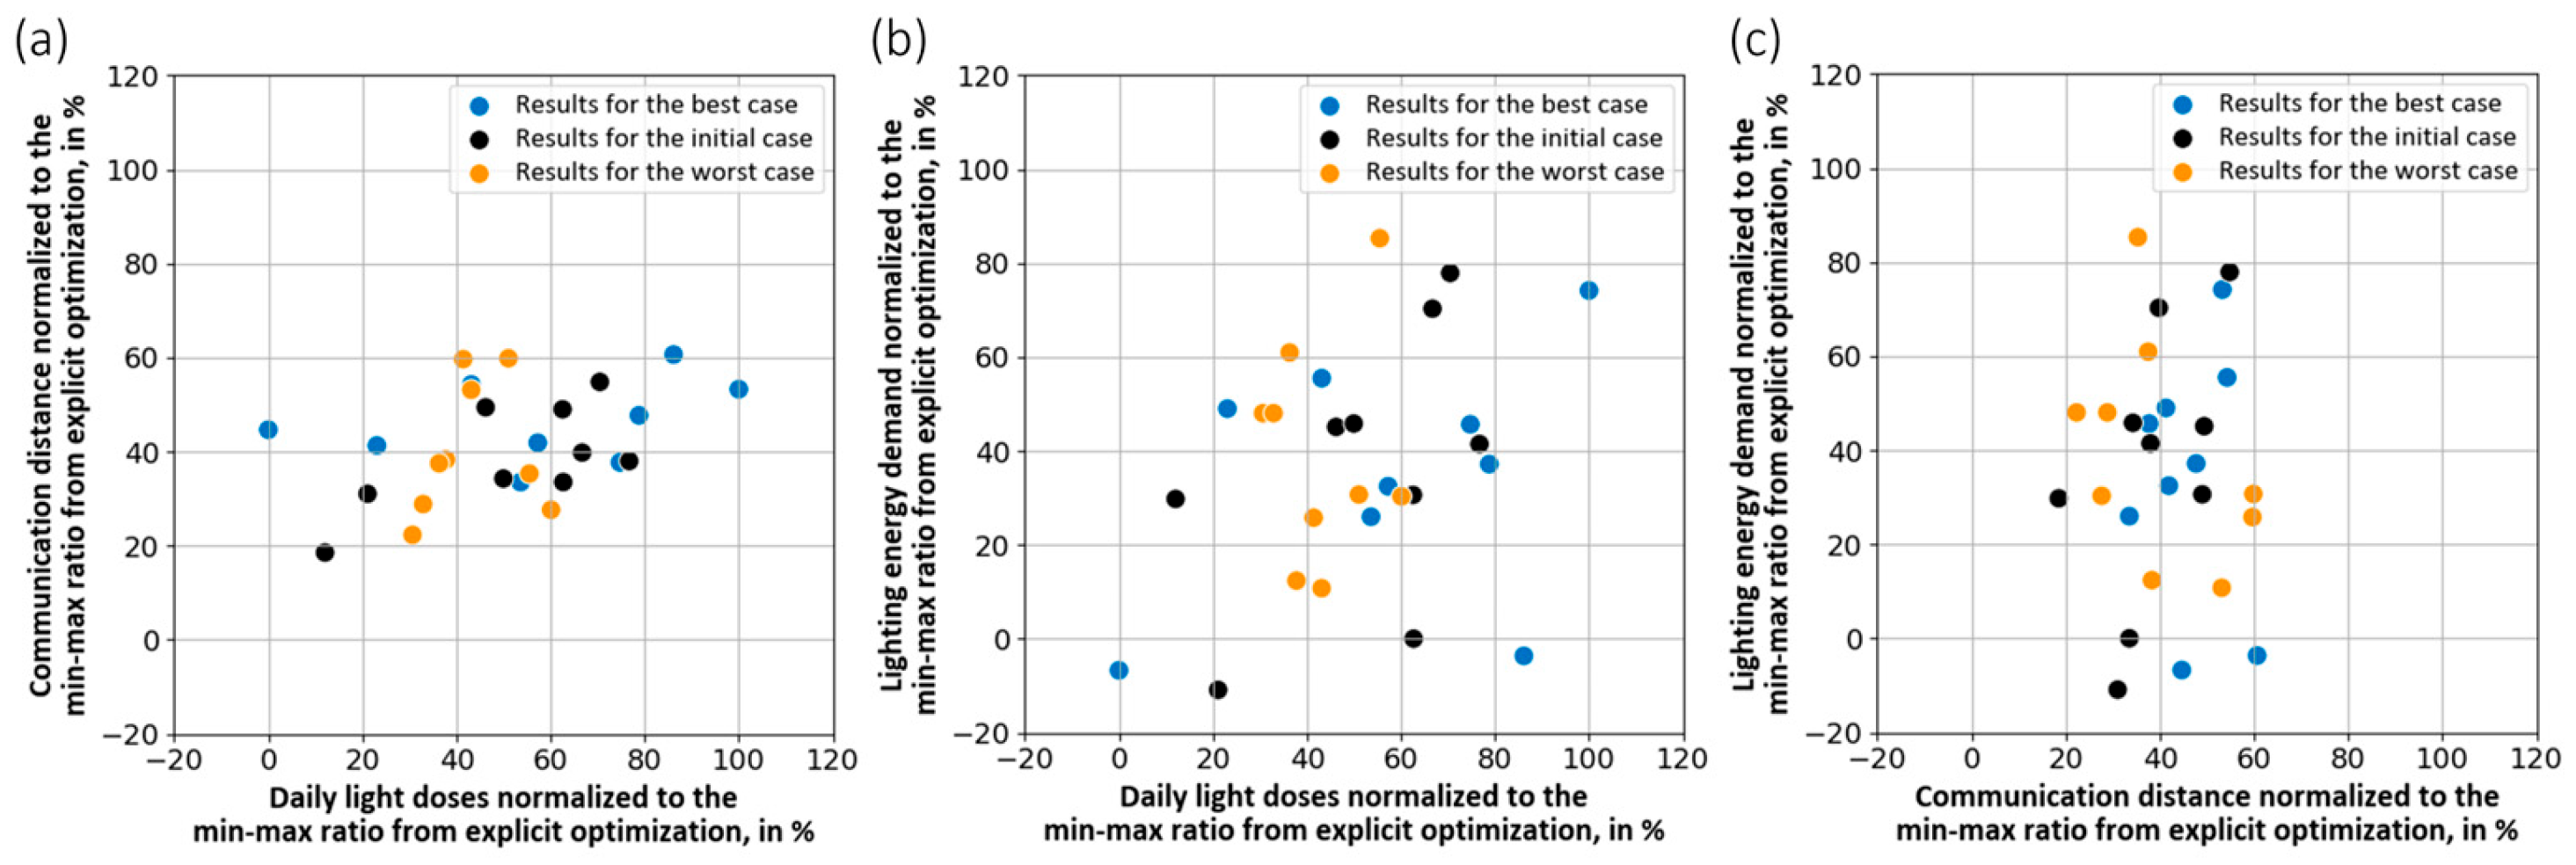
4.2. Correlation Analysis Within Objective-Specific Optimization Strategies
4.2.1. Correlation Analysis Within the Optimization of Communication Distances
4.2.2. Correlation Analysis Within the Optimization of Daily Light Doses
4.2.3. Correlation Analysis Within the Optimization of Lighting Energy Demand
5. Discussion
Limitations
6. Conclusions
7. Outlook
8. Addendum: Algorithm Selection for Deriving User Distributions in the Room Under the Optimization Objective of Communication Distances
8.1. Algorithms
8.2. Evaluation Methodology
8.3. Resulting Communication Distances
8.4. Resulting Runtimes
Author Contributions
Funding
Informed Consent Statement
Data Availability Statement
Acknowledgments
Conflicts of Interest
Abbreviations
| ANOVA | Analysis of variance |
| DA | Daylight autonomy |
| DE | Differential evolution algorithm |
| EMM | Estimated marginal means |
| GA | Genetic algorithm |
| GLMM | Generalized linear mixed-effects model |
| GRASP | Greedy randomized adaptive search procedure |
| ICC | Intraclass correlation coefficient |
| IEQ | Indoor environment quality |
| ILS | Iterated local search |
| IQR | Interquartile range |
| MEDI | Melanotic equivalent daylight illuminance |
| NIF | Non-image-forming |
| PIR | Passive infrared sensor |
| PSO | Particle swarm optimization |
| R&D | Research and development |
| RCL | Restricted candidate list |
| SA | Simulated annealing algorithm |
References
- Hedge, A. The Open-Plan Office: A Systematic Investigation of Employee Reactions to Their Work Environment. Environ. Behav. 1982, 14, 519–542. [Google Scholar] [CrossRef]
- Maher, A.; Von Hippel, C. Individual Differences in Employee Reactions to Open-Plan Offices. J. Environ. Psychol. 2005, 25, 219–229. [Google Scholar] [CrossRef]
- Shafaghat, A.; Keyvanfar, A.; Ferwati, M.S.; Alizadeh, T. Enhancing Staff’s Satisfaction with Comfort toward Productivity by Sustainable Open Plan Office Design. Sustain. Cities Soc. 2015, 19, 151–164. [Google Scholar] [CrossRef]
- Salis, S.; Williams, A.M. Knowledge Sharing through Face-to-Face Communication and Labour Productivity: Evidence from British Workplaces. Br. J. Ind. Relat. 2010, 48, 436–459. [Google Scholar] [CrossRef]
- Koskinen, K.U.; Pihlanto, P.; Vanharanta, H. Tacit Knowledge Acquisition and Sharing in a Project Work Context. Int. J. Proj. Manag. 2003, 21, 281–290. [Google Scholar] [CrossRef]
- Ambrosini, V.; Bowman, C. Tacit Knowledge: Some Suggestions for Operationalization. J Manag. Stud. 2001, 38, 811–829. [Google Scholar] [CrossRef]
- Boutellier, R.; Ullman, F.; Schreiber, J.; Naef, R. Impact of Office Layout on Communication in a Science-driven Business. R D Manag. 2008, 38, 372–391. [Google Scholar] [CrossRef]
- Jarzabkowski, P.; Seidl, D. The Role of Meetings in the Social Practice of Strategy. Organ. Stud. 2008, 29, 1391–1426. [Google Scholar] [CrossRef]
- Dittrich, K.; Guerard, S.; Seidl, D. The Role of Meetings in the Strategy Process—Towards an Integrative Framework. SSRN J. 2011, 1–43. [Google Scholar] [CrossRef]
- Scott, C.W.; Shanock, L.R.; Rogelberg, S.G. Meetings at Work: Advancing the Theory and Practice of Meetings. Small Group Res. 2012, 43, 127–129. [Google Scholar] [CrossRef]
- Panko, R.R.; Kinney, S.T. Dyadic Organizational Communication: Is the Dyad Different? In Proceedings of the Twenty-Fifth Hawaii International Conference on System Sciences, Kauai, HI, USA, 7–10 January 1992; Volume 4, pp. 244–252. [Google Scholar]
- Hammes, S.; Weninger, J.; Canazei, M.; Pfluger, R.; Pohl, W. Die Bedeutung von Nutzerzentrierung in automatisierten Beleuchtungssystemen. Bauphysik 2020, 42, 209–217. [Google Scholar] [CrossRef]
- Koo, S.Y.; Yeo, M.S.; Kim, K.W. Automated Blind Control to Maximize the Benefits of Daylight in Buildings. Build. Environ. 2010, 45, 1508–1520. [Google Scholar] [CrossRef]
- Guo, X.; Tiller, D.; Henze, G.; Waters, C. The Performance of Occupancy-Based Lighting Control Systems: A Review. Light. Res. Technol. 2010, 42, 415–431. [Google Scholar] [CrossRef]
- Galasiu, A.D.; Newsham, G.R.; Suvagau, C.; Sander, D.M. Energy Saving Lighting Control Systems for Open-Plan Offices: A Field Study. LEUKOS 2007, 4, 7–29. [Google Scholar] [CrossRef]
- Chraibi, S.; Lashina, T.; Shrubsole, P.; Aries, M.; Van Loenen, E.; Rosemann, A. Satisfying Light Conditions: A Field Study on Perception of Consensus Light in Dutch Open Office Environments. Build. Environ. 2016, 105, 116–127. [Google Scholar] [CrossRef]
- EN 12464-1; Light and Lighting—Lighting of Work Places—Part 1: Indoor Work Places. European Committee for Standardization European Standard: Brussels, Belgium, 2011.
- Chow, S.K.H.; Li, D.H.W.; Lee, E.W.M.; Lam, J.C. Analysis and Prediction of Daylighting and Energy Performance in Atrium Spaces Using Daylight-Linked Lighting Controls. Appl. Energy 2013, 112, 1016–1024. [Google Scholar] [CrossRef]
- Seppänen, O.A.; Fisk, W. Some Quantitative Relations between Indoor Environmental Quality and Work Performance or Health. HVACR Res. 2006, 12, 957–973. [Google Scholar] [CrossRef]
- Phipps-Nelson, J.; Redman, J.R.; Dijk, D.-J.; Rajaratnam, S.M.W. Daytime Exposure to Bright Light, as Compared to Dim Light, Decreases Sleepiness and Improves Psychomotor Vigilance Performance. Sleep 2003, 26, 695–700. [Google Scholar] [CrossRef]
- Smolders, K.C.H.J.; De Kort, Y.A.W.; Cluitmans, P.J.M. A Higher Illuminance Induces Alertness Even during Office Hours: Findings on Subjective Measures, Task Performance and Heart Rate Measures. Physiol. Behav. 2012, 107, 7–16. [Google Scholar] [CrossRef]
- Chang, A.; Scheer, F.A.J.L.; Czeisler, C.A. The Human Circadian System Adapts to Prior Photic History. J. Physiol. 2011, 589, 1095–1102. [Google Scholar] [CrossRef]
- Figueiro, M.G.; Steverson, B.; Heerwagen, J.; Kampschroer, K.; Hunter, C.M.; Gonzales, K.; Plitnick, B.; Rea, M.S. The Impact of Daytime Light Exposures on Sleep and Mood in Office Workers. Sleep Health 2017, 3, 204–215. [Google Scholar] [CrossRef]
- Klepeis, N.E.; Nelson, W.C.; Ott, W.R.; Robinson, J.P.; Tsang, A.M.; Switzer, P.; Behar, J.V.; Hern, S.C.; Engelmann, W.H. The National Human Activity Pattern Survey (NHAPS): A Resource for Assessing Exposure to Environmental Pollutants. J. Expo. Sci. Environ. Epidemiol. 2001, 11, 231–252. [Google Scholar] [CrossRef] [PubMed]
- Bodart, M.; De Herde, A. Global Energy Savings in Offices Buildings by the Use of Daylighting. Energy Build. 2002, 34, 421–429. [Google Scholar] [CrossRef]
- Li, D.H.W.; Lam, J.C. Evaluation of Lighting Performance in Office Buildings with Daylighting Controls. Energy Build. 2001, 33, 793–803. [Google Scholar] [CrossRef]
- Pham, D.T.; Karaboga, D. Intelligent Optimisation Techniques; Springer: London, UK, 2000; ISBN 978-1-4471-1186-3. [Google Scholar]
- Cai, H.; Khan, S. The Common First Year Studio in a Hot-Desking Age: An Explorative Study on the Studio Environment and Learning. J. Educ. Built Environ. 2010, 5, 39–64. [Google Scholar] [CrossRef]
- Fawcett, W.; Chadwick, A. Space-time Management and Office Floorspace Demand: Applied Experience and Mathematical Simulations. J. Corp. Real Estate 2007, 9, 5–24. [Google Scholar] [CrossRef]
- Hirst, A. Settlers, Vagrants and Mutual Indifference: Unintended Consequences of Hot-desking. J. Organ. Change Manag. 2011, 24, 767–788. [Google Scholar] [CrossRef]
- Candido, C.; Gocer, O.; Marzban, S.; Gocer, K.; Thomas, L.; Zhang, F.; Gou, Z.; Mackey, M.; Engelen, L.; Tjondronegoro, D. Occupants’ Satisfaction and Perceived Productivity in Open-Plan Offices Designed to Support Activity-Based Working: Findings from Different Industry Sectors. J. Corp. Real Estate 2021, 23, 106–129. [Google Scholar] [CrossRef]
- Sood, T.; Janssen, P.; Miller, C. Spacematch: Using Environmental Preferences to Match Occupants to Suitable Activity-Based Workspaces. Front. Built Environ. 2020, 6, 113. [Google Scholar] [CrossRef]
- Berelson, K.; Simini, F.; Tryfonas, T.; Cooper, P. Sensor-Based Smart Hot-Desking for Improvement of Office Well-Being. In Proceedings of the 1st International Conference on Digital Tools & Uses Congress—DTUC ’18, Paris, France, 3–5 October 2018; pp. 1–9. [Google Scholar]
- Hammes, S.; Weninger, J.; Pfluger, R.; Pohl, W. Take the Right Seat: The Influence of Occupancy Schemes on Performance Indicators of Lighting in Open Plan Offices. Energies 2022, 15, 3378. [Google Scholar] [CrossRef]
- Despenic, M.; Chraibi, S.; Lashina, T.; Rosemann, A. Lighting Preference Profiles of Users in an Open Office Environment. Build. Environ. 2017, 116, 89–107. [Google Scholar] [CrossRef]
- Hammes, S.; Hauer, M.; Geisler-Moroder, D.; Weninger, J.; Pfluger, R.; Pohl, W. The Impact of Occupancy Patterns on Artificial Light Energy Demand—Simulation and Post-Occupancy-Evaluation. In Proceedings of the Building Simulation 2021: 17th Conference of IBPSA, Bruges, Belgium, 1 September 2021; pp. 3536–3543. [Google Scholar]
- Hammes, S.; Weninger, J. Measurement Data on the Window Opening Behavior and Climate in a Strongly Daylit Office Building. Data Brief 2023, 46, 108794. [Google Scholar] [CrossRef]
- Panko, R.R.; Kinney, S.T. Meeting Profiles: Size, Duration, and Location. In Proceedings of the Twenty-Eighth Hawaii International Conference on System Sciences, Wailea, HI, USA, 3–6 January 1995; pp. 1002–1011. [Google Scholar]
- Cooper, P.B.; Maraslis, K.; Tryfonas, T.; Oikonomou, G. An Intelligent Hot-Desking Model Harnessing the Power of Occupancy Sensing Data. Facilities 2017, 35, 766–786. [Google Scholar] [CrossRef][Green Version]
- Hammes, S.; Weninger, J.; Gschwandtner, P.; Zech, P. Achieving a Deeper Understanding of User-Related Influences on Artificial Lighting Energy Demand Using High-Performance Computing. In Proceedings of the BSA 2024, South Tyrol, Italy, 26–28 June 2024; pp. 371–378. [Google Scholar] [CrossRef]
- Nakagawa, S.; Schielzeth, H. A General and Simple Method for Obtaining R2 from Generalized Linear Mixed-effects Models. Methods Ecol. Evol. 2013, 4, 133–142. [Google Scholar] [CrossRef]
- Yu, H.; Hutson, A.D. A Robust Spearman Correlation Coefficient Permutation Test. Commun. Stat.-Theory Methods 2024, 53, 2141–2153. [Google Scholar] [CrossRef] [PubMed]
- Brennan, A.; Chugh, J.S.; Kline, T. Traditional versus Open Office Design: A Longitudinal Field Study. Environ. Behav. 2002, 34, 279–299. [Google Scholar] [CrossRef]
- Bisel, R.S. A Communicative Ontology of Organization? A Description, History, and Critique of CCO Theories for Organization Science. Manag. Commun. Q. 2010, 24, 124–131. [Google Scholar] [CrossRef]
- Keyton, J.; Caputo, J.M.; Ford, E.A.; Fu, R.; Leibowitz, S.A.; Liu, T.; Polasik, S.S.; Ghosh, P.; Wu, C. Investigating Verbal Workplace Communication Behaviors. Int. J. Bus. Commun. 2013, 50, 152–169. [Google Scholar] [CrossRef]
- Clark, R.A.; Delia, J.G. TOPOI and Rhetorical Competence. Q. J. Speech 1979, 65, 187–206. [Google Scholar] [CrossRef]
- United Nations Environment Programme (UNEP). 2022 Global Status Report for Buildings and Construction—Towards a Zero-Emissions, Efficient and Resilient Buildings and Construction Sector; United Nations Environment Programme (UNEP): Nairobi, Kenya, 2022. [Google Scholar]
- United Nations Environment Programme. Sustainable Buildings and Climate Initiative (UNEP-SBCI) Buildings and Climate Change: Summary for Decision Makers; United Nations Environment Programme: Nairobi, Kenya, 2009. [Google Scholar]
- Hiang Liow, K.; Ooi, J.T.L. Does Corporate Real Estate Create Wealth for Shareholders? J. Prop. Investig. Financ. 2004, 22, 386–400. [Google Scholar] [CrossRef]
- Khamkanya, T.; Sloan, B. Flexible Working in Scottish Local Authority Property: Moving on to the Highest Flexibility Level. Int. J. Strateg. Prop. Manag. 2009, 13, 37–52. [Google Scholar] [CrossRef]
- Bakker, E.; Veuger, J. The Sense of Occupancy Sensing. Appl. Sci. 2021, 11, 2509. [Google Scholar] [CrossRef]
- Khamkanya, T.; Heaney, G.; McGreal, S. Scenario-based Approach to Office Occupancy Analysis. Prop. Manag. 2012, 30, 333–350. [Google Scholar] [CrossRef]
- Brennecke, J.; Coutinho, J.A.; Gilding, M.; Lusher, D.; Schaffer, G. Invisible Iterations: How Formal and Informal Organization Shape Knowledge Networks for Coordination. J. Manag. Stud. 2025, 62, 706–747. [Google Scholar] [CrossRef]
- Brunetto, Y.; Xerri, M.J.; Nelson, S.; Farr-Wharton, B. The Role of Informal and Formal Networks: How Professionals Can Be Innovative in a Constrained Fiscal Environment. Int. J. Innov. Manag. 2016, 20, 1650051. [Google Scholar] [CrossRef]
- Azizi, S.; Rabiee, R.; Nair, G.; Olofsson, T. Effects of Positioning of Multi-Sensor Devices on Occupancy and Indoor Environmental Monitoring in Single-Occupant Offices. Energies 2021, 14, 6296. [Google Scholar] [CrossRef]
- Hammes, S.; Weninger, J.; Geisler-Moroder, D.; Pfluger, R.; Pohl, W. Reduzierung des Kunstlichteinsatzes durch Anpassung der Nachlaufzeit an individuelle Anwesenheitsmuster. Bauphysik 2021, 43, 50–64. [Google Scholar] [CrossRef]
- Wong, K.P.; Zhao, Y.D. Differential Evolution, an Alternative Approach to Evolutionary Algorithm. In Proceedings of the 13th International Conference on Intelligent Systems Application to Power Systems, Arlington, VA, USA, 6–10 November 2005; pp. 73–83. [Google Scholar]
- Lambora, A.; Gupta, K.; Chopra, K. Genetic Algorithm—A Literature Review. In Proceedings of the 2019 International Conference on Machine Learning, Big Data, Cloud and Parallel Computing (COMITCon), Faridabad, India, 14–16 February 2019; pp. 380–384. [Google Scholar]




| Development | Research | ||||||||||||||||||
|---|---|---|---|---|---|---|---|---|---|---|---|---|---|---|---|---|---|---|---|
| User A | User B | User C | User D | User E | User F | User G | User H | User I | User J | User K | User L | User M | User N | User O | User P | User Q | User R | ||
| Development | User A | 32.50% | 9.00% | 20.00% | 5.00% | 5.00% | 5.00% | 3.00% | 6.00% | 2.00% | 8.50% | 2.50% | 0.00% | 0.00% | 0.00% | 0.00% | 0.00% | 0.00% | 1.50% |
| User B | 9.00% | 41.50% | 5.00% | 5.50% | 2.50% | 8.50% | 2.50% | 7.50% | 2.50% | 7.50% | 3.00% | 0.00% | 0.00% | 0.00% | 1.50% | 0.00% | 1.00% | 2.50% | |
| User C | 20.00% | 5.00% | 22.00% | 10.00% | 5.00% | 4.50% | 5.00% | 6.00% | 2.50% | 11.00% | 4.00% | 2.50% | 0.00% | 0.00% | 0.00% | 0.00% | 0.00% | 2.50% | |
| User D | 5.00% | 5.50% | 10.00% | 27.50% | 5.00% | 4.00% | 6.50% | 10.00% | 4.00% | 10.00% | 10.00% | 0.00% | 0.00% | 0.00% | 0.00% | 0.00% | 0.00% | 2.50% | |
| User E | 5.00% | 2.50% | 5.00% | 5.00% | 49.00% | 4.00% | 5.00% | 3.00% | 3.50% | 11.00% | 4.00% | 0.00% | 0.00% | 0.00% | 0.00% | 3.00% | 0.00% | 0.00% | |
| User F | 5.00% | 8.50% | 4.50% | 4.00% | 4.00% | 35.00% | 6.50% | 12.50% | 4.00% | 11.00% | 2.50% | 0.00% | 0.00% | 0.00% | 0.00% | 0.00% | 0.00% | 2.50% | |
| User G | 3.00% | 2.50% | 5.00% | 6.50% | 5.00% | 6.50% | 31.00% | 15.50% | 10.00% | 7.50% | 6.50% | 0.00% | 0.00% | 0.00% | 0.00% | 0.00% | 0.00% | 1.00% | |
| User H | 6.00% | 7.50% | 6.00% | 10.00% | 3.00% | 12.50% | 15.50% | 0.00% | 12.50% | 14.00% | 10.00% | 1.00% | 0.00% | 0.00% | 0.00% | 0.00% | 1.00% | 1.00% | |
| User I | 2.00% | 2.50% | 2.50% | 4.00% | 3.50% | 4.00% | 10.00% | 12.50% | 39.50% | 8.50% | 6.00% | 0.00% | 0.00% | 2.50% | 0.00% | 0.00% | 0.00% | 2.50% | |
| User J | 8.50% | 7.50% | 11.00% | 10.00% | 11.00% | 11.00% | 7.50% | 14.00% | 8.50% | 0.00% | 8.00% | 1.00% | 0.00% | 0.00% | 0.00% | 0.00% | 0.50% | 1.50% | |
| User K | 2.50% | 3.00% | 4.00% | 10.00% | 4.00% | 2.50% | 6.50% | 10.00% | 6.00% | 8.00% | 39.50% | 0.00% | 0.00% | 0.00% | 1.00% | 1.50% | 1.00% | 0.50% | |
| Research | User L | 0.00% | 0.00% | 2.50% | 0.00% | 0.00% | 0.00% | 0.00% | 1.00% | 0.00% | 1.00% | 0.00% | 14.00% | 25.00% | 7.50% | 10.00% | 27.50% | 6.50% | 5.00% |
| User M | 0.00% | 0.00% | 0.00% | 0.00% | 0.00% | 0.00% | 0.00% | 0.00% | 0.00% | 0.00% | 0.00% | 25.00% | 37.50% | 0.00% | 7.50% | 30.00% | 0.00% | 0.00% | |
| User N | 0.00% | 0.00% | 0.00% | 0.00% | 0.00% | 0.00% | 0.00% | 0.00% | 2.50% | 0.00% | 0.00% | 7.50% | 0.00% | 60.00% | 0.00% | 0.00% | 15.00% | 15.00% | |
| User O | 0.00% | 1.50% | 0.00% | 0.00% | 0.00% | 0.00% | 0.00% | 0.00% | 0.00% | 0.00% | 1.00% | 10.00% | 7.50% | 0.00% | 67.50% | 7.50% | 0.00% | 5.00% | |
| User P | 0.00% | 0.00% | 0.00% | 0.00% | 3.00% | 0.00% | 0.00% | 0.00% | 0.00% | 0.00% | 1.50% | 27.50% | 30.00% | 0.00% | 7.50% | 30.50% | 0.00% | 0.00% | |
| User Q | 0.00% | 1.00% | 0.00% | 0.00% | 0.00% | 0.00% | 0.00% | 1.00% | 0.00% | 0.50% | 1.00% | 6.50% | 0.00% | 15.00% | 0.00% | 0.00% | 50.00% | 25.00% | |
| User R | 1.50% | 2.50% | 2.50% | 2.50% | 0.00% | 2.50% | 1.00% | 1.00% | 2.50% | 1.50% | 0.50% | 5.00% | 0.00% | 15.00% | 5.00% | 0.00% | 25.00% | 32.00% | |
| Zone | |||||||||||||||||||
|---|---|---|---|---|---|---|---|---|---|---|---|---|---|---|---|---|---|---|---|
| 1_1 | 1_2 | 2_1 | 2_2 | 3_1 | 3_2 | 4_1 | 4_2 | 5_1 | 5_2 | 6_1 | 6_2 | 7_1 | 7_2 | 8_1 | 8_2 | 9_1 | 9_2 | ||
| Zone | 1_1 | 0.00 | 0.89 | 4.80 | 5.69 | 14.41 | 15.29 | 19.20 | 20.09 | 4.30 | 4.39 | 6.44 | 7.13 | 10.52 | 11.34 | 15.03 | 15.88 | 19.68 | 20.55 |
| 1_2 | 0.89 | 0.00 | 3.91 | 4.80 | 13.52 | 14.40 | 18.31 | 19.20 | 4.39 | 4.30 | 5.88 | 6.44 | 9.72 | 10.52 | 14.18 | 15.03 | 18.81 | 19.68 | |
| 2_1 | 4.80 | 3.91 | 0.00 | 0.89 | 9.61 | 10.49 | 14.40 | 15.29 | 6.44 | 5.81 | 4.30 | 4.39 | 6.45 | 7.13 | 10.52 | 11.34 | 15.03 | 15.88 | |
| 2_2 | 5.69 | 4.80 | 0.89 | 0.00 | 8.72 | 9.60 | 13.51 | 14.40 | 7.13 | 6.44 | 4.39 | 4.30 | 5.82 | 6.44 | 9.71 | 10.52 | 14.18 | 15.03 | |
| 3_1 | 14.41 | 13.52 | 9.61 | 8.72 | 0.00 | 0.89 | 4.80 | 5.69 | 15.08 | 14.23 | 10.59 | 9.77 | 6.55 | 5.93 | 4.45 | 4.54 | 6.54 | 7.22 | |
| 3_2 | 15.29 | 14.40 | 10.49 | 9.60 | 0.89 | 0.00 | 3.91 | 4.80 | 15.92 | 15.07 | 11.40 | 10.58 | 7.22 | 6.55 | 4.54 | 4.45 | 5.92 | 6.55 | |
| 4_1 | 19.20 | 18.31 | 14.40 | 13.51 | 4.80 | 3.91 | 0.00 | 0.89 | 19.71 | 18.84 | 15.07 | 14.22 | 10.58 | 9.78 | 6.55 | 5.92 | 4.45 | 0.45 | |
| 4_2 | 20.09 | 19.20 | 15.29 | 14.40 | 5.69 | 4.80 | 0.89 | 0.00 | 20.58 | 19.71 | 15.92 | 15.07 | 11.39 | 10.58 | 7.22 | 6.55 | 4.54 | 4.45 | |
| 5_1 | 4.30 | 4.39 | 6.44 | 7.13 | 15.08 | 15.92 | 19.71 | 20.58 | 0.00 | 0.89 | 4.80 | 5.69 | 9.60 | 10.49 | 14.40 | 15.29 | 19.20 | 20.09 | |
| 5_2 | 4.39 | 4.3 | 5.81 | 6.44 | 14.23 | 15.07 | 18.84 | 19.71 | 0.89 | 0.00 | 3.91 | 4.80 | 8.72 | 9.60 | 13.51 | 14.40 | 18.31 | 19.20 | |
| 6_1 | 6.44 | 5.88 | 4.30 | 4.39 | 10.59 | 11.40 | 15.07 | 15.92 | 4.80 | 3.91 | 0.00 | 0.89 | 4.81 | 5.69 | 9.60 | 10.49 | 14.40 | 15.29 | |
| 6_2 | 7.13 | 6.44 | 4.39 | 4.30 | 9.77 | 10.58 | 14.22 | 15.07 | 5.69 | 4.80 | 0.89 | 0.00 | 3.92 | 4.80 | 8.71 | 9.60 | 13.51 | 14.40 | |
| 7_1 | 10.52 | 9.72 | 6.45 | 5.82 | 6.55 | 7.22 | 10.58 | 11.39 | 9.60 | 8.72 | 4.81 | 3.92 | 0.00 | 0.89 | 4.80 | 5.69 | 9.60 | 10.49 | |
| 7_2 | 11.34 | 10.52 | 7.13 | 6.44 | 5.93 | 6.55 | 9.78 | 10.58 | 10.49 | 9.60 | 5.69 | 4.80 | 0.89 | 0.00 | 3.91 | 4.80 | 8.71 | 9.60 | |
| 8_1 | 15.03 | 14.18 | 10.52 | 9.71 | 4.45 | 4.54 | 6.55 | 7.22 | 14.40 | 13.51 | 9.60 | 8.71 | 4.80 | 3.91 | 0.00 | 0.89 | 4.80 | 5.69 | |
| 8_2 | 15.88 | 15.03 | 11.34 | 10.52 | 4.54 | 4.45 | 5.92 | 6.55 | 15.29 | 14.40 | 10.49 | 9.60 | 5.69 | 4.80 | 0.89 | 0.00 | 3.91 | 4.80 | |
| 9_1 | 19.68 | 18.81 | 15.03 | 14.18 | 6.54 | 5.92 | 4.45 | 4.54 | 19.20 | 18.31 | 14.40 | 13.51 | 9.60 | 8.71 | 4.80 | 3.91 | 0.00 | 0.89 | |
| 9_2 | 20.55 | 19.68 | 15.88 | 15.03 | 7.22 | 6.55 | 0.45 | 4.45 | 20.09 | 19.20 | 15.29 | 14.40 | 10.49 | 9.60 | 5.69 | 4.80 | 0.89 | 0.00 | |
| Best-Case Scenario | Worst-Case Scenario | ||
|---|---|---|---|
| Initial situation | Total in m: | 100.87 | |
| User-related in m: | 5.5 (4.19–6.55) | ||
| Preferred user in m: | 5.31 (4.45–6.44) | ||
| Optimization of communication paths via Simulated Annealing | Total in m: | 62.04 | 137.79 |
| User-related in m: | 3.73 (2.39–4.11) | 7.17 (5.56–9.78) * | |
| Preferred user in m: | 2.49 (1.33–3.99) * | 14.05 (12.42–17.09) * | |
| Optimization of daily light doses via method of [34] | Total in m: | 114.54 | 103.79 |
| User-related in m: | 6.24 (5.05–7.94) * | 5.71 (4.14–6.94) * | |
| Preferred user in m: | 6.57 (4.47–14.14) | 10.52 (5.75–14.65) * | |
| Optimization of energy demand via method of [34] | Total in m: | 106.25 | 114.15 |
| User-related in m: | 5.37 (4.59–6.22) | 6.39 (5.08–8.37) * | |
| Preferred user in m: | 5.69 (1.64–10.3) | 9.60 (4.8–14.40) | |
| Objective | Post Hoc Pairwise Comparisons (Bonferroni) | p-Value | |
|---|---|---|---|
| Best-Case Scenario | Worst-Case Scenario | ||
| Preference weighted communication distance | Optimization of communication distances vs. optimization of energy consumption | 3.65 × 10⁻⁷ | 0.02 |
| Optimization of communication distances vs. optimization of daily light doses | 9.96 × 10⁻¹⁰ | 3.53 × 10⁻⁴ | |
| Optimization of energy consumption vs. optimization of daily light doses | 0.96 | 0.72 | |
| Distance to preferred user | Optimization of communication distances vs. optimization of energy consumption | 0.02 | 5.06 × 10⁻⁴ |
| Optimization of communication distances vs. optimization of daily light doses | 1.67 × 10⁻⁴ | 2.03 × 10⁻³ | |
| Optimization of energy consumption vs. optimization of daily light doses | 0.57 | 1.00 | |
| Best-Case Scenario | Worst-Case Scenario | ||
|---|---|---|---|
| Initial situation | mean ± std in lxh: | 2723.27 ± 930.10 | |
| min in lxh: | 1152.26 | ||
| max in lxh: | 4738.46 | ||
| Optimization of communication paths via Simulated Annealing | mean ± std in lxh: | 2645.26 ± 929.73 | 2659.9 ± 976.41 |
| min in lxh: | 1314.74 | 1282.35 | |
| max in lxh: | 3945.05 | 4121.75 | |
| Optimization of daily light doses via method of [34] | mean ± std in lxh: | 2909.31 ± 1221.09 | 2417.19 ± 532.42 |
| min in lxh: | 889.31 | 1537.17 | |
| max in lxh: | 5146.58 | 3766.81 | |
| Optimization of energy demand via method of [34] | mean ± std in lxh: | 2696.84 ± 983.96 | 2624.18 ± 904.27 |
| min in lxh: | 1172.31 | 1165.06 | |
| max in lxh: | 4400.82 | 3955.43 | |
| Post Hoc Pairwise Comparisons (Bonferroni) | p-Value | |
|---|---|---|
| Best-Case | Worst-Case | |
| Optimization of communication distances vs. optimization of energy consumption | 0.42 | 0.41 |
| Optimization of communication distances vs. optimization of daily light doses | 0.20 | 0.24 |
| Optimization of energy consumption vs. optimization of daily light doses | 1.00 | 1.00 |
| Best-Case Scenario | Worst-Case Scenario | ||
|---|---|---|---|
| Initial situation | Total in kWh: | 237.12 | |
| Workplace-related in kWh: | 26.35 ± 16.87 | ||
| Same presences in min: | 15,952 ± 7532 | ||
| Optimization of communication paths via Simulated Annealing | Total in kWh: | 235.78 | 237.85 |
| Workplace-related in kWh: | 26.2 ± 6.64 | 26.43 ± 4.51 | |
| Same presences in min: | 16,774 ± 7131 | 15,412 ± 5262 | |
| Optimization of daily light doses via method of [34] | Total in kWh: | 227.18 | 247.82 |
| Workplace-related in kWh: | 25.24 ± 10.08 | 27.54 ± 16.37 | |
| Same presences in min: | 18,210 ± 8593 | 18,687 ± 9343 | |
| Optimization of energy demand via method of [34] | Total in kWh: | 178.32 | 268.60 |
| Workplace-related in kWh: | 19.81 ± 4.70 | 29.84 ± 12.69 | |
| Same presences in min: | 19,076 ± 7.81 | 12,100 ± 4231 | |
| Objective | Post Hoc Pairwise Comparisons (Bonferroni) | p-Value | |
| Best-Case Scenario | Worst-Case Scenario | ||
| Lighting energy demand | Optimization of communication distances vs. optimization of energy consumption | 0.10 | 1.00 |
| Optimization of communication distances vs. optimization of daily light doses | 0.21 | 1.00 | |
| Optimization of energy consumption vs. optimization of daily light doses | 1.00 | 1.00 | |
| Same Presences | Optimization of communication distances vs. optimization of energy consumption | 1.00 | 2.21 × 10⁻³ |
| Optimization of communication distances vs. optimization of daily light doses | 0.21 | 0.27 | |
| Optimization of energy consumption vs. optimization of daily light doses | 0.78 | 0.28 | |
Disclaimer/Publisher’s Note: The statements, opinions and data contained in all publications are solely those of the individual author(s) and contributor(s) and not of MDPI and/or the editor(s). MDPI and/or the editor(s) disclaim responsibility for any injury to people or property resulting from any ideas, methods, instructions or products referred to in the content. |
© 2025 by the authors. Licensee MDPI, Basel, Switzerland. This article is an open access article distributed under the terms and conditions of the Creative Commons Attribution (CC BY) license (https://creativecommons.org/licenses/by/4.0/).
Share and Cite
Hammes, S.; Weninger, J. Optimizing User Distributions in Open-Plan Offices for Communication and Their Implications for Energy Demand and Light Doses: A Living Lab Case Study. Buildings 2025, 15, 3458. https://doi.org/10.3390/buildings15193458
Hammes S, Weninger J. Optimizing User Distributions in Open-Plan Offices for Communication and Their Implications for Energy Demand and Light Doses: A Living Lab Case Study. Buildings. 2025; 15(19):3458. https://doi.org/10.3390/buildings15193458
Chicago/Turabian StyleHammes, Sascha, and Johannes Weninger. 2025. "Optimizing User Distributions in Open-Plan Offices for Communication and Their Implications for Energy Demand and Light Doses: A Living Lab Case Study" Buildings 15, no. 19: 3458. https://doi.org/10.3390/buildings15193458
APA StyleHammes, S., & Weninger, J. (2025). Optimizing User Distributions in Open-Plan Offices for Communication and Their Implications for Energy Demand and Light Doses: A Living Lab Case Study. Buildings, 15(19), 3458. https://doi.org/10.3390/buildings15193458


