Article

Thermal Performance Variations of Office Spaces in Educational Buildings Resulting from Façade Orientation: An Egyptian Case Study

by
Ahmad I. Elshamy
1,2,*,
Rania Rushdy Moussa
2,3,
Mahmoud Alghrieb
1,2,
Engy Elshazly
1,2,
Iman El-Mahallawi
2,4,* and
Hesham Safwat
1,2
1
Mechanical Engineering Department, The British University in Egypt, Cairo 11837, Egypt
2
Centre for Renewable Energy, The British University in Egypt, Cairo 11837, Egypt
3
Architecture Engineering Department, The British University in Egypt, Cairo 11837, Egypt
4
Metallurgical Engineering Department, Faculty of Engineering, Cairo University, Giza 12613, Egypt
*
Authors to whom correspondence should be addressed.
Buildings 2025, 15(19), 3437; https://doi.org/10.3390/buildings15193437
Submission received: 28 July 2025 / Revised: 12 September 2025 / Accepted: 18 September 2025 / Published: 23 September 2025

Abstract

This paper investigates the thermal performance of an office floor within the Faculty of Engineering at the British University in Egypt (BUE), located in Cairo, a city characterized by a hot arid climate. The study focuses on understanding the building’s thermal behavior by comparing two identical office rooms: Room 212 (north-facing) and Room 201 (south-facing). Utilizing dynamic thermal simulations with TRNSYS 18 for a full year, the research specifically analyzes the impact of these opposite orientations on indoor space temperature, total cooling loads, the monthly heat absorbed by various building surfaces, and the heat absorbed per unit area for each surface. The findings reveal significant disparities in thermal performance, particularly in terms of heat gain and cooling demand, directly attributable to orientation. This research highlights the critical role of facade orientation in mitigating radiative heat absorption and reducing energy consumption in educational buildings within hot climates, providing valuable insights for optimizing building design strategies to enhance thermal comfort and energy efficiency.

1. Introduction

The building sector is one of the largest consumers of energy worldwide, responsible for nearly one-third of total global energy demand and a significant share of greenhouse gas emissions [1]. This high consumption is driven by factors such as rapid urbanization, rising living standards, population growth, and the increasing reliance on energy-intensive technologies. Educational buildings represent a unique and important subcategory of the built environment due to their intensive use patterns, high occupant density, and the need to maintain optimal indoor environmental quality (IEQ) to support the learning environment and well-being [2].
In many countries, including Egypt, the number of educational institutions has grown steadily over the past decade as part of national strategies to improve access to education and strengthen human capacity [3,4]. Egypt’s educational institutions are currently adopting institutional and research strategies that enforce the integration of sustainable energy concepts on campuses [5,6], especially with their expansion to encompass more than 60,000 pre-university institutions and over 100 higher education institutions, collectively serving millions of students [7,8]. This rapid expansion brings with it a corresponding increase in the demand for resources, particularly energy for lighting, ventilation, heating, and cooling. The challenge is compounded in hot–arid climates like Egypt’s, where cooling loads dominate annual energy consumption, and where building design decisions, such as orientation, glazing ratios, and façade treatments, can have a profound effect on energy efficiency [9,10].
Educational buildings differ significantly from other building types in both their operation and energy demand profiles [11,12]. They are typically in use for long hours during the day, often with schedules that vary across seasons, and their indoor environment must be carefully controlled to ensure thermal comfort and adequate air quality [13]. University facilities tend to have substantially higher per capita energy consumption compared to residential or even other public buildings, nearly four times higher than the average residential occupant [11,14]. This is due to their diverse functional requirements, offices, lecture halls, laboratories, and social spaces, and the high internal heat gains from occupants, equipment, and lighting [10,15]. Poorly optimized designs can lead not only to excessive operational energy use but also to reduced comfort levels, which have been shown to negatively affect academic performance and health [16,17].
Among the many design factors influencing building performance, orientation is one of the most critical yet often underestimated [18]. Building orientation affects the amount and timing of solar radiation incidence on different façades, which in turn influences heat gain, daylight availability, cooling loads, and overall thermal comfort. In hot–arid climates, south-facing façades typically experience higher solar exposure, especially in summer, resulting in increased cooling demand unless mitigated through passive design strategies such as shading devices or high-performance glazing [18]. Conversely, north-facing façades generally receive less direct solar radiation, potentially reducing heat gain and associated cooling requirements [10].
Despite the well-documented influence of orientation on building performance, there remains a shortage of detailed, context-specific research for educational buildings in Egypt and similar climatic regions [19]. Existing design guidelines often take a “one-size-fits-all” approach, which may not adequately address the specific thermal performance needs of university buildings operating under local climatic and cultural conditions [20].
Research on building performance in hot climates consistently highlights that integrated design strategies combining architectural measures with building services can deliver substantial energy savings and emissions reductions [21]. Österreicher and Seerig quantified the CO2 and energy reduction potential of envelope optimization, shading, and efficient HVAC systems, demonstrating their effectiveness in reducing operational energy demand in hot climate zones [22].
Among these strategies, façade orientation is widely recognized as a primary driver of thermal performance. Rashad et al. [23] employed year-round TRNSYS simulations on a three-zone residential building to assess the influence of envelope heat transfer, thermal gains and losses, and orientation on cooling demand; underscoring how appropriate building configurations and interventions—such as external shading can notably reduce cooling loads. Similarly, Pathirana, Rodrigo, and Halwatura [20] found that orientation, glazing ratios, and building style strongly influence both thermal comfort and energy efficiency, particularly in office-type buildings [20]. In hot–arid contexts, Bensafi et al. [23] emphasized the need to integrate humidity control with thermal strategies to maintain occupant comfort [24], while case studies in Egypt, such as the zero-energy office building at BUE [12], confirm that reducing cooling loads through orientation and envelope improvements is a prerequisite before deploying renewable energy systems.
Recent research has continued to emphasize the role of façade orientation, shading systems, and passive strategies in enhancing thermal performance and reducing cooling demand in office environments. Seghier et al. [25] optimized the thermal daylight balance of tropical open-plan offices using a coupled OTTV and daylight simulation approach, highlighting the effectiveness of envelope adjustments in minimizing solar gains, while maintaining daylight availability [25]. Similarly, studies on external shading in office buildings demonstrated that well-designed shading configurations can significantly reduce cooling loads in hot climates [20]. More recently, BIM-based simulations of tropical high-rise buildings [26] showed that passive strategies, including low solar heat gain windows and low-conductivity walls, can reduce energy use by over 30%. Complementary to passive measures, advanced prediction models using feature-engineered neural networks achieved up to 13.8% energy savings in commercial chiller systems [27]. Retrofitting studies in Malaysia further demonstrated that combining passive shading with HVAC improvements could cut office energy consumption by nearly 60% [28]. These findings reaffirm the growing consensus that orientation-sensitive façade design, external shading, and integrated passive–active approaches are critical to reducing cooling loads and improving thermal comfort in hot–arid and tropical office contexts.
The literature review presented in this section has been synthesized to outline the key contributions, methodologies, and findings relevant to building thermal performance and energy efficiency in educational facilities, particularly in hot-arid climates. A summary of the reviewed research articles is provided in Table 1, highlighting their focus areas, approaches, and principal outcomes. This synthesis establishes the research context, identifies existing gaps, and underpins the rationale for the present investigation into the influence of orientation on the thermal performance of educational buildings.
Although numerous studies have examined building energy performance and thermal comfort in educational facilities across different climates, they focused on general passive design strategies, envelope optimization, or comparative analyses across multiple building types, without isolating the effect of a single design parameter, such as orientation, under controlled operational conditions. In hot–arid climates, where cooling demand dominates annual energy use, façade orientation can have a critical impact on solar heat gain, indoor temperature profiles, and cooling loads. However, as summarized in Table 1, existing research in this field either considers orientation as one of several design variables [2] or investigates its impact without applying a detailed surface-level heat gain analysis [18,29]. Moreover, there is a lack of simulation-based studies that quantify both total and per-unit-area heat absorption for each building envelope component in the context of higher education facilities in Egypt.
Analysis of the features of energy usage in various building types on campuses of higher education conducted by Khoshbakht et al. [30] showed that research buildings have the highest value, 216 kWh/m2/year, among Australia’s 80 university buildings, while the most valuable structures are academic office buildings, 137 kWh/m2/year. The authors conducted an extensive study [13] on the energy performance of the Engineering building at the British University, which revealed that due to the device’s consumption in the offices the pc power consumption has the highest percentage of 42.71%, versus highest power consumption of 48.59% in the lectures and tutorials venues, mainly due to lighting with percentage of 48.59%. In the design of educational buildings, orientation is not usually considered; however, its consideration may be included during functional allocation inside the building. The large number of offices and, accordingly, occupied areas requires deeper analysis and consideration of their allocation in the buildings.
To address this gap, the present study employs a controlled, simulation-based comparative analysis of two geometrically and materially identical office rooms with opposing orientations (north- and south-facing) within an actual university building. Using TRNSYS 18 with local climatic data and realistic occupancy patterns, the method isolates the effect of orientation on indoor air temperature, annual cooling loads, and heat gain through each envelope surface, providing a level of detail and contextual relevance that is currently underrepresented in the literature for hot–arid educational environments.
The originality of this study stems from its comprehensive, simulation-based comparative analysis of two geometrically identical office rooms with contrasting orientations within an existing educational building situated in a hot–arid climate. In contrast to general investigations on building orientation, the present work is tailored to the operational context of higher education facilities in Egypt, integrating local climatic data and realistic occupancy profiles into year-round dynamic simulations. The analysis quantifies the effect of orientation on indoor temperature patterns, annual cooling loads, and both the total and per-unit-area heat absorbed by individual building envelope components. By directly relating façade orientation to measurable thermal performance indicators, the study delivers context-specific passive design recommendations aimed at improving thermal comfort and reducing cooling energy demand in educational buildings, a subject that remains insufficiently addressed in the literature for hot–arid regions.

2. Methodology

The research was conducted through a simulation-based approach, focusing on two representative, identical office rooms (Room 212 and Room 201) located on an office floor within the Faculty of Engineering at the British University in Egypt (BUE), in Al Shorouk City, Cairo, Egypt. Room 212 was configured with a north orientation, while Room 201 was configured with a south orientation, allowing for a direct comparative analysis of the impact of these opposing facades.

2.1. Case Study Description and Building Modeling

The selected case study involved two identical office rooms, from both geometrical and equipping aspects. Details regarding the actual construction materials (e.g., wall U-values, window U-values, and solar heat gain coefficients) were incorporated into the simulation model to accurately represent the existing building. Typical occupancy patterns for an educational office environment were assumed, including schedules for occupants, lighting, and equipment, consistent for both simulated rooms to isolate the effect of orientation. The setpoint temperature for cooling was maintained at a standard comfort level (24 °C) during operational hours.
A 3D model of the floor under study, including the two office rooms, was carefully created using the TRNSYS3d plugin in Google SketchUp (Figure 1). This facilitated accurate geometry input and thermal zone definition for the subsequent simulation.

2.2. Simulation Tool

The thermal performance analysis was carried out using TRNSYS 18, a powerful and widely recognized dynamic building energy simulation tool. TRNSYS 18 is known for its modular structure and ability to model complex thermal systems. The local Typical Meteorological Year (TMY) weather data for Cairo was imported into the software to simulate realistic external conditions, including ambient temperature, relative humidity, and solar radiation profiles for a complete year. This allowed for an annual assessment of thermal behavior under varying climatic conditions.

2.3. Data Monitored

For both Room 212 (north) and Room 201 (south), the following key performance indicators were monitored and recorded over the entire year:
  • Ambient Air Temperature (°C): External air temperature.
  • Room Air Temperature (°C): The simulated indoor air temperature within each office room.
  • Cooling Loads (kW): The instantaneous cooling energy required to maintain the setpoint temperature within each conditioned space.
  • Total Monthly Heat Absorbed (kW): The monthly heat absorbed by each surface component of the building envelope (exterior wall, adjacent walls, windows).
  • Heat Absorbed per Square Meter (kW/m2): The monthly heat absorbed per unit area for each surface component, indicating the intensity of heat gain.
The data obtained from these annual simulations were then compiled and analyzed to identify trends and quantify the comparative impact of north versus south orientation on the thermal performance of the building.

2.4. Model Validation

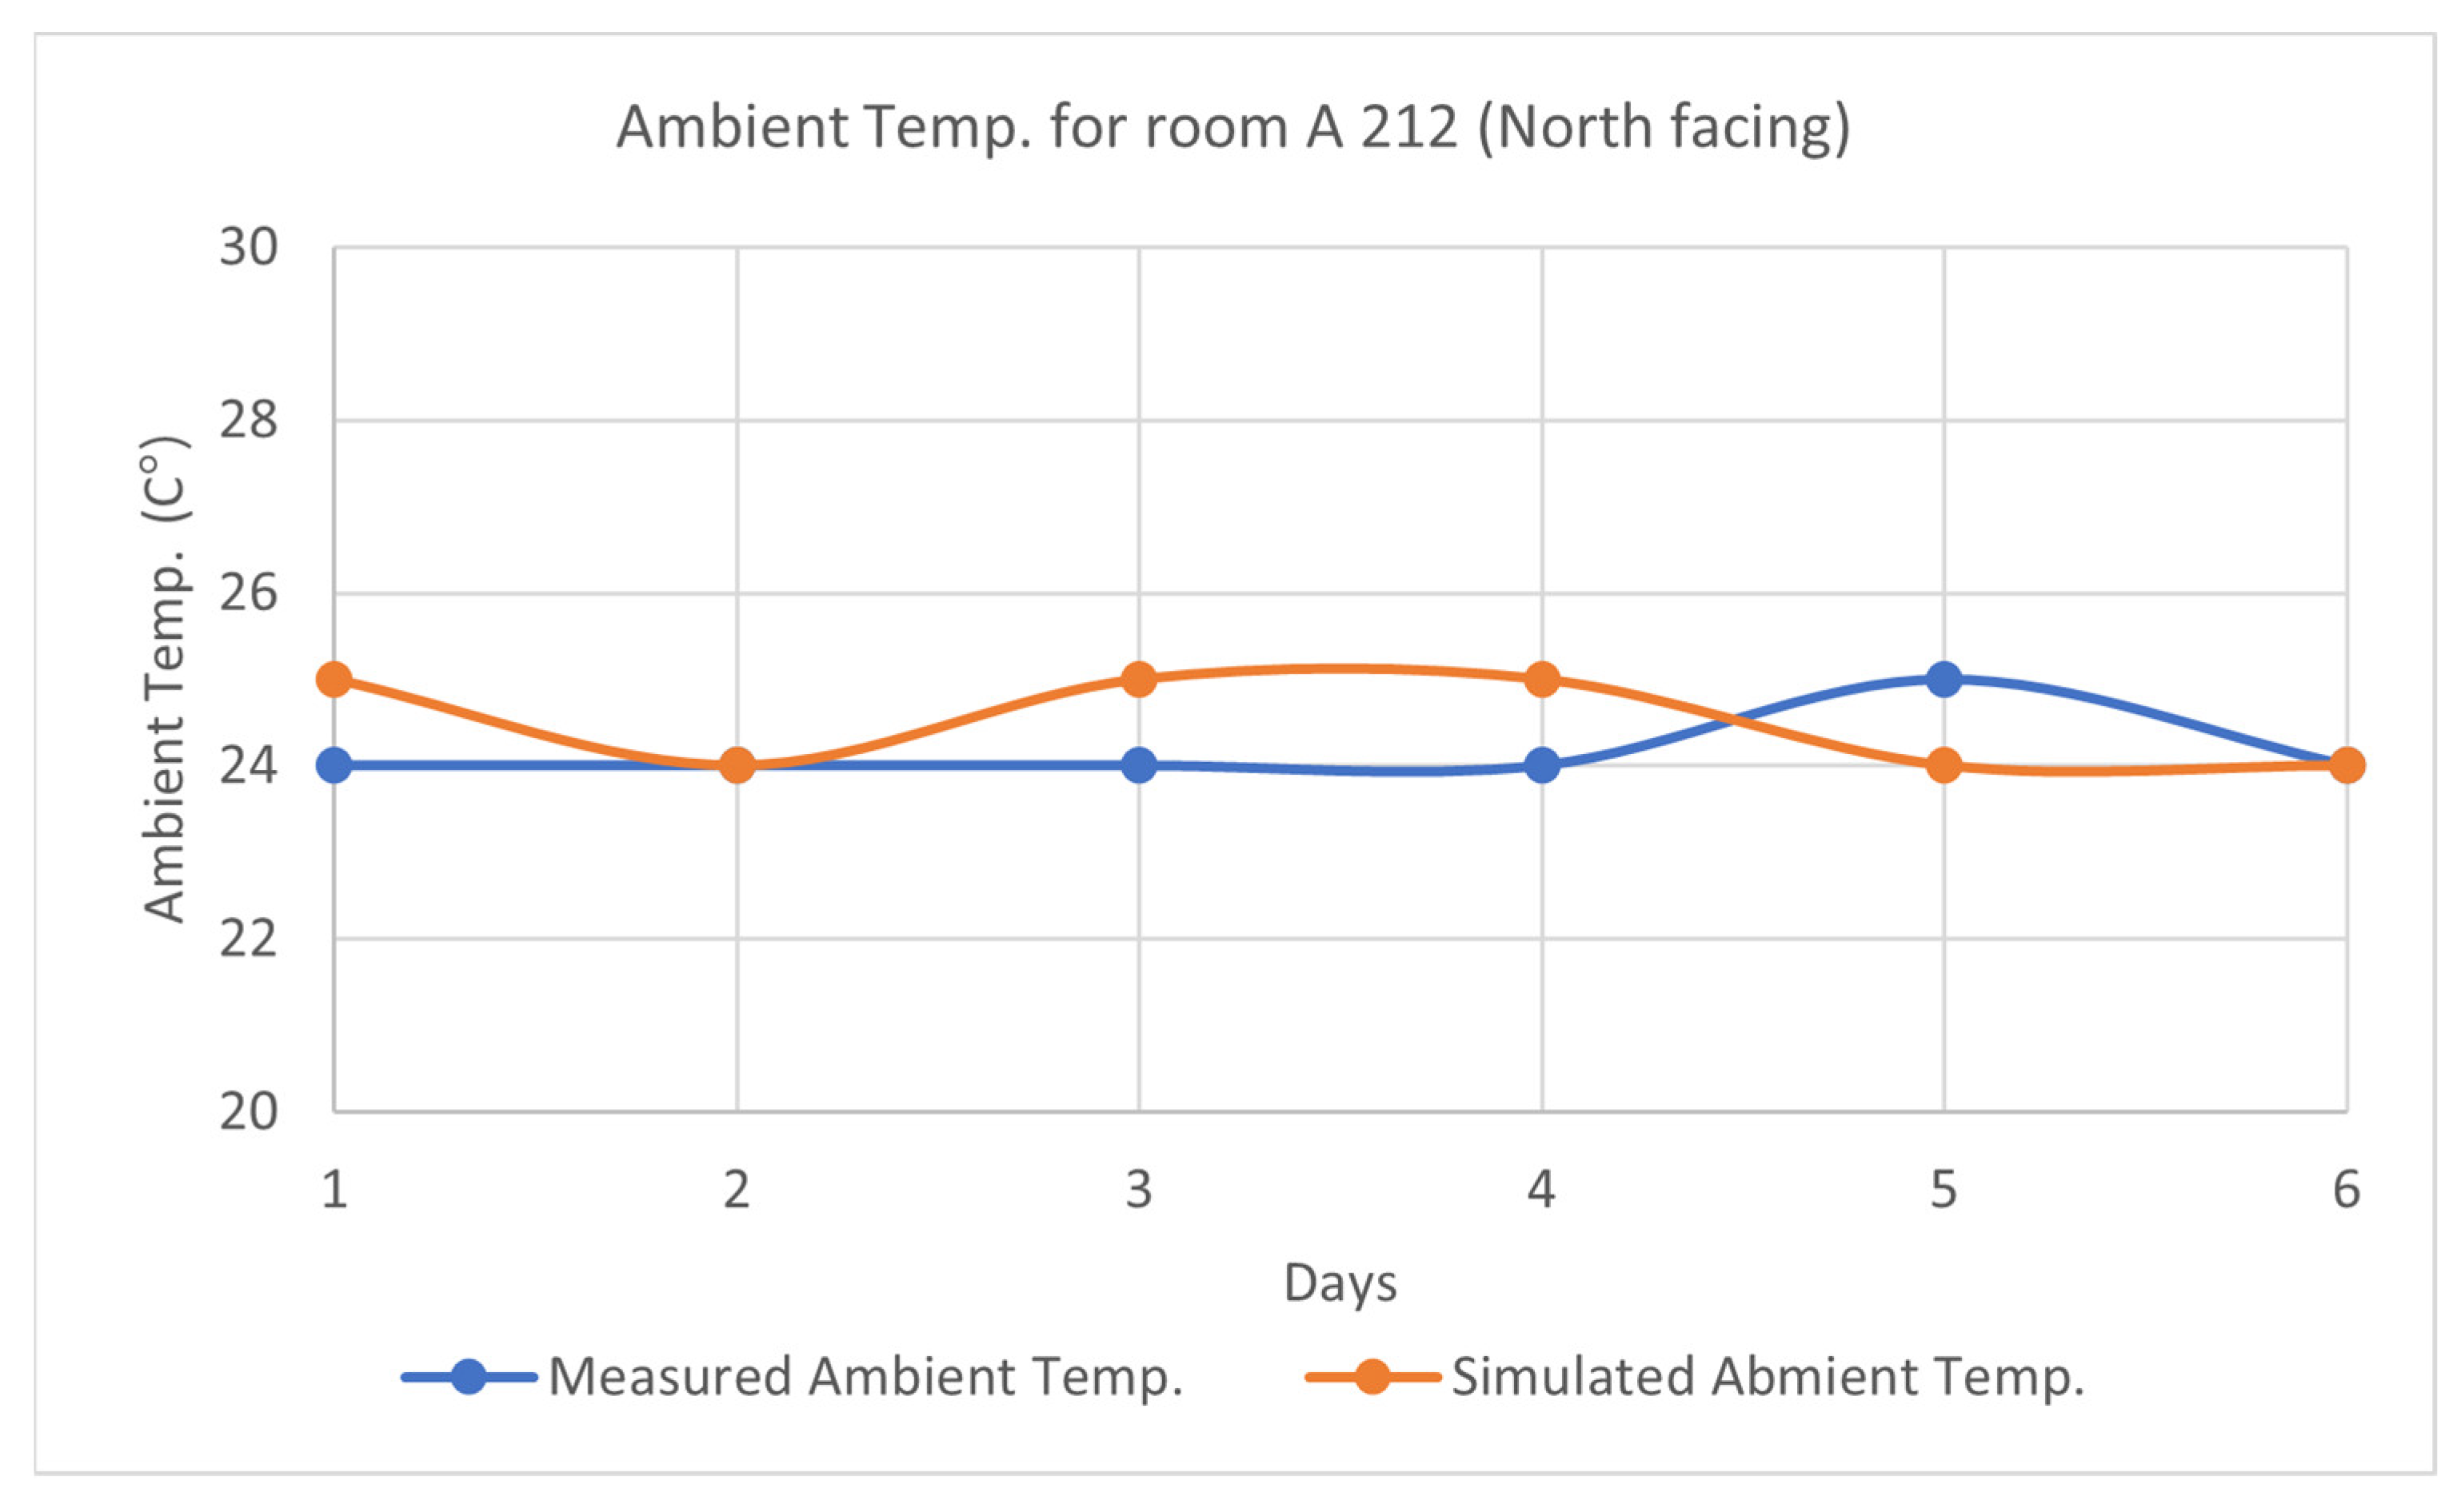
To validate the thermal simulation model, measured data collected between 15 and 21 June were directly compared with simulated results for two office rooms: Room A212 (north-facing) and Room A201 (south-facing). For Room A212, the measured temperature remained steady at 24–25 °C, while the simulation reproduced this trend almost identically, with differences of less than 1 °C across the entire period as shown in Figure 2 This strong agreement demonstrates that the model accurately captures the stable conditions of a north-facing office with minimal solar gains. Similarly, in Room A201, both measured and simulated values ranged between 26 and 29 °C, showing excellent alignment in overall levels and daily variation as shown in Figure 3. Although the simulation slightly underestimated peak temperatures on a few days, the general correspondence between the two datasets confirms that the model reliably reflects the warmer, more variable conditions of a south-facing office. Overall, the close match between measured and simulated data across both orientations validates the simulation results’ accuracy and demonstrates the model’s robustness in capturing indoor thermal behavior.

3. Results and Discussions

The simulation results provide a comprehensive understanding of how building orientation, specifically north versus south, influences the thermal behavior of the educational facility. The following subsections present and discuss the findings based on the outcomes provided.

3.1. Year-Round Air Temperature Profiles (Ambient, North Room, South Room)

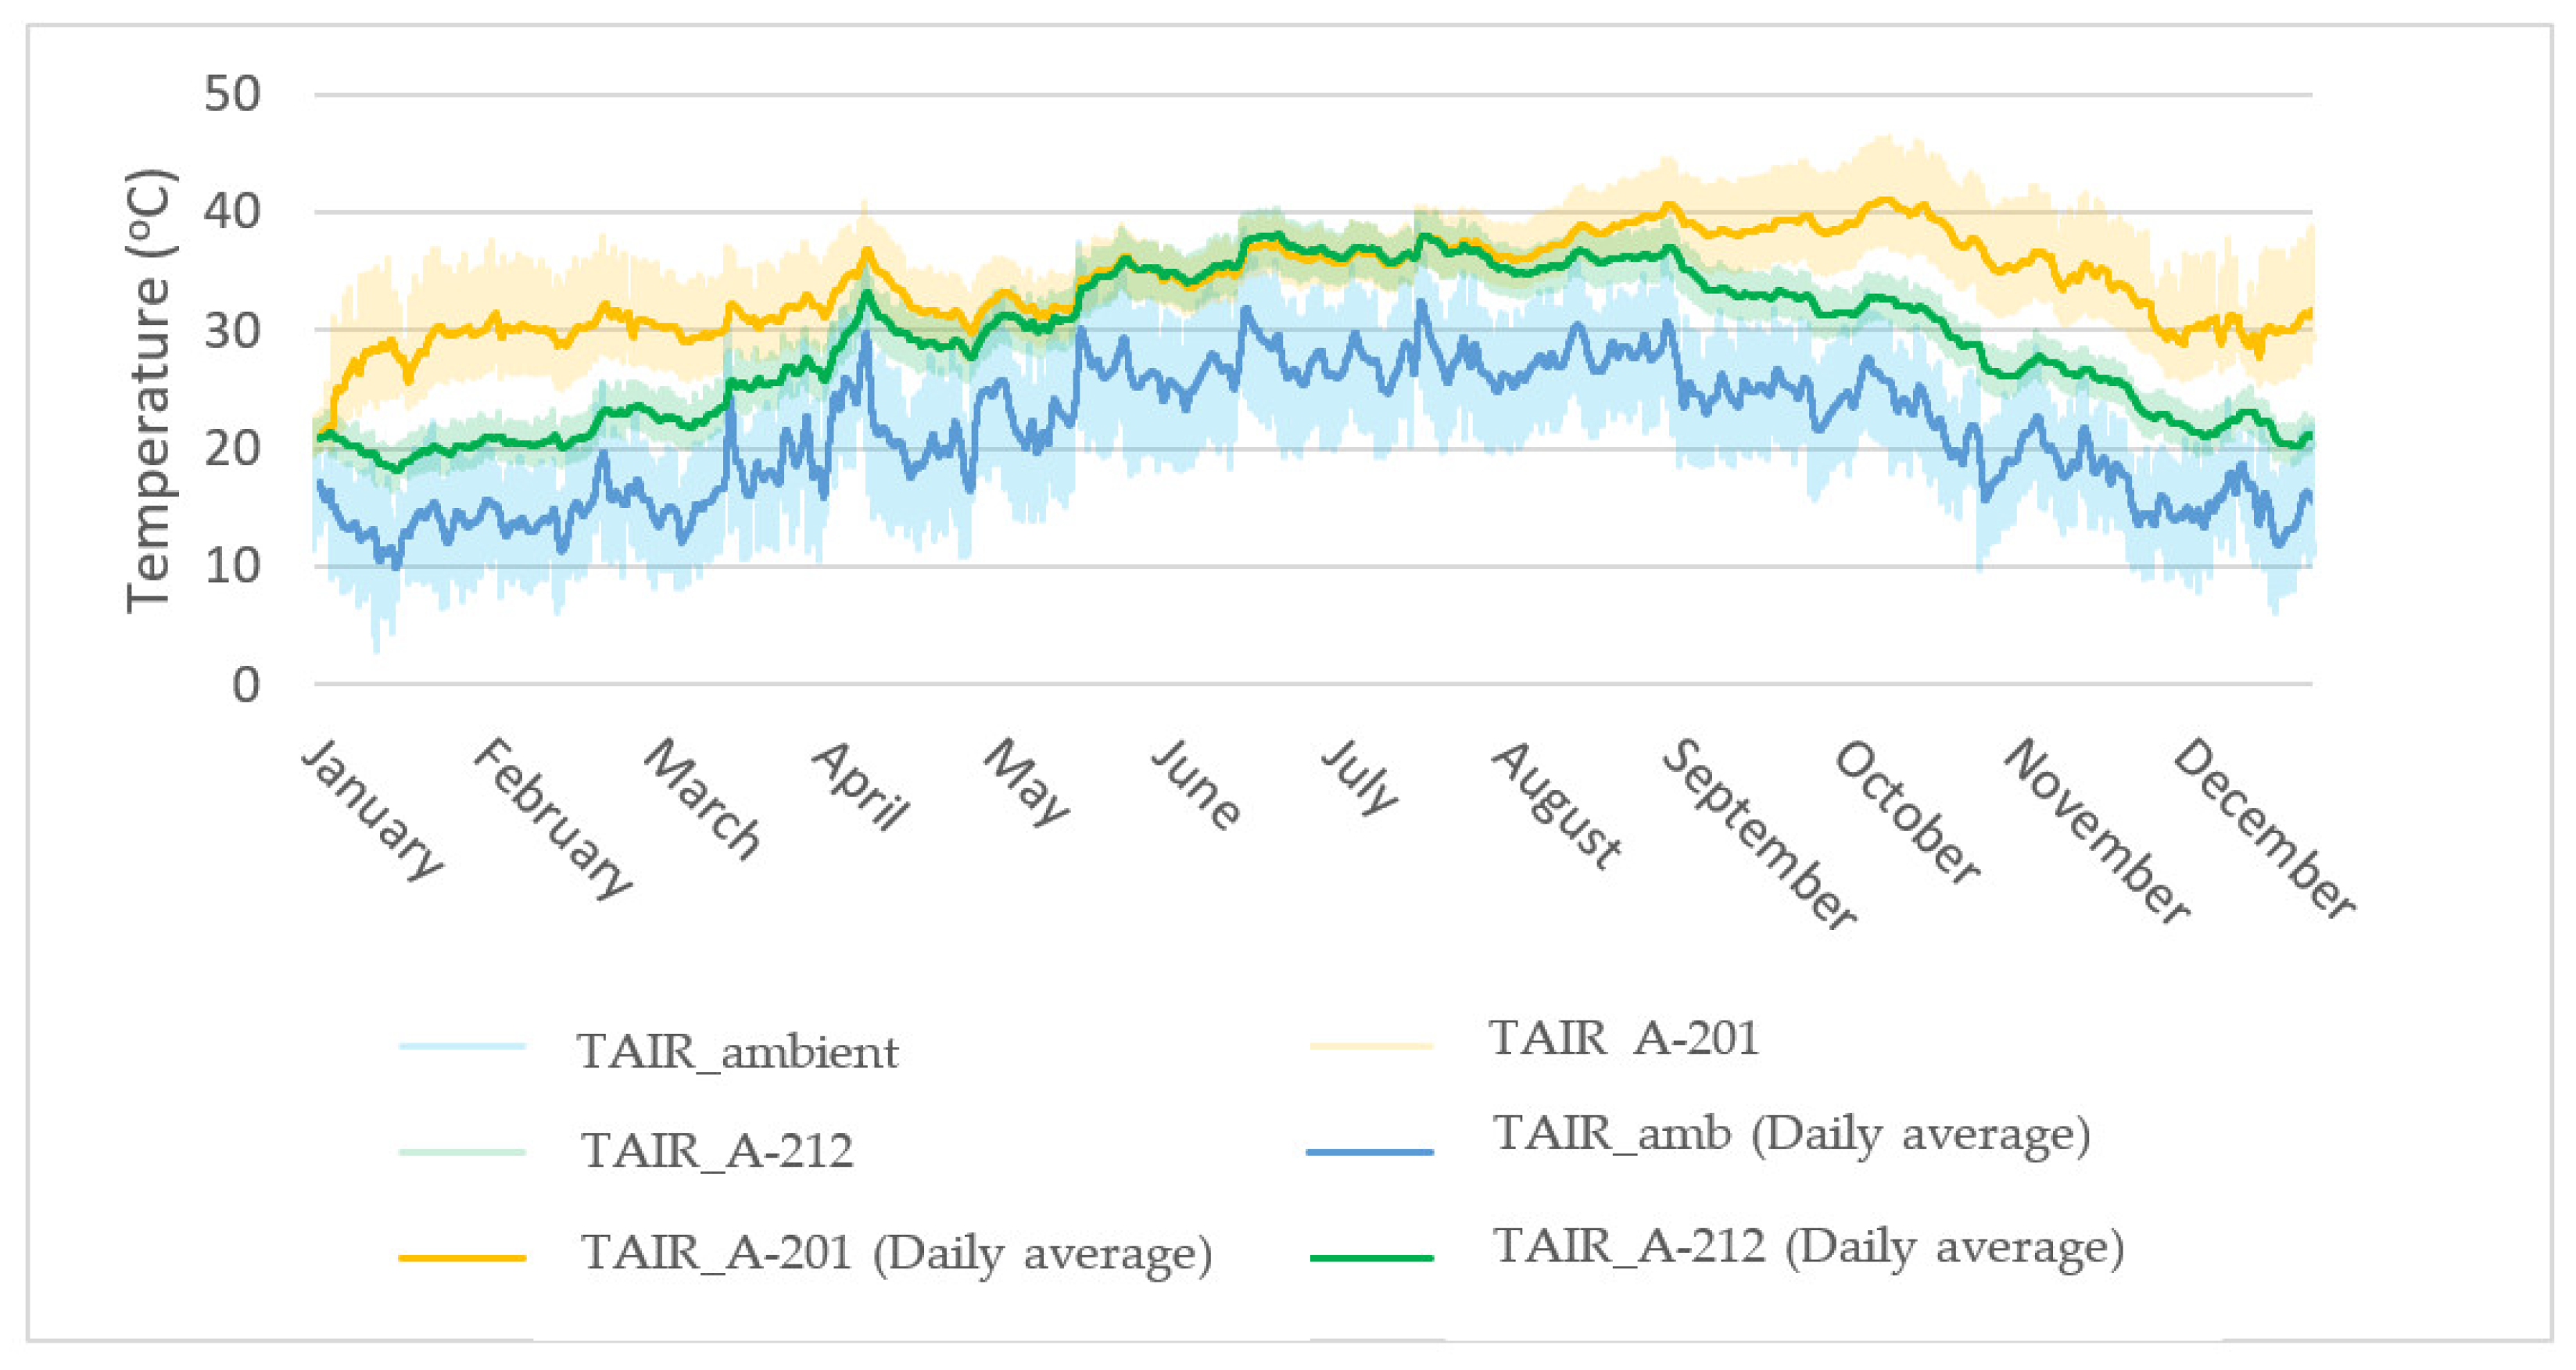
Figure 4 illustrates the year-round air temperature profiles for the ambient environment for Room 212 (north-facing) and Room 201 (south-facing), respectively. These data represent instantaneous hourly recordings, with each value calculated as the daily average of measurements taken every 8 min.
The ambient air temperature clearly shows typical seasonal variations for Cairo, characterized by high temperatures during summer months (June–September) and cooler temperatures in winter. Both Room 212 (north) and Room 201 (south) air temperatures generally follow the ambient temperature trends, but with significant internal moderation due to the building envelope and internal gains. A key observation from Figure 4 is the comparative behavior of the two rooms. During the hot summer months, Room 201 (south) is consistently observed to reach higher unconditioned peak indoor temperatures than Room 212 (north). This difference is less pronounced, or even reversed, during the cooler winter months when direct solar gain might be beneficial for the south-facing room. This discrepancy highlights the greater solar heat gain experienced by the south-facing facade during the hottest parts of the year, leading to higher indoor temperatures and consequently, a greater demand for cooling to maintain thermal comfort. The north-facing room, being less exposed to direct solar radiation throughout the day in the Northern Hemisphere, generally maintains a more stable and often cooler indoor temperature profile, especially during the intense summer period.

3.2. Comparative Annual Cooling Loads (North vs. South Rooms)

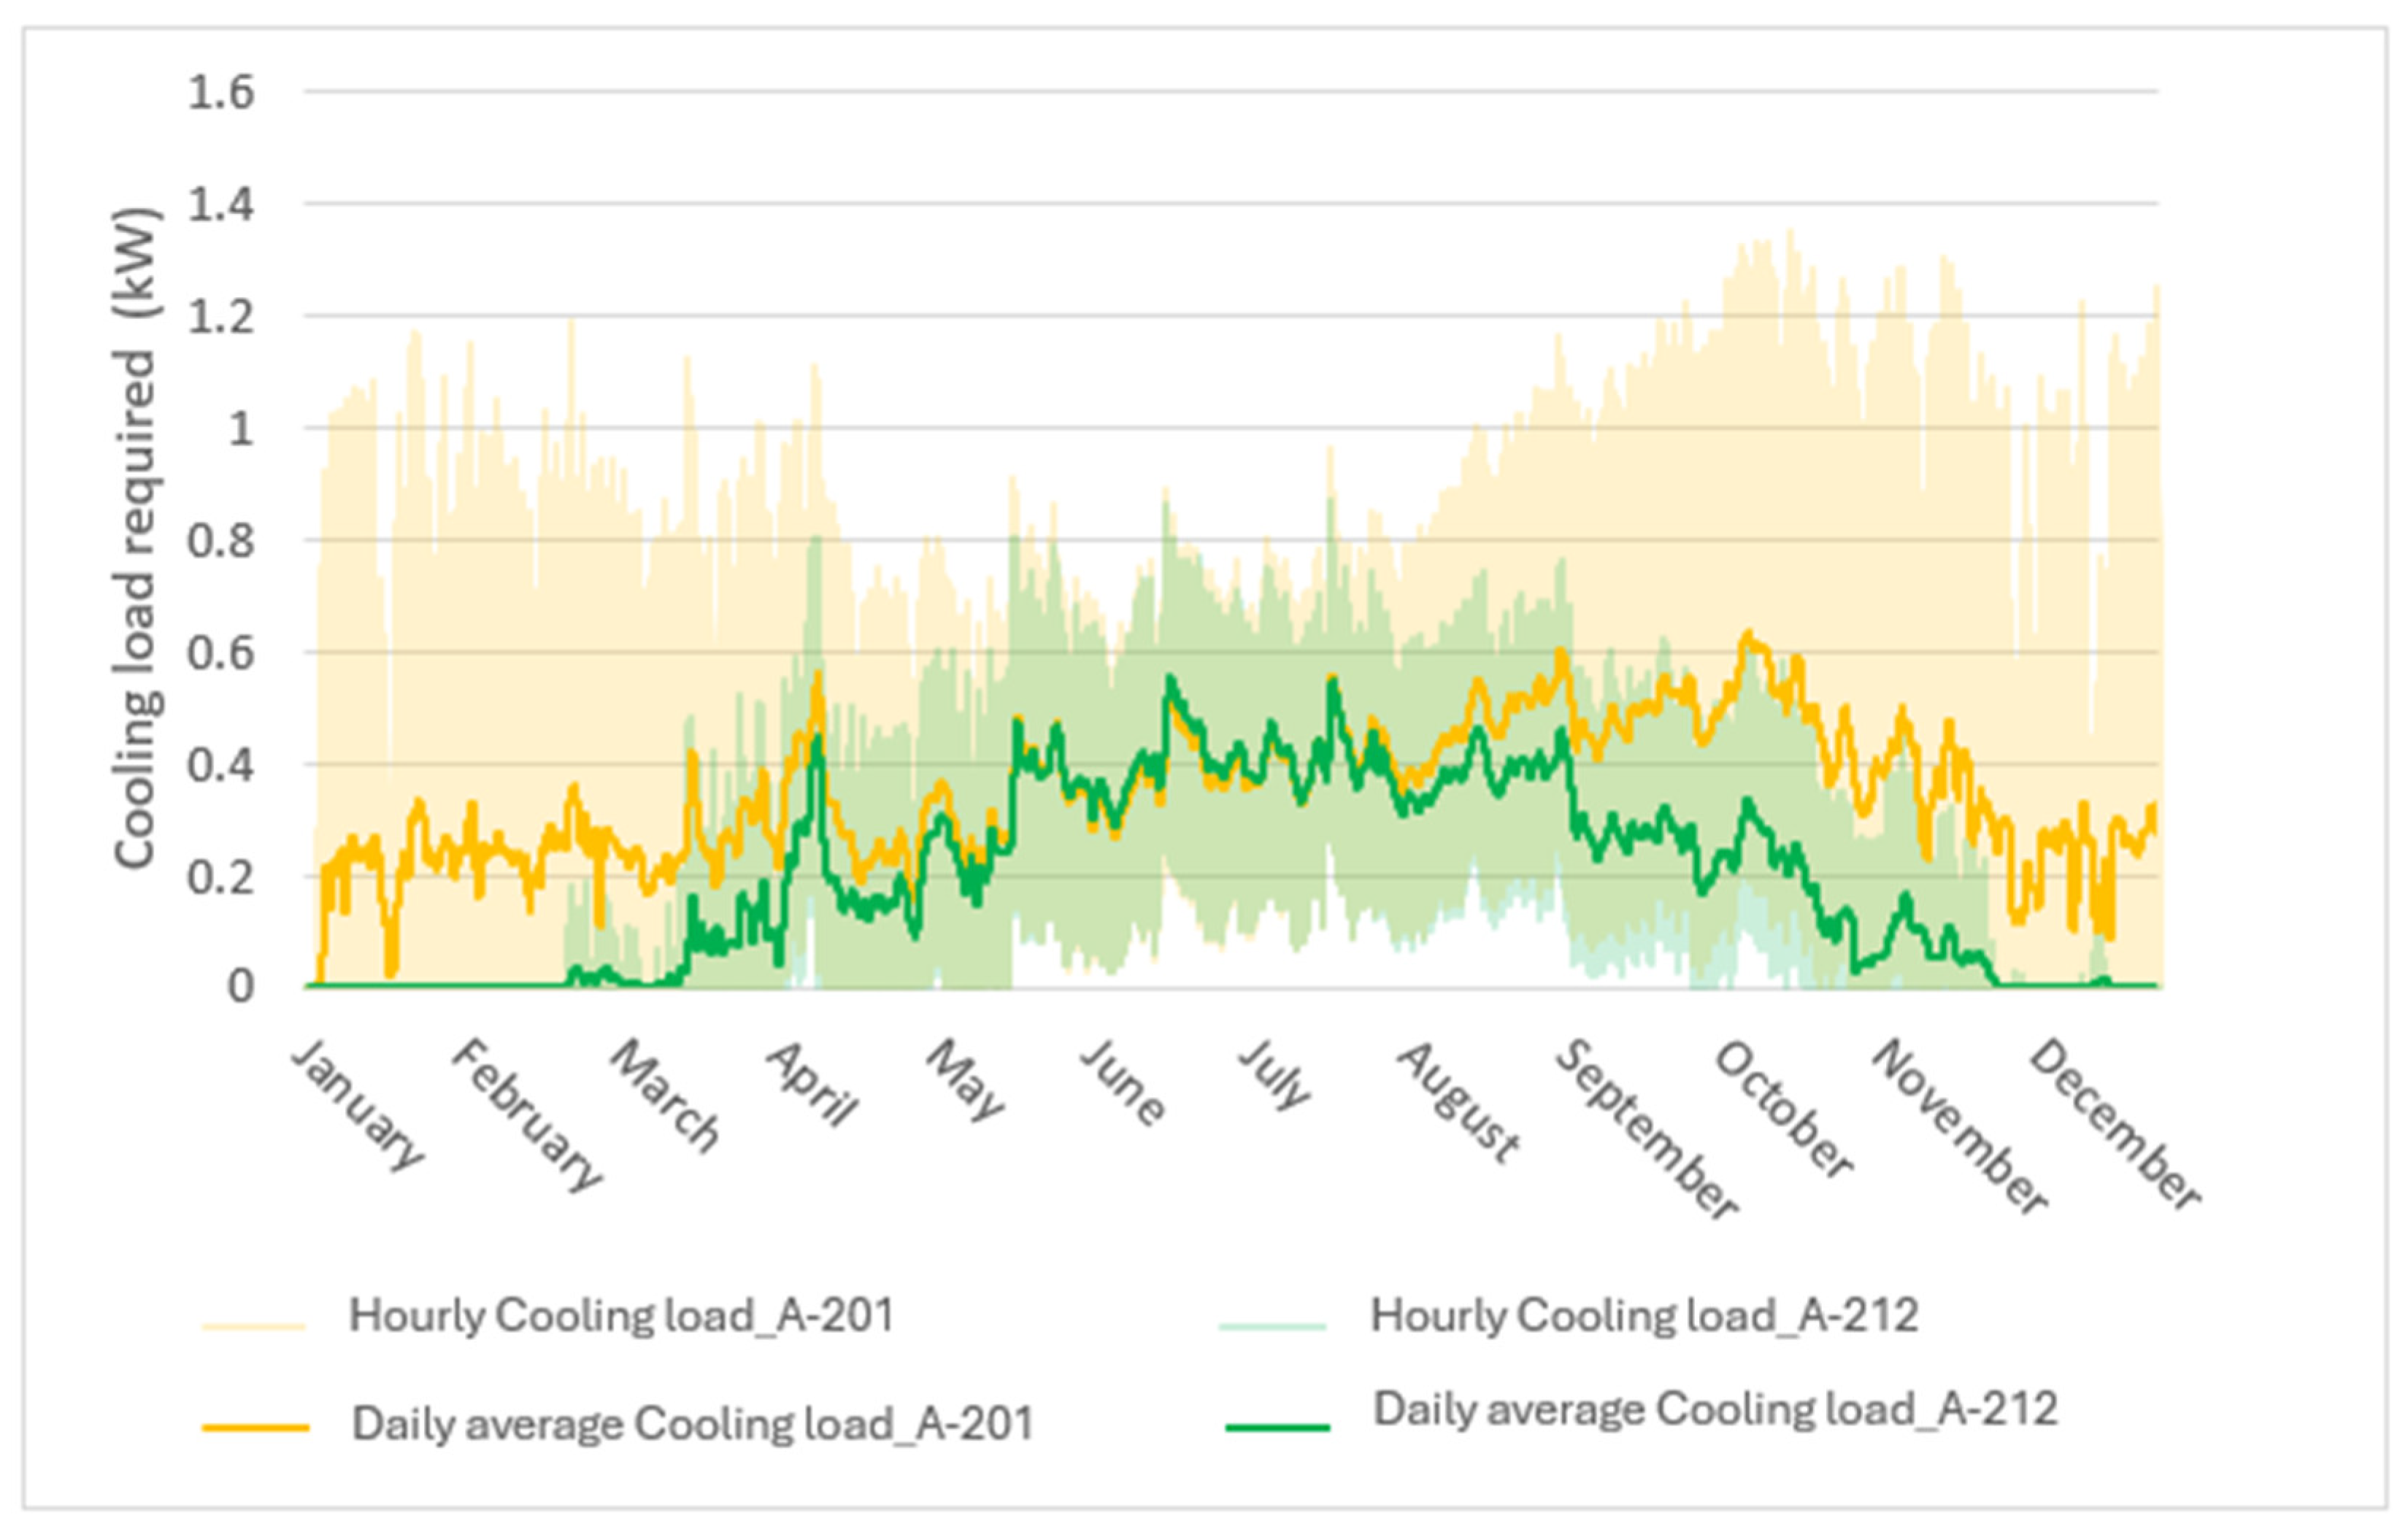
Figure 5 presents the variation of cooling loads (in kW) for Room 212 (north-facing) and Room 201 (south-facing) throughout the year.
As expected, the cooling loads for both rooms peak during the hot summer months, aligning with the highest ambient temperatures and solar radiation levels. Crucially, Room 201 (south-facing) consistently exhibits higher cooling loads than Room 212 (north-facing) during the extended summer period. This substantial difference underscores the direct impact of orientation on energy consumption for cooling. The south facade receives a high amount of solar radiation during the day, particularly around midday, leading to substantial heat gain that must be actively removed by the cooling system. The north-facing room, benefiting from more diffused solar radiation and less direct exposure during the hottest parts of the day in the Northern Hemisphere, requires considerably less cooling energy. This finding directly translates into higher operational costs and environmental impact for south-oriented spaces compared to north-oriented ones. The results indicate that the percentage of annual cooling energy savings is around 44.46% for the north-oriented office compared to the Southern one.

3.3. Total Monthly Heat Absorbed by Each Surface (kW)

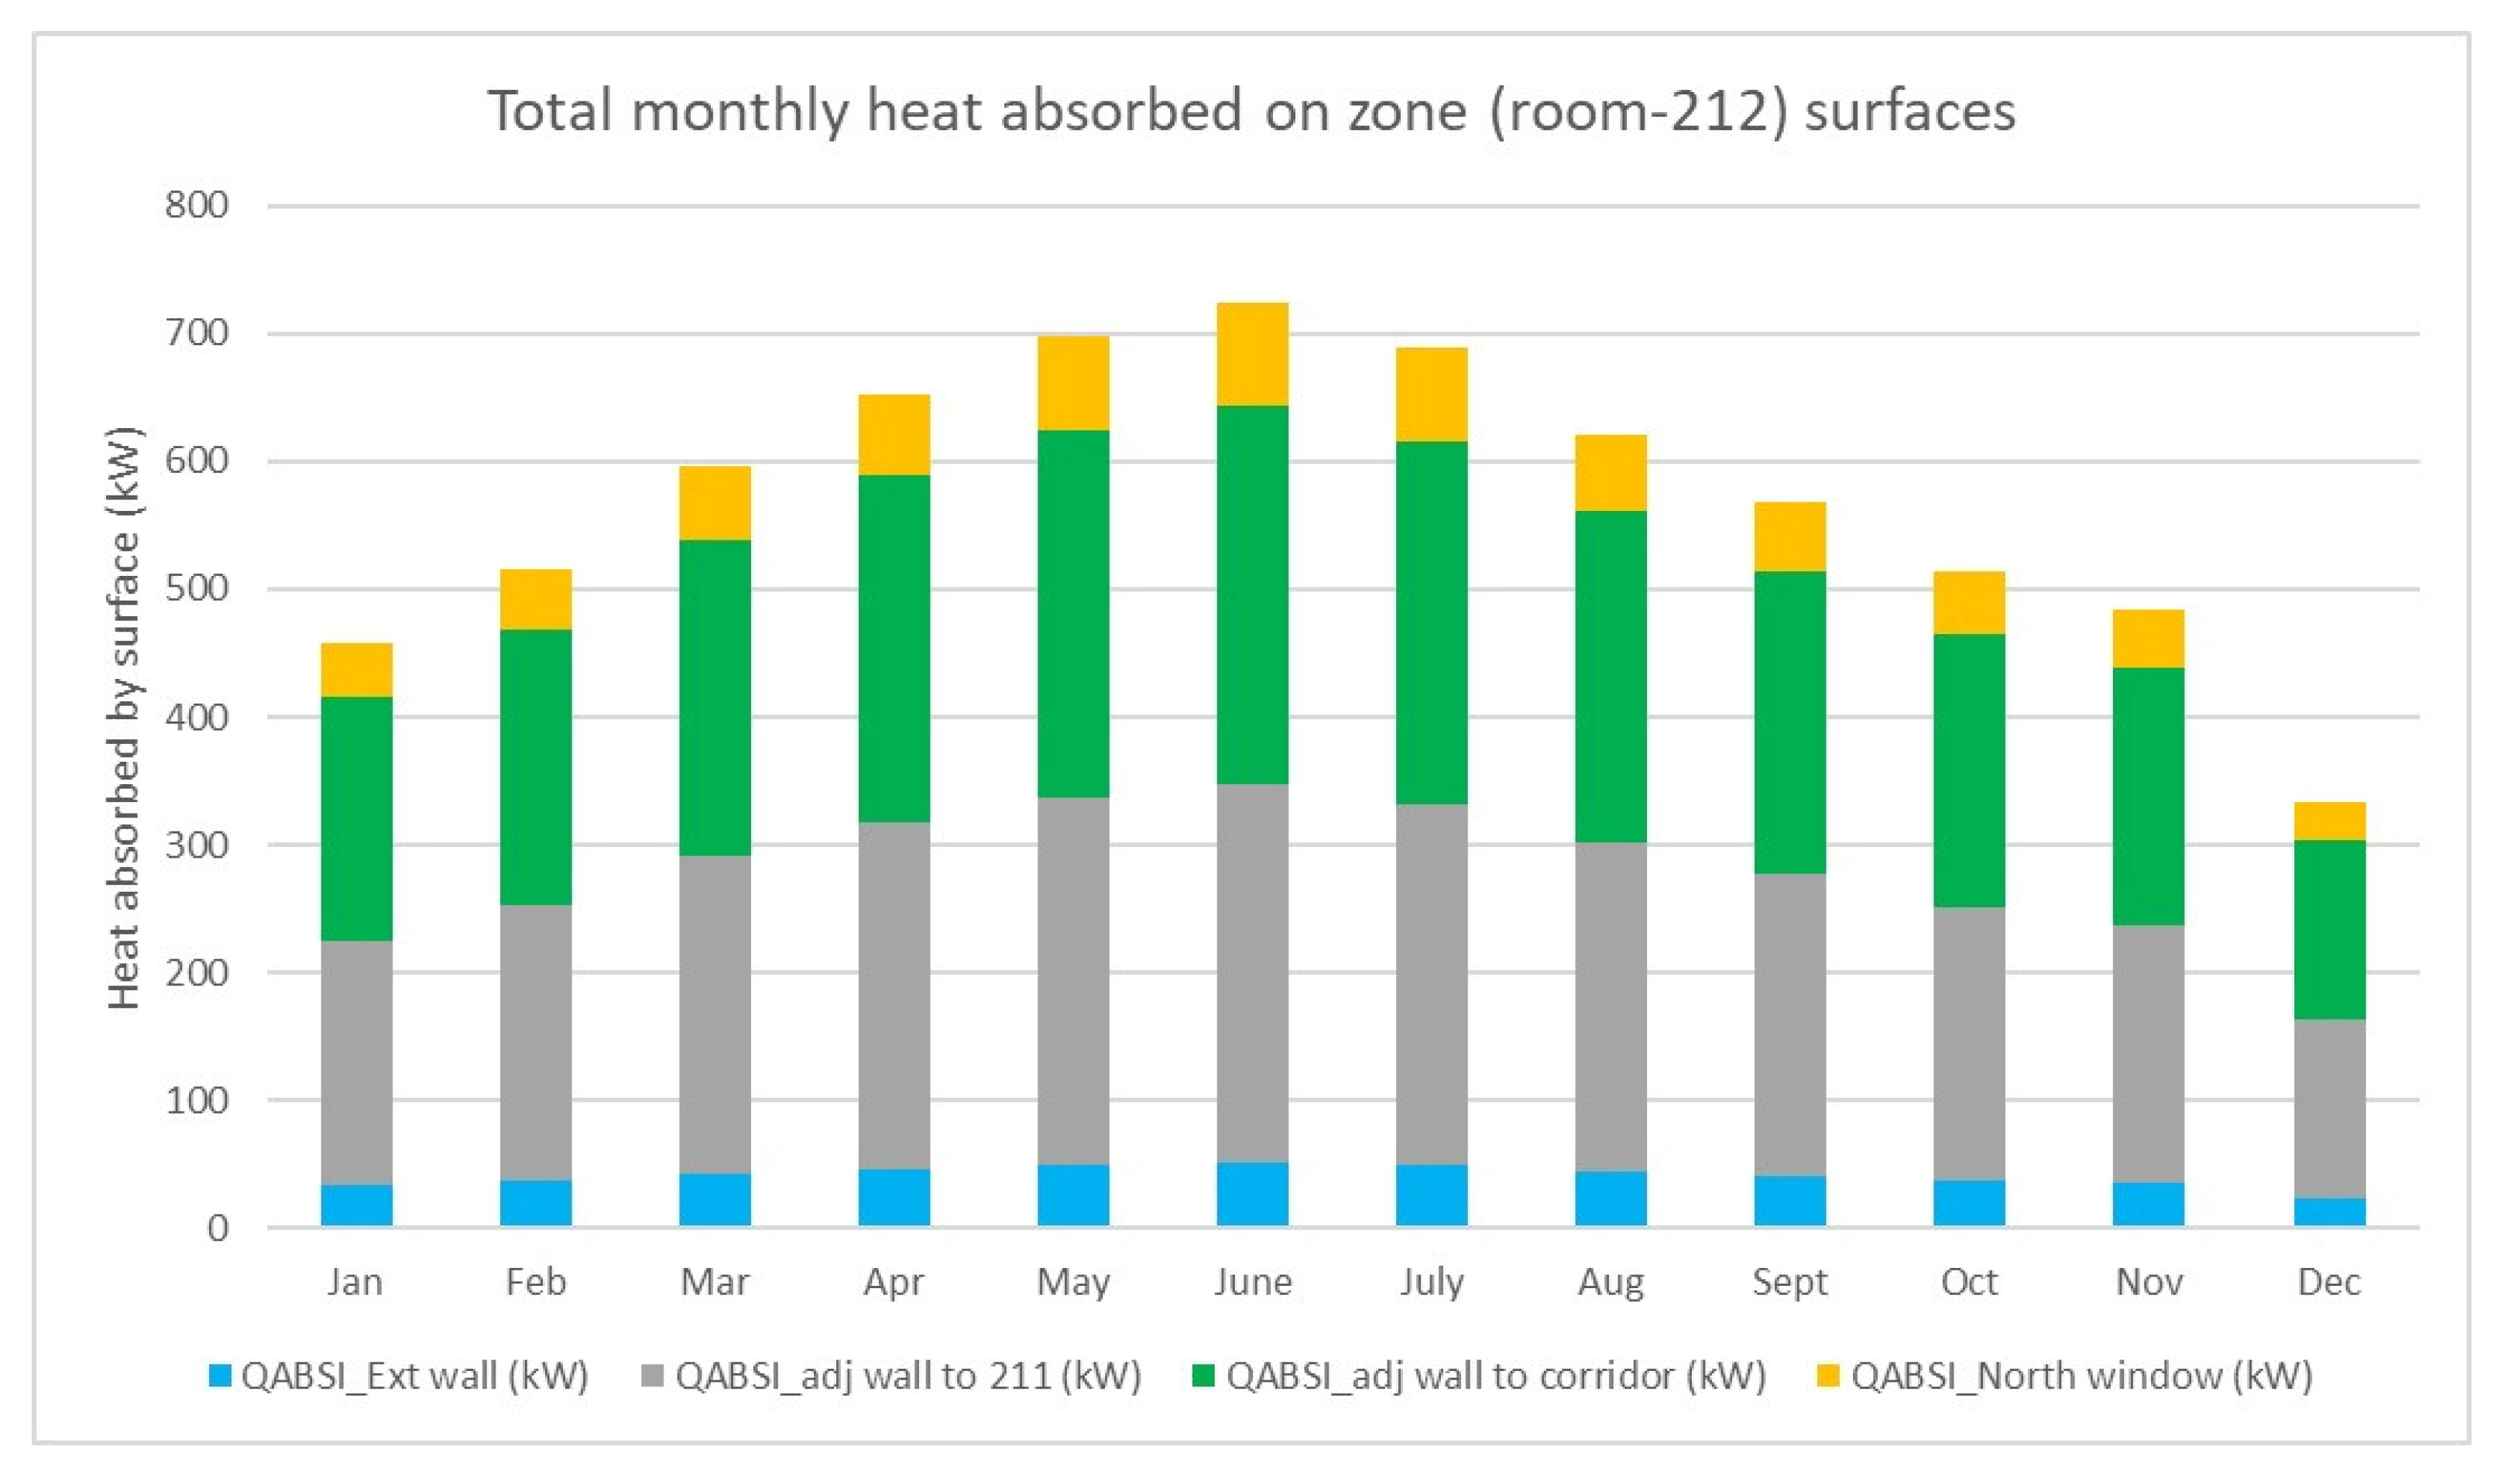
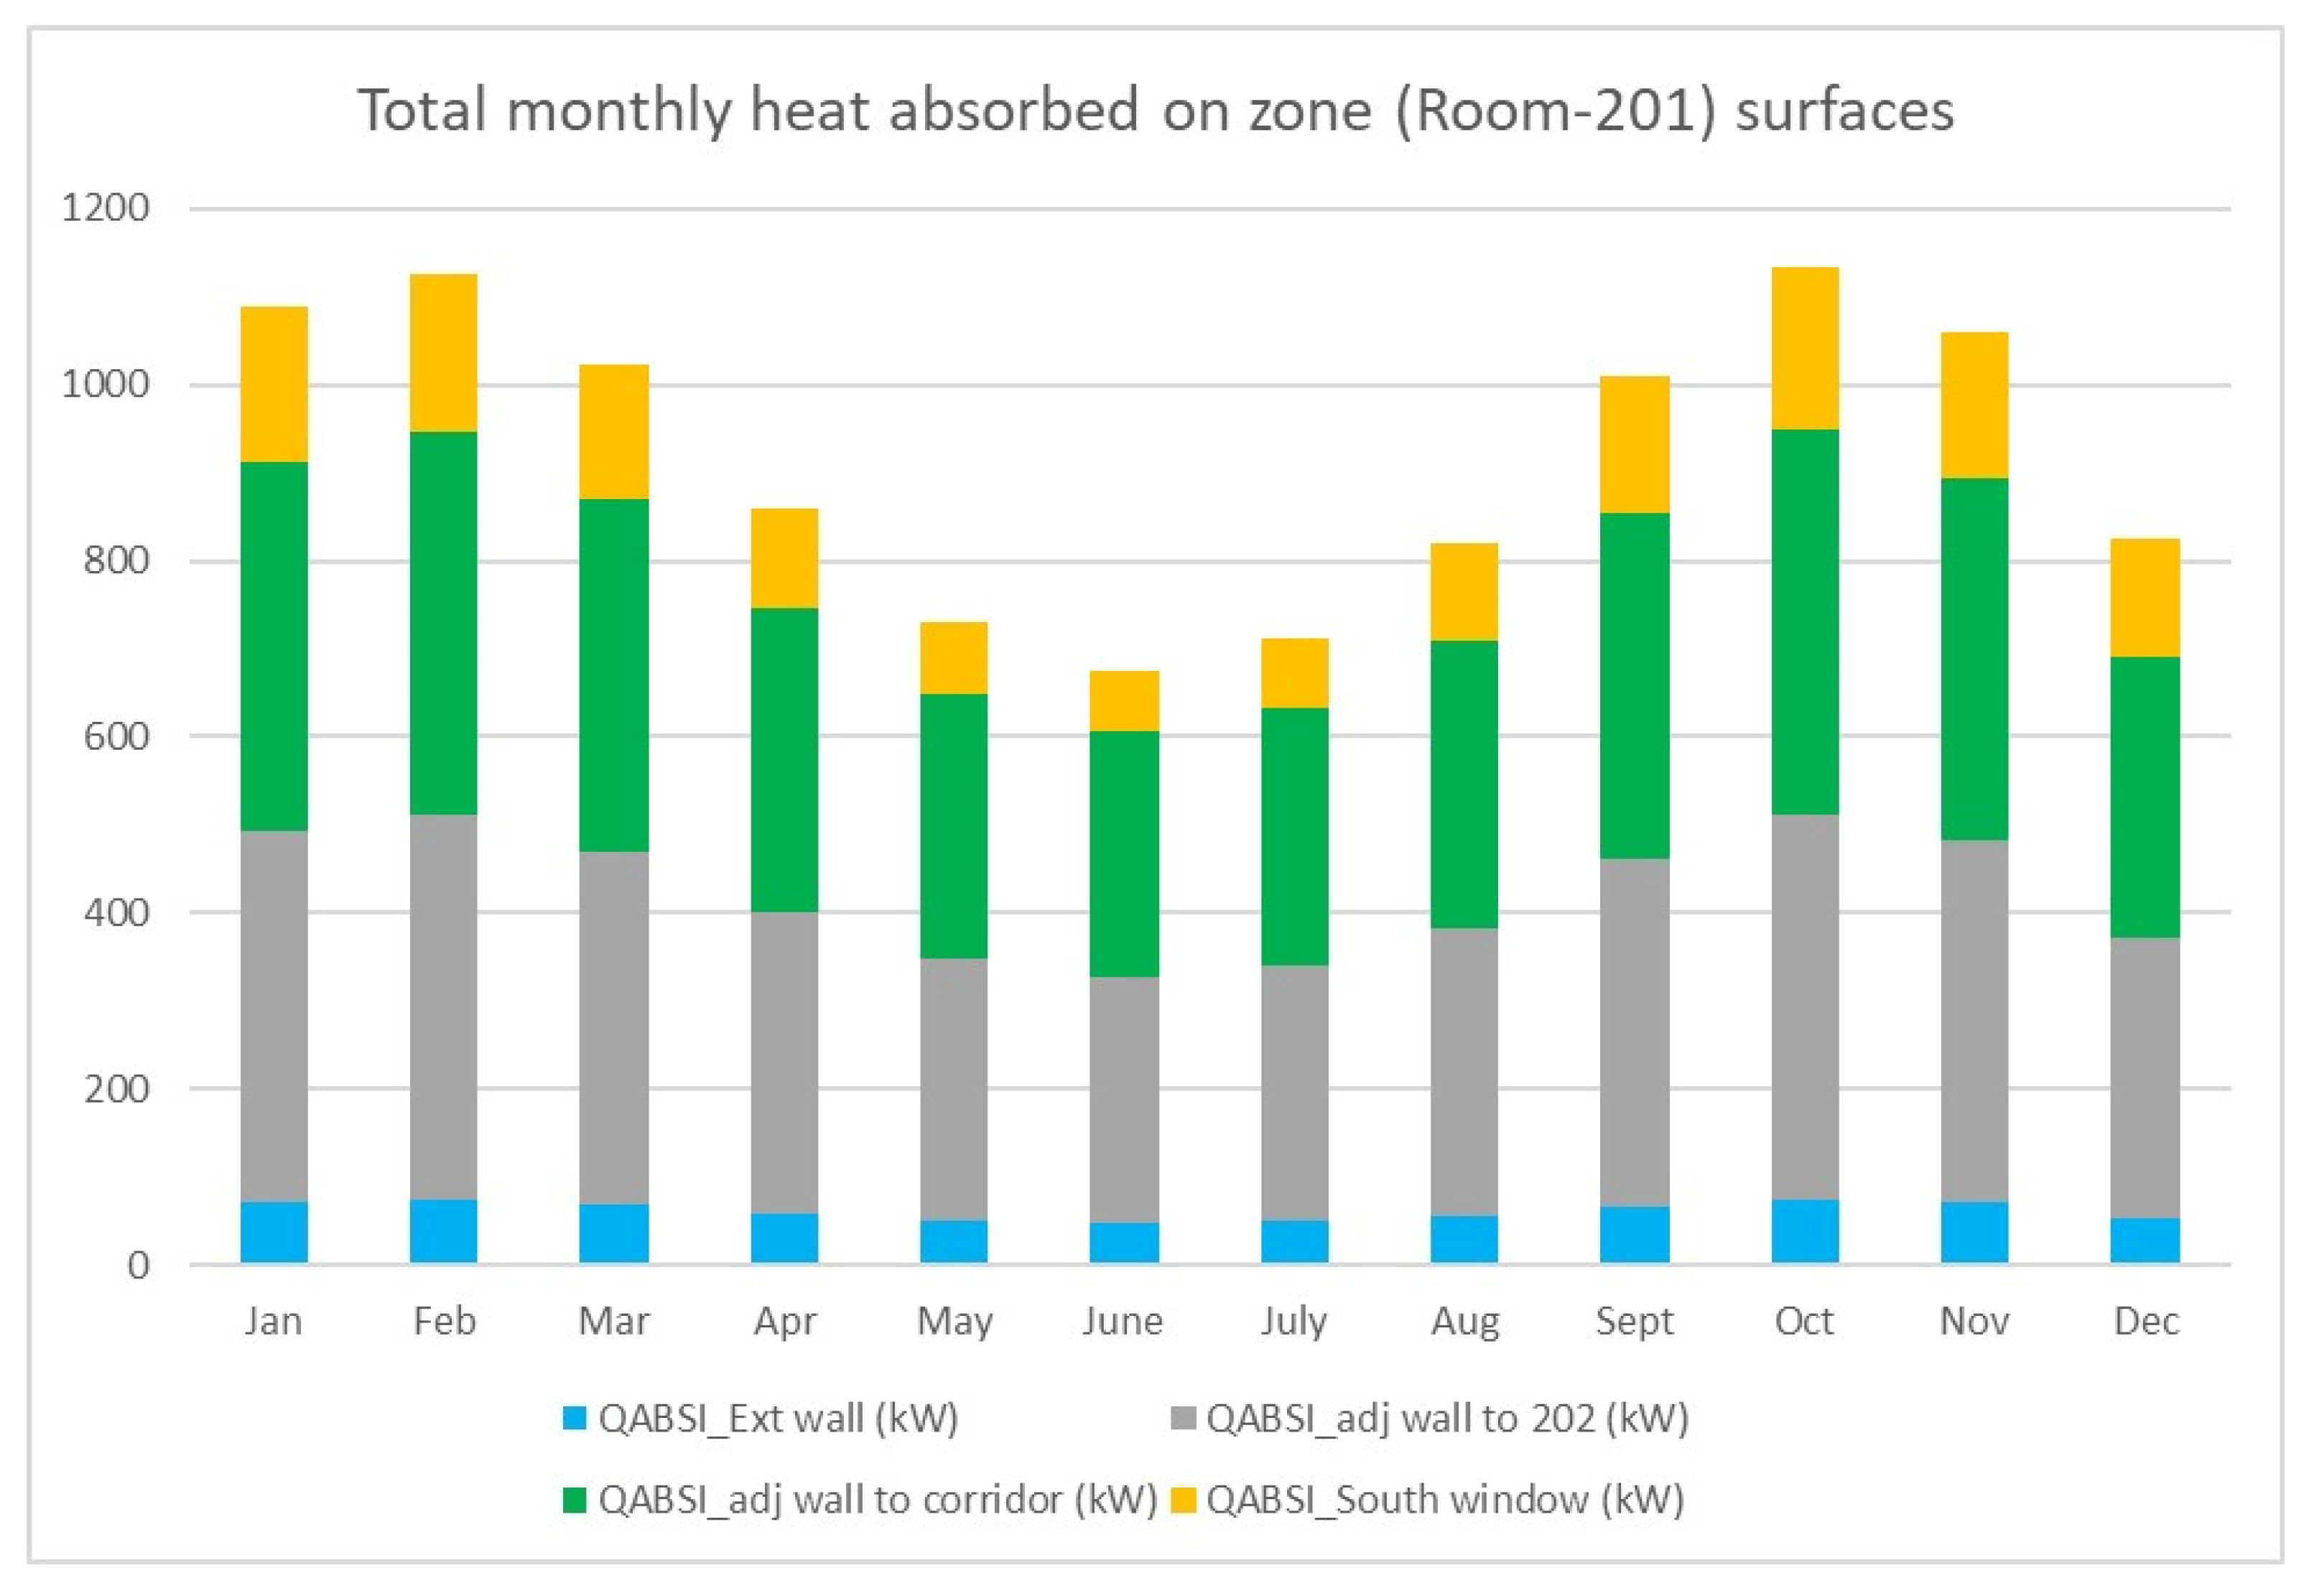
Figure 6 and Figure 7 present the total monthly heat absorbed (in kW) by each surface component (exterior wall, adjacent walls, and windows) for Room 212 (north) and Room 201 (south), respectively. This analysis highlights the absolute contribution of each surface to the overall heat gain.

3.3.1. Room 212 (North-Facing—Figure 6)

For the north-facing room, the total heat absorbed by the window surface would be present but likely significantly lower than that of the south-facing room’s window, reflecting less direct solar exposure. The exterior north wall would also contribute to total heat gain, primarily through conduction, with some diffused solar radiation. The sum of these total heat absorption values across all surfaces for Room 212 would contribute to its overall cooling load, which is observed to be lower in Figure 6.

3.3.2. Room 201 (South-Facing—Figure 7)

In stark contrast to the north room, the total monthly heat absorbed by the window surface of the south-facing Room 201 is expected to be substantially higher, particularly during the hot summer months. This represents a significant absolute energy input into the room. Similarly, the total heat absorbed by the exterior south wall would also be higher than that of the north wall, contributing significantly to the overall heat gain. The sum of these total heat absorption values across all surfaces for Room 201 would clearly lead to its higher overall cooling capacity observed in Figure 5. Comparing Figure 6 and Figure 7 clearly illustrates that the south orientation leads to a much larger absolute quantity of heat absorbed by the exposed facade, which directly translates to a higher cooling demand.

3.4. Heat Absorbed per Unit Area (kW/m2) for Each Surface

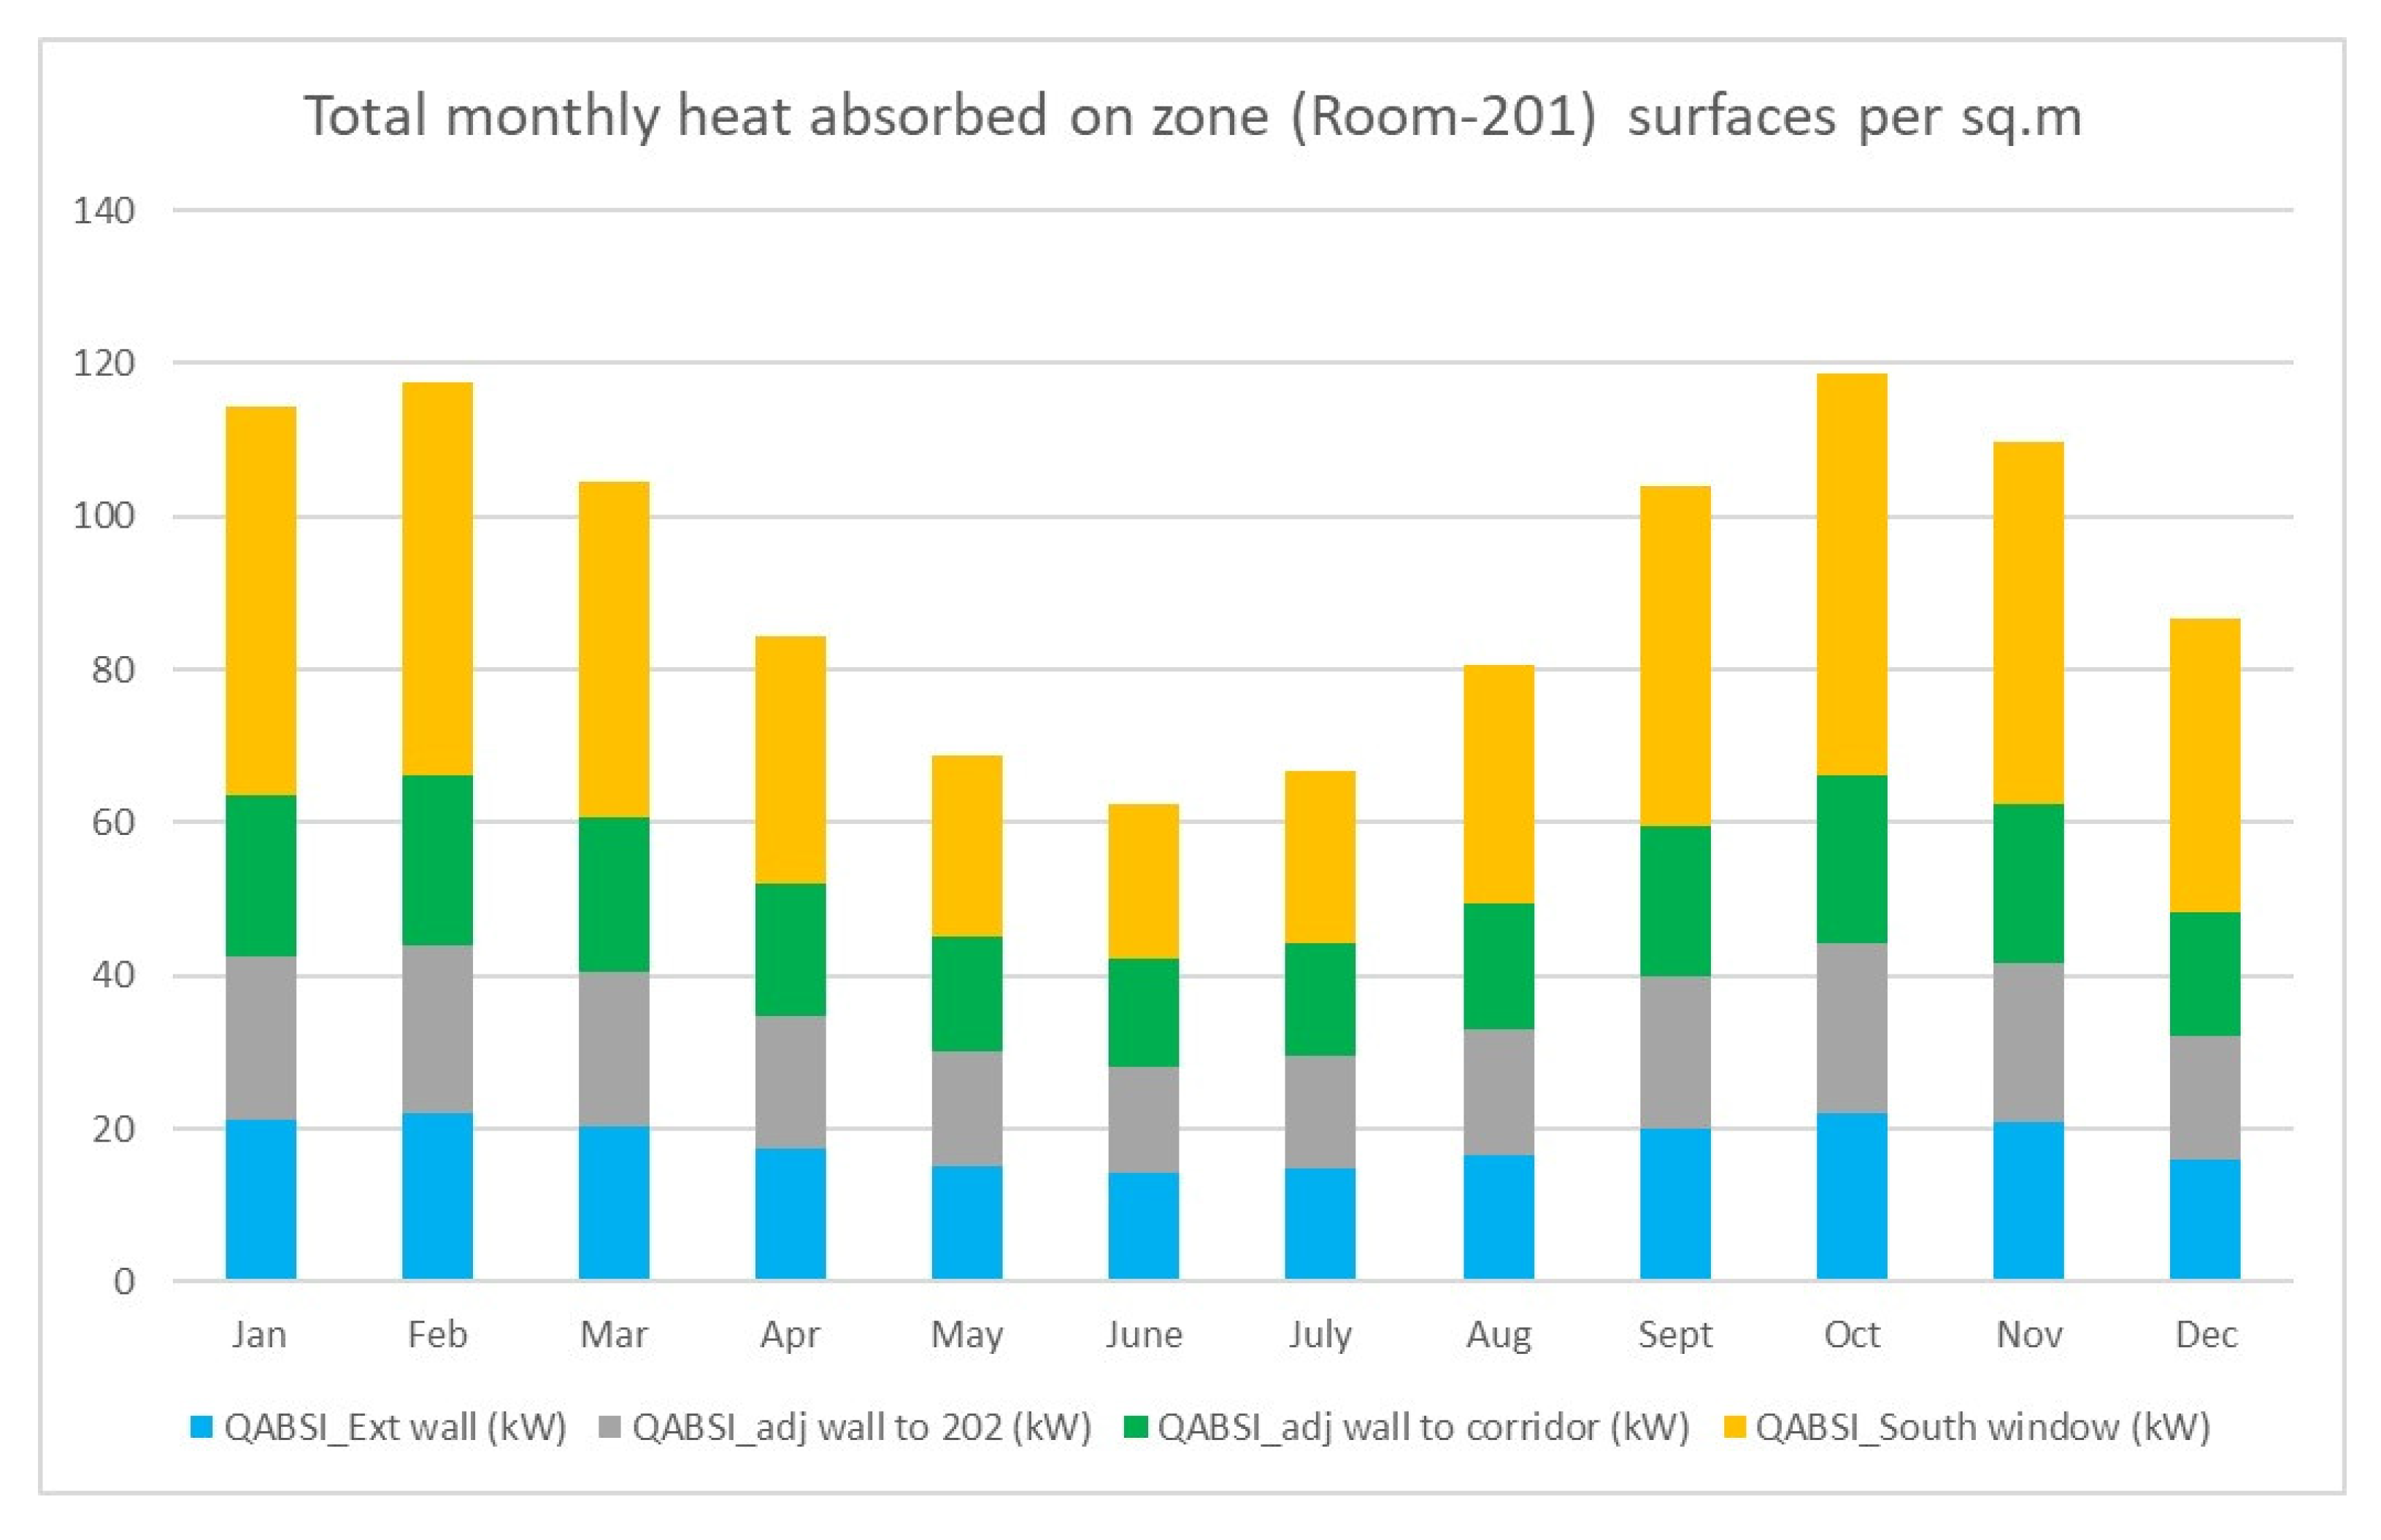
Figure 8 and Figure 9 provide a more granular insight by illustrating the monthly heat absorbed per square meter (kW/m2) for each surface in Room 212 (north) and Room 201 (south), respectively. This metric helps in understanding the intensity of heat gain through individual building components, independent of their total area, which is crucial for evaluating material and design choices.

3.4.1. Room 212 (North-Facing—Figure 8)

The heat absorbed per square meter by the north window would show relatively lower peaks compared to the south window, indicating its better performance in terms of solar control per unit area. Similarly, the north exterior wall would have a lower heat absorption intensity compared to the south wall. Comparing Figure 8 to Figure 6 (total heat for the north room), one can infer the relative contribution of each surface area to the overall total heat gain. For instance, even if the total heat absorbed by adjacent walls is high (Figure 6), its heat absorbed per square meter (Figure 8) might indicate that it is more important to focus on external walls and windows for buildings with larger facades.

3.4.2. Room 201 (South-Facing—Figure 9)

The heat absorbed per square meter by the south window is expected to exhibit very high values, especially during summer. This intense solar heat gain per unit area highlights the critical need for effective shading or high-performance glazing for south-facing transparent surfaces. The exterior south wall would also show a significantly higher intensity of heat absorption compared to the north wall, indicating higher surface temperatures or more direct solar exposure per unit area. Comparing Figure 9 to Figure 7 (total heat for the south room) allows for an understanding of how specific surface properties and incident solar radiation combine to create the overall thermal load. High kW/m2 values for south-facing surfaces are a direct cause for the elevated cooling loads observed in Room 201. Overall, the comprehensive analysis across all six figures clearly demonstrates the substantial impact of orientation on an educational building’s thermal performance in Cairo’s hot–arid climate. The south orientation consistently leads to higher air temperatures, greater cooling loads, and both a higher total and per-unit-area heat absorption through its exposed facades.

3.5. Office Rooms Carbon Footprint Analysis Based on Their Orientation

Studying the effect of office room orientation on their carbon footprint is crucial because it allows architects and engineers to design buildings that are inherently more energy efficient and sustainable. This not only reduces the building’s operational costs but, more importantly, lowers its carbon footprint by decreasing the reliance on electricity generated from fossil fuels. Ultimately, this knowledge is fundamental for creating environmentally responsible and cost-effective buildings that contribute to global efforts to combat climate change. This study will investigate the monthly carbon footprint (in kilograms of CO2e) of each wall surface of the office rooms under investigation.

Assumptions for the Calculation

AC System Efficiency (COP): A standard COP of 3.0 was used.
AC Operating Hours: 8 h per day were used, which translates to a variable number of hours per month depending on the month’s length.
Carbon emission factor: An electricity grid emission factor of 0.45 kg CO2e/kWh was adopted for Egypt, based on ADEME (2017) [31].
The formula used for the calculation, according to reference [32], is as follows:
Carbon Footprint (kg CO2e) = {Heat Absorbed (kW)/3.0 (COP)} × Monthly Hours (h) × 0.45 (kg CO2e/kWh)
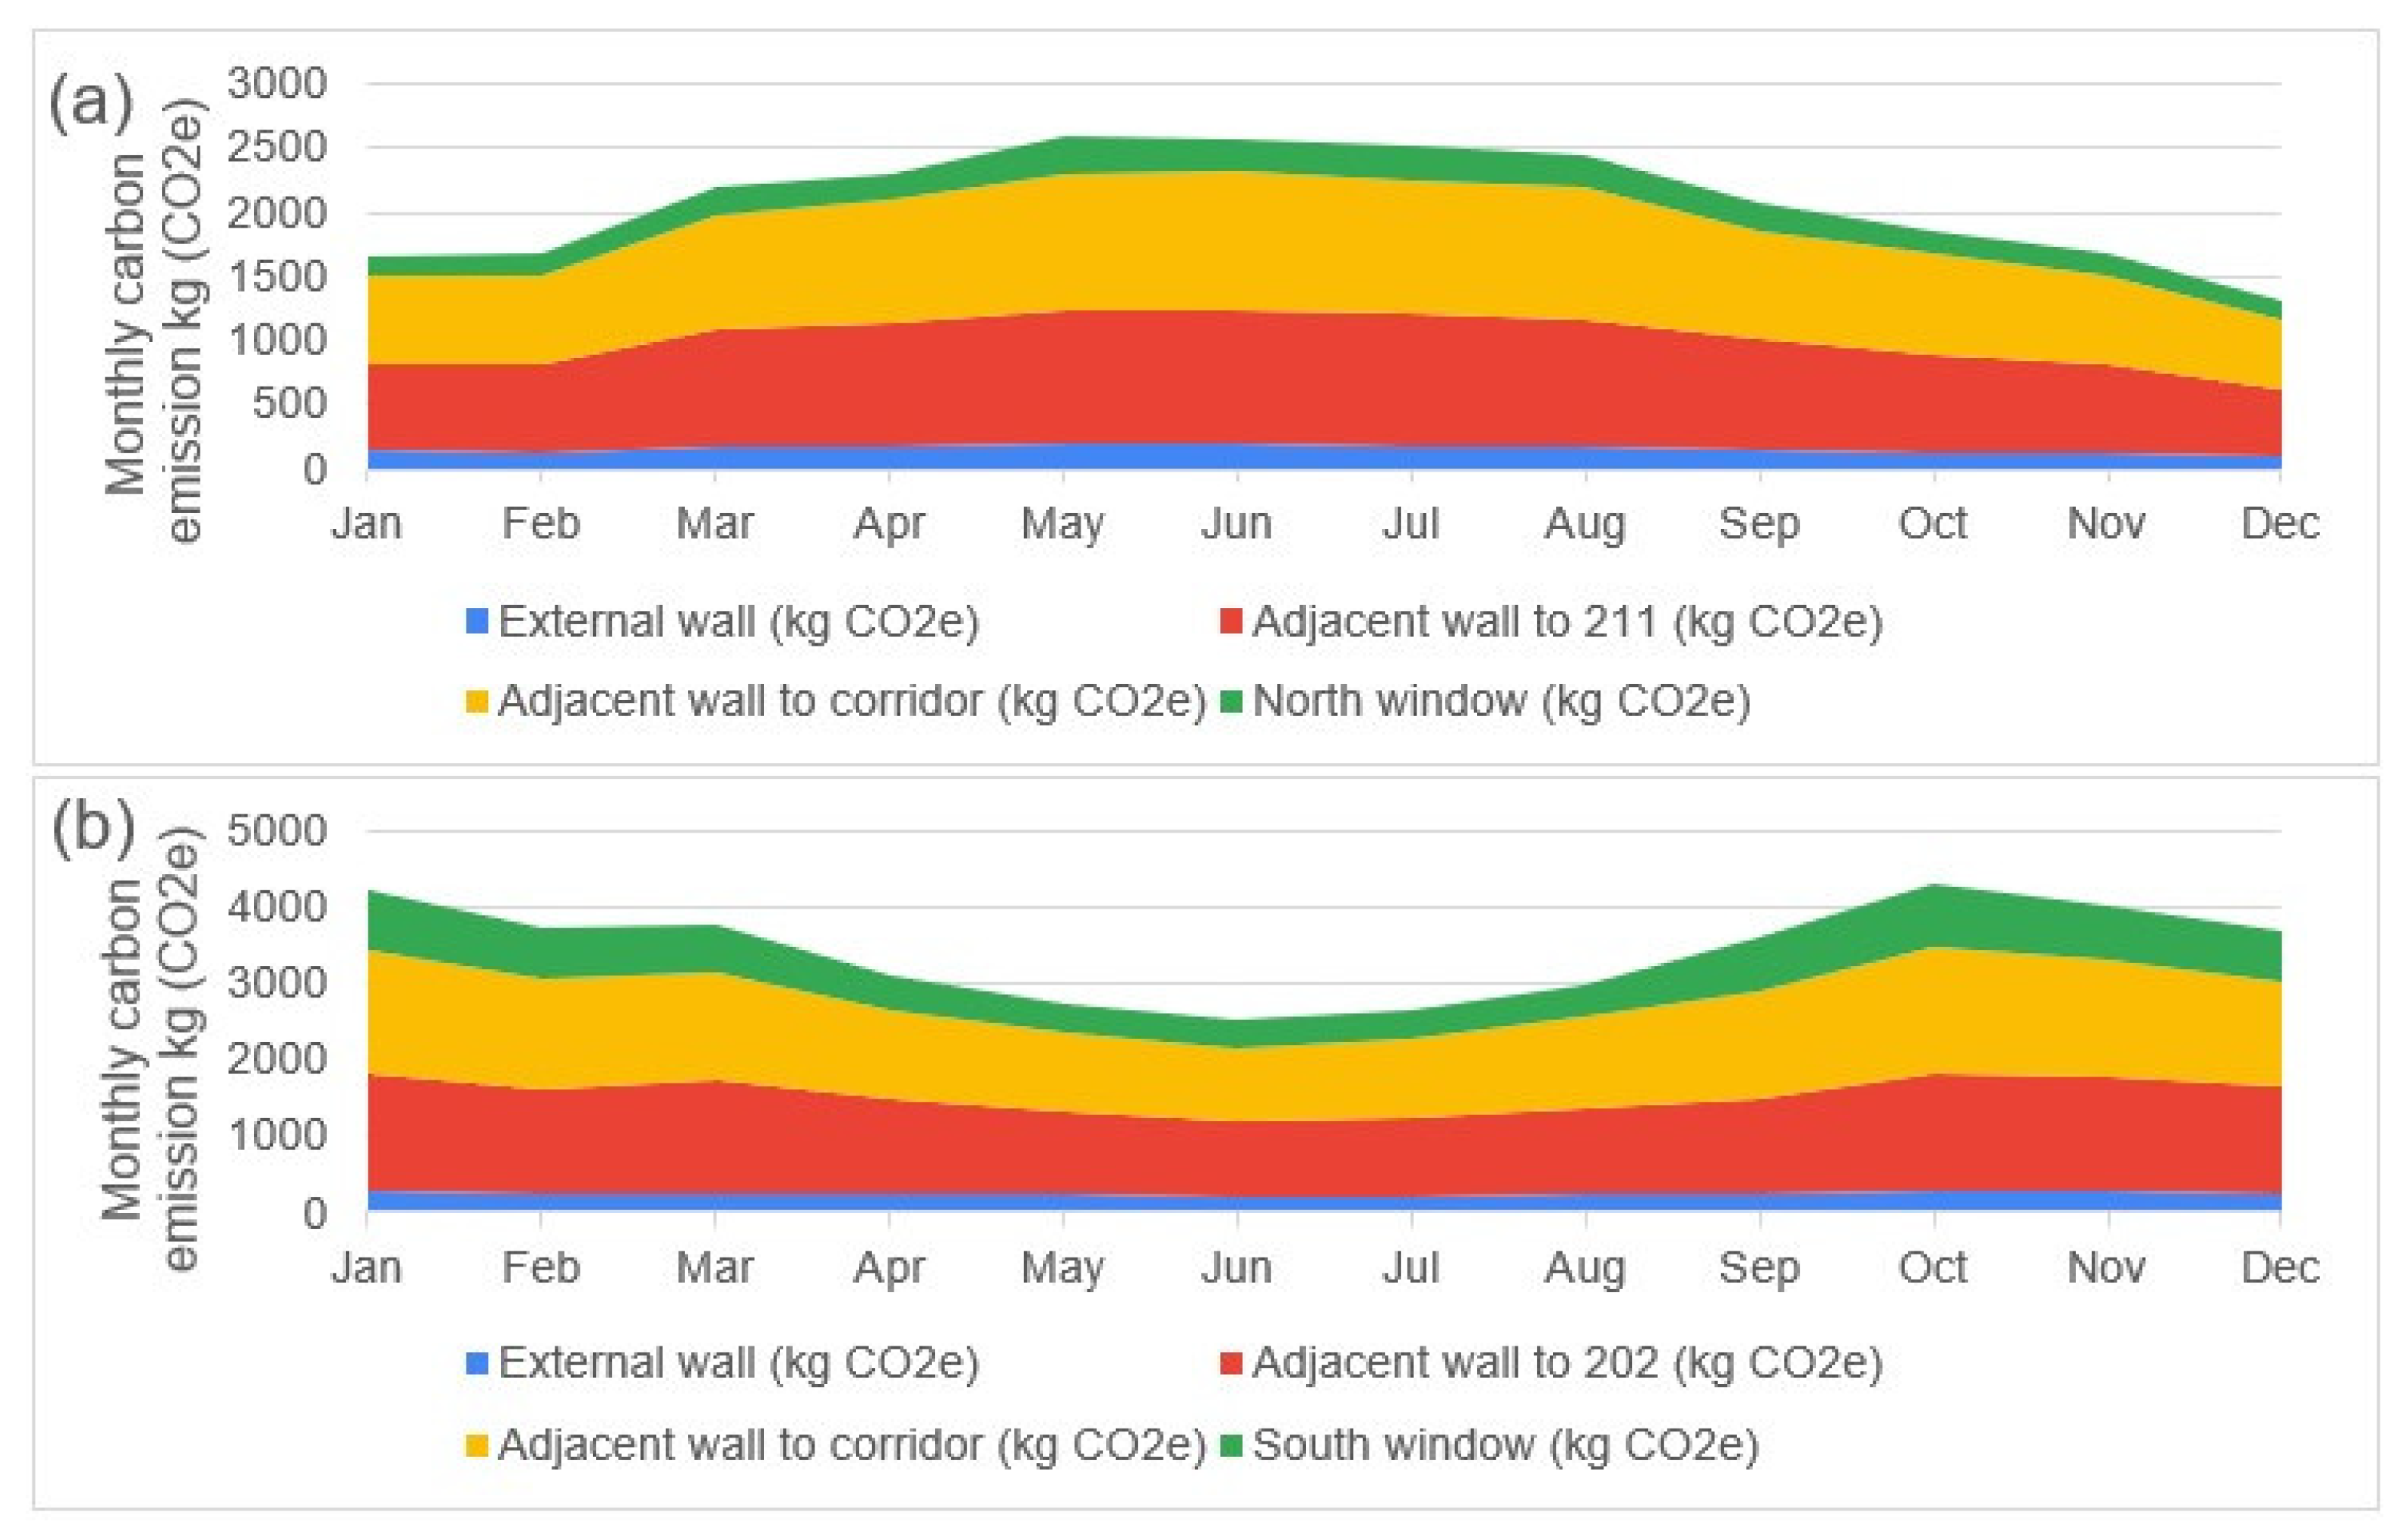
As it can be observed in Figure 10. that the adjacent walls, specifically the “adjacent wall to corridor” and “adjacent wall to 202/211,” are the largest contributors to the carbon footprint in both rooms. However, the south-facing room’s “south window” also has a profound impact, with its monthly footprint often exceeding the contribution of any single wall. While the windows in both rooms are major sources of heat gain, the south-facing window’s contribution is particularly pronounced, reaching 812 kg CO2e in January and October. This is more than double the maximum contribution from the north-facing window, emphasizing that solar exposure through windows is a key driver of cooling load and subsequent carbon emissions. The results confirm that to significantly reduce the carbon footprint, energy-saving measures should focus on the largest heat sources, which in this case are the adjacent walls and, most critically, the south-facing window.

4. Conclusions

This study comprehensively investigated the thermal behavior of two identical office rooms with opposing orientations (north and south) at the British University in Egypt, using TRNSYS 18 for year-round simulation. The research meticulously examined the impact of orientation on indoor space temperature, total cooling loads, the monthly heat absorbed by building surfaces, and the heat absorbed per unit area for each surface. The simulations confirmed that orientation is a critical determinant of thermal performance in Cairo’s hot arid climate. The key conclusions drawn from this research are:
  • Thermal Performance Disparity: The south-facing office room (Room 201) consistently experienced higher indoor air temperatures and substantially greater annual cooling loads compared to the north-facing office room (Room 212), particularly during the hot summer months.
  • Significant Total Heat Absorption: The analysis of total monthly heat absorbed (Figure 6 and Figure 7) unequivocally demonstrated that the south-facing facades (windows and walls) absorb a significantly larger absolute quantity of heat compared to their north-facing counterparts, directly contributing to higher cooling demands.
  • High Intensity of Heat Gain: The examination of heat absorbed per square meter (Figure 8 and Figure 9) further reinforced that south-facing transparent and opaque surfaces experience a much higher intensity of heat gain. This highlights the inherent challenge of managing solar heat gain on the south facade in such a climate.
  • Energy Efficiency Implications: The study clearly demonstrates that north-facing orientations offer a distinct advantage in terms of mitigating passive heat gain and reducing energy consumption for cooling in hot arid climates like Cairo.
These findings highlight the immense potential for energy efficiency improvements in educational buildings by prioritizing optimal orientation during the design phase. For future educational building designs in similar hot arid climates, it is strongly recommended to:
  • Strategically Orient Buildings: Whenever feasible, design building layouts to minimize exposure of large, glazed areas to direct south and west solar radiation.
  • Optimize South Facades: If south orientation for critical spaces is unavoidable, implement robust external shading devices (e.g., horizontal overhangs, vertical fins, and louvers) and high-performance glazing with very low solar heat gain coefficients (SHGCs) for south-facing windows to significantly mitigate intense solar heat gain.
  • Prioritize North Facades: Utilize north facades for larger window openings where ample natural daylight can be harvested with minimal direct solar heat gain during peak cooling seasons, contributing to energy savings from lighting.
  • Enhanced Envelope Performance: Ensure that all opaque building envelope components are well-insulated to reduce conductive heat transfer, especially for facades exposed to significant solar radiation.
  • The results highlight that adjacent walls and, most critically, the south-facing window are the largest contributors to cooling load and carbon emissions, making them the primary targets for energy-saving measures.
By integrating these passive design principles based on orientation, educational institutions can significantly reduce their energy consumption for cooling, enhance indoor thermal comfort for students and staff, and contribute to a more sustainable built environment in Egypt.

5. Future Investigations

Future studies should build on these results by testing additional design strategies that suit Cairo’s hot and dry climate. For example, adding photovoltaic (PV) shading systems on south-facing façades could both block excess solar heat and generate clean energy. Using thermal storage systems, such as phase change materials, could help reduce cooling demand during peak hours by storing and releasing heat at the right times. It would also be useful to study occupancy-based control strategies, where shading, ventilation, and cooling adjust automatically to how spaces are actually used. These steps would expand the current orientation-focused analysis and support more energy-efficient and comfortable educational buildings in Egypt.

Author Contributions

Conceptualization, I.E.-M. and H.S.; methodology, A.I.E. and E.E.; software, A.I.E. and M.A.; validation, H.S., A.I.E. and M.A.; formal analysis, A.I.E. and M.A.; investigation, A.I.E., R.R.M. and E.E.; resources, H.S.; data curation, M.A.; writing—original draft preparation, A.I.E., R.R.M. and M.A.; writing—review and editing, I.E.-M., R.R.M., A.I.E. and H.S.; visualization, A.I.E. and M.A.; supervision, H.S. and I.E.-M.; project administration, E.E.; funding acquisition, H.S. and I.E.-M. All authors have read and agreed to the published version of the manuscript.

Funding

This research was funded by [Grant Egypt-UK Cooperation: Research Environments Grants] grant number [Project ID: 49788] and The APC was funded by [Grant Egypt-UK Cooperation: Research Environments Grants].

Data Availability Statement

The original contributions presented in this study are included in the article. Further inquiries can be directed to the corresponding author.

Acknowledgments

The authors acknowledge that this paper is based upon work supported by Science, Technology & Innovation Funding Authority (STDF) under Egypt-UK Cooperation: Research Environments Grants (Project ID 49788) and Project Title: Sustainable Human to Building Behavioural Interaction: Awareness Development Roadmap and Training Programme; SusHumBuild.

Conflicts of Interest

The authors declare no conflict of interest.

Nomenclature

Symbol/AbbreviationDescription
BUEBritish University in Egypt
TMYTypical meteorological year
TRNSYSTransient System Simulation Tool
SHGCSolar heat gain coefficient
IAQIndoor air quality
IEQIndoor environmental quality
°CDegree Celsius
kWKilowatt
kW/m2Kilowatt per square meter
W/m2KWatt per square meter Kelvin
U-valueOverall heat transfer coefficient
QcoolCooling load
QabsTotal heat absorbed by a surface
qabsHeat absorbed per unit area
R212Room 212 (north-facing)
R201Room 201 (south-facing)
HVACHeating, ventilation, and air conditioning

References

  1. International Energy Agency (IEA). World Energy Outlook 2022. IEA. 2022. Available online: https://www.iea.org/reports/world-energy-outlook-2022 (accessed on 15 September 2025).
  2. Jaouaf, S.; Bensaad, B.; Habib, M. Passive strategies for energy-efficient educational facilities: Insights from a mediterranean primary school. Energy Rep. 2024, 11, 3653–3683. [Google Scholar] [CrossRef]
  3. UNICEF; Soliman, K. The Impact of Population Trends on the Needs of the Education System. 2024. Available online: https://www.unicef.org/ (accessed on 15 September 2025).
  4. Abdelgany, M.; Mohamed, S.; Rashed, M. Evaluating the Relationship Between Education Spending and Economic Growth in Egypt: An ARDL Model Analysis. Int. J. Econ. Financ. Manag. Sci. 2024, 12, 66–92. [Google Scholar] [CrossRef]
  5. Green School Initiative. (n.d.). United Nations Development Programme. Available online: https://www.arabstates.undp.org/content/rbas/en/home/ourwork/environmentandenergy/successstories/green-school-initiative.html (accessed on 27 September 2021).
  6. Emil, F.; Diab, A. Energy rationalization for an educational building in Egypt: Towards a zero energy building. J. Build. Eng. 2021, 44, 103247. [Google Scholar] [CrossRef]
  7. Egypt: Energy Efficiency in Public Schools. European Bank for Reconstruction and Development (EBRD). 2019. Available online: https://www.ebrd.com/news/2019/egypt-energy-efficiency-in-public-schools.html (accessed on 27 September 2021).
  8. Anber, M. Thermal Retrofitting of Primary School Buildings in Egypt Optimizing Energy Efficiency and Thermal Comfort. Int. Des. J. 2022, 12, 325–337. [Google Scholar] [CrossRef]
  9. Safwat, H.; Elsayed, M.A.; Alghrieb, M.; El-Mahallawi, I. Direct evaporative cooling for sustainability and environmental conservation. Innov. Infrastruct. Solut. 2024, 9, 256. [Google Scholar] [CrossRef]
  10. Song, Y.; Liu, J.; Zhang, W. Design Parameters Affecting Energy Consumption of University Educational Buildings in Hot Summer and Cold Winter Area of China. Buildings 2024, 14, 1697. [Google Scholar] [CrossRef]
  11. Wang, J.C. A study on the energy performance of school buildings in Taiwan. Energy Build. 2016, 133, 810–822. [Google Scholar] [CrossRef]
  12. Alaa, H.; Khaled, N.; Rushdy, R.; Hatem, T.M. Zero Energy Educational Building: A Case Study of the Energy and Environmental Engineering Building in the British University in Egypt. In Proceedings of the Conference Record of the IEEE Photovoltaic Specialists Conference, Fort Lauderdale, FL, USA, 20–25 June 2021; pp. 1913–1915. [Google Scholar] [CrossRef]
  13. Safwat, H.; Abdel-Rehim, A.A.; El-Mahallawi, I.; Hussein, A.A.; Amer, A.M.; Elshazly, E.; Elshamy, A.I. Guidelines for data collection on energy performance of higher-education buildings in Egypt: A case study. HBRC J. 2024, 20, 615–642. [Google Scholar] [CrossRef]
  14. Song, B.; Park, K. Validation of ASTER Surface Temperature Data with In Situ Measurements to Evaluate Heat Islands in Complex Urban Areas. Adv. Meteorol. 2014, 2014, 1–12. [Google Scholar] [CrossRef]
  15. Shams, M.M.E.F.; Amr, H.A.E.-A.; Moussa, R.R. Comparative Analysis on the Effects of Natural & Artificial Indoors Lighting on the Learning and Interactive Process. Wseas Trans. Power Syst. 2021, 16, 121–127. [Google Scholar] [CrossRef]
  16. Nam, I.; Yang, J.; Lee, D.; Park, E.; Sohn, J.R. A study on the thermal comfort and clothing insulation characteristics of preschool children in Korea. Build. Environ. 2015, 92, 724–733. [Google Scholar] [CrossRef]
  17. Tanner, C.K. Effects of school design on student outcomes. J. Educ. Adm. 2009, 47, 381–399. [Google Scholar] [CrossRef]
  18. Saleem, A.A.; Abel-Rahman, A.K.; Ali, A.H.H.A.; Ookawara, S. An Analysis of Thermal Comfort and Energy Consumption within Public Primary Schools in Egypt. IAFOR J. Sustain. Energy Environ. 2016, 3. [Google Scholar] [CrossRef]
  19. Elshamy, A.I.; Elshazly, E.; Oladinrin, O.T.; Rana, M.Q.; El-Lateef, R.S.A.; El-Badry, S.T.; Elthakaby, M.; Elbaz, A.M.R.; Dewidar, K.; El-Mahallawi, I. Challenges and Opportunities for Integrating RE Systems in Egyptian Building Stocks. Energy 2022, 15, 8988. [Google Scholar] [CrossRef]
  20. Pathirana, S.; Rodrigo, A.; Halwatura, R. Effect of building shape, orientation, window to wall ratios and zones on energy efficiency and thermal comfort of naturally ventilated houses in tropical climate. Int. J. Energy Environ. Eng. 2019, 10, 107–120. [Google Scholar] [CrossRef]
  21. MSolban, M.; Moussa, R.R. Investigating the potential of using human movements in energy harvesting by installing piezoelectric tiles in Egyptian public facilities. J. Eng. Res. 2021, 9. [Google Scholar] [CrossRef]
  22. Österreicher, D.; Seerig, A. Buildings in Hot Climate Zones—Quantification of Energy and CO2 Reduction Potential for Different Architecture and Building Services Measures. Sustainability 2024, 16, 9812. [Google Scholar] [CrossRef]
  23. Rashad, M.; Żabnieńska-Góra, A.; Norman, L.; Jouhara, H. Analysis of energy demand in a residential building using TRNSYS. Energy 2022, 254, 124357. [Google Scholar] [CrossRef]
  24. Bensafi, M.; Ameur, H.; Kaid, N.; Hoseinzadeh, S.; Memon, S.; Garcia, D.A. Thermophysics Analysis of Office Buildings with a Temperature–Humidity Coupling Strategy Under Hot-Arid Climatic Conditions. Int. J. Thermophys. 2021, 42, 118. [Google Scholar] [CrossRef]
  25. Seghier, T.E.; Sepúlveda, A.; Lim, Y.-W.; Mesloub, A. Optimising thermal-daylight performance in tropical open-plan offices: A coupled OTTV and daylight prediction approach. J. Build. Eng. 2024, 98, 111369. [Google Scholar] [CrossRef]
  26. Liu, Z.; Li, J.; Xi, T. A Review of Thermal Comfort Evaluation and Improvement in Urban Outdoor Spaces. Buildings 2023, 13, 3050. [Google Scholar] [CrossRef]
  27. Wang, Z.; Weidong, C.; Zhifeng, H.; Islam, M.R.; Jon, C.K. Feature Engineering Approach to Building Load Prediction: A Case Study for Commercial Building Chiller Plant Optimization in Tropical Weather. arXiv 2025, arXiv:2502.15780. [Google Scholar] [CrossRef]
  28. Perera, U.S.; Weerasuriya, A.U.; Zhang, X.; Ruparathna, R.; Tharaka, M.G.I.; Lewangamage, C.S. Selecting suitable passive design strategies for residential high-rise buildings in tropical climates to minimize building energy demand. Build. Environ. 2025, 267, 112177. [Google Scholar] [CrossRef]
  29. Bakry, K.; El-Mahallawi, I.; Safwat, H. Solar Absorption Cooling System for Egypt Conditions. Therm. Eng. 2025, 72, 657–667. [Google Scholar] [CrossRef]
  30. Khoshbakht, M.; Gou, Z.; Dupre, K. Energy use characteristics and benchmarking for higher education buildings. Energy Build. 2018, 164, 61–76. [Google Scholar] [CrossRef]
  31. ADEME. Base Carbone®: Electricity Supplied from Grid—Egypt (0.45 kg CO2;e/kWh). French Environment and Energy Management Agency (ADEME). Data Accessed via Climatiq. 2017. Available online: https://www.climatiq.io/data (accessed on 15 September 2025).
  32. Álvarez-Fernández, R.; Delgado-Jiménez, A.; Beltrán-Cilleruelo, F. Carbon Footprint Estimation Tool. In A Carbon Footprint Calculation Tool for Urban Development; Springer Briefs in Applied Sciences and Technology; Springer: Cham, Switzerland, 2024. [Google Scholar] [CrossRef]
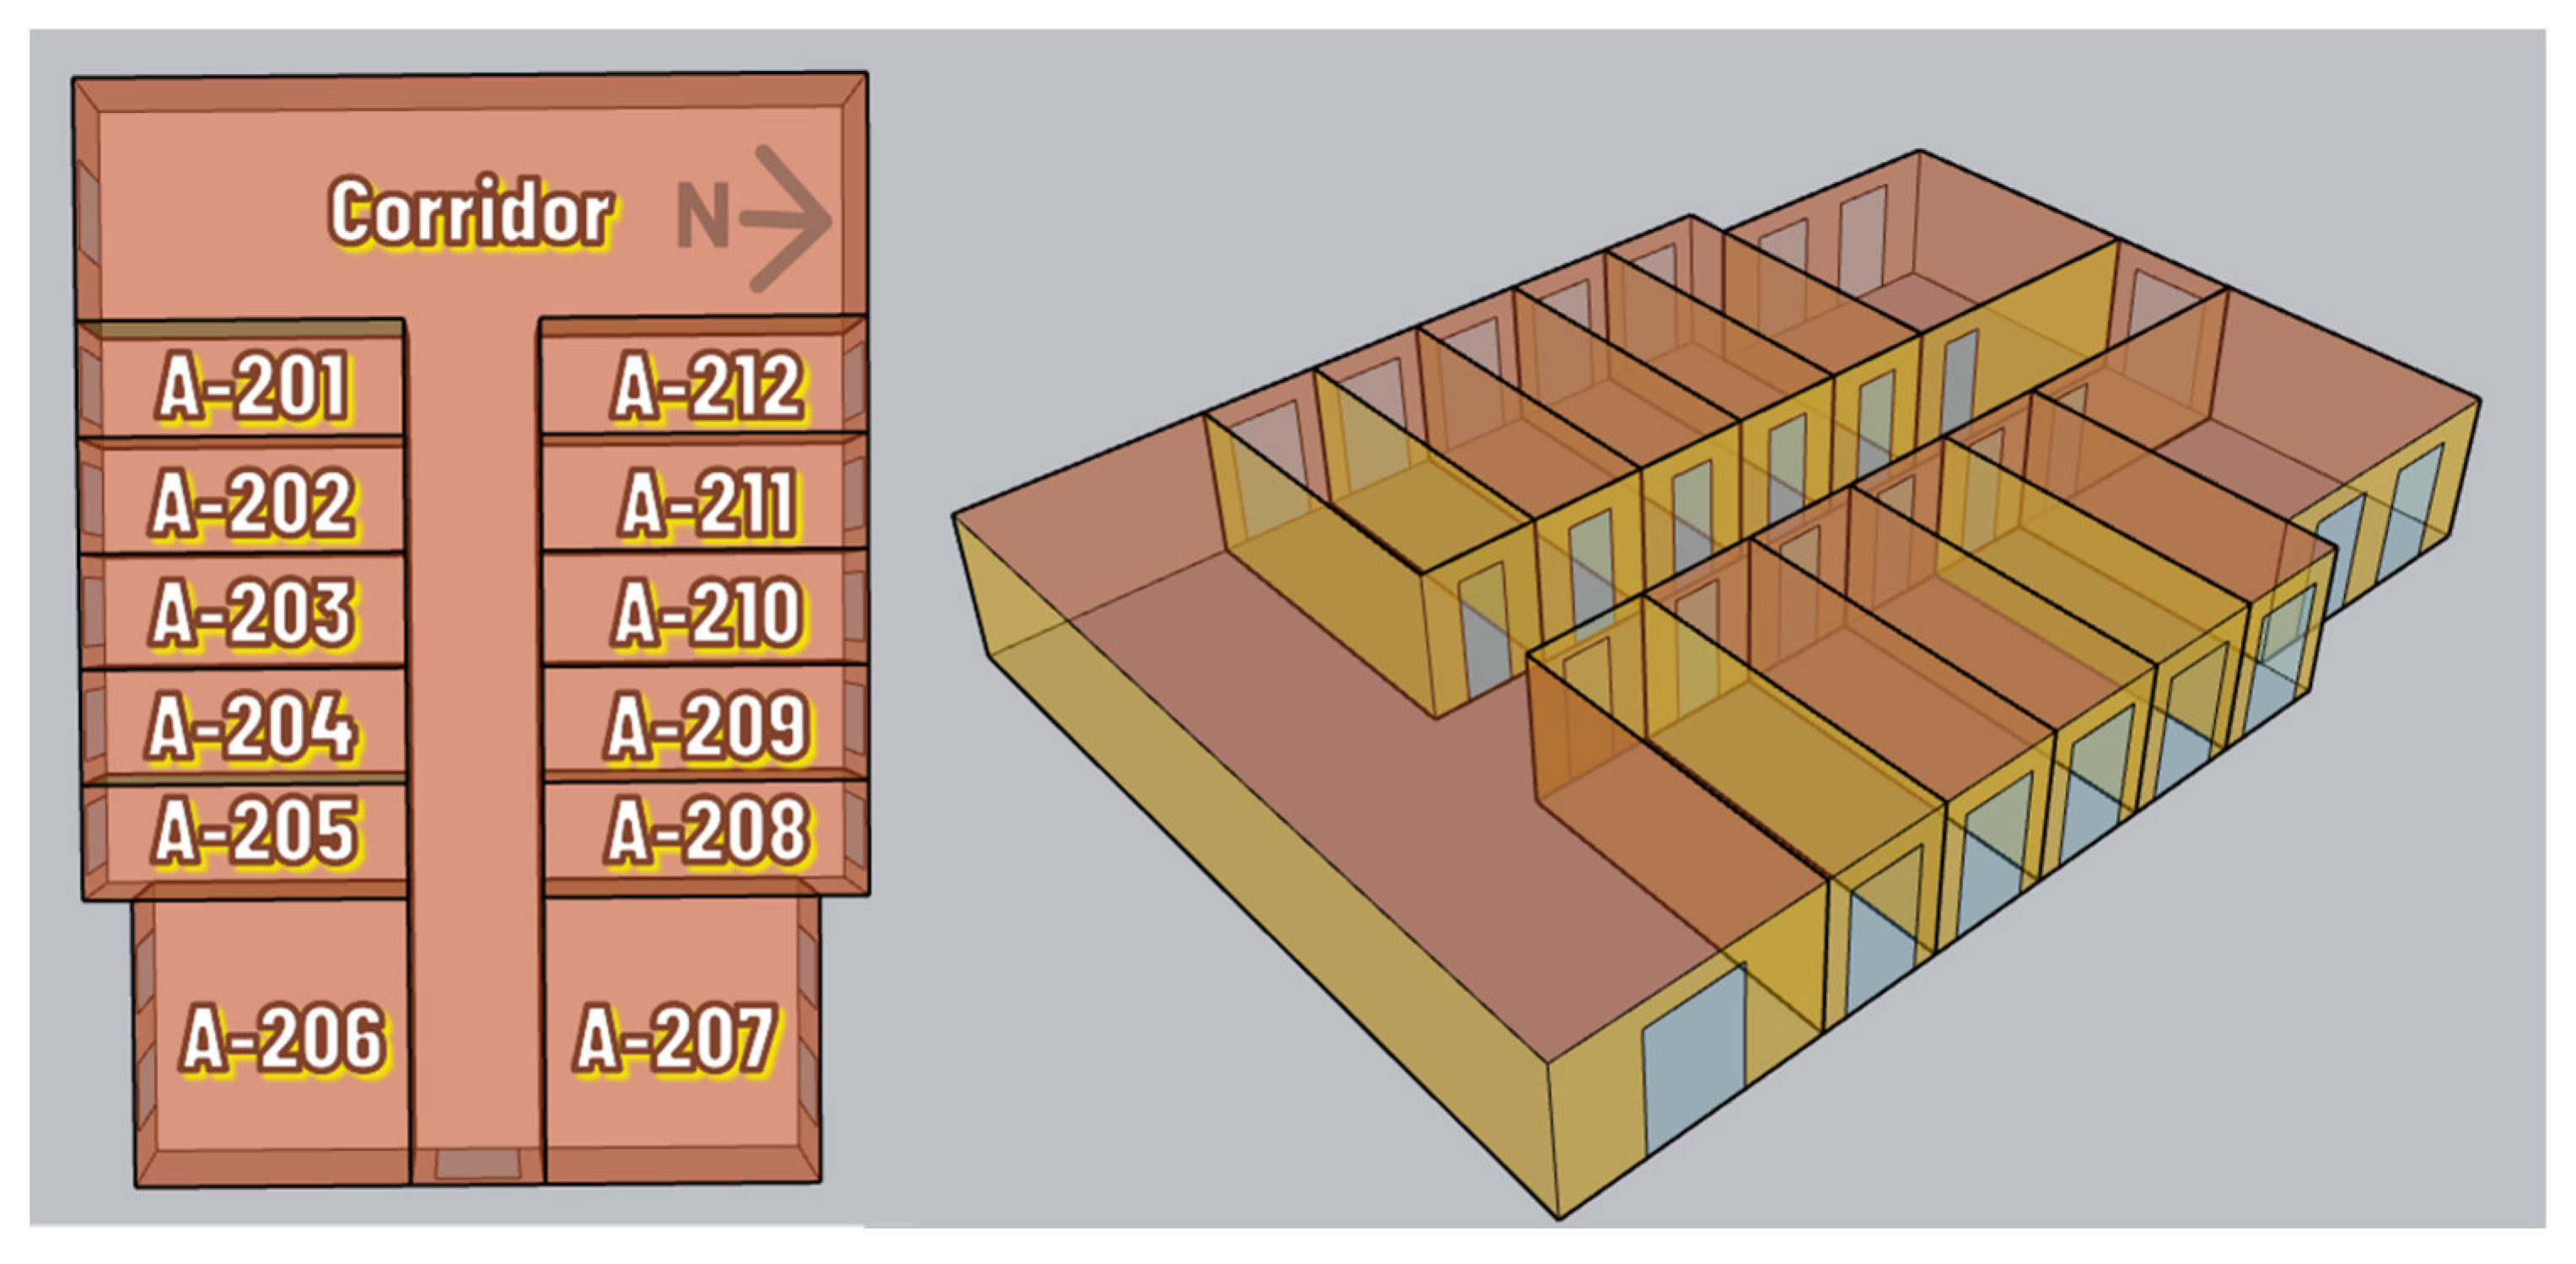
Figure 1. 3D model of the floor under study, including the two office rooms.
Buildings 15 03437 g001
Figure 2. Measured ambient temperature versus simulated ambient temperature for room A212.
Buildings 15 03437 g002
Figure 3. Measured ambient temperature versus simulated ambient temperature for room A201.
Buildings 15 03437 g003
Figure 4. Ambient temperature of office rooms (201 & 212) zone temperatures, instantaneous hourly recordings, with each value calculated as the daily average of measurements taken every 8 min.
Buildings 15 03437 g004
Figure 5. Cooling loads by office rooms 201 & 212, calculated on an hourly basis in kW throughout the year.
Buildings 15 03437 g005
Figure 6. The total monthly heat absorbed (in kW) by each surface component (Room 212).
Buildings 15 03437 g006
Figure 7. The total monthly heat absorbed (in kW) by each surface component (Room 201).
Buildings 15 03437 g007
Figure 8. The monthly heat absorbed per square meter (kW/m2) for each surface in Room 212.
Buildings 15 03437 g008
Figure 9. The monthly heat absorbed per square meter (kW/m2) for each surface in Room 201.
Buildings 15 03437 g009
Figure 10. Estimated carbon footprint in kilograms of CO2e per month for each surface in: (a) the south-facing room, (b) the north-facing room.
Buildings 15 03437 g010
Table 1. Summarizing the previous research articles and key findings.
Ref. No.Authors and YearFocus of StudyMethodologyKey Findings
[1]IEA, 2022Global building energy consumption trendsStatistical analysis of global energy dataBuilding sector accounts for ~1/3 of global energy demand, driven by urbanization and technology adoption.
[2]Jaouaf et al., 2024Passive strategies for energy-efficient educational facilities in the Mediterranean climateCase study analysis of a primary school; energy performance evaluationPassive design measures can significantly reduce energy demand in educational buildings without compromising comfort.
[4]Abdelgany et al., 2024Relationship between education spending and economic growth in EgyptARDL model analysis using economic and education sector dataPositive correlation between investment in education and national economic growth.
[3]UNICEF & Soliman, 2024Impact of population trends on educational needs in EgyptDemographic and educational capacity analysisRapid population growth increases pressure on the educational infrastructure.
[9]Safwat et al., 2024Direct evaporative cooling for sustainabilityCase study and performance evaluationEvaporative cooling can reduce cooling loads and environmental impact in arid climates.
[10]Song et al., 2024Design parameters affecting university building energy use in ChinaSimulation-based sensitivity analysisOrientation, envelope properties, and window-to-wall ratio strongly influence cooling demand.
[11]Wang, 2016Energy performance of school buildings in TaiwanComparative energy analysis across school typesUniversities consume more than double the per capita energy of secondary schools and six times that of elementary schools.
[13]Safwat et al., 2024Data collection guidelines for higher-education buildings in EgyptCase study with proposed frameworkStandardized data collection improves energy performance evaluation in higher education facilities.
[14]Song & Park, 2014Validation of ASTER surface temperature data for urban heat islandsRemote sensing validation with field measurementsASTER data effectively identifies and monitors heat island patterns in complex urban areas.
[15]Shams et al., 2021Impact of natural vs. artificial lighting on learningComparative study in educational settingsNatural lighting improves learning engagement and reduces artificial lighting energy use.
[16]Nam et al., 2015Thermal comfort of preschool children in KoreaField study of thermal preference and clothing insulationYounger students prefer cooler indoor temperatures; comfort range differs by age group.
[17]Tanner, 2009Effect of school design on student outcomesReview of educational architecture and performance dataWell-designed facilities positively impact student achievement.
[18]Abdel-Rady et al., 2014Thermal comfort and energy consumption in Egyptian primary schoolsField measurements and analysisWindow thermal properties significantly impact total energy consumption; classrooms require daylighting balance.
[19]Elshamy et al., 2022Integration of renewable energy in Egyptian buildingsLiterature review and case studiesSignificant potential for renewable integration in the Egyptian building stock, but challenges remain in policy and implementation.
[29]Bakry et al., 2025Solar absorption cooling system for EgyptTechnical feasibility and performance evaluationSolar absorption cooling can be effective in Egyptian climate conditions for reducing the grid cooling loads of university libraries.
Disclaimer/Publisher’s Note: The statements, opinions and data contained in all publications are solely those of the individual author(s) and contributor(s) and not of MDPI and/or the editor(s). MDPI and/or the editor(s) disclaim responsibility for any injury to people or property resulting from any ideas, methods, instructions or products referred to in the content.