Article

Towards Sustainable Mortar: Optimising Sika-Fibre Dosage in Ground Granulated Blast Furnace Slag (GGBS) and Silica Fume Blends for 3D Concrete Printing

1
Centre for Critical Infrastructure, School of Civil Engineering, University College Dublin, D04 V1W8 Dublin, Ireland
2
Construct Innovate, School of Civil Engineering, University College Dublin, D04 V1W8 Dublin, Ireland
*
Authors to whom correspondence should be addressed.
Buildings 2025, 15(19), 3436; https://doi.org/10.3390/buildings15193436
Submission received: 30 July 2025 / Revised: 10 September 2025 / Accepted: 16 September 2025 / Published: 23 September 2025

Abstract

Three-dimensional concrete printing (3DCP) is rapidly emerging as a transformative construction technology, enabling formwork-free fabrication, geometric flexibility, and reduced labour. However, the lack of conventional reinforcement and the strict requirements for fresh and hardened properties present significant challenges. Fibre reinforcement and supplementary cementitious materials (SCMs), such as ground granulated blast furnace slag (GGBS), offer pathways to enhance printability while mitigating environmental impact. This study investigates the combined effect of natural cellulose microfibres and silica fume on the rheological, mechanical, and sustainability performance of 3D-printable mortars. Six mixes were prepared with 50% GGBS, 45% cement, and 5% silica fume, incorporating fibre dosages from 0% to 1%. Results showed that a 0.5% fibre dosage provided the most favourable balance. At this dosage, static yield stress increased to 9.35 Pa and thixotropy reached 8623 mPa·s, enhancing structuration for shape retention. Plastic viscosity remained stable at 4–5 Pa·s, ensuring adequate extrusion performance. Higher fibre dosages (≥0.75%) caused a significant increase in rheological resistance, with static yield stress reaching 208 Pa and thixotropy 135,342 mPa·s. This resulted in excessive structuration, fibre clustering, and poor extrudability. Compressive strength was achieved at 109.10 MPa (92% of silica fume-only mix) with 0.5% fibre. In comparison, flexural strength was 13.20 MPa at 0.5% fibre content and reduced gradually to 12.29 MPa at 1% fibre due to weak fibre–matrix bonding and porosity. Sustainability analysis confirmed that using 50% GGBS and 5% silica fume reduced embodied carbon compared to a 100% cement mix. This study also demonstrated that cellulose microfibres at 0.25–0.5% are optimal for balancing fresh properties, mechanical strength, and sustainability in 3D-printed mortars.

1. Introduction

Three-dimensional concrete printing is an emerging focus in the construction industry, driven by the demand for automation, sustainability, and design flexibility. It eliminates the need for traditional formwork by replacing it with direct layer-by-layer deposition of concrete [1,2]. This allows for faster and less labour-intensive construction, as well as geometrically advanced shapes. This form of construction does not allow for typical reinforcement methods, which is an area of concern for the performance of the cementitious mix. This limitation of 3D-printed construction can be overcome by using fibres, which enhance the fresh and hardened state of the mix [3].
Research into the incorporation of different types of fibres in cementitious mixtures has demonstrated wide-ranging effects on both fresh and hardened properties. Beyond polypropylene, other fibres such as steel, basalt, glass, and natural fibres have been studied. These can improve tensile strength, flexural behaviour, and crack resistance, while also influencing rheological parameters, including yield stress and viscosity [4,5,6,7]. Such effects are particularly relevant for extrusion-based printing, where fibres contribute to shape stability and interlayer bonding during construction [8,9]. Fibre dispersion is equally important to these properties to ensure a high flow level and minimal fibre clumping [10]. The fibre dosage must be in the optimal range, as an excessive volume can result in adverse effects.
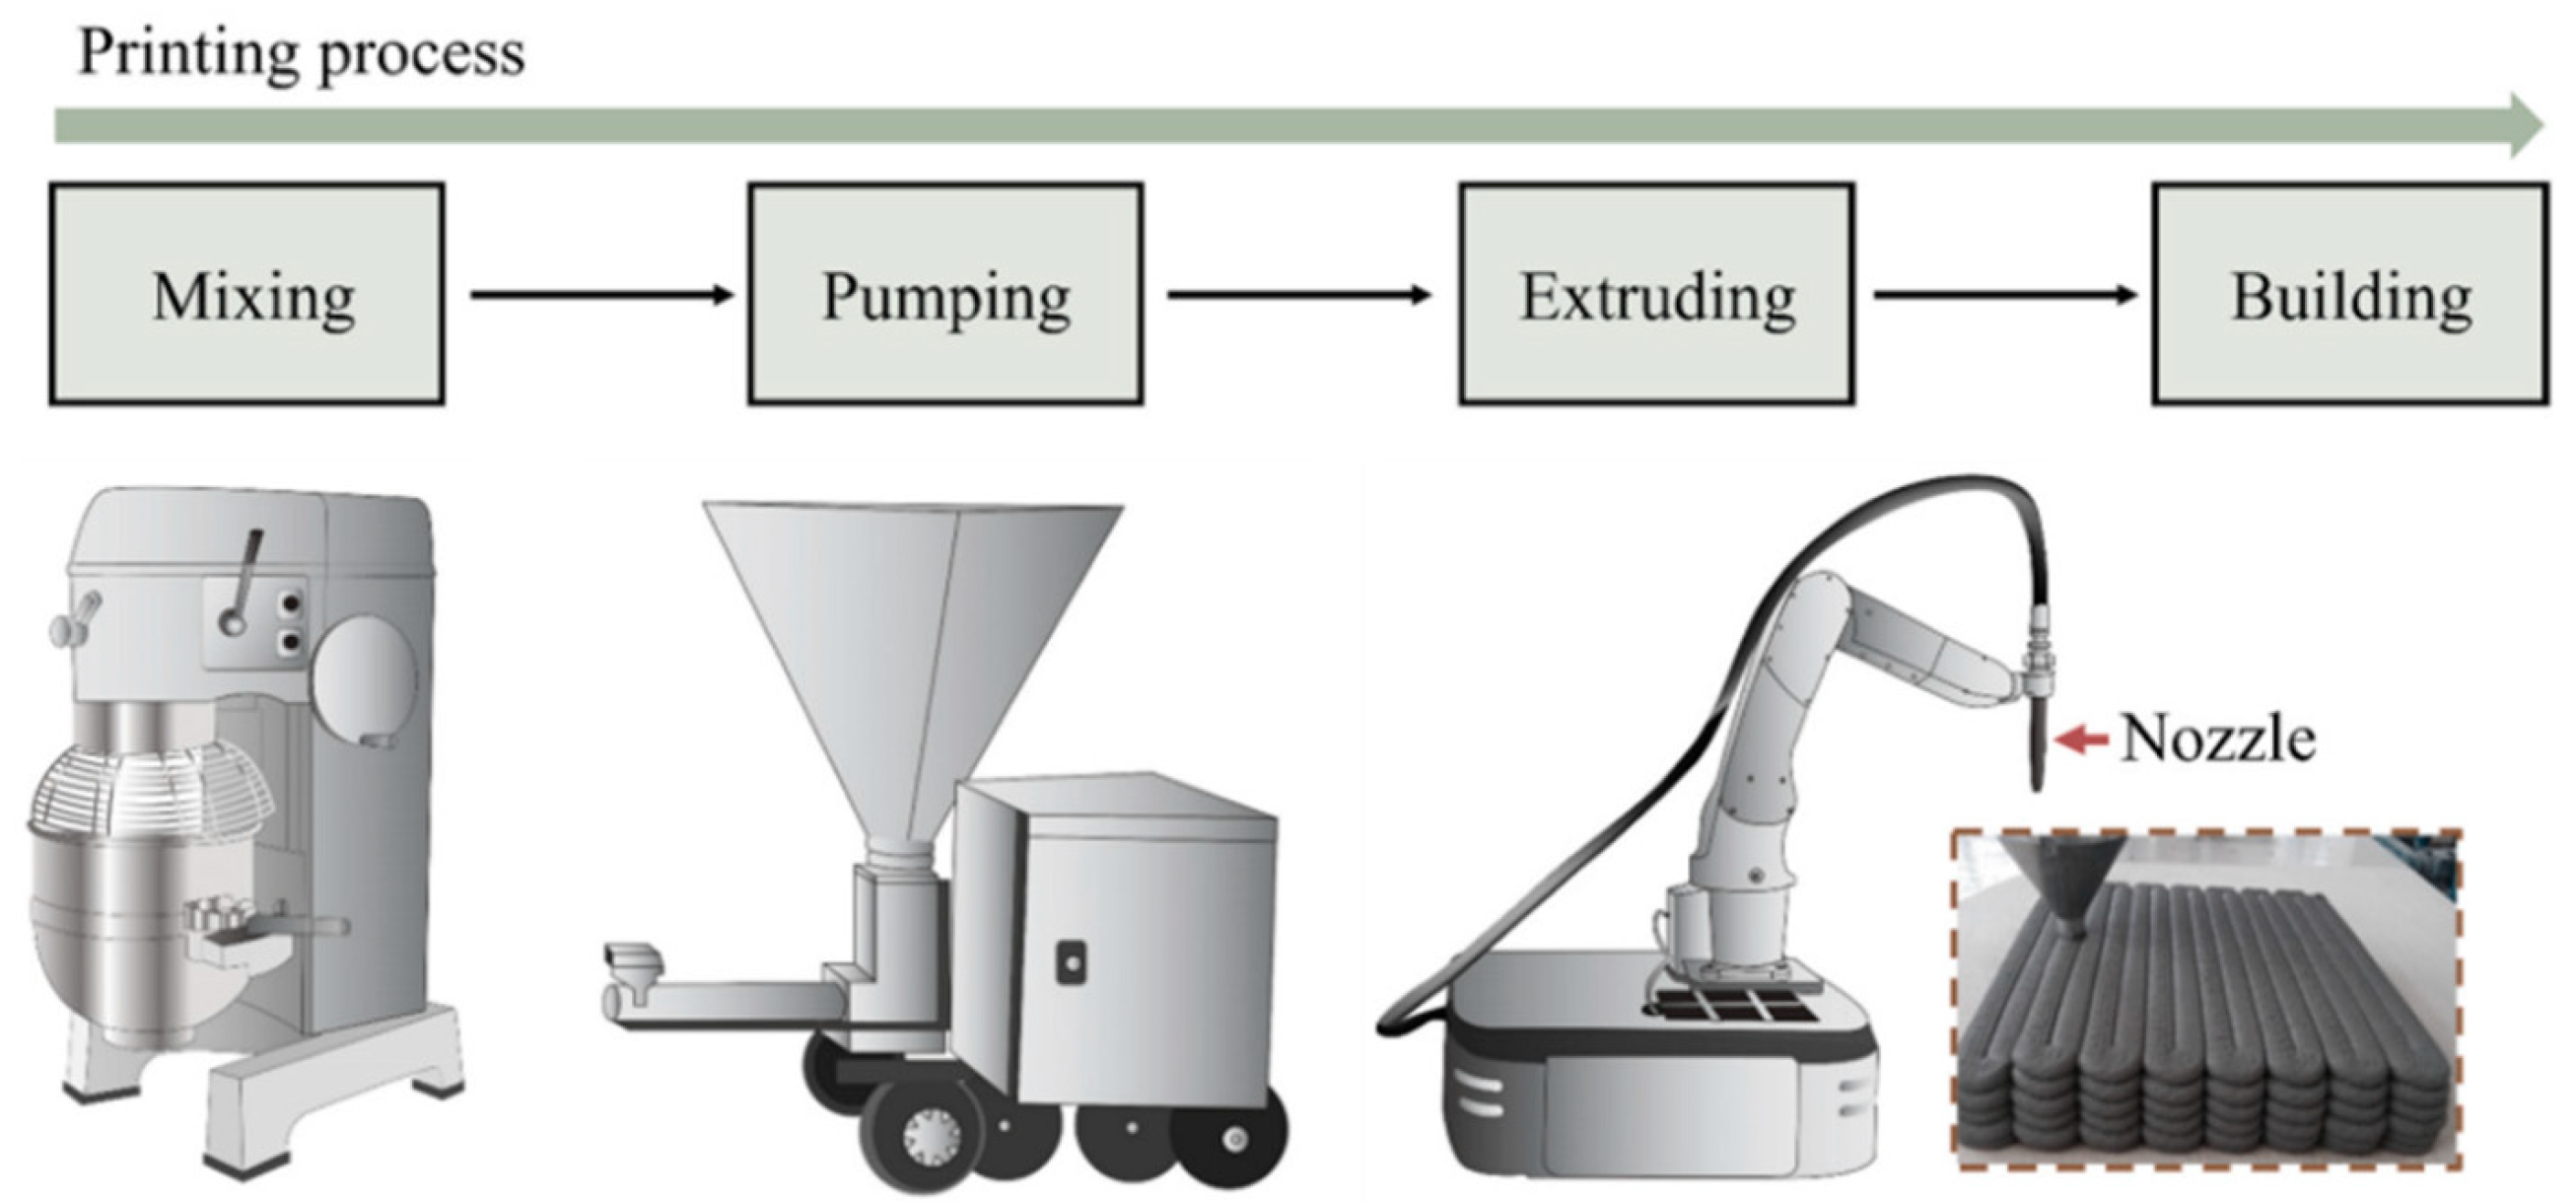
As illustrated in Figure 1, the 3D concrete printing process involves three main stages: material mixing, pumping, and robotic-layered extrusion guided by a predesigned digital path [11]. Buildability is defined as the ability of the freshly extruded filament to support subsequent layers without excessive deformation or collapse, ensuring dimensional stability throughout the printing process [12,13]. The capabilities of 3D printers in construction determine the range of printable materials and achievable geometries. Current systems are capable of processing cement-based mortars, geopolymer pastes, polymer-modified mixtures, and high-volume supplementary cementitious materials (SCMs) blends. Machine specifications differ depending on the material: cementitious composites often require high pumping pressures and robust nozzles to maintain continuous flow, whereas polymer-based mixtures may demand lower extrusion forces but more precise temperature and curing control [14,15,16,17]. Key factors such as nozzle diameter, pumping capacity, extrusion pressure, and build volume must be aligned with the rheological characteristics of the chosen mixture to ensure stable extrusion, adequate layer adhesion, and overall buildability [18,19,20].
Compared with cast concrete, 3D-printed concrete generally exhibits inferior mechanical properties, which limits its structural application. The main challenge lies in achieving both extrudability and buildability, requiring a balance that can be optimized through admixtures and adjustments to the water/binder ratio [9]. Also, unreinforced 3D-printed concrete is susceptible to shrinkage cracking, which can be managed using polypropylene fibres [8,21]. Polypropylene fibres increase the capacity of the concrete and decrease the formation of shrinkage cracks; when cracks do form, they bridge the gap to transfer the loads [21]. Therefore, reinforcement is essential to ensure load-bearing capacity and provide ductility, durability, and other structural requirements [22]. Several reviews confirm the efficacy of synthetic polypropylene fibres in improving shrinkage resistance, interlayer bonding, and mechanical strength in mortars [8,22,23].
To address sustainability concerns, SCMs have been increasingly adopted in 3D-printed mortars. These include fly ash (FA) [24], silica fume (SF) [25], ground granulated blast furnace slag (GGBS) [26], limestone [27], nanoclay [28] and calcined kaolinitic clay [29]. SCMs not only reduce cement content but also improve rheology, hydration, and mechanical performance. Fly ash and GGBS enhance flowability and long-term strength through their filler effect and latent hydraulic reactions. Silica fume and calcined kaolinitic clay increase yield stress and thixotropy, enhancing buildability, while also accelerating hydration and refining the microstructure. Collectively, these effects lead to improved early- and later-age strength, reduced porosity, and improved durability [27,30].
In this study, a 100% natural cellulose fibre product named Sika-Fibre 200, provided by Sika Ireland Ltd. (Dublin, Ireland), was investigated as a sustainable alternative with comparable performance characteristics. The benefits attributed to these natural fibres, particularly in the fresh state, include the mitigation of shrinkage cracking, enhancement of rheological properties, stabilization of the extrusion process in 3D printing, and a reduction in water demand. This research quantifies the effect of varied Sika-Fibre 200 concentrations within a ternary blend mortar containing 50% GGBS, 45% cement, and 5% SF. The investigation comprised the following experimental procedures: slump flow, rheological analysis (static/dynamic yield stress, shear flow index, thixotropy, plastic viscosity), compressive and flexural strength testing, and an assessment of embodied carbon. The goal was to determine an optimal mix that satisfies the requirements for printability, mechanical performance, and sustainability, contributing to the advancement of high-performance, low-carbon mortars for 3D construction printing.

2. Material and Mix Design

2.1. Materials

The binder system consisted of Portland cement (Irish Cement CEM II/A-L 42.5N) conforming to I.S. EN 197-1 [31] and GGBS supplied by Ecocem Materials Ireland (Dublin, Ireland) and meeting the requirements of I.S. EN 15167-1 [32]. For selected mixtures, SF compliant with EN 13263-1 [33] was incorporated at 5% of the binder mass (SF/b = 0.05) to replace an equivalent portion of cement. Dry silica sand with a maximum particle size of 2 mm, conforming to I.S. EN 196-1 [34], was used as the fine aggregate with a constant sand-to-binder ratio (s/b) of 1 maintained across all mixtures.
A polycarboxylate ether (PCE)-based superplasticizer (SP), Sika Viscocrete-10, conforming to I.S. EN 934-2 [35], was incorporated at a dosage of 2% by binder mass (SP/b = 0.02) to improve flow characteristics. A constant water-to-binder ratio (w/b) of 0.26 was adopted for all mixtures based on preliminary trial mixes. The binder composition included a fixed GGBS-to-binder ratio (GGBS/b) of 0.50 in all mixes, except for the control mixture.
Cellulose fibres (SikaFiber®-200, Sika Ireland Ltd.) were incorporated at dosages of 0.25%, 0.50%, 0.75%, and 1.00% by volume of binder. The fibres contained more than 80% cellulose by composition, with a nominal length of 200 μm and a diameter of 20 μm. Six mixes were prepared to evaluate the influence of fibre dosage and the inclusion of SF on rheological and mechanical performance. A control mix without fibres or silica fume was also included for baseline comparison. The mixes and fibre properties can be seen in Table 1 and Table 2, respectively.

2.2. Mixing and Casting Procedures

Mixing was conducted in compliance with I.S. EN 196-1 in a CONTROLS AUTOMIX mortar mixer using the manual controls [34]. The cement, GGBS, silica fume, and fibres were dry mixed for 30 s at 140 ± 5 rpm. After this, the combined water and SP were added while mixing for over 30 s, followed by another 30 s of mixing at 140 ± 5 rpm. Following this, the wet mix was mixed at 285 ± 10 rpm for 1 min. The mix was then checked for consistency. If the consistency was deemed acceptable, the mixing process would finish at this point; if not, it would then be mixed at 140 (5 rpm for 30 s) followed by 285 (10 rpm for 1 min). This step was repeated until the desired consistency was achieved.

3. Testing Methods

3.1. Fresh State Testing

3.1.1. Flow Table Test

The flowability of the mortar mixes was evaluated in accordance with ASTM C230/C230M-20 [36]. The mortar was placed into a standard flow mould positioned at the centre of the flow table. The mould was filled in two layers, each tamped 20 times with a tamping rod to ensure uniform compaction, and the surface was struck off level with the top of the mould. Immediately after filling, the mould was carefully lifted vertically away from the mortar. The table was then dropped 25 times in 15 s by means of the specified drop mechanism to allow the mortar to spread. Following the drops, two perpendicular diameters of the spread mortar were measured, and their average was recorded as the flow value of the mix.

3.1.2. Rheological Test

An Anton Paar MCR 102e SmartPave (Anton Paar, Graz, Austria) was used to examine the rheology of each mix, as seen in Figure 2a. Once a mix had been freshly prepared, it was transferred straight from the mixing bowl into an Anton Paar Building Material Cell 90 (BMC) and fitted onto the rheometer. The BMC was filled to a limit of 40 mm below the top level. The features of the BMC were a ribbed interior surface for wall slip prevention, a depth of 100 mm, and a 70 mm diameter. The stirrer used can be seen in Figure 2b. A smaller vane is used because of the reduced surface area interaction between it and the mortar during shearing. This creates a lower torque when compared to a vane with a larger diameter. Reducing the torque avoids overloading the rheometer and improves the accuracy, while ensuring that the measurement does not exceed the rheometer’s functional capacity. The stirrer was lowered to 10 mm from the bottom of the BMC to ensure the vane had a good depth in the mix. The heating plate of the rheometer was set to room temperature and allowed to reach equilibrium before conducting the test.
The test protocol used for the rheological test can be seen in Figure 3 [30]. To keep the structuration of each mix the same, the mixes were subjected to a pre-shear of 60 (1/s) for 30 s. Applying this high shear rate disrupts any structural buildup that may have occurred before beginning the rheological test. This shear effectively breaks apart the flocculated network of cement particles. Although this process does not completely eliminate structural buildup, it helps bring each mix to a similar baseline prior to testing, thereby enabling more accurate and comparable results.
This pre-shear phase was followed by a 30-s rest period to allow the mix to restructure. After the rest period, the static test commenced. Static yield stress refers to the stress required to initiate flow, reflecting the strength of the flocculated network within the mortar [37]. The test involved applying a constant shear rate of 0.5 s−1 for 200 s, with data recorded at 0.1-s intervals. Subsequently, a shear rate of 100 s−1 was applied for 30 s, again with data captured at 0.1-s intervals. The procedure was repeated using a shear rate of 0.5 s−1 to obtain data for Interval 3. This sequence enabled the determination of static yield stress and thixotropy using Intervals 1 to 3. Among these, Interval 1 was used to evaluate the static yield stress, as it consistently exhibited the clearest peak across all mixtures [38].
The dynamic test was subsequently conducted by increasing the shear rate from 5 s−1 to 55 s−1 in increments of 5 s−1, followed by a symmetrical decrease from 55 s−1 back to 5 s−1 at the same rate. Each shear rate was maintained for 20 s, with data collected at 1-s intervals. Dynamic yield stress refers to the minimum stress required to sustain continuous flow without interruption [37]. This test enabled the evaluation of dynamic yield stress, flow curves, shear behaviour (thickening or thinning) and plastic viscosity.

3.2. Hardened State Testing

3.2.1. Compressive Strength Test

Compressive strength testing was performed in accordance with I.S. EN 196-1 [34] using 50 mm cubic specimens. Three samples were cast by pouring the mix into steel moulds pre-coated with release oil to facilitate demoulding. Due to the good flowability of the mortar, no vibration was required. After 24 h of setting in the moulds, the specimens were demoulded using compressed air and transferred to a water bath for curing at 7 or 28 days, depending on the designated testing age. Testing was conducted using a CONTROLS AUTOMAX 5 (CONTROLS, Tucker, GA, USA) compression machine, applying a constant loading rate of 2400 N/s until failure. The average compressive strength was calculated from three specimens to ensure data reliability. Metal plates were placed beneath each sample to ensure stable contact and accelerate load application.

3.2.2. Flexural Strength Test

Flexural strength testing was conducted in accordance with I.S. EN 1015-11 [39]. Beam specimens measuring 160 mm × 40 mm × 40 mm were cast and demoulded after 24 h, followed by immediate curing in a water bath for the designated durations. Prior to testing, alignment lines were drawn 30 mm from each end along the length of the specimen to indicate support positions and at midspan to mark the loading point. Testing was performed using a 5980 Series Universal Testing System under a three-point bending configuration. The loading head was carefully positioned using the manual control dial to avoid preloading damage. A displacement-controlled loading rate of 0.01 mm/s was applied to ensure stable crack development and accurate failure capture. Three specimens were tested per mix, and the average value was reported to account for variability.

4. Results and Analysis

4.1. Fresh State Results

4.1.1. Slump Flow

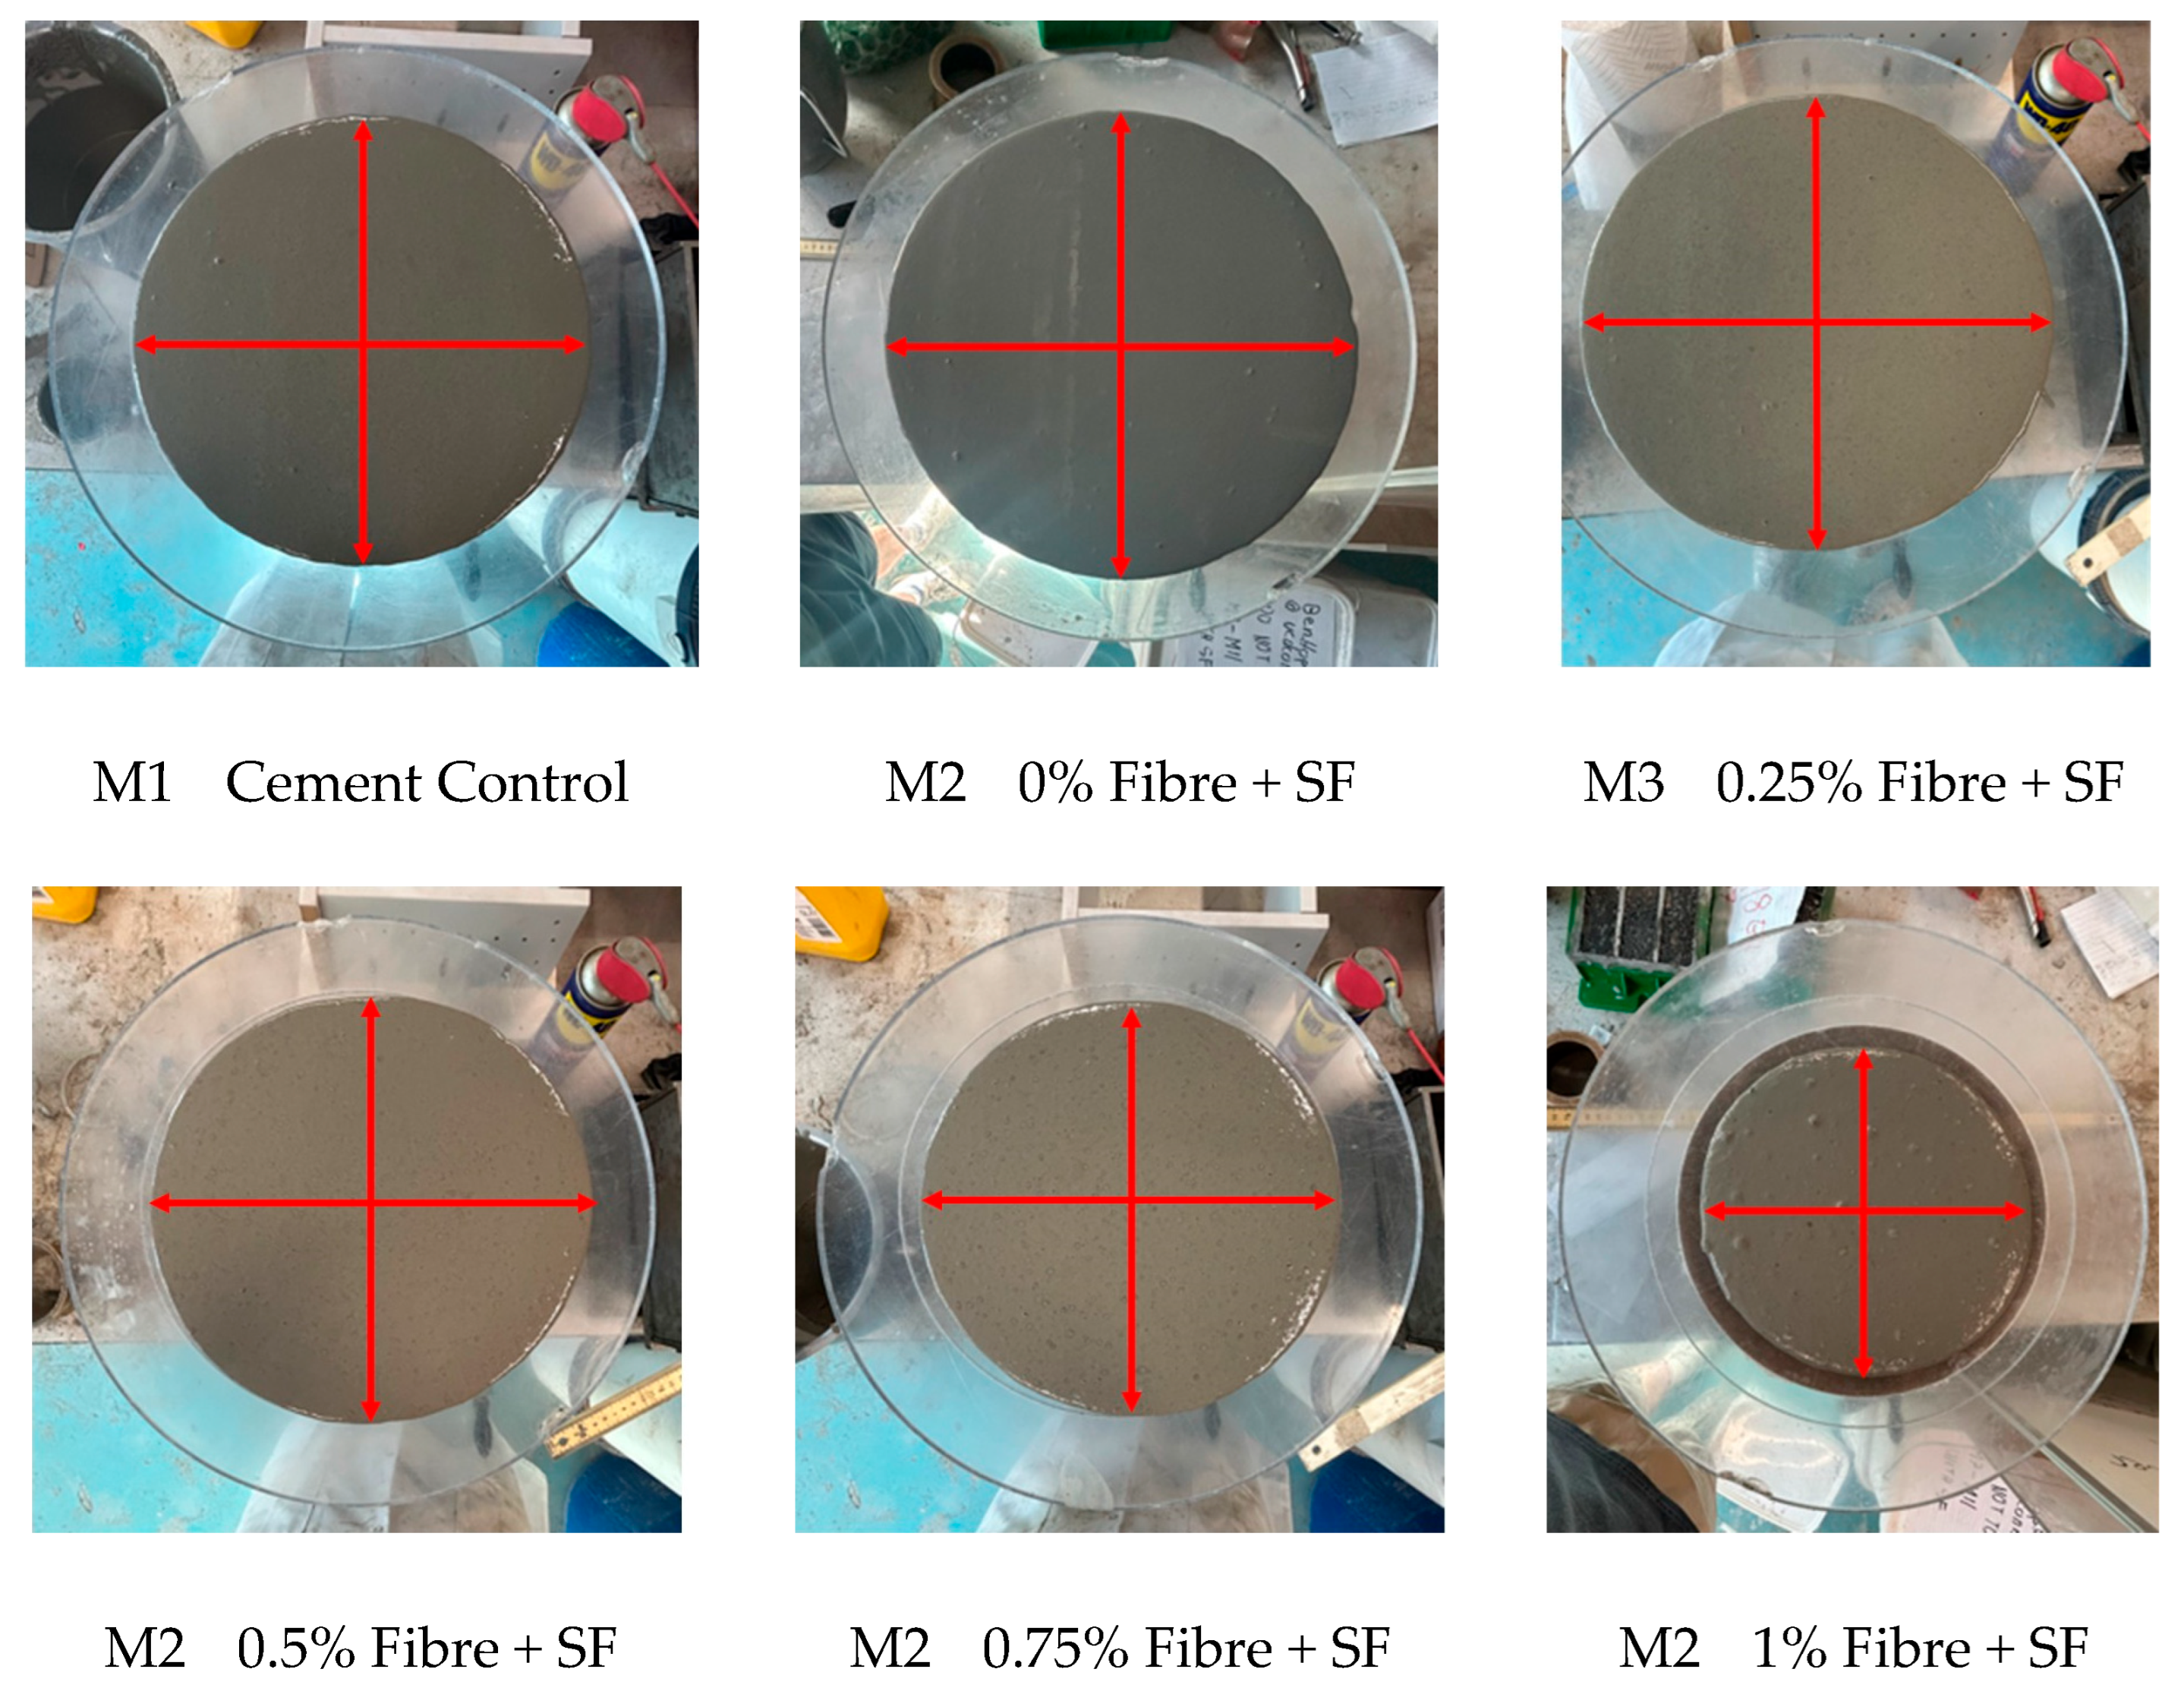
The results of the flow table test are presented in Figure 4 and Figure 5. The incorporation of silica fume without fibres (M2) resulted in the highest flow value of 285 mm, corresponding to an increase of approximately 10% compared to the cement control mix M1 (260 mm). With the addition of fibres, a gradual reduction in flow was observed as the fibre dosage increased. At 0.25% fibre content (M3), the flow decreased slightly to 270 mm, still 4% higher than the control. At 0.5% fibre dosage (M4), the flow dropped to 255 mm, which was 2% lower than the control mix. Further increasing the fibre content to 0.75% (M5) and 1.0% (M6) caused significant reductions, with flows of 247.5 mm and 202.5 mm, corresponding to decreases of 5% and 22% relative to the control, respectively. These results indicate that while the inclusion of silica fume enhances flow in the absence of fibres, the progressive increase in fibre dosage counteracts this effect, leading to reduced workability. The pronounced reduction at 1.0% fibre dosage suggests that excessive fibre addition impairs flowability due to fibre agglomeration and increased internal resistance within the mixture.

4.1.2. Rheology

Static Yield Stress
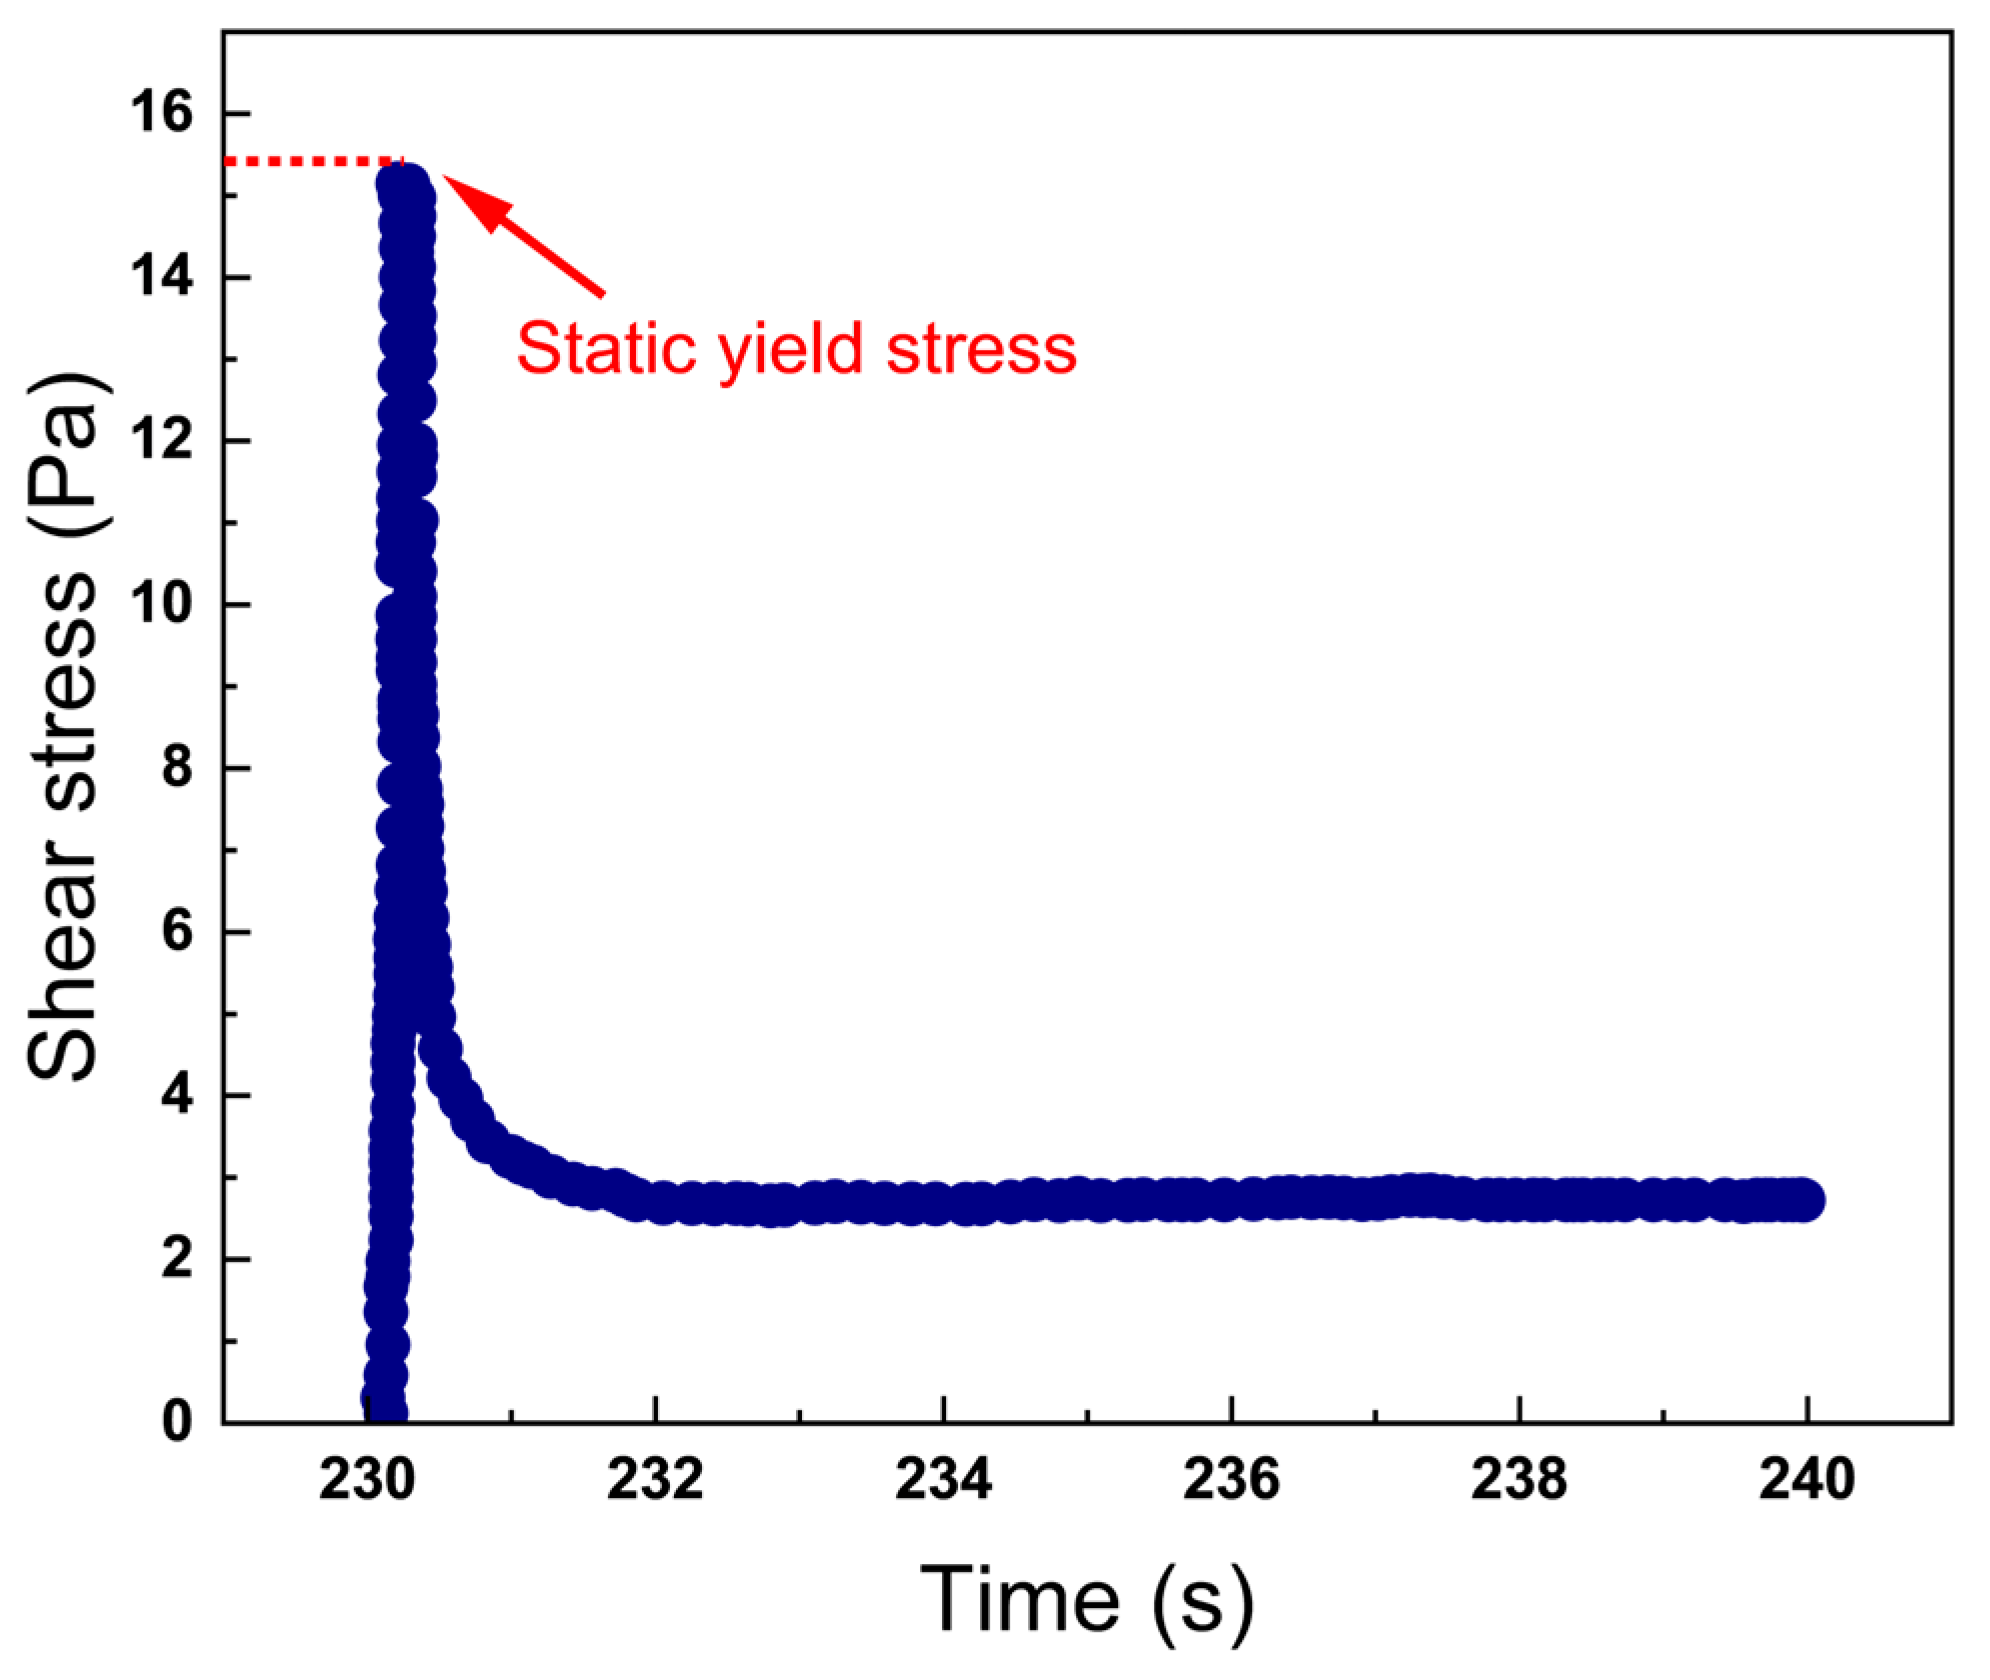
The static yield stress is defined as the minimum stress required to initiate flow in a material at rest, and it reflects the degree of flocculation and structural build-up within the mortar [40,41]. It also characterizes the stress needed to break down the interconnected particle–fibre–binder network that develops when the mix is undisturbed; therefore, it is a key parameter for assessing buildability in 3D printing. The static yield stress was determined from the early peak in the stress–time curve recorded during the static interval of the rheological test. Figure 6 presents a typical trial test curve obtained in this study, shown to indicate how the static yield stress is identified from the early peak.
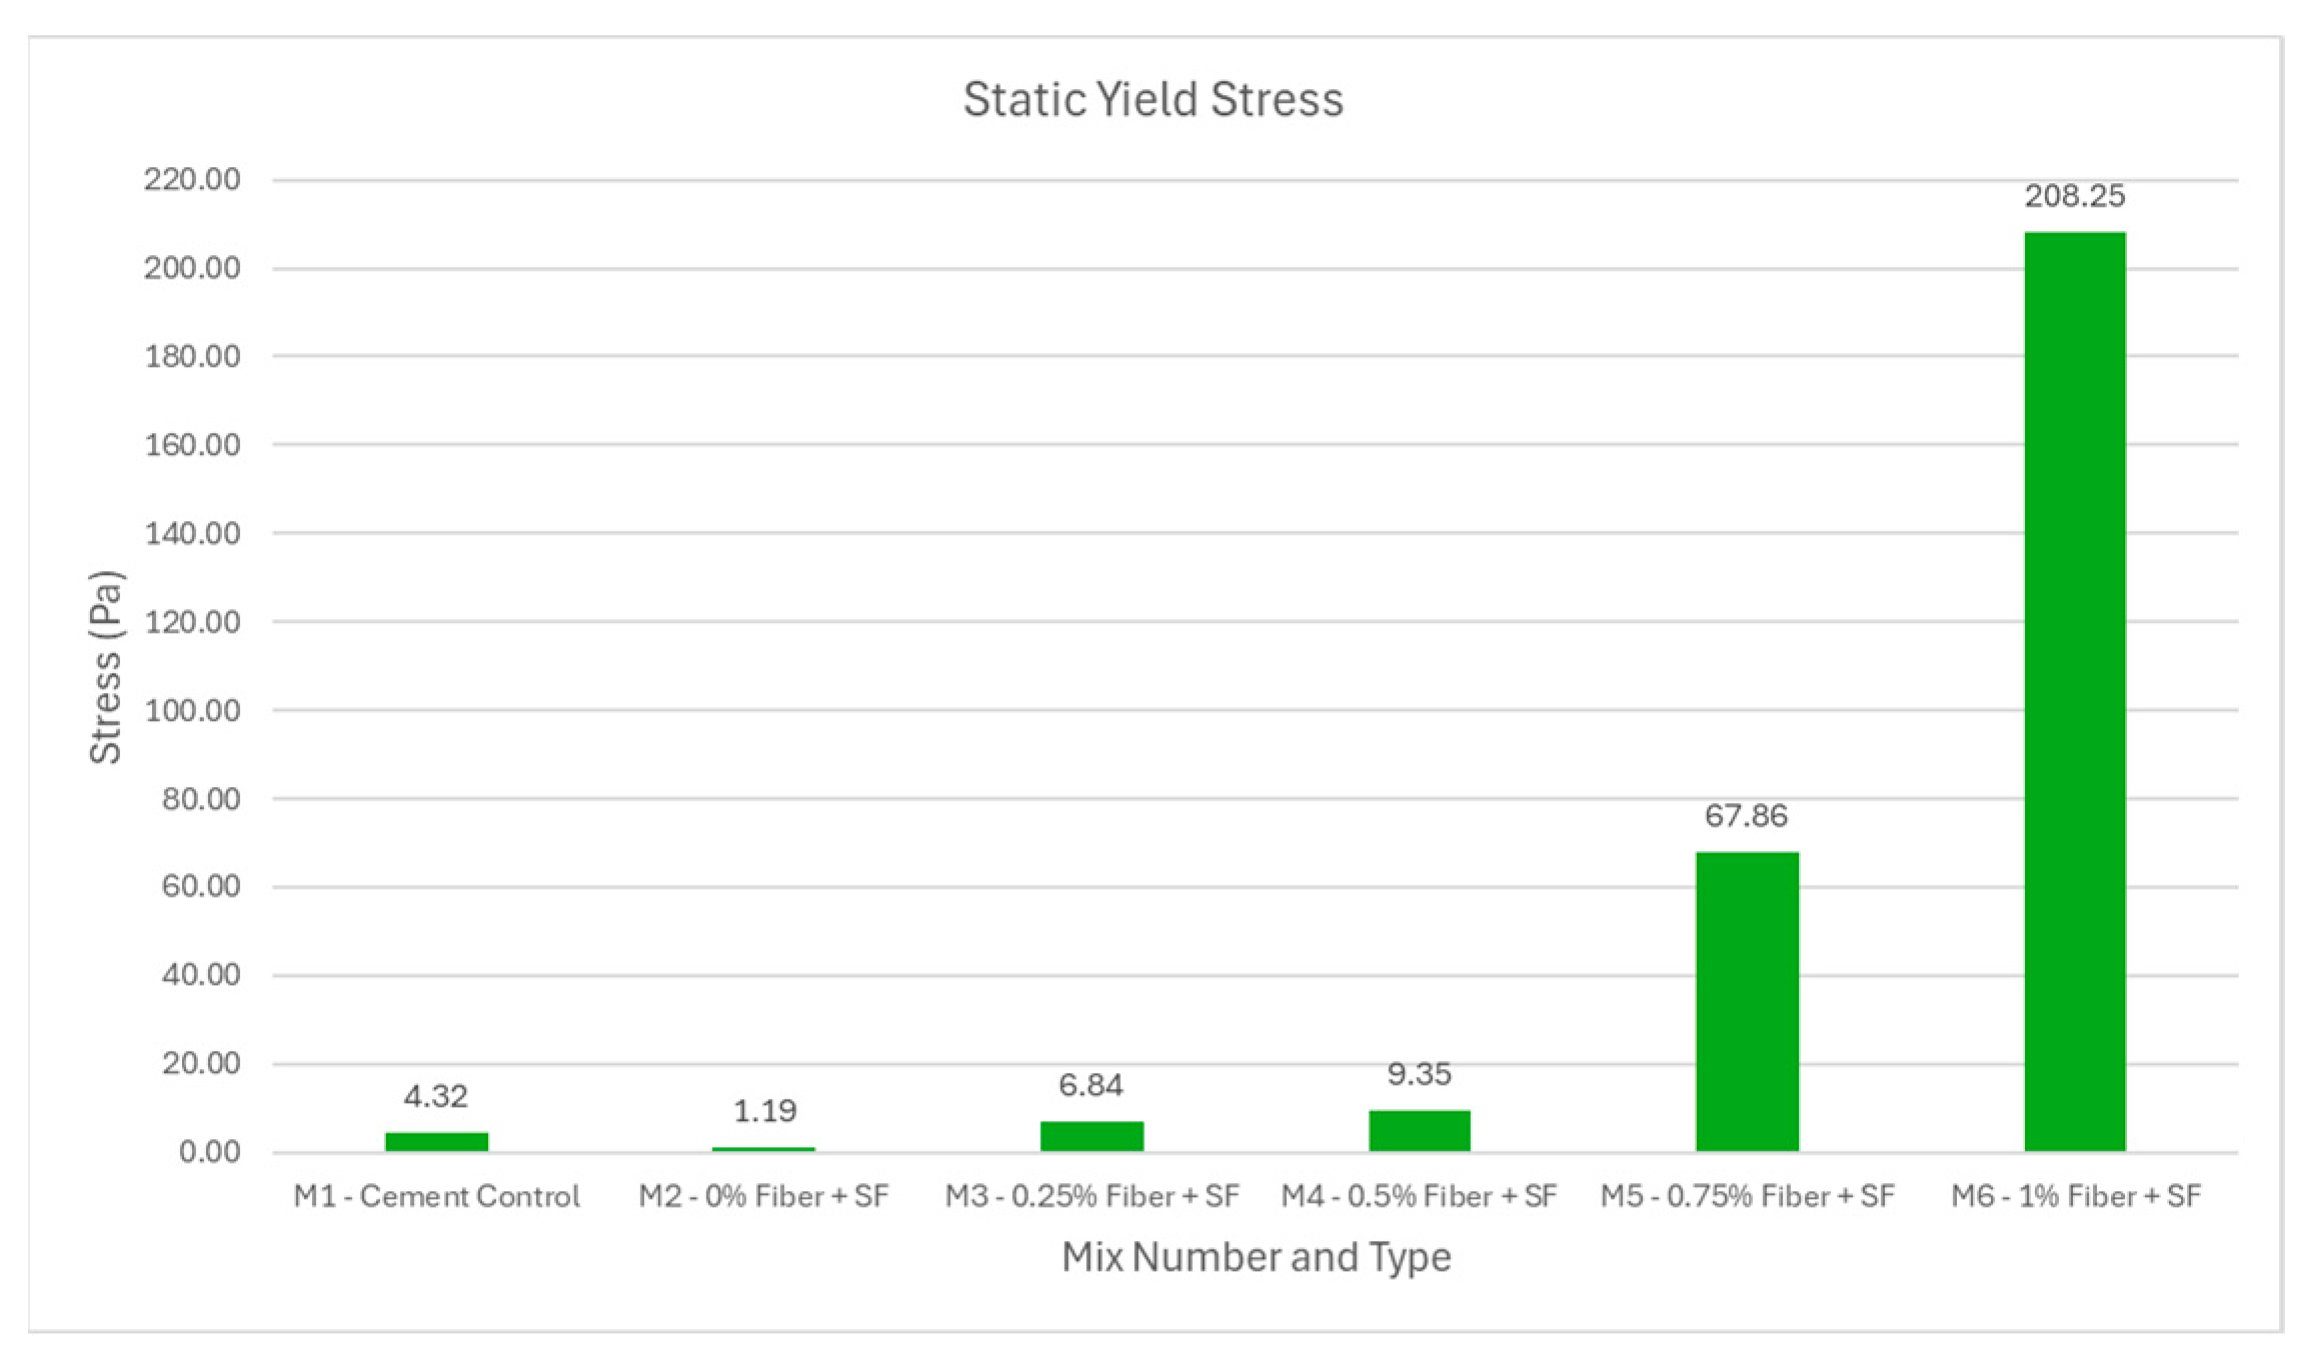
The results of static yield stress testing are presented in Figure 7. The control mix (M1) without silica fume or fibres exhibited a static yield stress of 4.32 Pa. When silica fume was introduced without fibres (M2), the static yield stress dropped to 1.19 Pa, indicating that the particle packing and dispersion effect of silica fume initially reduced structural build-up. However, static yield stress began to increase with the incorporation of fibres. At 0.25% and 0.5% fibre dosages (M3 and M4), values enhanced slightly to 6.84 Pa and 9.35 Pa, respectively, showing a modest enhancement in resistance to flow initiation. A more pronounced enhancement was observed at 0.75% fibre (M5), where static yield stress increased to 67.86 Pa, while the highest value of 208.25 Pa occurred at 1% fibre dosage (M6). This strong increase at higher fibre contents can be attributed to the combined effects of fibre bridging and the flocculation promoted by silica fume [42], both of which intensify internal resistance and create a percolated network that resists deformation. The high surface area and water demand of silica fume may also accelerate early structuration, reinforcing the fibre–matrix network. From a printability perspective, a moderate increase in static yield stress supports buildability by enabling extruded layers to retain their shape. However, excessively high values may compromise pumpability and hinder stable extrusion, as seen in M6.
Dynamic Yield Stress and Shear Thickening
Dynamic yield stress represents the minimum shear stress required to initiate and sustain flow under continuous shearing, and it is a critical parameter governing the pumpability of 3D-printed concrete [18,37]. A sufficiently low dynamic yield stress is necessary to ensure smooth conveyance of the mixture through hoses and nozzles without excessive pumping pressure or risk of blockage [43]. However, if the dynamic yield stress is too low, the material may segregate or bleed, leading to loss of homogeneity during transport [44]. In extrusion-based 3D printing, controlling dynamic yield stress is therefore essential to balance ease of pumping with the need to maintain material cohesion, directly influencing both the stability of the extrusion process and the quality of the deposited filament. In this research, flow curve analysis was employed to evaluate the dynamic yield stress and shear behaviour, with the Herschel–Bulkley (H-B) model (Equation (1)) used to fit the data obtained from the flow curves in the dynamic test stage [37]:
τ = τ y + K γ ˙ n
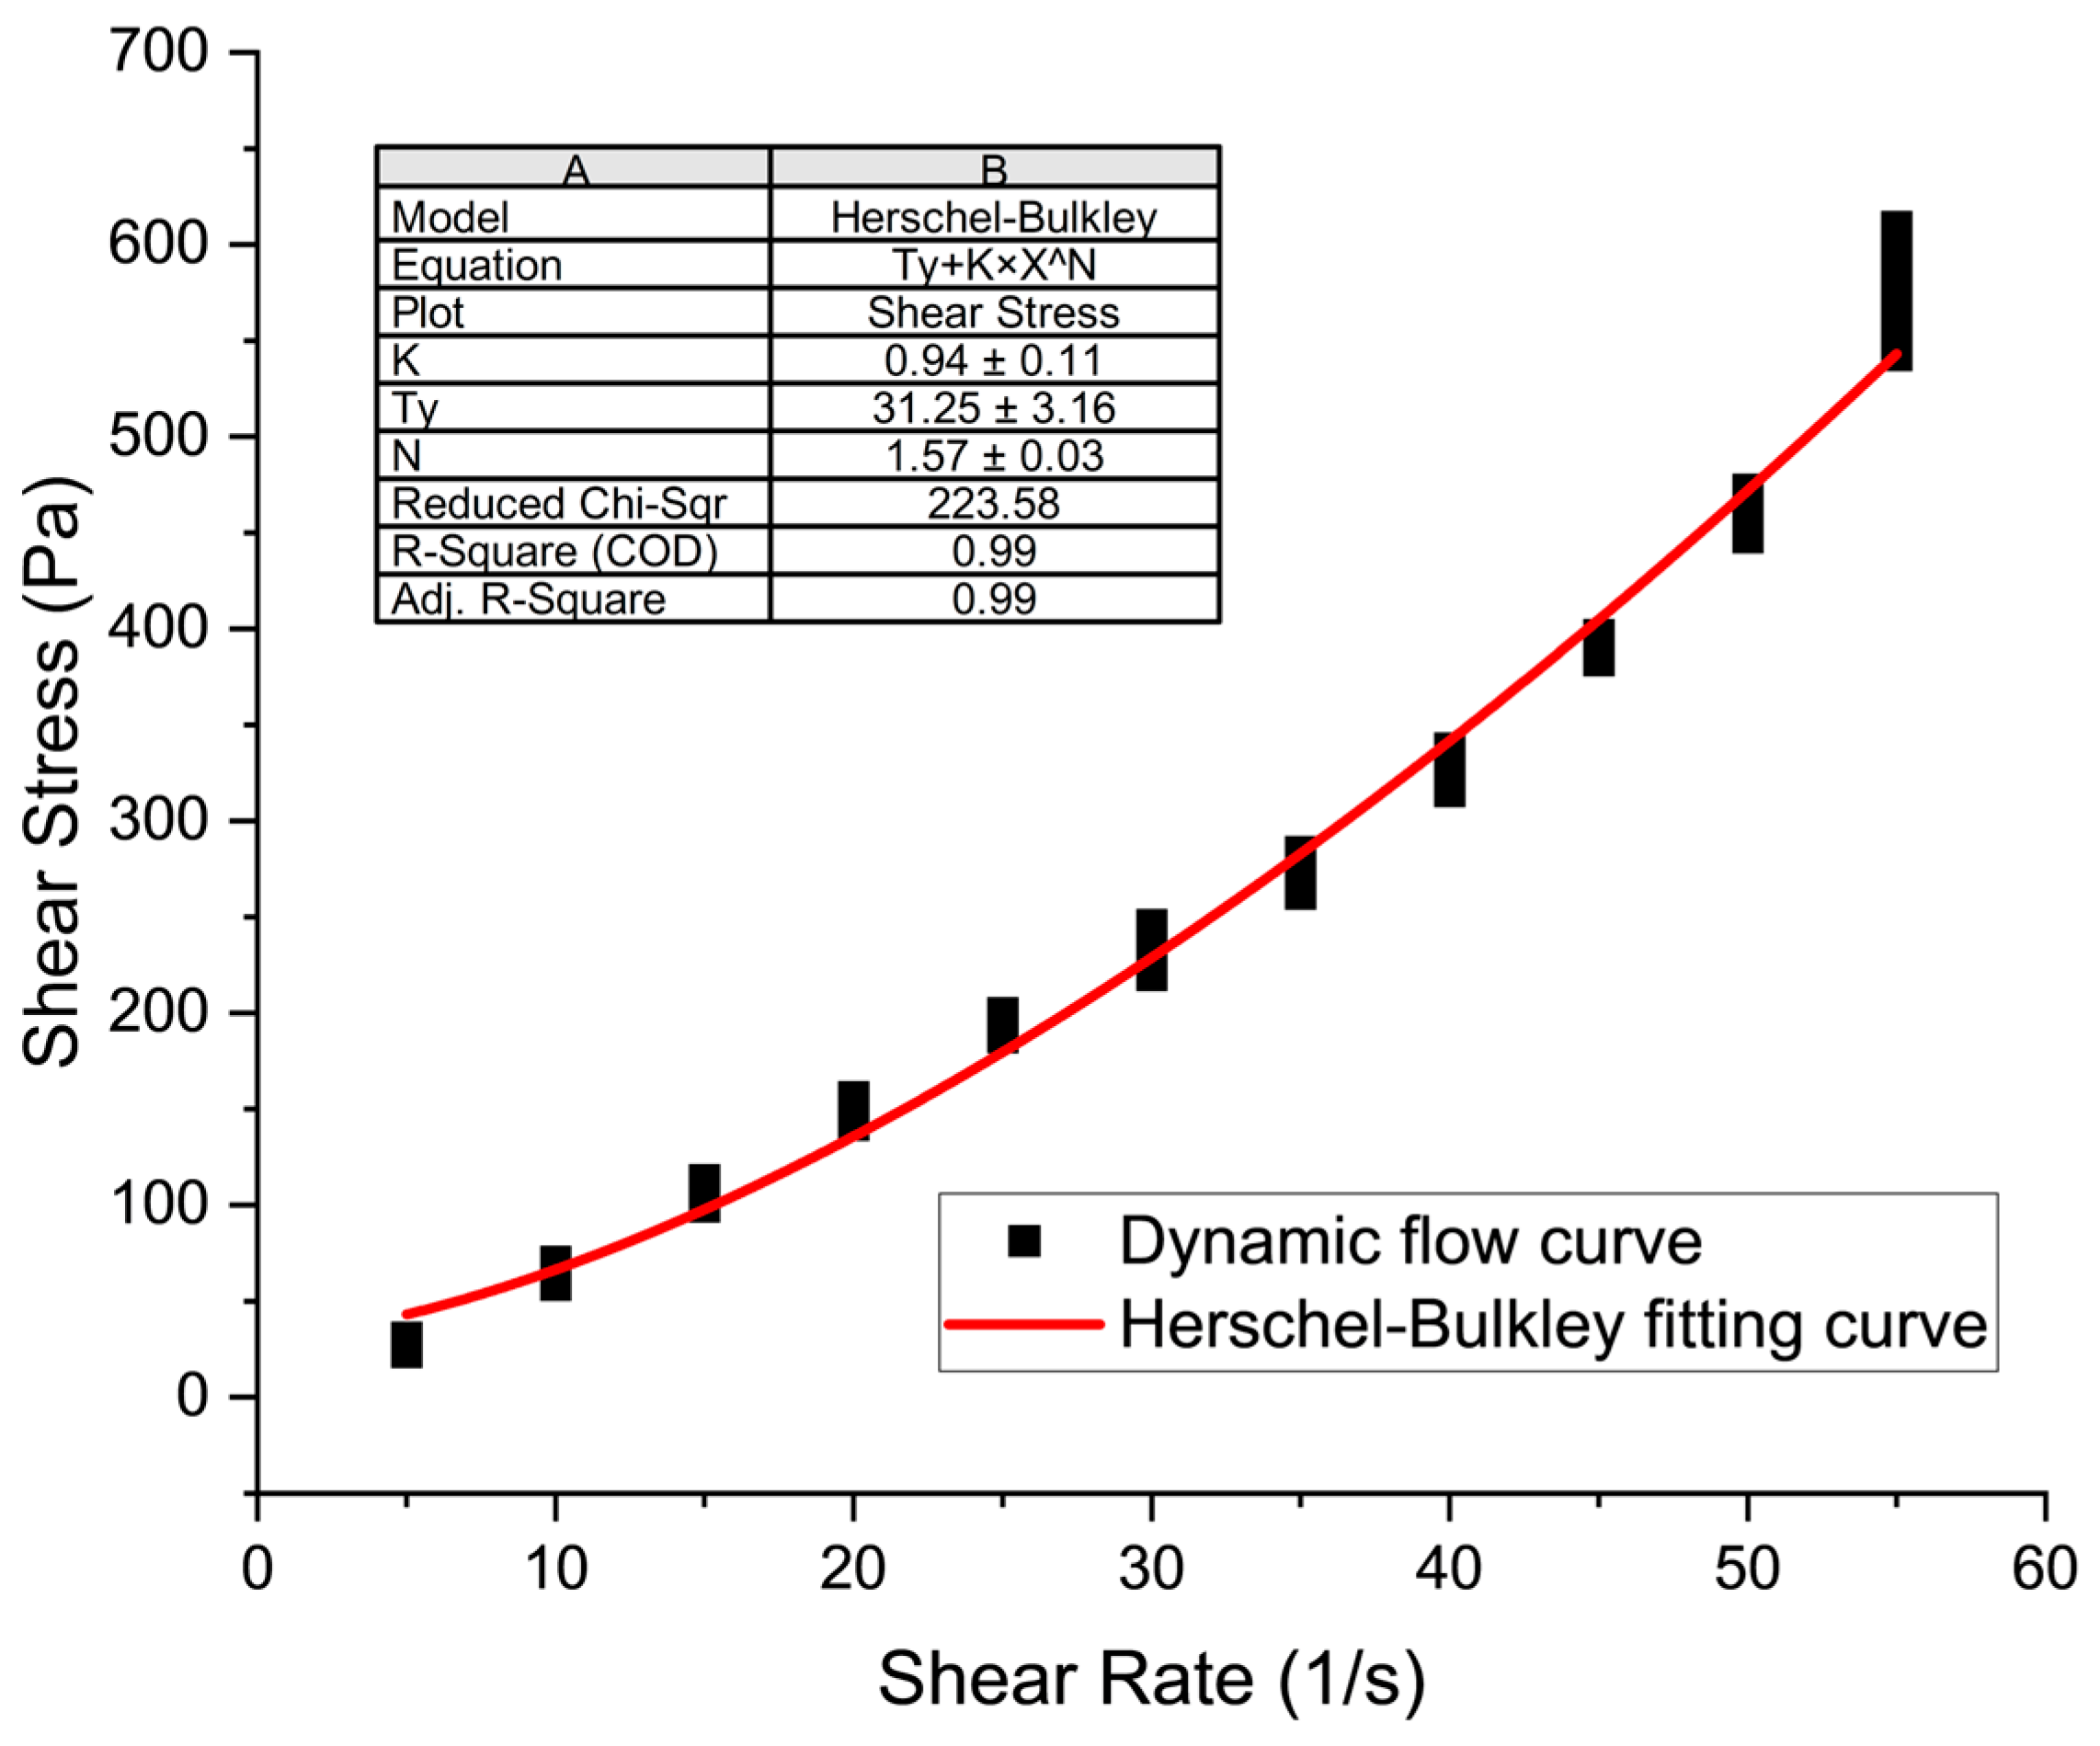
where τ denotes the shear stress, τ y is the dynamic yield stress, K is the consistency index, γ ˙ is the shear rate, and n is the flow index. When n > 1, it indicates shear thickening behaviour; when n < 1, it relates to shear thinning behaviour. The downward branch of the shear flow curve was selected by using Origin 2019 software to extract the dynamic yield stress and shear flow index. A representative fitted curve is presented in Figure 8.
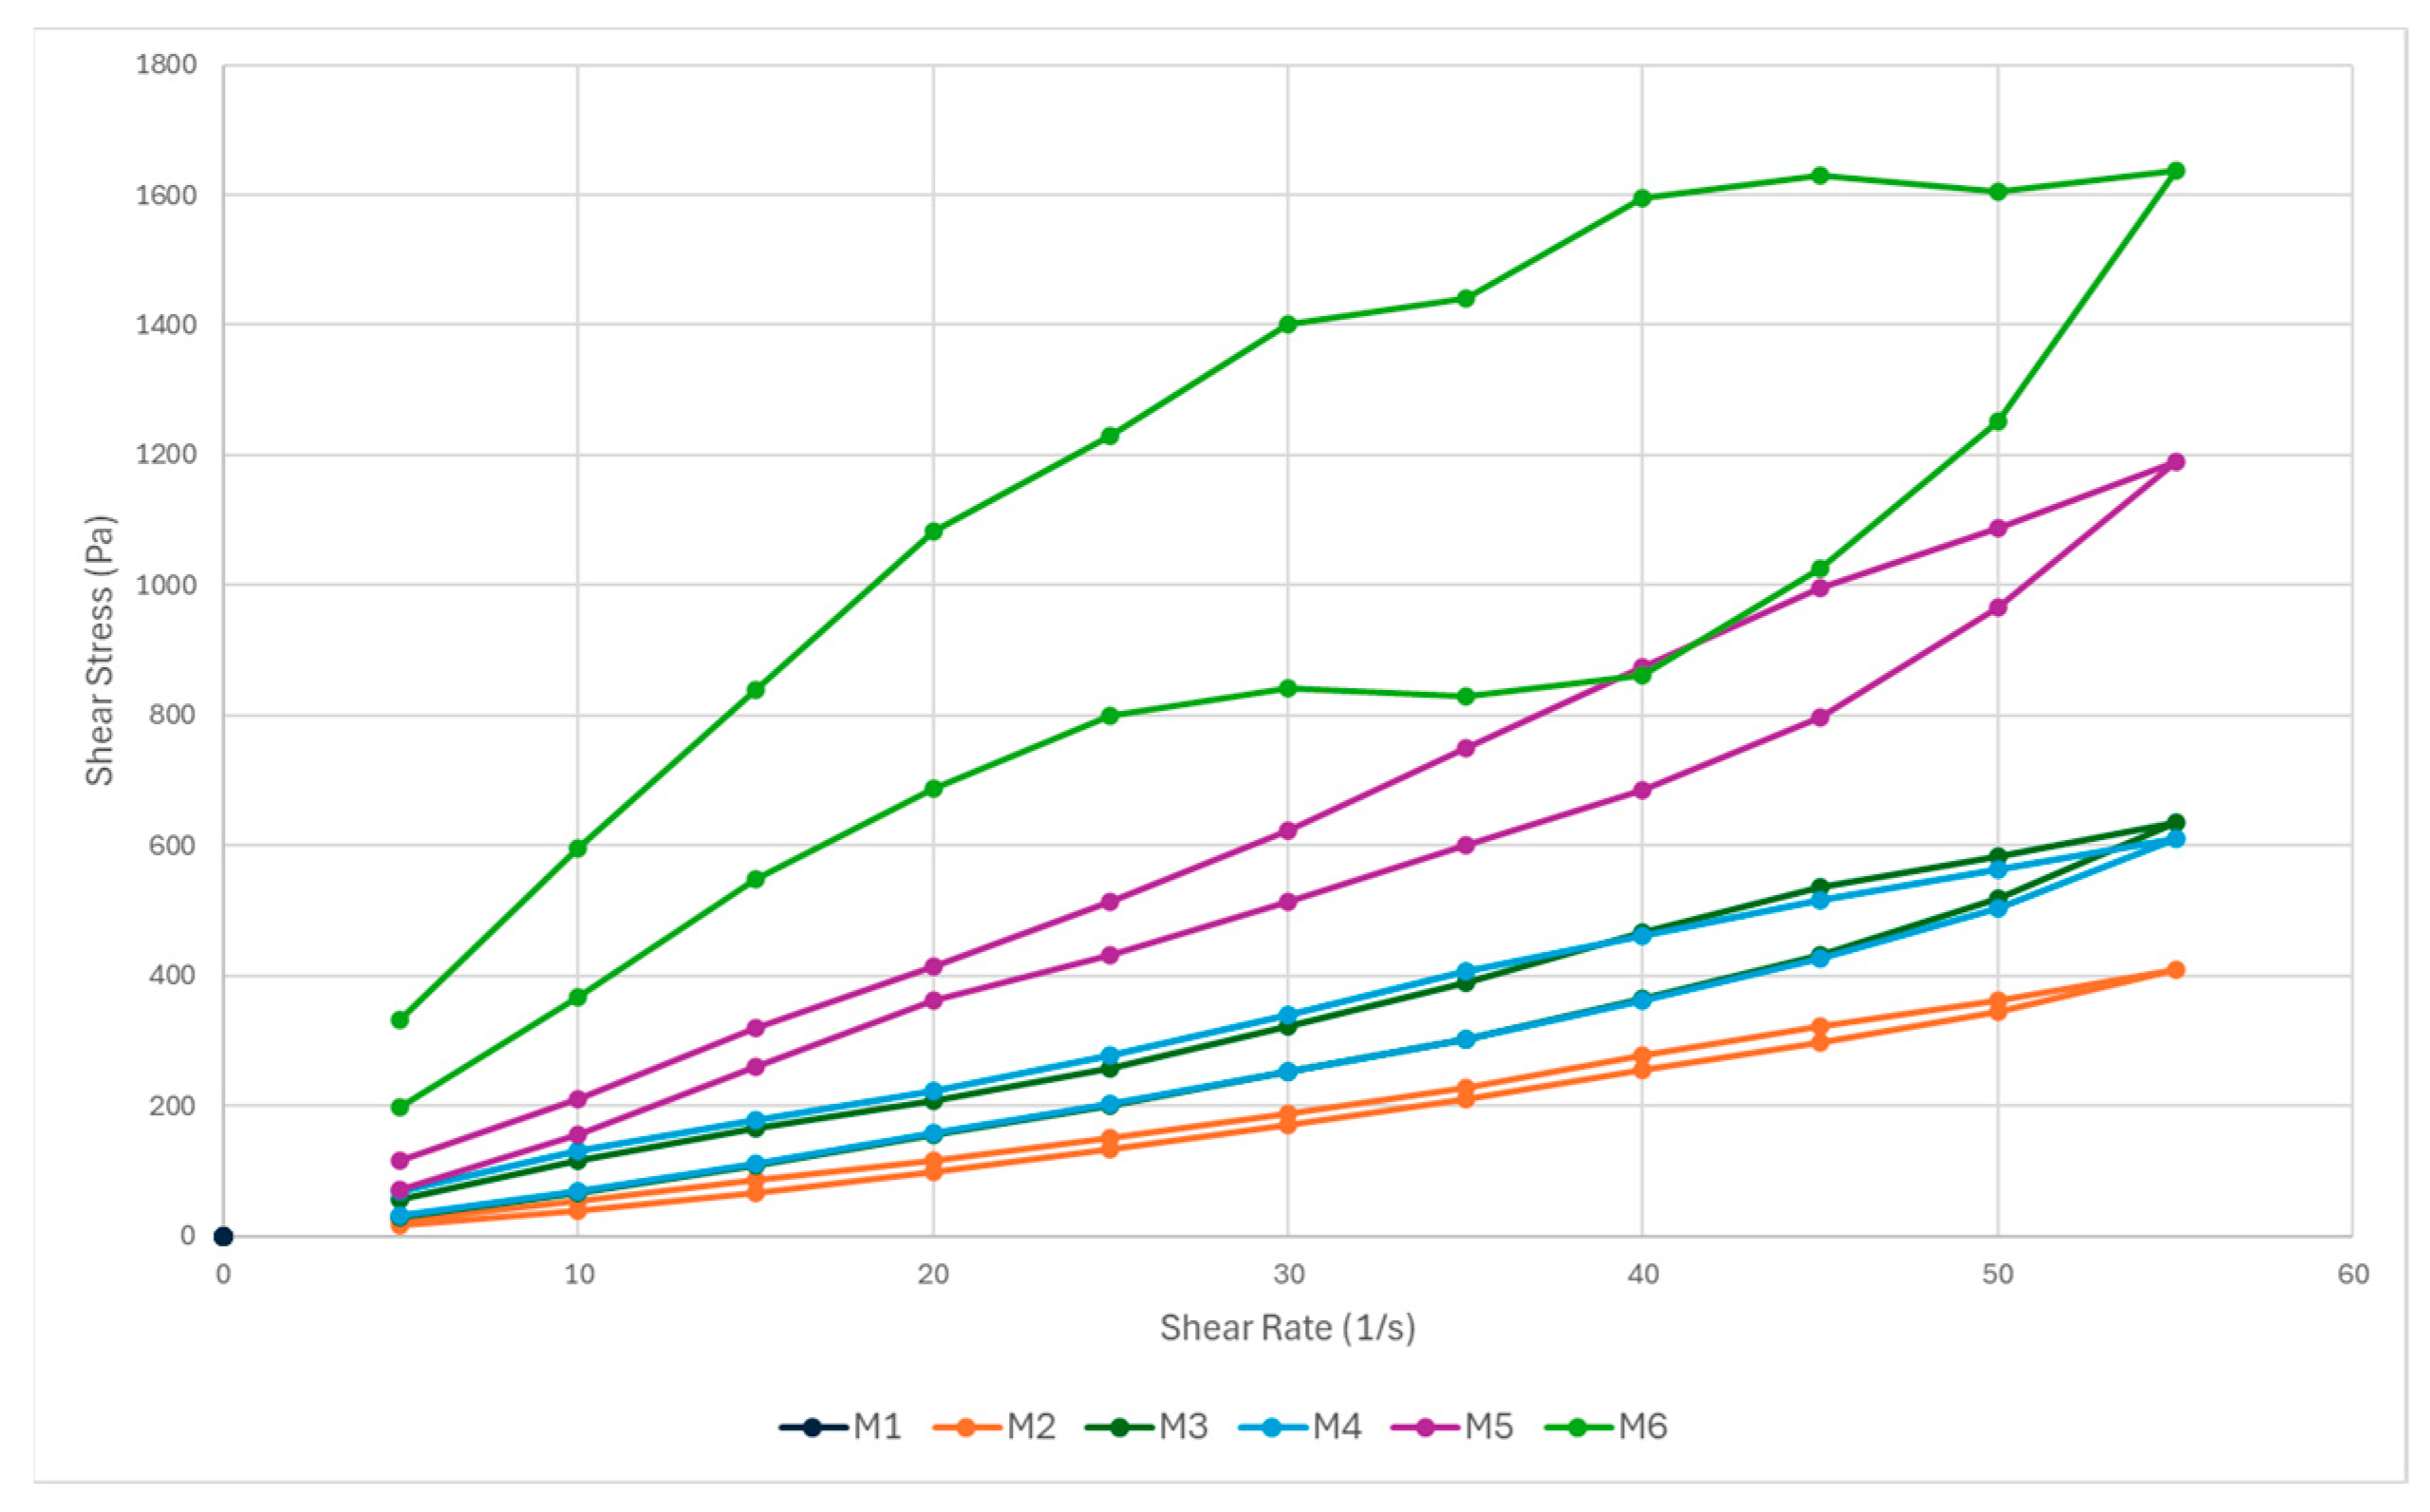
The full dynamic flow curves for the mixes are presented in Figure 9. A clear trend is observed where the shear stress increases with fibre dosage, with M6 (1% fibre) showing the highest values across the entire shear rate range. This reflects reduced workability and increased internal resistance, which corresponds to higher plastic viscosity. The hysteresis observed between the upward and downward shear ramps indicates thixotropic behaviour, with the enclosed loop area increasing in proportion to the fibre content. This enlarged hysteresis area signifies greater structural build-up and breakdown within the material, confirming that fibres promote thixotropy by enhancing particle–fibre interactions and network formation. For 3D printing, controlled thixotropy is required since the material must rebuild its internal structure after shear to retain the shape of extruded filaments, while excessive thixotropy may hinder pumpability and lead to inconsistent extrusion [45,46]. The irregular curve of the M6 mix suggests localized structural build-up, which could result in poor flow consistency and extrusion instability.
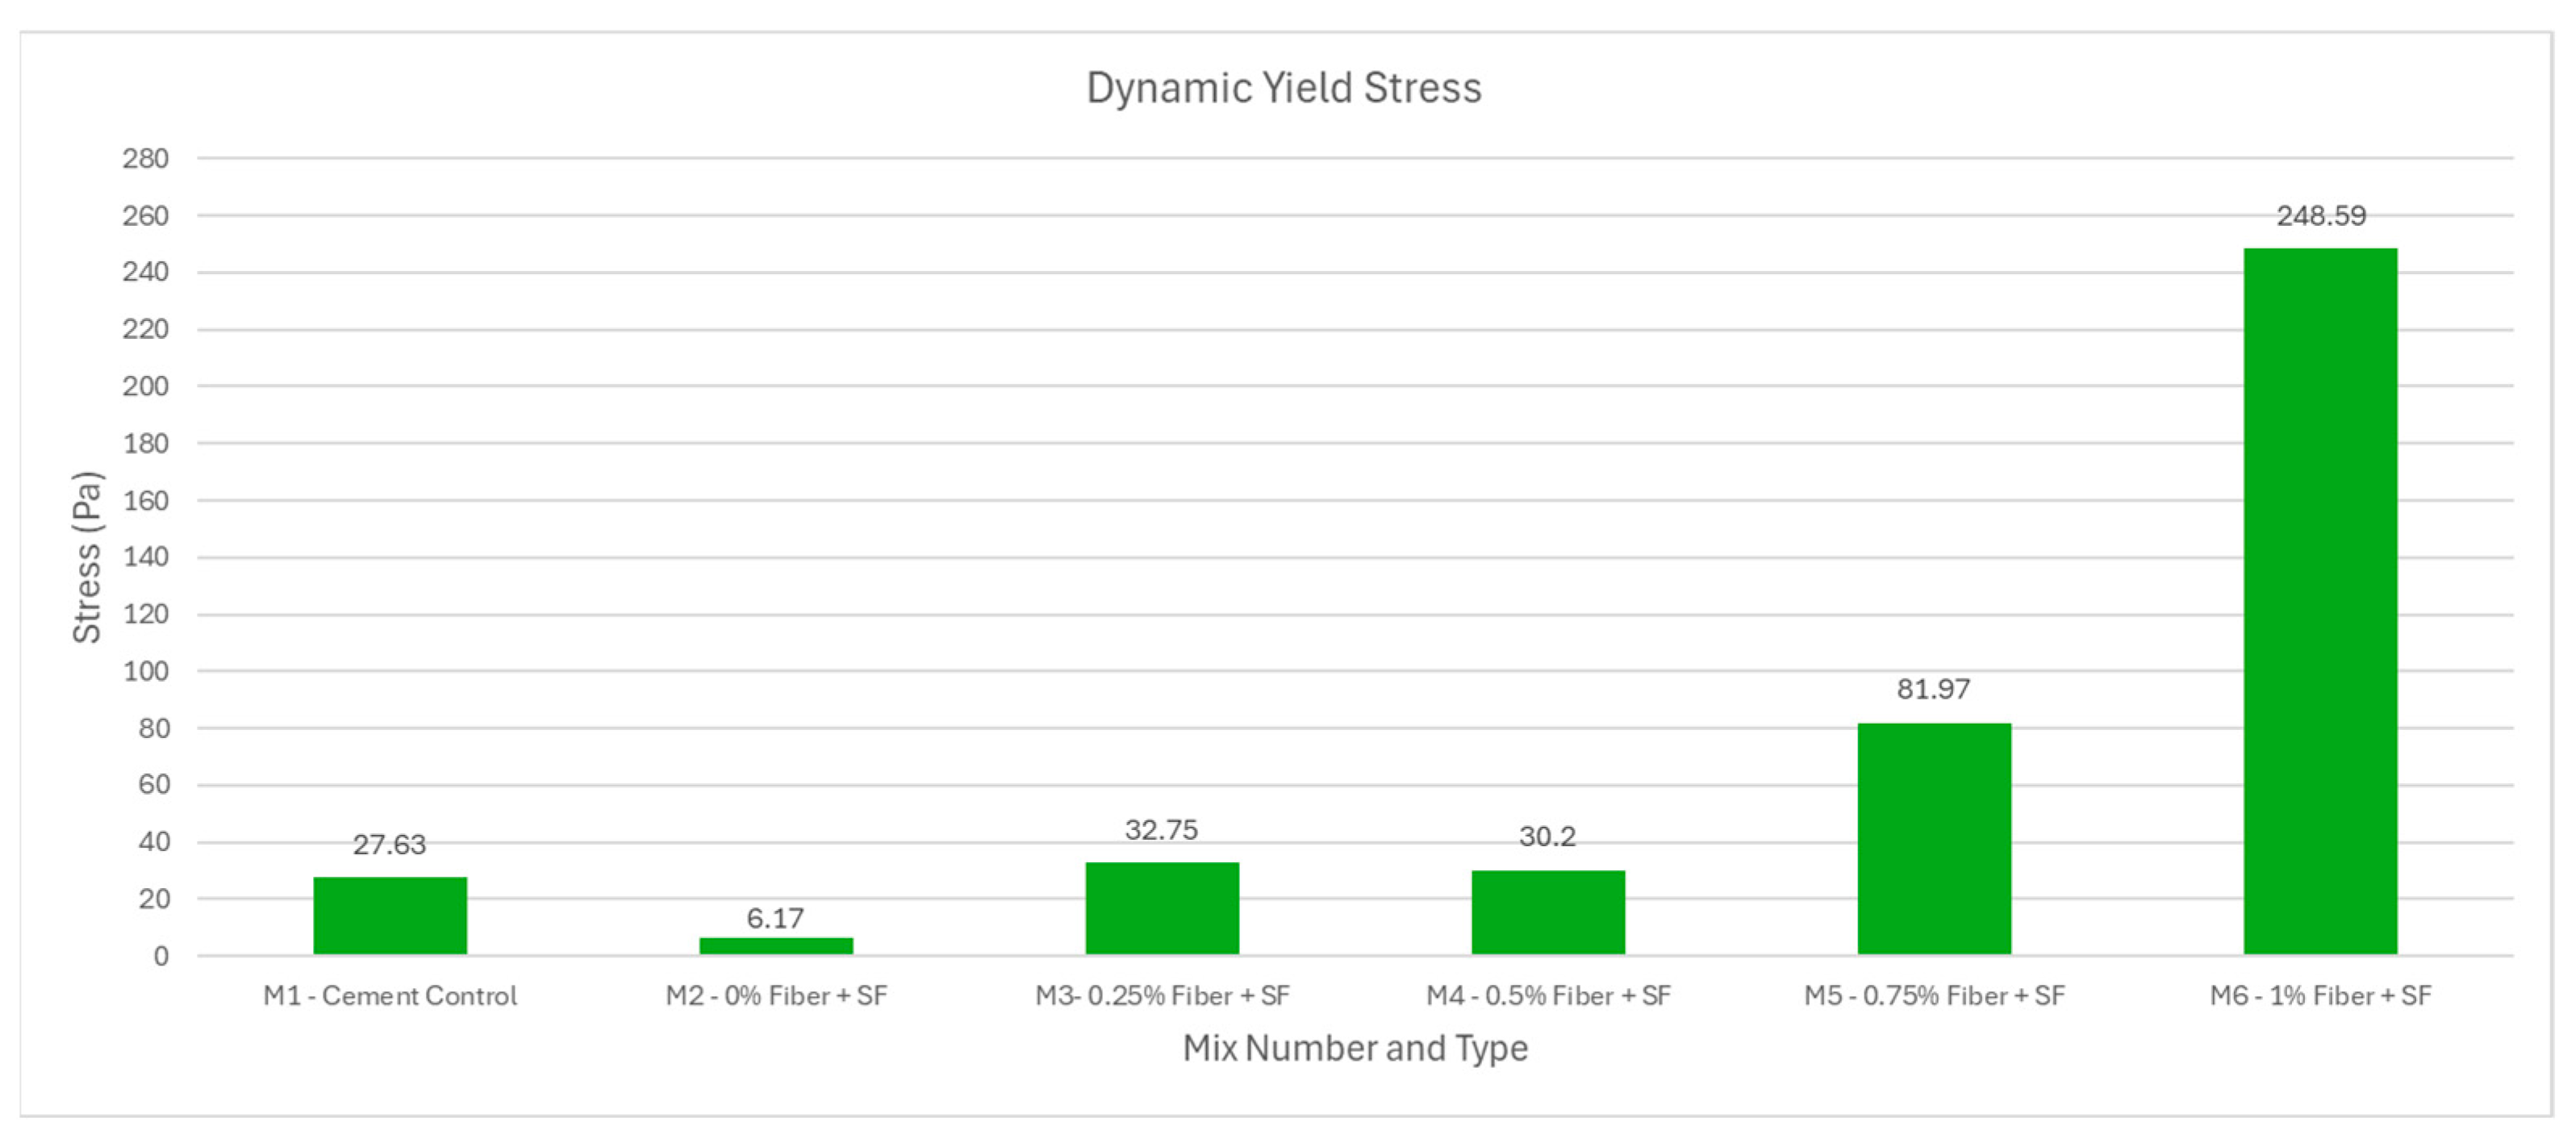
Figure 10 shows the dynamic yield stress values for all mixes, highlighting the strong influence of fibre dosage. The control mix (M1) exhibited a yield stress of 27.63 Pa, while the addition of silica fume without fibres (M2) reduced this value to 6.17 Pa, indicating that the filler effect and particle lubrication of silica fume improved flowability under shear [47]. However, as fibres were introduced, the dynamic yield stress increased progressively, reaching 32.75 Pa at 0.25% fibre (M3) and 30.20 Pa at 0.5% fibre (M4). A more pronounced increase was observed at 0.75% fibre (M5), with a stress of 81.97 Pa, while the 1% fibre mix (M6) exhibited a significant increase to 248.59 Pa. This substantial increase can be attributed to the combined effects of fibre–matrix interactions, enhanced structural interlocking, and reduced free water content, which intensify flow resistance [48].
From a 3D printing perspective, lower dynamic yield stress values (as seen in M1 and M2) are favourable for pumpability but may risk segregation and poor filament cohesion during extrusion. Conversely, the very high dynamic yield stress of M6 indicates strong structural buildup, which benefits shape retention but may compromise extrudability and increase pumping energy demands. The results highlight the critical balance required: moderate fibre contents (M3–M4) combined with silica fume demonstrate a workable compromise between pumpability and buildability, while excessive fibre dosage (M6) may hinder stable printing due to excessive flow resistance.
Shear thickening behaviour, characterized by an increase in viscosity with elevating shear rate, was observed in all tested mixtures (Figure 11) [49]. The control mix (M1) showed a flow index of 1.57, while the addition of silica fume without fibres (M2) slightly reduced the value to 1.47, suggesting that silica fume improved particle packing and lubrication, thereby moderating shear thickening. At 0.25% fibre dosage (M3), the flow index reached a peak of 1.657, highlighting the synergistic effect of fibre–matrix interactions and silica fume densification in promoting frictional contacts under shear. Beyond this dosage, the flow index reduced gradually, with values of 1.551 at 0.5% fibre (M4) and 1.480 at 0.75% fibre (M5). At the highest fibre dosage (M6), the flow index decreased markedly to 1.282, falling below that of the 0% fibre mix, which indicates a transition toward weaker shear thickening or partial shear thinning. From a 3D printing perspective, moderate shear thickening (as seen in M1–M4) is beneficial for extrudability, since the material maintains cohesion and prevents segregation during pumping and nozzle flow. However, excessive fibre content (M6) disrupts this balance: fibre clustering and reduced free water led to uneven stress distribution, reducing shear thickening capacity. This reduction can impair flow stability during extrusion and compromise filament uniformity. The observed trend is consistent with the findings of Jiao et al. [10], who reported that combined fibre and silica fume additions enhance shear thickening up to an optimal dosage, after which clustering effects dominate and reduce the response.
Plastic Viscosity
Plastic viscosity describes the resistance of a cementitious mixture to flow once the yield stress has been exceeded, reflecting the internal friction between particles and the liquid phase. In 3D concrete printing, plastic viscosity is closely associated with pumpability and extrudability. A sufficiently low viscosity is required to allow continuous pumping and extrusion through the nozzle without excessive energy demand or risk of blockage. Conversely, if the viscosity is too low, the mixture may lose cohesion, resulting in filament collapse or poor shape retention [18,50]. Therefore, plastic viscosity must be carefully controlled to ensure efficient pumping while maintaining sufficient stability during deposition, which directly affects the uniformity and buildability of the printed layers. In this section, the Modified Bingham (MB) formula [10] was used to obtain the values for plastic viscosity μ , which can be seen in Equation (2) below.
τ = τ 0 + μ γ ˙ + c γ ˙ 2
where c is regression coefficient. Similarly to the H-B model, the MB model was applied to the downward curve of the shear flow graph using Origin to determine plastic viscosity. A representative fitting curve is shown in Figure 12.
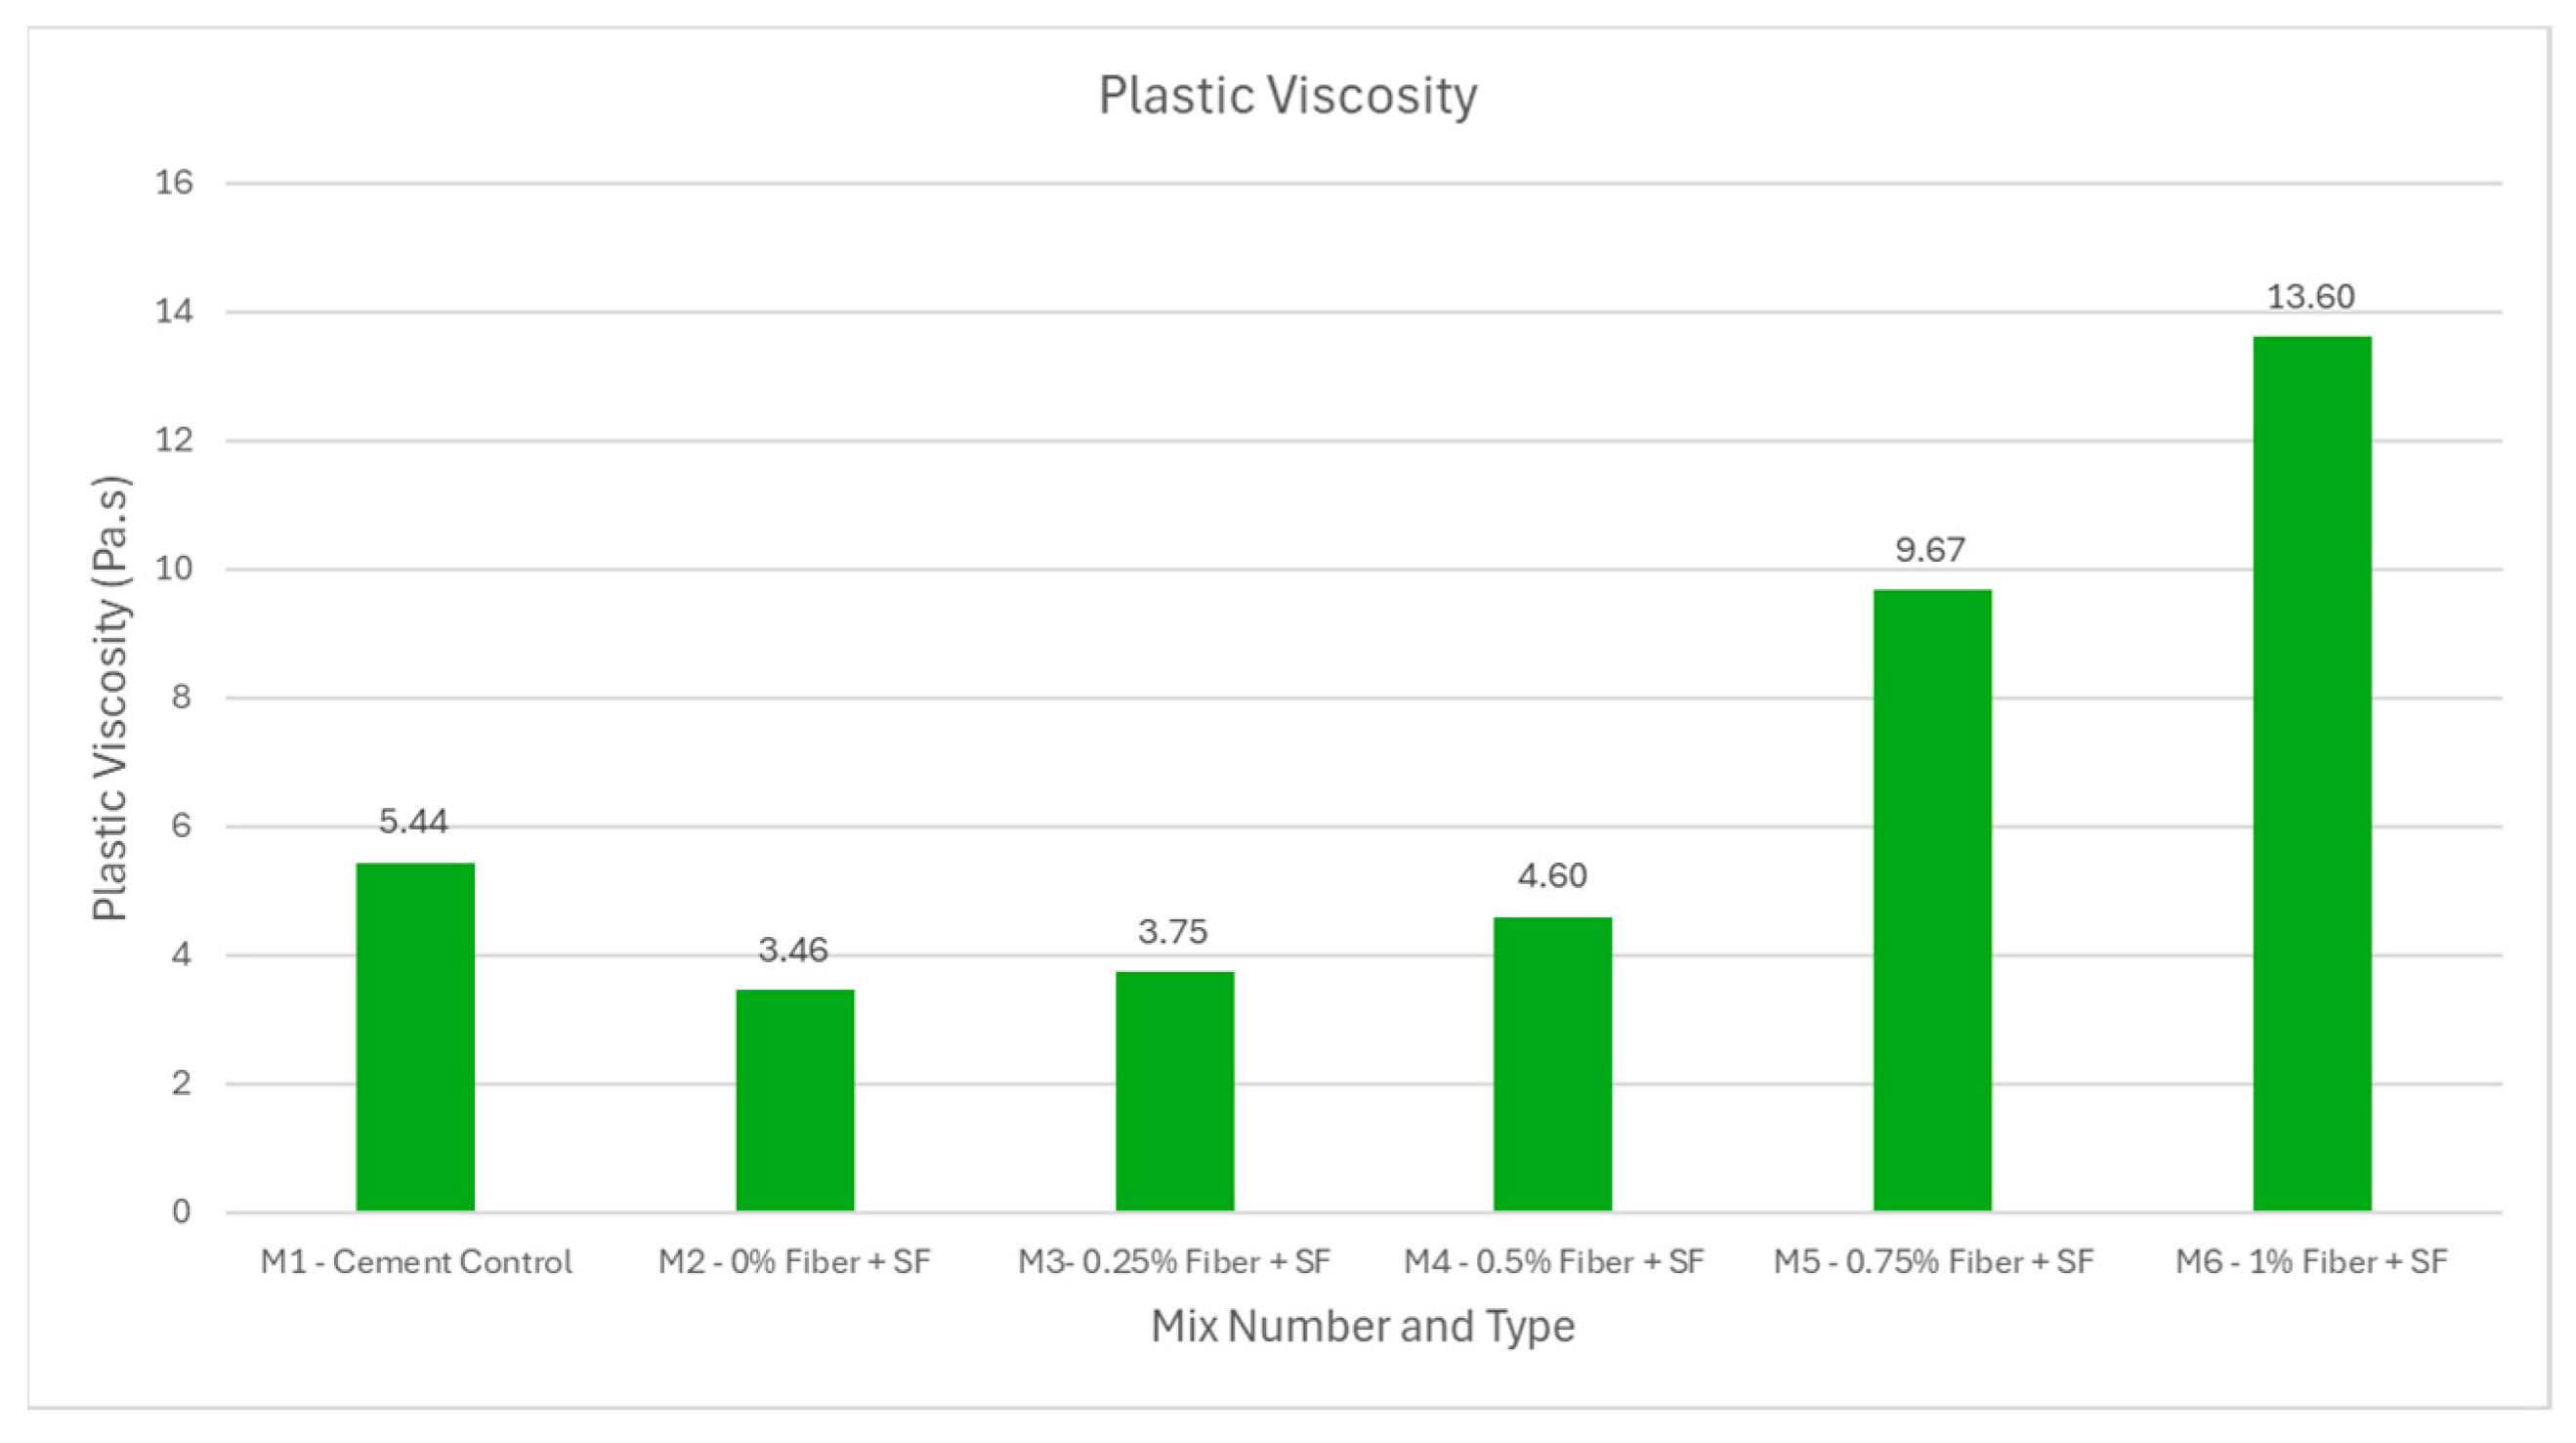
As shown in Figure 13, the incorporation of silica fume reduced the plastic viscosity of the 0% fibre mix (M2) to 3.46 Pa·s compared to 5.44 Pa·s for the cement control (M1), indicating an improved flowability caused by particle lubrication and packing effect [51]. With the addition of fibres up to 0.5% (M3–M4), plastic viscosity remained in a narrow range between 3.75 and 4.60 Pa·s, suggesting that silica fume facilitated fibre dispersion and mitigated excessive fibre–matrix friction. A marked increase was observed at higher fibre dosages, with M5 (0.75% fibre) reaching 9.67 Pa·s and M6 (1% fibre) increasing significantly to 13.60 Pa·s. This phenomenon can be attributed to fibre clustering and reduced free water content, which intensify internal resistance during shearing. In terms of 3D printability, lower plastic viscosity values (M2–M4) are favourable for pumping efficiency and extrusion stability but may reduce buildability if the mixture becomes too fluid. The significantly higher viscosity at 0.75% and 1% fibre dosage (M5–M6) indicate the improved shape retention and structural stability of printed layers, although this reduces pumpability and increases the risk of nozzle blockage. The observed trend is consistent with findings by Dong et al. [52], where silica fume initially reduced viscosity through particle lubrication but subsequently led to increased viscosity at higher contents due to matrix densification and intensified particle interactions. This effect was further amplified in this study by the combined influence of cellulose fibres and silica fume.
Thixotropy
Thixotropy refers to the reversible and time-dependent reduction in viscosity when a material is subjected to shear stress or shear rate [53]. To quantify thixotropic behaviour, a three-interval rheological protocol was employed, as reported by Panda et al. [54]. The procedure consisted of three steps: (i) applying a low shear rate of 0.5 s−1 for 200 s to allow structural build-up; (ii) applying a high shear rate of 100 s−1 for 30 s to induce structural breakdown; and (iii) reapplying a low shear rate of 0.5 s−1 for 30 s to evaluate structural recovery. This approach enables the assessment of both the breakdown and rebuilding capacity of the material, thereby characterizing its thixotropy.
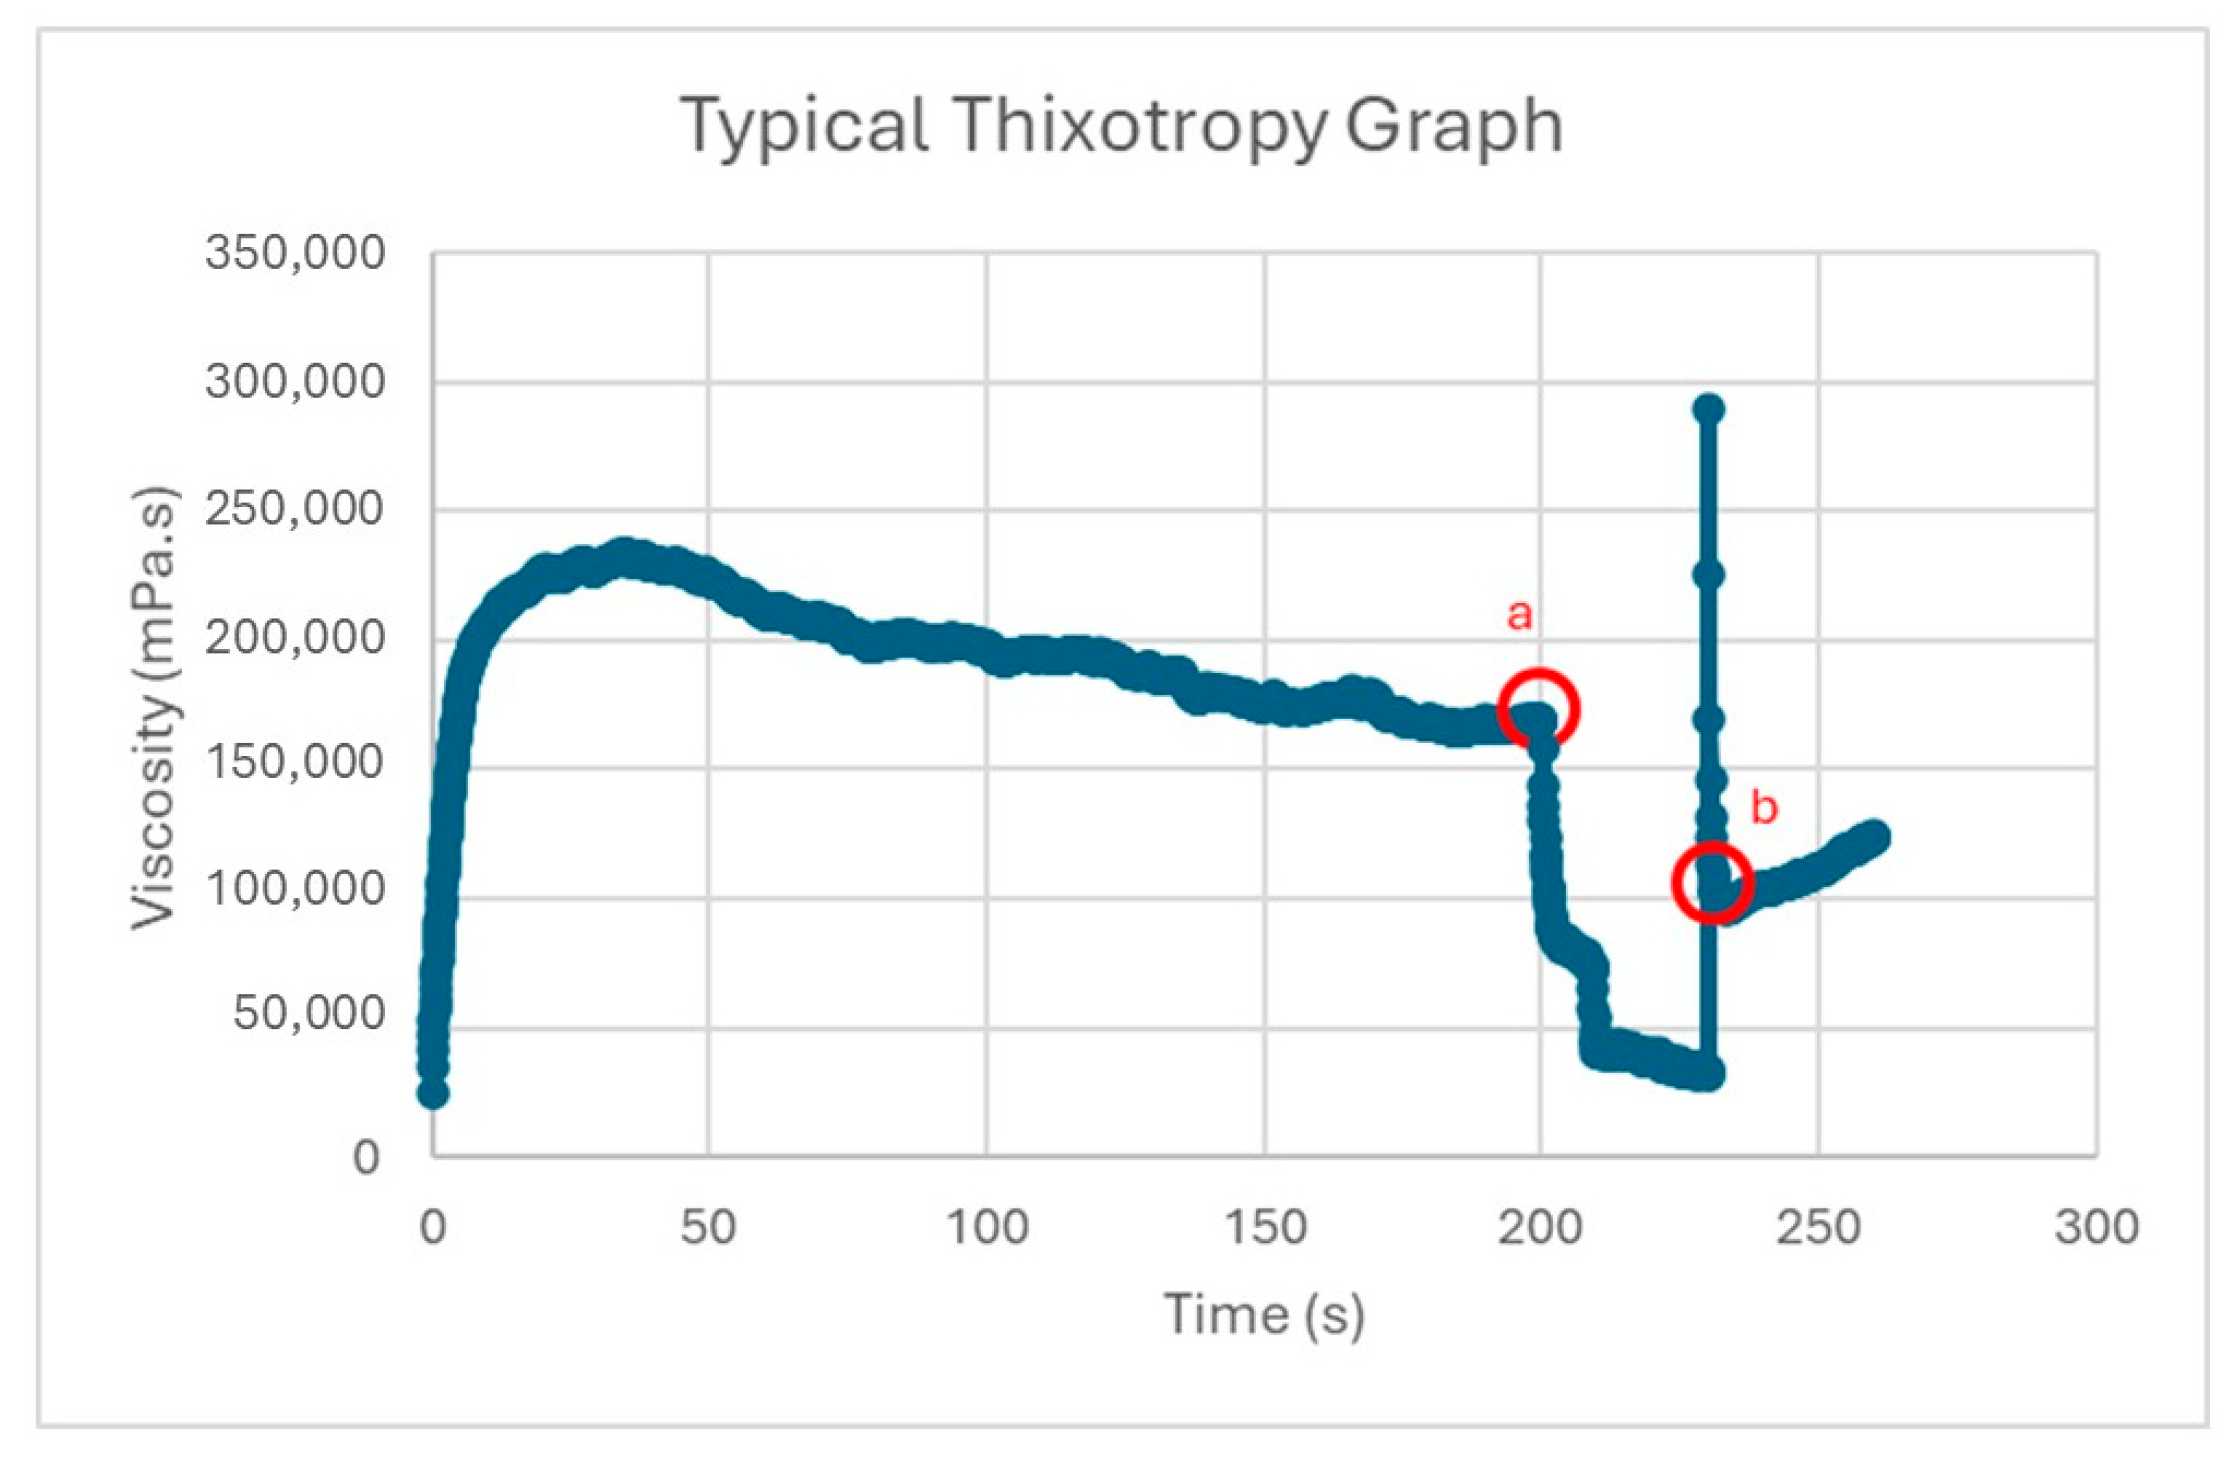
Thixotropy was quantified using Equation (3), which calculates the absolute difference between the final data points of intervals 1 and 2, labelled as “a” and “b” in Figure 14.
T h i x o t r o p y = μ a μ b
This value represents the amount of structure lost under shear. A high value relates to a high structure build-up at rest and a high shear loss under structural breakdown.
As shown in Figure 15, the cement control mix (M1) exhibited a thixotropy value of 44,235.6 mPa·s, whereas the addition of silica fume without fibres (M2) markedly reduced it to 1150.6 mPa·s. This reduction indicates that the particle lubrication effect of silica fume significantly suppressed structural rebuilding. With the inclusion of fibres, thixotropy increased gradually at lower dosages, reaching 2592 mPa·s at 0.25% fibre (M3) and 8623 mPa·s at 0.5% fibre (M4). A further increase to 13,383 mPa·s was observed at 0.75% fibre (M5), suggesting that fibre–matrix interactions progressively promoted structural build-up. At 1% fibre content (M6), thixotropy increased significantly to 135,342 mPa·s, more than an order of magnitude higher than the other fibre-containing mixes, reflecting excessive structuration and strong resistance to flow recovery.
From a 3D printing perspective, moderate thixotropy is advantageous because it enables extruded filaments to rebuild structure quickly after deposition, thereby supporting buildability and preventing layer deformation. However, very low thixotropy may result in poor shape retention, as observed in M2, while excessively high values can lead to nozzle blockage and unstable extrusion due to over-structuring, such as in M6. The interplay between silica fume and fibres therefore governs the balance between lubrication and structuration, where silica fume initially reduces thixotropy, but higher fibre dosages dominate the behaviour by reinforcing particle–fibre networks. This observation is consistent with findings by Mao et al. [55], who reported that the incorporation of silica fume and fibres can synergistically alter thixotropic recovery depending on dosage.

4.2. Hardened State Results

4.2.1. Compressive Strength

The compressive strength results at 7 and 28 days are shown in Figure 16. The cement control mix (M1) achieved 98.93 MPa at 7 days and 102.19 MPa at 28 days, representing a modest strength development of 3%. The inclusion of silica fume without fibres (M2) significantly enhanced performance with strengths of 92.67 MPa at 7 days and 119.04 MPa at 28 days, corresponding to a 28% increase. This improvement can be attributed to the pozzolanic activity and filler effect of silica fume, which refined the pore structure and promoted long-term hydration.
When fibres were incorporated, the 0.25% fibre mix (M3) showed 93.82 MPa at 7 days and 105.53 MPa at 28 days with a 12% increase, but this was still lower than M2. The reduction compared to the silica fume-only mix may be related to incomplete fibre dispersion or disruption of the matrix continuity at low dosage. At 0.5% fibre (M4), the strength increased again to 82.29 MPa at 7 days and 109.10 MPa at 28 days (a 33% increase). This suggests that a more effective fibre network gradually formed, improving crack resistance and post-cracking load transfer.
However, strength reduced at higher fibre dosages. M5 (0.75% fibre) recorded 76.39 MPa at 7 days and 97.98 MPa at 28 days, while M6 (1% fibre) further dropped to 66.55 MPa at 7 days and 86.06 MPa at 28 days. Although both mixes showed curing-age strength increase (28% and 29%, respectively), the overall compressive strength was lower than the control and silica fume-rich mixes. This reduction can be attributed to increased porosity, fibre clustering, and reduced workability at high fibre contents. Additionally, the densified microstructure generated by silica fume may have amplified the stiffness incompatibility at the fibre–matrix interface, leading to early fibre debonding and pull-out under load [47].

4.2.2. Flexural Strength

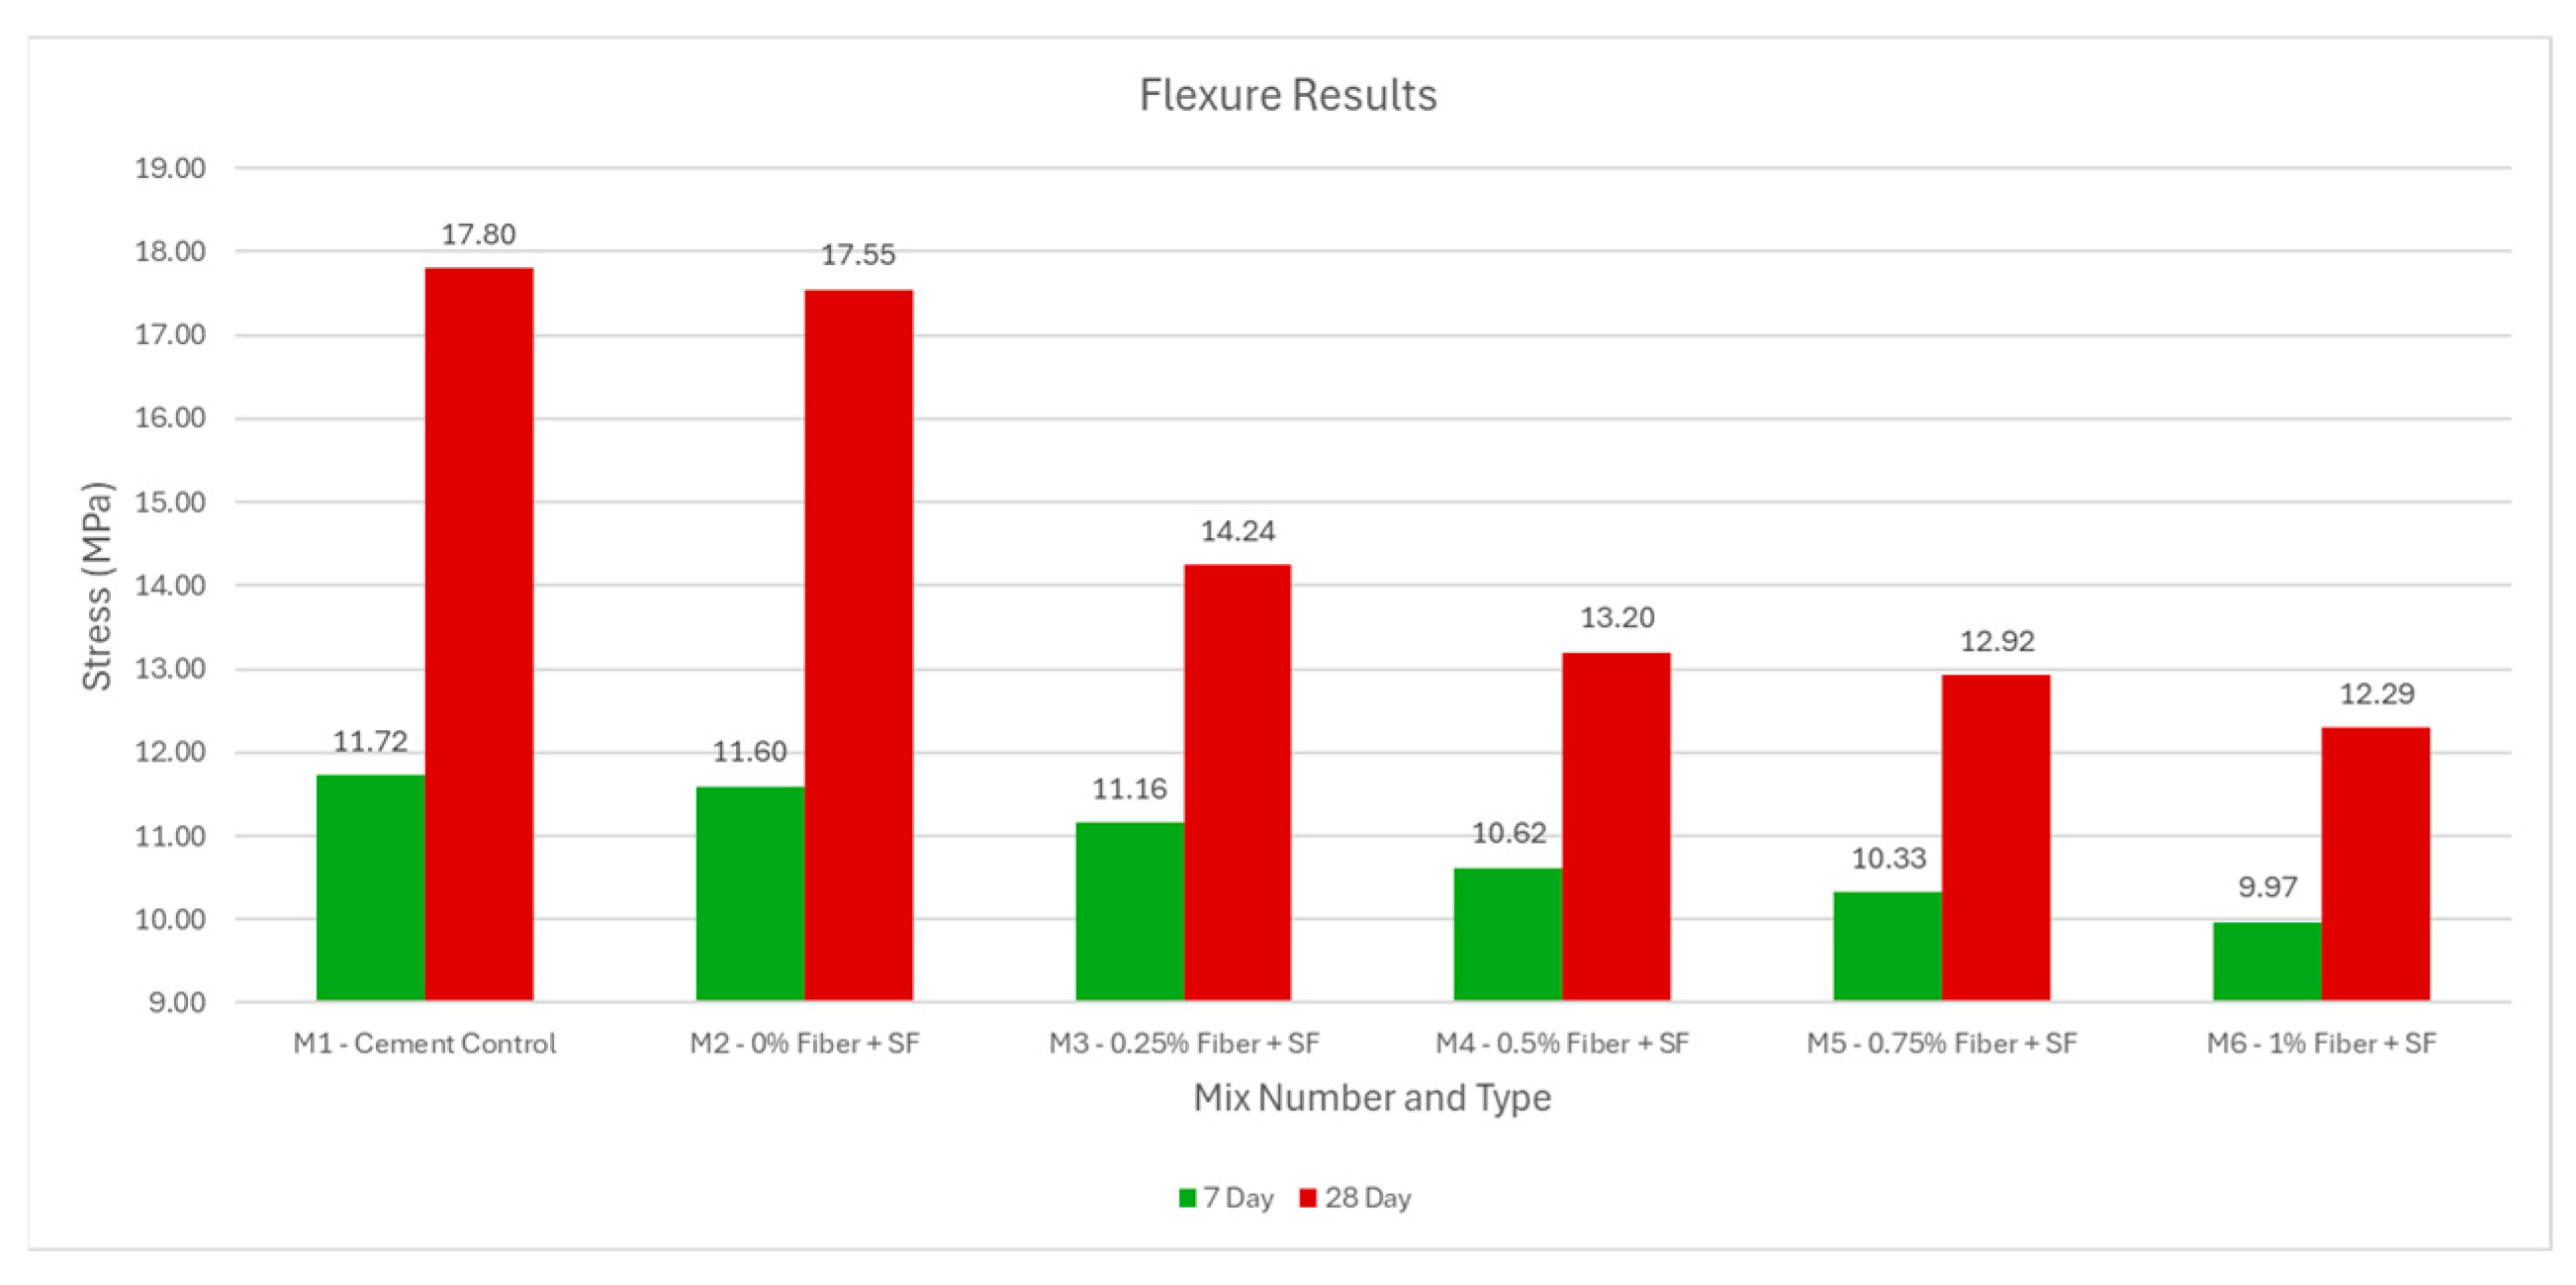
The flexural strength results at 7 and 28 days are presented in Figure 17. The cement control mix (M1) achieved 11.72 MPa at 7 days and 17.80 MPa at 28 days, showing a 52% increase. The inclusion of silica fume without fibres (M2) produced a comparable result of 11.60 MPa at 7 days and 17.55 MPa at 28 days, with a 51% improvement. These values represent the highest flexural strengths, suggesting that silica fume enhances matrix densification and refines the microstructure through its pozzolanic activity and filler effect. With the addition of fibres, a clear decreasing trend in flexural strength is observed. At 0.25% fibre (M3), the value was reduced to 11.16 MPa at 7 days and 14.24 MPa at 28 days, corresponding to only a 28% increase from early to later age, significantly lower than the silica fume-only mix. At 0.5% fibre (M4), flexural strength further decreased to 10.62 MPa at 7 days and 13.20 MPa at 28 days, while at 0.75% (M5) the value declined to 10.33 MPa and 12.92 MPa. The lowest strength was recorded at 1% fibre (M6), with 9.97 MPa at 7 days and 12.29 MPa at 28 days, representing a modest 23% increase.
The reduction in flexural strength with increasing cellulose microfibre dosage can be attributed to fibre clustering and poor dispersion, which generate stress concentrations and reduce effective stress transfer [56]. Unlike nanoscale fibres that can enhance matrix densification at higher dosages, microfibres are less effective in filling pores and more prone to creating weak zones, especially beyond 0.5% dosage. Previous studies using higher fibre contents (up to 5%) reported similar reductions in mechanical performance due to increased porosity and interfacial debonding [57,58]. Furthermore, most existing research focuses on hydration and compressive properties, with fewer studies directly addressing flexural strength, making the observed trend in this study a significant contribution. These combined effects explain why cellulose microfibres at higher dosages reduce flexural performance rather than improve it.

4.2.3. Porosity

The effect of cellulose microfibre addition on porosity was evaluated using image analysis of cross-sections with an area of 50 mm × 50 mm, as shown in Figure 18. Images (a)–(c) present high-resolution camera photographs of the samples, while (d)–(f) show the corresponding binary-processed images obtained using Image-Pro Plus 6.0 software. In the processed images, white regions represent voids and the black background corresponds to the solid matrix. Two key parameters were measured: the total pore area and the maximum pore diameter.
For the matrix containing silica fume but without fibres, the gross pore area was 4.60 mm2, with a maximum pore diameter of 1.81 mm. At a fibre content of 0.5%, the gross pore area increased to 6.24 mm2, with a maximum diameter of 1.86 mm. At 1% fibre content, the gross pore area increased markedly to 12.34 mm2, with a maximum diameter of 2.23 mm. This trend indicates that the addition of cellulose microfibres leads to a progressive increase in porosity, particularly at higher dosages. The increase in pore area and diameter can be attributed to fibre agglomeration and poor dispersion at elevated contents, which disrupts the matrix continuity and promotes void formation. Moreover, the water absorption of cellulose fibres may reduce the effective water content for cement hydration, contributing to incomplete matrix densification [58].
The observed increase in porosity is consistent with the mechanical results presented in Section 4.2.1 and Section 4.2.2, where higher fibre dosages were associated with reduction in compressive and flexural strength. This confirmed that excessive fibre content compromises matrix integrity despite the potential crack-arresting role of fibres. From a 3D printing perspective, increased porosity not only weakens mechanical strength but also affects print quality by reducing interlayer bonding efficiency and buildability, as larger voids hinder the formation of dense, well-adhered filaments.

5. Discussion

5.1. Comparison of Fibre-Induced Mixes Against Reference Mix

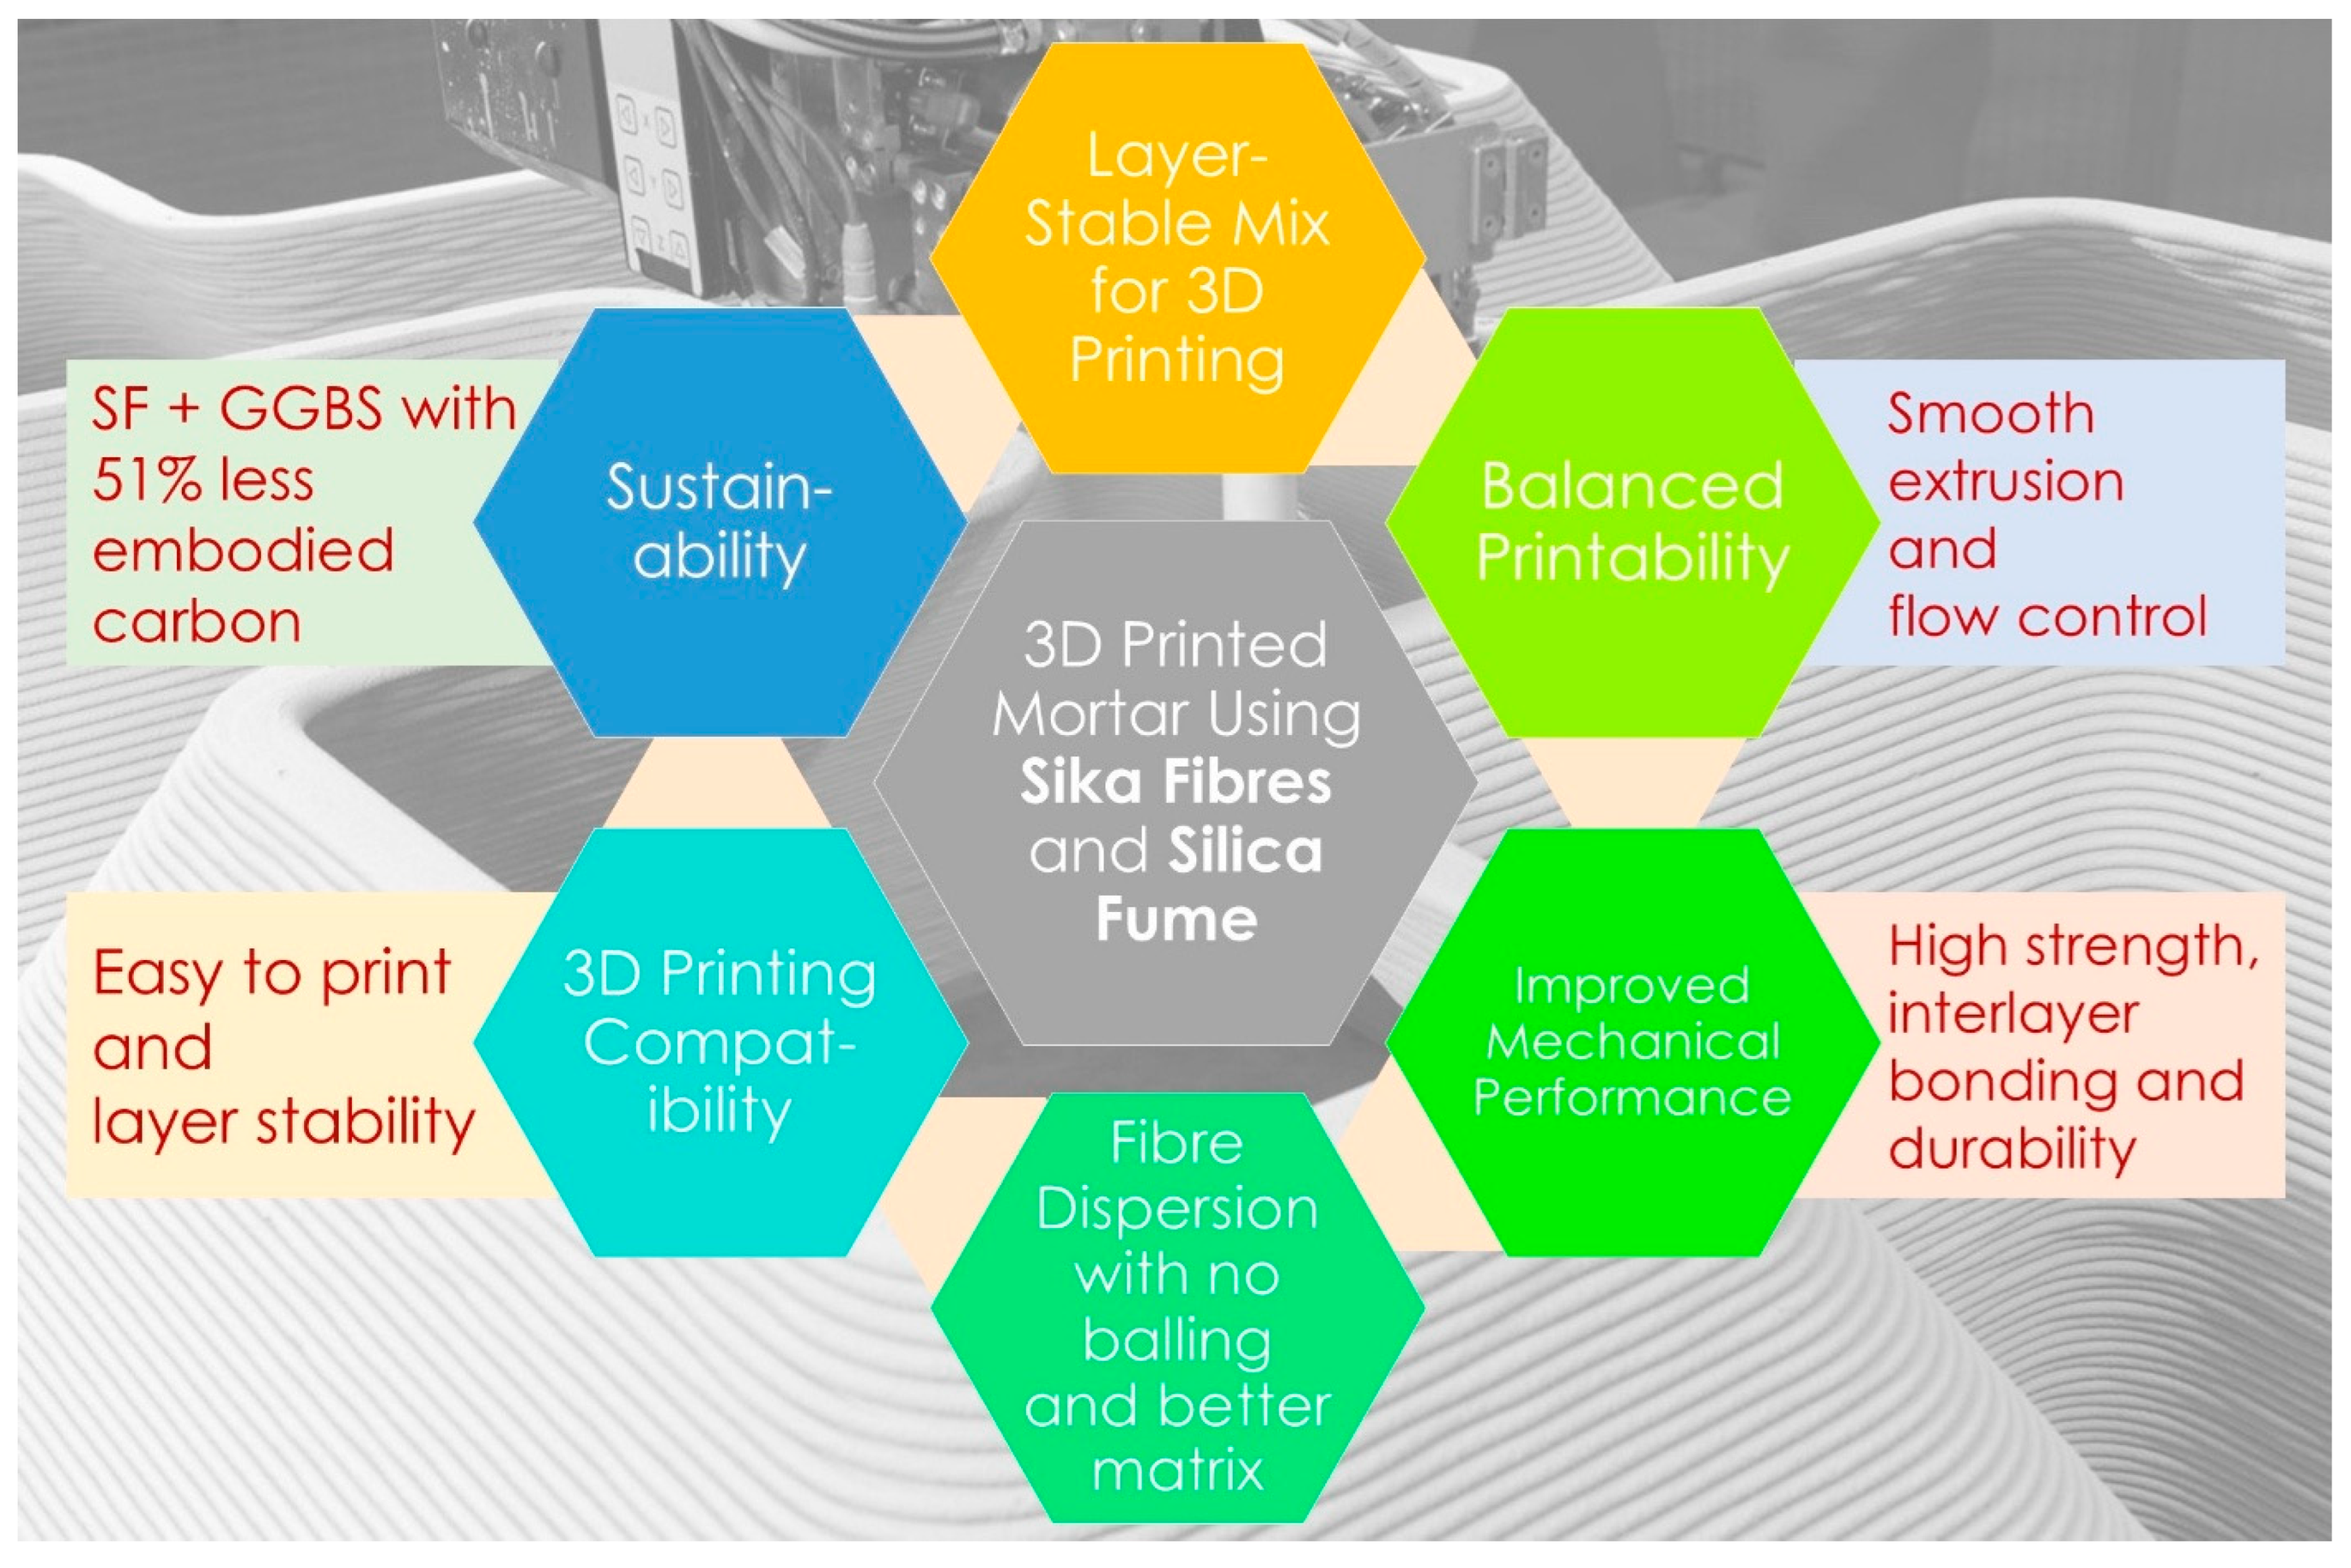
The difference between the fibre-induced mixes and those without fibres can be seen clearly in the fresh and hardened states. The mixes without fibre showed enhanced flowability, highlighting the GGBS and silica fume’s effect on flowability. While the fibres showed no improvement in flowability, their benefits were evident in the increased buildability, structural stability, and mechanical performance (Figure 19). The main trends observed in the mixes were as follows:
  • Buildability improved at all fibre dosages, as static yield stress increased with higher fibre content.
  • Plastic viscosity increased significantly at higher fibre dosages, particularly in mixes without silica fume. This behaviour indicates poor fibre dispersion and clustering, which was partially mitigated by the lubrication effect of silica fume [48].
  • Thixotropic behaviour increased significantly at high fibre dosages, particularly in mixes without silica fume. This indicates that high fibre content promoted structuration and clustering, which were partially mitigated by silica fume and consistent with findings by Mao et al. [55], who reported that silica fume reduces excessive thickening.
  • Each mix exhibited shear thickening behaviour (n > 1), followed by a decrease as fibre content increased. This trend is likely attributed to fibre clustering, which distributes shear more uniformly and aligns with the findings of Jiao et al. [10], indicating that excessive fibre addition reduces shear thickening capacity.
  • The compressive strength decreased with increasing fibre dosage at the 7-day age, possibly due to increased porosity and the samples not reaching sufficient hydration development compared to 28-day curing. The highest compressive strength 119.04 MPa was observed in Mix 2, which incorporated silica fume without fibre. The addition of 0.25% fibre unexpectedly reduced strength, followed by a slight improvement at 0.5%, after which the strength declined again with higher dosages. This early increase may be attributed to the formation of an effective fibre network and improved dispersion at lower fibre contents.
  • The flexural strength showed a steady reduction at both 7-day and 28-day curing ages, possibly due to the combined presence of fibres and silica fume causing excessive matrix densification, which subsequently affected strength at higher fibre dosages.

5.2. 3D-Printing Implications

5.2.1. Extrudability and Shape Retention

Based on Table 3, which summarizes findings from the literature, a consistent rheological window can be identified to balance extrudability and shape retention in extrusion-based 3D printing of cementitious materials. The dynamic yield stress generally needs to be maintained within the range of 300–800 Pa, as mixtures with values below this threshold tend to exhibit excessive flowability and filament collapse, while those exceeding ~900–1000 Pa often result in discontinuous extrusion or nozzle blockage. Similarly, the plastic viscosity is critical to ensuring smooth flow through the nozzle while avoiding blockage or segregation; values in the range of 5–15 Pa·s were associated with successful extrusion and stable layer formation. For example, Fasihi and Libre [59] reported stable extrusion between 108 and 263 Pa and between 5.1 and 16.4 Pa·s, while Nerella et al. [60] demonstrated printable mortars with dynamic yield stresses of ~300–600 Pa and viscosity near 5–6 Pa·s. At the higher range, mixtures modified with viscosity-modifying agents (VMAs) or nanoclays (NCs) achieved printable static yield stresses above 2000 Pa, but the corresponding dynamic yield stress still remained within 300–900 Pa [61]. Taken together, these results suggest that maintaining dynamic yield stress in the range of 300–800 Pa and plastic viscosity between 5 and 15 Pa·s provides the most reliable compromise. This balance ensures sufficient resistance to deformation for shape retention while enabling continuous and energy-efficient extrusion.
In comparison, the results of this study demonstrate that the incorporation of cellulose microfibres within a silica fume–GGBS matrix also supports this balance when used at moderate dosages. At 0.25–0.5% fibre content (M3–M4), the dynamic yield stress increased modestly from 6.17 Pa (M2) to 32.75 Pa (M3), representing a 4.3-fold increase, while plastic viscosity increased from 3.46 Pa·s to 4.60 Pa·s with a 32.9% increase. Although these absolute values are lower than the ranges typically reported in the literature, they fall within the relative rheological window required for continuous pumping and stable filament deposition, which offered good extrudability and sufficient structuration for shape retention. However, the rheological parameters elevated significantly when fibre dosage exceeded 0.75% (M5–M6). Dynamic yield stress increased from 6.17 Pa (M2) to 81.97 Pa (M5) and 248.59 Pa (M6), while plastic viscosity increased from 3.46 Pa·s to 9.67 Pa·s and 13.60 Pa·s, reflecting increases of up to 39.3-fold and 293%, respectively. These magnified values exceeded the workable range, reducing workability, increasing extrusion resistance and risking nozzle clogging. The slump flow results confirm this trend, as stable spreading was observed at 0.25–0.5% fibre content, while the 1% fibre mix exhibited poor workability and irregular flow behaviour. These findings indicate that cellulose microfibres at moderate dosages enhance extrudability and shape retention in line with the literature findings, whereas higher dosages compromise printability despite improving structural build-up.

5.2.2. Buildability

The review of recent buildability-focused studies in Table 4 highlights a consistent rheological window for static yield stress and thixotropy that ensures stable layer stacking in extrusion-based 3DCP. Static yield stress is regarded as the primary indicator of buildability, with values below ~500–800 Pa typically leading to filament collapse under self-weight [66,67], while values above ~2600–3000 Pa accelerate pump blockage or excessive structuration [64,68]. Mixtures with static yield stress in the range of ~1000–2500 Pa were consistently reported to provide sufficient structural stability without compromising extrudability [68,69]. In addition to static yield stress, thixotropy governs the rate of structuration after deposition, ensuring rapid stress recovery to support overlying layers. Effective buildability has been linked to a structuration rate of ~1.0–2.0 kPa/min [68,70], a hysteresis loop area of 2×10⁴–3×10⁴ Pa/s [45], or a static–dynamic yield stress gap of 500–2000 Pa with rate of static yield stress evolution above 2.0 [64]. These findings suggest that maintaining static yield stress between 1000 and 2500 Pa and ensuring a moderate thixotropy response provides the most reliable balance for robust buildability in 3D-printed concretes.
In comparison, the results of this study demonstrate that cellulose microfibres within a silica fume–GGBS matrix produced relative rheological enhancements that supported buildability, though the absolute values were lower than reference ranges. The static yield stress increased from 1.19 Pa in the silica fume-only mix (M2) to 6.84 Pa and 9.35 Pa at 0.25% and 0.5% fibre (M3–M4) with 4.7-fold and 6.9-fold increase, respectively, which improved filament stability without impairing extrusion. At higher dosages, static yield stress increased significantly to 67.86 Pa and 208.25 Pa at 0.75% and 1% fibre, equivalent to 56-fold and 174-fold increases; this may cause excessive resistance and reduced extrudability. Thixotropy exhibited a similar trend: it decreased to 1150.6 mPa·s with silica fume alone (M2), then increased to 2592 mPa·s at 0.25% fibre and 8623 mPa·s at 0.5% fibre (1.3-fold and 6.5-fold increases), thereby enhancing structural recovery and layer retention. Beyond 0.75% fibre, thixotropy gradually increased and reached 135,342 mPa·s in M6, which is an increase of more than 116-fold compared to M2, leading to excessive structuration and poor extrusion stability. Overall, these results indicate that an optimal fibre dosage of 0.25–0.5% provides the best compromise for buildability, as static yield stress and thixotropy are sufficiently enhanced to stabilize layers while avoiding the excessive rheological resistance observed at higher fibre contents.

5.2.3. Mechanical Performance

Mechanical performance is critical in 3D-printed concrete to ensure that extruded filaments can resist self-weight, support successive layers, and maintain long-term stability. In this study, a 0.5% fibre dosage provided the most balanced performance. At this dosage, compressive strength reached 109.10 MPa at 28 days with an increase of 33% from 7 days, which was attributed to improved crack resistance and post-cracking load transfer. However, flexural strength was 13.20 MPa and lower than the silica fume-only mix (17.55 MPa), indicating that cellulose microfibres were less effective for flexural reinforcement than synthetic or macro fibres. Beyond this dosage both compressive and flexural strength decreased significantly. In M6 (1% fibre), the values dropped to 86.06 MPa and 12.29 MPa, respectively, which correlated with a significantly increase in porosity from 4.60 mm2 in M2 to 12.34 mm2 in M6. This reduction can be attributed to fibre clustering, poor dispersion, and the densified microstructure induced by silica fume, which amplified mechanical incompatibility at the fibre–matrix interface and led to early debonding and pull-out. These results imply that in 3D-printed concrete, cellulose microfibres at moderate dosages (0.25–0.5%) can enhance compressive behaviour and contribute to structural stability. However, excessive contents compromise mechanical integrity and interlayer bonding, while the silica fume-only mix achieved the highest overall strengths.

5.2.4. Sustainability

The sustainability of the investigated mortars was evaluated through a cradle-to-gate carbon footprint analysis, following the guidelines of EN 15804 [71] and ISO 21930 [72]. As shown in Table 5 and Table 6, cement exhibited the highest carbon intensity (678 kg CO2-e/m3), while GGBS and silica fume demonstrated substantially lower values at 34 and 7.6 kg CO2-e/m3, respectively. The incorporation of GGBS was particularly effective in reducing the embodied carbon of the mixture. Compared to the reference mix composed entirely of cement (718.4 kg CO2-e/m3), the blend containing 50% GGBS and 5% silica fume (M2) achieved a reduction of 49.5%, diminishing emissions to 362.9 kg CO2-e/m3. These results highlight that binder composition, especially the degree of cement replacement with GGBS, is the dominant factor controlling environmental performance. Overall, the findings demonstrate that adopting high-volume GGBS with partial silica fume substitution offers a practical pathway to nearly halve the carbon footprint of 3D-printed mortars while retaining desirable material properties.

5.2.5. Practical Recommendations and Limitations

  • For 3D printing applications, the dosage of cellulose microfibres should be limited to a maximum of 0.5%, as this level ensures sufficient extrudability, buildability and compressive strength, while avoiding excessive rheological resistance, fibre clustering, and porosity formation observed at higher dosages.
  • The silica fume content should be controlled below 5%, since lower dosages may interact more favourably with fibres by reducing matrix overpacking. However, additional studies are required to confirm the potential benefits of reduced silica fume levels.
  • The present study primarily investigated rheological and mechanical performance using mould-cast specimens, without direct validation under real 3D printing conditions. The absence of layered stacking tests means that the influence of interlayer bonding and anisotropy on structural performance has not yet been evaluated.
  • The micro-level mechanisms of fibre–matrix interaction remain insufficiently explored. While macro-level results show that fibre clustering and porosity affect strength, further work using microstructural analysis techniques (e.g., CT scanning, SEM, or fibre orientation mapping) is necessary to clarify how cellulose microfibres influence hydration, pore refinement, and crack bridging.
  • Future research should focus on full printing trials to validate the printability of these mortars, including filament formation, layer adhesion, and dimensional stability, as well as advanced microscopic investigations to better explain the role of natural microfibres in both rheological response and mechanical behaviour.

6. Conclusions

This study examined the effects of micronized cellulosic fibres and silica fume within GGBS-rich mortars on rheology, mechanical performance, porosity, and sustainability for 3D printing applications. The results show that fibre dosage strongly influences printability by modifying yield stress, viscosity, and thixotropy, which thereby affect flowability, mechanical strength, and porosity. At moderate fibre contents (0.25–0.5%), rheological parameters increased to values that improved extrudability and shape retention while maintaining pumpability and continuous flow. Compressive strength remained high, porosity was contained, and embodied carbon was reduced by nearly half through high-volume GGBS substitution. In contrast, higher fibre dosages (≥0.75%) led to excessive rheological resistance, fibre clustering, and porosity, which compromised both mechanical strength and extrusion stability. These results highlight the critical balance required to optimize both performance and sustainability in 3D-printed mortars. Based on the experimental findings, the following conclusions can be drawn:
  • Slump flow reduced from 285 mm (0% fibre dosage) to 255 mm at 0.5% fibre dosage (−11%) and 202.5 mm at 1% fibre dosage (−29%), consistent with the increase in yield stress and viscosity.
  • Static yield stress increased 7 times at 0.5% fibre dosage and 174 times at 1% fibre, dosage, while thixotropy increased from 1150.6 Pa·s (0% fibre dosage) to 8623 Pa·s (0.5% fibre dosage) and peaked at 135,342 Pa·s (1% fibre dosage). Dynamic yield stress and plastic viscosity remained within printable ranges at 0.25–0.5% fibre dosage (≈30 Pa, 3–5 Pa·s) but increased excessively at higher dosages.
  • At 0.5% fibre, compressive strength reached 109.10 MPa, while flexural strength decreased from 17.55 MPa (0% fibre dosage) to 13.20 MPa (0.5% fibre dosage) and 12.29 MPa (1% fibre dosage) due to fibre clustering and weak fibre–matrix bonding. Porosity increased from 4.60 mm2 (0% fibre dosage) to 12.34 mm2 (1% fibre dosage) with larger voids undermining strength.
  • The ternary binder (50% GGBS + 5% silica fume) reduced embodied carbon by 49.5%, from 718.4 to 362.9 kg CO2-e/m3, confirming binder composition as the dominant environmental factor.
  • A 0.25–0.5% cellulose fibre dosage is identified as optimal, which can provide the best balance of fresh state properties, compressive strength and sustainability. Higher dosages compromise printability through excessive rheological resistance, porosity and flexural strength loss.

Author Contributions

W.S.: Writing—original draft, Visualization, Software, Methodology, Investigation, Formal analysis, Data curation, and Conceptualization. B.H.: Validation, Formal Analysis, Methodology, Investigation, Data Curation, and Writing—Original Draft Preparation. M.K.: Project administration, Writing—review and editing, Methodology, Investigation, Formal analysis, Supervision, Conceptualization, and Funding acquisition. C.M.: Writing—review and editing, Visualization, Methodology, Funding acquisition, Project administration, and Supervision. All authors have read and agreed to the published version of the manuscript.

Funding

This publication emanated from two separate projects. The first is funded by Construct Innovate Technology Centre and Harcourt Technologies Limited (HTL) (Grant Code: CISFC1-23_013). The second is funded by Ecocem Materials and the Science Foundation Ireland (SFI) Research Centre in Applied Geosciences hosted by UCD (iCRAG-Phase 2-Grant Code: 13/RC/2092_P2).

Data Availability Statement

The original contributions presented in this study are included in the article. Further inquiries can be directed to the corresponding authors.

Acknowledgments

The authors gratefully acknowledge Ecocem Materials Ireland for providing GGBS, Irish Cement for supplying CEM II/A-L 42.5N, Roadstone for providing aggregates, and Sika Ireland Ltd. for supplying the superplasticizer, silica fume, and Sika fibres.

Conflicts of Interest

The authors declare no conflicts of interest.

References

  1. Jindal, B.B.; Jangra, P. 3D Printed Concrete: A comprehensive review of raw material’s properties, synthesis, performance, and potential field applications. Constr. Build. Mater. 2023, 387, 131614. [Google Scholar] [CrossRef]
  2. Khan, M.; McNally, C. Recent developments on low carbon 3D printing concrete: Revolutionizing construction through innovative technology. Clean. Mater. 2024, 12, 100251. [Google Scholar] [CrossRef]
  3. Ding, T.; Xiao, J.; Zou, S.; Zhou, X. Anisotropic behavior in bending of 3D printed concrete reinforced with fibers. Compos. Struct. 2020, 254, 112808. [Google Scholar] [CrossRef]
  4. Ma, L.; Zhang, Q.; Lombois-Burger, H.; Jia, Z.; Zhang, Z.; Niu, G.; Zhang, Y. Pore structure, internal relative humidity, and fiber orientation of 3D printed concrete with polypropylene fiber and their relation with shrinkage. J. Build. Eng. 2022, 61, 105250. [Google Scholar] [CrossRef]
  5. Ding, T.; Xiao, J.; Zou, S.; Yu, J. Flexural properties of 3D printed fibre-reinforced concrete with recycled sand. Constr. Build. Mater. 2021, 288, 123077. [Google Scholar] [CrossRef]
  6. Bos, F.P.; Bosco, E.; Salet, T.A.M. Ductility of 3D printed concrete reinforced with short straight steel fibers. Virtual Phys. Prototyp. 2018, 14, 160–174. [Google Scholar] [CrossRef]
  7. Zhang, P.; Wang, C.; Gao, Z.; Wang, F. A review on fracture properties of steel fiber reinforced concrete. J. Build. Eng. 2023, 67, 105975. [Google Scholar] [CrossRef]
  8. Hopkins, B.; Si, W.; Khan, M.; McNally, C. Recent Advancements in Polypropylene Fibre-Reinforced 3D-Printed Concrete: Insights into Mix Ratios, Testing Procedures, and Material Behaviour. J. Compos. Sci. 2025, 9, 292. [Google Scholar] [CrossRef]
  9. Liu, X.; Hu, J.; Guo, X. Printability and interlayer bonding property of 3D printed fiber reinforced geopolymer (3DP-FRG). J. Build. Eng. 2024, 87, 109060. [Google Scholar] [CrossRef]
  10. Jiao, D.; Shi, C.; Yuan, Q.; Zhu, D.; De Schutter, G. Effects of rotational shearing on rheological behavior of fresh mortar with short glass fiber. Constr. Build. Mater. 2019, 203, 314–321. [Google Scholar] [CrossRef]
  11. Alami, A.H.; Olabi, A.G.; Ayoub, M.; Aljaghoub, H.; Alasad, S.; Abdelkareem, M.A. 3D Concrete Printing: Recent Progress, Applications, Challenges, and Role in Achieving Sustainable Development Goals. Buildings 2023, 13, 924. [Google Scholar] [CrossRef]
  12. Singh, N.; Colangelo, F.; Farina, I. Sustainable Non-Conventional Concrete 3D Printing—A Review. Sustainability 2023, 15, 10121. [Google Scholar] [CrossRef]
  13. Zhong, H.; Zhang, M. 3D printing geopolymers: A review. Cem. Concr. Compos. 2022, 128, 104455. [Google Scholar] [CrossRef]
  14. Demont, L.; Ducoulombier, N.; Mesnil, R.; Caron, J.-F. Flow-based pultrusion of continuous fibers for cement-based composite material and additive manufacturing: Rheological and technological requirements. Compos. Struct. 2021, 262, 113564. [Google Scholar] [CrossRef]
  15. Zhou, W.; Zhang, Y.; Ma, L.; Li, V.C. Influence of printing parameters on 3D printing engineered cementitious composites (3DP-ECC). Cem. Concr. Compos. 2022, 130, 104562. [Google Scholar] [CrossRef]
  16. Duan, J.; Sun, S.; Chi, S.; Hu, C.; Ling, C.; Fu, H.; Han, Z. Effect of process parameters on forming quality and flexural strength of continuous fiber reinforced cement-based 3D printed composites. Constr. Build. Mater. 2024, 438, 137241. [Google Scholar] [CrossRef]
  17. Gong, F.; Cheng, X.; Zhang, X.; Fang, B. Equipment design and parameters recommendation of rubber modified 3D printed asphalt in pavement maintenance. Constr. Build. Mater. 2024, 431, 136523. [Google Scholar] [CrossRef]
  18. Si, W.; Khan, M.; McNally, C. A Comprehensive Review of Rheological Dynamics and Process Parameters in 3D Concrete Printing. J. Compos. Sci. 2025, 9, 299. [Google Scholar] [CrossRef]
  19. Ahi, O.; Ertunç, Ö.; Bundur, Z.B.; Bebek, Ö. Automated flow rate control of extrusion for 3D concrete printing incorporating rheological parameters. Autom. Constr. 2024, 160, 105319. [Google Scholar] [CrossRef]
  20. Maroszek, M.; Rudziewicz, M.; Hutyra, A.; Dziura, P.; Hebda, M. Evaluation of 3D Concrete Printing Extrusion Efficiency. Appl. Sci. 2024, 14, 11866. [Google Scholar] [CrossRef]
  21. Cai, J.; Wang, J.; Zhang, Q.; Du, C.; Meloni, M.; Feng, J. State-of-the-art of mechanical properties of 3D printed concrete. Case Stud. Constr. Mater. 2024, 21, e03847. [Google Scholar] [CrossRef]
  22. Warsi, S.B.F.; Panda, B.; Biswas, P. Exploring fibre addition methods and mechanical properties of fibre-reinforced 3D printed concrete: A review. Dev. Built Environ. 2023, 16, 100295. [Google Scholar] [CrossRef]
  23. Ahmad, J.; Burduhos-Nergis, D.D.; Arbili, M.M.; Alogla, S.M.; Majdi, A.; Deifalla, A.F. A Review on Failure Modes and Cracking Behaviors of Polypropylene Fibers Reinforced Concrete. Buildings 2022, 12, 1951. [Google Scholar] [CrossRef]
  24. Lin, Z.; Lyu, G.; Fang, K. Carbon emissions assessment of concrete and quantitative calculation of CO2 reduction benefits of SCMs: A case study of C30-C80 ready-mixed concrete in China. Case Stud. Constr. Mater. 2025, 22, e04287. [Google Scholar] [CrossRef]
  25. Amin, M.; Zeyad, A.M.; Tayeh, B.A.; Agwa, I.S. Effect of ferrosilicon and silica fume on mechanical, durability, and microstructure characteristics of ultra high-performance concrete. Constr. Build. Mater. 2022, 320, 126233. [Google Scholar] [CrossRef]
  26. Singh, R.P.; Vanapalli, K.R.; Cheela, V.R.S.; Peddireddy, S.R.; Sharma, H.B.; Mohanty, B. Fly ash, GGBS, and silica fume based geopolymer concrete with recycled aggregates: Properties and environmental impacts. Constr. Build. Mater. 2023, 378, 131168. [Google Scholar] [CrossRef]
  27. Ibrahim, K.A.; van Zijl, G.P.; Babafemi, A.J. Comparative studies of LC3- and fly ash-based blended binders in fibre-reinforced printed concrete (FRPC): Rheological and quasi-static mechanical characteristics. J. Build. Eng. 2023, 80, 108016. [Google Scholar] [CrossRef]
  28. Si, W.; Carr, L.; Zia, A.; Khan, M.; McNally, C. Advancing 3D Printable Concrete with Nanoclays: Rheological and Mechanical Insights for Construction Applications. J. Compos. Sci. 2025, 9, 449. [Google Scholar] [CrossRef]
  29. Kurda, R.; de Brito, J.; Silvestre, J.D. Carbonation of concrete made with high amount of fly ash and recycled concrete aggregates for utilization of CO2. J. CO2 Util. 2019, 29, 12–19. [Google Scholar] [CrossRef]
  30. Si, W.; Khan, M.; McNally, C. Effect of nano silica with high replacement of GGBS on enhancing mechanical properties and rheology of 3D printed concrete. Results Eng. 2025, 27, 106680. [Google Scholar] [CrossRef]
  31. I.S. EN 197-1:2011; Cement—Part 1: Composition, Specifications and Conformity Criteria for Common. National Standards Authority of Ireland: Dublin, Ireland, 2011.
  32. I.S. EN 15167-1:2006; Ground Granulated Blast Furnace Slag for Use in Concrete, Mortar and Grout—Part 1: Definitions, Specifications and Conformity Criteria. National Standards Authority of Ireland: Dublin, Ireland, 2016.
  33. I.S. EN 13263-1:2005+A1:2009; Silica Fume for Concrete—Part 1: Definitions, Requirements and Conformity Criteria. National Standards Authority of Ireland: Dublin, Ireland, 2009.
  34. I.S. EN 196-1:2016; Methods of Testing Cement—Part 1: Determination of Strength. National Standards Authority of Ireland: Dublin, Ireland, 2016.
  35. I.S. EN 934-2:2009+A1:2012; Admixtures for Concrete, Mortar and Grout—Part 2: Concrete Admixtures—Definitions, Requirements, Conformity, Marking and Labelling. National Standards Authority of Ireland: Dublin, Ireland, 2012.
  36. ASTM C230/C230M-20; Standard Specification for Flow Table for Use in Tests of Hydraulic Cement. ASTM International: West Conshohocken, PA, USA, 2020.
  37. Li, Q.; Fan, Y.; Shah, S.P. Rheological Properties and Structural Build-Up of Cement Based Materials with Addition of Nanoparticles: A Review. Buildings 2022, 12, 2219. [Google Scholar] [CrossRef]
  38. Mezger, T.G. The Rheology Handbook; No. 9783748600367; Vincentz Network: Hannover, Germany, 2012. [Google Scholar]
  39. I.S. EN 1015-11:2019; Methods of Test for Mortar for Masonry—Part 11: Determination of Flexural and Compressive Strength of Hardened Mortar. National Standards Authority of Ireland: Dublin, Ireland, 2019.
  40. Ivanova, I.; Mechtcherine, V. Possibilities and challenges of constant shear rate test for evaluation of structural build-up rate of cementitious materials. Cem. Concr. Res. 2020, 130, 105974. [Google Scholar] [CrossRef]
  41. Yuan, Q.; Zhou, D.; Khayat, K.H.; Feys, D.; Shi, C. On the measurement of evolution of structural build-up of cement paste with time by static yield stress test vs. small amplitude oscillatory shear test. Cem. Concr. Res. 2017, 99, 183–189. [Google Scholar] [CrossRef]
  42. Rahman, M.; Baluch, M.; Malik, M. Thixotropic behavior of self compacting concrete with different mineral admixtures. Constr. Build. Mater. 2014, 50, 710–717. [Google Scholar] [CrossRef]
  43. Feys, D.; De Schutter, G.; Verhoeven, R. Parameters influencing pressure during pumping of self-compacting concrete. Mater. Struct. 2013, 46, 533–555. [Google Scholar] [CrossRef]
  44. Perrot, A.; Lecompte, T.; Khelifi, H.; Brumaud, C.; Hot, J.; Roussel, N. Yield stress and bleeding of fresh cement pastes. Cem. Concr. Res. 2012, 42, 937–944. [Google Scholar] [CrossRef]
  45. Lee, K.-W.; Lee, H.-J.; Choi, M.-S. Correlation between thixotropic behavior and buildability for 3D concrete printing. Constr. Build. Mater. 2022, 347, 128498. [Google Scholar] [CrossRef]
  46. Jayathilakage, R.; Rajeev, P.; Sanjayan, J. Rheometry for Concrete 3D Printing: A Review and an Experimental Comparison. Buildings 2022, 12, 1190. [Google Scholar] [CrossRef]
  47. Khan, M.; Cao, M.; Hussain, A.; Chu, S. Effect of silica-fume content on performance of CaCO3 whisker and basalt fiber at matrix interface in cement-based composites. Constr. Build. Mater. 2021, 300, 124046. [Google Scholar] [CrossRef]
  48. Wu, Z.; Khayat, K.H.; Shi, C. Changes in rheology and mechanical properties of ultra-high performance concrete with silica fume content. Cem. Concr. Res. 2019, 123, 105786. [Google Scholar] [CrossRef]
  49. Hanratty, N.; Khan, M.; McNally, C. The Role of Different Clay Types in Achieving Low-Carbon 3D Printed Concretes. Buildings 2024, 14, 2194. [Google Scholar] [CrossRef]
  50. Mohan, M.K.; Rahul, A.; Van Tittelboom, K.; De Schutter, G. Rheological and pumping behaviour of 3D printable cementitious materials with varying aggregate content. Cem. Concr. Res. 2021, 139, 106258. [Google Scholar] [CrossRef]
  51. Jiao, D.; Shi, C.; Yuan, Q.; An, X.; Liu, Y.; Li, H. Effect of constituents on rheological properties of fresh concrete—A review. Cem. Concr. Compos. 2017, 83, 146–159. [Google Scholar] [CrossRef]
  52. Dong, D.; Huang, Y.; Pei, Y.; Zhang, X.; Cui, N.; Zhao, P.; Hou, P.; Lu, L. Effect of spherical silica fume and fly ash on the rheological property, fluidity, setting time, compressive strength, water resistance and drying shrinkage of magnesium ammonium phosphate cement. J. Build. Eng. 2023, 63, 105484. [Google Scholar] [CrossRef]
  53. Roussel, N.; Ovarlez, G.; Garrault, S.; Brumaud, C. The origins of thixotropy of fresh cement pastes. Cem. Concr. Res. 2012, 42, 148–157. [Google Scholar] [CrossRef]
  54. Panda, B.; Unluer, C.; Tan, M.J. Investigation of the rheology and strength of geopolymer mixtures for extrusion-based 3D printing. Cem. Concr. Compos. 2018, 94, 307–314. [Google Scholar] [CrossRef]
  55. Mao, Y.; Jiao, D.; Hu, X.; Jiang, Z.; Shi, C. Effect of dispersion behavior of silica fume on the rheological properties and early hydration characteristics of ultra-high strength mortar. Cem. Concr. Compos. 2024, 152, 105654. [Google Scholar] [CrossRef]
  56. Peters, S.J.; Rushing, T.S.; Landis, E.N.; Cummins, T.K. Nanocellulose and Microcellulose Fibers for Concrete. Transp. Res. Rec. J. Transp. Res. Board 2010, 2142, 25–28. [Google Scholar] [CrossRef]
  57. Masoudzadeh, F.; Fasihi, M.; Jamshidi, M. The influence of cellulose pulp and cellulose microfibers on the flexural performance of green-engineered cementitious composites. J. Part. Sci. Technol. 2017, 3, 33–40. [Google Scholar] [CrossRef]
  58. Hoyos, C.G.; Cristia, E.; Vázquez, A. Effect of cellulose microcrystalline particles on properties of cement based composites. Mater. Des. 2013, 51, 810–818. [Google Scholar] [CrossRef]
  59. Fasihi, A.; Libre, N.A. Interaction between material and process parameters during 3D concrete extrusion process. Structures 2024, 70, 107678. [Google Scholar] [CrossRef]
  60. Nerella, V.; Näther, M.; Iqbal, A.; Butler, M.; Mechtcherine, V. Inline quantification of extrudability of cementitious materials for digital construction. Cem. Concr. Compos. 2019, 95, 260–270. [Google Scholar] [CrossRef]
  61. Kilic, U.; Ma, J.; Baharlou, E.; Ozbulut, O.E. Effects of viscosity modifying admixture and nanoclay on fresh and rheo-viscoelastic properties and printability characteristics of cementitious composites. J. Build. Eng. 2023, 70, 106355. [Google Scholar] [CrossRef]
  62. Chen, Y.; Figueiredo, S.C.; Yalçinkaya, Ç.; Çopuroğlu, O.; Veer, F.; Schlangen, E. The Effect of Viscosity-Modifying Admixture on the Extrudability of Limestone and Calcined Clay-Based Cementitious Material for Extrusion-Based 3D Concrete Printing. Materials 2019, 12, 1374. [Google Scholar] [CrossRef]
  63. Zhang, C.; Deng, Z.; Chen, C.; Zhang, Y.; Mechtcherine, V.; Sun, Z. Predicting the static yield stress of 3D printable concrete based on flowability of paste and thickness of excess paste layer. Cem. Concr. Compos. 2022, 129, 104494. [Google Scholar] [CrossRef]
  64. De Vlieger, J.; Blaakmeer, J.; Gruyaert, E.; Cizer, Ö. Assessing static and dynamic yield stress of 3D printing mortar with recycled sand: Influence of sand geometry, fineness modulus, and water-to-binder ratio. J. Build. Eng. 2025, 101, 111827. [Google Scholar] [CrossRef]
  65. Nair, S.A.; Panda, S.; Santhanam, M.; Sant, G.; Neithalath, N. A critical examination of the influence of material characteristics and extruder geometry on 3D printing of cementitious binders. Cem. Concr. Compos. 2020, 112, 103671. [Google Scholar] [CrossRef]
  66. Jayathilakage, R.; Rajeev, P.; Sanjayan, J. Yield stress criteria to assess the buildability of 3D concrete printing. Constr. Build. Mater. 2020, 240, 117989. [Google Scholar] [CrossRef]
  67. Chen, M.; Yang, L.; Zheng, Y.; Huang, Y.; Li, L.; Zhao, P.; Wang, S.; Lu, L.; Cheng, X. Yield stress and thixotropy control of 3D-printed calcium sulfoaluminate cement composites with metakaolin related to structural build-up. Constr. Build. Mater. 2020, 252, 119090. [Google Scholar] [CrossRef]
  68. Moeini, M.A.; Hosseinpoor, M.; Yahia, A. 3D printing of cement-based materials with adapted buildability. Constr. Build. Mater. 2022, 337, 127614. [Google Scholar] [CrossRef]
  69. Liu, Z.; Li, M.; Weng, Y.; Wong, T.N.; Tan, M.J. Mixture Design Approach to optimize the rheological properties of the material used in 3D cementitious material printing. Constr. Build. Mater. 2019, 198, 245–255. [Google Scholar] [CrossRef]
  70. Wang, Y.; Jiang, Y.; Pan, T.; Yin, K. The Synergistic Effect of Ester-Ether Copolymerization Thixo-Tropic Superplasticizer and Nano-Clay on the Buildability of 3D Printable Cementitious Materials. Materials 2021, 14, 4622. [Google Scholar] [CrossRef] [PubMed]
  71. EN 15804:2012+A2:2019; Sustainability of Construction Works—Environmental Product Declarations—Core Rules for the Product Category of Construction Products. European Committee for Standardization: Brussels, Belgium, 2019.
  72. ISO 21930:2017; Sustainability in Buildings and Civil Engineering Works—Core Rules for Environmental Product Declarations of Construction Products and Services. International Organization for Standardization: Geneva, Switzerland, 2017.
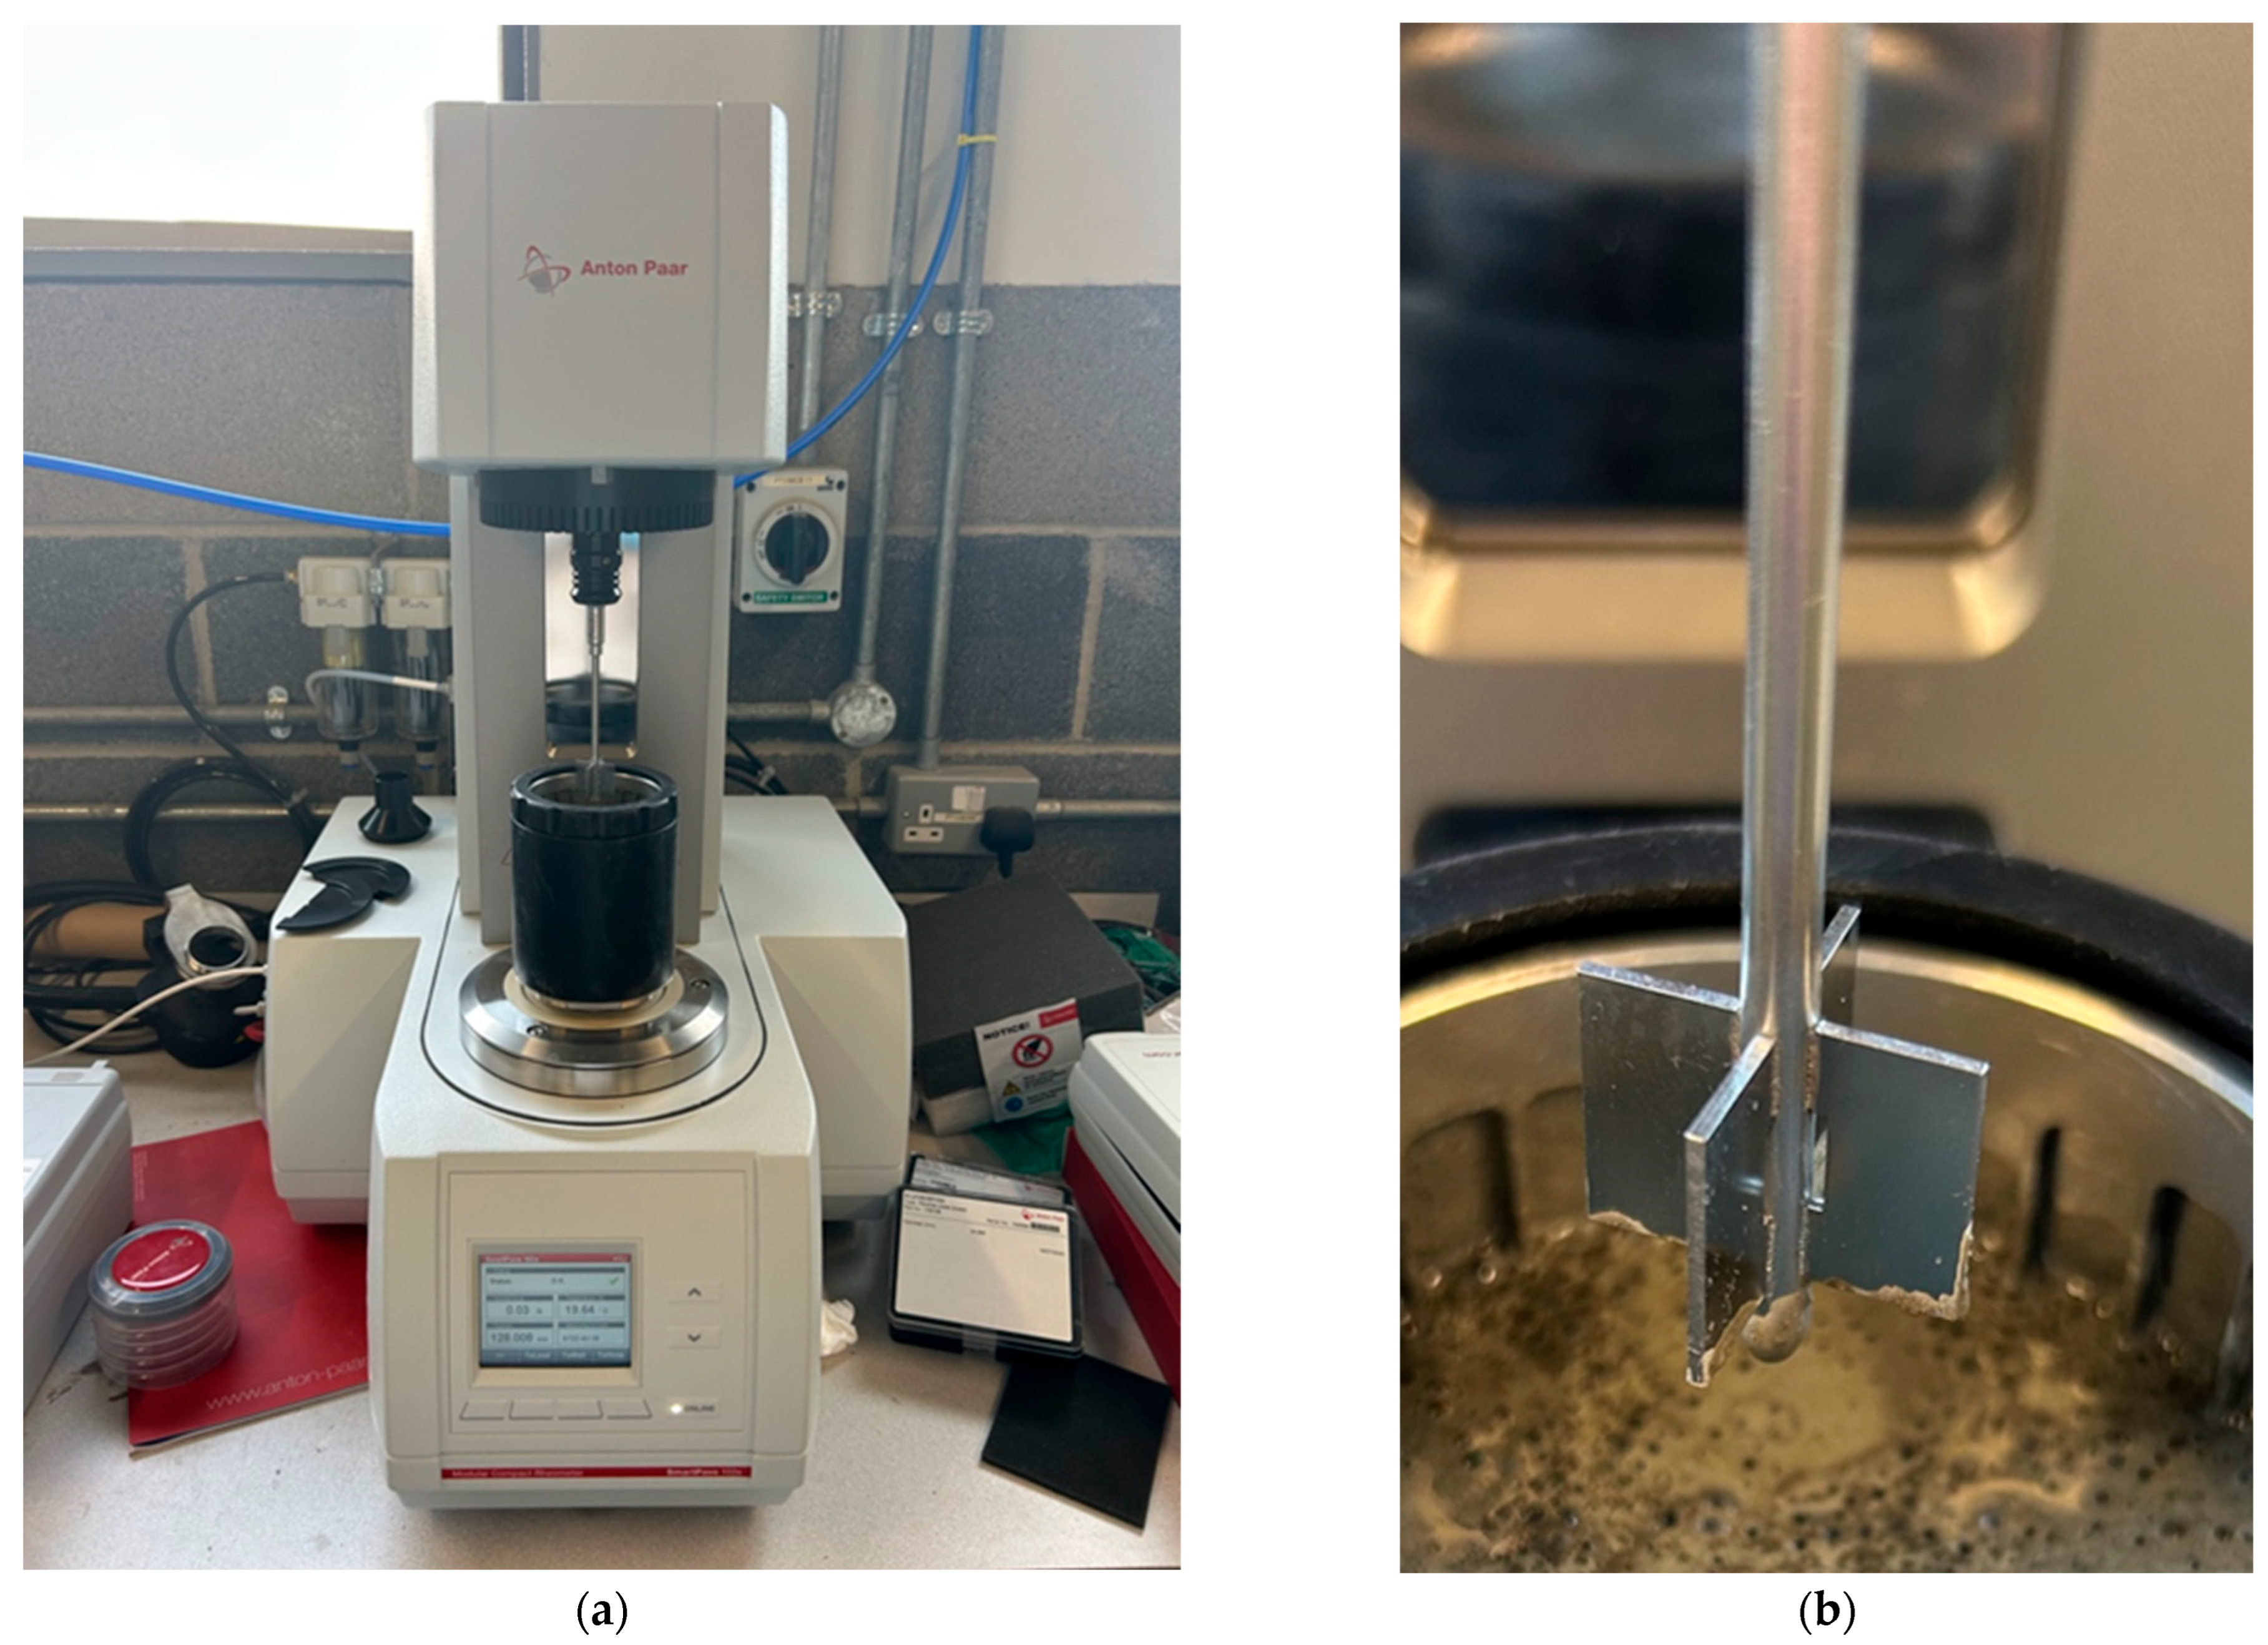
Figure 1. Three-dimensional printing process [12,13].
Buildings 15 03436 g001
Figure 2. (a) Anton Paar MCR 102e SmartPave. (b) Vane.
Buildings 15 03436 g002
Figure 3. Rheological test protocol [30].
Buildings 15 03436 g003
Figure 4. Flow table results.
Buildings 15 03436 g004
Figure 5. Flow table results graph.
Buildings 15 03436 g005
Figure 6. Typical stress vs. time graph for static yield stress.
Buildings 15 03436 g006
Figure 7. Static yield stress.
Buildings 15 03436 g007
Figure 8. Herschel–Bulkley fitting line.
Buildings 15 03436 g008
Figure 9. Flow curves for the mixes.
Buildings 15 03436 g009
Figure 10. Dynamic yield stress for mixes.
Buildings 15 03436 g010
Figure 11. Shear flow index for mixes.
Buildings 15 03436 g011
Figure 12. Modified Bingham fitting line.
Buildings 15 03436 g012
Figure 13. Plastic viscosity.
Buildings 15 03436 g013
Figure 14. Typical thixotropy graph.
Buildings 15 03436 g014
Figure 15. Thixotropy.
Buildings 15 03436 g015
Figure 16. Compression results.
Buildings 15 03436 g016
Figure 17. Flexure Results.
Buildings 15 03436 g017
Figure 18. Porosity cross-sections: (a) high-resolution camera image of M2; (b) high-resolution camera image of M4; (c) high-resolution camera image of M5; (d) binary image of M2; (e) binary image of M4; (f) binary image of M5.
Buildings 15 03436 g018
Figure 19. Benefits of 3D-printed mortar using microfibres and silica fume.
Buildings 15 03436 g019
Table 1. Mix design.
Mix No.Mix NameCement/bGGBS/bSF/bw/bs/bSP/bMicro-Fibre/vol
1Cement Control1000.2610.020.00%
20% Microfibre + SF0.450.50.050.2610.020.00%
30.25% Microfibre + SF0.450.50.050.2610.020.25%
40.5% Microfibre + SF0.450.50.050.2610.020.50%
50.75% Microfibre + SF0.450.50.050.2610.020.75%
61% Microfibre + SF0.450.50.050.2610.021.00%
Table 2. Fibre properties.
Fibre TypeLengthDiameterAspect RatioDensityChemical Concentration (% w/w)Appearance
Cellulose fibres200 μm20 μm101.5 kg/m3≥80Buildings 15 03436 i001
Table 3. Summary of rheological parameters range for better extrudability.
Ref.Mix DesignDynamic Yield Stress (Pa)Static Yield Stress
(Pa)
Plastic Viscosity
(Pa·s)
[62]Adjusted VMA
Cement:Limestone:Calcined Clay = 0.4:0.4:0.2
400–9001000–3000 (by 25–45 min)40–120
[63]Adjusted Nano silica and sand content300–1200500–25005–20
[59]Adjusted water to binder ratio and silica fume content108–263——5.1–16.4
[60]With microsilica and finer sand replacement306/643——5.3–5.8
[64]Adjusted water to binder ratio and recycled sand content218–1105
(printable: 400–800)
298–9000
(printable: 500–2600)
——
[61]Calcium sulfoaluminate (CSA) cement
adjusted VMA and NC contents
73–935
(printable: 300–900)
86–4240 (printable: 1000–4200)351–2361 (relative scale)
[65]Adjusted admixture type and content (flay ash, limestone and microsilica)50–300——0.2–1.0
Table 4. Summary of rheological parameters range for better buildability.
Ref.Mix DesignStatic Yield Stress (Pa)Plastic Viscosity
(Pa·s)
Thixotropy
[67]Adjusted Metakaolin content in CSA cement500–1500 at 25 min2.41–2.56 Pa·sHysteresis area: 15–3.5 × 10⁴ Pa/s; Viscosity recovery degree > 60–70%
[68]Adjusted additives content (NC, fly ash, silica fume)1000–25005–7.5 Pa·sStructuration rate: 0.54–2.34 kPa/min
[45]Adjusted sand to binder ratio1000–2000——Hysteresis area: 20–30 kPa/s
Buildup ratio: 0.77–0.81
[70]Adjusted NC and admixtures1200–17001.6–2.6 Pa·sRate of static yield stress evolution: 1.0–2.0 Pa/s
[66]Time-dependent rheological properties (0–60 min)1200–2000——Structuration rate: 0.02 kPa/min
Table 5. CO2 emission factors (kg CO2-e/m3).
ConstituentCementGGBSSandSPSF
Carbon factor 67834333697.6
Table 6. Carbon reduction in binder.
Mixkg CO2-e/m3Reduction (%)
100% Cement (M1)718.4-
50% GGBS/45% Cement/5% Silica Fume (M2)362.949.5
Disclaimer/Publisher’s Note: The statements, opinions and data contained in all publications are solely those of the individual author(s) and contributor(s) and not of MDPI and/or the editor(s). MDPI and/or the editor(s) disclaim responsibility for any injury to people or property resulting from any ideas, methods, instructions or products referred to in the content.