1. Introduction
Green infrastructure has emerged as a key strategy for adapting urban environments to climate change and mitigating the negative impacts of urbanization [
1]. Among various approaches, vegetated constructions such as green façades, living walls, and especially green roofs are increasingly being applied in cities worldwide [
2]. Their integration into buildings contributes significantly to the overall green infrastructure of urban areas and helps reintroduce vegetation into densely built and industrialized landscapes [
3]. The multifunctional benefits of vegetated roofs include improved stormwater management [
4,
5], enhanced biodiversity [
6], better air quality [
7], mitigation of the urban heat island (UHI) effect [
8,
9], and extended roof membrane durability [
10]. From the perspective of building physics, green roofs reduce surface temperatures, buffer heat transfer into the interior, and contribute to lowering cool energy demand during hot periods, making them an effective passive design measure [
11,
12].
Within this group, extensive green roofs (EGRs) represent the most widespread application due to their low areal mass, relatively simple installation, and reduced maintenance requirements compared to intensive systems [
9]. Despite their lightweight nature, EGRs can significantly influence the thermal balance of buildings through shading, the insulating effect of the substrate, and evapotranspiration (ET) [
13]. The latter is particularly important during summer, as it dissipates a substantial fraction of incoming solar energy as latent heat. However, ET strongly depends on water availability. Under hot and dry conditions, precisely when cooling is most needed, vegetation often experiences water stress, leading to reduced ET and diminished thermal benefits [
14].
Several studies have highlighted the dominant role of ET in the thermal performance of green roofs. For example, ref. [
15] demonstrated that nearly 60% of incoming solar radiation could be dissipated through ET, leaving only a small fraction transferred as sensible heat into the interior. A systematic review in ref. [
16] confirmed that ET-driven cooling is most effective under conditions of high solar radiation and low relative humidity. Similarly, ref. [
17] compared ET from vegetated and bare substrates over four consecutive summer days, finding that limited soil moisture restricted ET to values of approximately 50 W/m
2, thereby constraining the cooling potential of green roofs. More recent reviews and case studies further underline the broader contribution of green roofs to mitigating urban overheating, improving building energy performance, and reducing cooling demand in different climates. For instance, a systematic review of Mediterranean applications confirmed their role as a key climate adaptation strategy [
18], while comparative experiments in hot-humid regions demonstrated that green roofs could outperform both conventional and photovoltaic roofs in lowering surface and interior temperatures [
19]. Other studies documented their potential to improve outdoor microclimates and reduce building energy demand through retrofits [
20], or highlighted their winter and annual energy performance under lightweight configurations [
21]. These findings confirm that green roofs provide multidimensional benefits across climates, yet also reveal the need for further long-term, full-scale monitoring and context-specific design optimization.
Research has also focused on the role of irrigation. Innovative irrigation strategies, such as predictive irrigation control based on meteorological inputs [
22] or the integration of capacitive soil moisture sensors for automated irrigation systems [
23], have been proposed to optimize ET while minimizing water use. Experimental studies further confirmed that irrigation can stabilize substrate moisture, sustain ET, and preserve cooling performance during heatwaves [
24]. For instance, irrigated EGRs were shown to lower the temperature of the waterproofing membrane by up to 5 °C and the vegetation surface by up to 10 °C compared to non-irrigated roofs. Conversely, ref. [
25] suggested that substrate water content may not always be the dominant factor, as increased ET rates were achieved despite higher substrate thermal conductivity and reduced albedo under wetter conditions.
Beyond isolated EGR studies, recent works have begun exploring hybrid roof systems. The synergy between green roofs and photovoltaic (PV) panels has been reported to enhance both thermal and energy performance: green roofs can reduce PV module temperatures, thereby improving their efficiency, while PV arrays provide partial shading that reduces substrate water loss [
26]. However, such systems require careful irrigation design and structural considerations to avoid substrate degradation or roof overloading [
27].
Despite the breadth of research, several knowledge gaps remain. Many studies rely on small-scale modules or simulation approaches, while full-scale investigations on a real building roof are scarce. Moreover, while the benefits of continuous irrigation are well established, less is known about how temporary irrigation outages affect thermal performance and how quickly green roofs recover their cooling capacity once irrigation is resumed. Comparative analyses of EGRs with alternative roof strategies, such as PV systems combined with hydro-accumulative layers, also remain limited, despite their increasing relevance for industrial and commercial buildings.
Furthermore, systematic reviews and recent experimental evidence emphasize the need to assess green roof performance not only under ideal irrigation and climatic conditions but also during periods of water stress or interrupted irrigation. Investigating these transient dynamics in real-world, full-scale conditions provide novel insights that cannot be derived from small-scale or simulation-only studies.
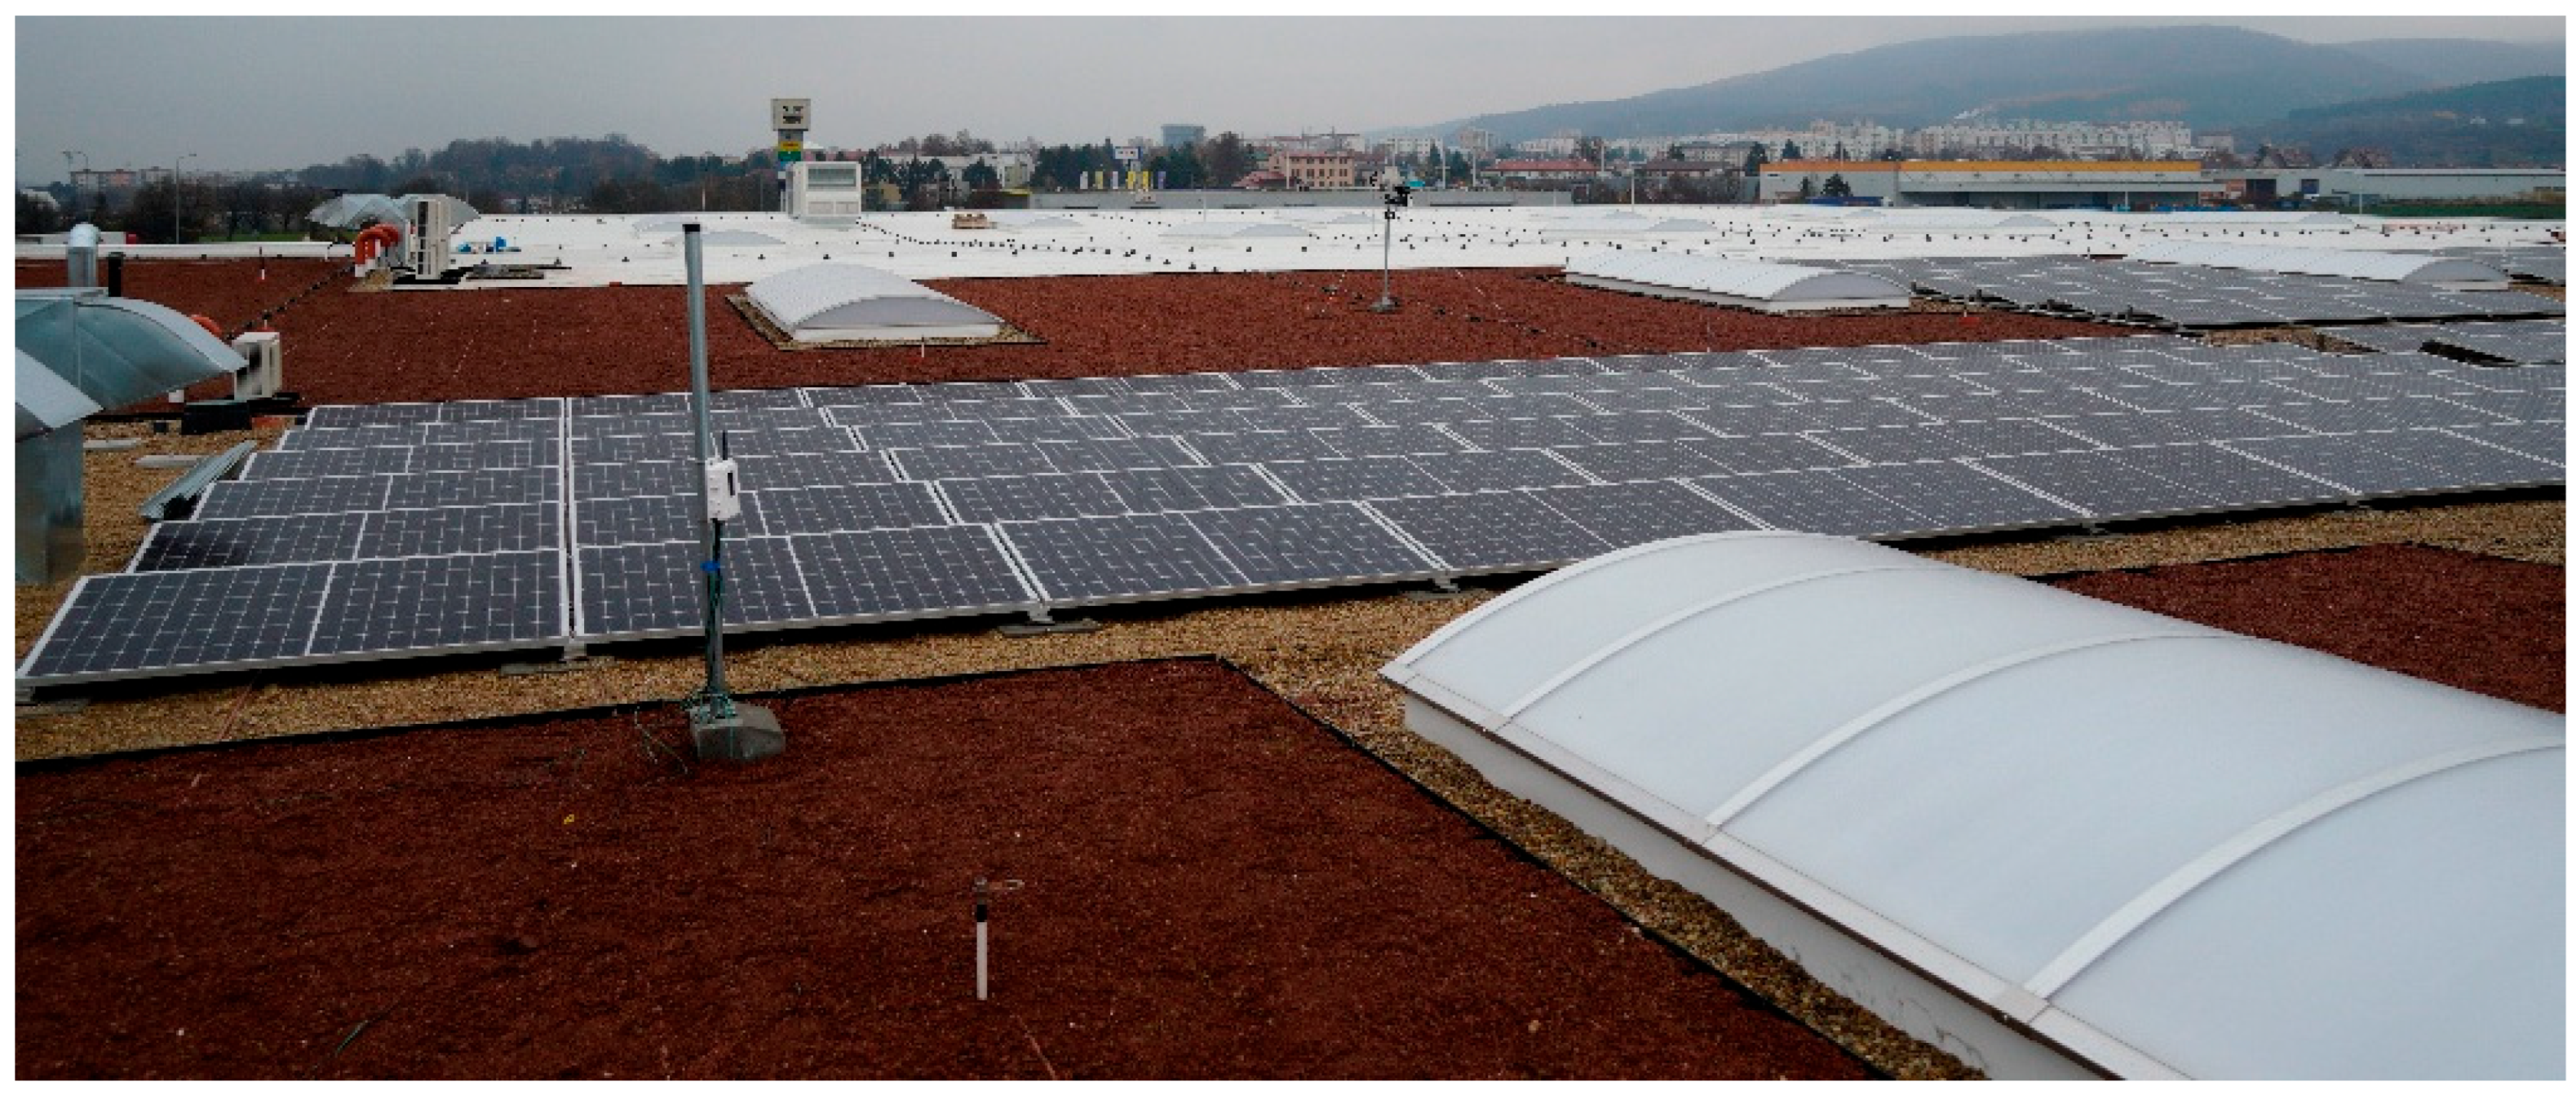
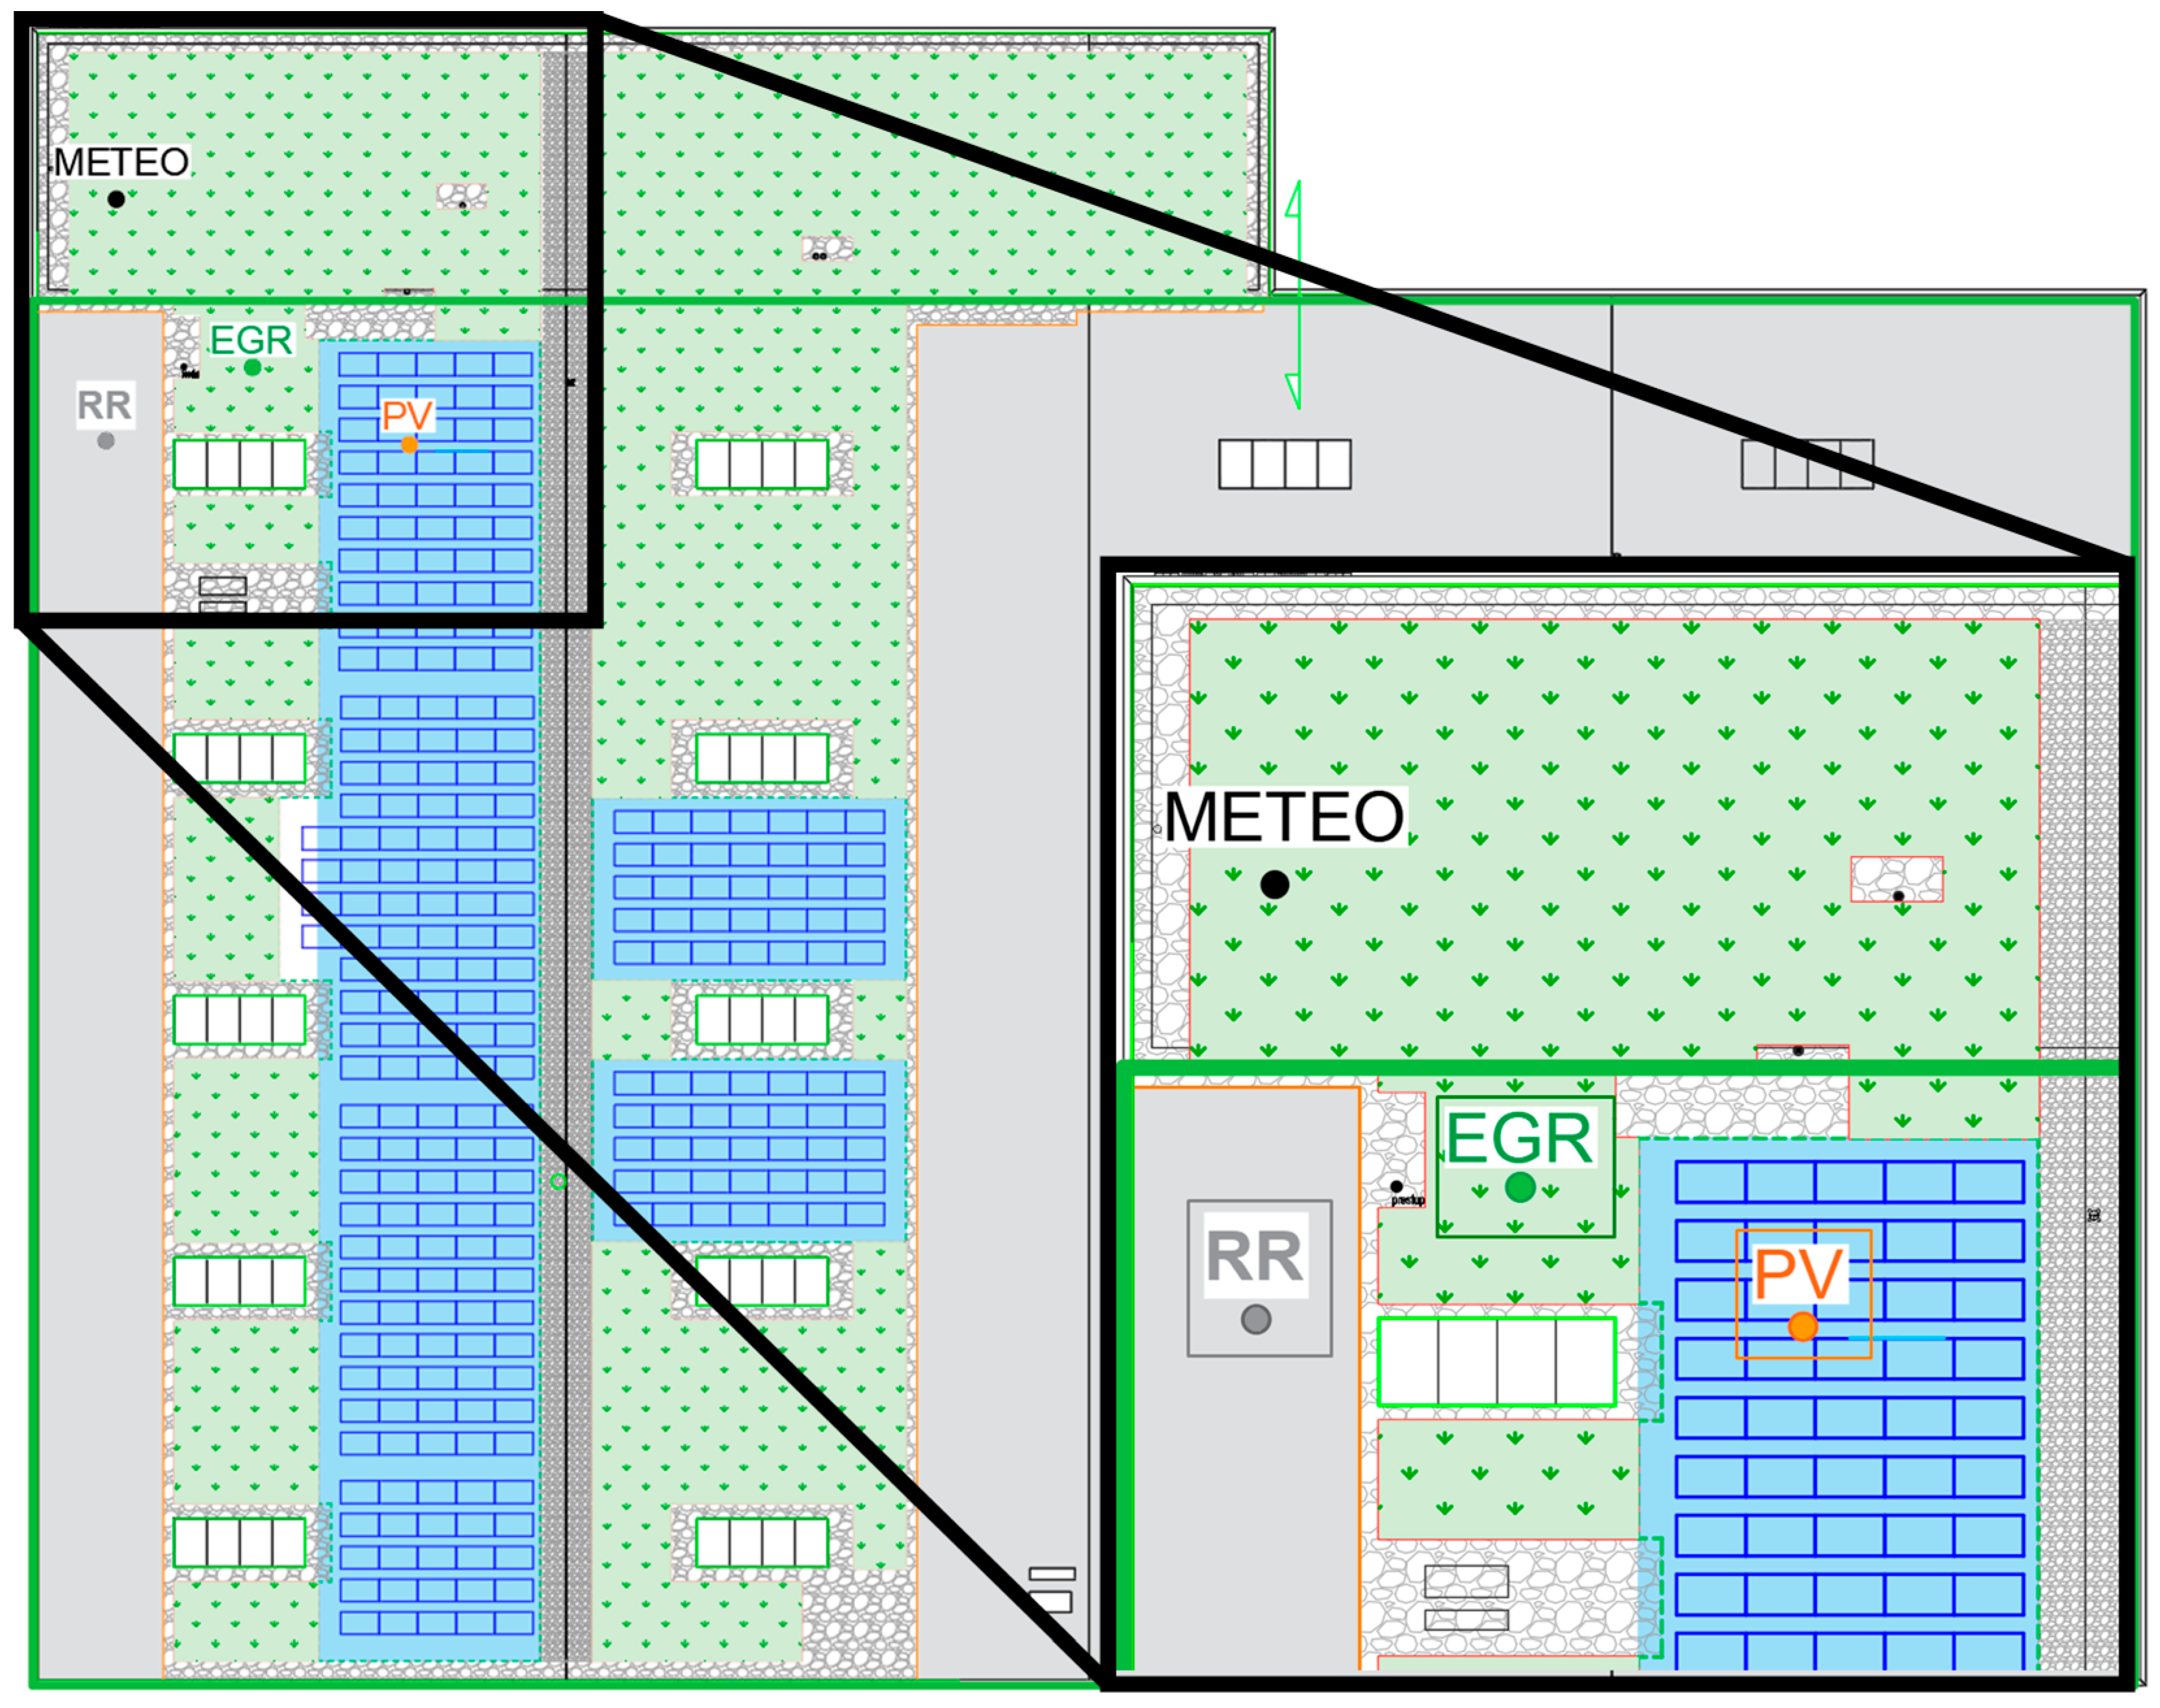
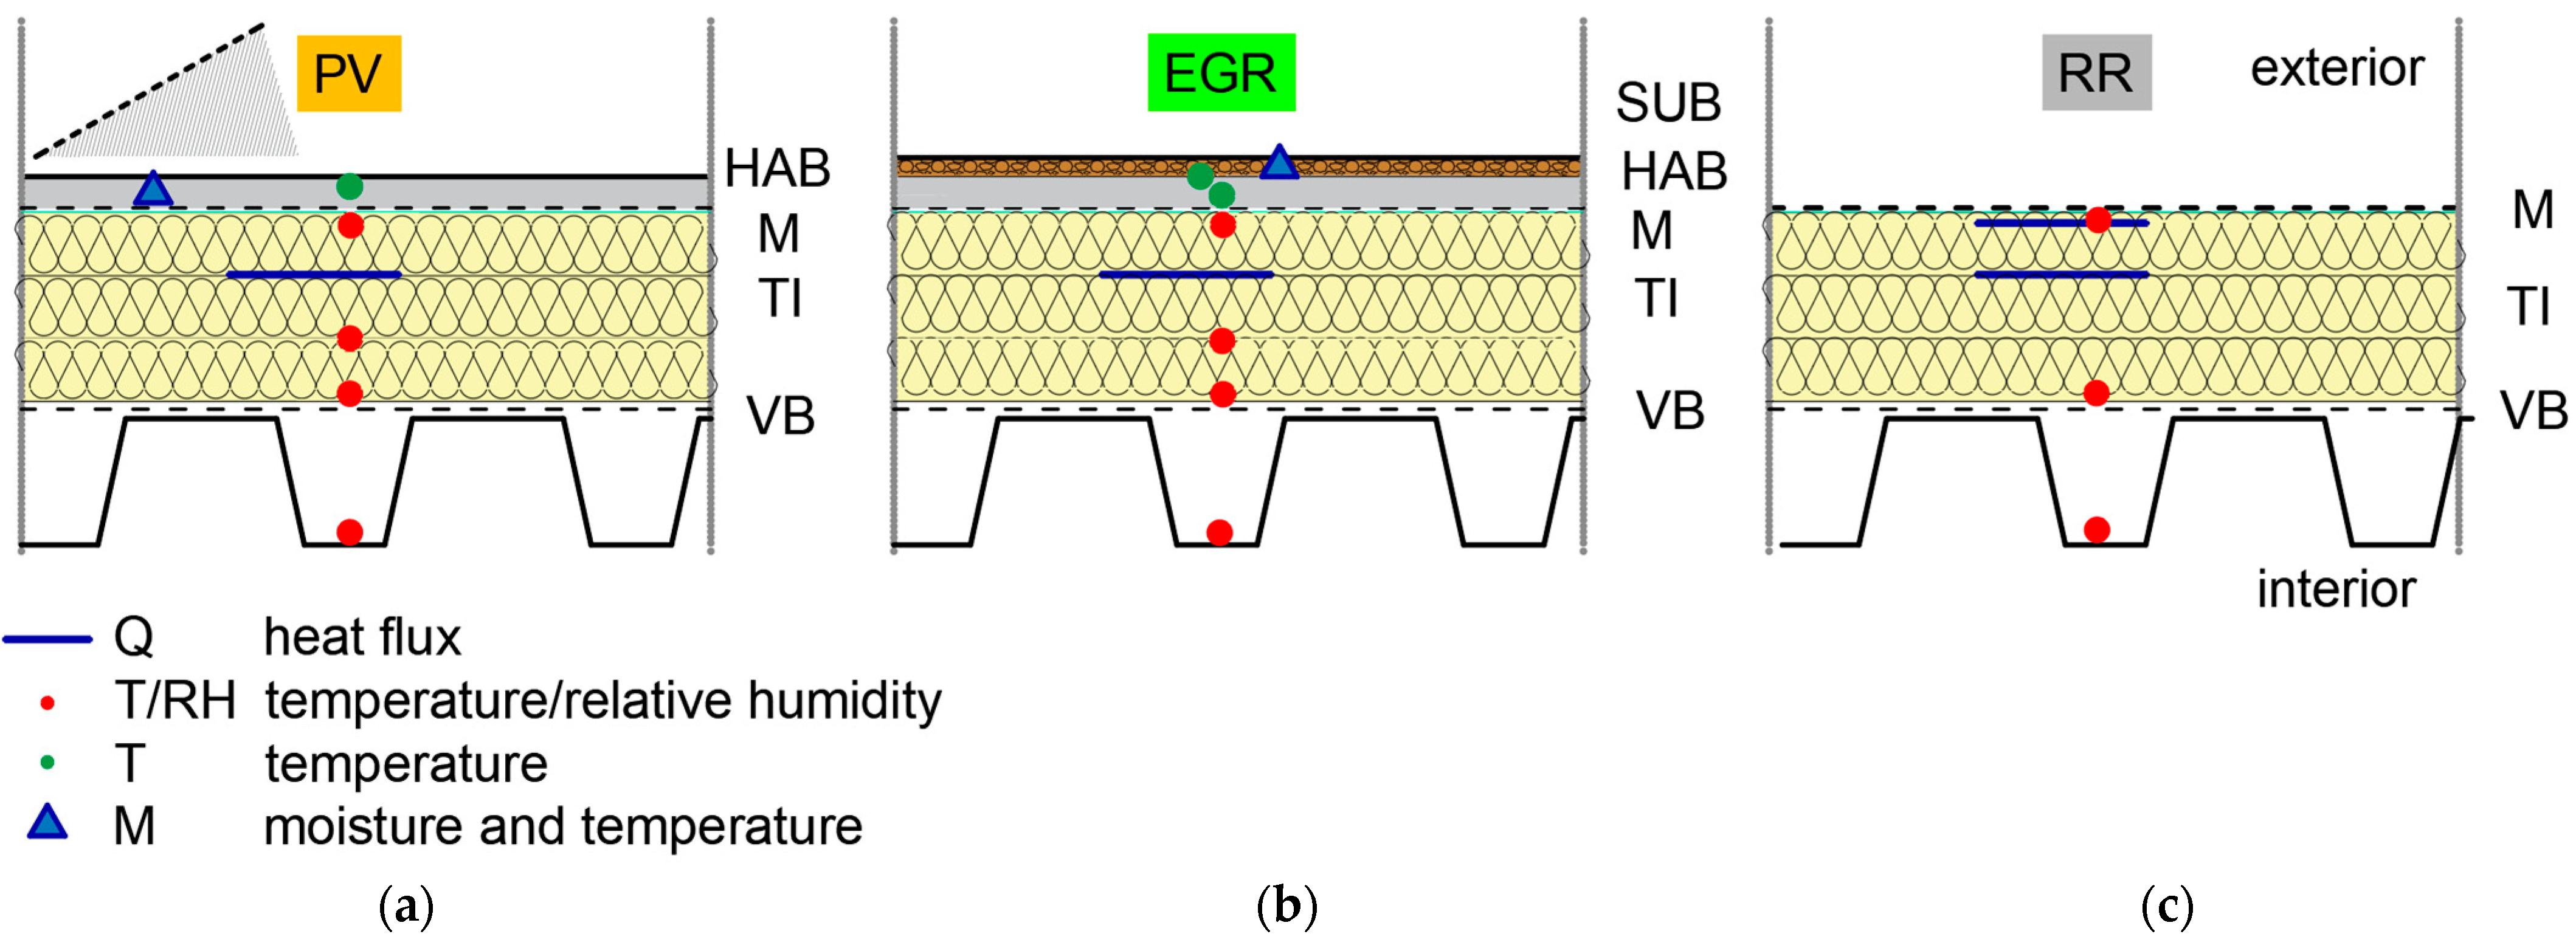
This study addresses these gaps by investigating the thermal behavior of three flat roof types used on an industrial hall in Dubnica nad Váhom, Slovakia: (i) an extensive green roof (EGR), (ii) roof with a hydro-accumulative layer and photovoltaic (PV) covering, and (iii) a conventional reflective reference roof (RR) with a bright TPO membrane.
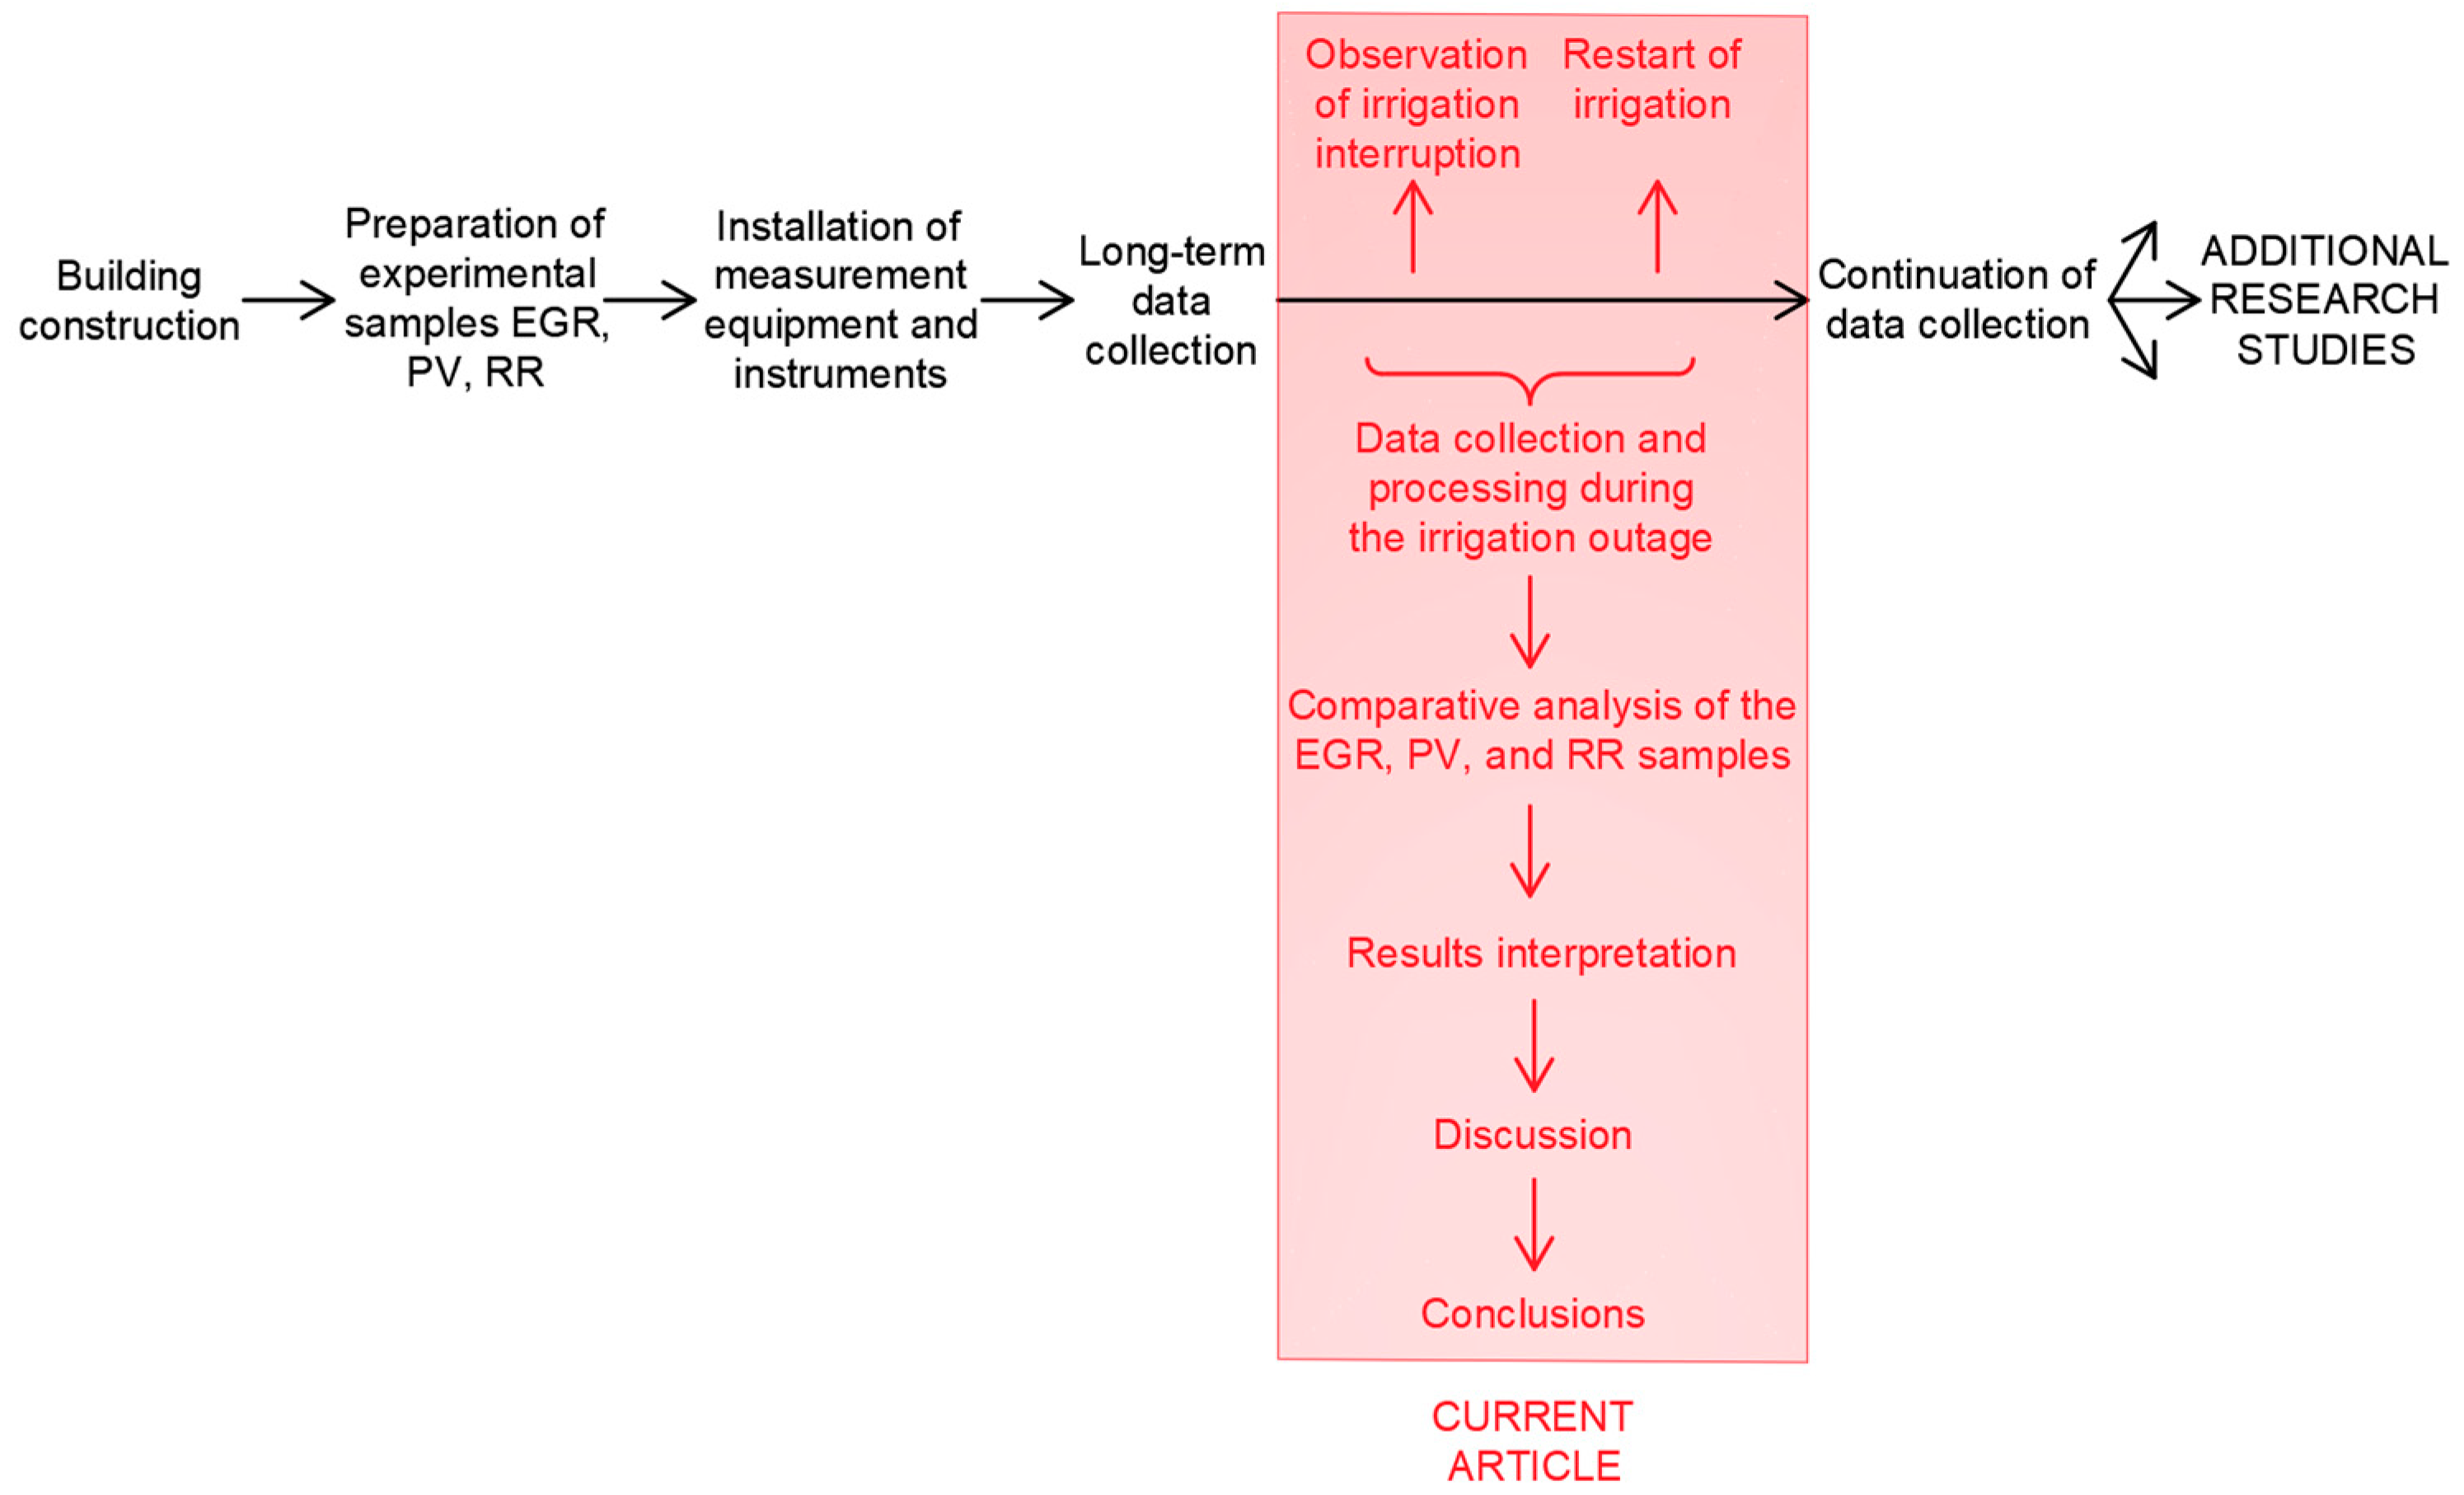
Particular attention is given to an unplanned irrigation outage during the summer of 2024 and the subsequent recovery phase. The aim is to quantify the impact of active drip irrigation on the thermal dynamics of an EGR and compare its performance with the PV and RR. The novelty and unique contribution of this study lie in (a) providing full-scale experimental measurements on an industrial building roof, (b) analyzing the thermal response of EGRs to an unplanned irrigation outage and its recovery, and (c) directly comparing EGR with PV and RR roof types under extreme summer conditions. These findings deliver actionable knowledge for optimizing irrigation strategies and reinforce the role of green roofs as an effective building adaptation measure.
3. Results and Discussions
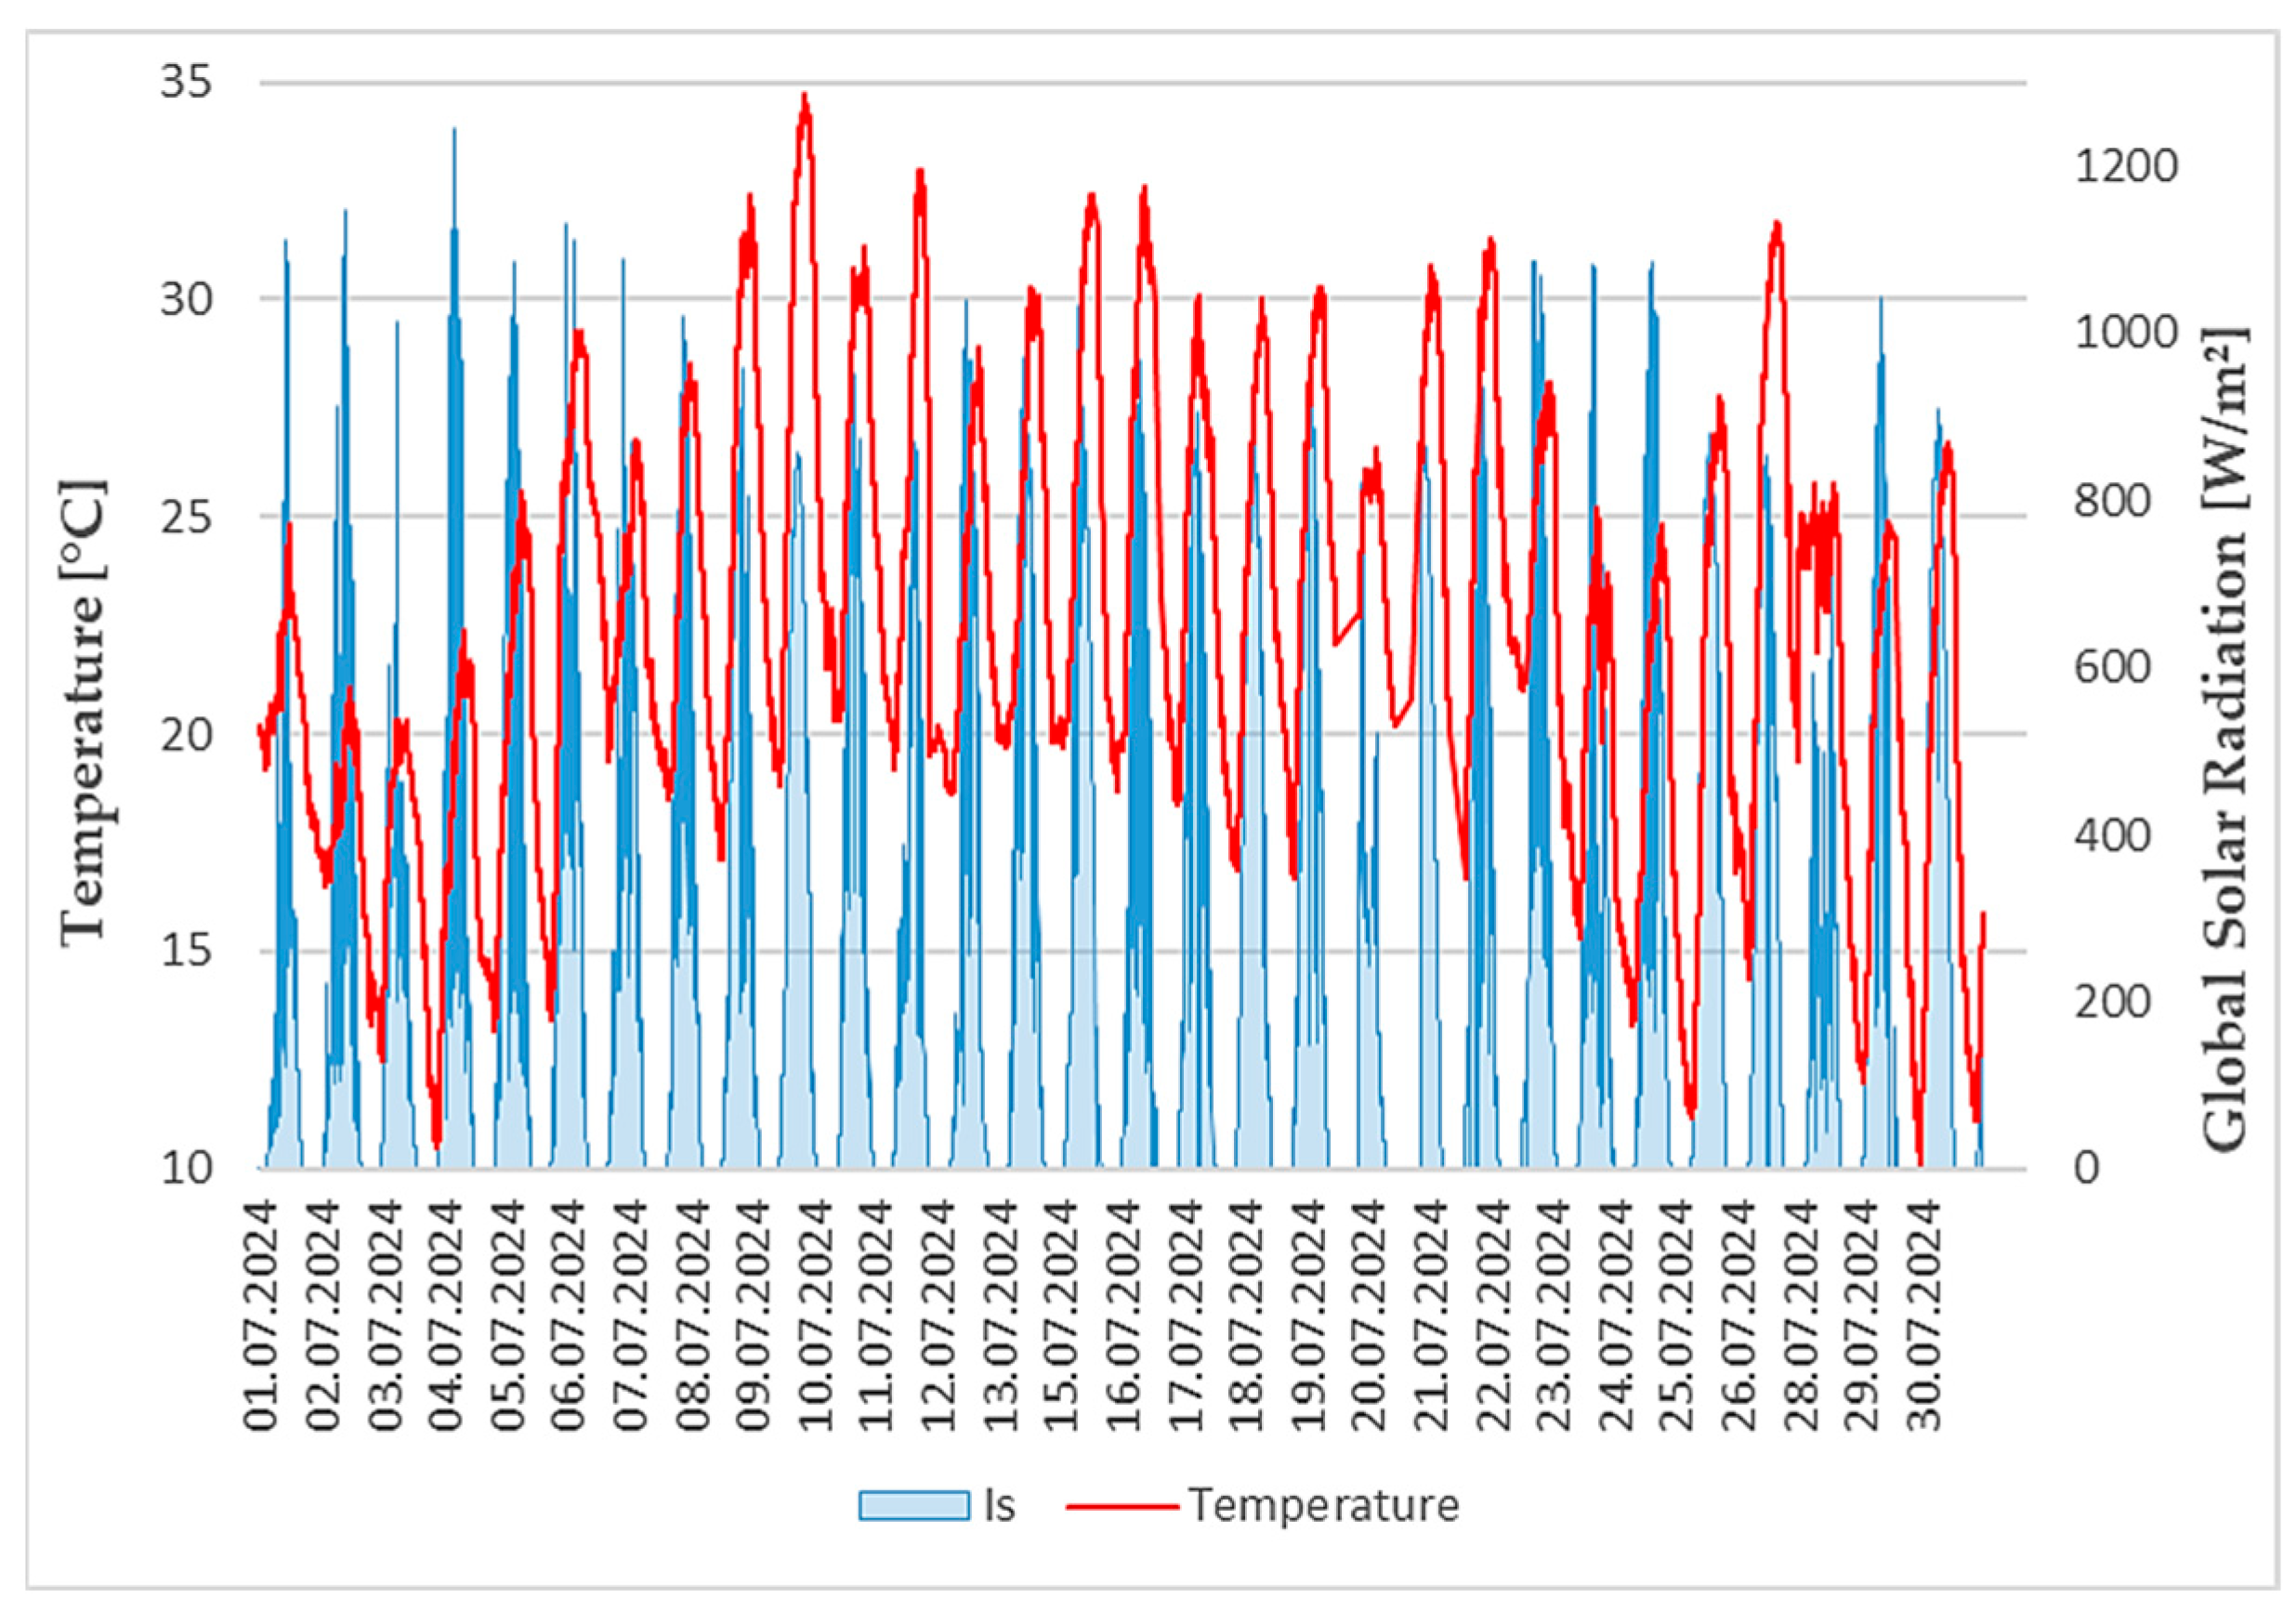
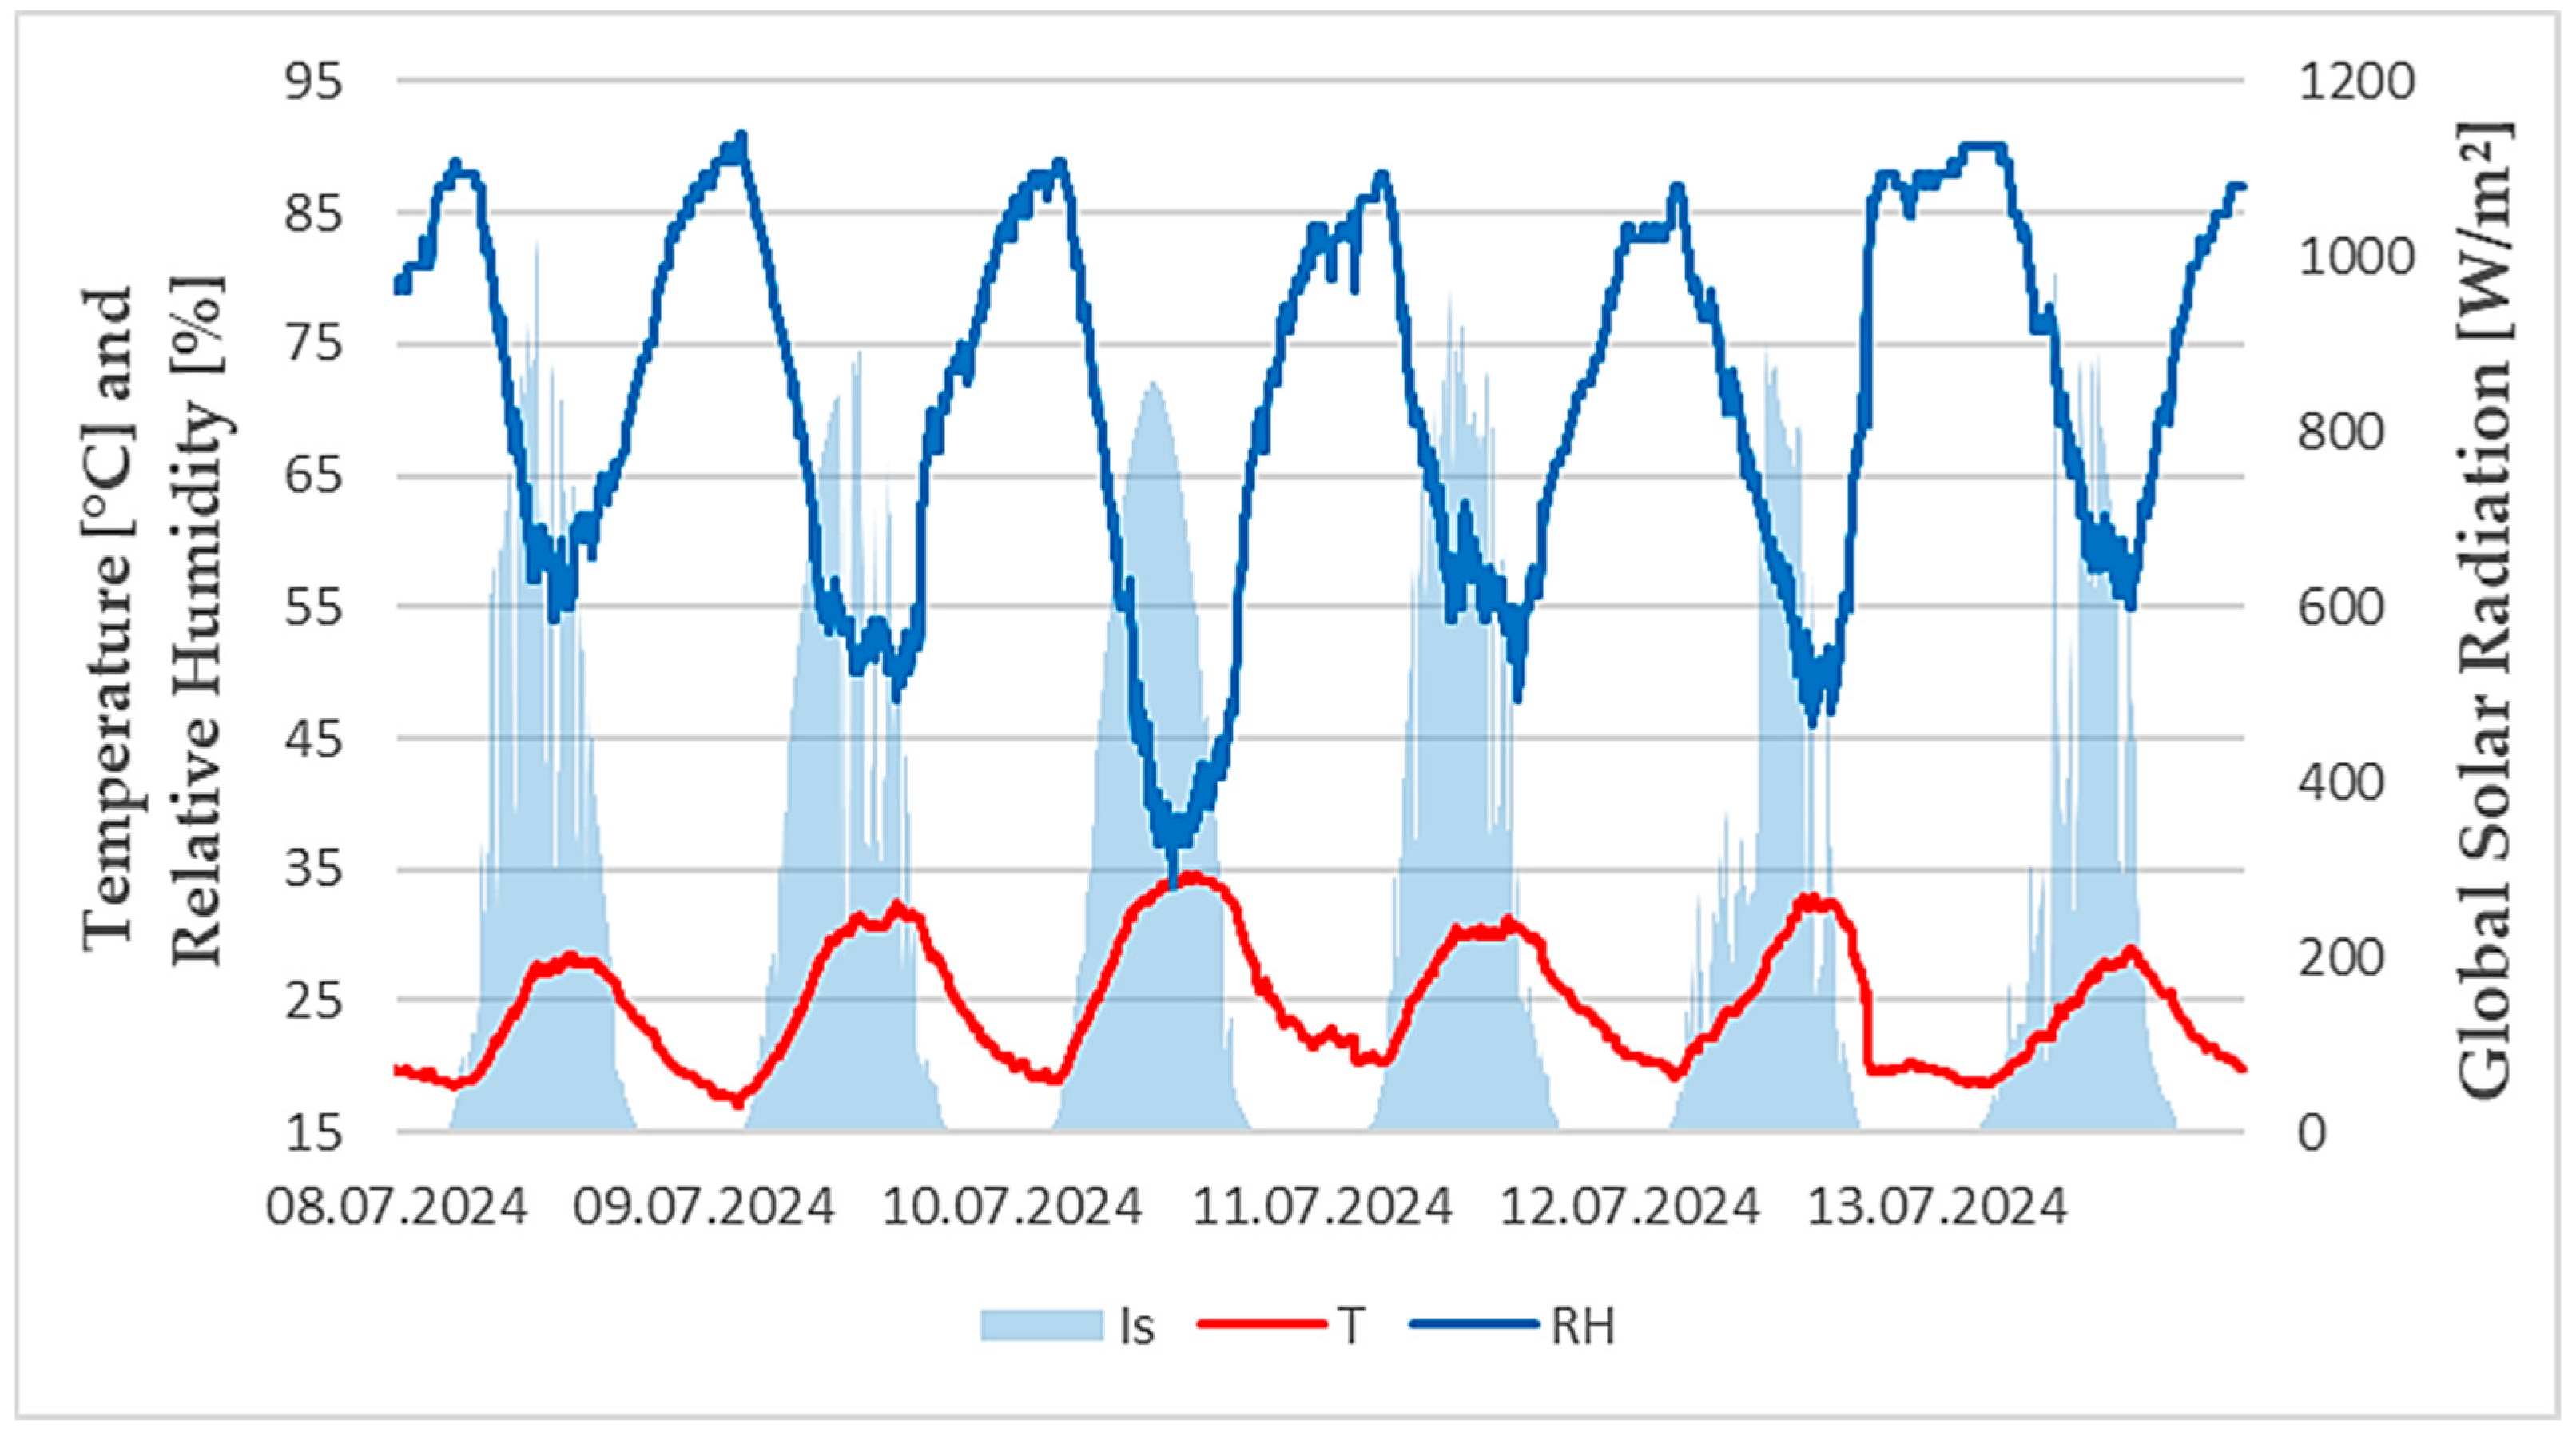
The experimental site in Dubnica nad Váhom, Slovakia, is characterized by a temperate continental climate with warm summers and cold winters. The Slovak Hydrometeorological Institute classifies the region as a moderately warm continental zone. During the summer of 2024, when the measurements were conducted, average daytime air temperatures ranged between 25–32 °C, with peak solar radiation exceeding 900 W/m
2 on clear days. Relative humidity varied between 40–65%, and total precipitation during the monitoring period was limited, leading to predominantly dry conditions. The graph in
Figure 10 presents the course of temperature and solar radiation during the summer month of July 2024.
The period analyzed was intentionally chosen to reflect typical summer weather conditions and provide suitable conditions for assessing the impact of irrigation on the temperature behavior of the green roof. The key factor in selecting specific days was an identifiable change in the operation of the drip irrigation system. At the beginning of July 2024, a technical defect occurred, and irrigation was interrupted, leading to significant drying of the vegetation substrate and heat accumulation in the roof structure. On 11 July 2024, the irrigation system was put back into use, allowing for detailed monitoring of the immediate response of individual roof layers to the water supply to the system. It is precisely this change—from a period of drought to a regime of regular irrigation—that provides ideal conditions for comparing differences in temperature profiles and heat flow in different types of roof structures (vegetation roof, roof with PV panels and reference roof) when pointing out the positive effect of regular irrigation of extensive roofs.
For the purpose of clarity and readability in the graphs in the figures, a three-day period before the repair of the irrigation system and a three-day period after the restart of drip irrigation were analyzed. The three-day interval before irrigation represents the phase when the roof cladding layers were already sufficiently dry due to the irrigation failure, creating a representative reference state without evapotranspiration support. The subsequent three-day period after irrigation activation captures the dynamics and stabilization of thermal conditions after water supply is restored. The selected range ensures the readability and comprehensibility of the results, minimizes the impact of accidental daily fluctuations, and provides relevant data for quantitative comparison of individual types of roof structures in different hydrothermal conditions. The graph in
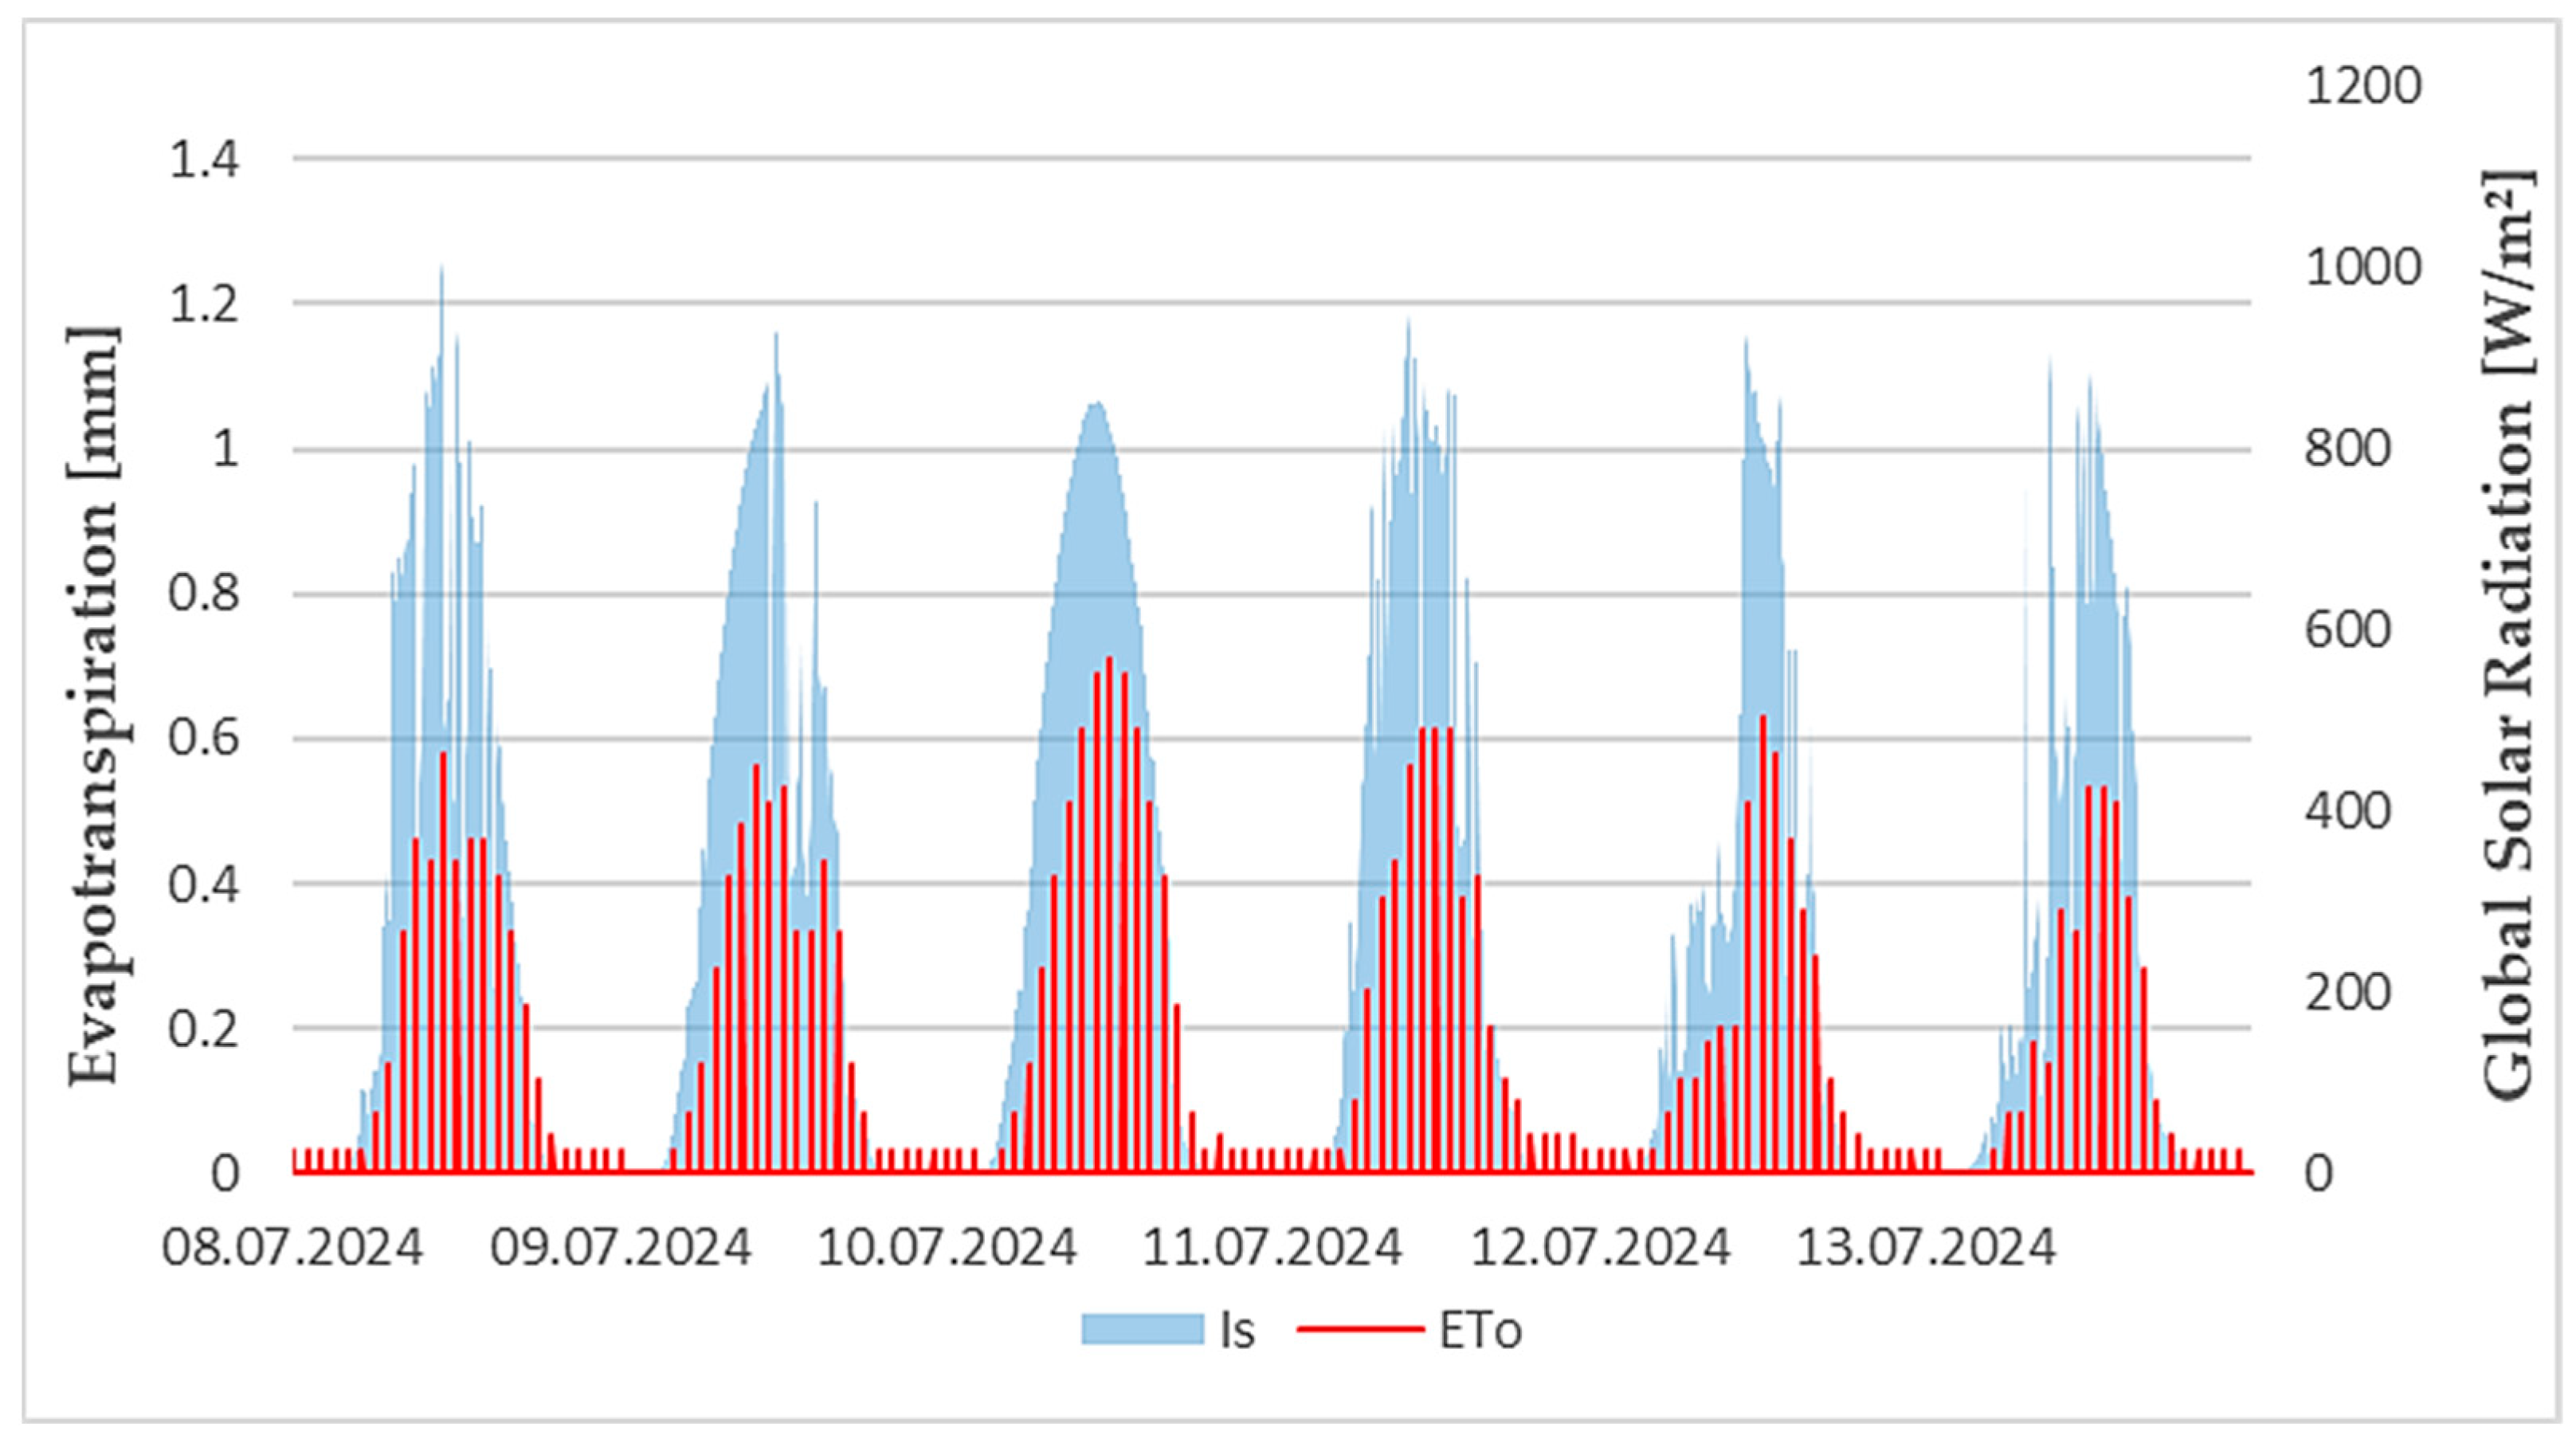
Figure 11 presents the course of solar radiation intensity as well as outdoor air temperature and relative air humidity.
One of the main benefits of green roofs is their ability to use solar energy for evapotranspiration—the physical conversion of water into water vapor at a constant, unchanged outdoor temperature. This process is an important cooling mechanism for green roofs. The graph in
Figure 12 illustrates the daily sum of global solar radiation and the corresponding theoretical amount of evapotranspiration (ET
0) that could be released into the environment under the climatic conditions of a given day, provided that sufficient water is available in the substrate. During periods without active irrigation (before 11 July 2024), when the substrate was significantly dried out, the ability of the green roof to use this energy for water evaporation was significantly reduced. The energy from solar radiation is thus not used for latent evaporation, but is accumulated in the structure, leading to its overheating.
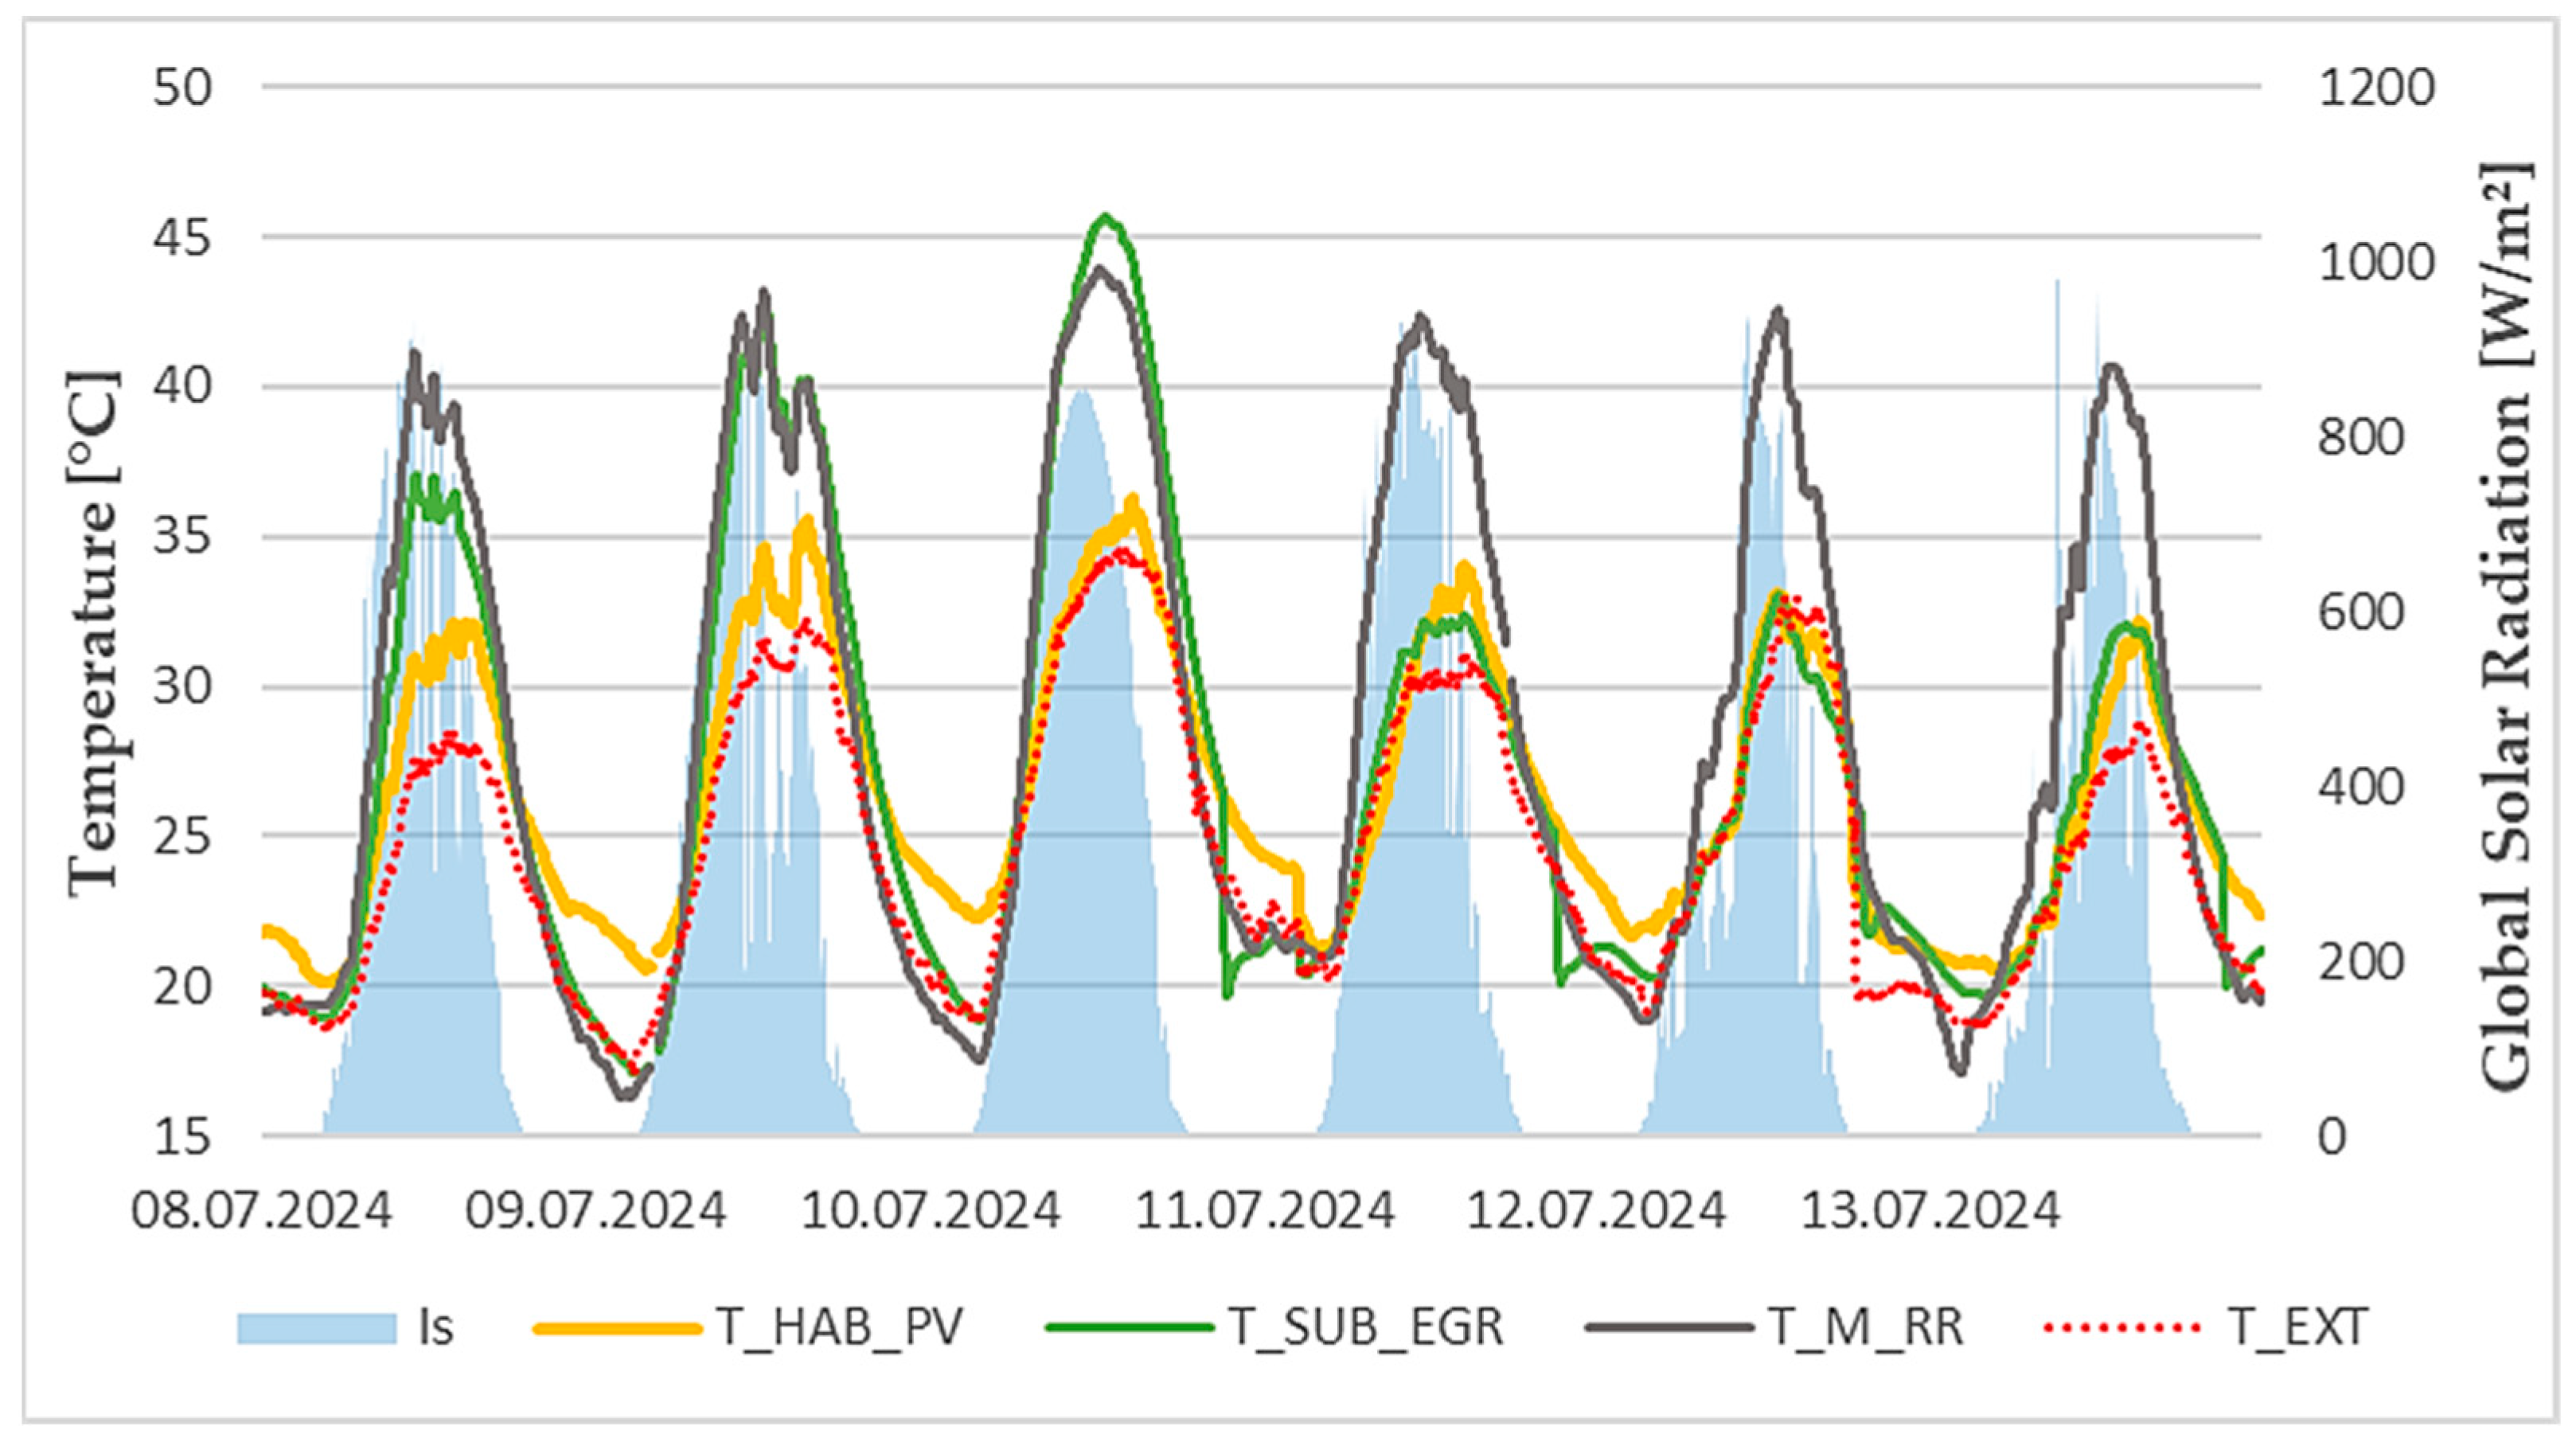
The impact of starting up the irrigation system is particularly noticeable in the temperature and heat flow in the individual roof structures. The graph in
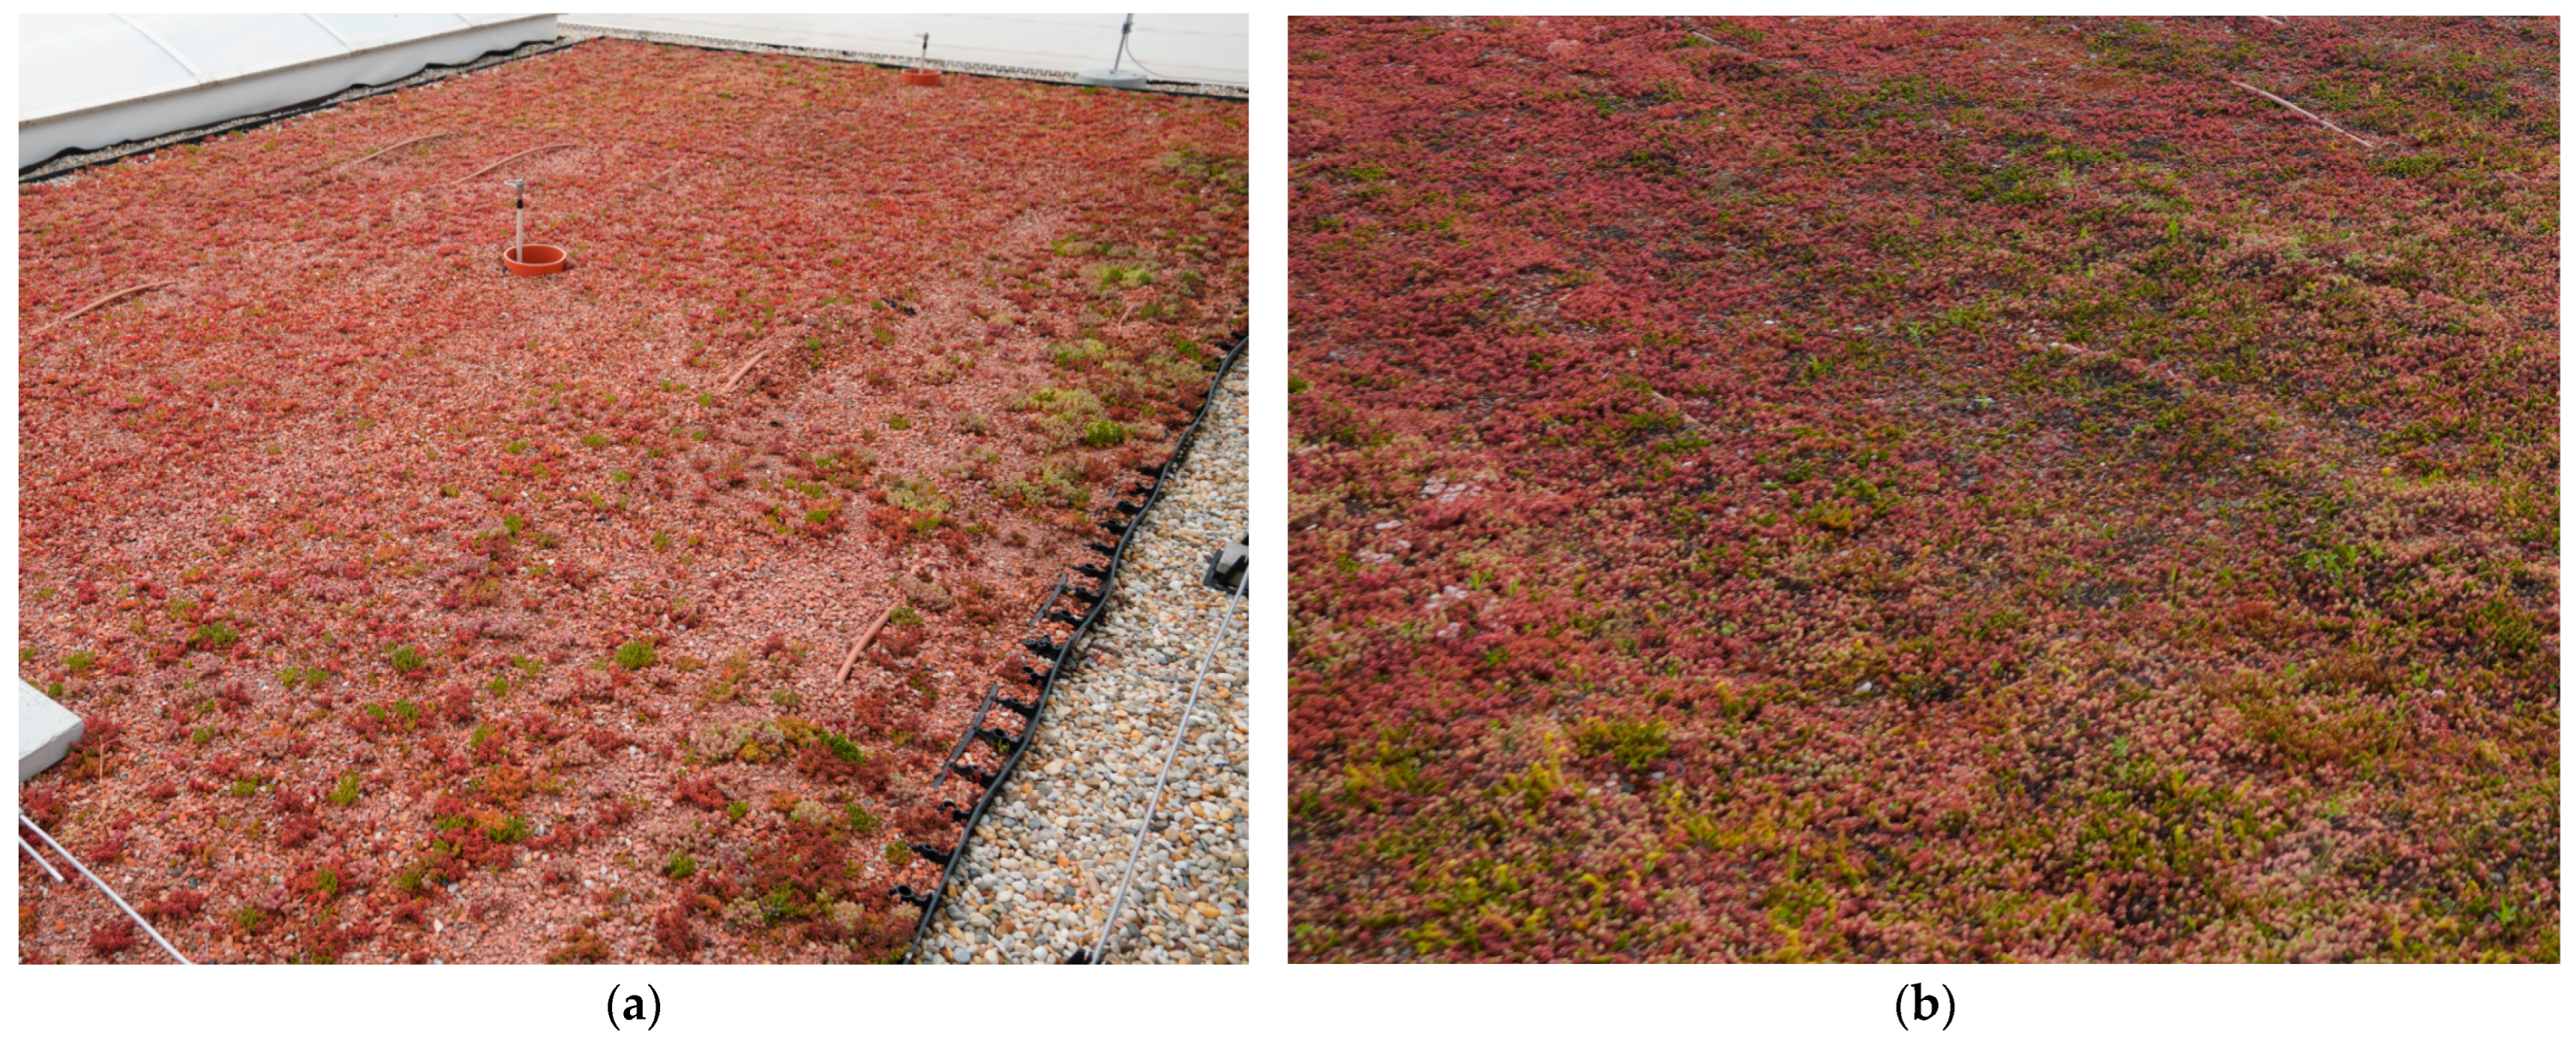
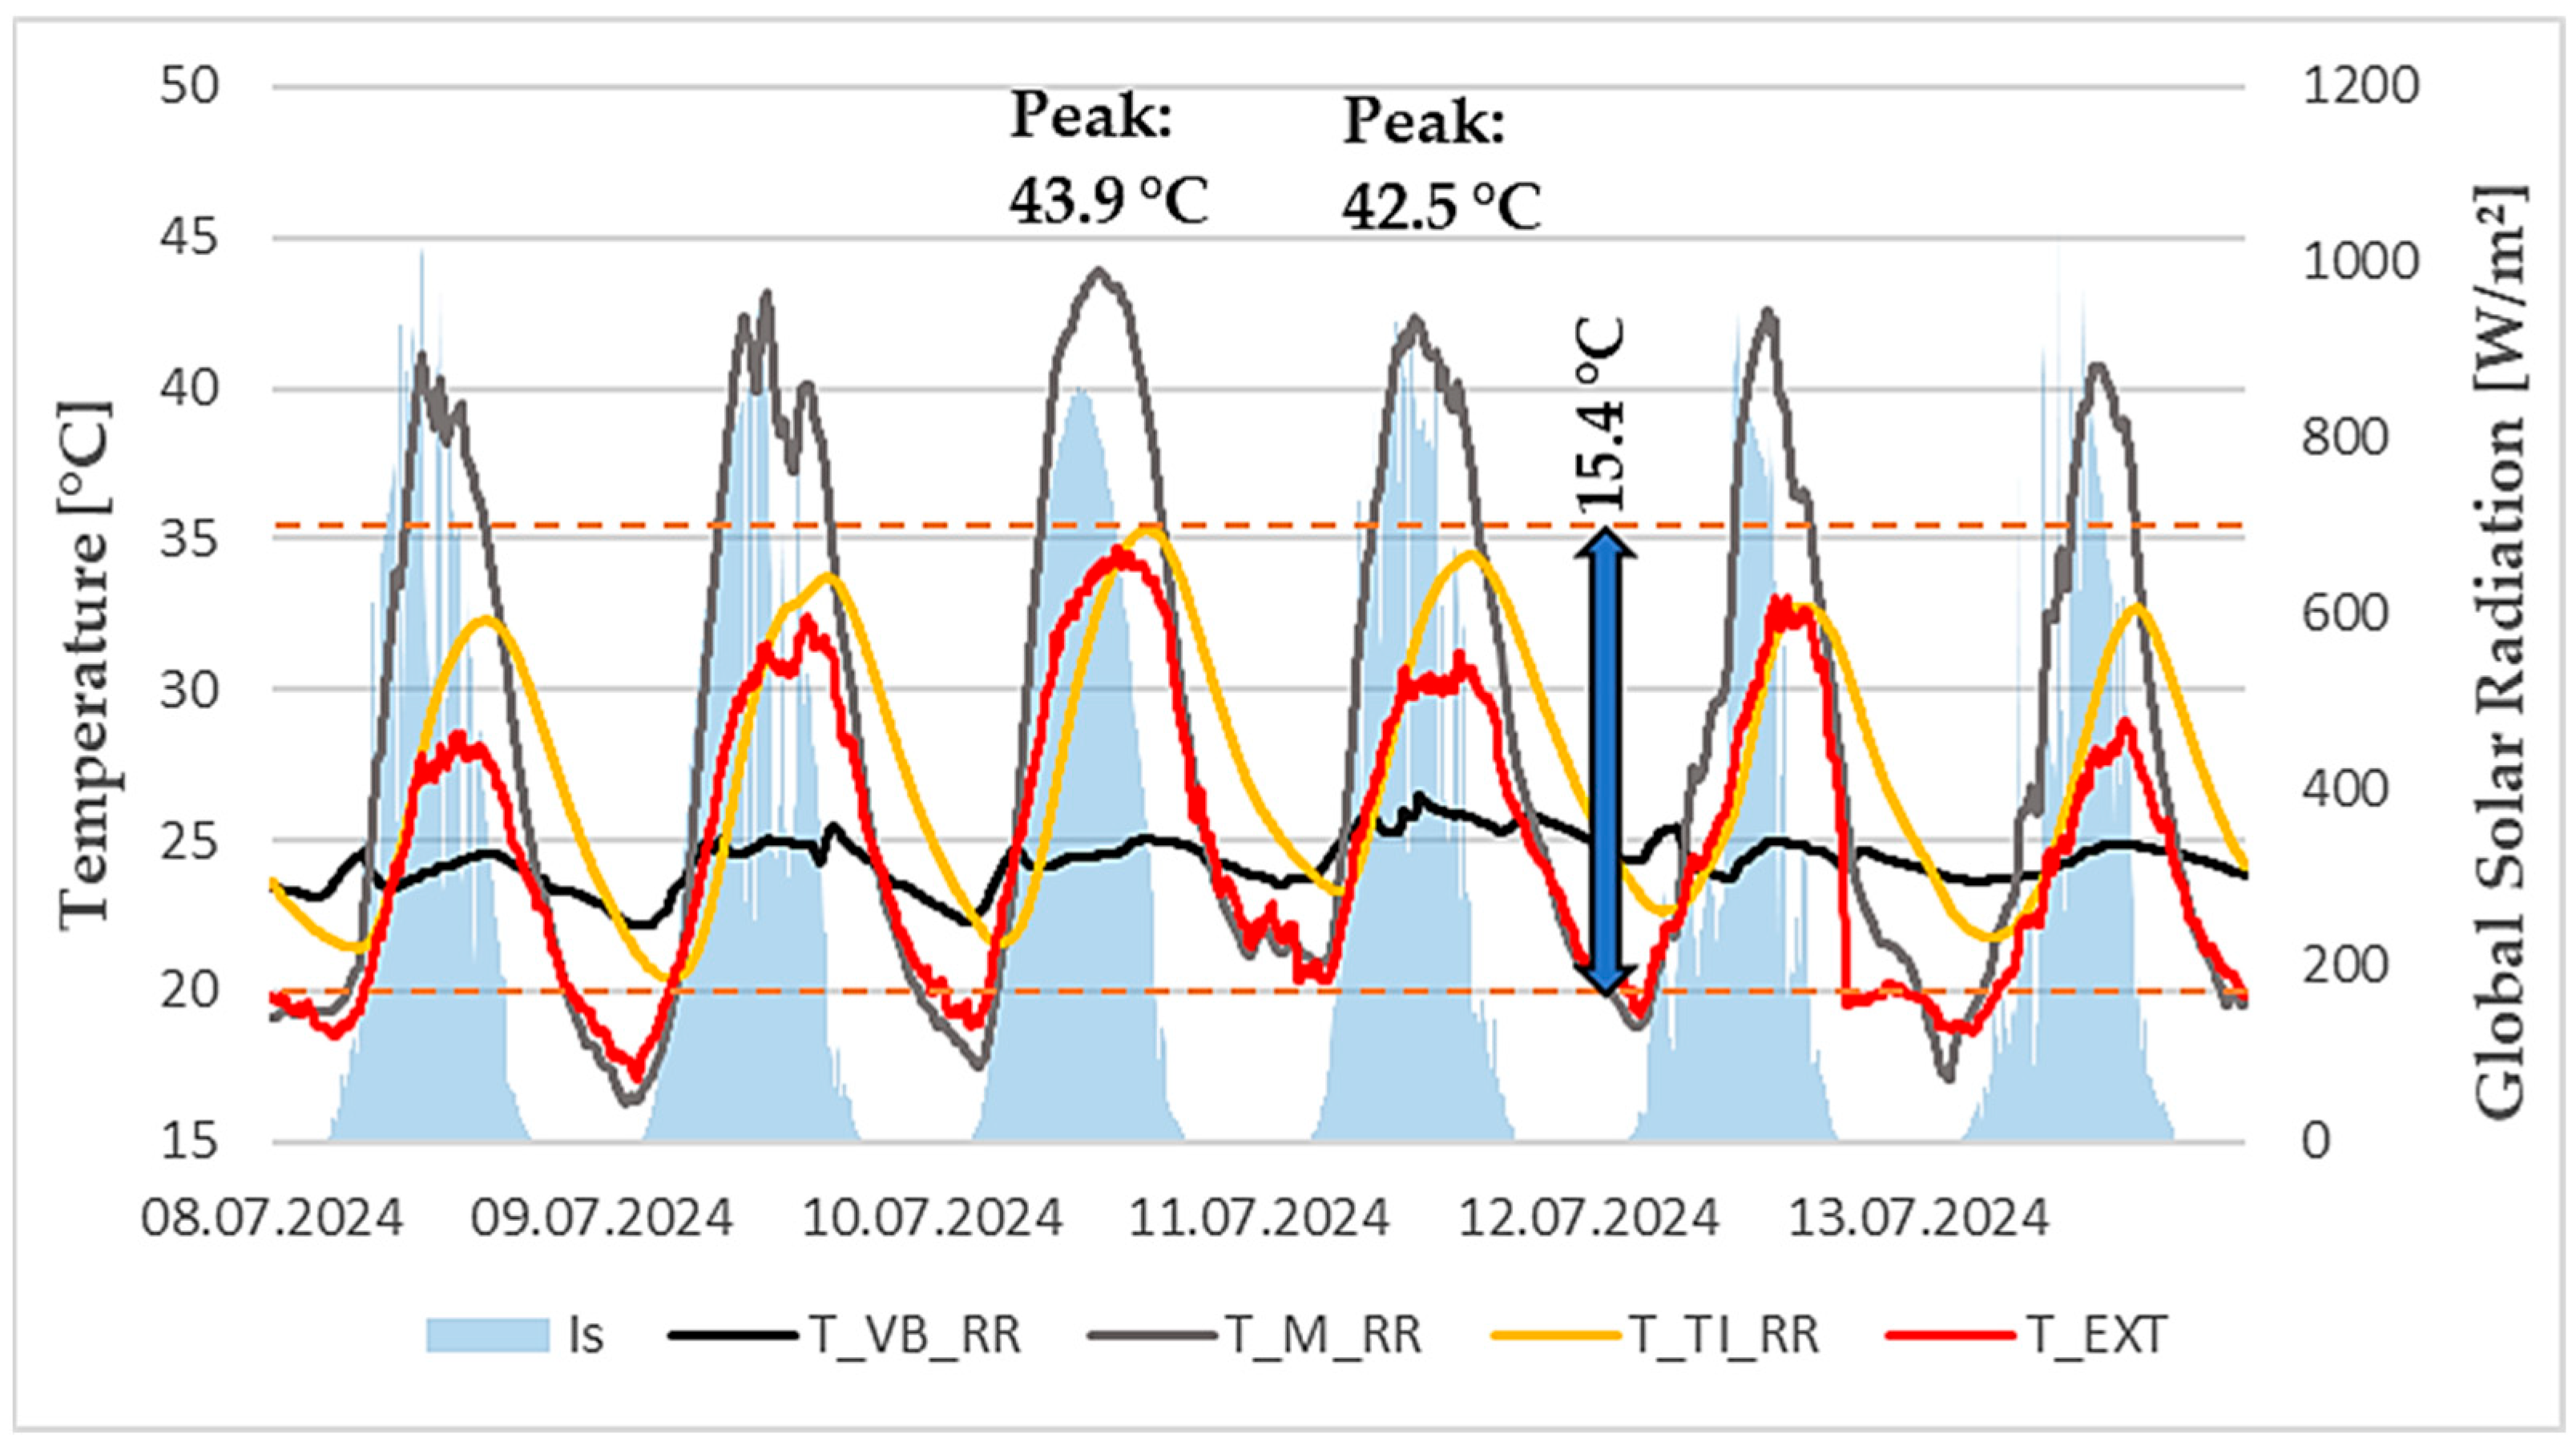
Figure 13 illustrates the temperature curve on the surface (substrate in the case of EGR and PV and at the waterproofing membrane in the case of RR). The graph indicates that the EGR composition can achieve higher surface temperatures than the RR sample (10 July 2024). This is mainly due to the fact that the EGR surface is not yet completely covered with vegetation. The significantly darker surface of the expanded clay substrate, which has a lower albedo than the surface of the light-colored waterproofing membrane in the case of the RR sample, absorbs more solar radiation. Since there is no water supply, the heat gained helps to increase the temperature in the structure. After turning on the irrigation system, a dramatic difference in temperature can be seen in the EGR sample. The maximum temperature at the substrate level reaches 32.4 °C, while the day before, during the non-irrigation period, it reaches 45.6 °C. While the RR sample continues to trend toward increased surface temperature, the EGR sample maintains a consistently lower temperature after irrigation is started. The surface temperature is maintained close to the outside air temperature due to evaporation. The sample using PV panels (PV) does not experience such a noticeable change. This is mainly due to the permanent shading of the PV panels. The shade created near the PV panels reduces the temperature and also keeps the area under the panels more humid. The sample maintains a consistently lower temperature from the previous irrigation period.
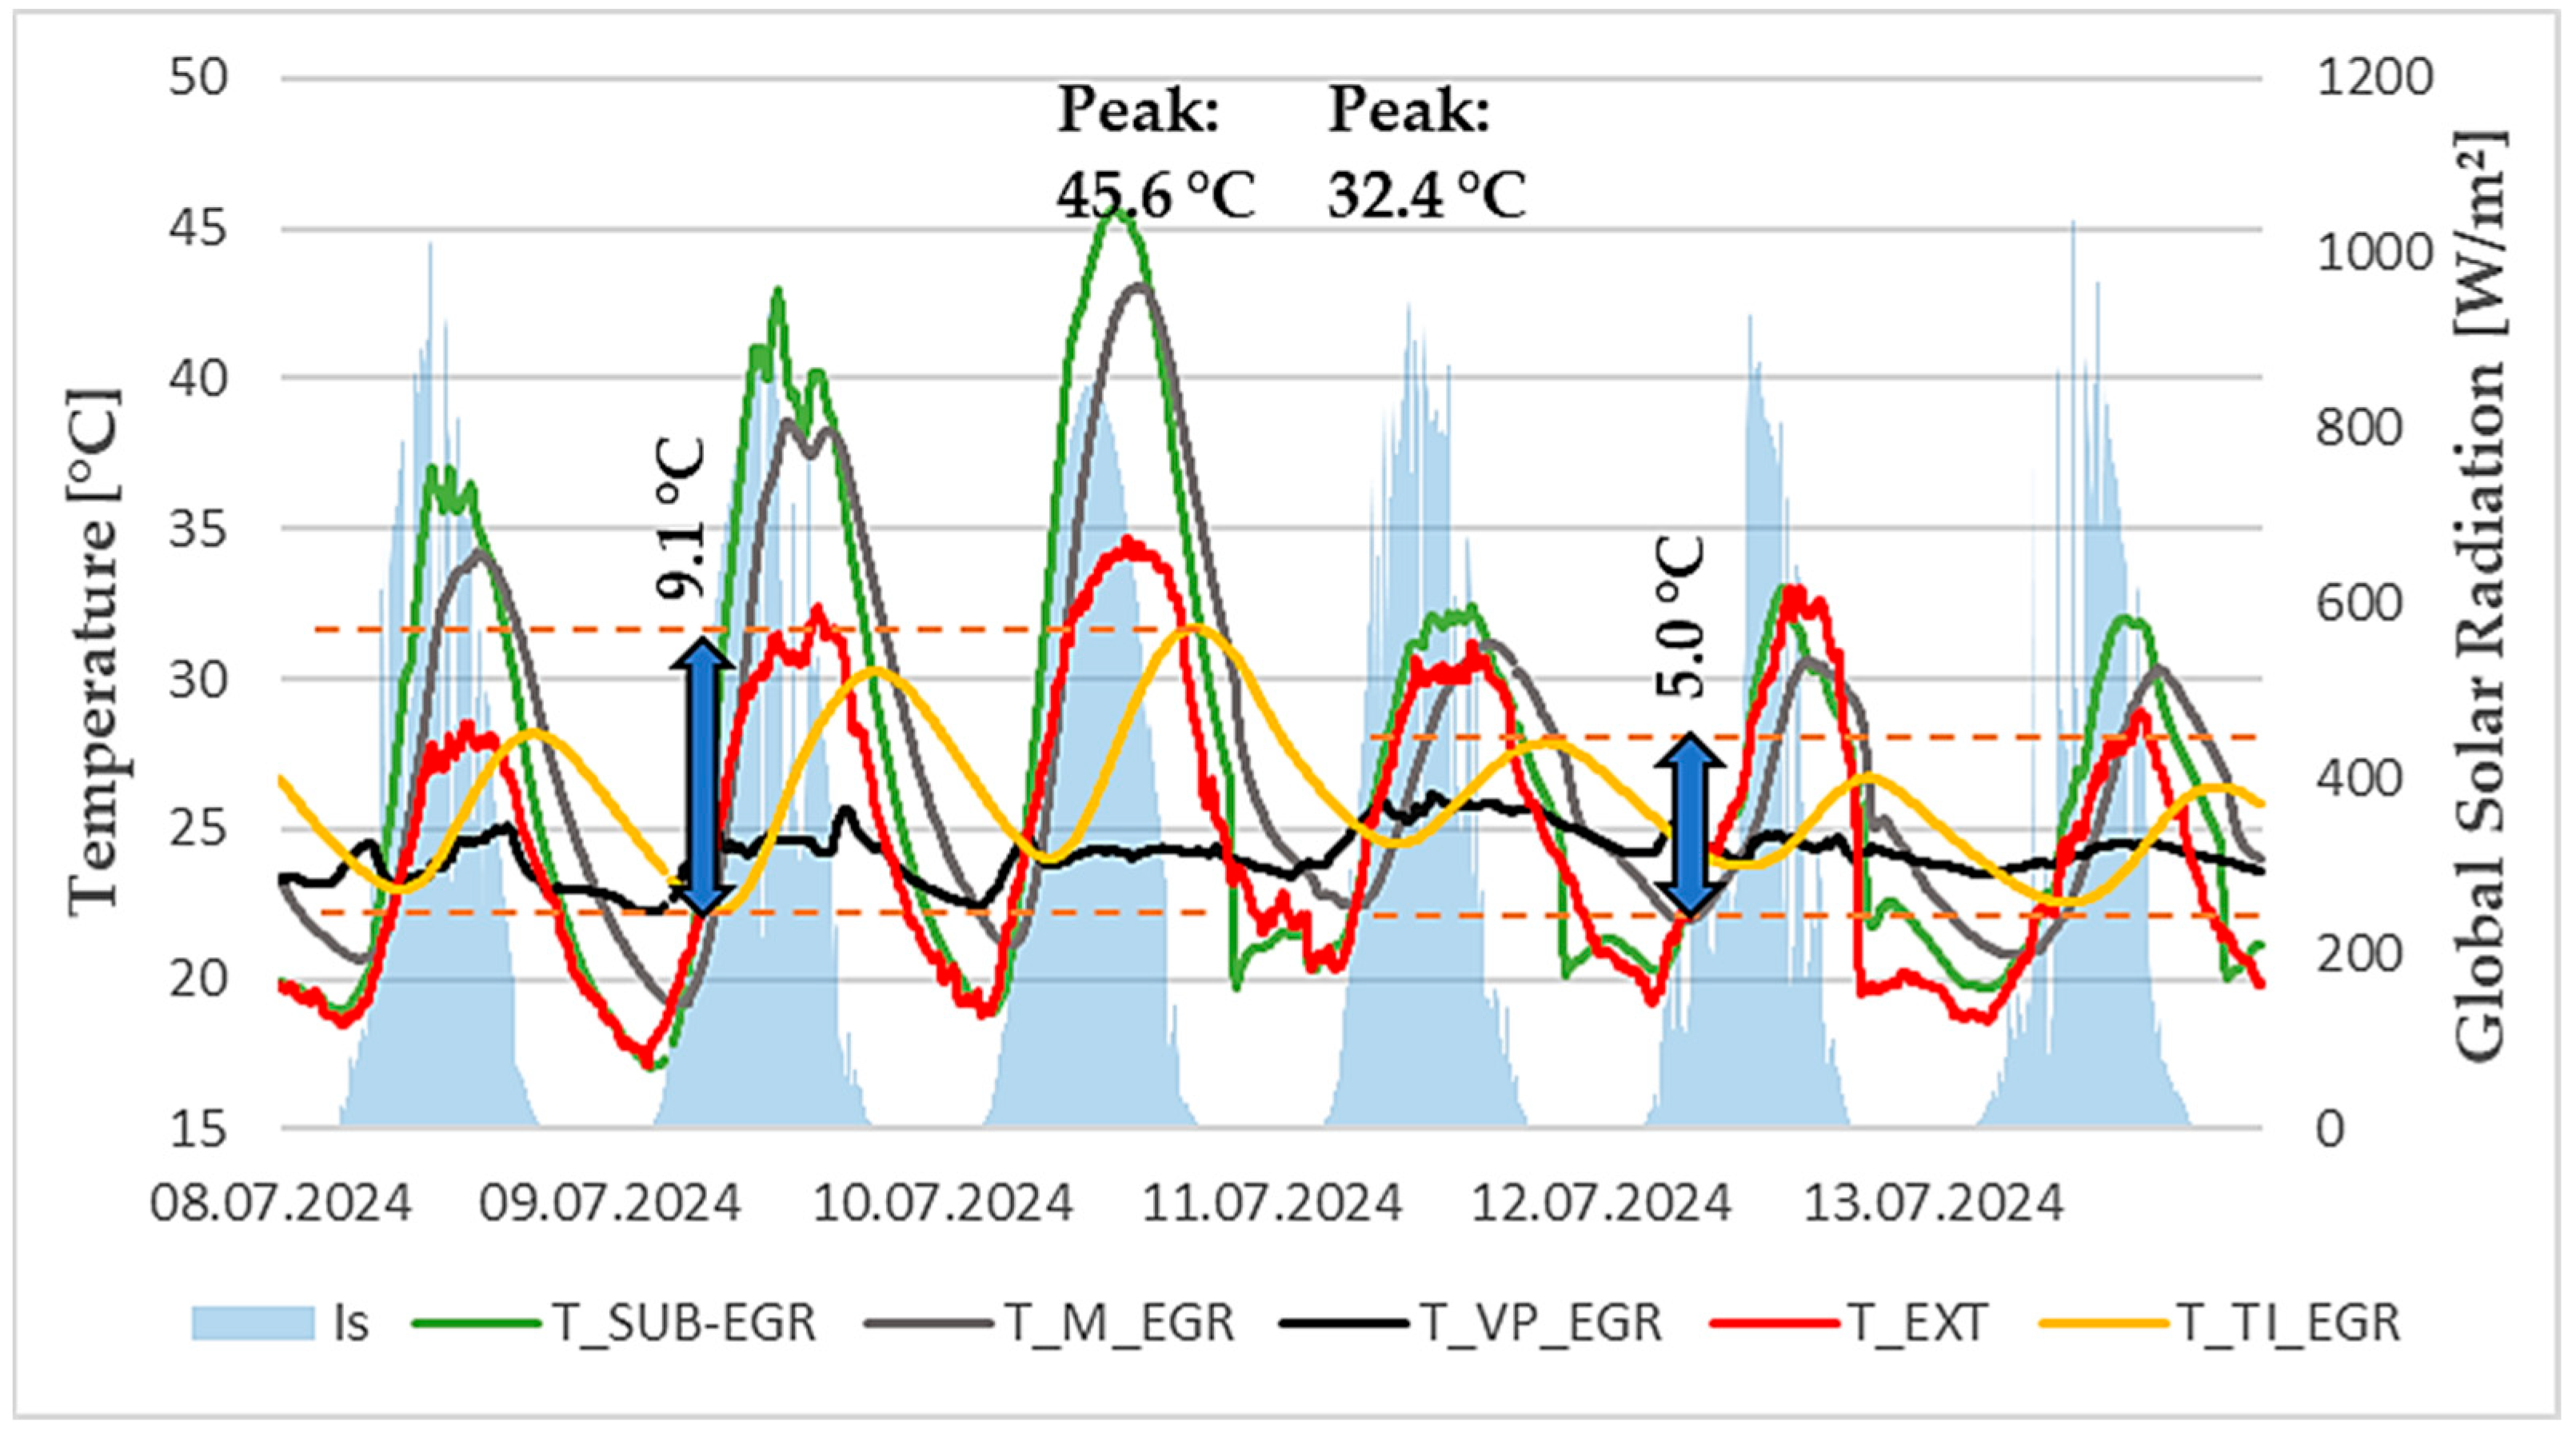
Analysis of the temperature curve in individual layers of the EGR sample confirms that restarting drip irrigation had a significant impact on the thermal regime of the entire composition (
Figure 14). The most pronounced effect was observed in the surface layers—in the substrate and at the level of the waterproofing layer, where the maximum daily temperature dropped by more than 13 °C. However, significant changes were also recorded in the deeper parts of the structure, specifically under the first layer of thermal insulation, where the difference in temperature fluctuations between the period without irrigation and the period after irrigation exceeded 4 °C.
A comparison of the temperature profiles in the EGR and RR samples reveals the hydroaccumulation and evapotranspiration effects of the green roof, which contributes to limiting overheating and mitigating daily temperature fluctuations. In the case of the RR sample (
Figure 15), there is a clear regular daily temperature fluctuation with a high range, with the temperature amplitude at the level of thermal insulation reaching values exceeding 15 °C. The temperature fluctuation at the waterproofing level is more than 26 °C in the case of RR, which is more than double the value in the case of restarting irrigation of the EGR sample. These differences highlight the ability of green roofs to stabilize the temperature regime of the roof structure through a combination of moisture accumulation and cooling via evapotranspiration.
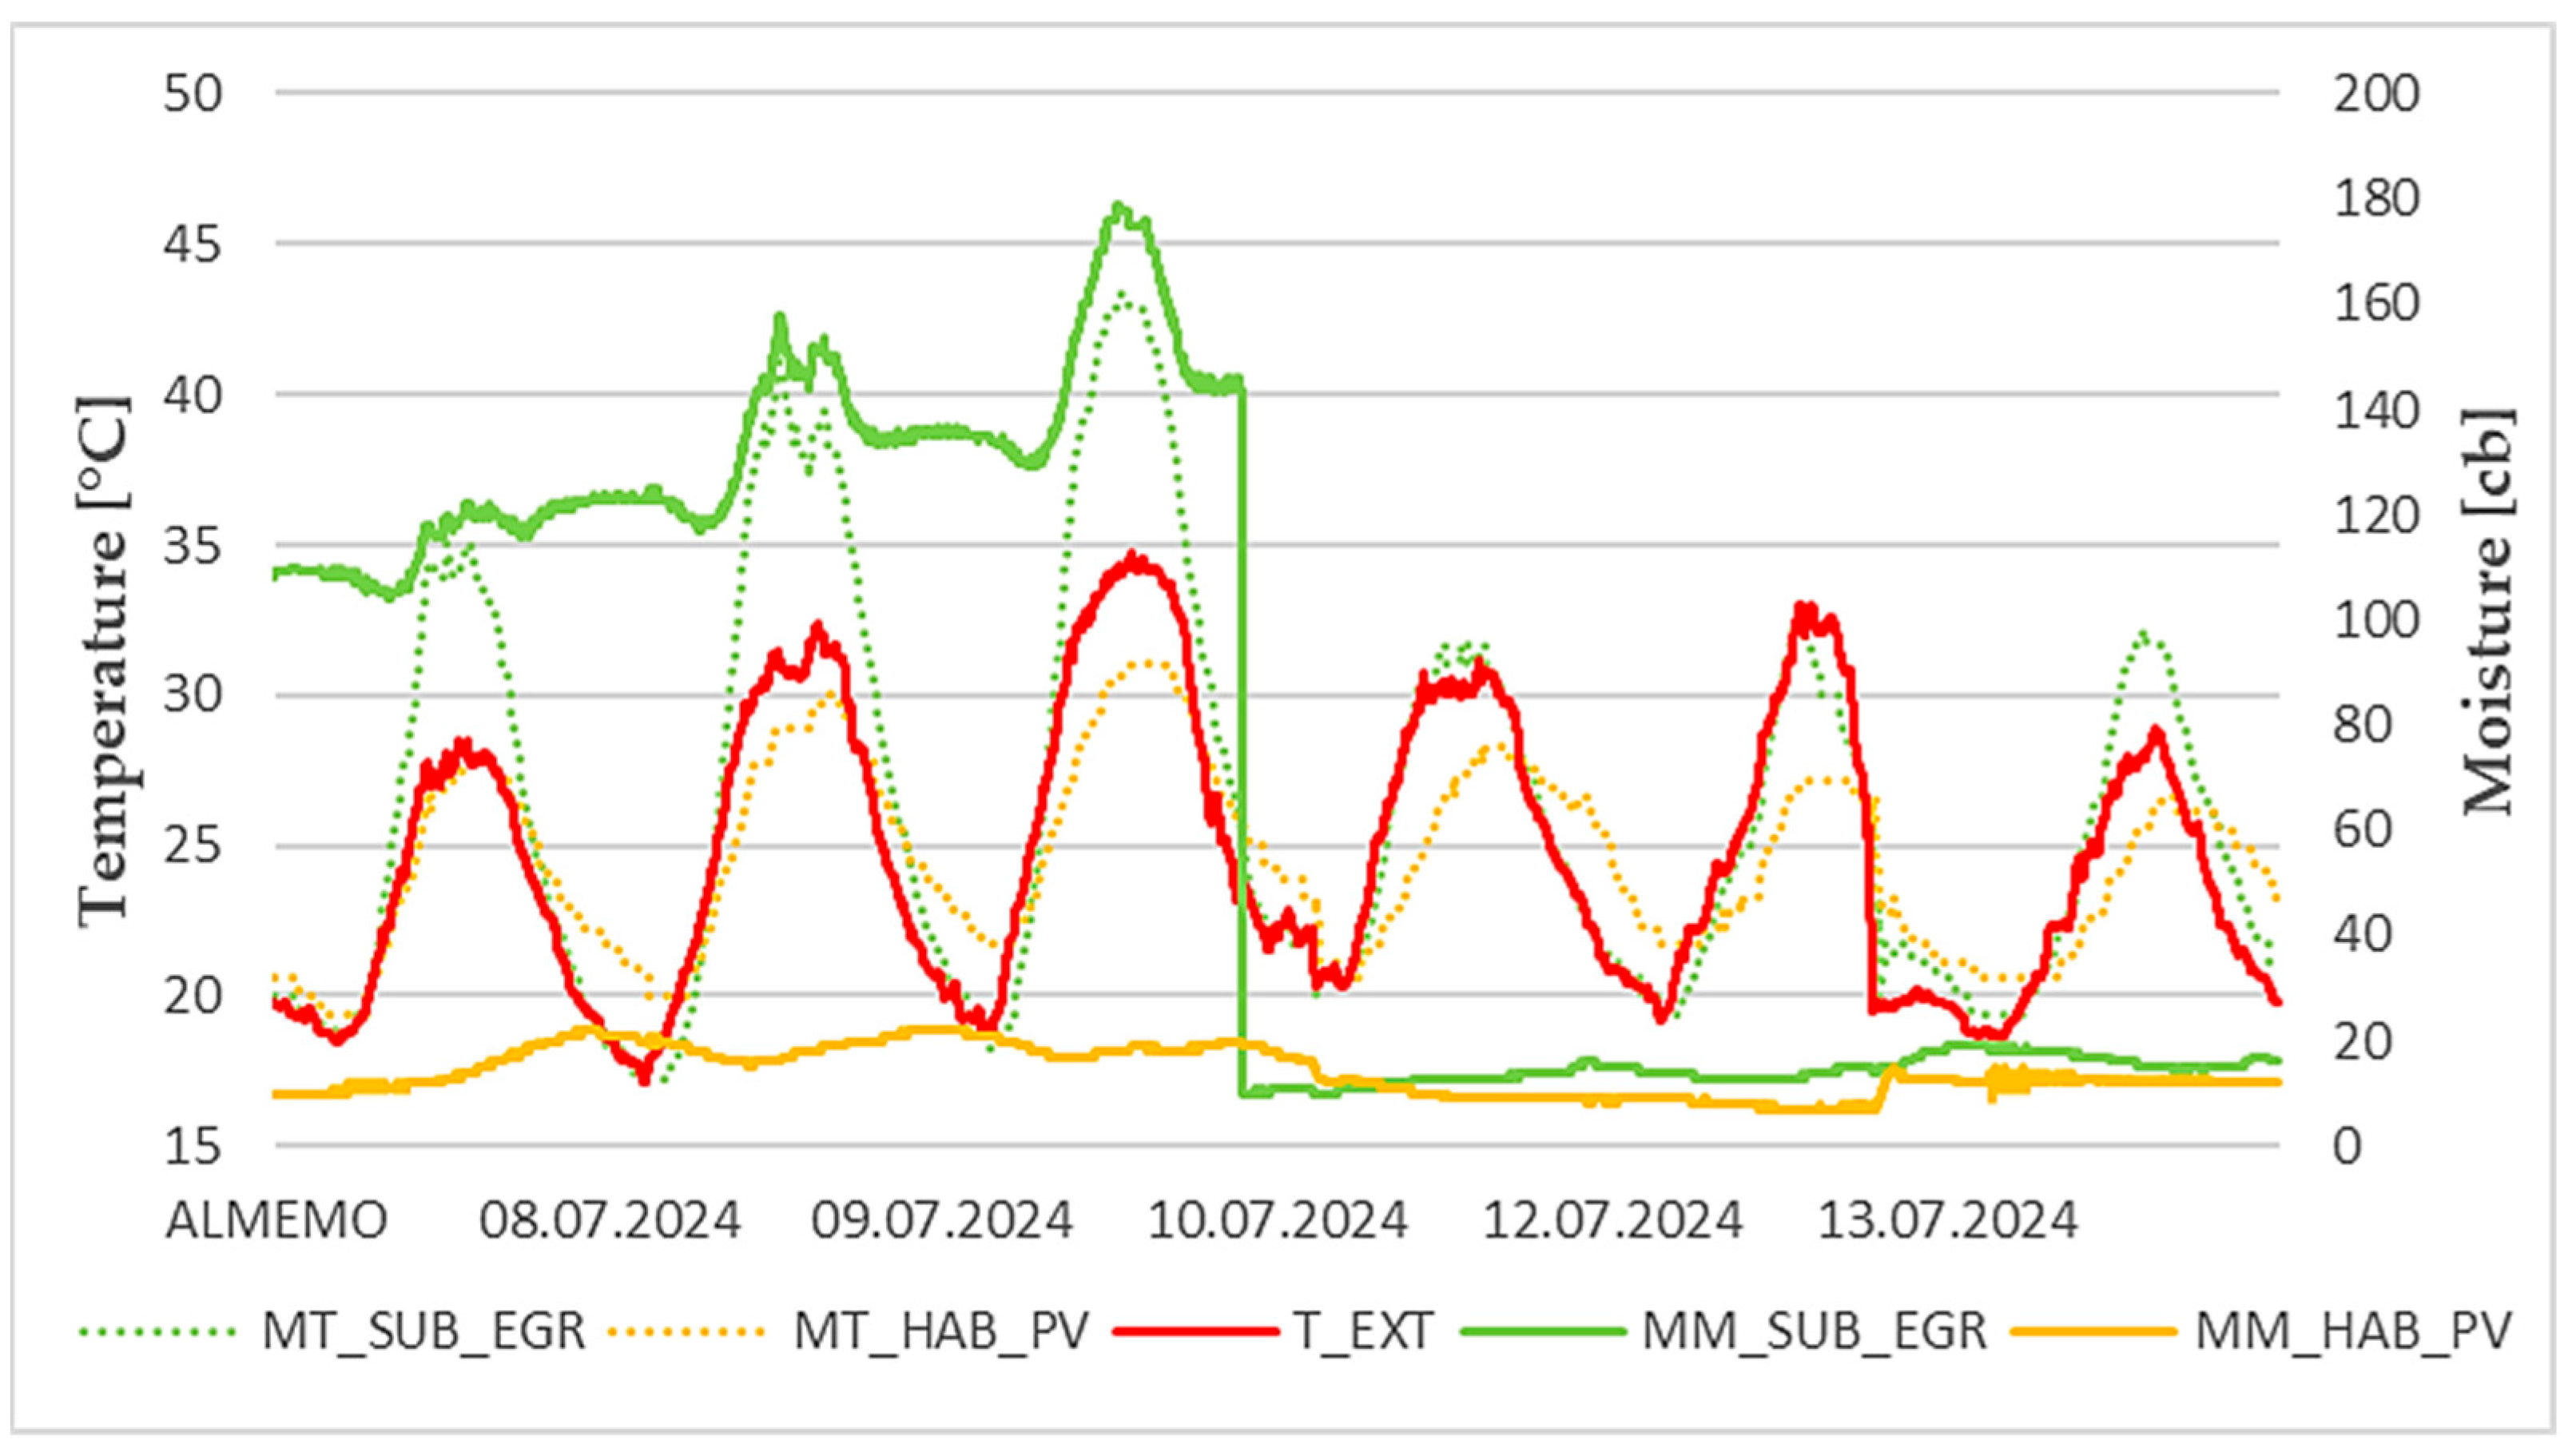
These results are followed by an analysis of moisture and temperature in the substrate (
Figure 16), which reveals significant differences between the period without irrigation and after its resumption. During the irrigation shutdown, there was a noticeable gradual daily decrease in moisture, accompanied by only a slight nighttime increase caused by condensation on the vegetation (presented by green solid line). The temperature of the vegetation increased proportionally to the drying of the substrate (presented by green dashed line) until it finally reached higher values than the temperature on the surface of the RR sample—a roof without vegetation. After restarting the drip irrigation, there was a sharp increase in moisture due to the presence of water in the system, accompanied by a simultaneous decrease in substrate temperature, indicating the immediate onset of evapotranspiration cooling. It should be noted that the vegetation in the EGR consisted of drought-tolerant Sedum species (perennials and cuttings), which were able to withstand nearly saturated substrate conditions (≈17 cb) without visible stress, maintaining their physiological activity and evapotranspiration function.
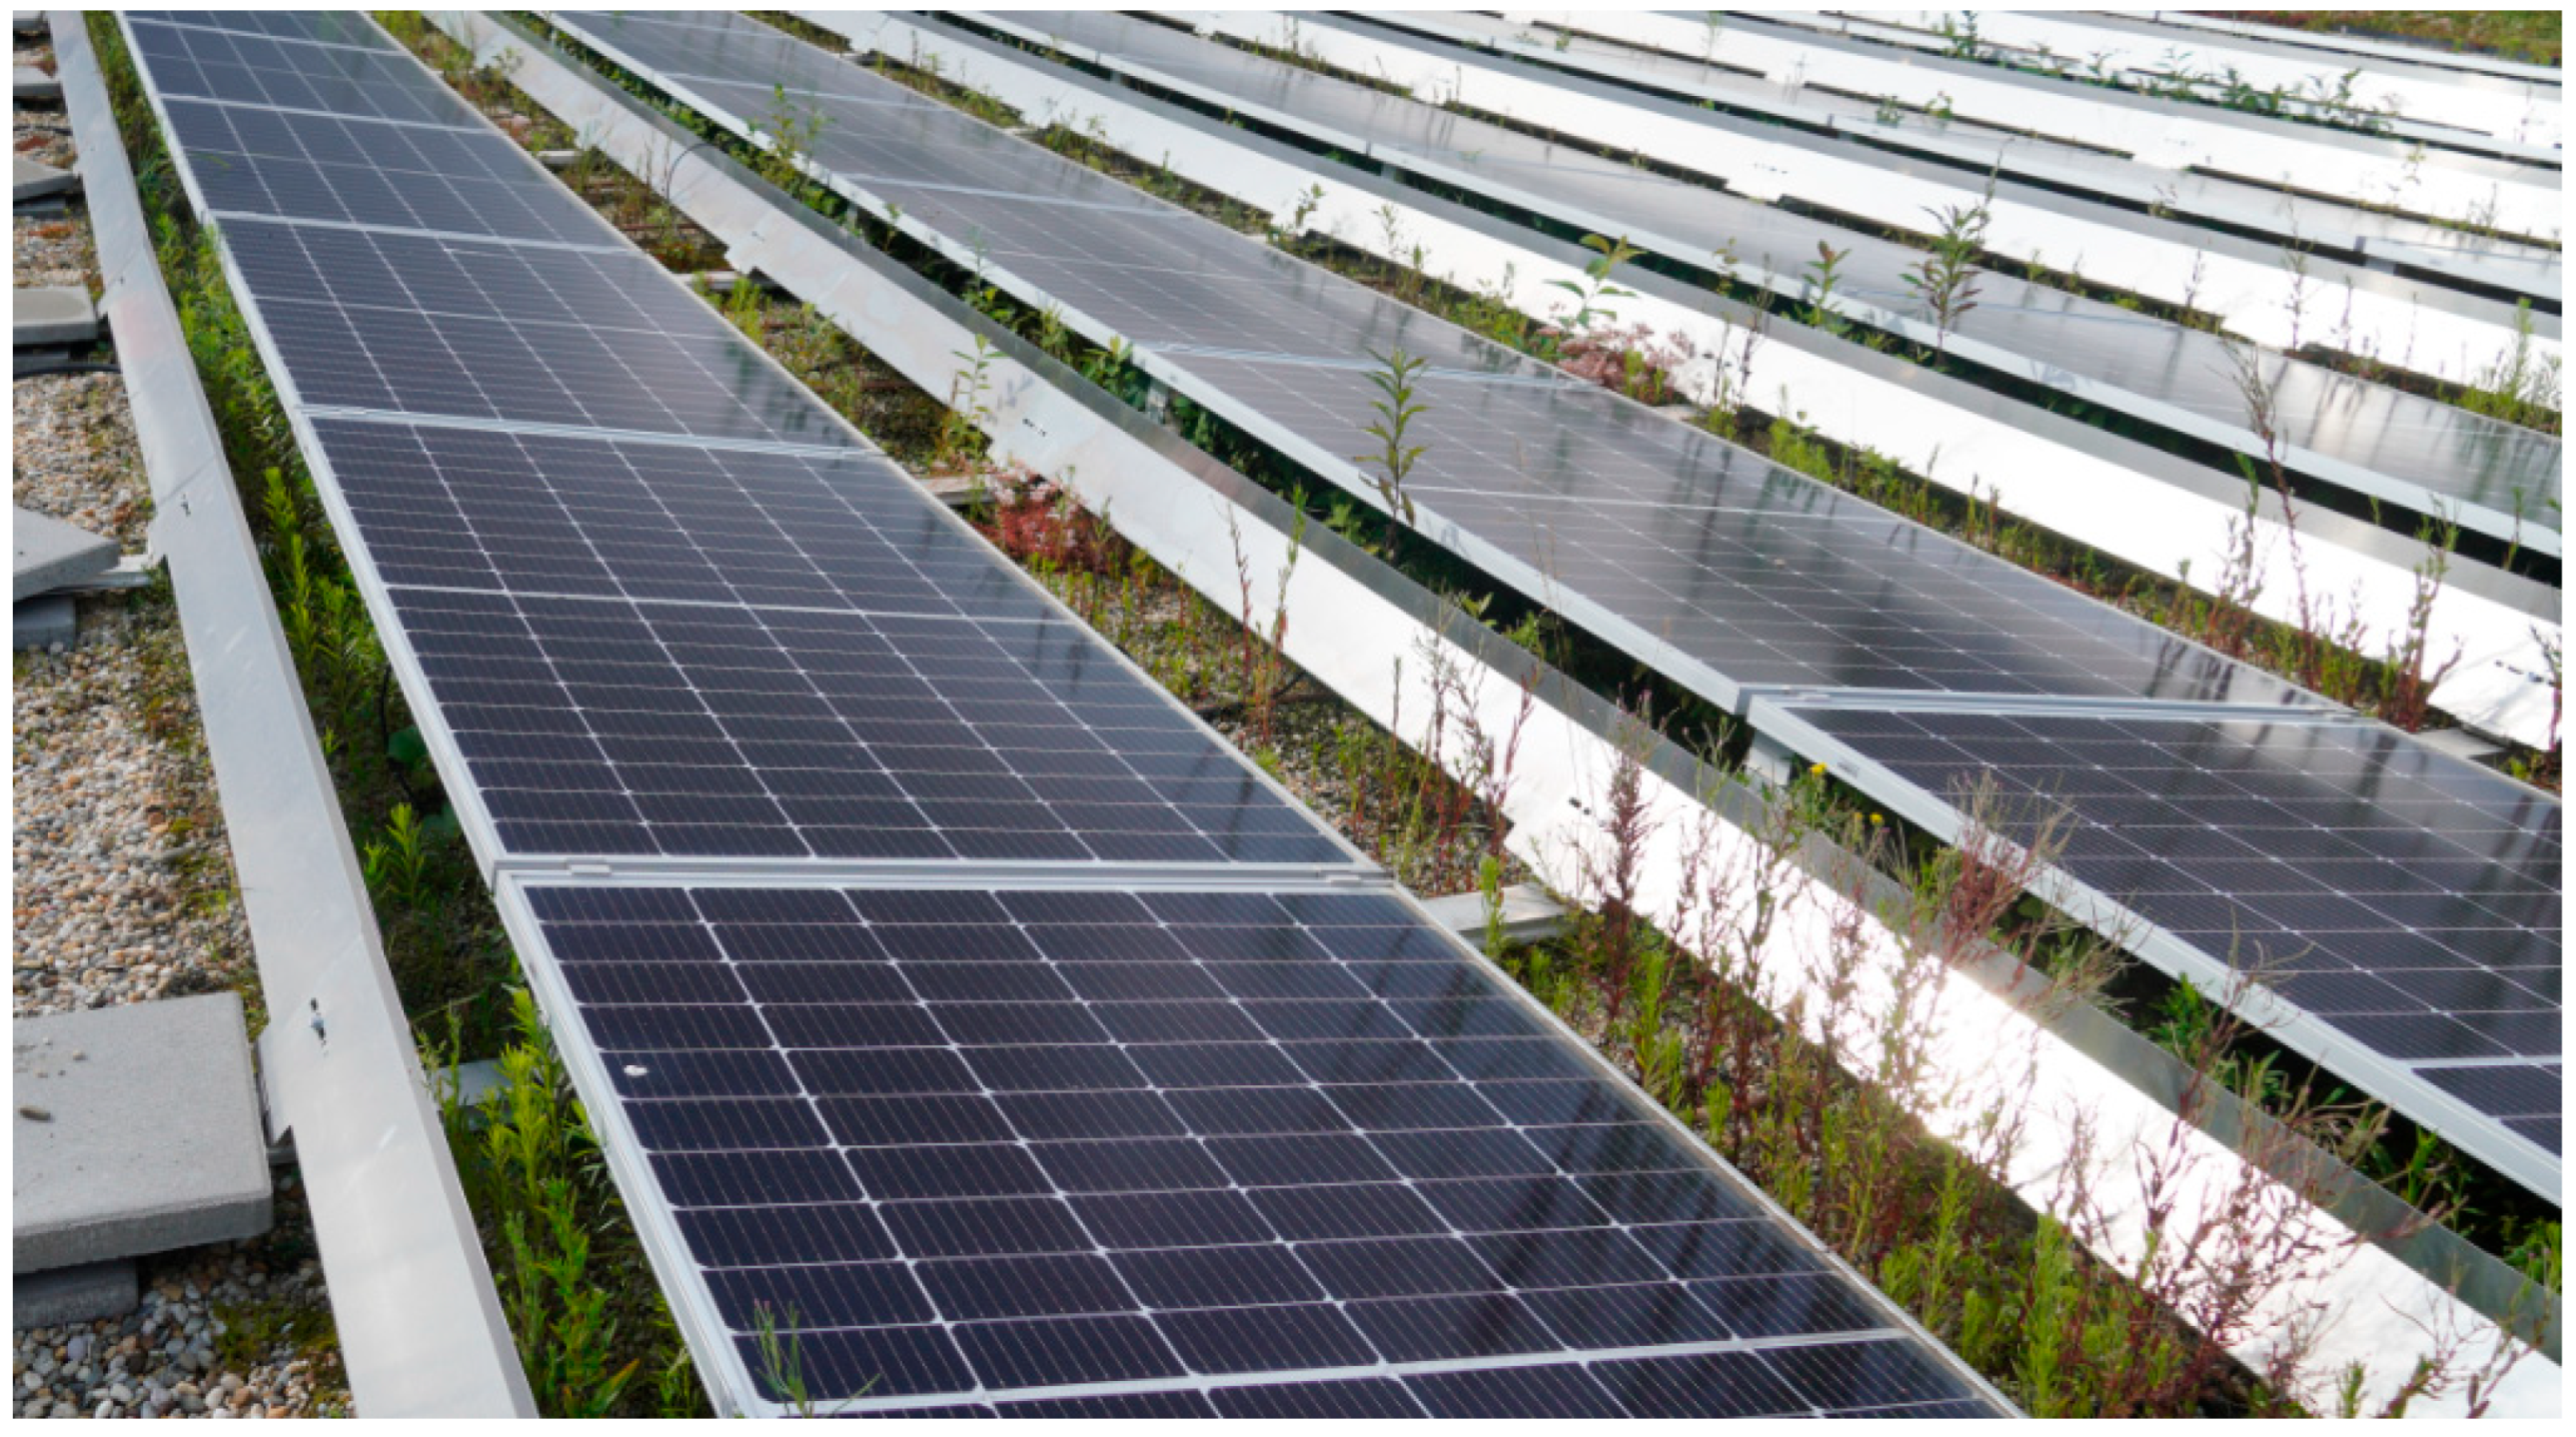
From this moment on, the EGR sample maintained a stable higher moisture content and lower temperature compared to the period before irrigation. On the contrary, the sample using PV panels maintains increased moisture in the substrate even when not irrigated due to the shading of the PV panels (presented by orange solid line). These areas are not exposed to direct sunlight, and without the vegetation, suitable moisture levels can be maintained in the hydroaccumulation boards—only evaporation occurs and due the PV shade is limited. After irrigation started, a drop in temperature was also observed in this sample (presented by orange dashed line), with values remaining consistently lower than the ambient air temperature.
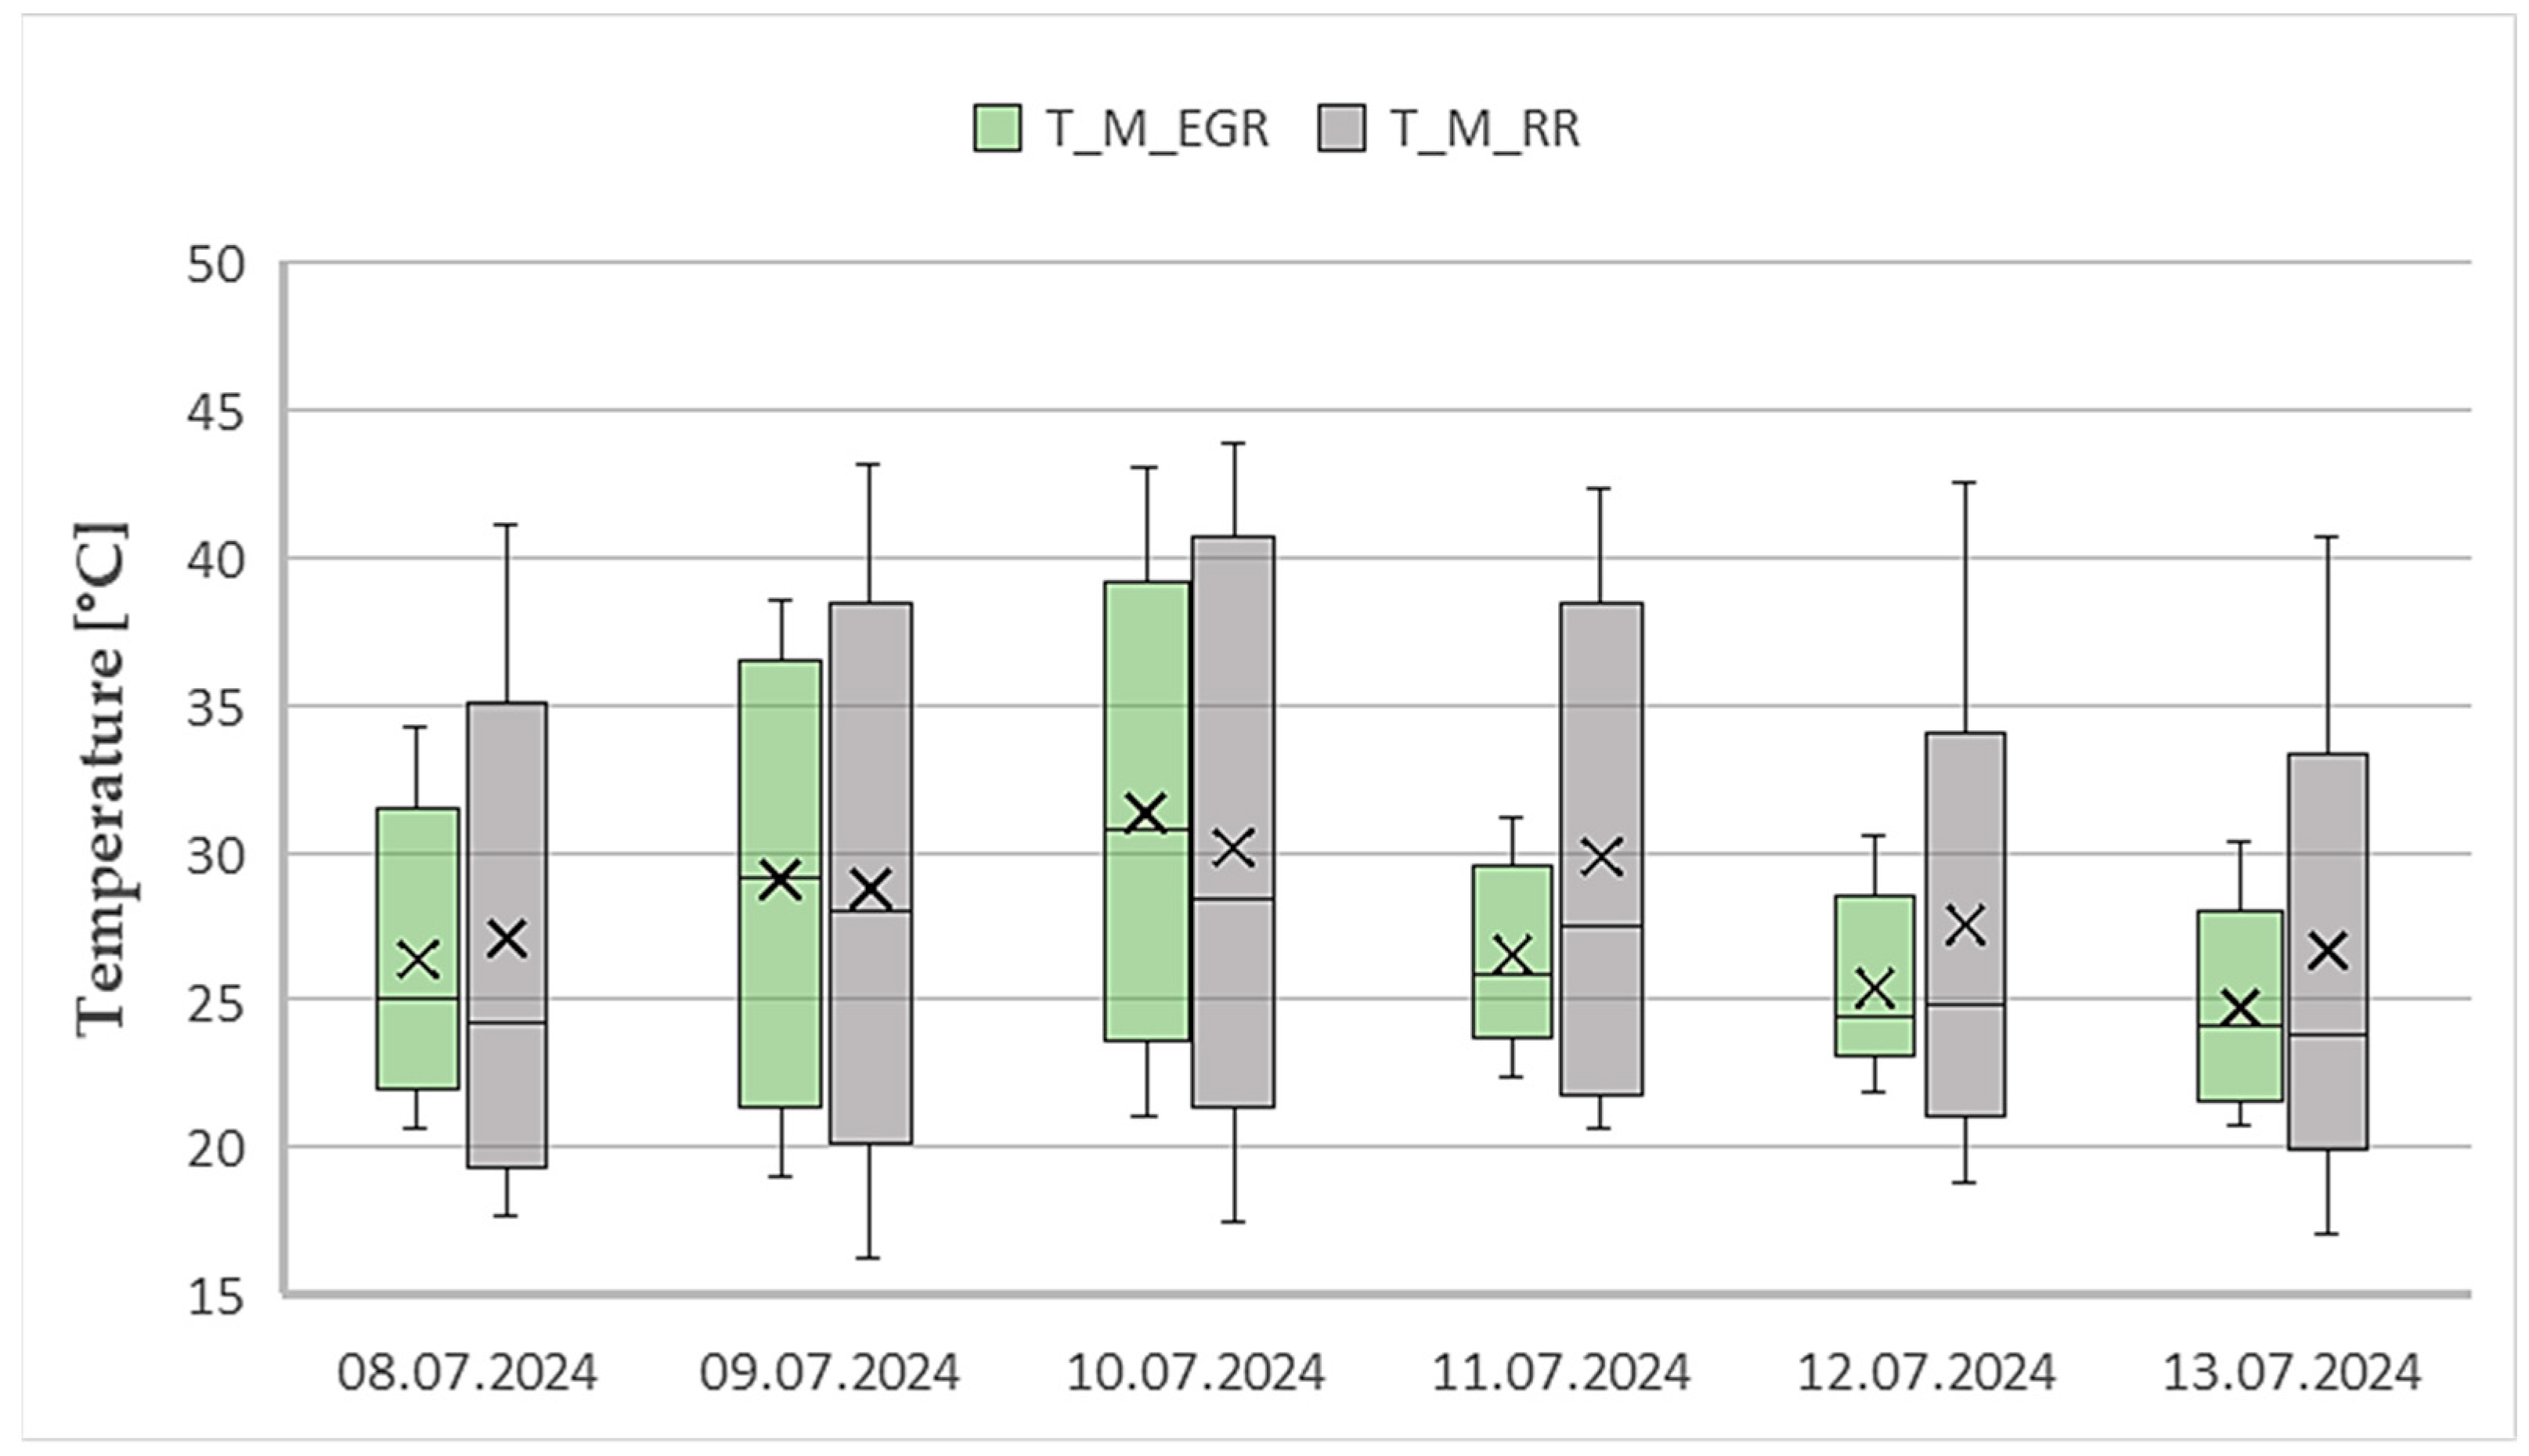
Active irrigation can effectively regulate the temperature profile in green roofs. It creates passive protection against temperature fluctuations, especially in the waterproofing zone, which is most exposed to outdoor weather conditions. Constant expansion and contraction throughout the year can lead to degradation of the integrity of the waterproofing membrane, creating potential damage points that can degrade the primary function of the flat roof waterproofing system. The following box plot graphs in
Figure 17 provide a more detailed analysis and comparison of the temperature curve at the waterproofing level between the RR and EGR samples. A shallow layer of vegetation substrates in a dry state has minimal protective potential in terms of reducing temperature fluctuations at the waterproof membrane. Gradual drying of the substrate reduces the possibility of evaporative cooling, which could maintain a favorable temperature. After restarting irrigation, when the substrate contains enough water to support effective evapotranspiration, we can notice a reduction in temperature fluctuations. Although the average temperature on 8 July 2024, and 11 July 2024, does not differ much, the temperature fluctuation has been reduced by more than half. Over time, this reduction in temperature fluctuation can prove to be a suitable passive protective effect not only for cooling but also in terms of extending the service life of the waterproofing material.
The graph in
Figure 18, which demonstrates a comparison of surface temperatures for EGR and PV samples, highlights the active shading technique when using PV panels. PV panels in combination with water accumulation boards, which are also irrigated, can effectively regulate the temperature in the space under the PV panels. The shading technique of PV panels can effectively dampen temperature fluctuations even when irrigation is not running. After irrigation is started, the sample using PV panels maintains a lower temperature curve and lower temperature fluctuations than the EGR sample.
Active irrigation in the context of green roofs has a crucial role in the thermal regulation of the structure. Not only in terms of reducing temperature fluctuations and optimizing the overheating of the structure as part of the protective function of the waterproofing system, but also in terms of heat flow transport and thus the impact on the energy balance of the building. The following graphs relating to heat flow transport through the structure demonstrate not only a reduction in fluctuations, but also an overall reduction in the amount of heat passing through the structure into the interior of the building. Within the scope of this experiment, we do not clearly determine the impact of heat flow reduction on limiting the overheating of the building in the summer, as the industrial hall has a large amount of open space. In addition, the interior is significantly influenced by the production technology and the distribution of sunlight through skylights in the roof structure, which ensure an optimal working environment in terms of lighting technology. However, we can express the impact of limiting heat transfer to the interior through a fragment of the structure and point out the differences in individual, commonly implemented compositions.
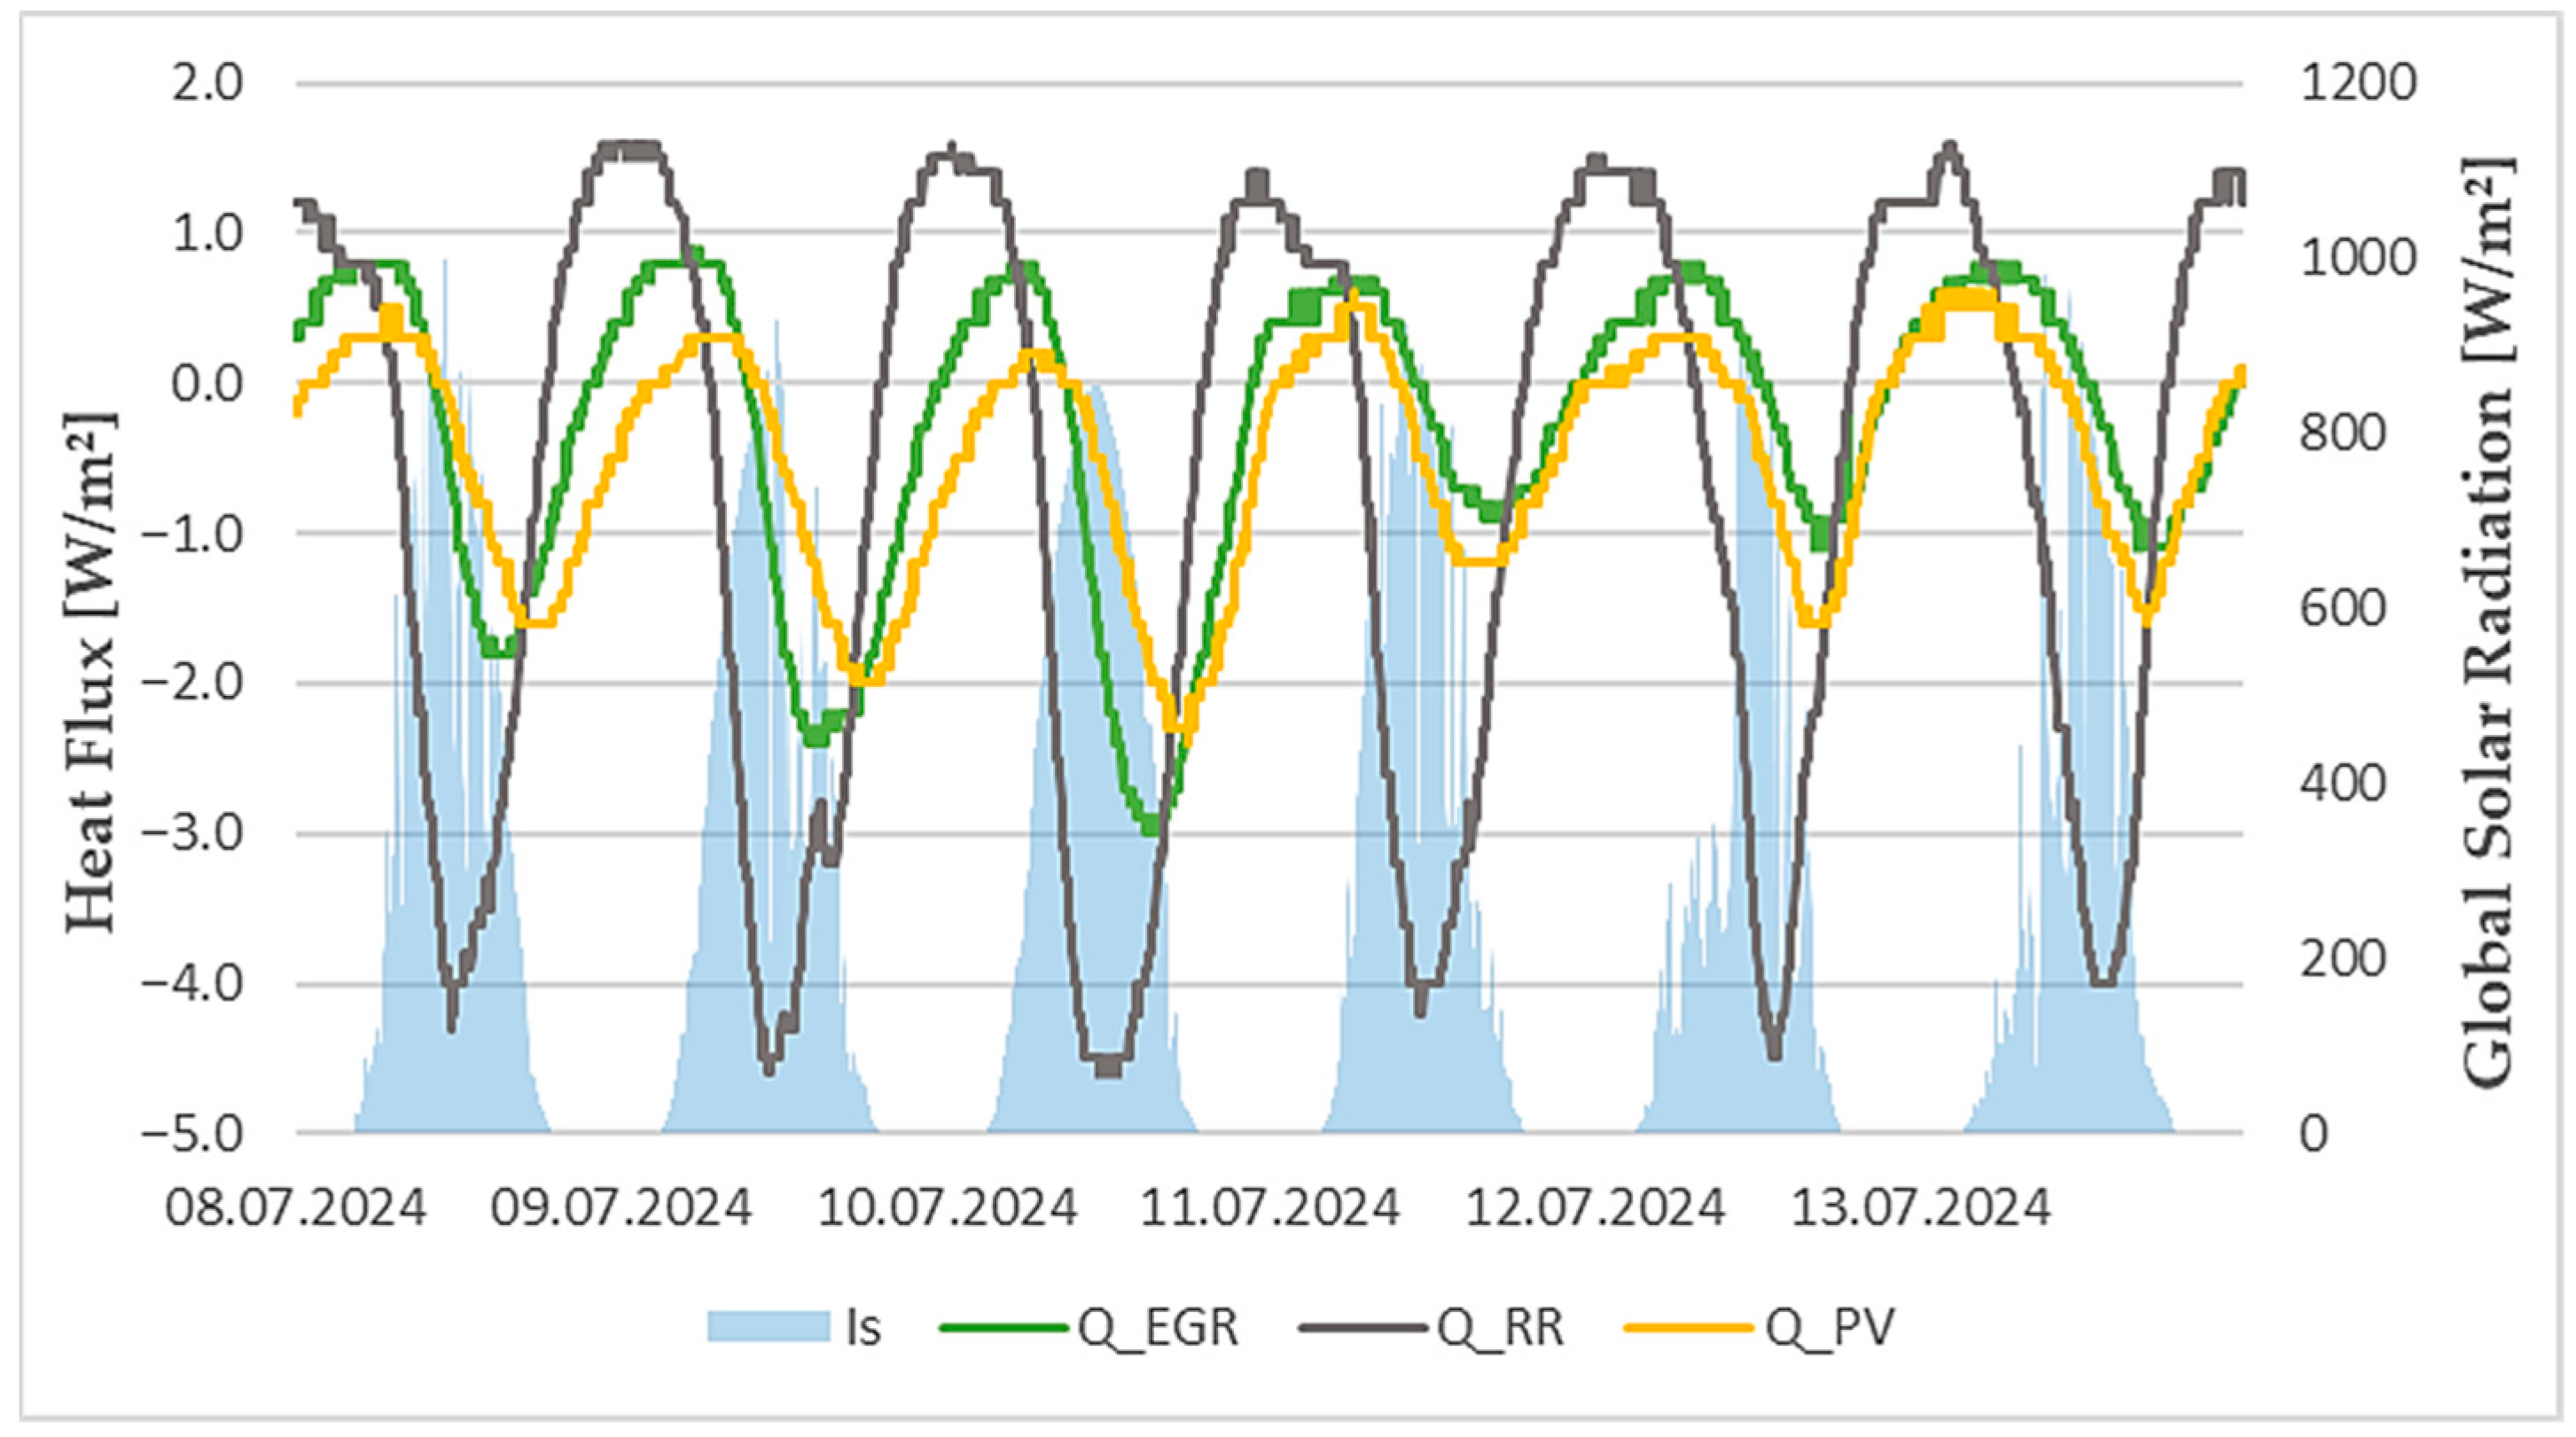
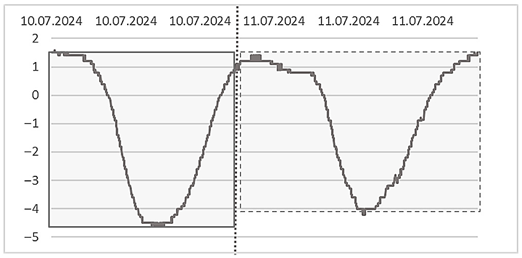
The graph in
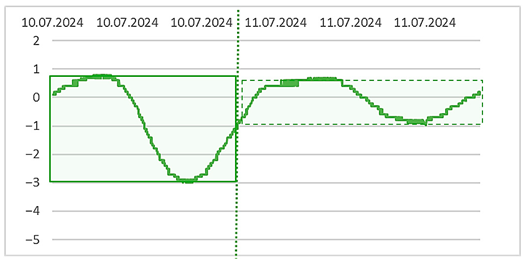
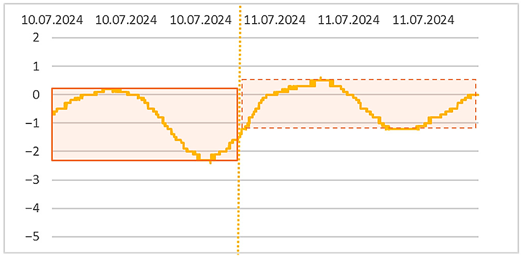
Figure 19 presents the results of heat flux density transport through the individual samples observed. Negative values represent heat gains (to the industrial hall’s indoor air), while positive values represent heat losses (to the outdoor air). The graph indicates that the RR sample has the highest heat flow. The increase in temperature during sunny days and the presence of solar radiation, which increases the temperature near the outer surface, cause an increase in the amount of heat passing through the structure. In the case of the EGR and PV samples, a phase shift from heat loss to heat gain can be noticed in comparison with the reference sample. In the case of the EGR sample, the shift is 2.5 h, and in the case of the PV sample, it is almost 3.5 h. Although the temperature curve in the non-irrigated RR and EGR samples was similar, the vegetation layer can absorb and accumulate a significant portion of the solar energy and does not allow it to pass into the interior. EGR samples use the incident energy for the viability of the plant cover and, unless the vegetation cover dries out completely, they contribute to evaporation and thus reduce the amount of heat energy entering the interior. Radical changes occur when irrigation is started. As soon as sufficient water reaches the substrate, the evaporation process begins during the day. The amount of solar energy hitting the surface of the structure no longer passes into the interior but is used for ET. The result is a reduction in the building’s thermal load, as only a portion of the incident radiation is transferred through the roof structure to the indoor space of the industrial hall, while a significant fraction is utilized for water evaporation. The phase shift from heat loss to heat gain in the EGR sample is shifted by almost 5 h compared to RR. The heat flow fluctuation in EGRs was reduced from 3.9 W/m
2 to 1.9 W/m
2.
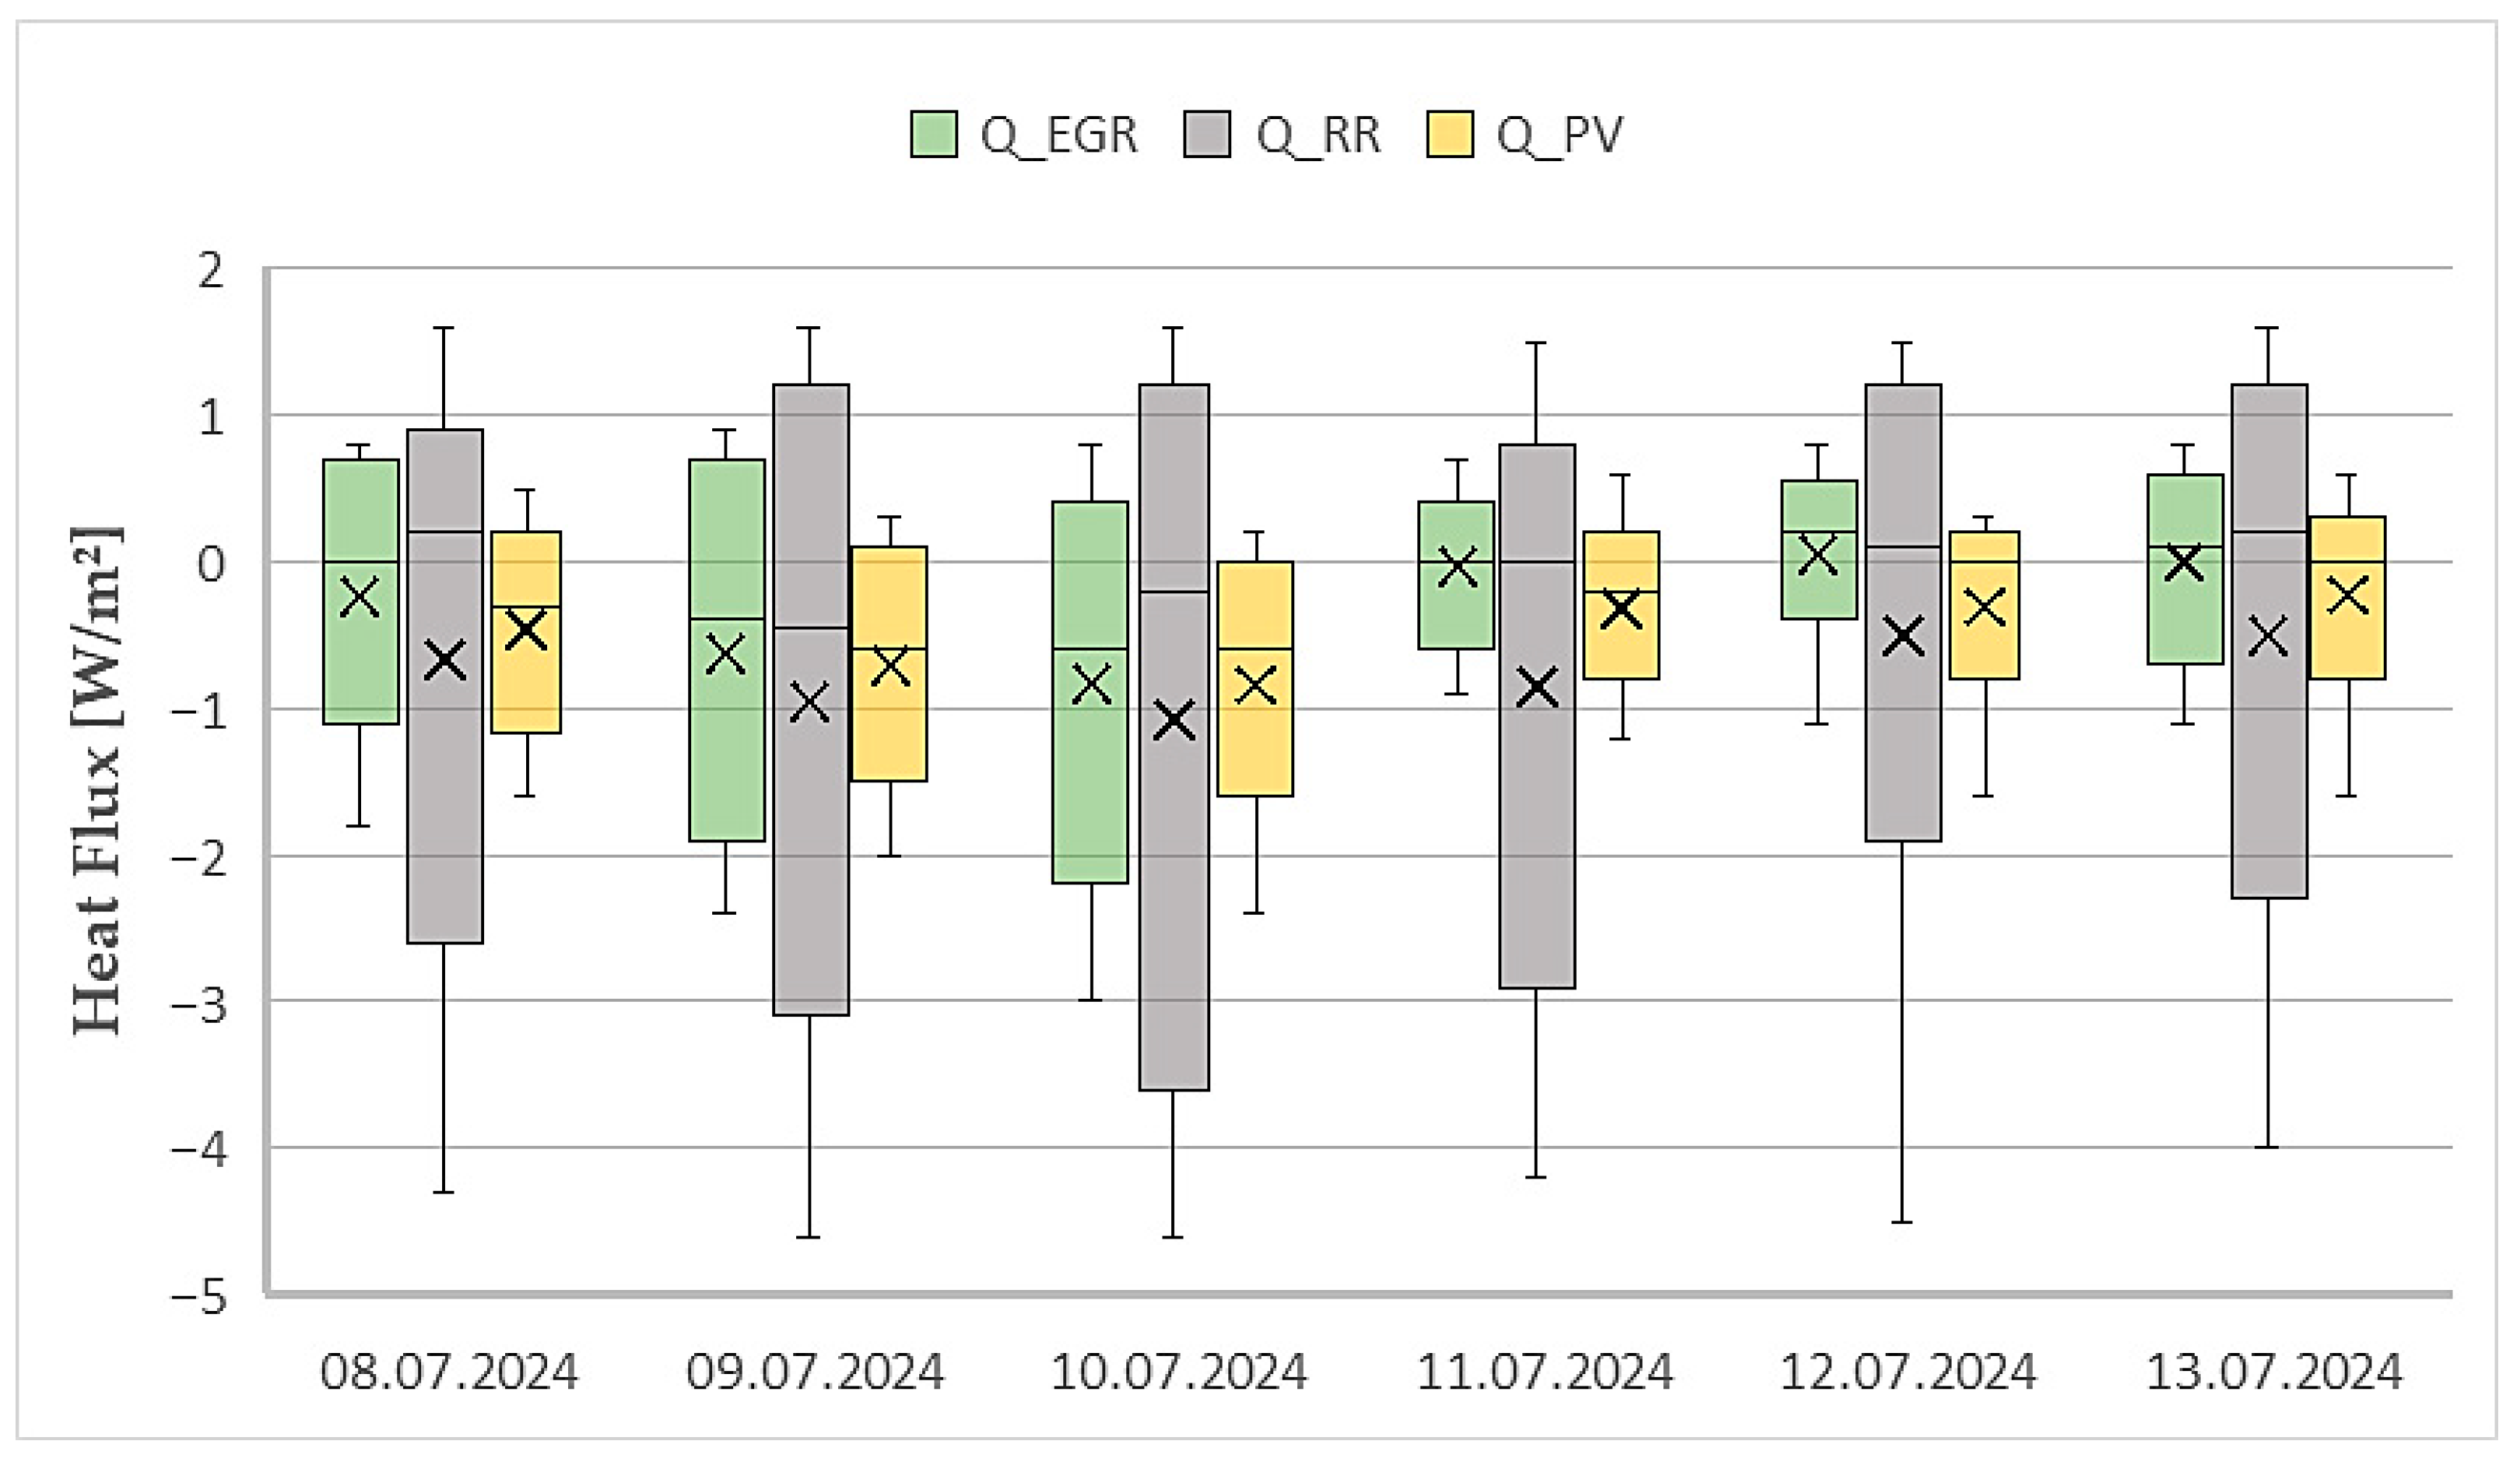
Figure 20 presents a box plot showing the statistical distribution of heat flux density for the observed roof samples over a 24 h period. Negative values indicate heat gains directed into the interior, whereas positive values represent heat losses from the interior. It should be noted that this representation summarizes daily variability and does not capture specific diurnal dynamics or the potential benefits of heat gains or losses under varying indoor conditions—for example, heat entering the hall may be beneficial during cooler night periods, whereas heat removal could be less desirable when indoor temperatures are low.
The box plot highlights that, during the irrigated period, the EGR sample exhibited reduced heat gains compared to the PV and RR samples. Specifically, afternoon heat flux into the interior with the EGR decreased by 40–55% relative to the non-irrigated period, while the PV sample showed only a minor reduction (10–15%) due to partial shading by the panels, and the RR sample remained nearly unchanged (see
Figure 19). These results suggest that irrigated EGRs can enhance evaporative cooling under high solar radiation conditions, even though PV panels maintain lower hydroaccumulation board temperatures. This demonstrates that, although PV panels provide effective shading and can keep the sample cooler than the EGR vegetation cover (
Figure 18), PV does not provide as effective evaporative cooling as EGRs—the EGR sample indicates substantially lower heat gains into the hall interior compared to the PV sample (
Figure 20). A vegetation sample exposed to direct sunlight can consume and utilize a significant portion of solar energy for natural evaporation.
The observed effects are specific to the studied conditions and should not be generalized without further investigation. Furthermore, the importance of net solar radiation (Rns) as a factor influencing evapotranspiration rates is emphasized; however, its exact impact requires more detailed analysis under varying climatic and operational conditions.
Based on a comparison of the heat flux density between irrigated and non-irrigated days, we can numerically determine the percentage of solar energy consumption for evapotranspiration from the EGR sample during active irrigation.
During the monitored period, the highest daily sum of solar radiation intensity (IS) was recorded on 10 July (non-irrigated day), reaching a value of 435,022 W/m
2, which corresponds to approximately 26.10 MJ/m
2 per day. The net solar radiation incident on the structure when determining the theoretical ET after taking albedo into account was 20.1 MJ/m
2. On this day, the highest value of theoretical evapotranspiration (ET) was also determined at 6.26 mm/m
2·day (
Figure 12). However, since drip irrigation was not activated on that day, it was not possible to achieve full ET. The incident solar energy was therefore not significantly used for the process of water evaporation but appeared as an increased density of heat flow penetrating into the interior.
The following day, 11 July, the irrigation system was working again. The daily IS sum on this day reached 392,199 W/m
2, which represents approximately 23.53 MJ/m
2 per day. The net solar radiation incident on the structure, after considering the albedo, was 18.12 MJ/m
2. The theoretical ET was calculated at 5.18 mm/m
2·day (
Figure 12). For the average daily temperature, the latent heat of evaporation of 1 L·m
−2 of water was 2.43 MJ/m
2. Full ET thus required 12.59 MJ/m
2, which corresponds to approximately 69.5% of the total net solar radiation. For better readability, the mentioned values of solar radiation and theoretical evapotranspiration are summarized in
Table 4.
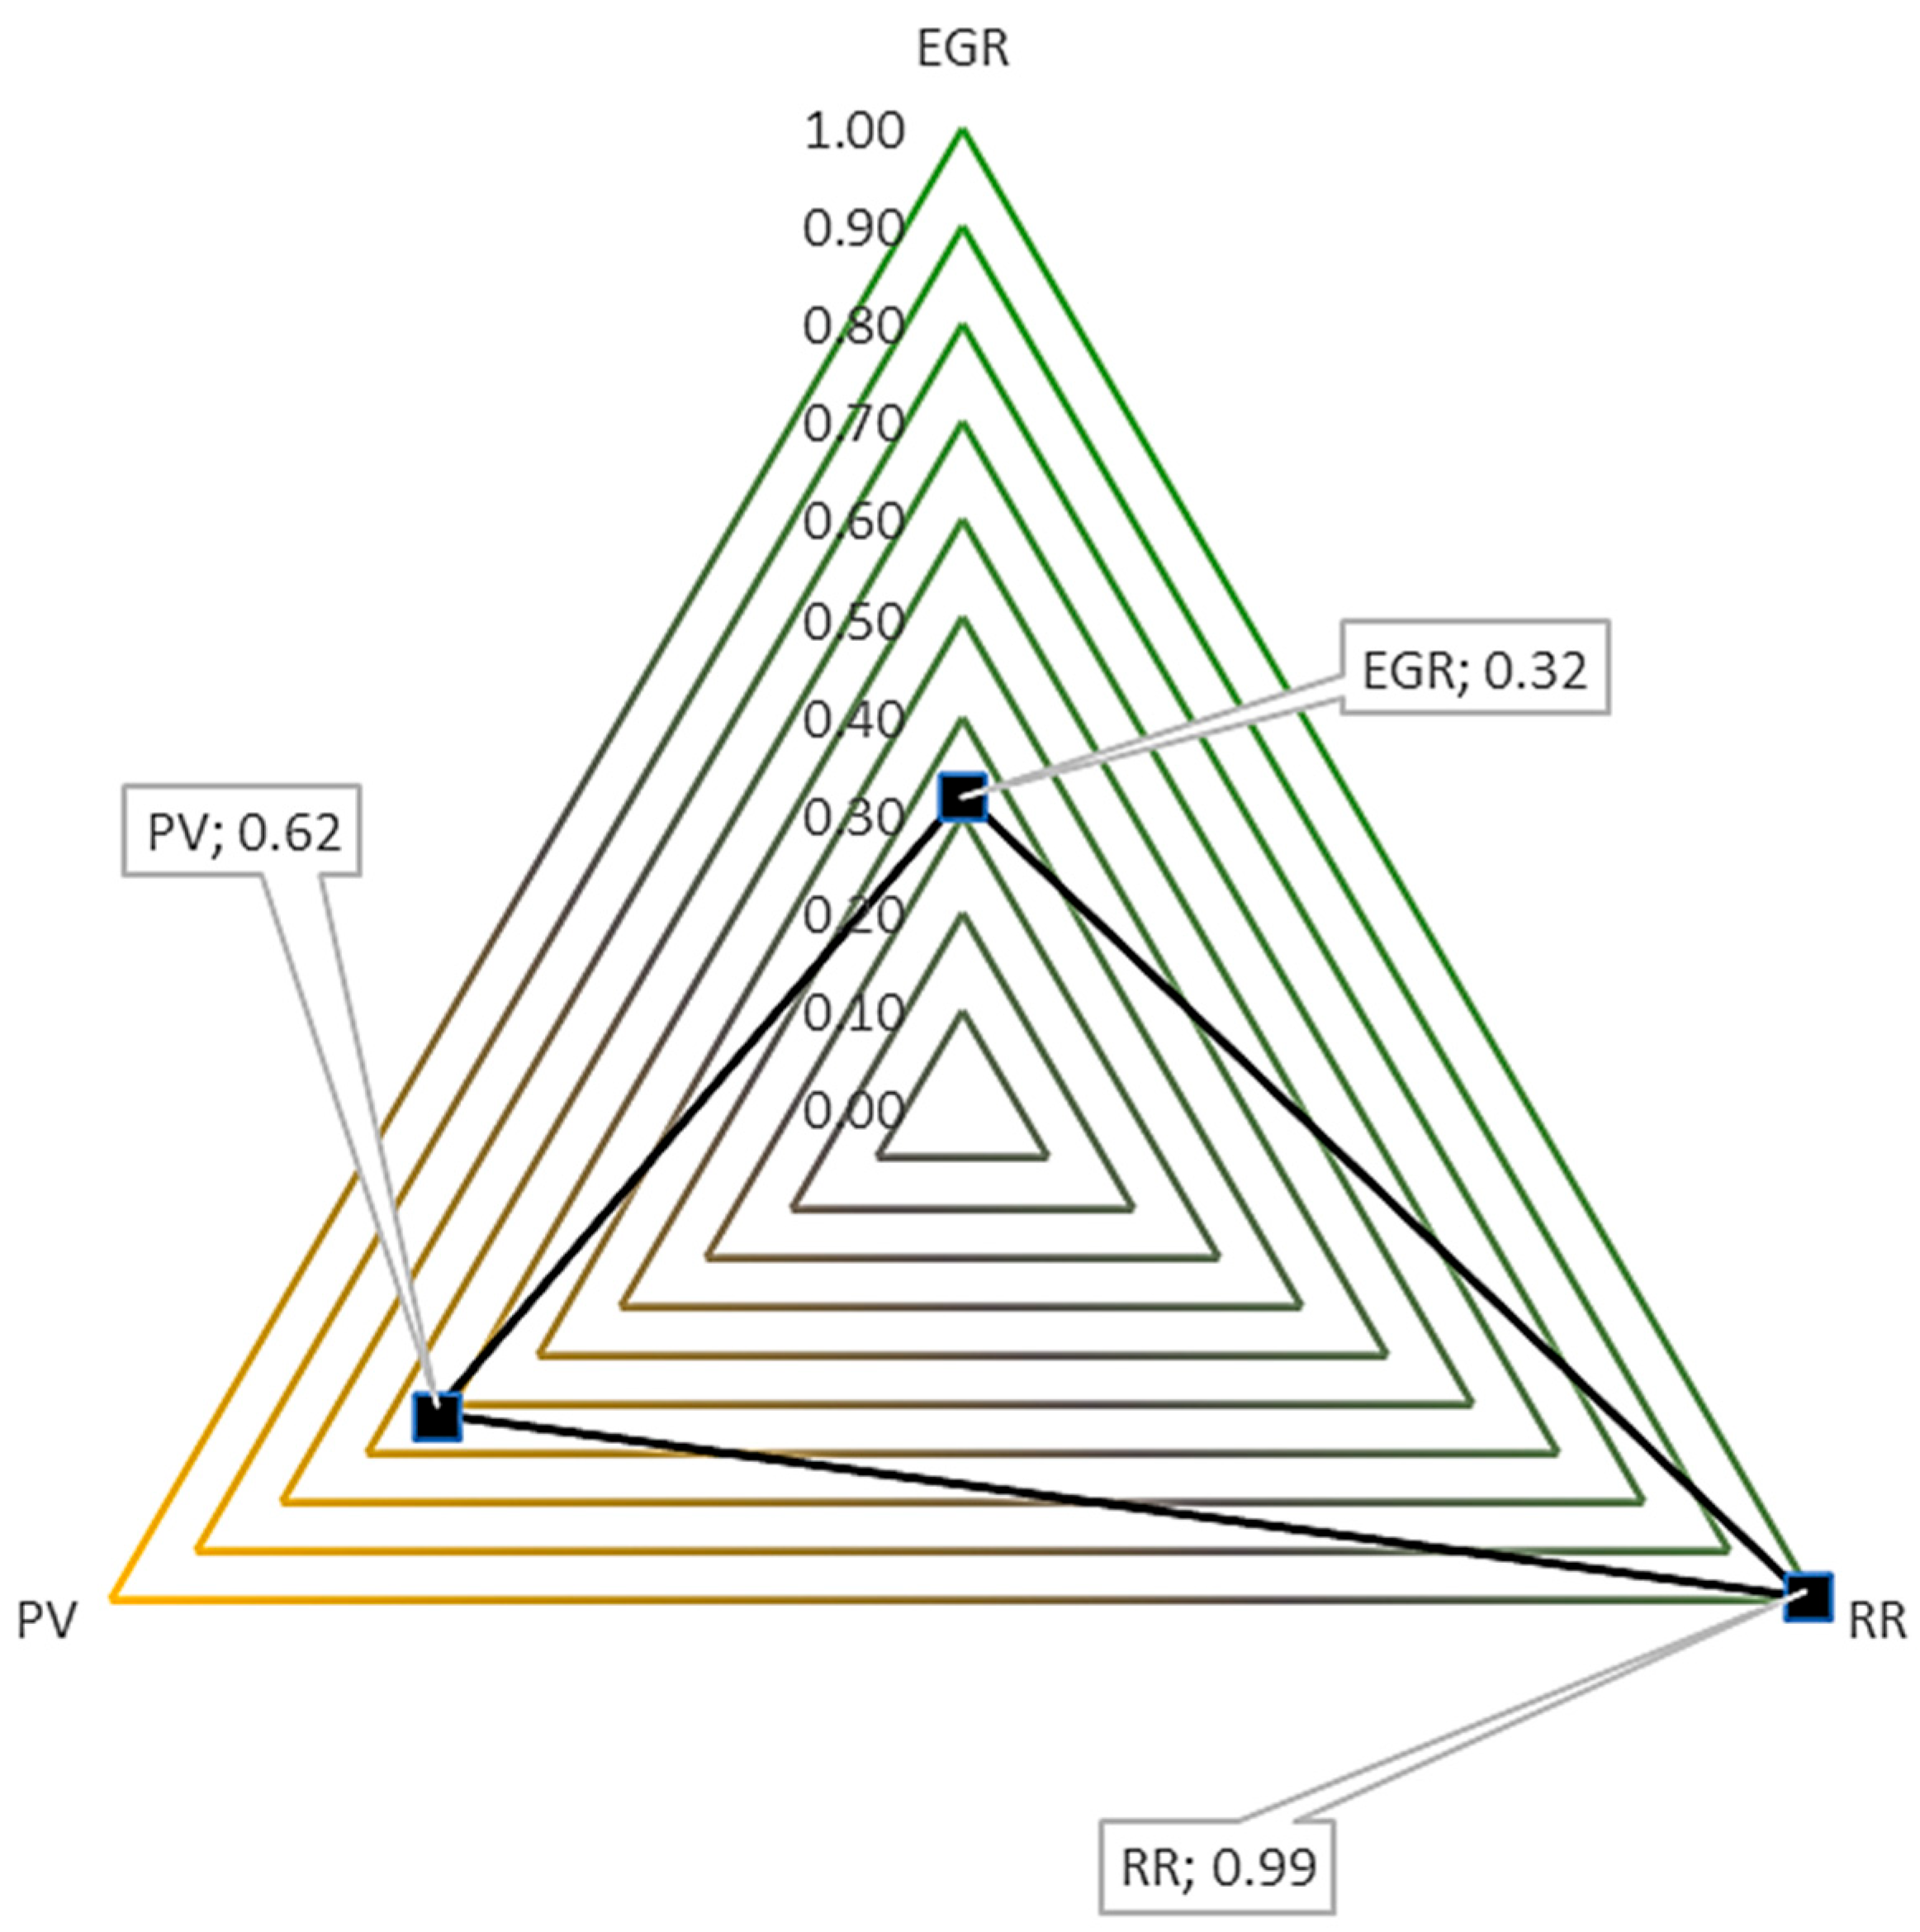
A comparison of the non-irrigated (10 July) and irrigated (11 July) days demonstrate that the heat flux density transmitted into the interior in the case of the EGR sample, after conversion to the difference in incident solar energy, was only 32% of the previous day’s value on the irrigated day. This effect differed significantly between the individual samples. Comparison of heat flux density between individual samples during non-irrigated and irrigated days (
Figure 21):
the reference roof (RR) showed almost identical transfer (only 1% difference),
the sample with photovoltaic panels (PV) showed a 38% reduction,
the extensive green roof (EGR) showed a reduction of up to 68%, which corresponds to approximately the percentage of incident solar energy used for the theoretical ET process on that day.
The analysis of heat flows confirmed the ability of green roofs with active irrigation to reduce the amount of heat transfer into the interior of the building and at the same time shift the phase course of heat gains, thereby contributing to the optimization of the energy balance of the building in the summer months.
Table 5 demonstrates a comparison of heat flows for experimental samples over two days with different irrigation strategies: non-irrigated day (10 July 2024) and irrigated day (11 July 2024).
In the case of the RR reference sample, which was not affected by active irrigation, there was a decrease in the total daily heat flow through the roof structure from −1545 W/m2 on the non-irrigated day to −1218 W/m2 on the irrigated day. In both cases, however, virtually all of the incident solar radiation was transferred through the structure into the interior, with the lower values on the irrigated day being primarily due to lower solar radiation intensity. The EGR vegetation sample demonstrated the most significant benefit of active irrigation—the total daily heat flux decreased from −1202 W/m2 to −64 W/m2. The roof with photovoltaic (PV) panels achieved a decrease from −1204 W/m2 to −478 W/m2. In this case, the synergistic effect of shading by the panels and cooling by irrigation was evident, significantly reducing the amount of heat penetrating into the interior.
The measurement results proved that with an extensive green roof (EGR) with active drip irrigation, the heat flux density transmitted into the interior was reduced to 32% of the value recorded during a non-irrigated day, which meant a reduction in heat gains of approximately 68%. This effect is consistent with the conclusions of [
16], who state that sufficient substrate moisture allows for a high degree of utilization of incident solar energy for evapotranspiration, thereby limiting heat transfer into the structure. The importance of active irrigation and maintaining proper substrate moisture for the proper functioning of green roofs is also mentioned by [
22] in the design of an intelligent irrigation control system.
The authors in [
34] indicate that with sufficient moisture content, the average ET of green roofs was 4.1 mm/day. According to data on plant stomatal conductance, the rate of plant transpiration decreased significantly after 12 days of drying. This is confirmed by the fact that during the period of non-irrigation, optimal ET did not occur, which was reflected in an increase in heat flux transport. In our experiment, when irrigation was resumed, a daily total theoretical evapotranspiration of 5.18 mm/day was achieved, which represented 69.5% utilization of net solar radiation for water evaporation.
In a finding [
27], they state that the application of vegetation under PV panels can reduce the temperature under PV. Sedums proved to be the most effective, which is the preferred choice especially for EGRs due to lower water requirements and higher albedo values. This was also confirmed in our measurements, with the difference in surface temperature under the PV sample and the non-irrigated EGR reaching up to 10 °C. However, at the time of irrigation, the EGR sample was able to maintain the same or lower temperature than the PV sample. Ref. [
26] also writes about the appropriate integration of PV panels in an article, where he confirms the beneficial effect of vegetation below the panels on PV panels, as it provides effective cooling, which also has a positive impact on the functionality and efficiency of the panels.
Similarly, ref. [
35] experimentally demonstrated that irrigation in the case of EGRs can reduce heat flux density depending on the type of substrate and climatic conditions, which is fully comparable to our values for EGRs. In contrast, the reference roof (RR) in our study presented a difference between irrigated and non-irrigated days of only 1%, confirming that without a vegetation layer and evapotranspiration effect, the impact of irrigation is insignificant.
Our study contributes to the empirical data on direct measurements of the impact of irrigation on the heat balance, which is an effective extension of the existing literature, especially in the area of the functional use of green roofs in extreme summer conditions.
Limitations and Recommendations
This study highlighted the importance of active irrigation for extensive green roofs; however, the results should be interpreted in light of several key limitations. First, the vegetation layer was still in the development phase, and the leaf area index (LAI), which directly influences evapotranspiration intensity, was not systematically measured or monitored. Therefore, the exact cooling potential of the roof at full vegetation maturity cannot be precisely determined.
Second, the applied irrigation regime was not optimized, which limits the generalizability of the findings to other climatic conditions, substrates, or vegetation types. The impact of irrigation on photovoltaic panel efficiency was not sufficiently investigated. Additionally, the comparative influence of evaporation from hydroaccumulative layers versus the cooling effect of PV panels was not thoroughly analysed, which restricts the ability to draw general conclusions regarding the optimal combined roof design.
Third, the study results cannot be directly applied to unequivocally assess the impact of green roofs on the entire building interior. The building is strongly influenced by three-shift operations, internal equipment, and other heat sources. Large skylights provide solar radiation and lighting for workers, complicating the interpretation of the roof measures’ effect on the indoor climate. The study therefore focused on specific roof segments and constructions and cannot be comprehensively extrapolated to the entire building.
Acknowledging these limitations increases the transparency and scientific credibility of the research. Based on these insights, future research should include systematic monitoring of vegetation indices, quantification of the impact of hydroaccumulation board moisture on PV efficiency, and the application of adaptive irrigation strategies. Comparative studies between irrigated extensive and intensive green roofs are also recommended to better assess the trade-offs between structural load, water consumption, and thermal benefits.
This study opens several avenues for future research. First, systematic monitoring of vegetation development, particularly the leaf area index (LAI), is necessary to better quantify the influence of vegetation dynamics on evapotranspiration and cooling performance. Future work should also focus on assessing the relationship between hydroaccumulative board moisture and photovoltaic (PV) efficiency, as the potential synergies between irrigation management and PV performance remain insufficiently understood.
Another promising direction involves the testing of adaptive irrigation strategies that balance water savings with cooling potential, especially under changing climatic conditions. Comparative studies between irrigated extensive and intensive green roofs are also needed to evaluate trade-offs in terms of thermal performance, structural load, and long-term maintenance.
By addressing these research directions, subsequent studies can enhance the generalizability of current findings and contribute to the development of integrated design strategies that optimize both thermal comfort and energy efficiency in buildings.
Summary of recommendations for future research:
systematically monitor vegetation parameters (e.g., LAI) and their influence on evapotranspiration,
investigate the effect of substrate moisture on photovoltaic panel efficiency,
test adaptive irrigation strategies with respect to water savings and cooling performance,
compare irrigated extensive green roofs with intensive roofs in terms of structural load, maintenance, and thermal benefits.
4. Conclusions
The presented study confirmed the significant impact of active irrigation on the thermal behavior of green roofs during the summer season with typical climatic conditions. Based on experimental monitoring of three different roof structures—an extensive green roof (EGR), roof with photovoltaic panels (PV), and reference roof without vegetation (RR)—it was clearly demonstrated that regular drip irrigation significantly reduces surface temperatures and mitigates temperature fluctuations in the roof structure.
A key finding is that irrigation lowered the maximum daily substrate temperature in the EGR by more than 13 °C, highlighting the effectiveness of evapotranspiration as a natural cooling mechanism. Stabilization of temperatures at the waterproofing level was also observed, with fluctuations reduced by over 50%, which can extend the service life of roofing materials by mitigating thermomechanical stress. While PV panels provide shading and reduce heat loads, irrigation of exposed green surfaces further enhances cooling, demonstrating the efficient use of solar energy for evapotranspiration. In the case studied, approximately 70% of incident solar energy was utilized for water evaporation, corresponding to a similar reduction in heat flow into the building interior.
This redistribution of thermal load reduces heat penetration during critical afternoon hours, lowering energy demands for air conditioning and improving indoor comfort. Overall, the results support the implementation of active irrigation as an effective strategy to improve green roof performance, protect roof structures, enhance microclimatic conditions, and reduce building energy consumption. Furthermore, these findings underline the broader benefits of green roofs in mitigating urban heat islands and enhancing local urban environments.
To provide a concise overview of the key results presented above,
Table 6 summarizes the most important findings for the individual roof samples. The table shows the differences between the last two days of measurement—10 July (non-irrigated day) and 11 July (irrigated day).
The table highlights the impact of active irrigation on maximum substrate temperature and reduction in heat flux into the interior. In addition, practical implications of these findings for building performance, roof maintenance, and urban microclimate improvement are also presented. In the case of the RR sample, the difference in the total heat flux is caused by the different weather conditions on 10 July and 11 July.
Practical Recommendations and Design Implications for Green Roofs
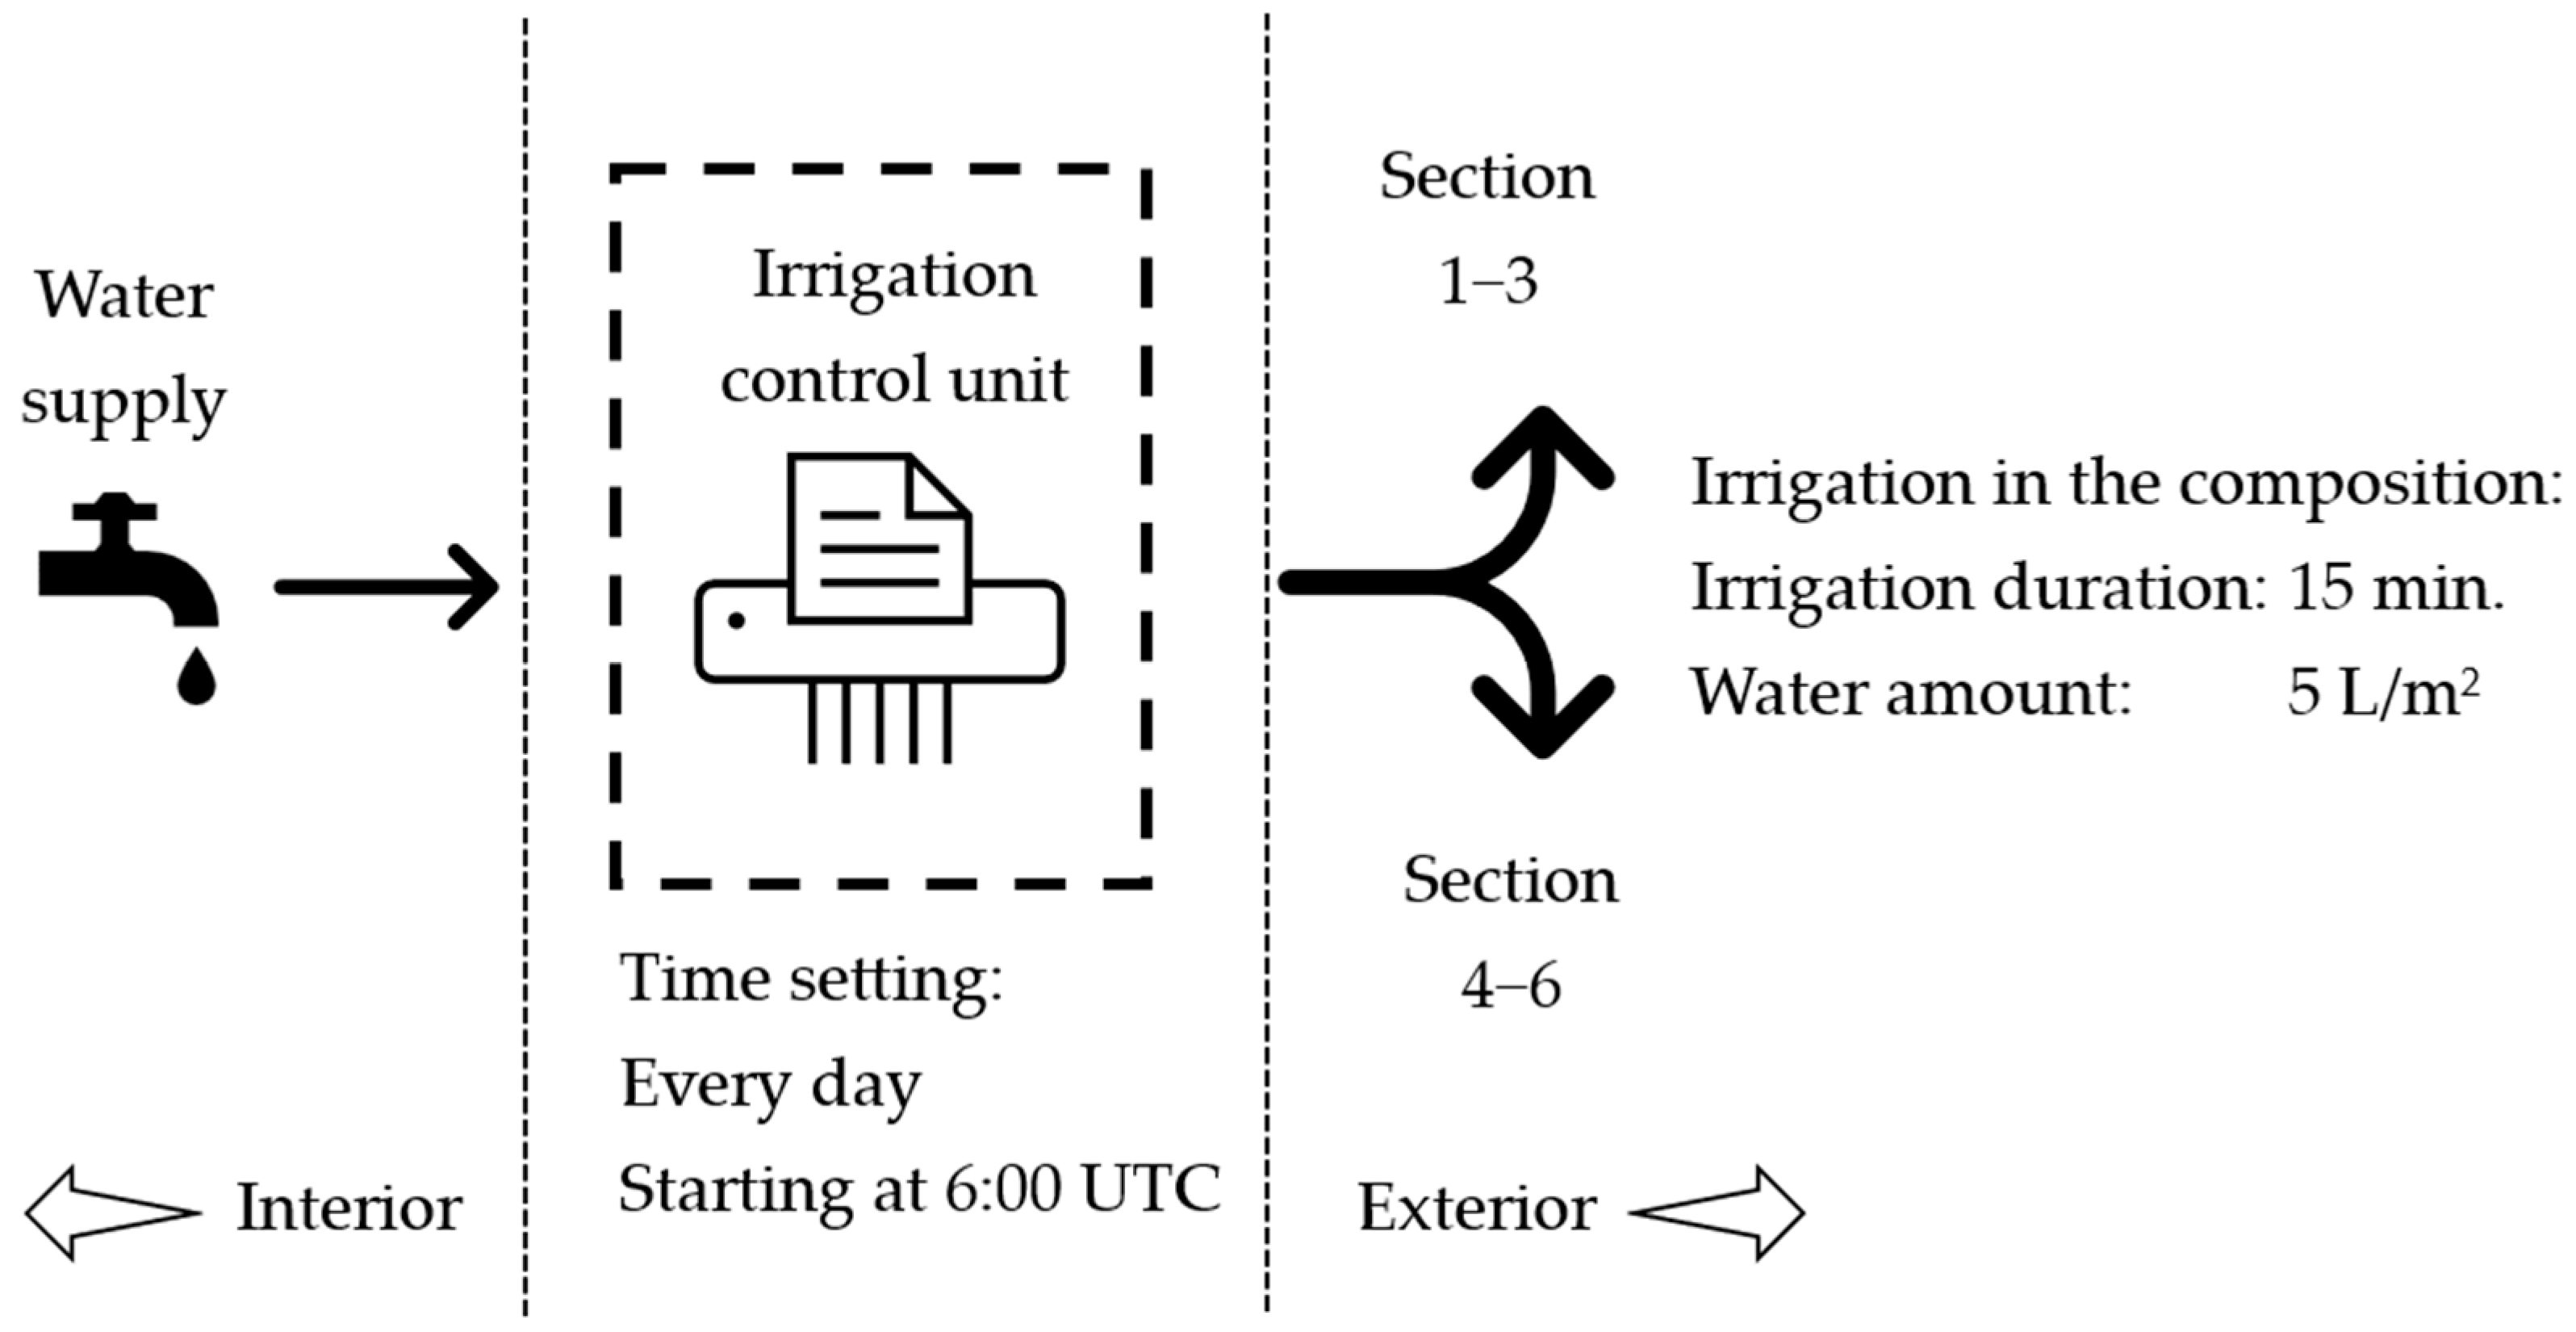
The findings of this study provide clear guidance for the practical implementation of green roofs in real buildings. Active irrigation should be considered a key component in the design of extensive green roofs, particularly in regions with hot summer climates, as it significantly enhances the cooling potential of the vegetation layer and stabilizes roof temperatures. For building owners and facility managers, integrating drip irrigation systems can reduce the risk of thermal stress on waterproofing materials, potentially extending their service life and lowering maintenance costs. In addition, optimizing irrigation by adjusting the amount and frequency of water application to current climatic conditions and the state of vegetation maximizes cooling efficiency while minimizing water consumption. Regular maintenance, including inspection of drip lines and soil moisture monitoring systems, ensures long-term reliability and effectiveness.
The combination of hydroaccumulative board with photovoltaic panels can provide a dual benefit: while panels offer shading and energy generation, actively irrigated HAB further contributes to cooling and reduces heat load transmitted into the building. Design guidelines for sustainable roofs should therefore prioritize both vegetation coverage and active water management to optimize energy savings, indoor comfort, and the microclimatic performance of urban environments.
Large industrial and warehouse buildings often occupy extensive areas, significantly reducing the amount of natural greenery in urban settings. Implementing lightweight extensive green roofs (EGRs) on these structures can bring substantial microclimatic benefits. Beyond improving roof thermal performance and reducing building energy demand, EGRs can help cool the surrounding environment, enhance urban biodiversity, and mitigate the urban heat island effect. In this way, expansive roof surfaces, which would otherwise exacerbate urban overheating and environmental degradation, can be transformed into active elements of sustainable urban development.
