Article

Construction of Landscape Heritage Corridors in Ethnic Minority Villages Based on LCA-MSPA-MCR Framework: A Case Study of the Nanling Ethnic Corridor Region in China

1
School of Architecture, South China University of Technology, Guangzhou 510641, China
2
Guangzhou Key Laboratory of Landscape Architecture, South China University of Technology, Guangzhou 510641, China
3
College of Tourism and Landscape Architecture, Guilin University of Technology, Guilin 541006, China
*
Author to whom correspondence should be addressed.
Buildings 2025, 15(18), 3403; https://doi.org/10.3390/buildings15183403
Submission received: 5 August 2025 / Revised: 13 September 2025 / Accepted: 16 September 2025 / Published: 19 September 2025

Abstract

To address the challenges of the loss of ethnic cultural carriers and the spatial fragmentation of landscape management due to rural population shrinkage, constructing heritage corridors has emerged as a crucial strategy for integrating fragmented resources, enhancing cultural landscape connectivity, and improving functional resilience. Using the Nanling Ethnic Corridor in China as a case study, this research proposes an integrated method combining Landscape Character Assessment (LCA), Morphological Spatial Pattern Analysis (MSPA), and the Minimum Cumulative Resistance (MCR) model, aiming to construct a landscape heritage corridor network for ethnic villages. Firstly, LCA was employed to identify 12 categories of landscape characters, followed by a multi-dimensional value evaluation to determine high-value landscape areas. Subsequently, MSPA was used to extract core landscape patches, and the importance of these patches was assessed by combining connectivity indices (dIIC, dPC), resulting in the identification of 48 key landscape source areas. Finally, the MCR model was applied to generate potential corridors, and a heritage corridor network was formed through the optimization of topological nodes. The results indicate that (1) the heritage network consists of 48 source areas and 151 corridors, forming a structure with “two vertical and one horizontal” main axes and a circular branch network; (2) spatial distribution of source areas and corridors exhibits aggregation in the central and western regions and sparsity in the southeast, closely aligning with the distribution of ethnic villages and high-value landscape areas; (3) the optimized corridor network significantly improves the connection efficiency and resilience of cultural nodes. This study provides a scientific foundation for the systematic conservation, spatial optimization, and sustainable development of cultural heritage in ethnic regions experiencing population shrinkage.

1. Introduction

Globally, rural population contraction driven by declining fertility rates is increasingly prevalent. The United Nations’ World Population Prospects 2023 report reveals that approximately 47% of countries are confronting sub-replacement fertility challenges [1]. As one of the world’s most populous countries, China is exhibiting pronounced demographic contraction in rural regions. According to the National Bureau of Statistics of China, the rural resident population has declined by 164 million over the past decade, with the aging rate in rural areas exceeding that in urban areas by 7.2 percentage points [2]. Sustained rural population shrinkage not only triggers the exodus of productive elements but also exacerbates the degradation of landscape functions and spatial fragmentation by altering key variables such as land use intensity and community engagement, thereby forming a negative feedback loop of “population decline and landscape degradation” [3]. This irreversible demographic transition is profoundly reshaping rural development trajectories, posing systemic challenges to the sustainable management and preservation of rural cultural landscapes. This issue is especially acute in China’s regions that are rich in ethnic cultural heritage, leading to a dual challenge: On the one hand, reduced financial support and public services have led to a crisis of “management deficiency” and “breakdown in cultural transmission,” undermining the resilience of rural landscape systems—that is, the capacity of a landscape to resist disturbances and maintain core ecological and cultural functions [4]. On the other hand, population shrinkage accelerates the disappearance of carriers of ethnic culture, calling urgently for adaptive heritage management to re-establish dynamic conservation mechanisms, enabling rural landscape heritage to adapt to demographic changes [5]. International cases illustrate the complexity of this challenge. In the European Alps, a “Conservation and Management Plan” has been implemented to restore degraded rural therapeutic park landscapes [6]. In rural areas of Hokkaido, Japan, approaches such as community-supported agriculture, farmland banking, and agricultural networks have been attempted to repurpose idle farmlands while preserving cultural memory [7]. These practices collectively address a central question in cultural landscape transformation amid population shrinkage: how to achieve “qualitative enhancement” rather than merely “maintaining scale.”
In response to this contemporary challenge, the theoretical framework of “Smart Decline,” based on the objectives of adaptive heritage management, has gradually gained international approval. This approach emphasizes enhancing spatial efficiency through resource reorganization and functional optimization in the context of population shrinkage, instead of passively maintaining homogeneous development [8]. The “Global Rural Landscapes Initiative,” launched by the International Council on Monuments and Sites (ICOMOS) in 2011, highlighted the urgency of establishing a resilient conservation framework, emphasizing that adaptive heritage management is attainable through spatial networking and functional diversification [9]. Furthermore, China’s 2024 policy on ethnic village preservation advocates a “centralized and contiguous protection” strategy, which aims to build an integrated protection system by clustering once-isolated settlements. This strategy essentially represents an adaptive response to optimize resource allocation amid spatial contraction [10]. Among various specific planning methods for adaptive heritage management, the heritage corridor approach has emerged as a key pathway to balance the challenges of decline with developmental opportunities. Its strengths lie in integrating scattered resources, enhancing spatial continuity, and supporting functional complexity. Originating in the United States, the concept of the heritage corridor has evolved into a regional conservation method that synthesizes protection, recreation, and education [11]. By adopting smart decline strategies, it shifts development pressure from quantitative expansion to structural optimization and qualitative enhancement. This makes it particularly suitable for addressing issues such as the reduction in service facilities and the fragmentation of heritage management caused by population decrease. As indicated in Table 1, current research on the construction of landscape heritage corridors predominantly utilizes methodologies such as the Minimum Cumulative Resistance (MCR) model [12], the Environmental Space Model (ESM) [13], the Circuit Effective Conductance (CEC) model [14], the Recreation Opportunity Spectrum (ROS) theory [15], the Conservation Action Planning (CAP) theory [16], and the Land Zoning Management theory [17]. Research has yielded significant findings from multiple perspectives, including the route selection methods for landscape heritage corridors [18], functional suitability evaluation [19], and landscape planning and design along the routes [20]. The most commonly employed route selection method involves utilizing modern technologies, such as Geographic Information System (GIS) and Remote Sensing (RS) [21], to conduct a land suitability analysis for key influencing factors (e.g., topography, land cover, and habitat conditions) within the target area. This analysis is then combined with a multi-criteria evaluation, including the economic feasibility of construction, transportation accessibility, and infrastructure availability, to perform an integrated assessment. Ultimately, this approach yields optimized landscape heritage corridor plans. For instance, Jurković et al. applied a combined approach of Cost–Benefit Analysis (CBA) and transportation spatial planning to identify and protect urban railway landscape corridors in Croatia [22]. Similarly, Feng et al. constructed a cultural heritage network for Dunhuang City based on a Field Strength Model, planning a landscape heritage corridor that integrates environmental utilization with ecological restoration [23]. Nevertheless, extant research is shown to exhibit pronounced limitations in the following aspects: On the one hand, during corridor route selection, quantifiable natural landscape data (e.g., elevation, slope, vegetation) are frequently analyzed, while analysis of human landscape data (often unstructured, including text, interview records, and images) remains limited [24]. On the other hand, the scope and approaches to protection remain constrained. Studies primarily focus on micro-level physical conservation of individual villages, while systematic methodologies for establishing cross-regional, large-scale rural landscape heritage networks remain underexplored.
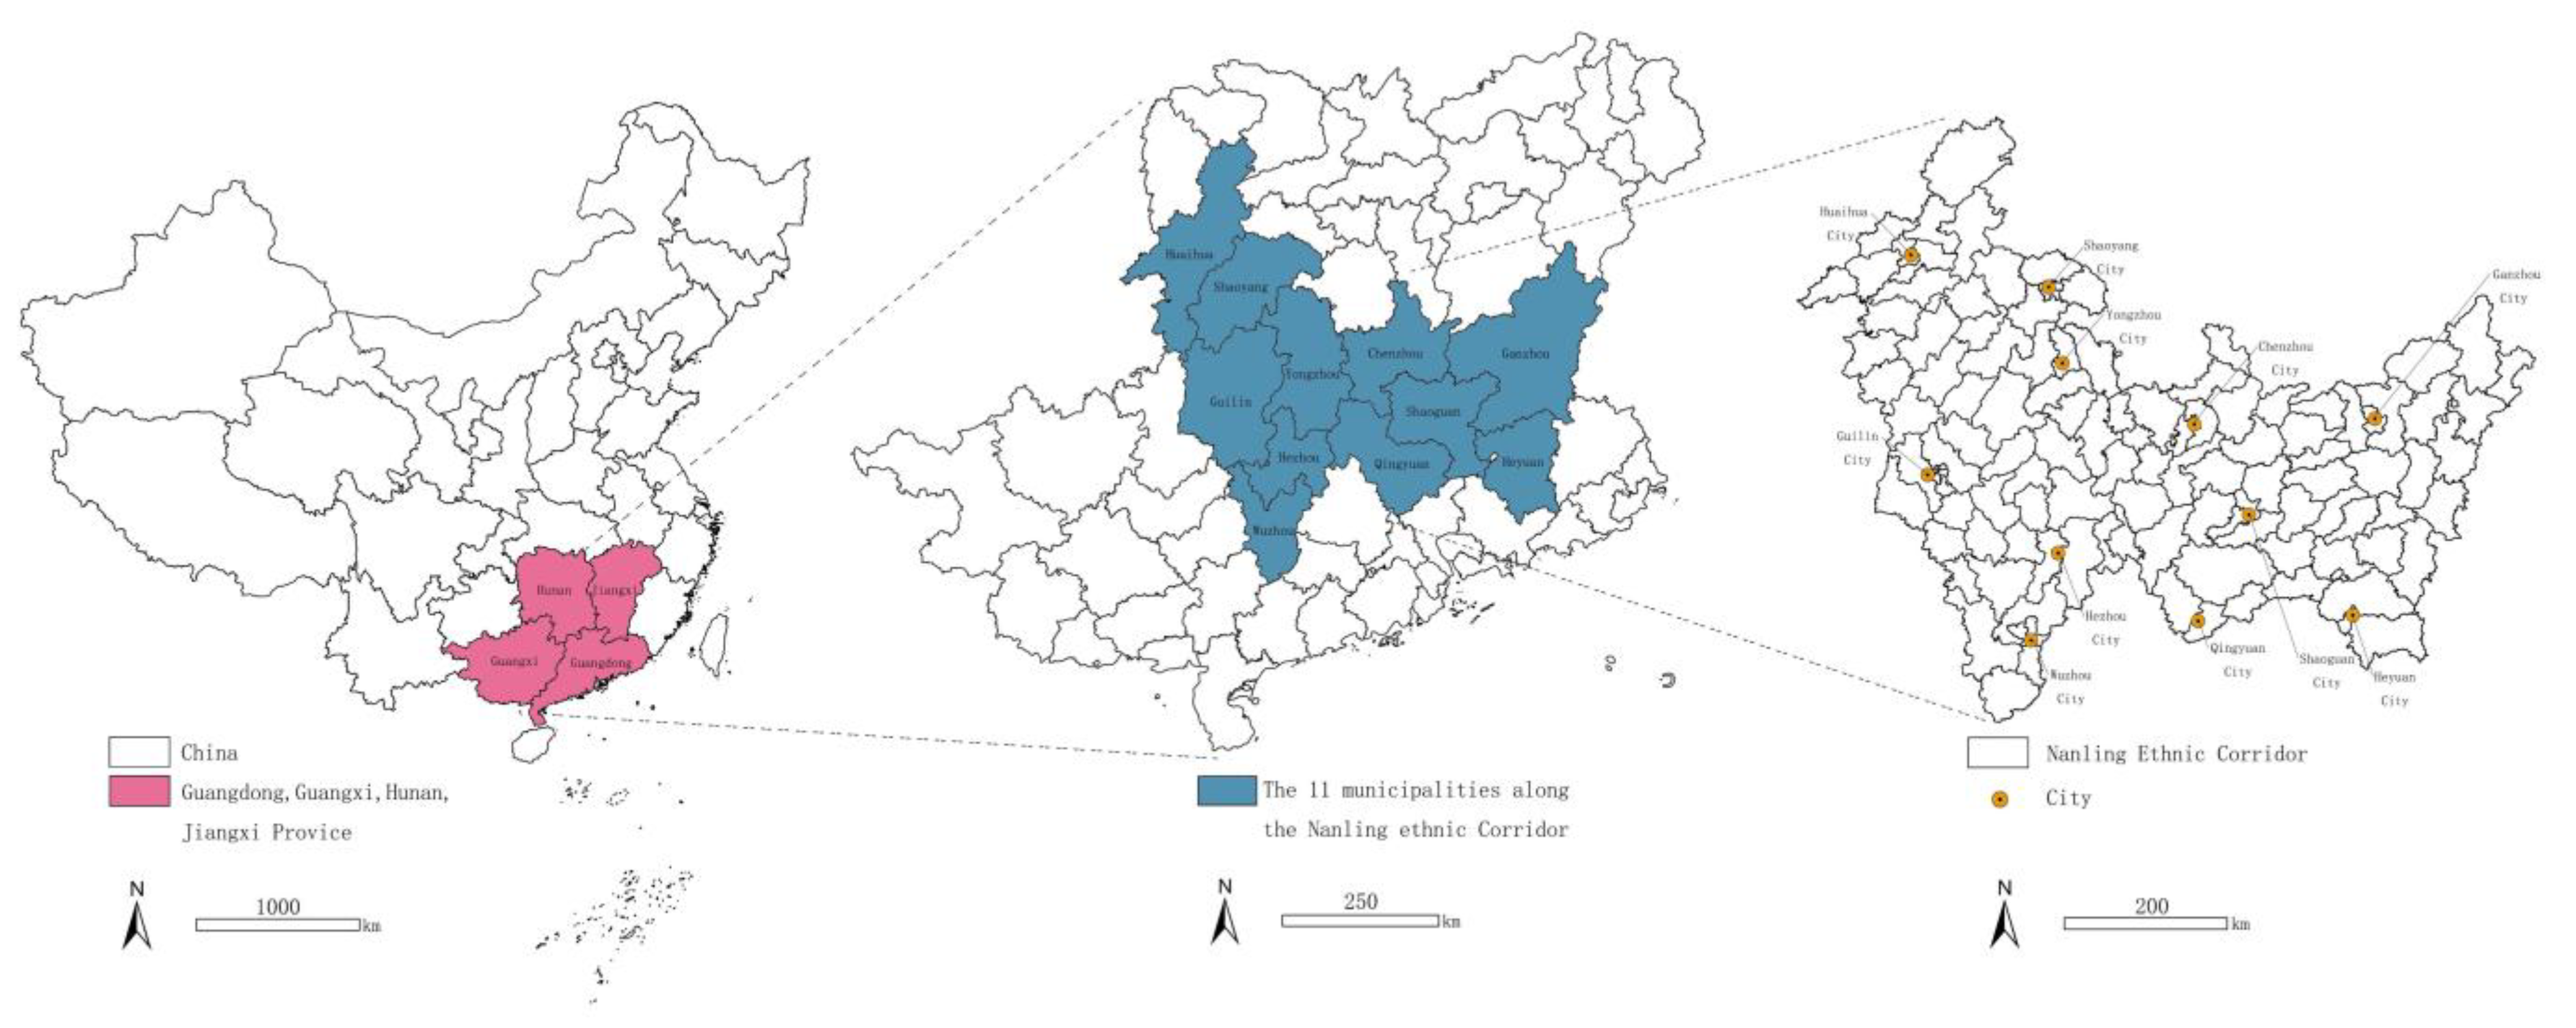
To address the aforementioned limitations, this study proposes an integrated model combining Landscape Character Assessment (LCA), Morphological Spatial Pattern Analysis (MSPA), and the Minimum Cumulative Resistance (MCR) model. Focusing on the Nanling Ethnic Corridor in China—a typical region characterized by both population shrinkage and rich cultural diversity [25]—this research explores a methodology for constructing a landscape heritage corridor system for ethnic villages based on the “LCA-MSPA-MCR” framework (Figure 1). The objectives of this integrated model are threefold: first, to quantify the multi-dimensional values of landscape resources and visualize their spatial distribution using LCA; second, to identify core patches and landscape nodes via MSPA, thereby enhancing network connectivity; and third, to simulate optimal corridor routes through the MCR model, in response to the dual demands of efficient resource allocation and resilient heritage development against the backdrop of population shrinkage. The findings of this study innovate the methodological system for integrating landscape resources in areas experiencing population shrinkage and realize a paradigm shift from micro-level physical conservation to macro-level systematic construction through the landscape heritage corridor network. This research not only provides solid theoretical support, scientific evidence, and decision-making references for the coordinated development of “spatial renewal—cultural revival—industrial activation” in ethnic villages within the Nanling Ethnic Corridor, it also contributes Chinese experience to major global issues such as cultural landscape transformation amid population changes and urban-rural sustainable development practices in the context of population shrinkage.

2. Materials and Methods

2.1. Study Area

This study focuses on China’s Nanling Ethnic Corridor. As one of the three major ethnic corridors in China, this region is an important cultural and geographical unit [26]. For spatial delineation, this study adopts the narrow conceptualization of the “Nanling Ethnic Corridor” proposed by Wang Yuanlin, with geographical coordinates ranging from 22°58′ N to 29°01′ N latitude and 108°47′ E to 116°38′ E longitude. The study area encompasses Shaoguan, Qingyuan, and Heyuan in Guangdong Province; Guilin, Hezhou, and Wuzhou in the Guangxi Zhuang Autonomous Region; Chenzhou, Yongzhou, Huaihua, and Shaoyang in Hunan Province; as well as Ganzhou in Jiangxi Province, covering a total area of approximately 230,000 km2 (Figure 2).
The Nanling Ethnic Corridor features predominantly mountainous terrain. It is formed principally by the Mengzhu, Qitian, Dupang, Dayu, and Yuecheng Ranges (collectively termed the ‘Five Ridges’) along with fragmented mountain systems. Characterized by a subtropical monsoon climate with warm and humid conditions, the region receives annual precipitation ranging from 1500 to 2000 mm. This unique geographical environment has fostered abundant natural and cultural landscape resources. The ethnic minority population totals approximately 17.5 million, constituting over 25% of the total population. As the historic core area for long-term integration and symbiosis among Han, Zhuang, Yao, Dong, Miao, and other ethnic groups, the corridor hosts numerous ethnic villages distinguished by rich typological diversity and distinctive cultural features [27].
The rationale for selecting this case study area stems from its exceptional representativeness and urgency, outlined as follows: (1) Representativeness: Recognized as a “national ethnic culture repository”, its diverse ethnic village typologies and profound cultural heritage provide an ideal research sample for landscape character identification and heritage corridor network construction. (2) Urgency: The region, as an underdeveloped area, is undergoing significant population shrinkage and confronting formidable challenges in preserving its ethnic cultural heritage and landscape resources. This complex interplay of demographic, economic, and cultural conservation challenges makes it an ideal empirical site to verify that the management model of heritage corridors adapts to population contraction.

2.2. Data Sources

The data employed in this study comprise two primary categories: fundamental geospatial data and ethnic village attribute datasets. All datasets underwent rigorous screening and preprocessing to ensure their temporal consistency, accuracy, and applicability, thereby providing reliable support for subsequent landscape character assessment and heritage corridor construction based on the integrated LCA-MSPA-MCR framework. Firstly, for fundamental geospatial data, the 30 m resolution digital elevation model (DEM) data and the 2023 China 30 m resolution land use/cover data (CNLUCC) come from the Resource and Environmental Science Data Center (RESDC) of the Chinese Academy of Sciences. Auxiliary data (including administrative boundaries, transportation networks, vegetation types, geospatial dataset of intangible cultural heritage, etc.) are also derived from authoritative datasets published by RESDC and Global Change Research Data Publishing and Repository, ensuring data consistency and coordination. Secondly, in terms of ethnic village attributes, this study defines its research subjects as nationally and provincially designated ethnic minority characteristic villages within the 11 prefecture-level cities of the Nanling Ethnic Corridor. Specifically, the national village samples are integrated from the first (2014), the second (2017), and the third (2019) batches of “Chinese Ethnic Minority Characteristic Villages” published by the State Ethnic Affairs Commission; the provincial village samples are integrated from the official lists issued by the relevant provincial governments, including batches 1–3 of “Guangxi Ethnic Minority Characteristic Villages” (Guangxi Zhuang Autonomous Region), batches 1–4 of “Most Beautiful Ethnic Minority Towns/Villages” (Hunan Province), the first batch of “Guangdong Ethnic Minority Characteristic Villages” (Guangdong Province), and the first batch of “Provincial Ethnic Minority Characteristic Village Construction Sites” (Jiangxi Province). Through spatial location matching and list comparison, a total of 162 eligible characteristic ethnic villages were finally identified as specific research objects, covering 6 major ethnic groups, including 93 national-level villages and 69 provincial-level villages. The spatial distribution of the sample covers the main ethnic areas in the study area, ensuring the regional representativeness of the study. Thirdly, in order to support the quantitative construction of the multi-dimensional indicator system of nature, humanities, and society in LCA, relevant supplementary data were also collected in this study. This mainly includes the socio-economic statistics provided by the local statistical yearbook (such as population density, ethnic composition ratio, etc.) and the distribution data of cultural heritage sites provided by the census data of local cultural departments, which are mainly used to construct specific indicator layers in the LCA evaluation system.

2.3. Research Methods

An integrated research strategy based on the LCA-MSPA-MCR framework was primarily employed in this study. Firstly, implementing LCA methodology to identify spatial agglomeration patterns and quantify the composite value of landscape resources within the Nanling Ethnic Corridor. Secondly, utilizing MSPA to analyze spatial distribution patterns and internal structural connectivity of landscape clusters based on LCA zoning classifications, thereby identifying pivotal landscape source areas. Thirdly, establishing a comprehensive spatial resistance surface via the MCR model, followed by topology optimization, prioritizing connectivity between landscape source nodes, to construct a multi-tiered heritage corridor network system.

2.3.1. Landscape Resource Assessment of the Nanling Ethnic Corridor Based on LCA

  • Landscape character assessment system. The construction of the landscape character assessment system is guided by four principles: systematicness, representativeness, data accessibility, and relevance to the study area. The principle of systematicness ensures coverage of the core dimensions of landscape characteristics; representativeness ensures that the elements effectively reflect the regional distinctiveness of the Nanling Ethnic Corridor; accessibility is based on available data sources and their quality; and relevance emphasizes the close connection between the elements and the research theme. By integrating the physical geographic system and unique cultural history of the Nanling Ethnic Corridor, and referencing practical experiences from regions such as Gwangju, South Korea [28], and Israel [29], as well as research findings by scholars like Khalilah Zakariya [30], this study comprehensively selects 31 variables across 8 subcategories from two element types—natural and human factors (Table 2).
In the selection of natural landscape, considerations were adapted to the specific characteristics of the Nanling Ethnic Corridor region, including its mountainous topography and ecological sensitivity. Features such as elevation, slope, landform, and soil were selected due to their direct relevance to topographic complexity and ecological processes, whereas vegetation served as an indicator of ecosystem condition and biodiversity. Other natural features, such as climatic indices, were excluded owing to their limited connection to the study’s objectives. With regard to cultural landscape, village density reflects spatial patterns of human habitation, cultural heritage density highlights the historical and cultural significance of ethnic corridors, and land cover demonstrates the transformation of landscapes by human activities. The exclusion of economic data and similar features was due to their stronger orientation toward socioeconomic dimensions and weaker correlations with landscape character.
The classification and categorization criteria of variables strictly adhere to the principles of scientific validity, operational practicality, and relevance to the regional characteristics of the Nanling Ethnic Corridor. The specific rationales are as follows: The classification of elevation, slope, and landform is based on the vertical zonation pattern of China’s terrain, the standardized Chinese geomorphologic classification system, and the adaptability of human activities, while also incorporating the actual geomorphological context of the Nanling Ethnic Corridor region—a landscape dominated by low to medium mountains interspersed with hills and intramontane basins. Areas with elevations below 200 m are generally classified as plains and valleys, where slopes are gentle and conditions are suitable for human settlement and cultivation; elevations between 200 m and 500 m represent a transitional zone of hills and low mountains, characterized by substantial topographic variation and relatively frequent human activities; regions above 500 m fall within medium–low mountainous terrain, featuring steep slopes, high ecological sensitivity, and limited human disturbance. This classification system effectively captures the influence of topographic patterns on landscape diversity and reflects the critical role of terrain in shaping both human activity distributions and ecological differentiations. The vegetation represents the main plant communities in the Nanling region, reflecting the distribution differences between natural and artificial vegetation, with particular emphasis on the characteristics of subtropical vegetation and the impact of human cultivation. The soil types selected are the most representative in the area: southern paddy soil reflects agricultural activities, while limestone soil, red soil, and yellow soil are associated with the ecological background of karst and hilly mountainous areas. Village density was analyzed using kernel density estimation and classified into low, medium, and high levels based on the natural breaks, which objectively reflects the spatial variation in the aggregation degree of villages [31]. Similarly, cultural heritage density was divided into low, medium, and high levels based on kernel density analysis [32]. High-density areas indicate zones rich in cultural resources, reflecting the spatial pattern of historical and cultural sedimentation in the ethnic corridor, whereas low-density areas suggest a sparse distribution of cultural relics. Land cover refers to the Current Land Use Classification System of China [33], covering the major land use types in the Nanling Ethnic Corridor region, which effectively represents the interaction between human activities and the natural environment.
2.
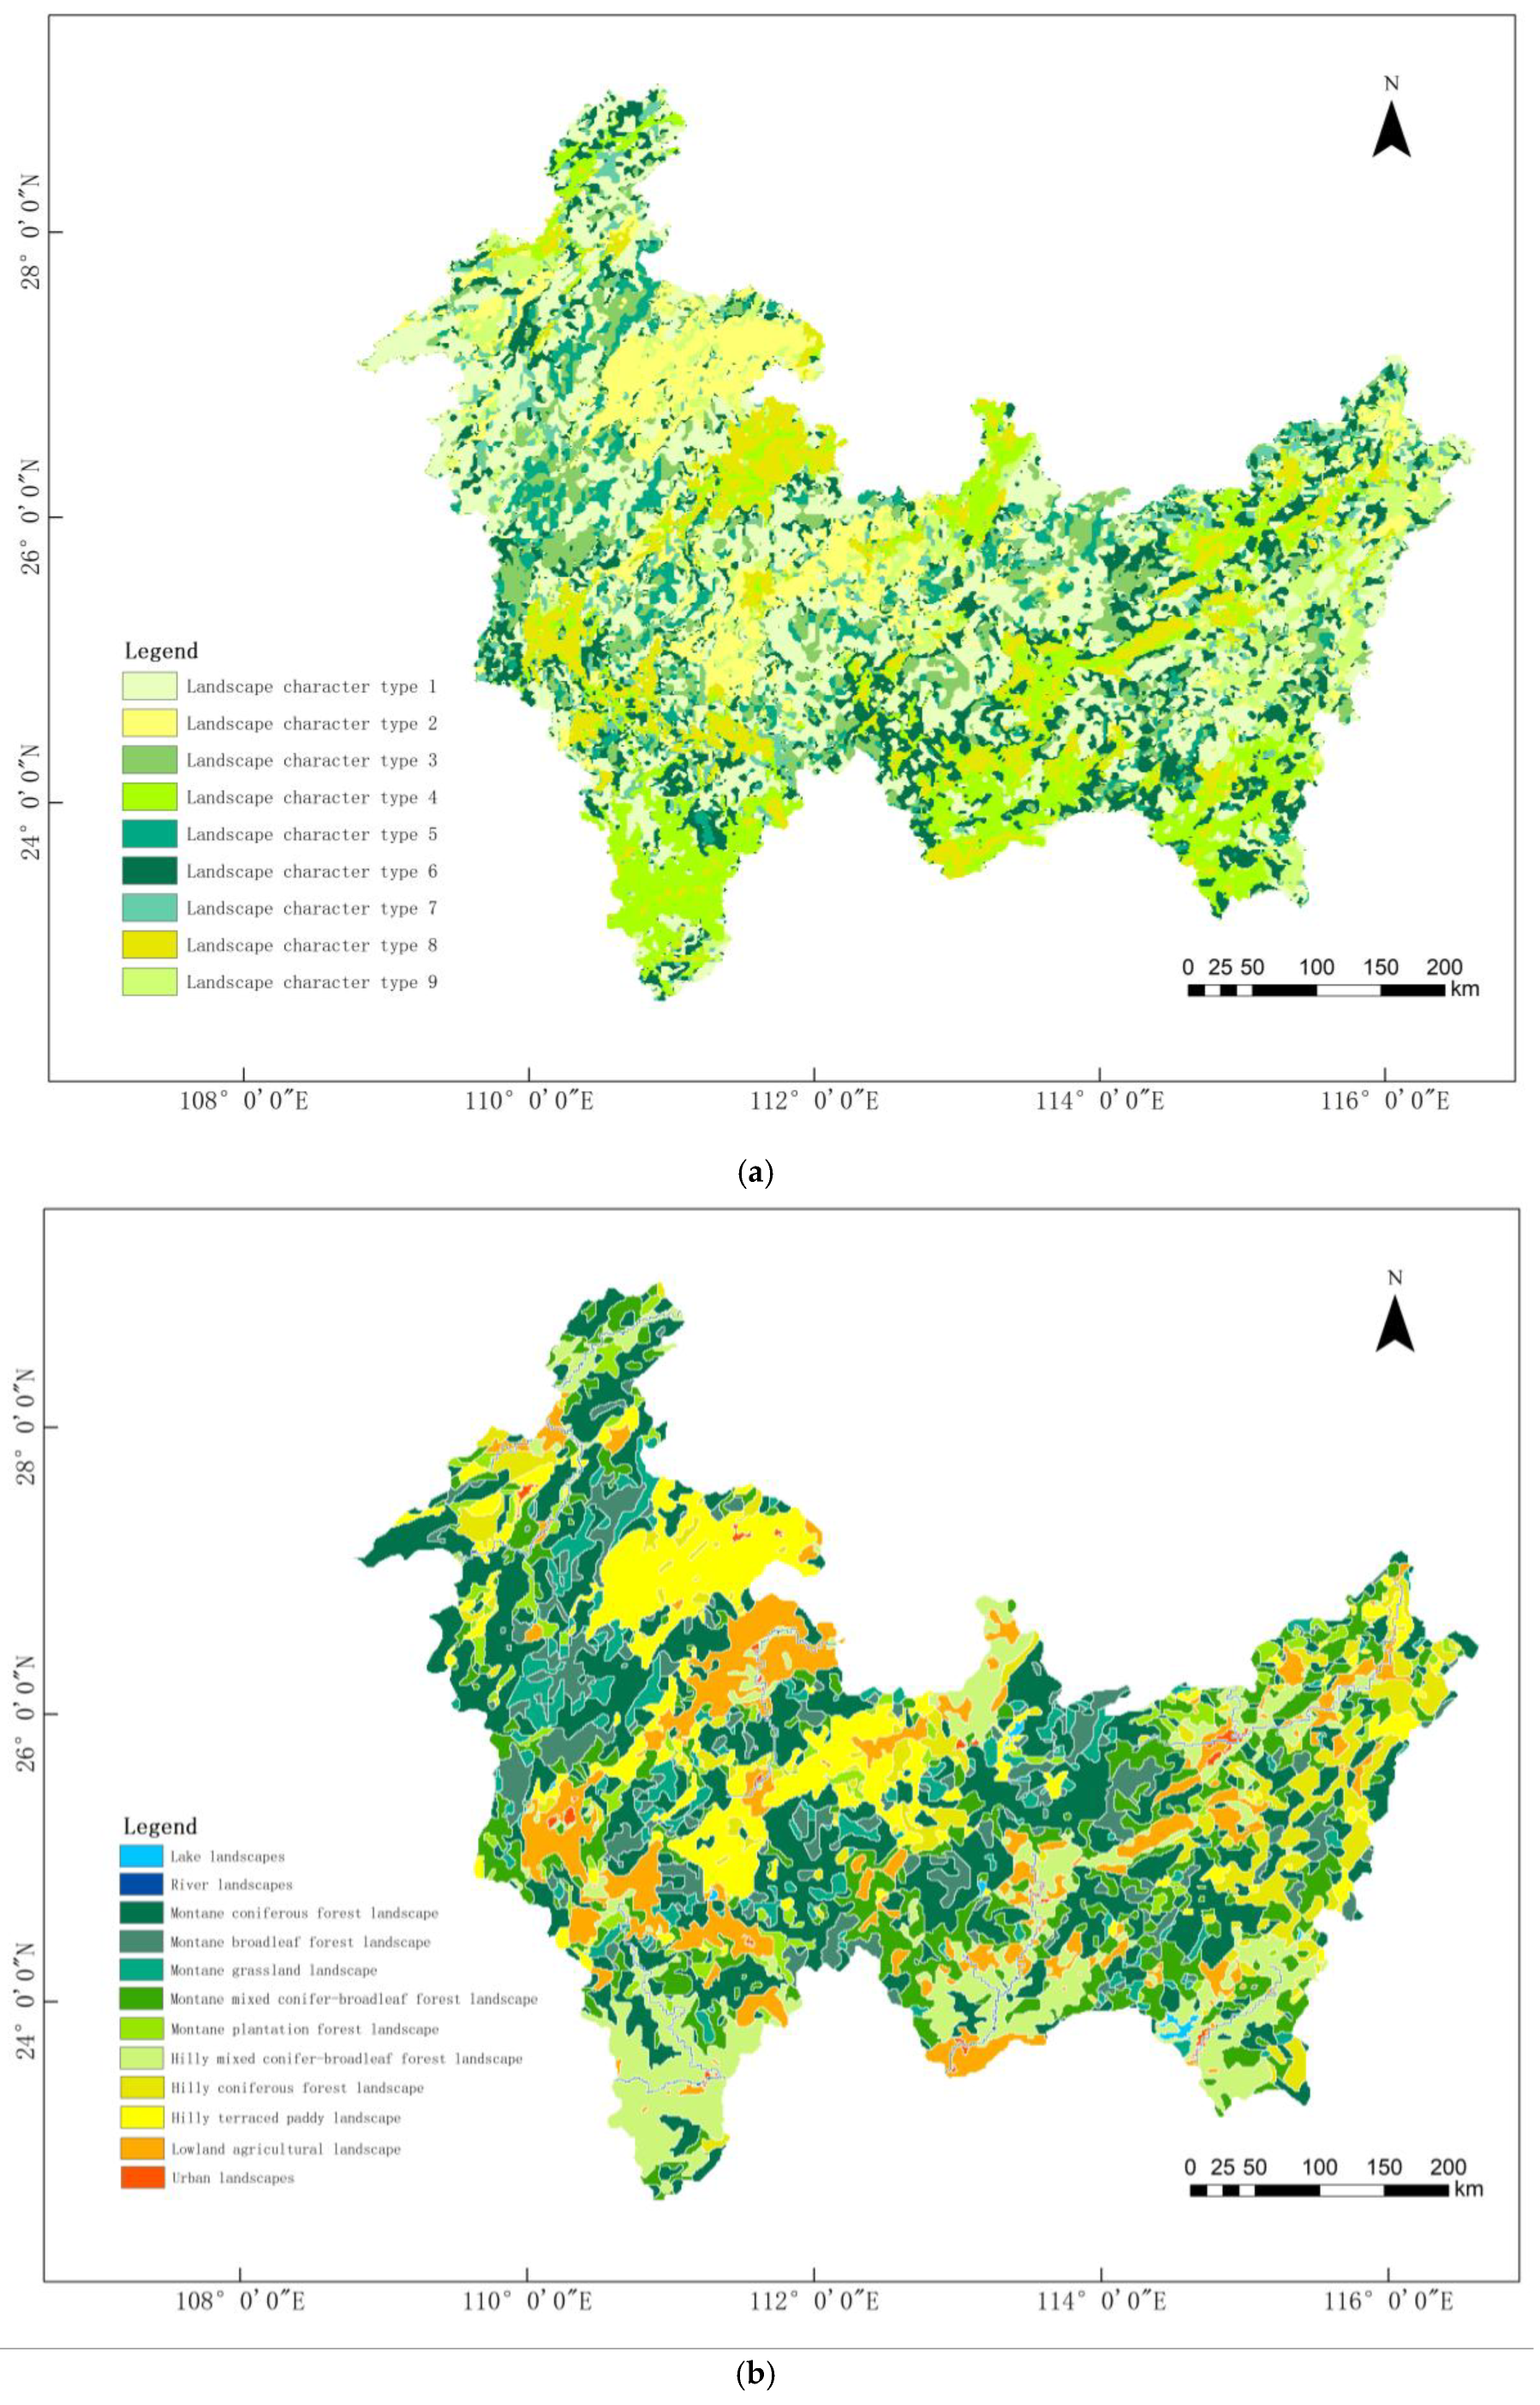
Landscape Character Assessment. In ArcGIS 10.8, the study area was divided into 213,769 landscape spatial units at a scale of 1 km × 1 km. A connection matrix between landscape feature elements and spatial units was constructed, where “presence” was assigned a value of “1” and “absence” was assigned a value of “0.” This scale was referenced from the landscape character assessment grid division standard proposed by Tudor [34] and was optimized based on the regional area and topographic complexity of the Nanling Ethnic Corridor. The Nanling Ethnic Corridor is a macro-scale geographical region, extending approximately 800 km from east to west and encompassing a total area of over 230,000 square kilometers. In large-scale regional studies such as those of the Nanling Ethnic Corridor, a grid resolution of 1 km × 1 km can effectively reflect the overall distribution trends of regional landscape patterns at a macro level, while simultaneously possessing the capability to identify local topographic variations and landscape heterogeneity at a micro level [35]. Compared to larger grid scales such as 2 km × 2 km [36], this resolution effectively avoids the loss of local topographic information. In contrast to finer grid scales such as 0.5 km × 0.5 km [37], it significantly reduces data redundancy and improves computational efficiency while maintaining identification accuracy [38]. On this basis, two-step cluster analysis in SPSS 27 processed the correlation matrix to preliminarily classify landscape character types within the Nanling Ethnic Corridor, generating preliminary zoning schematics. Finally, on the basis of 1–2 sample sites for each landscape feature type, the final landscape feature map was obtained by using the comprehensive method of eCognition 9.0 analysis and artificial visual interpretation.
3.
Landscape Value Evaluation. This study combined expert evaluation with stakeholder engagement to construct a landscape value assessment system, balancing scientific rigor with social acceptability.
Firstly, the evaluation indicators were selected. Natural landscape value encompasses the ecological functions and natural resource attributes of the landscape, including two factors: ecological service value and natural resource value. The selection of indicators was derived from regulatory documents such as the National Nature Reserve Assessment Criteria [39], the Scenic Resource Quality Rating Standards for Chinese Forest Parks [40] and the Regulations on Scenic and Historic Areas [41], which allowed for a scientific quantification of the contributions made by natural landscapes in the Nanling Ethnic Corridor region in terms of ecological services, resource conservation, and environmental quality. Social landscape value focuses on the social functions and community relations of the landscape, comprising two factors: sociocultural value and scientific research value. These were primarily based on the Madrid Landscape Assessment Framework [42], the Hong Kong Landscape Evaluation Framework [43] and the Regulations on the Protection of Famous Historical and Cultural Cities, Towns, and Villages [44], which served to measure the value of landscapes in aspects such as education, popular science, recreational activities, and community economic development, thereby promoting a balance between conservation and utilization. Humanistic landscape value primarily addresses the cultural connotations and historical legacy of the landscape, including three factors: historical heritage value, spiritual symbolic value, and aesthetic taste value. The selection of these factors referred to the Regulations on Scenic and Historic Areas [41], the Convention Concerning the Protection of the World Cultural and Natural Heritage [45] and the Principles for the Conservation of Heritage Sites in China [46]. These frameworks effectively evaluated the role of cultural landscapes in the Nanling Ethnic Corridor in terms of historical continuity, cultural identity, and artistic expression.
Secondly, a multidisciplinary evaluation panel was formed. To ensure the authority and representativeness of the evaluation, the panel consisted of 13 experts and 30 non-specialist stakeholders. The experts were selected based on the high relevance of their research fields to this study and their extensive practical experience. The 13 experts came from four disciplinary backgrounds: landscape planning (4), human geography (3), urban and rural planning (3), and ethnology (3). All held the title of associate professor or above or had equivalent professional expertise (Table 3). The 30 non-specialist participants were community representatives and members of the public who had long resided in the Nanling Ethnic Corridor region and were familiar with the local landscape features, ensuring that the evaluation results reflected the value perceptions of local communities.
Thirdly, the Analytic Hierarchy Process (AHP) was applied to calculate weights for each evaluation factor. The specific procedure was as follows: the aforementioned 13 experts were invited to perform pairwise comparisons of the relative importance among criteria-level and indicator-level metrics based on the Saaty 1–9 scale, thereby constructing judgment matrices. After collecting all expert ratings, a consistency test was first conducted by calculating the consistency ratio (CR) value of each expert’s judgment matrix. The CR values of all experts were less than 0.1 (Table 3), indicating that all judgments met the consistency requirement and were thus valid. Subsequently, the geometric mean method was applied to synthesize all valid expert judgments, forming a comprehensive judgment matrix. The final weights of each factor were then calculated, resulting in the landscape value evaluation system for the Nanling Ethnic Corridor (Table 4).
Finally, value scoring and integration were conducted. After establishing the weighting system, both the expert panel and the non-specialist group were required to independently score all landscape character types on a scale of 1 to 10. To integrate the scoring differences between the two groups, a weighted arithmetic mean method was adopted: the scores from the 13 experts were averaged to obtain the mean expert score (E), while the scores from the 30 non-specialist representatives were averaged to yield the mean public score (P). The final comprehensive value score (S) was calculated using the formula S = 0.7E + 0.3P. This specific weight allocation (70% for experts, 30% for non-specialists) was determined based on the following rationale:
(1) Primacy of Expert Judgment in Complex Multi-criteria Assessment—The evaluation of landscape heritage value, especially within a scientific research context, involves a complex interplay of ecological, aesthetic, historical, and socio-cultural criteria. Expert panelists, selected from relevant disciplines (landscape planning, human geography, etc.), possess the specialized knowledge and experience necessary to objectively deconstruct and evaluate these multifaceted dimensions against established international conservation principles and scientific standards (e.g., references [39,40,41,42,43,44,45,46] in Table 4). Their judgment is critical for ensuring the scientific rigor, objectivity, and consistency of the assessment.
(2) Mitigating Subjectivity and Knowledge Gaps in Public Perception—While non-specialist stakeholders provide invaluable insights into lived experiences, place attachment, and perceived values, their assessments can be influenced by personal preferences, immediate benefits, or varying levels of awareness regarding broader conservation goals and the full spectrum of heritage significance. The 30% weighting adequately incorporates these community perspectives and social acceptability without allowing subjective biases or local knowledge gaps to disproportionately skew the results that form the basis of a scientific spatial planning model.
(3) Alignment with Common Practices in Participatory Planning Literature—This weighting scheme aligns with methodologies commonly adopted in participatory landscape planning and environmental decision-making research, where expert opinion is often accorded greater weight in technical assessments, while public input is valued but strategically integrated to balance technical excellence with social context [47]. This approach is deemed appropriate for constructing the foundational value surface used in subsequent corridor modeling.
The resulting composite value score (S) thus prioritizes scientific authority while incorporating community values, forming a robust and balanced foundation for the subsequent identification of high-value landscape sources. The results were subsequently visualized using ArcGIS 10.8 to generate a landscape value assessment map.

2.3.2. Landscape Source Identification via MSPA and Connectivity Analysis

  • Identify the initial source. MSPA segmented the grid image through image processing technology to identify habitat patches and corridors that play an important role in landscape connectivity in the study area at the pixel level [48]. The landscape value evaluation results were regrouped through reclassification. Areas scoring higher than 6.0 in landscape value were selected as foreground data for MSPA. This threshold was determined based on the frequency distribution of landscape value scores. Scores above 6.0 corresponded to the top 26.3% of the cumulative frequency, which objectively represented high-value landscape areas, thereby ensuring the typicality and representativeness of the foreground data [49]. Then, within the Guidos Toolbox 3.0 platform, the 8-neighborhood analysis and a 40 m edge width parameter were configured to perform MSPA, with areas larger than 50 km2 to be extracted as the initial source.
In the context of cultural heritage corridors, the “edge” in MSPA is regarded as a transitional zone or visual buffer of cultural landscapes [50]. For ethnic villages, this is reflected in the transition from construction land to the natural environment. The setting of the edge width aims to treat the core area of the village as an integrated patch, where the interior represents a landscape blending cultural and natural elements, while the exterior forms potential corridors through features such as forests and rivers. The cultural heritage patches in the Nanling Ethnic Corridor are generally small and fragmented. An excessively large edge width (80–100 m) may misidentify small patches that belong to the core area as part of the edge, thereby reducing the core area and connectivity. Conversely, an overly small edge width (10–20 m) may fail to filter out linear disturbances such as roads and modern buildings, compromising landscape integrity. Through repeated calibration, a width of 40 m was identified as an appropriate threshold, which effectively represents the influence range of common disturbances while ensuring accurate identification of the village core areas and maintaining the integrity of culturally functional land uses.
The selection of a 50 km2 area threshold for identifying initial source areas is primarily based on the concept of “cultural core areas” in cultural geography [51] and the ethnic distribution pattern of “large dispersion, small aggregation” in the Nanling Ethnic Corridor [52]. Ethnic villages in this region are predominantly located within relatively independent medium-sized watershed units such as valleys or basins, which typically support a single ethnic community (e.g., Yao, Zhuang, or Dong). GIS analysis and historical literature review indicate that the core watershed units supporting typical ethnic cultures in the Nanling Ethnic Corridor generally range from 50 to 100 km2 in area. This scale is sufficient to form a relatively self-contained natural and cultural unit while remaining geographically distinguishable from other units. Therefore, the 50 km2 threshold is intended to identify these core areas that can support a complete ethnic cultural community from a geospatial perspective. This ensures that the identified source areas function as integrated heritage complexes with coherent cultural landscape structures and functions, thereby underpinning their centrality and representativeness within the broader heritage corridor.
2.
Determine the final landscape source. Commonly employed landscape connectivity indices include the Integral Index of Connectivity (IIC), possible connectivity index (PC), and the Delta values for probability index of connectivity (dPC). The IIC and the PC were employed to quantify landscape connectivity to identify critical landscape elements [53]. The dPC particularly highlighted the significance of patches and effectively assessed the connectivity of core patches [54]. Based on the average distance between various ethnic cultural communities in the Nanling Ethnic Corridor, the connectivity probability for source patches was set to 0.5, with a distance threshold of 50 km in Conefor 2.6, to calculate IIC and PC. The patch importance index (dI) was introduced to quantify the functional significance of source patches, and patches with dI > 0.5 were ultimately selected as the key landscape sources [55]. The calculation formula is outlined as follows:
d I I C = i = 1 n j = 1 n [ ( A i A j ) / ( 1 + C i j ) ] A e 2
d P C = i = 1 n j = 1 n A i × A j × P i j * A e 2
d I = 0.5 d I I C + 0.5 d P C
In the specific calculation Formulas (1)–(3), d I I C is the overall connectivity index; d P C is the possible connectivity index; d I is the patch importance index, and the larger the d I , the higher the patch importance. A i and A j are the areas of landscape patches i and j ; A e is the total area of the area; n is the total amount of patches in the landscape surface e ; C i j is the total number of connections between landscape patches i and j in the shortest path; and P i j * is the maximum connection probability between landscape patches i and j .

2.3.3. Heritage Corridor Construction via MCR Model

  • Resistance factor indicator. To address spatial restructuring challenges in urban–rural contexts under population shrinkage, this study conceptualizes rural settlement reorganization as a process of overcoming spatial resistance. The MCR model simulates this process to identify least-cost paths generated by ethnic villages traversing comprehensive spatial resistance [56]. From the perspective of cultural heritage corridors, the magnitude of the resistance value reflects the importance of a given factor in influencing cultural spatial movement. A higher resistance value indicates a stronger capacity of that factor to either “facilitate” or “hinder” cultural connectivity, making it a dominant factor in the model. Through field surveys and a review of existing relevant studies [57,58,59,60,61,62], and considering the significant cultural and social attributes of ethnic villages as well as the unique, fragmented mountainous terrain of the Nanling Ethnic Corridor region, land cover, elevation, slope, topographic relief index (TRI), and traffic accessibility (distance to roads) were ultimately selected as resistance factors. Among these, land cover and slope have the highest resistance range (0–500), followed by traffic accessibility (0–200), while elevation and TRI have the lowest resistance range (0–100). The classification criteria and assigned resistance values for each factor are as follows (Table 5):
(1) Land cover is considered a critical factor influencing cultural exchanges in the Nanling Corridor. As the direct carrier of human activities, it comprehensively reflects both the “intensity of land use” and the “value of ecological protection.” Therefore, a relatively broad resistance value range (0–500) was assigned to finely capture its internal variations. Based on the current land use status in the Nanling Corridor region, land cover is classified into 3 categories. Cropland and construction land are the areas with the highest density of ethnic village distribution, where cultural activities and spatial connectivity occur most frequently, thus being assigned the lowest resistance values (5). Grassland and water bodies have limited impact on residents’ daily activities and are assigned moderate resistance values (150). Forests and shrubs, serving as critical ecological habitats with sparse village distribution, are assigned the highest resistance values (500) to protect ecological processes and reflect the actual connectivity challenges.
(2) Slope is regarded as the most critical topographic factor influencing the cost of human spatial movement and settlement decisions, as it determines the feasibility of transportation and construction. Consequently, it was assigned the same maximum resistance range (0–500) as land cover to reflect its comparable significance. With reference to widely adopted standards in geography, urban planning, and engineering, slope gradients were classified into 5 zones. Resistance values exhibit a progressive increase with rising slope steepness, as rugged terrain substantially elevates spatial mobility costs and impedes connectivity, thereby reducing inter-village linkage efficiency and the spatial extent of cultural influence dissemination.
(3) Traffic accessibility is recognized as the most influential socio-economic factor affecting cultural connectivity in the modern context. Roads, as the most potent artificial infrastructure for reducing spatial resistance, are assigned a moderate resistance value range (0–200), secondary only to land cover and slope. According to the distance decay law, cultural influence diminishes with increasing distance from roads. Therefore, based on the daily activity range and cultural exchange radius of rural residents, transport accessibility is classified into 4 levels. The resistance value increases significantly with the distance from the road, intuitively reflecting the core role of the road network in reducing spatial resistance and enhancing connectivity between villages.
(4) Elevation was assigned a relatively lower resistance range (0–100) due to its indirect and macro-scale influence on cultural diffusion. High-altitude areas are often associated with harsh weather conditions and complex topography, which can affect habitability and agricultural productivity, thereby indirectly influencing the distribution density of villages. However, unlike slope, elevation does not directly impede cultural exchange. The specific classification was based on statistical relationships between the distribution frequency of villages and elevation in the study area, resulting in the division of elevation into 5 zones. The resistance values increase significantly with rising altitude, reflecting the growing objective challenges posed by high-elevation areas to cultural diffusion, population mobility, and village construction.
(5) TRI reflects the overall roughness of the terrain within a region, serving as a macroscopic measure of slope variation. High TRI values indicate mountainous landscapes with deeply incised valleys, which can cause large-scale segmentation of cultural regions and form natural boundaries for cultural divisions. However, it does not directly determine the specific traversal cost at any given point. Therefore, it functions as a background regional resistance factor with a relatively limited resistance range (0–100). The classification thresholds were determined based on statistical analysis of regional DEM data and are divided into 4 tiers. The resistance values increase with the intensification of terrain undulation, and complex topography further impedes spatial connectivity.
To quantify the relative contribution of resistance factors to spatial connectivity resistance, this study employed the AHP to determine their weights. The evaluation process involved nine experts in the fields of physical geography, urban and rural planning, heritage conservation, and landscape architecture from the Nanling Ethnic Corridor region, invited by the research team. This process ensured that the resistance value allocation not only adhered to general principles but also aligned closely with the actual conditions of the study area. Judgment matrices were constructed through expert consultation and successfully passed consistency checks (CR = CI/RI = 0.076/0.90 ≈ 0.084). The weight distribution revealed the following: Land cover (0.4800) > Slope (0.2111) > Traffic Accessibility (0.1589) > Topographic Relief Index (0.0937) > Elevation (0.0564). The weight distribution indicates that land cover is the most critical dominant factor influencing the spatial connectivity of heritage sites in the Nanling Ethnic Corridor, followed by the accessibility of transportation infrastructure. Although slope, topographic relief, and elevation serve as natural limiting factors, their relative importance in this region decreases in that order.
2.
Calculate the composite resistance surface. By weighted overlay of five resistance factors, a comprehensive resistance surface was constructed (Formulas (4)–(5)). The global resistance value of the ethnic village heritage corridor was calculated using the Cost Distance tool in ArcGIS 10.8.
Minimum cumulative resistance value:
M C R = f m i n j = n i = m ( D i j R i )
where D i j represents the actual distance that ecological source   j needs to cross to reach another source i , and R i represents the resistance value that needs to be overcome to cross source i . f m i n is a positive correlation function reflecting the actual distance and the drag coefficient variable.
Resistance value:
F i = j = 1 n W j × A i j
where i represents the grid, j represents the resistance factor, F i represents the comprehensive resistance value of i grid, n represents the number of resistance factors, W j represents the proportion of j , and A i j represents the resistance value of j in i grid.
3.
Topology-Optimized Heritage Corridor Alignment. Functioning as spatial linkages connecting ethnic village heritage nodes, heritage corridors serve dual roles in cultural conservation and public service facility coordination [63]. Using the Model Builder tool in ArcGIS 10.8, this study generated multiple global potential heritage corridor paths in batches by integrating the comprehensive resistance surface, cost distance tool, and spatial distribution of ethnic villages as key parameters. To address the inefficiency caused by extensive invalid or redundant path computations resulting from global cross-operations, a network node optimization method based on topological theory is introduced. This method designates core ethnic villages within the landscape source areas as locally critical nodes for prioritized connectivity, thereby enhancing the overall efficiency of heritage corridor network construction. Subsequently, topological analysis tools are employed to evaluate the connectivity, clustering coefficient, and path length of different heritage corridor route alternatives, identifying primary and secondary heritage corridors to form a heritage corridor network for ethnic villages in the Nanling Ethnic Corridor.

3. Results

3.1. Landscape Character Assessment Results

3.1.1. Landscape Character Identification Results

Two-step cluster analysis in SPSS 27 identified nine distinct landscape type combinations (Table 6). A cluster quality value of 0.40 indicates a moderate degree of separation between the clusters. This effectively reflects the complexity of the landscape in the Nanling Ethnic Corridor, particularly the widespread natural transitions and ecotones between different landscape types. Therefore, the resulting nine landscape categories demonstrate not only strong interpretability in terms of spatial distribution and attributes but also considerable practical applicability. Through the table join tool in ArcGIS 10.8, the clustering results were associated with spatial grid units, preliminarily constructing the distribution map of landscape character in the Nanling Ethnic Corridor (Figure 3a). On this basis, multi-scale segmentation was performed using eCognition 9.0. Optimal segmentation results were attained when scale, compactness, and shape parameters were configured at 10, 0.5, and 0.1, respectively, dividing the study area into 4206 valid units. Subsequently, the classification tool, supplemented by manual correction, was used to generate the final landscape character map of the Nanling Ethnic Corridor (Figure 3b). The analysis results demonstrate that the Nanling Ethnic Corridor region can be categorized into 12 landscape character types, forming a total of 1414 character areas. Among these, mountainous coniferous forest landscapes are the most widely distributed, covering an area of 66,820 km2 and accounting for 28.5% of the total. In contrast, lake landscapes occupy the smallest area, merely 490 km2, representing only 0.2% of the total. Additionally, other landscape types, such as hilly mixed forest landscapes (33,323 km2), hilly terraced field landscapes (27,205 km2), and plain farmland landscapes (25,316 km2), each account for over 10% of the total area. These landscape types constitute the integrated spatial pattern of the Nanling Ethnic Corridor.

3.1.2. Landscape Value Assessment Results

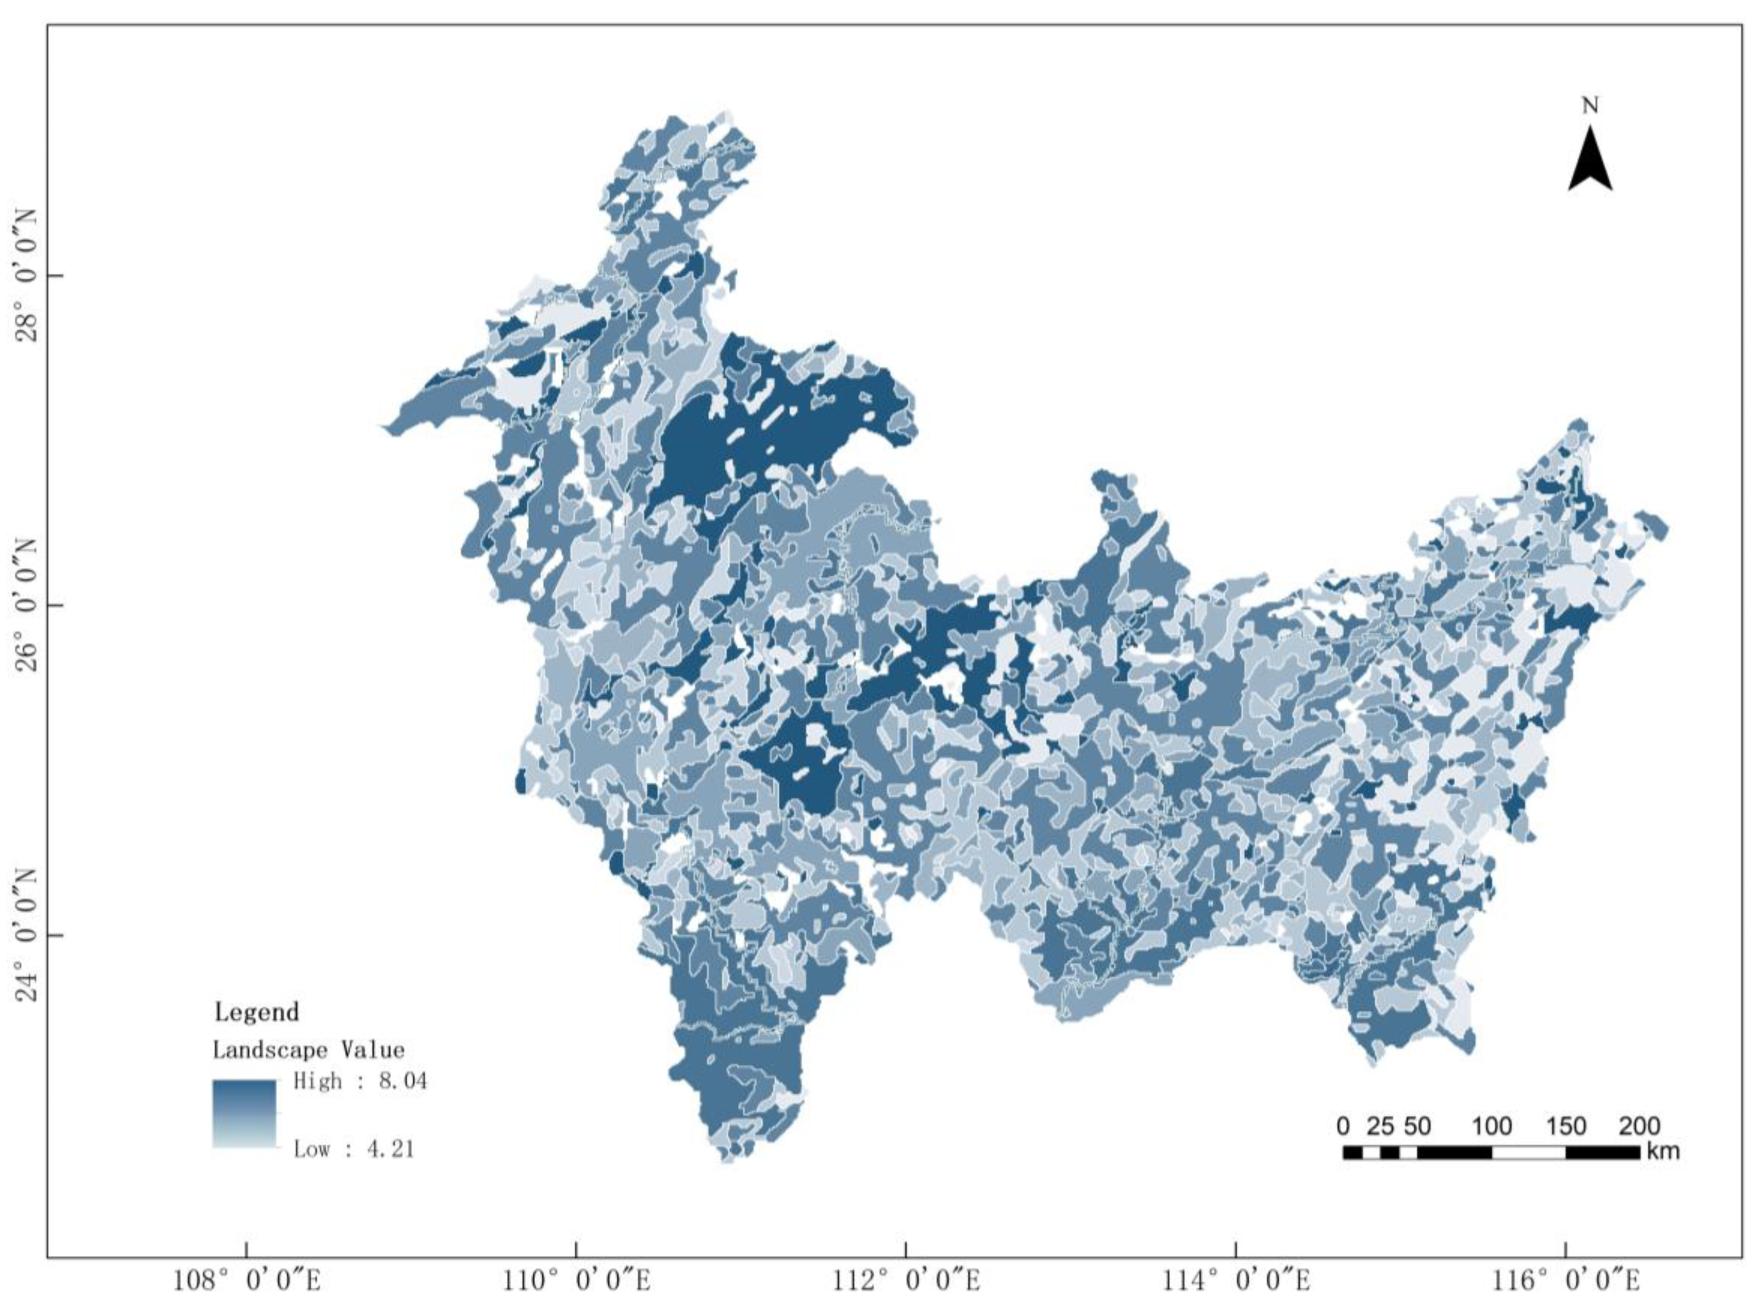
The landscape value assessment results (Figure 4) indicate that the landscape value within the Nanling Ethnic Corridor region ranges between 4.21 and 8.04 points, exhibiting significant spatial heterogeneity. High-value areas (6–8.04 points) were primarily concentrated in the central and northwestern mountainous regions, as well as the southern hilly areas of the corridor. These regions encompass the most ecologically and aesthetically valuable landscape types. Among them, aquatic landscapes (rivers, lakes) scored the highest due to their critical ecosystem service functions and recreational value; terraced fields in hilly areas were highly valued for their unique agro-cultural heritage and aesthetic appeal; while hilly mixed forests and mountainous coniferous forests received high ratings for their well-preserved ecological integrity and distinctive landscape value. Medium-value areas (5–6 points) were mainly distributed in transitional zones between the central and southern parts of the corridor, comprising three typical landscape types: urban settlement landscapes, which scored moderately due to their cultural service functions; plain farmland landscapes, which, despite their high production value, were relatively limited in landscape value; and mountainous broad-leaved forests, which were rated as intermediate due to their ecological superiority over plantations but inferiority to pristine forests. Low-value areas (scores of 4.21 to 5) were scattered across marginal regions, including the central mountains, eastern hills, and northwestern mountainous areas. These areas consist of four typical landscape types: alpine meadows, which are constrained by their short scenic viewing periods and fragile ecosystems; mountainous coniferous–broadleaf mixed forests, whose ecological functions have declined due to human disturbances; mountainous plantation landscapes, which exhibit limited landscape value due to monoculture tree species; and hilly coniferous forests, which scored lower due to their simplistic stand structure.

3.1.3. Landscape Source Identification Results

Based on the landscape value assessment results presented in Section 3.1.2, this study conducted an MSPA on high-value areas with scores exceeding 6.0. The MSPA results (Figure 5) showed that core areas constituted the predominant landscape component, accounting for 51.82% of the total high-value area. This was followed by the edge area (Edge, 30.75%) and the branch area (Branch, 6.49%). Combined, the islet, perforation, loop, and bridge areas contributed 10.94% of the total high-value area. A total of 329 core patches were identified. Subsequently, core patches exceeding 50 km2 in area were selected for landscape connectivity analysis with Conefor 2.6. This process culminated in the identification of 48 distinct landscape sources. The spatial distribution characteristics of these sources are as follows: (1) In terms of landscape composition, they are predominantly spatial complexes of high-value landscape types, with hilly terraced fields, hilly mixed forests, and mountainous coniferous forests being the dominant landscape types. Spatially, they exhibited a pronounced clustered pattern, with primary concentrations in the central, northwestern, and southern regions of the Nanling Ethnic Corridor, forming three distinct clustering centers. (2) In terms of spatial configuration, they generally exhibit a northwest–southeast oriented belt-like distribution, while other regions contain sparse and scattered source areas.
There are rich ethnic village resources distributed in the landscape source. Based on ethnic composition characteristics, it can be divided into 11 ethnic cultural units (Table 7), including representative ethnic settlement units such as the Xinhuang-Zhijiang Dong Ethnic Unit, the Longhui Hui Ethnic Unit, and the Ruijin She Ethnic Unit. Villages were categorized into two types based on their spatial relationship with the landscape source areas: core ethnic villages situated within the source boundaries and non-core ethnic villages distributed outside the source areas. Analysis indicates (Table 7) that these cultural units encompass six major ethnic minorities, namely the Yao, Dong, She, Miao, Hui, and Zhuang, demonstrating distinct characteristics of ethnic settlement. The villages of these ethnic groups maintain a relatively concentrated spatial distribution pattern while forming culturally distinctive communities. This “large, concentrated settlements with small mixed habitation” spatial distribution pattern of ethnic groups provides an ideal material carrier and cultural foundation for constructing a comprehensive and continuous ethnic cultural heritage corridor.

3.2. Heritage Corridor Construction Results

3.2.1. Composite Resistance Surface and Suitability Zoning Results

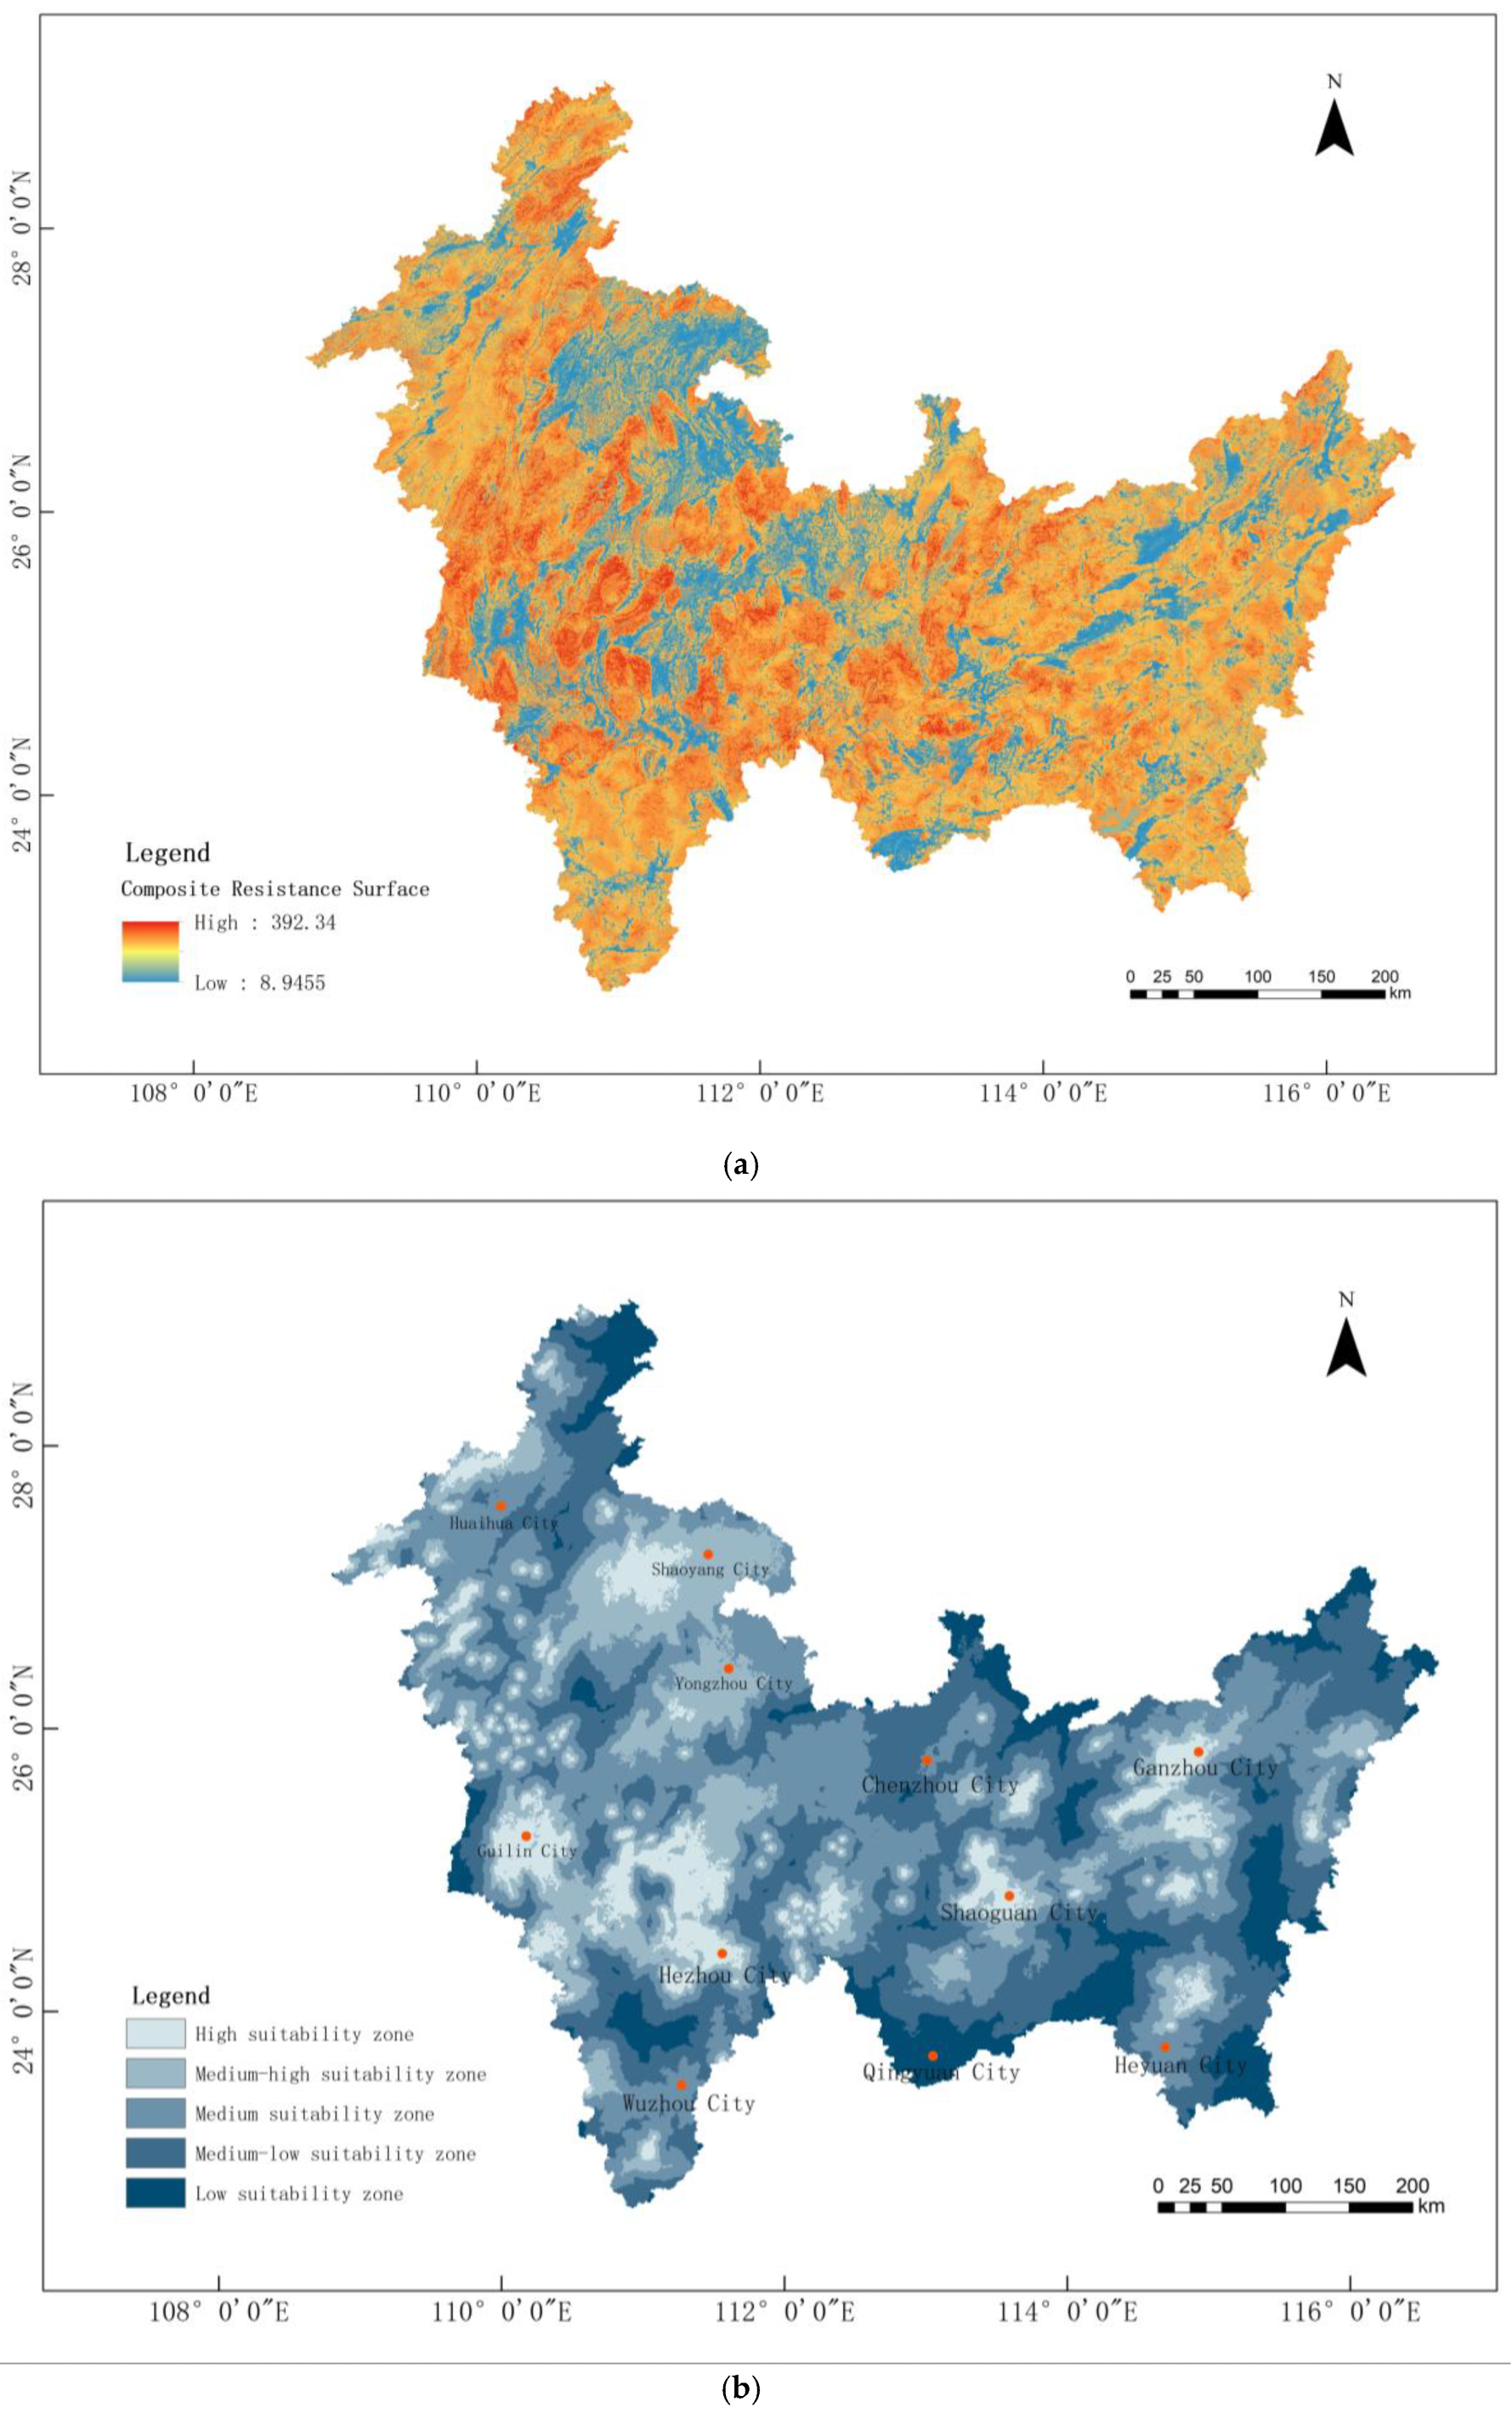
The composite resistance surface model of the Nanling Ethnic Corridor, incorporating land cover types, elevation, slope, relief amplitude, and transport accessibility (Figure 6a), reveals significant spatial differentiation of resistance levels across the study area, manifesting a clear “low-central, high-periphery” spatial pattern. Specifically, the high-resistance zones are predominantly concentrated in the mountainous areas of the central and western Nanling Ethnic Corridor. Due to their distance from urban settlements and water systems, as well as poor transportation accessibility, these regions exhibit significant resistance to development and construction. Notably, however, these high-resistance areas often possess high landscape value. Conversely, the low-resistance zones are sporadically distributed across the plains in the western and northern parts of the corridor. Benefiting from flat terrain and convenient transportation, these areas serve as ideal locations for the development of ethnic villages. Nevertheless, their landscape value is lower in comparison with high-resistance zones.
The suitability zoning results (Figure 6b) show that the resistance value thresholds increased sequentially from high to low and were measured as 51.473, 27.873, 12.593, and 4.993. Accordingly, the study area was classified into five spatial categories in descending order: high suitability zones, medium-high suitability zones, medium suitability zones, medium-low suitability zones, and low suitability zones. The high and medium-high suitability zones are distributed around Guilin, Shaoyang, Hezhou, Shaoguan, Ganzhou, and Heyuan, exhibiting a discontinuous patchy structure characterized by intermittently distributed continuous multi-patch patterns.

3.2.2. Heritage Corridor Route Selection Results

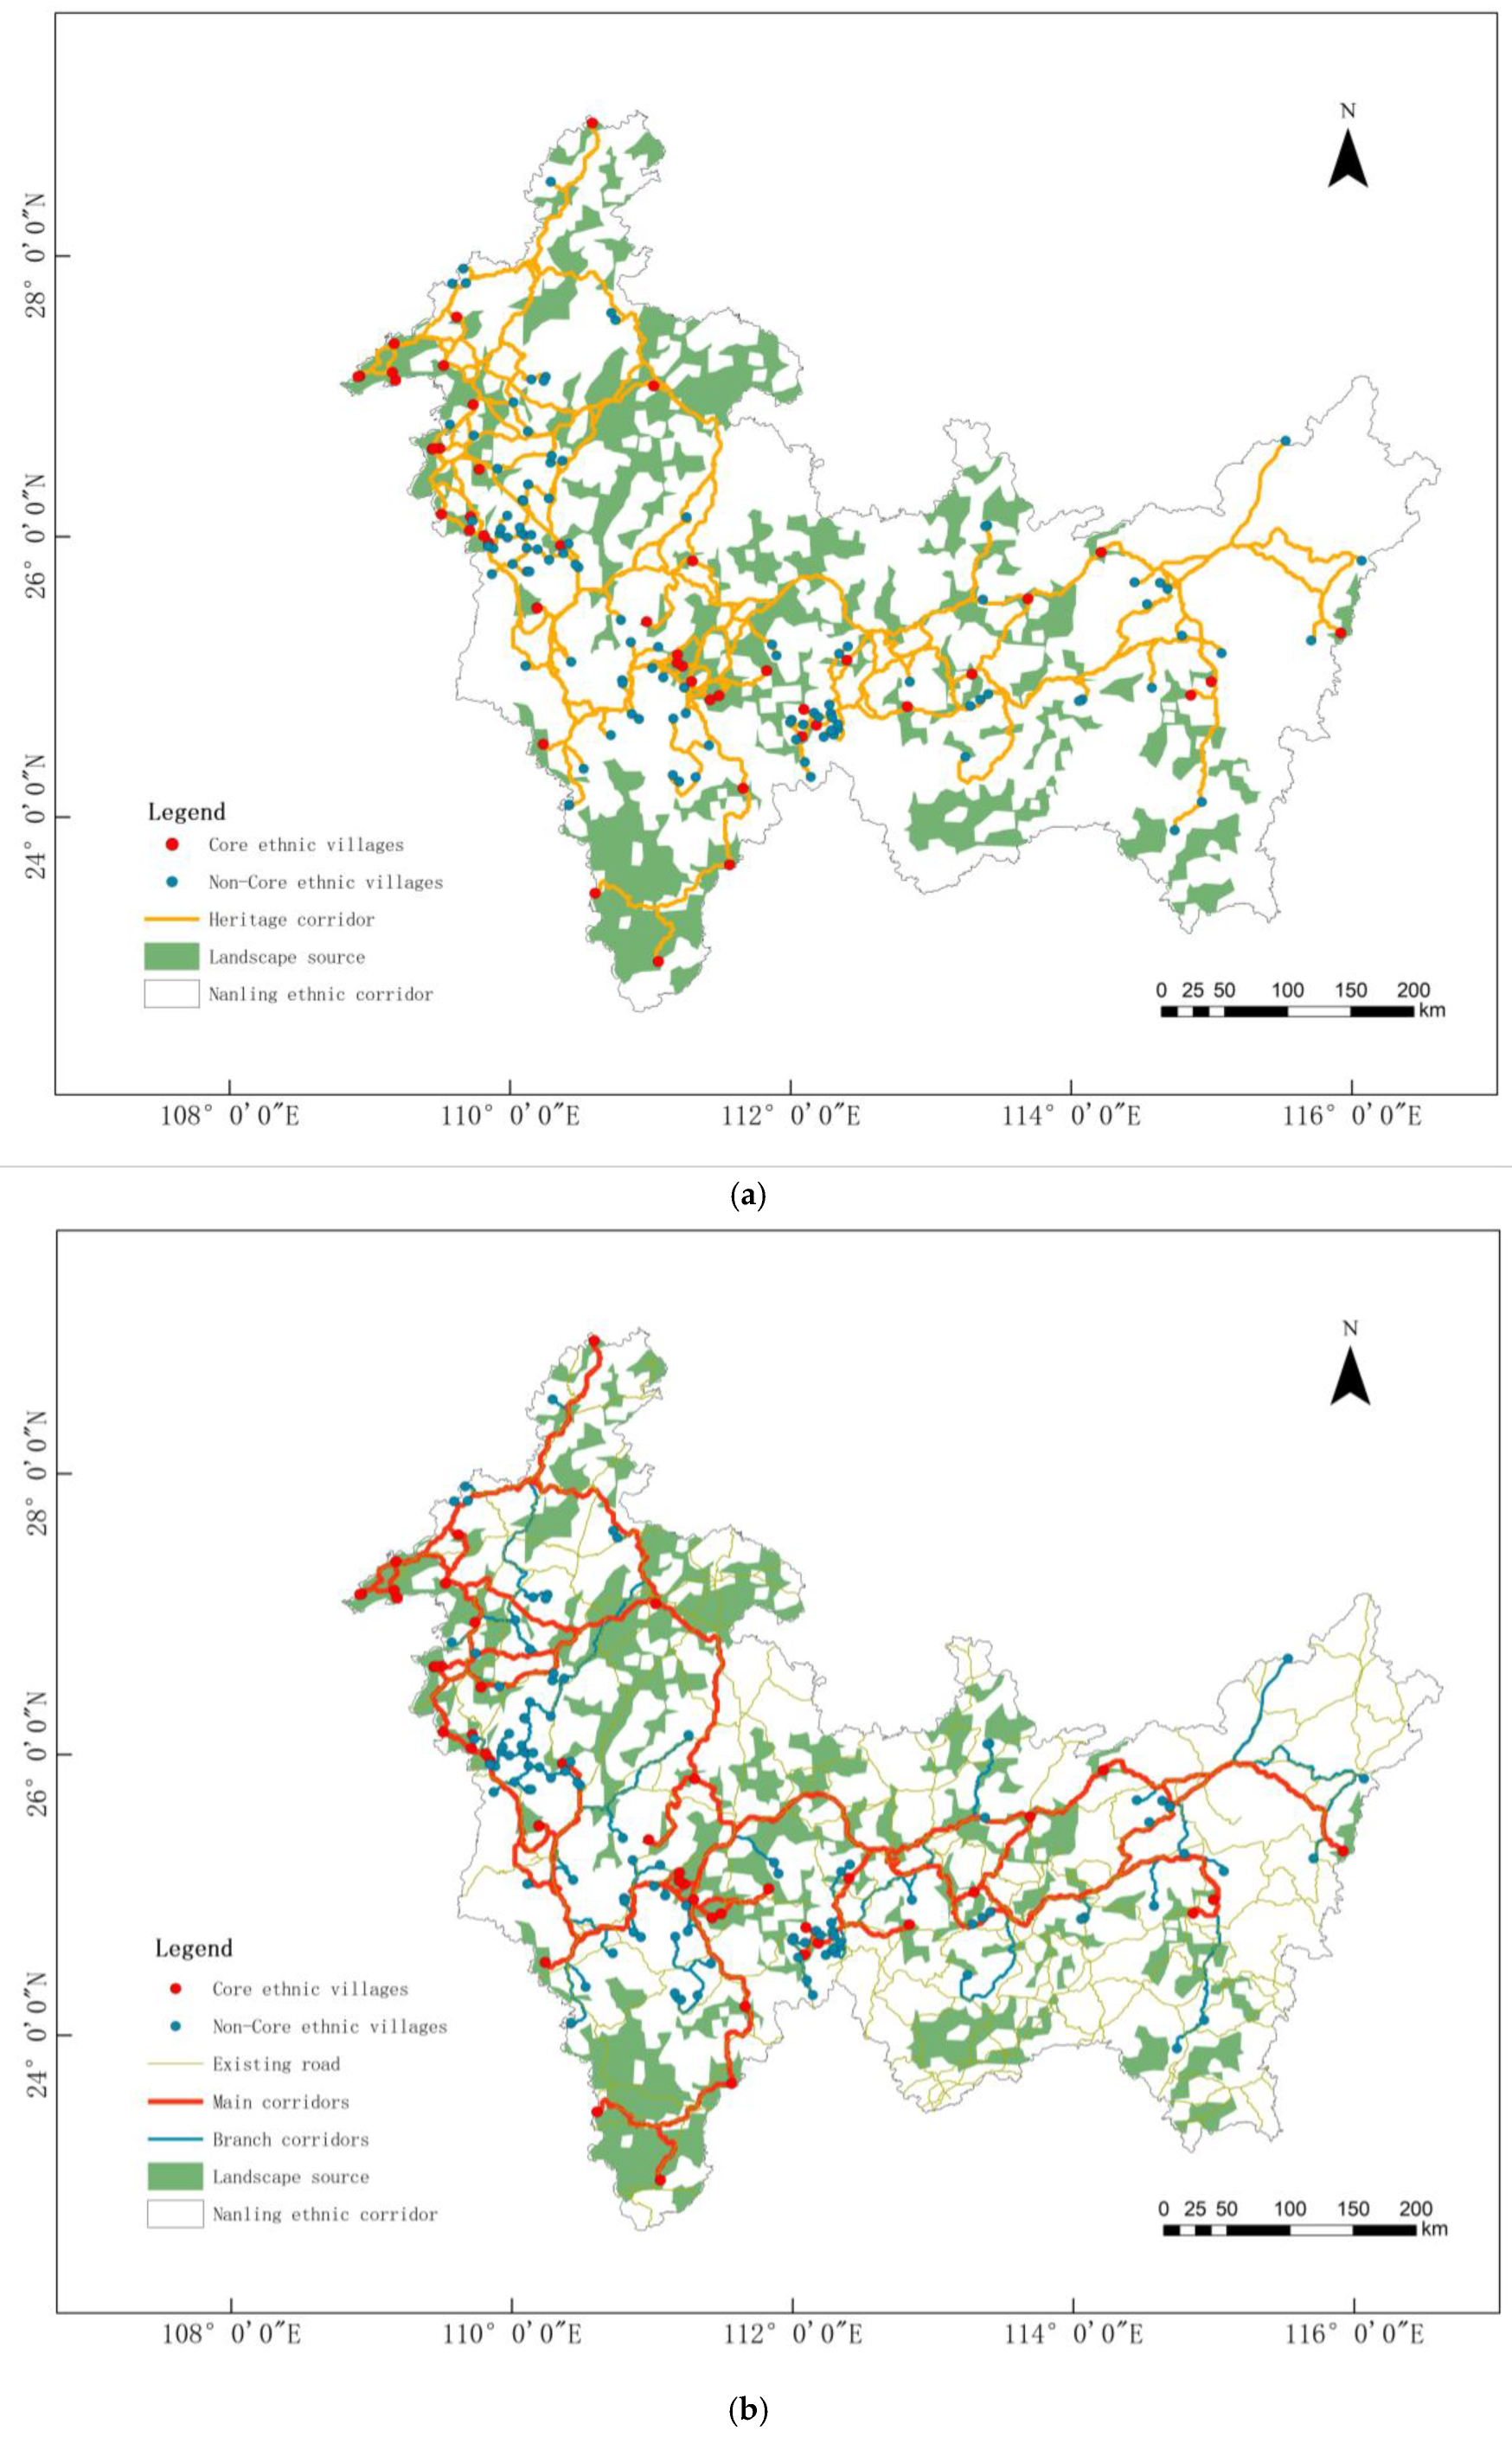
Utilizing the MCR model, a preliminary sketch of the cultural heritage corridor of ethnic villages in the Nanling Ethnic Corridor was constructed (Figure 7a). A total of 352 corridors were identified. However, this preliminary network exhibited structural deficiencies, including redundant connections, incomplete coverage of key nodes, high vulnerability (e.g., over-reliance on individual cores and limited alternative pathways), and low overall efficiency. To address these issues, this study identified core ethnic villages within the landscape source areas as local key nodes and employed topological analysis tools to optimize the heritage corridor network. Ultimately, the heritage corridor of ethnic villages in the Nanling Ethnic Corridor was developed (Figure 7b). The results indicate that a total of 151 corridors were identified, forming a clear “main-branch” hierarchical structure. Among them, 45 main corridors connect core ethnic village nodes to form the backbone of the network, while 106 branch corridors extend radially to surrounding non-core nodes, creating a secondary network. The spatial distribution reveals significant disparities in corridor density, with intensive networks in the central and western regions due to the high concentration of ethnic villages and well-developed road systems, and sparser networks in the east and south due to constraints such as extensive natural forest coverage, sparse distribution of cultural heritage nodes, and inadequate transportation accessibility. The network topology exhibits the following characteristics: two north–south arterial corridors in the western region and one east–west arterial corridor in the central region jointly form a core framework characterized by a “two verticals and one horizontal” structure. Branch corridors radiate outward from this primary framework, ultimately interweaving to create a ring-shaped network system covering major ethnic settlements. The topologically optimized heritage corridor establishes a structural framework that facilitates the systematic conservation and sustainable utilization of cultural heritage by reinforcing the hub function of core villages and organically integrating dispersed landscape resources. It directly addresses the need for optimized resource allocation amid population shrinkage, thereby offering an effective solution to overcome the traditional “isolated-point-based” conservation dilemma.
To further validate the enhanced connectivity of the optimized heritage corridor relative to the existing road network, this study employed four topological metrics (connectance, circuitry, node connectivity, and the alpha index) to conduct a comparative analysis of the coverage and connectivity of cultural heritage nodes in ArcGIS 10.8 (Table 8). The results demonstrate that the connectance of the heritage corridor (0.34) is more than twice that of the existing road network (0.16), indicating a significant enhancement in overall connectivity. The notable increases in both the alpha index and circuitry collectively confirm that the heritage corridor has formed more circuitous structures, leading to a substantial improvement in robustness and effectively mitigating the structural vulnerability observed in the current road system. Moreover, the node connectivity of the heritage corridor network (3.3) was considerably higher than that of the existing road network (1.6), indicating that cultural heritage nodes are connected to a greater number of corridors, thereby strengthening its pivotal role within the network.

3.2.3. Spatial Pattern Construction of Heritage Corridor

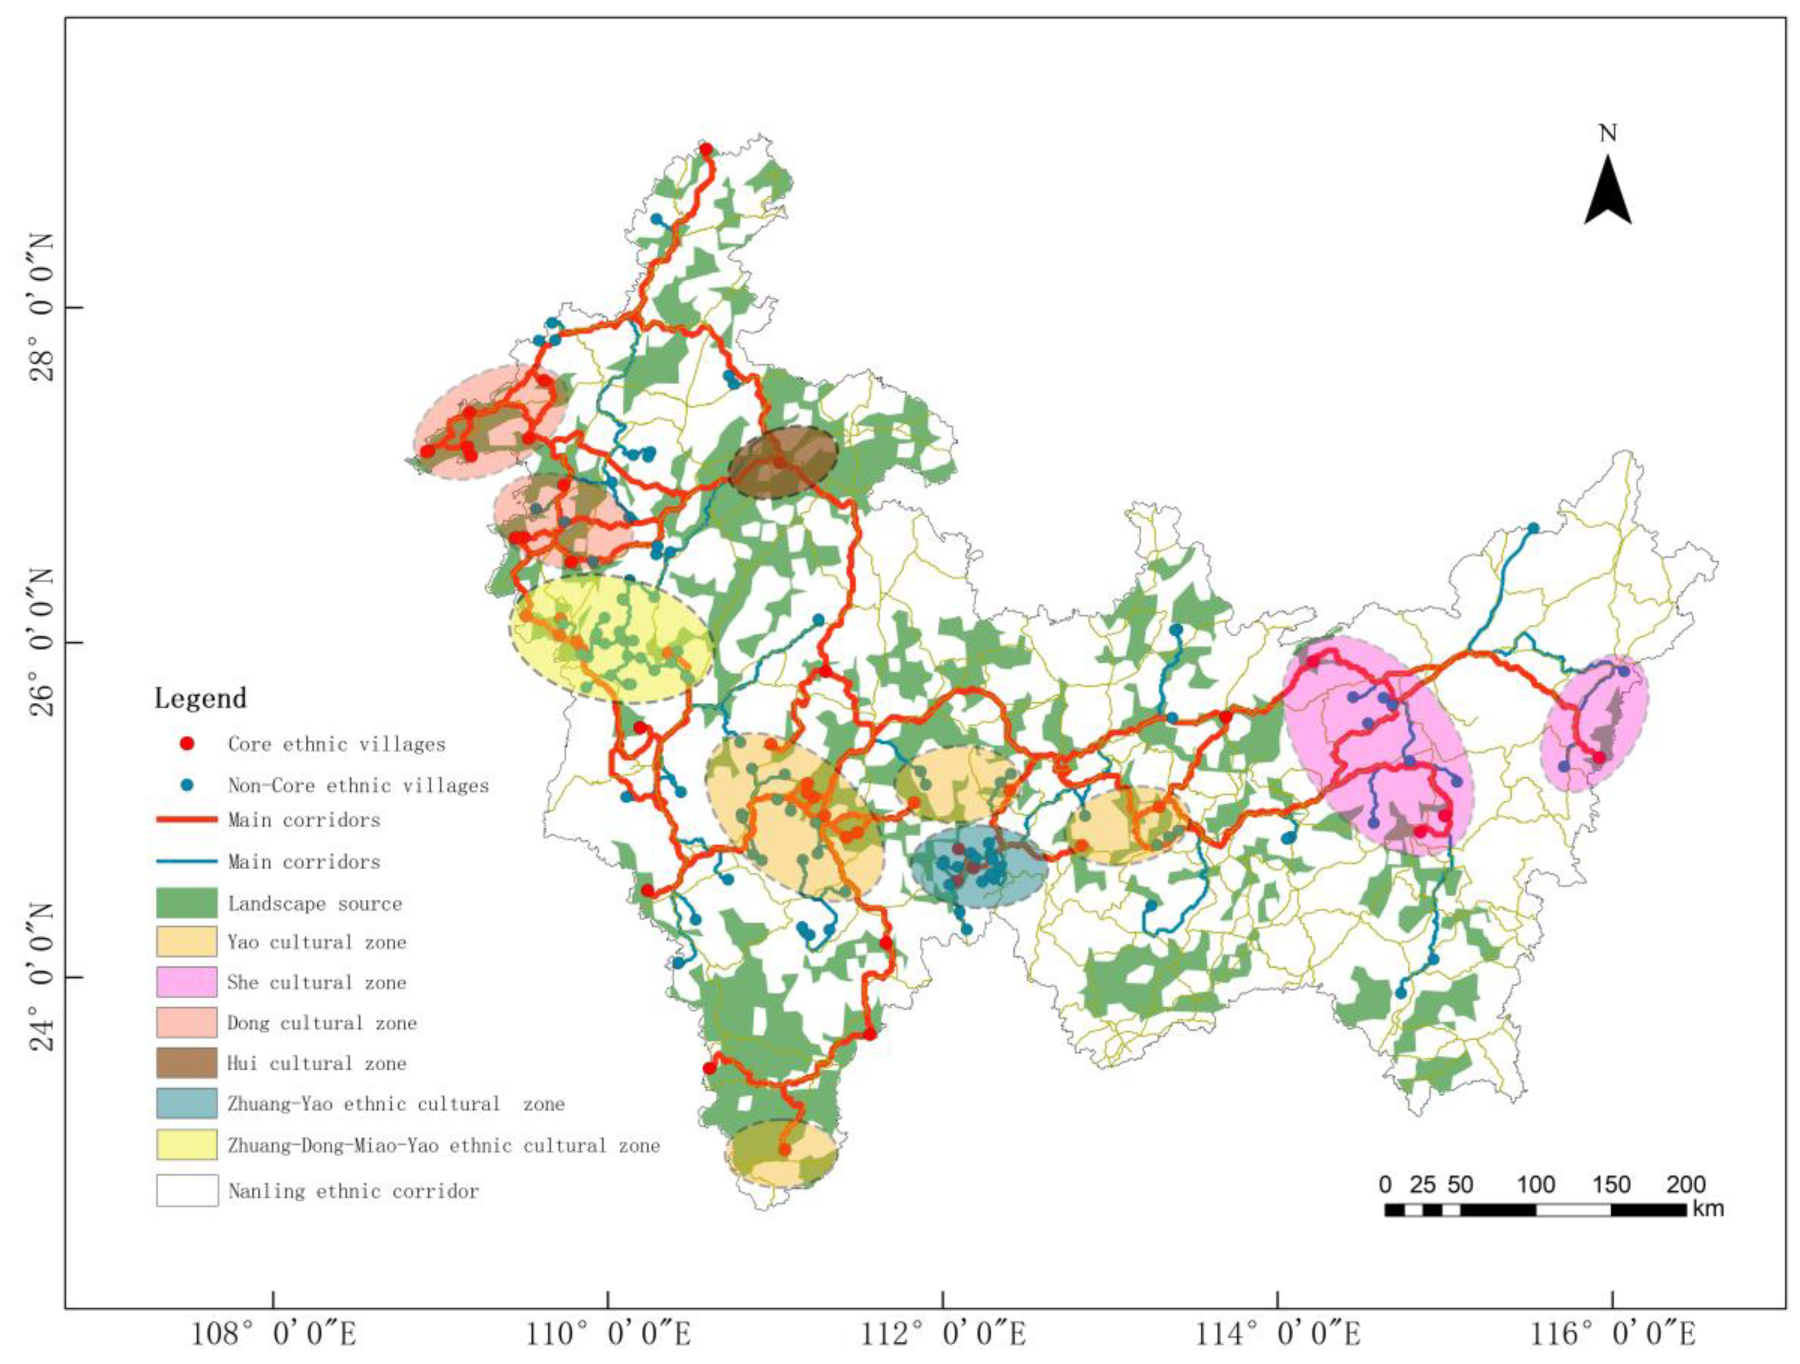
Based on ethnic villages, landscape sources, and heritage corridors, this study constructs a four-dimensional integrated spatial pattern of heritage corridors, namely “points (ethnic minority characteristic villages)–sources (core heritage source areas)–corridors (heritage corridors)–regions (ethnic cultural zones)” (Figure 8). This framework systematically integrates scattered cultural nodes and ecological resources, forming 11 distinctive cultural zones categorized into six major types, which significantly enhances the network’s conservation efficacy and the experiential diversity of regional cultural heritage. The spatial distribution pattern is characterized as follows: The Yao cultural zones (5 clusters) are concentrated in the central-southern section of the Nanling Ethnic Corridor (e.g., Gongcheng, Jiangyong, Ruyuan), characterized by hilly terraced fields and alpine flora landscapes, exhibiting both high ecological and aesthetic value. The Dong cultural zones (2 clusters) are distributed in the western region (Xinhuang, Huitong), featuring alpine coniferous forest landscapes. The She cultural zones (2 clusters) are located in the eastern area (Ganzhou), dominated by hilly farmland landscapes. Particularly noteworthy is the multi-ethnic cultural convergence zone of Longsheng–Tongdao–Ziyuan. Although its direct ornamental value is constrained by mountainous mixed broadleaf–conifer forests and meadow landscapes, its unique cultural intermingling characteristics possess irreplaceable sociocultural significance. This spatial configuration is not merely about resource exploitation, but rather a systematic evaluation based on cultural heritage elements, achieving a spatial coupling of natural ecology and cultural resources. Through differentiated conservation mechanisms (e.g., strict protection in core zones and moderate development in peripheral areas), it effectively reconciles the conflict between heritage preservation and tourism development, maximizes the recreational service functions of cultural resources, and provides cultural driving forces for regional sustainable development. Ultimately, it facilitates the synergistic transformation of landscape, ecological, and cultural multidimensional values.

4. Discussion

This study constructed a landscape heritage corridor network for ethnic villages in the Nanling Ethnic Corridor by integrating Landscape Character Assessment, Morphological Spatial Pattern Analysis, and the Minimum Cumulative Resistance model. It provides a spatial solution for the systematic protection of cultural heritage against the backdrop of population shrinkage. This study demonstrates the effectiveness of this integrated multi-method framework in identifying high-value landscape sources, optimizing corridor connectivity, and establishing a multi-level protection system of “point–source–corridor–region”. This approach addresses the limitations of scale and methodological simplicity inherent in traditional conservation models. However, there remain issues requiring in-depth exploration in this study regarding theoretical depth and practical application, which mainly focus on the following three dimensions.

4.1. Ecological Risks: Challenges of Climate Change to Corridor Feasibility

The impacts of climate change-induced extreme weather events, such as extreme rainfall and landslides, on the physical connectivity and long-term stability of landscape heritage corridors warrant further investigation. Specifically, future studies should quantify the frequency and intensity of such events in the Nanling region and their potential damage to corridor infrastructure (e.g., ancient post roads and river valley trails). The Nanling Ethnic Corridor features fragmented mountainous terrain and complex geological conditions. Although the corridor route selection was optimized based on the current MCR surface, the dynamic environmental factors (e.g., geological stability) incorporated into the model are still insufficient. Extreme rainfall may intensify soil erosion, leading to path interruptions or substrate erosion of linear cultural heritage relying on ancient post roads and river valley areas. In contrast, landslides directly threaten the safety of core villages located in steep slope areas and the connecting corridors [64]. Future research urgently needs to introduce “climate scenario simulations” and “geological hazard sensitivity assessments” to dynamically adjust the weights of ecological factors in the resistance surface model. This will enhance the resilience threshold and adaptive pathways of the corridor network under the context of climate change. For instance, priority could be given to strengthening river valley corridors with stable ecological substrates, or alternative cultural trails could be preset for high-risk areas.

4.2. Socio-Cultural Risks: Concerns over Cultural Commodification and Gentrification

Tourism development driven by heritage corridors, while activating the local economy, may also trigger risks of cultural commodification and spatial gentrification [65]. The “living nature” of the multi-ethnic cultures in the Nanling Ethnic Corridor is one of the core values of the landscape heritage corridors. However, tourism-oriented commodification tends to simplify rituals (e.g., sacrifices) and handicrafts into performative consumer products, potentially undermining cultural authenticity and ethnic identity. Meanwhile, the involvement of external capital may lead to a rise in land prices in corridor node areas. For example, around well-known scenic spots like the Lijiang River in Guilin and the Huangyao Ancient Town in Hezhou, there have been phenomena of squeezing the living space of indigenous residents, forming a paradox between “cultural display enclave” and “living space replacement”. To mitigate this risk, it is necessary to pre-set a “cultural sovereignty” mechanism in corridor planning: on the one hand, community-participatory design (e.g., the “Kuanyue (Terms of agreement)” system of the Dong ethnic group) should be adopted to ensure that the right to cultural interpretation belongs to the local ethnic groups; on the other hand, “indigenous rights protection zones” should be demarcated in spatial management and controlled to restrict the intensity of commercial development and safeguard the continuity of life in ethnic villages and the stability of the main body of cultural inheritance.

4.3. Model Applicability: Potential for Cross-Regional and Cross-Cultural Application

Although the integrated LCA-MSPA-MCR framework developed in this study was empirically tested using the Nanling Ethnic Corridor in China as a case study, its methodological design possesses significant cross-regional adaptability and cross-cultural application potential. The realization of this potential is rooted in the model’s modular and adjustable framework structure: (1) In terms of cross-regional applicability, the core advantage of the model lies in the flexibility and extensibility of its factor system. The evaluation index system within the LCA module can be dynamically reconstructed according to the natural and humanistic characteristics of different regions. For example, when applied to oasis–desert corridors in arid areas of Northwest China, ecological resistance factors such as water resource availability and aeolian erosion sensitivity can be incorporated, while cultural value indicators—including oasis agricultural cultural heritage and religious heritage sites—can be emphasized. In contrast, for southeastern coastal regions or canal corridor areas, the weight of topographic resistance can be reduced, with greater focus placed on water system connectivity, intertidal zone ecological functions, and the value of marine cultural landscapes. The adjustability of resistance factor types, classification criteria, and weights in the MCR model allows it to be effectively adapted to the diverse landscape contexts and heritage spatial distribution characteristics of different regions, facilitating the transition from a “mountain model” to a “plain model” or “waterfront model.” (2) Regarding cross-cultural applicability, the model demonstrates the ability to address cultural diversity and complexity. Humanistic landscape evaluation factors in the LCA module (e.g., village density, cultural heritage type density) can be custom-designed to match the characteristics of different cultural regions. For instance, in multi-ethnic settlements in Southwest China, the weights of terrace culture, rice-farming systems, and ethnic festival landscapes can be prioritized; in the Tibetan-Qiang-Yi Corridor, however, greater emphasis should be placed on the value of religious sacred sites, watchtower relics, and plateau nomadic cultural landscapes. The coupling mechanism of MSPA-MCR not only identifies spatial connections but also recognizes the continuity and fragmentation of cultural spaces—a capability that aids in reconstructing spatial carriers of cultural identity in culturally interlaced or fragmented regions, such as cross-border ethnic areas and urban historical and cultural blocks.
Nevertheless, the cross-regional application of the model faces three key challenges: First, regional variations in the quantitative assessment of cultural values necessitate greater incorporation of local community input (e.g., through participatory GIS and oral history interviews) to calibrate cultural weights, thereby preventing technical indicators from being detached from local knowledge systems. Second, inconsistencies in data availability and accuracy—particularly in cross-border regions or areas with underdeveloped data infrastructure—demand the integration of multi-source data (e.g., traditional knowledge, high-resolution remote sensing images, and geotagged social media data) to compensate for gaps in official datasets. Third, variations in governance structures mean that the effectiveness of the model in administratively fragmented regions (e.g., cross-border corridors and ethnic autonomous areas) is highly dependent on the efficiency of cross-administrative collaboration mechanisms. Thus, data sharing agreements and joint management mechanisms must be established as institutional guarantees for model promotion. In the future, the flexibility and universality of the model can be further enhanced through modular development—for example, by constructing a “core-optional” factor library or developing “simplified” and “enhanced” application workflows adapted to different data conditions and cultural contexts. This will facilitate the expansion of the method from a regional case study to a cross-cultural and cross-regional heritage conservation paradigm.

5. Conclusions

To address the challenges of “loss of cultural carriers and fragmentation of landscape management” arising from population shrinkage, this study innovatively proposes an integrated “LCA-MSPA-MCR” framework. This model enables the systematic protection of the landscapes of ethnic villages in the Nanling Ethnic Corridor, covering the entire process from “value identification” to “spatial optimization”. The findings of this study not only deepen the theoretical understanding of heritage corridors in shrinking regions but also provide a reference for fostering cultural resilience in similar contexts worldwide. The main conclusions are as follows: (1) At the theoretical and methodological level, a three-in-one heritage corridor planning technical framework of “value identification–spatial optimization–network construction” has been established. This framework addresses key challenges, including the spatial representation of cultural values, the scientific delineation of protected areas, and the spatial optimization of corridors, thereby promoting the paradigm shift in heritage protection from single-point static protection to network-based dynamic adaptation. (2) At the empirical application level, 12 types of landscape character types and 48 landscape sources have been identified in the Nanling Ethnic Corridor. A heritage network system consisting of 151 corridors has been constructed, forming a spatial structure characterized by a “two vertical and one horizontal” main framework complemented by a circular branch network. This provides a scientific basis for the systematic protection of regional cultural heritage. (3) At the practical value level, the proposed four-dimensional protection model of “point–source–corridor–area” and differentiated development strategies can not only enhance the integrity and effectiveness of cultural heritage protection but also promote the activated utilization and sustainable development of cultural resources. These outcomes offer an integrated solution for balancing cultural protection and regional development in the context of population shrinkage. (4) At the implementation mechanism level, future research will focus on the adaptability and refined application of the proposed methods. In particular, in-depth explorations will be conducted into aspects such as climate change resilience, community participation mechanisms, and cross-cultural comparisons.

Author Contributions

X.T.: supervision, guidelines, writing—review and editing. J.M.: funding acquisition, methodology, conceptualization, software, writing—original draft, writing—review and editing. Y.T.: formal analysis, investigation, software, writing—original draft. All authors have read and agreed to the published version of the manuscript.

Funding

This study was funded by the National Social Science Foundation of China under the project: “Research on the Protection and Inheritance of Ethnic Characteristics in the Rural Construction action of Nanling Ethnic Corridor”. Project Number is 21CMZ001.

Data Availability Statement

The data presented in this study are available on request from the corresponding author.

Acknowledgments

This research was successfully completed with the generous support of the Guilin Urban Planning and Design Institute, which provided essential materials and data for the study. We also extend our sincere gratitude to the experts and scholars who contributed to the experimental phase of this research.

Conflicts of Interest

The authors declare no conflicts of interest.

Abbreviations

The following abbreviations are used in this manuscript:
ICOMOSInternational Council on Monuments and Sites
MCRMinimum Cumulative Resistance
ESMEnvironmental Space Model
CECCircuit Effective Conductance
ROSRecreation Opportunity Spectrum
CAPConservation Action Planning
GISGeographic Information System
RSRemote Sensing
CBACost–Benefit Analysis
LCALandscape Character Assessment
MSPAMorphological Spatial Pattern Analysis
DEMDigital Elevation Model
CNLUCCChina 30 m Resolution Land Use/Cover Data
RESDCResource and Environmental Science Data Center
AHPAnalytic Hierarchy Process
CRConsistency Ratio
PCProbability of Connectivity Index
IICIntegral Index of Connectivity
TRITopographic Relief Index

References

  1. Population Division of the United Nations Department of Economic and Social Affairs. World Population Prospects 2023; United Nations: New York, NY, USA, 2023. [Google Scholar]
  2. National Bureau of Statistics. China Population Census Yearbook 2020; China Statistics Press: Beijing, China, 2021. [Google Scholar]
  3. Zhang, P.; Pu, H. Flexible Control of Urban Development Intensity in Response to Population Shrinkage: A Case Study of Shantou City. Buildings 2025, 15, 1378. [Google Scholar] [CrossRef]
  4. Wang, D.; Wei, X.D.; Yan, X.Q.; Sohaib, O. A Study on Sustainable Design of Traditional Tujia Village Architecture in Southwest Hubei, China. Buildings 2024, 14, 27. [Google Scholar] [CrossRef]
  5. Zhang, X.Z.; Ren, Y.Y.; Lv, J.; Geng, Y.H.; Su, C.X.; Ma, R.Q. Morphological Evolution and Socio-Cultural Transformation in Historic Urban Areas: A Historic Urban Landscape Approach from Luoyang, China. Buildings 2025, 15, 1373. [Google Scholar] [CrossRef]
  6. Del Curto, D.; Garzulino, A.; Menini, G.; Schiesaro, C. Sustainable Conservation and Management of a 20th-Century Landscape in the Alps: The Former Sanatorium Village of Sondalo. Sustainability 2022, 14, 7424. [Google Scholar] [CrossRef]
  7. Su, G.; Okahashi, H.; Chen, L. Spatial Pattern of Farmland Abandonment in Japan: Identification and Determinants. Sustainability 2018, 10, 3676. [Google Scholar] [CrossRef]
  8. Zou, M.H. Effectiveness Evaluation and Adaptive Management Model Construction of Mount Wutai World Cultural Landscape Heritage Management. Master’s Thesis, Nanchang University, Nanchang, China, 2022. (In Chinese). [Google Scholar]
  9. ICOMOS-IFLA. ICOMOS-IFLA Principles Concerning Rural Landscapes as Heritage; ICOMOS: New Delhi, India, 2017. [Google Scholar]
  10. Ministry of Finance; Ministry of Housing and Urban-Rural Development. Notice on Organizing the Application for 2024 Demonstration of Concentrated and Contiguous Protection and Utilization of Traditional Villages: Cai Ban Jian [2024] No. 15 [EB/OL]; Office of the Central Financial and Economic Affairs Commission of the Communist Party of China: Beijing, China, 2024. Available online: https://www.mof.gov.cn (accessed on 15 June 2025).
  11. Zhang, T.X.; Yang, Y.L.; Fan, X.; Ou, S.Y. Corridors Construction and Development Strategies for Intangible Cultural Heritage: A Study about the Yangtze River Economic Belt. Sustainability 2023, 15, 13449. [Google Scholar] [CrossRef]
  12. Yue, F.T.; Li, X.Q.; Huang, Q.; Li, D. A Framework for the Construction of a Heritage Corridor System: A Case Study of the Shu Road in China. Remote Sens. 2023, 15, 4650. [Google Scholar] [CrossRef]
  13. Chen, J.L.; Zhao, X.X.; Wang, H.Q.; Yan, J.X.; Yang, D.; Xie, K. Portraying Heritage Corridor Dynamics and Cultivating Conservation Strategies Based on Environment Spatial Model: An Integration of Multi-source Data and Image Semantic Segmentation. Herit. Sci. 2024, 12, 419. [Google Scholar] [CrossRef]
  14. Wu, Y.; Miao, M.R.; Wu, Y.L.; Zhu, H.; Li, X.B.; Candeias, A. The Research on the Construction of Traditional Village Heritage Corridors in the Taihu Lake Region Based on the Current Effective Conductance (CEC) Theory. Buildings 2025, 15, 472. [Google Scholar] [CrossRef]
  15. Shen, H.Q. Review of National Park Visitor Experience Indicators: A Case Study of ROS, LAC and VERP. Landsc. Archit. 2013, 5, 86–91. (In Chinese) [Google Scholar]
  16. Que, Z.S.; Hu, Y.M.; Li, J.H.; Li, H.Y.; Zhao, S.C.; Yang, J.; Nie, X.W. The Empirical Study of Land Use Zoning Method based on MAPGIS. J. Anhui Agric. Sci. 2009, 37, 1843–1844. (In Chinese) [Google Scholar]
  17. Yang, R. On the Development Trend of World National Park Movement. Chin. Landsc. Archit. 2003, 7, 10–15. (In Chinese) [Google Scholar]
  18. Huang, Y.H.; Shen, S.Y.; Hu, W.M.; Li, Y.R.; Li, G. Construction of Cultural Heritage Tourism Corridor for the Dissemination of Historical Culture: A Case Study of Typical Mountainous Multi-Ethnic Area in China. Land 2023, 12, 138. [Google Scholar] [CrossRef]
  19. Xie, Y.S.; Wang, Q.N.; Xie, M.Q.; Shibata, S. Construction Feasibility Evaluation for Potential Ecological Corridors under Different Widths: A Case Study of Chengdu in China. Landsc. Ecol. Eng. 2023, 19, 381–399. [Google Scholar] [CrossRef]
  20. Zhang, Z.Z.; Meerow, S.; Newell, J.P.; Lindquist, M. Enhancing Landscape Connectivity through Multifunctional Green Infrastructure Corridor Modeling and Design. Urban For. Urban Green. 2019, 38, 305–317. [Google Scholar] [CrossRef]
  21. Zhang, L. Study on the Development of Railway Location Design System Based on GIS. Master’s Thesis, Southwest Jiaotong University, Chengdu, China, 2007. (In Chinese). [Google Scholar]
  22. Jurković, Ž.; Hadzima-Nyarko, M.; Lovoković, D. Railway Corridors in Croatian Cities as Factors of Sustainable Spatial and Cultural Development. Sustainability 2021, 13, 6928. [Google Scholar] [CrossRef]
  23. Feng, B.; Ma, Y.C. Network Construction for Overall Protection and Utilization of Cultural Heritage Space in Dunhuang City, China. Sustainability 2023, 15, 4579. [Google Scholar] [CrossRef]
  24. Jiang, N.; Wu, J.Y.; Ma, Y.C.; Jia, Y.; Zhao, D. Research on the Evaluation Criteria of Rural Landscape Resources under the Background of New Era–From the Perspective of Building an Ecological, Livable and Beautiful Countryside. Landsc. Des. 2024, 4, 8–11. (In Chinese) [Google Scholar]
  25. Li, Y.J.; Li, S. On Review and Prospect of the Ethinc Corridor in South Five Ridege. J. Guangxi Norm. Univ. (Philos. Soc. Sci. Ed.) 2016, 5, 67–73. (In Chinese) [Google Scholar]
  26. Wang, Y.L. Research on Chinese and Foreign Traffic and Belief Space; The Commercial Press: Beijing, China, 2011. [Google Scholar]
  27. Ma, G.Q. On Anthropological Location and Conntataion of Nanling Ethnic Corridor. J. Guangxi Norm. Univ. (Philos. Soc. Sci. Ed.) 2013, 3, 84–90. (In Chinese) [Google Scholar]
  28. Kim, K.; Pauleit, S. Landscape Character, Biodiversity and Land Use Planning: The Case of Kwangju City Region, South Korea. Land Use Policy 2007, 24, 264–274. [Google Scholar] [CrossRef]
  29. Trop, T. From knowledge to action: Bridging the Gaps toward Effective Incorporation of Landscape Character Assessment Approach in Land-use Planning and Management in Israel. Land Use Policy 2017, 61, 220–230. [Google Scholar] [CrossRef]
  30. Zakariya, K.; Ibrahim, P.H.; Abdul Wahab, N.A. Conceptual Framework of Rural Landscape Character Assessment to Guide Tourism Development in Rural Areas. J. Constr. Dev. Ctries. 2019, 24, 85–99. [Google Scholar] [CrossRef]
  31. Yang, Y.; Hu, J.; Liu, D.J.; Li, Y.J.; Chen, Y.; Hu, S.L. Spatial Differentiation of Ethnic Traditional Villages in Guizhou Province and the Influencing Factors. J. Arid. Land Resour. Environ. 2022, 36, 178–185. (In Chinese) [Google Scholar]
  32. Gong, S.S.; Li, Z.M.; Hu, J.; Wei, Y.H. The Spatial Distribution and Evolution of Ancient Villages in Shanxi Province. Sci. Geogr. Sin. 2017, 37, 416–425. (In Chinese) [Google Scholar]
  33. Standardization Administration of the People’s Republic of China. Current Land Use Classification; China Statistics Press: Beijing, China, 2021. [Google Scholar]
  34. Tudor, C. An Approach to Landscape Character Assessment; Natural England: London, UK, 2014. [Google Scholar]
  35. Rosa, M. Chefaoui. Landscape Metrics as Indicators of Coastal Morphology: A Multi-scale Approach. Ecol. Indic. 2014, 45, 139–147. [Google Scholar]
  36. Wu, J.; Shen, W.; Sun, W.; Tueller, P.T. Empirical Patterns of the Effects of Changing Scale on Landscape Metrics. Landscape Ecol. 2002, 17, 761–782. [Google Scholar] [CrossRef]
  37. Liu, L.Y.; Zhang, L.; Song, Y.H. Landscape Character Assessment of Three Parallel Rivers Natural Heritage Sites. J. West China For. Sci. 2024, 53, 111–118. (In Chinese) [Google Scholar]
  38. Peng, J.; Dang, W.X.; Liu, Y.X.; Zong, M.L.; Hu, X.X. Review on Landscape Ecological Risk Assessment. Acta Geogr. Sinca 2015, 70, 664–677. (In Chinese) [Google Scholar]
  39. State Environmental Protection Administration of China. Standard for Evaluating National Nature Reserves; China Statistics Press: Beijing, China, 2006. [Google Scholar]
  40. National Forestry and Grassland Administration. Rating of Landscape Quality of National Forest Parks in China; China Statistics Press: Beijing, China, 1999. [Google Scholar]
  41. State Council of the People’s Republic of China. Regulations on Scenic and Historic Areas; State Council of the People’s Republic of China: Beijing, China, 2006. [Google Scholar]
  42. Gómez-Sal, A.; Belmontes, J.-A.; Nicolau, J.-M. Assessing landscape values: A proposal for a multidimensional conceptual model. Ecol. Model. 2003, 3, 319–341. [Google Scholar] [CrossRef]
  43. Hong Kong Development Bureau Planning Department. Landscape Value Mapping of Hong Kong; Hong Kong Development Bureau Planning Department: Hong Kong, China, 2005. [Google Scholar]
  44. State Council of the People’s Republic of China. Regulations on the Protection of Famous Historical and Cultural Cities, Towns, and Villages; State Council of the People’s Republic of China: Beijing, China, 2017. [Google Scholar]
  45. UNESCO. Convention Concerning the Protection of the World Cultural and Natural Heritage; UNESCO: Paris, France, 1972. [Google Scholar]
  46. ICOMOS China. Principles for the Conservation of Heritage Sites in China; ICOMOS China: Beijing, China, 2015. [Google Scholar]
  47. Mendoza, G.A.; Martins, H. Multi-criteria decision analysis in natural resource management: A critical review of methods and new modelling paradigms. For. Ecol. Manag. 2006, 230, 1–22. [Google Scholar] [CrossRef]
  48. Wei, Q.Q.; Halike, A.; Yao, K.X.; Chen, L.M.; Balati, M. Construction and optimization of ecological security pattern in Ebinur Lake Basin based on MSPA-MCR models. Ecol. Indic. 2022, 138, 108857. [Google Scholar] [CrossRef]
  49. Yu, K.J. Landscape Culture, Ecology and Perception; Science Press: Beijing, China, 1998. [Google Scholar]
  50. Li, H.; Wang, C.C.; Xu, Q.; Wang, J.Z.; Huang, Y.L.; Liu, Y. Research on the Construction of Ecological—Cultural Complex Heritage Corridor Network Based on Suitability Analysis: Taking Pu’er city, Yunnan Province as An Example. Landsc. Archit. Acad. J. 2022, 39, 19–27. (In Chinese) [Google Scholar]
  51. Zhou, S.Y.; Kong, X.; Zhu, G. Cultural Geography; Higher Education Press: Beijing, China, 2004. [Google Scholar]
  52. Li, K.J. The Formation and Historical Evolution of the Distribution Pattern of Ethnic Groups in China. J. Southwest Minzu Univ. (Humanit. Soc. Sci. Ed.) 2007, 9, 26–31. (In Chinese) [Google Scholar]
  53. Zou, C.; Tang, X.X.; Tan, Q.; Feng, H.C.; Guo, H.Y.; Mei, J.X. Constructing Ecological Networks for Mountainous Urban Areas Based on Morphological Spatial Pattern Analysis and Minimum Cumulative Resistance Models: A Case Study of Yongtai County. Sustainability 2024, 16, 5559. [Google Scholar] [CrossRef]
  54. Han, S.H.; Mei, Y.G.; Ye, Z.Y. Construction of Ecological Security Pattern in Yanping District, Nanping City, Fujian Province Based on the Least Cumulative Resistance Model. Bull. Soil Water Conserv. 2019, 39, 192–198+205. [Google Scholar]
  55. Ning, Q.; Zhu, Z.M.; Qin, M.L.; Shi, Q.Q.; Song, Y.Z. Research on the Optimization of Territorial Space Ecological Network of Nanning City Based on MSPA and Circuit Theory. J. Guangxi Univ. (Nat. Sci. Ed.) 2021, 46, 306–318. (In Chinese) [Google Scholar]
  56. Zeng, L.Y.; Li, R.Y.M.; Du, H.Z. Modeling the Ecological Network in Mountainous Resource-Based Cities: Morphological Spatial Pattern Analysis Approach. Buildings 2025, 15, 1388. [Google Scholar] [CrossRef]
  57. Li, H.; Wang, Z. Exploring the Anti-Japanese War Heritage Corridor System Based on GIS Spatial Analysis. Urban Dev. Stud. 2017, 24, 86–93. [Google Scholar]
  58. Feng, L.H.; Sun, J.W.; Zhai, T.T.; Miao, M.R.; Yu, G.C. Planning for Cultural Connectivity: Modeling and Strategic Use of Architectural Heritage Corridors in Heilongjiang Province, China. Buildings 2025, 15, 1970. [Google Scholar] [CrossRef]
  59. Wang, Q.; Yang, C.; Wang, J.H.; Tan, L.F. Tourism in Historic Urban Areas: Construction of Cultural Heritage Corridor Based on Minimum Cumulative Resistance and Gravity Model—A Case Study of Tianjin, China. Buildings 2024, 14, 2144. [Google Scholar] [CrossRef]
  60. Chen, S.L.; Wu, X.H.; Xu, B.; Yan, S.J. Research on the Route Selection of Rural Scenic Byway in the Western Area of Yuhang, Hangzhou Based on Crowdsource Data. Chin. Landsc. Archit. 2023, 39, 99–105. (In Chinese) [Google Scholar]
  61. Zhou, L.Y.; Zhao, Y.L.; Zhu, C.L.; Zhu, C.L.; Shi, C. Route Selection for Scenic Byways in Karst Areas Based on the Minimum Cumulative Resistance Model: A Case Study of the Nanpan-Beipan River Basin, China. Ecol. Indic. 2024, 163, 112093. [Google Scholar] [CrossRef]
  62. Zheng, M.Q.; Shen, M.Z.; Zhong, L.S. Construction of Ecological Security Pattern in Pudacuo National Park. Acta Ecol. Sin. 2021, 41, 874–885. (In Chinese) [Google Scholar] [CrossRef]
  63. Wu, Y.; Yang, Y.X.; Miao, M.R.; Wu, Y.L.; Zhu, H. Study on Spatial Distribution and Heritage Corridor Network of Traditional Settlements in Ancient Huizhou. Buildings 2025, 15, 1641. [Google Scholar] [CrossRef]
  64. Wang, Y. A Study on Greenways Route Selection Method for Xi’an Section of the Northern Piedmont of Qinling Based on Ecological Suitability Analysis. Master’s Thesis, Xi’an University of Architecture and Technology, Xi’an, China, 2020. (In Chinese). [Google Scholar]
  65. Zhang, X.; Chang, H. Review on the Phenomenon of Gentrification in the Revitalization of Rural Areas in China. J. Kunming Univ. Sci. Technol. (Soc. Sci.) 2022, 22, 128–137. (In Chinese) [Google Scholar]
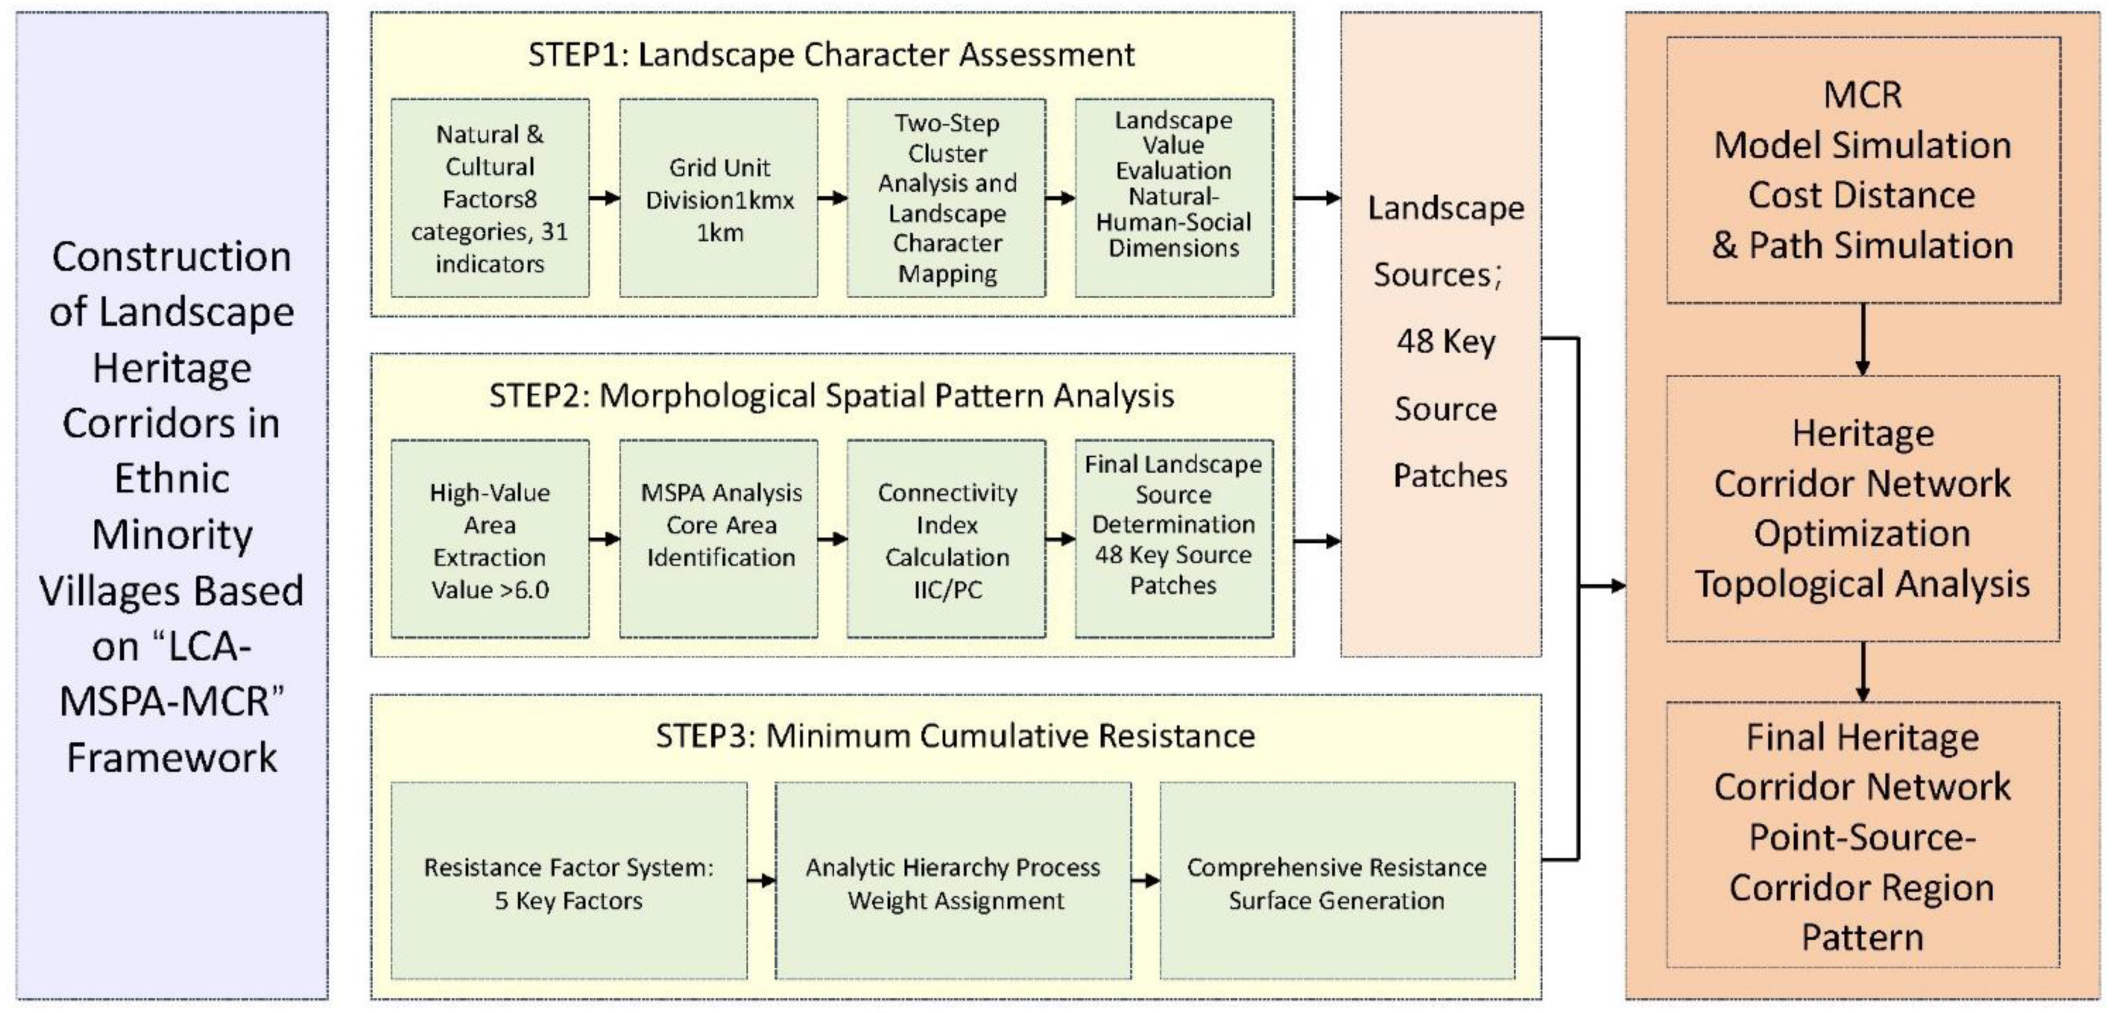
Figure 1. The LCA-MSPA-MCR framework.
Buildings 15 03403 g001
Figure 2. Study area (this figure was adapted from the standard map [GS (2024) 0650] issued by the National Administration of Surveying, Mapping and Geoinformation of China).
Buildings 15 03403 g002
Figure 3. The process of landscape character assessment: (a) sketch of landscape character of the Nanling Ethnic Corridor; (b) landscape feature identification results of Nanling Ethnic Corridor.
Buildings 15 03403 g003
Figure 4. Landscape value assessment results.
Buildings 15 03403 g004
Figure 5. Landscape source.
Buildings 15 03403 g005
Figure 6. The construction process of the composite resistance surface: (a) results of the composite resistance surface; (b) suitability zoning results.
Buildings 15 03403 g006
Figure 7. Heritage corridor of ethnic villages in the Nanling Ethnic Corridor: (a) Preliminary sketch of the heritage corridor of ethnic villages in the Nanling Ethnic Corridor; (b) The topologically optimized heritage corridor of ethnic villages in the Nanling Ethnic Corridor.
Buildings 15 03403 g007
Figure 8. Spatial pattern of heritage corridors of ethnic villages in the Nanling Ethnic Corridor.
Buildings 15 03403 g008
Table 1. Comparison of five common corridor line selection models.
MethodologyStage of ApplicationApplicable ContextLimitations
Minimum
Cumulative
Resistance
(MCR)
Mid-stage planning (“Corridor Routing”). Used after identifying core heritage “sources” and constructing the resistance surface.Precise identification of linear corridor spatial extent. Ideal for scientifically determining the optimal route connecting dispersed heritage features.1. Typically yields a single optimal path, potentially overlooking alternative routes.
2. A static model that struggles to simulate dynamic processes.
Circuit
Effective
Conductance
(CEC)
Mid-to-late-stage planning (“Corridor Optimization and Restoration”). Used to evaluate the robustness of a preliminary corridor (e.g., from MCR).Assessing overall connectivity and resilience of a corridor network. Applicable for scenarios requiring evaluation of the importance or fragility of specific corridor sections.1. The model is more complex, computationally intensive, and requires greater expertise to interpret.
2. Primarily serves ecological objectives; offers weaker explanatory power for cultural experiences.
Environmental
Spatial
Modeling
(ESM)
Early-stage planning (“Baseline Assessment”). Used to identify ecological redlines for priority protection, serving as constraints for the corridor routing process.Macro-scale ecological security pattern construction. Suitable for delineating ecological protection zones and networks.1. The output is a zonal map (polygons), not a linear path; cannot be directly used for routing.
2. Heavily biased towards natural ecological elements; less capable of spatially integrating cultural heritage elements.
Recreation
Opportunity
Spectrum
(ROS)
Late-stage planning (“Zoning and Management”). Used to design differentiated experience offerings and management strategies after the corridor’s spatial extent is defined.Tourism planning and visitor management for corridors. Applicable to heritage corridor projects aimed at developing cultural tourism that requires providing visitors with rich yet managed experiences.1. Is not a spatial routing model; cannot generate specific alignments.
2. It is a management framework that must be integrated with other spatial models.
Conservation
Action
Planning &
Zoning (CAP)
Late-stage planning. It is the management safeguard system ensuring the corridor’s sustainable development.A management toolkit for all heritage corridor projects. It is key to translating corridor plans from “blueprint” to “reality”.Is not at all a routing method; provides no spatial generative functionality.
Table 2. Classification and codes of landscape character elements of Nanling Ethnic Corridor.
Feature CategoryThe Name of The FeatureVariables and Code
Natural LandscapeElevationA1 ≤ 200 m, 200 m < A2 < 500 m, A3 ≥ 500 m
SlopeSL1 ≤ 10°, 10° < SL2 < 30°, SL3 ≥ 30°
VegetationV1 = Coniferous Forest, V2 = Broad-leaved Forest, V3 = Bush, V4 = Brushwood, V5 = Cultivated Plants
LandformLF1 = Hilly, LF2 = Low Mountain, LF3 = Medium-height Mountains, LF4 = Plain, LF5 = Mesa
SoilS1 = Southern Paddy Soil, S2 = Limestone, S3 = Red Soil, S4 = Yellow Soil
Cultural LandscapeCultural Heritage DensityC1 = Low Density, C2 = Medium Density, C3 = High Density
Village DensityH1 = Low Density, H2 = Medium Density, H3 = High Density
Land CoverL1 = Farmland, L2 = Woodland, L3 = Grassland, L4 = Built-up Land, L5 = Water Body
Table 3. Professional background of the expert panel and consistency test results for the AHP.
Specialty FieldNumber of ExpertsAcademic/Professional TitleRange of Consistency Ratio (CR)
Landscape Planning4Professor (2), Associate Professor (2)0.02–0.07
Human Geography3Research Fellow (1), Associate Professor (2)0.01–0.05
Urban and Rural Planning3Senior Urban Planner (2), Professor (1)0.03–0.06
Ethnology3Professor (1), Associate Professor (2)0.04–0.08
Total/Mean13 Mean CR: 0.048
Table 4. Landscape Value Evaluation System of Nanling Ethnic Corridor.
Target LayerCriterion LayerFactor LayerWeightDescription and EvaluationReferences
Assessment of Landscape Character Type Values in the Nanling Ethnic
Corridor
(A)
Natural
Landscape Value
(B1)
Ecological
Service Value
(C1)
0.375As natural ecosystems, landscapes have ecological service functions such as pollution purification, climate regulation, and biodiversity maintenanceNational Nature Reserve Assessment Criteria [39], Scenic Resource Quality Rating Standards for Chinese Forest Parks [40]
Natural
Resource Value
(C2)
0.125The ability of landscapes to provide natural resources such as material resources (such as timber and minerals) and energy resources (such as wind and water energy) for social and economic developmentScenic Resource Quality Rating Standards for Chinese Forest Parks [40], Regulations on Scenic and Historic Areas [41]
Social
Landscape
Value
(B2)
Sociocultural Value
(C3)
0.03Landscapes sustain the capacity for cultural prosperity within human communities by providing spaces for recreation, education, and social interactionMadrid Landscape Assessment Framework [42], Hong Kong Landscape Evaluation Framework [43], Regulations on the Protection of Famous Historical and Cultural Cities, Towns, and Villages [44]
Scientific
Research Value
(C4)
0.068Landscapes are an important object of modern scientific research, providing the value of experimental fields and basic data for revealing scientific laws and detecting environmental changesMadrid Landscape Assessment Framework [42], Hong Kong Landscape Evaluation Framework [43]
Humanistic Landscape Value
(B3)
Historical
Heritage Value
(C5)
0.152As a carrier of human history and culture, landscapes carry the recording function of collective memory and witness the evolution of civilization through spatial form and narrativeRegulations on Scenic and Historic Areas [41], Convention Concerning the Protection of the World Cultural and Natural Heritage [45], Principles for the Conservation of Heritage Sites in China [46]
Spiritual
Symbol Value
(C6)
0.1667As regional cultural symbols, landscapes convey collective identity and spiritual belief through spatial symbols, thereby shaping the function of ethnic cultural emotionsConvention Concerning the Protection of the World Cultural and Natural Heritage [45], Principles for the Conservation of Heritage Sites in China [46]
Aesthetic Taste Value
(C7)
0.0833The visual beauty, spatial scale, diversity, cleanliness and cultural uniqueness of the landscapeRegulations on Scenic and Historic Areas [44], Convention Concerning the Protection of the World Cultural and Natural Heritage [45], Principles for the Conservation of Heritage Sites in China [46]
Table 5. Resistance factor grading.
Resistance FactorResistance GradingResistance ValueWeight ValuePrimary Rationale
Land CoverFarmland, Construction Land50.4800Human activities and ecological protection are the carriers that play a decisive role
Water Bodies, Grasslands150
Forests, Shrubs500
ElevationLow Altitude: −100–200 m100.0564Climatic and resource factors indirectly influence the distribution of village settlements and cultural dissemination
Low and Medium Altitude: 200–500 m30
Medium Altitude: 500–1000 m50
Medium and High Altitude: 1000–1500 m70
High Altitude: 1500–2107 m100
Slope<3°50.2111The direct determinants of the cost and construction feasibility of cultural heritage corridors
3–8°10
8–15°30
15–25°100
>25°500
Topographic
Relief Index
Flat Ground: 0–30100.0937Macroscopically shaping cultural regions serves as a background-level resistive force
Hill: 30–7030
Low Mountain: 70–20050
Middle and High Mountains: >200100
Traffic
Accessibility
Areas within 1 km of national or provincial highways100.1589The strongest anthropogenic factor in reducing spatial resistance in modern society
Areas located 1–3 km from national or provincial highways50
Areas located 3–5 km from national or provincial highways100
More than 5 km from national or provincial highways200
Table 6. The variable combinations and percentages of natural landscape types in the Nanling Ethnic Corridor.
Character TypeVariable Combination (Main Variables)Percentage/%
Type 1A2, L2, LF2, V1, V2, V3, V4, C1, H1, S39.2%
Type 2A2, L1, LF1, LF2, LF5, V1, V5, C1, H1, S313.9%
Type 3A3, L2, LF3, V1, V2, V3, V4, V5, C2, H1, S318.8%
Type 4A1, L2, LF2, V1, V5, V1, H2, S312.1%
Type 5A2, L2, LF2, V3, C2, H1, S310.1%
Type 6A2, L2, LF1, V1, C1, H1, S310.8%
Type 7A2, L2, LF2, V5, C1, H1, S36.0%
Type 8A1, L1, LF1, LF2, V1, V3, V5, C2, H1, S39.4%
Type 9A2, L2, LF2, V1, C2, H1, H2, S2, S39.7%
Total 100%
Table 7. Information table of ethnic villages in the sources of the landscape.
Ethnic Cultural AreaEthnic CategoryCore Ethnic Villages
Xinhuang-Zhijiang
Dong Unit
DongChongshou Village, Tianjing Village, Bihe Village, Zaoxi Village, Niupizhai Village, Shaotian Village, Cuanyangutun Village
Jingzhou-Huitong
Dong Unit
DongFengmu Village, Disun Miao Village, Disun Village, Pingtan Village, Yanjiao Village
Longhui Hui UnitHuiShanjie Hui Village
Tongdao-Longsheng-Ziyuan Multiethnic UnitZhuang, Dong, Yao
and Miao
Shangxiang Village, Taro Village, Xiyao Village,
Hengling Village, Diling Dongzhai,
Pingshuitun Village
Gongcheng-Jiangyong
Yao Unit
YaoShangjiangkou Tun, Fuxi Village, Shenpo Village,
Humaling Village, Goulan Yaozhai,
Shanggantang Village, Jingtouwan Village
Cenxi Yao UnitYaoLvyun Village
Lianshan-Liannan
Zhuang and Yao Unit
Zhuang and Yao Zhongping Village, Zhengqi Village,
Guxianping Village
Ruyuan Yao UnitYaoBibeikou Village, Yingming Village
Shangyou-Nankang-Dingnan She UnitShe Hengkeng She Village, Fuzu She Village,
Huangsha She Village
Ruijin She UnitShe Anzhi She village
Jianghua-Lianzhou
Yao Unit
YaoTongchongkou Village, Tianxin Village
Table 8. Coverage and connectivity of cultural heritage nodes.
TypeConnectanceCircuitryNode ConnectivityAlpha Index
Existing Road Network0.160.221.60.12
Heritage Corridor0.340.493.30.31
Disclaimer/Publisher’s Note: The statements, opinions and data contained in all publications are solely those of the individual author(s) and contributor(s) and not of MDPI and/or the editor(s). MDPI and/or the editor(s) disclaim responsibility for any injury to people or property resulting from any ideas, methods, instructions or products referred to in the content.