Article

Experimental Study on the Shear Performance of Epoxy Resin-Bolted Steel-Cross Laminated Timber (CLT) Connections

1
School of Civil and Transportation Engineering, Ningbo University of Technology, Ningbo 315211, China
2
Huaxing Steel Structure Co., Ltd., Ningbo 315336, China
3
School of Civil Engineering, Chang’an University, Xi’an 710061, China
*
Author to whom correspondence should be addressed.
Buildings 2025, 15(18), 3400; https://doi.org/10.3390/buildings15183400
Submission received: 8 August 2025 / Revised: 14 September 2025 / Accepted: 17 September 2025 / Published: 19 September 2025
(This article belongs to the Special Issue Advances and Applications in Timber Structures)

Abstract

Steel–timber composite (STC) structures offer a sustainable and low-carbon structural solution. Steel–timber interface behavior is critical for the mechanical performance of STC structures. This paper introduces a novel connection for steel–timber composites (STC) that combines mechanical interlocking with adhesive bonding through an epoxy-bonded bolted design. Epoxy resin is injected into the timber dowel slots, followed by pre-tightening of the bolts, forming a composite dowel system where the ‘bolt–epoxy resin–timber’ components work in synergy. The load–displacement characteristics and failure modes of nine specimen groups were investigated through a series of double-shear push-out tests. The influence of a wide range of connector parameters on the stiffness, shear bearing capacity, and ductility of STC joints was systematically investigated. The parameters included fastener strength grade, thread configuration, diameter, number, and the use of epoxy resin reinforcement. The experimental results demonstrated that high-strength partially threaded bolts were crucial for achieving a synergy of high load-bearing capacity and commendable ductility, while full-threaded bolts exhibited vulnerability to brittle shear failure, a consequence of stress concentration at the root of the threads. Although screw connections provided enhanced initial stiffness through timber anchorage, ordinary bolt connections exhibited superior ultimate load-bearing capacity. In comparison with conventional bolt connections, epoxy resin–bolt connections exhibited enhanced mechanical properties, with an augmentation in ultimate load and initial stiffness of 12% and 11.8%, respectively, without sacrificing ductility.

1. Introduction

Compared to traditional concrete structures, which are energy-intensive and have high self-weight, wood has emerged as an ideal green prefabricated building material due to its energy-saving, environmentally friendly, lightweight, high-strength, and easy-to-process properties [1,2,3]. Progress in wood engineering technology has led to a significant improvement in the mechanical performance of engineered wood products. Modern engineered wood products, represented by Glue laminated timber (GLT) and Cross laminated timber (CLT), effectively overcome the limitations of natural wood, such as constraints in size, strength, and anisotropy [4]. This progress has greatly expanded the application potential of timber structures in multi-story and large-span buildings [5,6], and has also provided a critical material foundation for achieving a green transformation in the construction industry.
To optimize the performance of its materials, the steel–timber composite (STC) structure has emerged as an efficient composite system. By combining the high strength of steel with wood’s lightweight and environmentally friendly properties, this system achieves dual improvements in both structural performance and sustainability [7,8]. In STC structures, shear connections at the steel–timber interface are critical for ensuring the synergistic performance of the two materials [9,10]. The mechanical behavior of the connection joints, including strength, stiffness, and ductility, directly determines the overall performance of the composite member and the structure as a whole. Consequently, the development and performance evaluation of high-performance steel–timber shear connectors has remained a key research focus in this field. However, in most mechanical connection methods (especially bolt connections), to ensure the feasibility of on-site construction, the dimensions of the mortise slots reserved on timber components are typically 1–2 mm larger than the diameter of the connecting components. This directly compromises the initial stiffness of STC joints, leading to a significant reduction.
To provide a valuable reference for high-performance shear connections, it is instructive to draw parallels with the well-established field of steel-concrete composite structures. For performance, welded shear studs are the most prevalent and effective means of achieving composite action, renowned for their high shear strength [11,12]. Specially, due to the direct welding and mechanical interlocking, they have high initial stiffness. For design philosophy, the frontier has moved towards damage-control systems that enhance seismic resilience. As demonstrated by He et al. [13,14], this is achieved by designing specific components, such as steel angles, as replaceable “fuse elements”. These fuses concentrate inelastic deformation, protecting the primary structure and enabling rapid post-earthquake repair. The pursuit of a high-performance, ductile, and slip-free connection, informed by these advanced concepts, provides a crucial reference for innovation in the STC field.
In recent years, scholars have explored various connections. Traditional mechanical fasteners like bolts and screws are widely used due to their simplicity [15,16,17,18,19]. However, they often fail to resolve the issue of initial slip. To address this, composite connection forms have been investigated. One prominent approach involves combining epoxy resin with fasteners. For example, extensive studies by Hassanieh et al. [20,21,22,23,24] demonstrated that epoxy-screw combinations achieve excellent compo-site efficiency and ductility. However, while self-tapping screws inherently provide a better initial stiffness, their shear strength and stiffness are generally inferior to those of bolts of a similar diameter. This may limit their application in structures demanding high shear resistance Another advanced solution is the perfobond rib or perforated steel plate connector, often combined with epoxy resin or grout [25,26]. These connectors exhibit exceptional stiffness and load-bearing capacity. Nevertheless, their fabrication is often complex, requiring precise manufacturing of the steel plates and meticulous on-site assembly, which can increase construction complexity and cost. Other techniques such as applying prestress [27,28] or using grouting materials [29,30,31,32], have also proven effective but come with their own complicated procedural demands. Therefore, a new connection method is urgently needed. It must not only enhance the joint’s initial stiffness but also retain the structural simplicity of traditional mechanical fasteners.
Therefore, this paper proposes a novel steel–timber connection construction—epoxy resin–bolt connection. Figure 1 illustrates the construction method of this joint: first, epoxy resin is uniformly injected into the pre-drilled holes of the CLT panel, after which bolts are inserted to securely fasten the H-steel to the CLT panel. This design allows the epoxy resin to tightly encase the bolts, forming a ‘bolt–epoxy resin–timber’ composite dowel system that works synergistically after curing. This construction method effectively fills the gaps between the bolts and the timber, fundamentally eliminating the initial slip of the connection. It transfers shear forces more uniformly to a larger area of the timber, thereby enhancing the connection’s initial stiffness and ultimate shear bearing capacity. At the same time, this connection method retains the structural simplicity and ease of fabrication of traditional mechanical fasteners.
Nine groups of monotonic double-shear push-out tests were conducted to evaluate the performance of this new connector. The influence of fastener strength grade, bolt configuration, type, diameter, number, and epoxy resin reinforcement measures on the stiffness, shear bearing capacity, and ductility of the STC joints was analyzed in the tests. The results of these tests were then used to provide preliminary design suggestions for epoxy resin–bolt connections.

2. Materials and Methods

2.1. Specimen Details

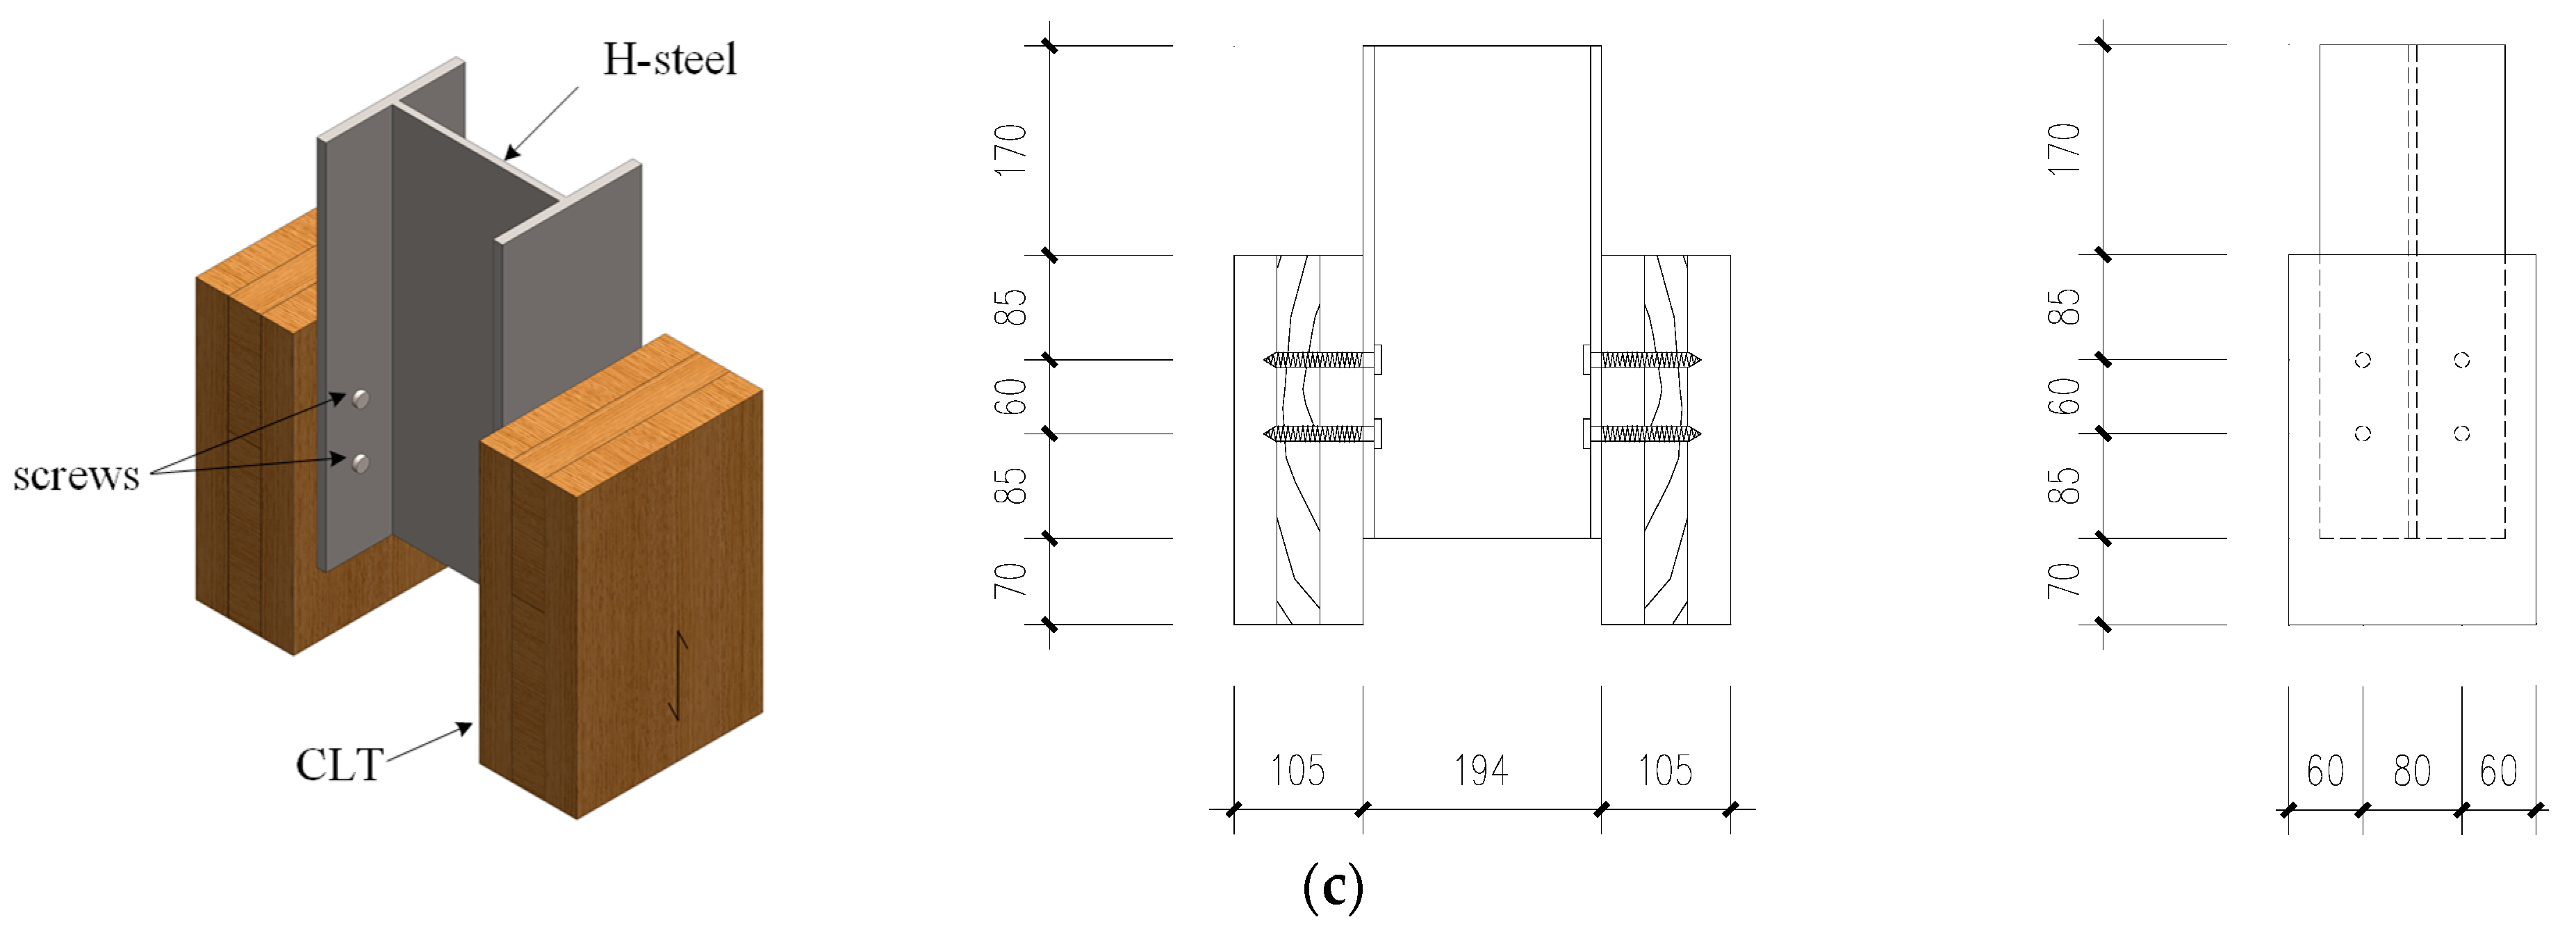
The experimental program involved a total of nine groups of push-out tests, comprising six bolted and three screwed connection configurations, with each group consisting of four replicate specimens. The design and configuration of the test specimens are detailed in Figure 2. To ensure uniform force distribution during loading, each specimen consisted of a central hot-rolled H-steel beam with two CLT panels attached symmetrically to its flanges by shear connectors. The H-steel section was model HN194 × 150 × 6 × 9. It had a section height of 194 mm, a web thickness of 6 mm, and flanges that were 150 mm wide and 9 mm thick. The washer size is 50 mm × 50 mm, thickness of 3 mm. The CLT panels were fabricated from spruce-pine-fir. Each panel consisted of three 35 mm thick layers of timber lamellas, which were arranged orthogonally to one another. The primary design parameters for all specimens are summarized in Table 1, where D and L denote the connector diameter and length, respectively.
The preparation process of the test specimens primarily consisted of two stages: pre-treatment of components and overall assembly. First, holes were pre-drilled in the flanges of the H-steel. To ensure proper connection clearance, the holes were designed with a diameter 2 mm larger than that of the connecting fasteners(bolts or screws). Subsequently, holes were pre-drilled in the CLT panels, and the specific sizes of the drill holes were determined according to the connection method: (1) For bolted connection joints without an epoxy resin adhesive layer, the diameter of the dowel slots in the CLT panels was the same as the bolt diameter; (2) For bolted connection joints with an epoxy resin adhesive layer, to accommodate the epoxy resin and ensure it fully encapsulated the bolt, the dowel slots in the CLT panels were designed with a diameter 4 mm larger than that of the bolts; (3) For test specimens with screws, the guide hole diameter and depth were set to 0.75 D and 0.75 L, respectively. Finally, the pre-treated H-steel was positioned and assembled with the CLT panels.
During the connection process, except for the screws with a diameter of 8 mm, which were tightened with a torque of 10 N·m, all other test specimens were subjected to a preload torque of 30 N·m when connecting the H-steel flange to the side of the CLT panel to ensure the initial tightening state of the connection. For bolted connection specimens containing epoxy resin adhesive layer, the assembly procedure was as follows: firstly, epoxy resin was evenly injected into the dowel slots of the CLT panel, then the bolts were inserted and the H-steel was securely fastened to the CLT panel. After curing at room temperature for 24 h, an epoxy resin–bolt composite connection was formed.
To ensure consistency across specimens and to investigate the primary shear transfer mechanisms, a controlled preload was applied to all bolted connections. The target preload was based on a Grade 8.8 M12 bolt, with a preload (P) of 0.15·fy·As (where fy is the yield strength and As is the tensile stress area), resulting in approximately 10.85 kN. Using the empirical formula T = K·d·P, with a torque coefficient (K) of 0.24 for non-lubricated bolts in steel-to-wood contact, the required torque (T) was calculated to be 31.27 N·m. Considering the scale interval of the torque wrench used in the laboratory, a practical and consistent torque of 30 N·m was applied to all bolted specimens. This consistent application ensures that the influence of preload is a controlled variable across the relevant test groups. For the self-tapping screw specimens, the applied torque was not intended to achieve a specific load-bearing preload. Instead, its primary function was to ensure the components were snugly fastened.

2.2. Material Properties

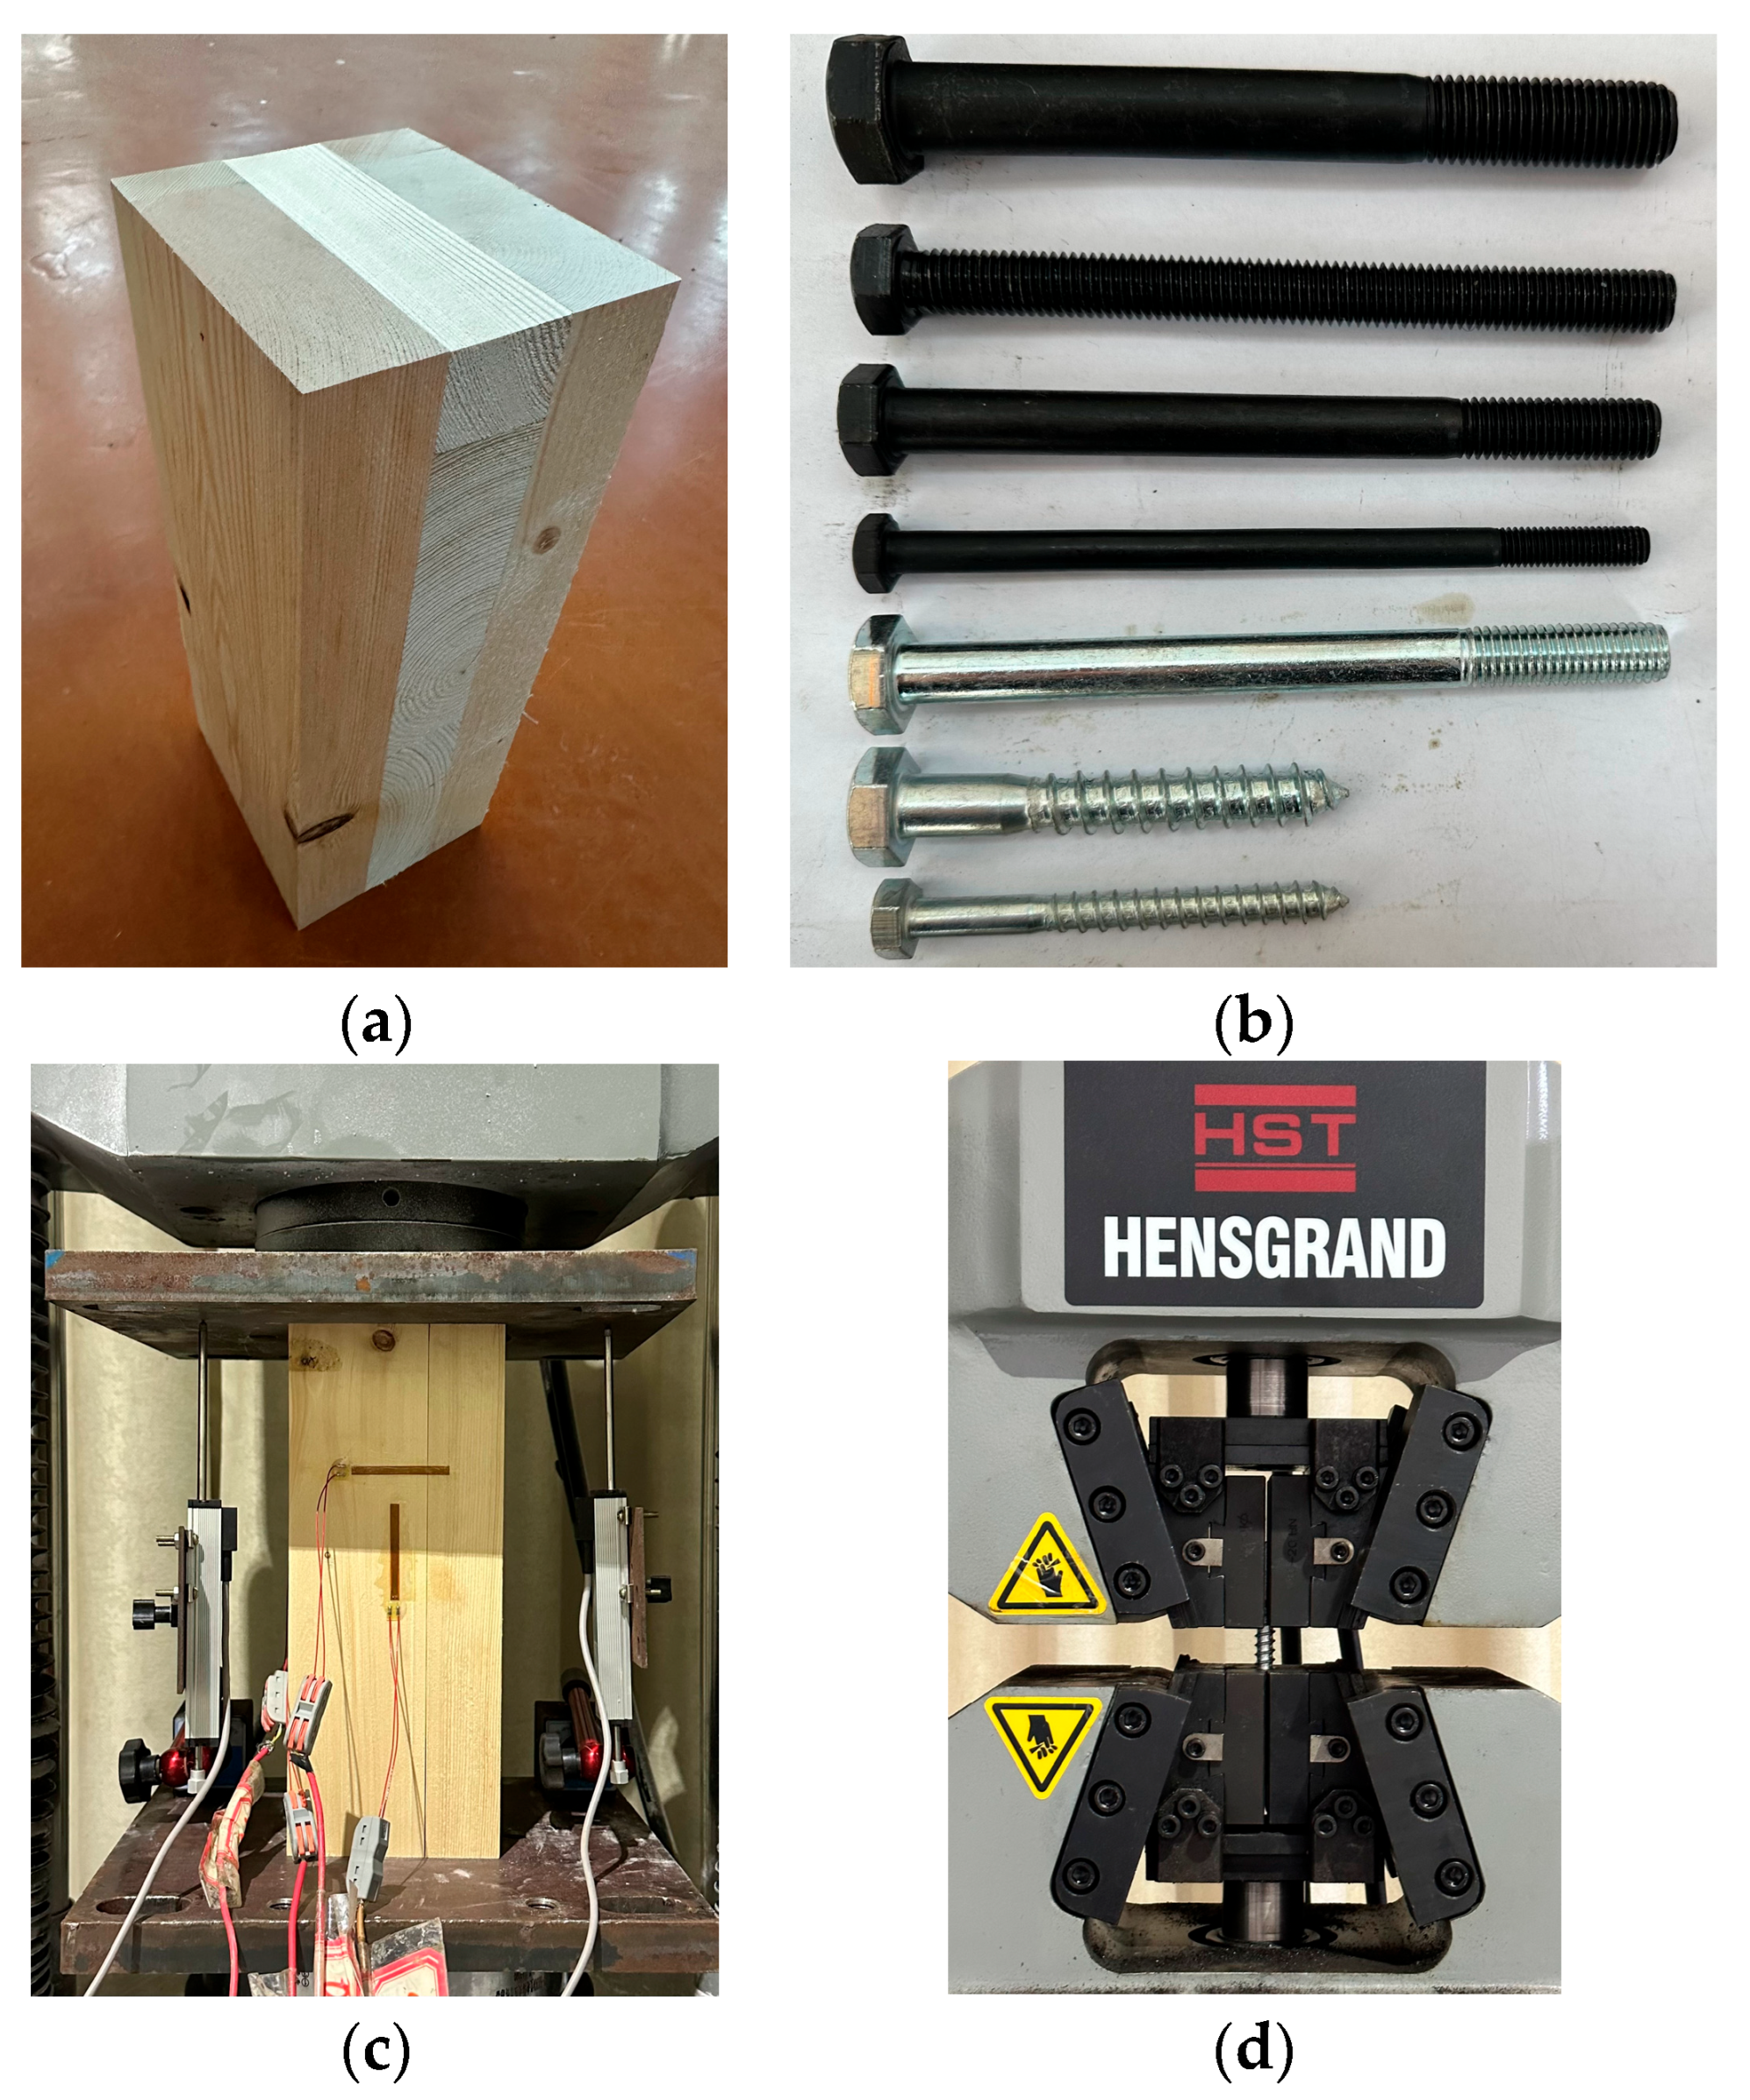
The test specimens in this experiment primarily consisted of three materials: CLT, metal connectors and epoxy resin. For the CLT panels, their basic mechanical properties were determined following the procedures in GB/T 50329-2012 [33] and GB/T 26899-2011 [34], with the results summarized in Table 2. The metal connectors were subjected to tensile strength tests in accordance with GB/T 228.1-2021 [35], and the corresponding results are presented in Table 3. Figure 3 illustrates the testing process for the mechanical properties of CLT panels and metal connectors. The epoxy resin used in the test was MT-500 anchor adhesive produced by Nanjing Mankate Science and Technology Co., Ltd. (Nanjing, China). The mechanical and durability properties of the MT-500 anchor adhesive are presented in Table 4 and Table 5, respectively. For the steel components, hot-rolled H-sections were used, which were made of Q235B grade steel conforming to the requirements of GB 50017-2017 [36] and GB 50011-2010 [37].

2.3. Loading Method

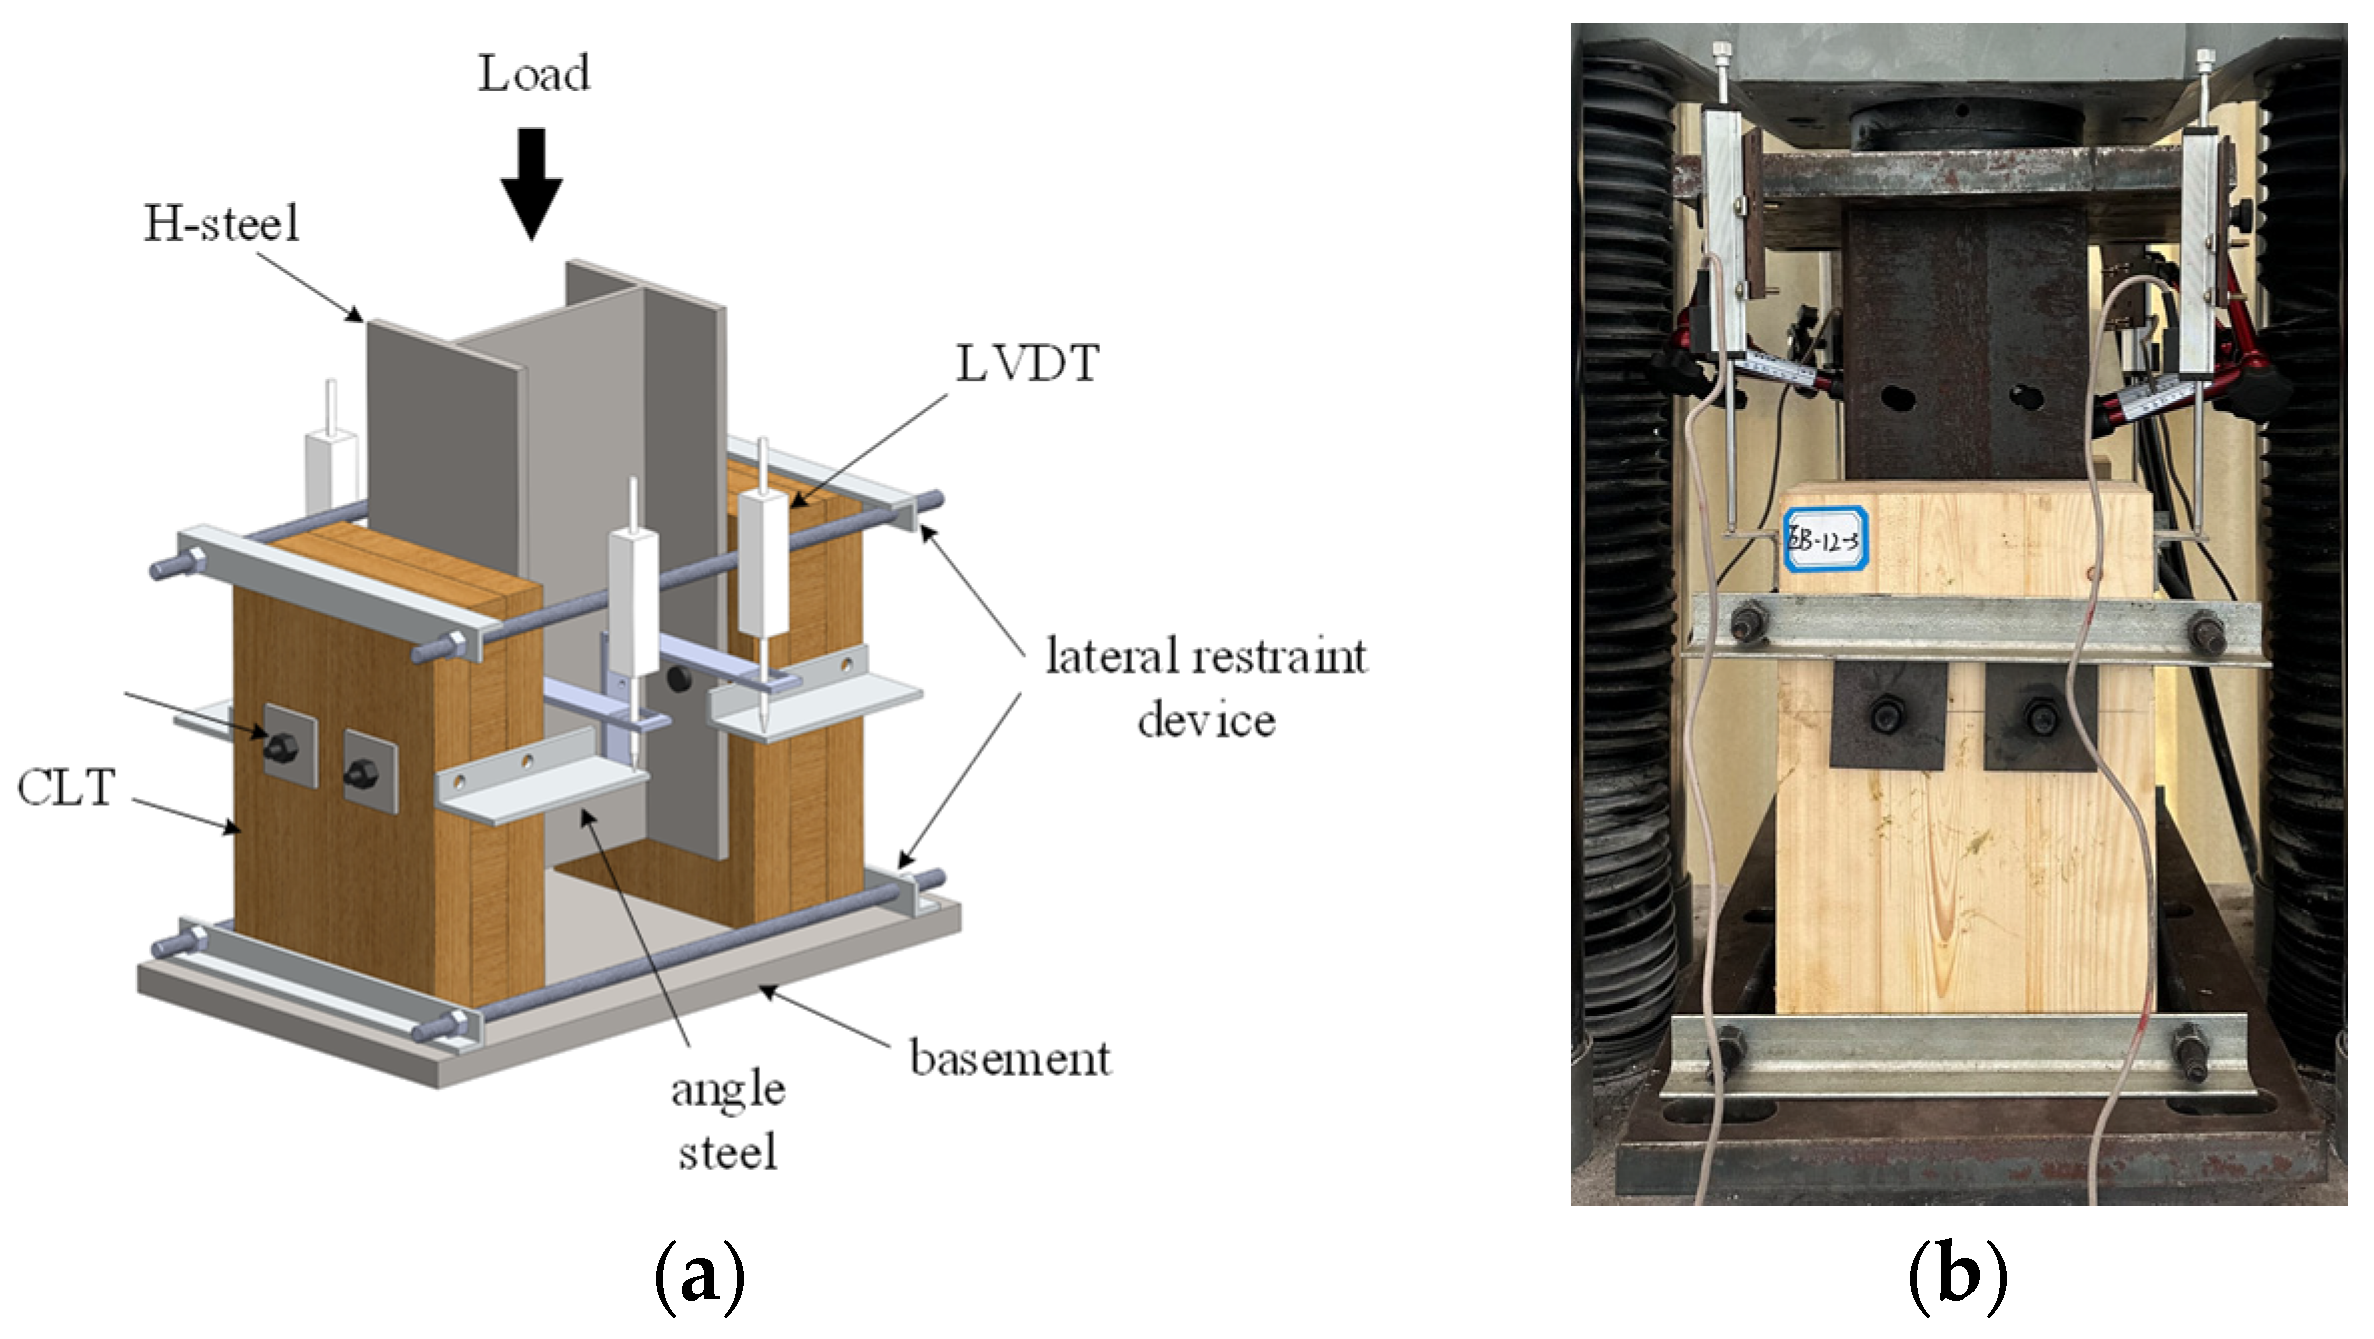
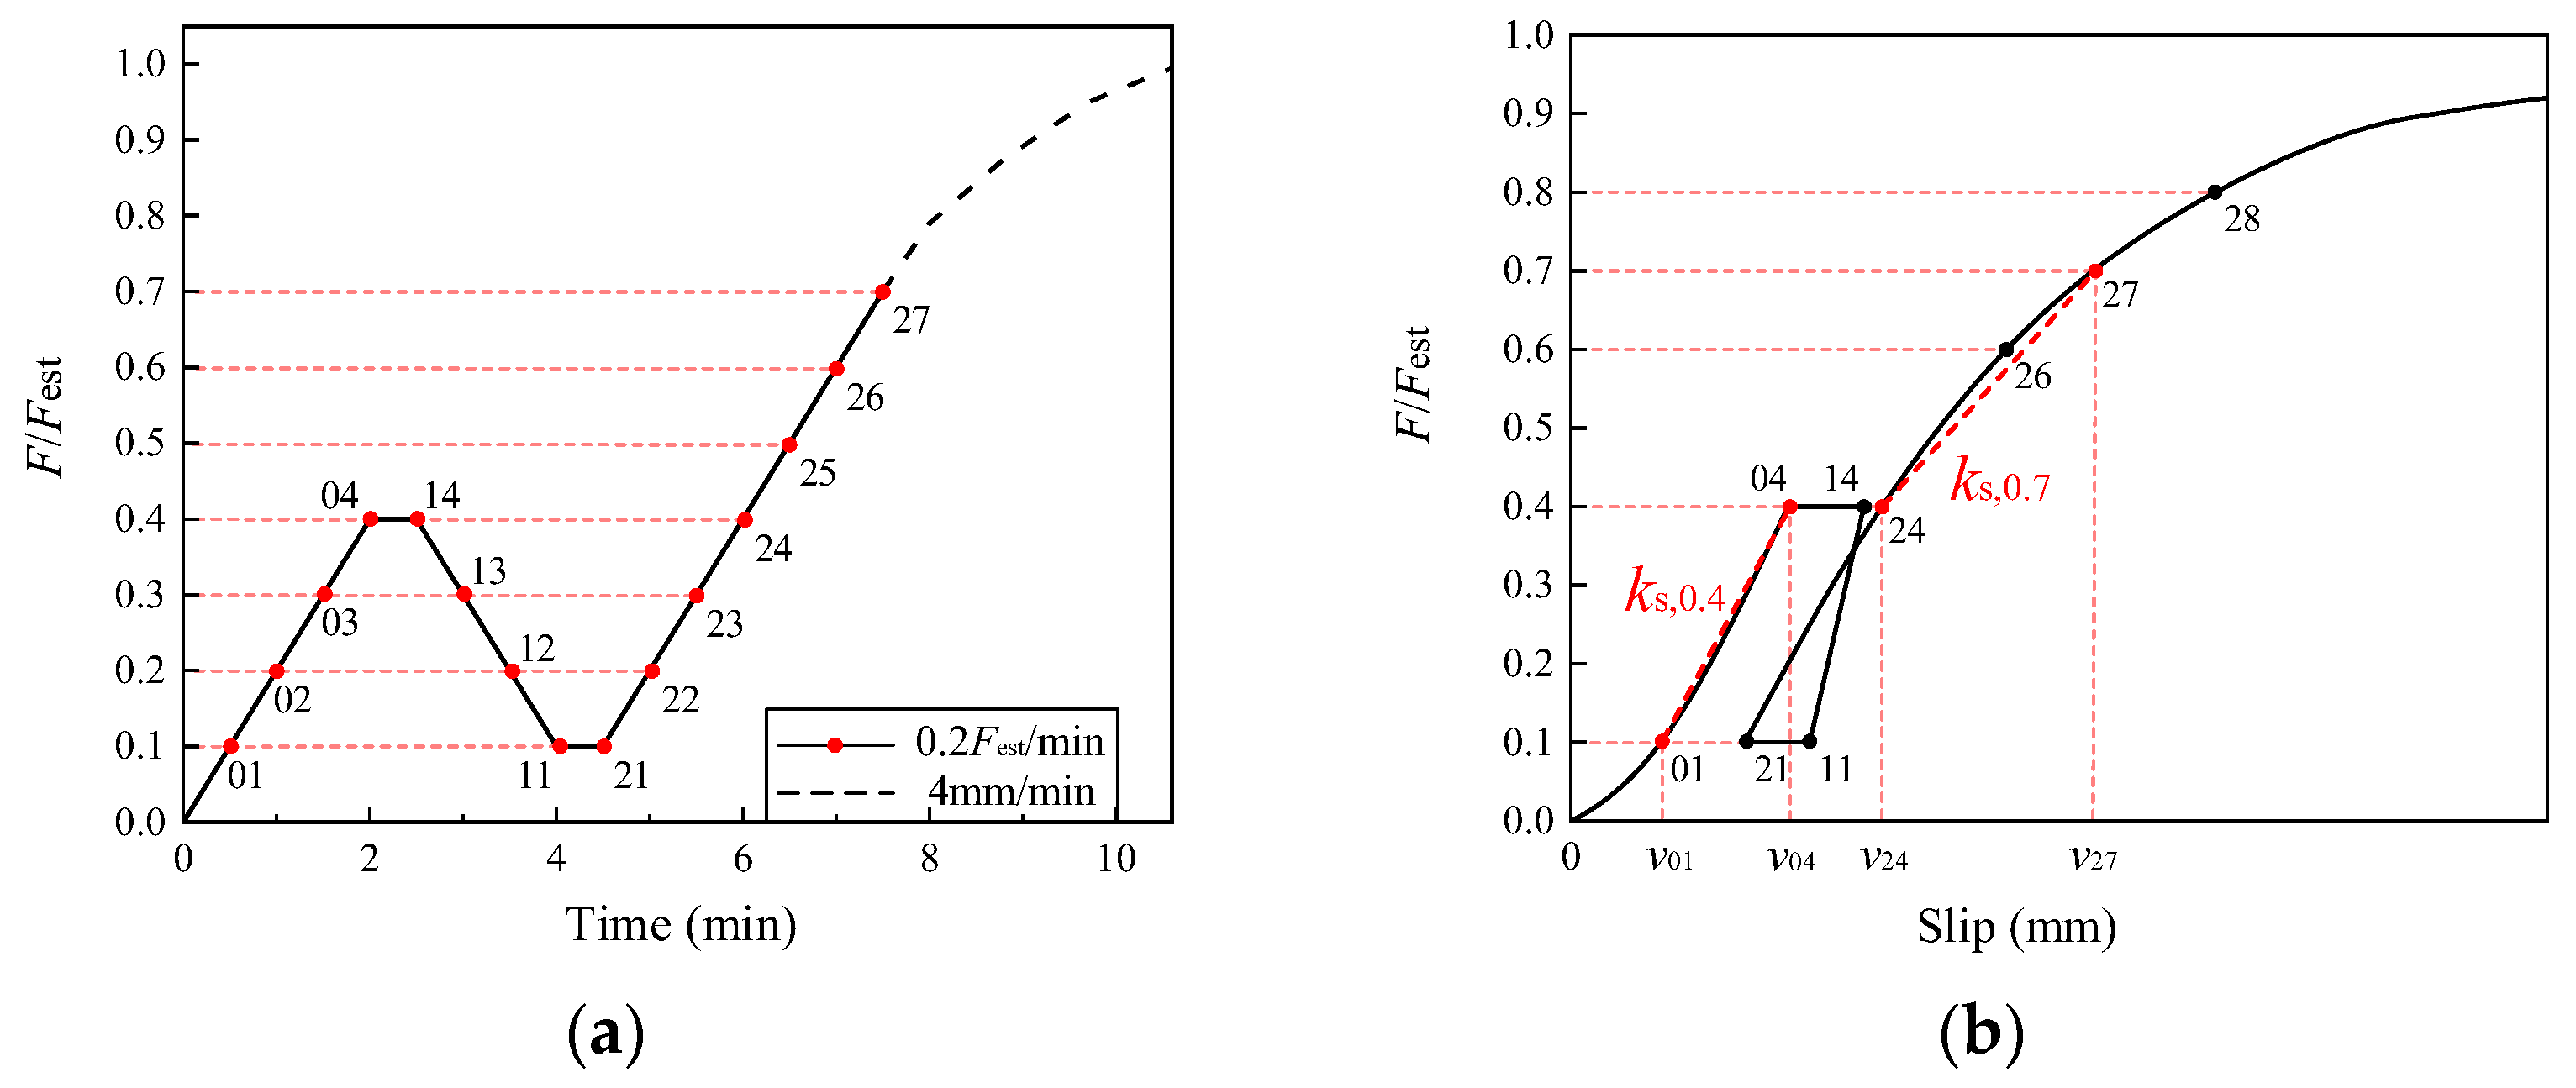
The loading regimen used in the test was based on the relevant provisions of BS EN 26891:1991 [38], with the loading apparatus shown in Figure 4. The loading procedure involved two main phases: an initial force-controlled phase followed by a displacement-controlled phase to failure. A typical loading path is shown in Figure 5. To establish the estimated ultimate load Fest for each group, one specimen from each group was randomly selected and subjected to a preliminary loading test. A constant loading rate of 4 mm/min was applied to the specimen until it failed. The maximum load recorded during this process was defined as Fest for that group of specimens. The remaining three replicate specimens in each group were then subjected to a formal graded loading protocol, which consisted of the following steps: (1) The specimen was loaded under force control at a rate of 0.2 Fest/min up to a load of 0.4 Fest. This load was then held for 30 s; (2) The load was reduced to 0.1 Fest at the same rate and held for another 30 s; (3) The specimen was reloaded to 0.7 Fest at a rate of 0.2 Fest/min. At this point, the control method was switched to displacement control. Loading then proceeded under displacement control at a constant rate of 4 mm/min. The test was terminated when either the specimen failed or the relative slip reached a limit of 50 mm.

3. Experimental Results

3.1. Load–Displacement Curves

Figure 6 displays the complete set of load–displacement curves obtained from the experimental program. The load of the double-row screw specimens was normalized by dividing it by the number of rows to facilitate a comparative analysis of the mechanical properties of single-row and double-row screw specimens. A set of three identical specimens is tested for each group to ensure repeatability. As some specimens contained initial fabrication defects, only two effective specimens were available in the 1B-12 and 1BE-8 groups. The defective specimens were excluded from the statistical analysis. However, to facilitate a comprehensive analysis of the macroscopic mechanical performance, the load–displacement curve of the third specimen is still presented, designated with the suffix “−3”. The thick solid red lines represent the average response of the effective specimens in the same group. As shown in the figure, the load–displacement curves of the specimens in each group exhibit small variability, and the average response effectively characterizes the overall mechanical performance of the connection joints in that group.
A clear distinction in failure modes was observed from the curves. As shown in Figure 6b–d, the specimens in the 1BF-12, 1B#-12, and 1BE-8 groups failed abruptly due to bolt shear fracture, leading to a sudden loss of capacity. Conversely, the specimens in the 1B-12, 1BE-12, and 1BE-16 groups were governed by progressive wood crushing, which caused only minor load fluctuations at large displacements. The load–displacement curves for all specimen groups exhibited a remarkably consistent progression, which can be characterized by four distinct stages: elastic, elasto-plastic, plastic development, and failure. Taking specimen 1B#-12 as an example, the typical development process of its load–displacement curve is described as follows:
(1)
Elastic stage: In the initial loading stage, the connection exhibited a linear load–displacement relationship, indicating that both the bolt and timber were deforming elastically. With increasing load, the specimen gradually yields, and the joints stiffness begins to exhibit non-linear degradation, subsequently entering the elastic-plastic stage.
(2)
Elasto-plastic stage: This stage is characterized by the non-linear smooth degradation of joint stiffness. Wood fibers are compressed by the bolt, gradually undergoing plastic deformation, causing the joint’s tangential stiffness to continuously decrease. However, the load-bearing capacity of the joint continued to increase due to the compaction of the wood. This resulted in the curve exhibiting a distinct convex non-linear characteristic.
(3)
Plastic development stage: As deformation accumulates, the joint enters a stage dominated by material plasticity, characterized by strengthening and increased ductility. The bolts exhibit significant bending deformation and gradually form one or more plastic hinges. The compressed wood areas below the pin slots or washers become denser, and the load-bearing capacity continues to increase, eventually reaching the peak load, with the specimen exhibiting some ductility. During the continued loading process, the wood fibers experience sustained and non-uniform fracture, which manifests as slight fluctuations in the load displacement curve.
(4)
Failure stage: When the displacement exceeds the peak load point, the curve enters the load-bearing capacity decline segment, marking the beginning of the loss of structural integrity at the joint. Due to the compressive failure of the pin slot wall, shear fracture of the bolt, or local compressive failure of the wood beneath the washer, the bearing capacity of the joint significantly decreases and the specimen fails.
However, some high-performance bolt specimens exhibited significant plastic deformation capacity. No obvious failure stage was observed within the displacement range set for the test, and their response remained in the plastic development stage at the end of the test. Therefore, for these specimens, the recorded load-slip curves did not fully reflect the load-bearing capacity degradation after the peak and the final failure process.

3.2. Failure Modes

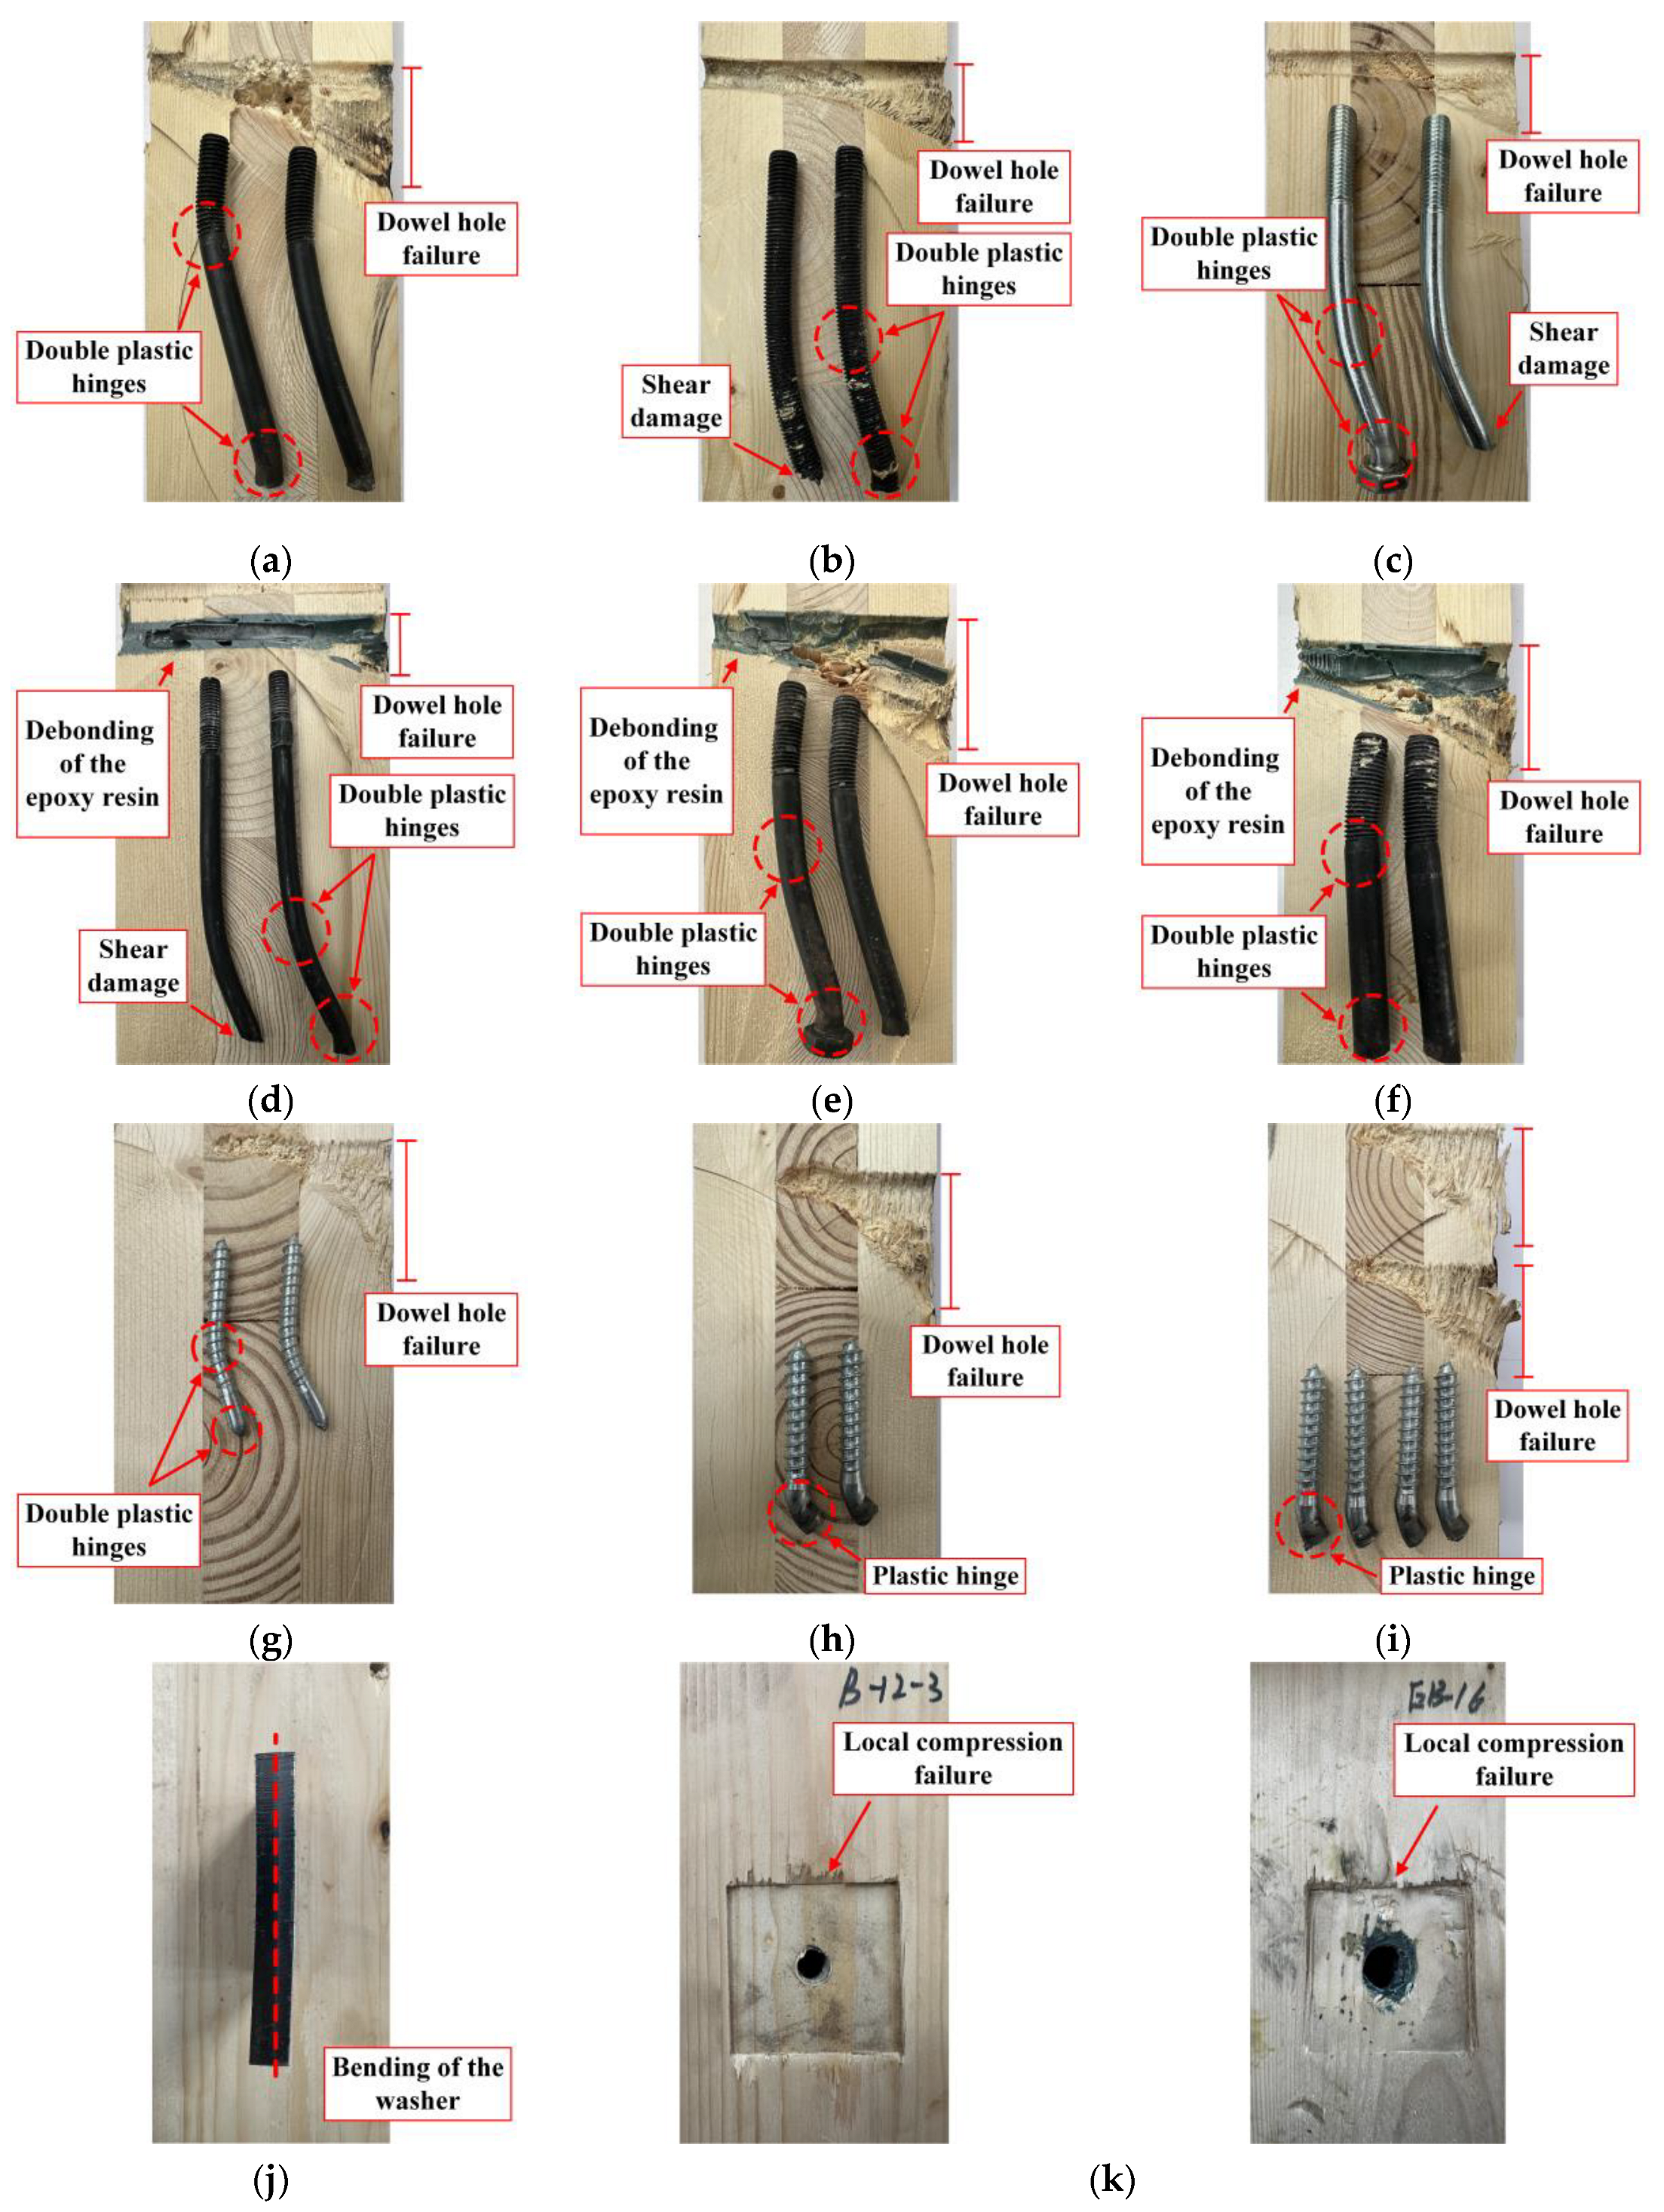
After the test, the nut head was removed to facilitate the complete extraction of the connection components. The failure modes for each specimen group are summarized in Table 6, with typical failure patterns illustrated in Figure 7.
All connection components exhibited plastic hinging after the test. Based on the number of plastic hinges, the failure mechanism can be categorized into two typical failure modes. Failure mode I: single plastic hinge yielding, similar to yielding mode IIIm in GB 50005—2017 ‘Standard for design of timber structures’ [39]; failure mode II: double plastic hinge yielding, similar to yielding mode IV in the same standard. Additionally, in groups with lower connection member strength or higher aspect ratios, failure mode III was observed: shear failure occurred at the location of the plastic hinge formed at the CLT to steel interface.
In addition to the yielding and fracture of the connectors themselves, a series of accompanying damages were widely observed in the tests: under the squeezing action of the connectors, significant compressive failure occurred in the timber dowel slot regions of all specimens, accompanied by the generation of squeezing debris; In bolted connection specimens, clear local compression indentations formed beneath the washers; for epoxy resin–bolt connections, the failure process was also accompanied by delamination of the epoxy resin layer from the bolt and wood bonding interface. These composite damage phenomena collectively constituted the complete failure mechanism of the connection joints.

4. Discussion

4.1. Mechanical Properties

Table 7 summarizes the key mechanical properties for the nine groups of test specimens, including the average values and their corresponding coefficients of variation. In accordance with the standards BS EN26891:1991 [38] and BS EN 12512:2001 [40], the parameters are defined as follows:
(1)
The maximum load observed throughout the test is denoted as the peak load Fmax. A peak load is deemed valid only when the load–displacement curve shows a clear maximum, followed by a period of sustained load decay. For specimens where the load continues to increase until the end of loading, the peak load is not defined.
(2)
As illustrated in Figure 8, two distinct methods are employed to determine the yield point (vy, Fy), corresponding to the different types of load–displacement curves observed for the various connectors.
(3)
The ultimate displacement vu is defined as the smallest of the following three criteria: (a) the displacement corresponding to a significant decrease in load due to shear failure of the connector; (b) the displacement corresponding to a load equal to 0.8 Fmax of the load on the descending segment of the curve; (c) a maximum displacement limit of 30 mm.
(4)
The ultimate load Fu is identified as the load value on the curve corresponding to the ultimate displacement vu.
(5)
The joint’s initial stiffness Ks,0.4 and secondary stiffness Ks,0.7 are calculated according to Equations (1) and (2), respectively.
K s , 0.4 = 0.3 F est v 04 - v 01
K s , 0.7 = 0.3 F est v 27 - v 24
In the formula: Fest is the estimated ultimate load; v01 and v04 are the joint displacements corresponding to the first stage of loading when the load reached 0.1 Fest and 0.4 Fest, respectively; v24 and v27 are the joint displacements corresponding to the third stage of loading when the load reached 0.4 Fest and 0.7 Fest, respectively, as shown in Figure 5b.
Table 6. Test failure mode.
GroupShear ConnectorCLT Local Compression FailureFailure Mode
Single Plastic HingeDouble Plastic HingesShear Damage
1B-12 SevereII
1BF-12 ModerateII + III
1B#-12 ModerateII + III
1BE-8 SlightII + III
1BE-12 SevereII
1BE-16 SevereII
1S#-8 II
1S#-12 I
2S#-12 I
(6)
The ratio of the ultimate displacement to the yield displacement is used to define the ductility coefficient Δ. Table 8 presents the method for determining the minimum required ductility and corresponding ductility classes for Cross-Laminated Timber (CLT) structures, as specified in prEN 1998-1-2:2023 [41].
Table 7. Mechanical properties of specimens.
GroupFmax
(kN)
Fy
(kN)
Fu
(kN)
vy
(mm)
vu
(mm)
Ks,0.4
(kN/mm)
Ks,0.7
(kN/mm)
Δ
1B-12/113.43
[6.04]
181.47
[3.75]
8.45
[9.04]
30
[0.00]
12.76
[3.46]
5.78
[15.86]
3.56
[9.04]
1BF-12184.46
[4.44]
93.17 [1.27]181.84 [4.13]7.83
[3.70]
29.62 [2.22]11.97
[0.90]
5.21
[8.90]
3.79 [5.77]
1B#-12144.85 [0.60]69.55 [6.47]139.15 [3.31]7.39
[1.64]
30
[0.00]
10.32
[9.10]
3.98
[6.44]
4.06 [1.62]
1BE-8131.01 [4.79]54.12 [3.44]131.01 [4.79]6.33
[3.24]
24.98 [1.05]8.12
[4.41]
4.78
[4.76]
3.95 [4.29]
1BE-12/137.18 [8.56]203.37 [5.82]9.03 [10.89]30
[0.00]
14.27
[16.54]
5.14
[17.78]
3.35 [11.61]
1BE-16/143.52 [10.76]232.24 [7.84]8.45
[3.60]
30
[0.00]
18.23
[17.81]
6.00
[31.50]
3.55
[3.57]
1S#-846.58 [4.94]41.39 [6.45]37.29 [4.34]7.17 [10.56]30
[0.00]
5.74
[8.60]
4.38
[18.49]
4.22 [11.22]
1S#-1268.91 [5.56]57.83 [6.79]68.29 [5.79]5.71 [33.81]30
[0.00]
11.75
[37.44]
10.84
[10.59]
5.75 [38.47]
2S#-1262.53 [5.25]54.09 [2.73]61.55 [6.42]8.58
[9.19]
30
[0.00]
7.04
[13.04]
7.15
[7.10]
3.52 [9.10]
Note: Values in [ ] denote the coefficient of variation (%).
Table 8. Minimum required ductility Δ as defined of dissipative zones tested accordingly.
Structural TypeDissipative Sub-Assembly/Joint/2D-or 3D Connector/ConnectionType of DuctilityΔ
DC2
Δ
DC3
Cross laminated timber structuresShear wallDisplacement1.52.5
Hold-downs, tie-downs, foundation tie-downs, angle brackets, shear platesDisplacement1.51.5
Screwed wall panel-to-panel jointsDisplacement-5.5
Note: DC2: Ductility Class 2, which represents a medium energy dissipation capacity. DC3: Ductility Class 3, which represents a high energy dissipation capacity.

4.2. Comparison of Test Results with Eurocode 5 Predictions

In Eurocode 5 [42], the bearing capacity Zd of connections using multiple bolts may be calculated according to Equations (3) and (4):
Z d = n e f Z
n e f = n k d
n e f = n 0.9 a 1 13 d 4
where Z is the characteristic load-carrying capacity of a single fastener; nef is the effective number of fasteners in a row parallel to the grain(calculated according to Equations (4a) and (4b) for screw and bolted connections, respectively); and Zd is the resulting effective characteristic capacity of that entire row.
The theoretical capacity of each fastener was predicted based on the Eurocode 5 provisions for a steel plate as the central member in a double shear connection. The code provides distinct equations to account for different ductile failure modes: Equation (5) corresponds to failure with two plastic hinges, while Equation (6) applies to failure with a single plastic hinge. A noteworthy feature of Eurocode 5 is its explicit inclusion of the “rope effect”, which adds a capacity contribution from the fastener’s axial resistance Fax,Rk/4 to the primary Johansen yield theory component. For bolted connections, the code limits this rope effect contribution to 25% of the Johansen capacity. The specific calculation content is shown in Table 9.
Z = f e m t 1 d 2 + 4 M y , R k f e m d t 1 2 1 + F a x , R k 4
Z = 2.3 M y , R k f e m d + F a x , R k 4
where My,Rk is the characteristic fastener yield moment (N·mm); and Fax,Rk is the characteristic withdrawal capacity of the fastener (N), which for a bolt is taken as the lesser of either its tensile capacity or the bearing capacity provided by the washer or steel plate; fem denotes the characteristic embedment strength in the timber member, set as 5.7 MPa (fc/5); d denotes the fastener diameter; t1 is the smaller value between the side timber thickness and the penetration depth.
Eurocode 5, as a classic design standard, demonstrates good accuracy in predicting the yield strength of connections with conventional screws and high-strength bolts, with prediction errors generally within 20% of the experimental values. However, the code significantly overestimates the capacity of low-strength bolts by a non-conservative margin of 33.8%. On the other hand, it severely underestimates the performance of the epoxy resin–bolt connections proposed in this study, proving overly conservative by neglecting the composite strengthening effect of the epoxy grout.

4.3. Comparison of the Performance of Ordinary Bolt Joints

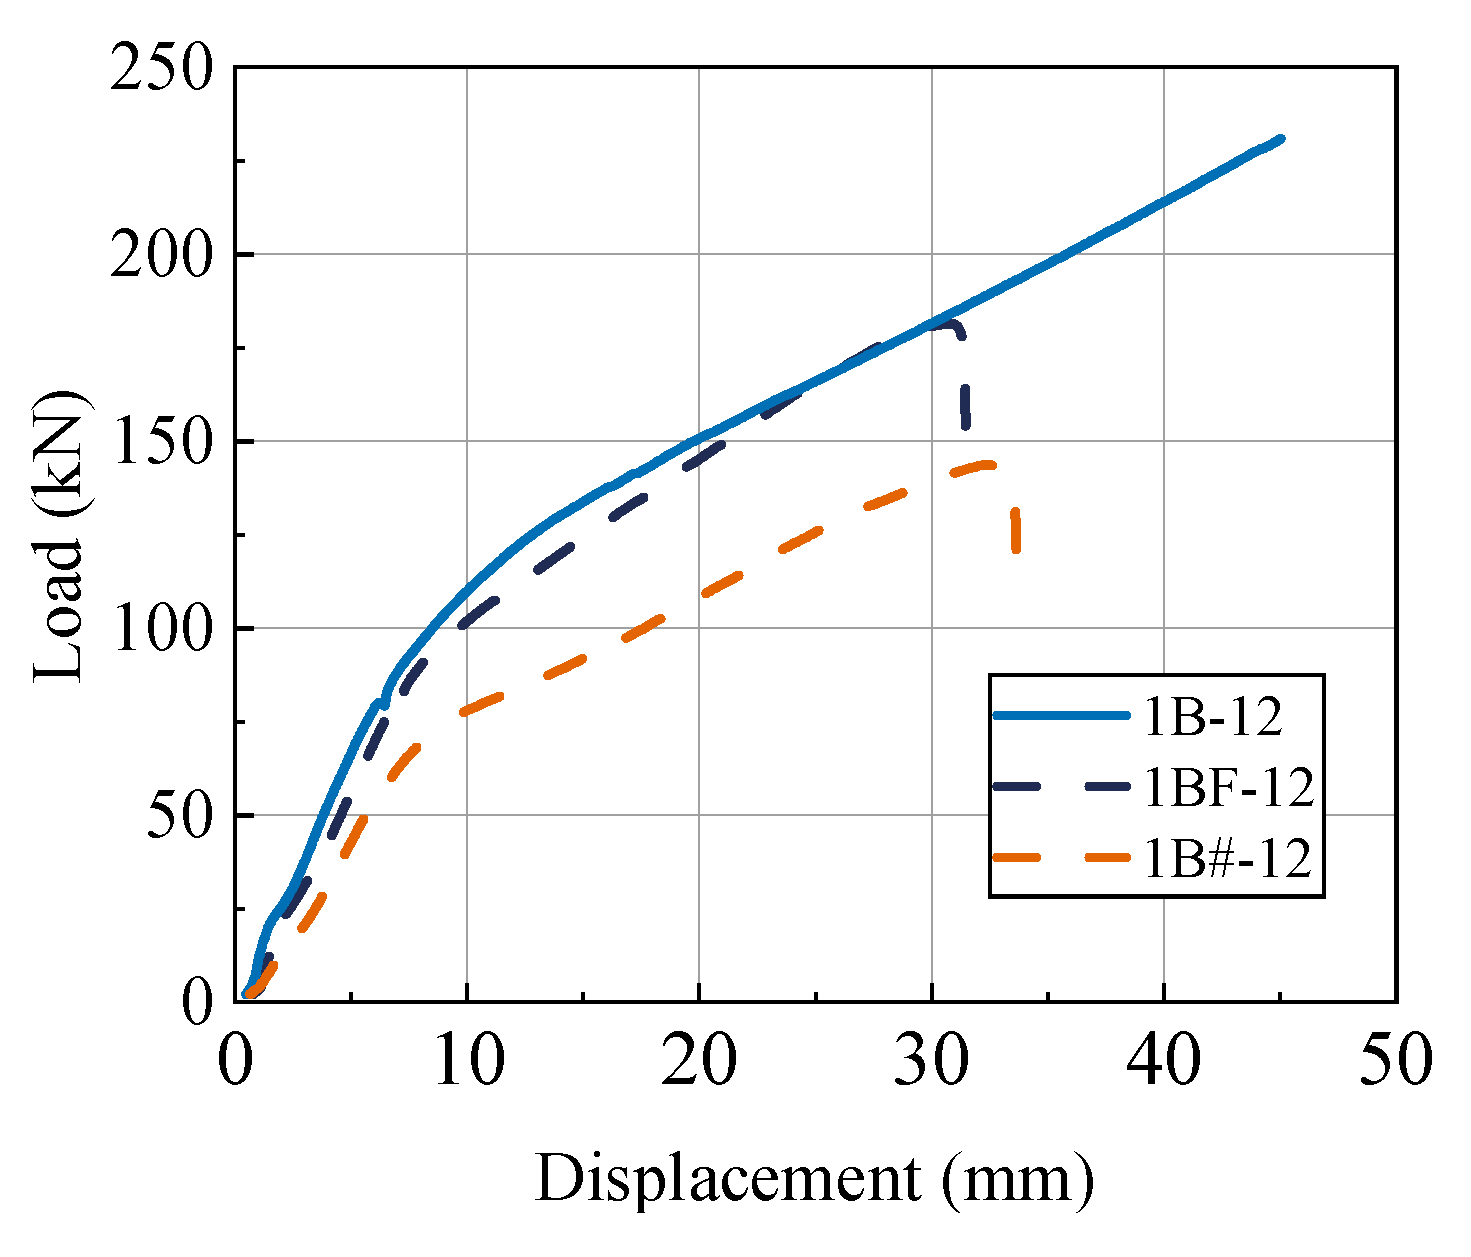
Under the same nominal diameter, the load–displacement curves of ordinary bolted joint specimens with different construction types are shown in Figure 9, clearly revealing the effect of bolt strength grade and thread construction on the joint’s mechanical properties.
During the initial loading phase, all specimens exhibited near-linear elastic behavior. Among them, the specimen groups using 8.8-grade bolts (1B-12 and 1BF-12) showed similar and relatively high initial stiffness. However, the initial stiffness of the specimen group using 4.8-grade bolts (1B#-12) was relatively low, which may be attributed to the lower-strength steel exhibiting microplastic deformation at local high-stress points earlier. As shown in Table 7, specimen group 1B#-12 exhibited a significant reduction in mechanical properties compared to group 1B-12. The initial stiffness, secondary stiffness, and ultimate load decreased by 19.1%, 31.1%, and 23.3%, respectively. This directly demonstrates that using high-strength bolts is an effective means of enhancing the ultimate load-bearing capacity of connections.
Although both are high-strength bolts, the fully threaded specimen group 1BF-12 experienced shear failure at the ultimate load due to the reduction in the net cross-sectional area at the bolt root and stress concentration effects, exhibiting typical brittle failure characteristics. Similarly, although the specimen group 1B#-12 avoided stress concentration issues in the threads, its insufficient material strength caused the bolts to reach their shear limit before the timber reached its bearing capacity, leading to premature failure of the connection and failing to fully utilize the wood’s plastic deformation capacity to develop ductility. This specimen group experienced bolt fracture immediately after reaching a peak load of 144.85 kN, also exhibiting brittle failure. In contrast, specimen group 1B-12 demonstrated the optimal mechanical performance, maintaining a high level of load-bearing capacity within a large deformation range even after reaching the ultimate load, and its final failure mode was characterized by bolt yielding.

4.4. Comparison of Bolt and Screw Joint Performance

In STC beams, screws or groups of screws are commonly used in conjunction with each other. Therefore, based on single-row bolt joint tests, this study investigated the differences in mechanical performance between single- and double-row screw joints and single-row bolt joints.
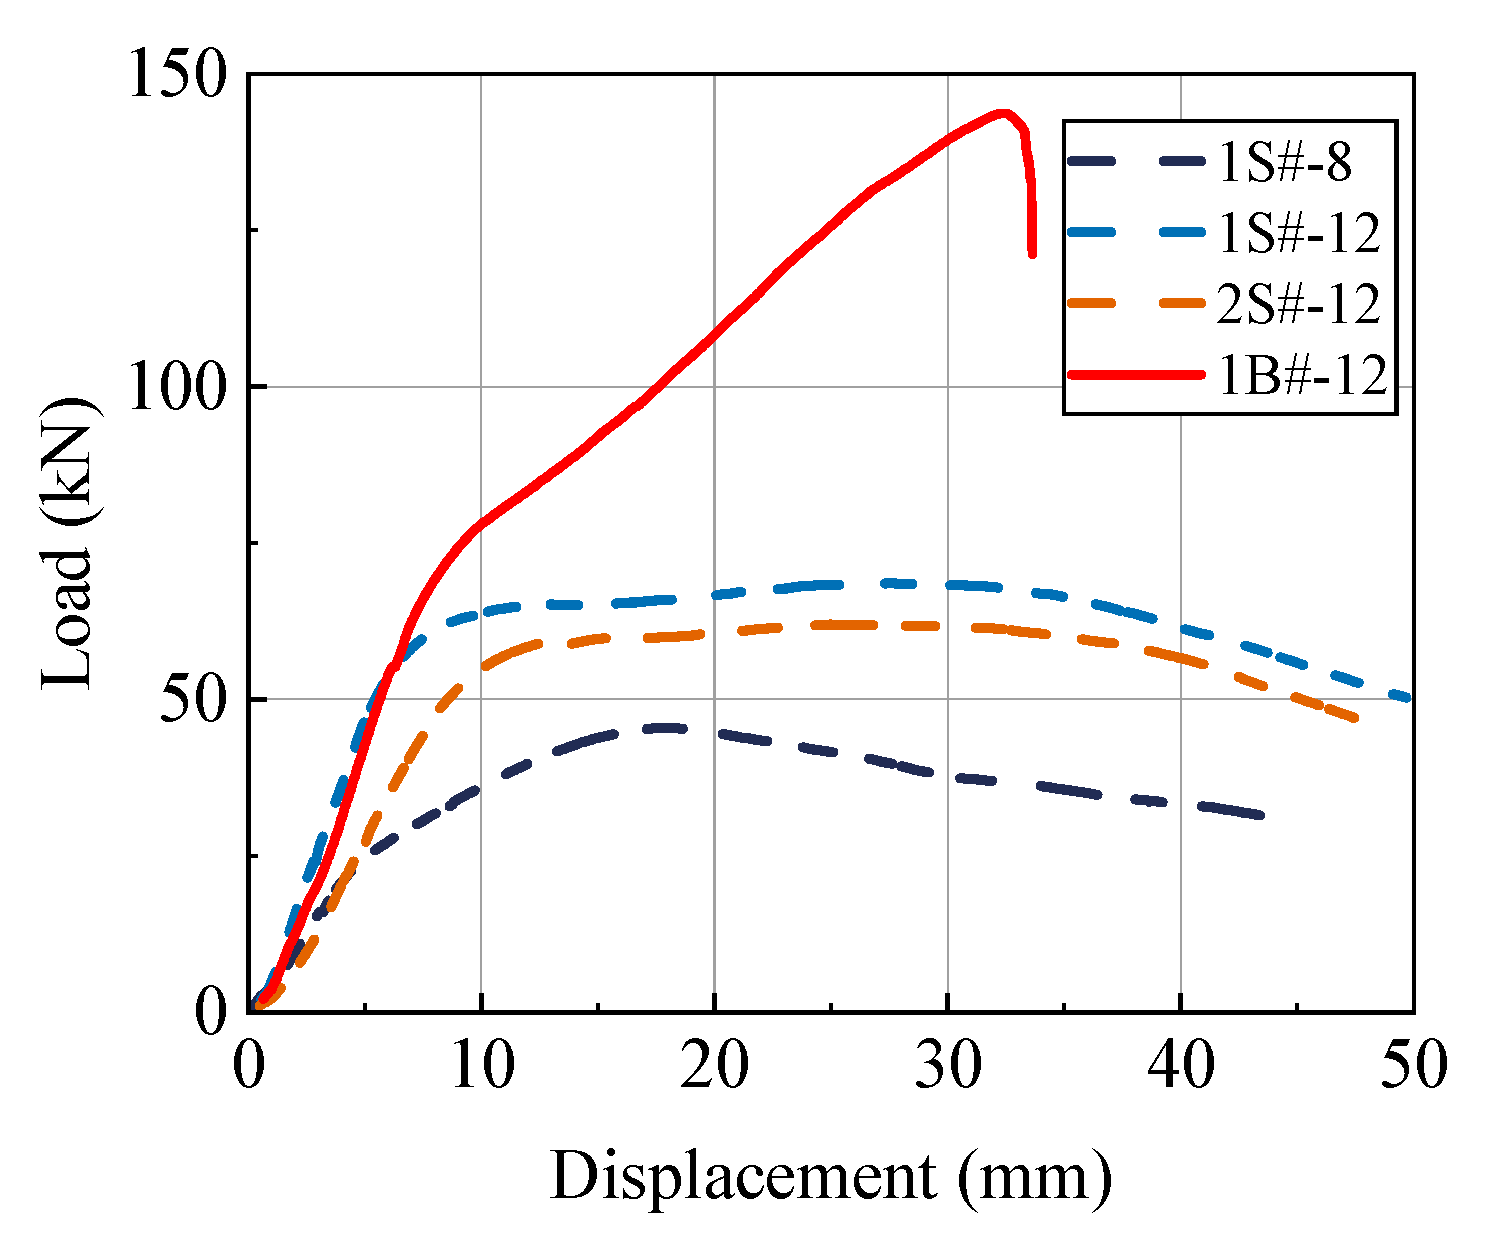
Figure 10 compares the load–displacement curves of 4.8-grade bolts and screw specimens. Due to the anchoring effect of washers and nuts, bolt specimen group 1B#-12 had a high peak load, but its failure mode is brittle failure. The screw specimen groups (1S#-8, 1S#-12, and 2S#-12) had lower peak loads but demonstrated excellent ductility. Their load–displacement curves exhibit a prolonged plastic platform, with a very gradual post-peak degradation in load-bearing capacity, while also demonstrating a large ultimate deformation capacity. This ideal ductile failure mode is primarily due to the inherent ductility of screws. In the later stages of loading, the screws undergo significant bending deformation, which synergistically deforms with the surrounding wood, accompanied by the extraction of the screws, thereby forming an energy dissipation mechanism. Notably, when the specifications of the screws are similar to those of bolts, the initial stiffness of the screw connection test specimens group 1S#-12 was 13.8% higher than that of the bolt connection test specimens group 1B#-12. This phenomenon is attributed to the fundamental difference in installation methods: screws are screwed into a 0.75 D diameter slot via self-tapping, forming a tight thread-wood engagement interface that effectively utilizes the wood’s anchoring effect, thereby achieving excellent initial embedment performance.
Within the screw test specimen group, the normalized peak load of the double-row screw test specimen group 2S#-12 was slightly lower than that of the single-row screw test specimen group 1S#-12, with initial stiffness and secondary stiffness decreasing by 40% and 34%, respectively. The phenomenon that the total capacity of the connection is not equal to the simple linear sum of the contributions from individual fasteners clearly reveals the ‘group nail effect’ in double-row screw connections. This effect stems from the load transfer is intrinsically coupled with material strain. In a multi-row screw arrangement, the load is first transferred to the leading row of screws—those closest to the point of application. The load is then conveyed to subsequent rows through the combined deformation of the interconnecting materials, including both the steel and timber. In this process, the load is attenuated on the transfer path as the wood around the row of screws is subjected to pressure deformation. During this transfer, the load is attenuated on the transfer path as the wood around the row of screws is subjected to pressure deformation. The screw load distribution shows a gradient characteristic, that is, the closer the screw is to the load application point, the greater the load it bears. As a result, the total load-bearing capacity of the connection fails to reach the simple linear superposition of individual screw capacities. This phenomenon is referred to as the ‘group nail effect’ and it significantly reduces the overall efficiency of the connection.
By increasing the diameter of the screw from 8 mm (specimen group 1S#-8) to 12 mm (specimen group 1S#-12), the strength and stiffness of the specimens were significantly improved. This is in line with the expected scenario, as a larger diameter provides a greater timber bearing area and higher shear resistance of the screws, thereby comprehensively enhancing the mechanical performance of the connection joint. This demonstrates that increasing the diameter is an effective method for strengthening connection performance.

4.5. Comparison of the Performance of Ordinary Bolts and Epoxy Resin-Bolted Joints

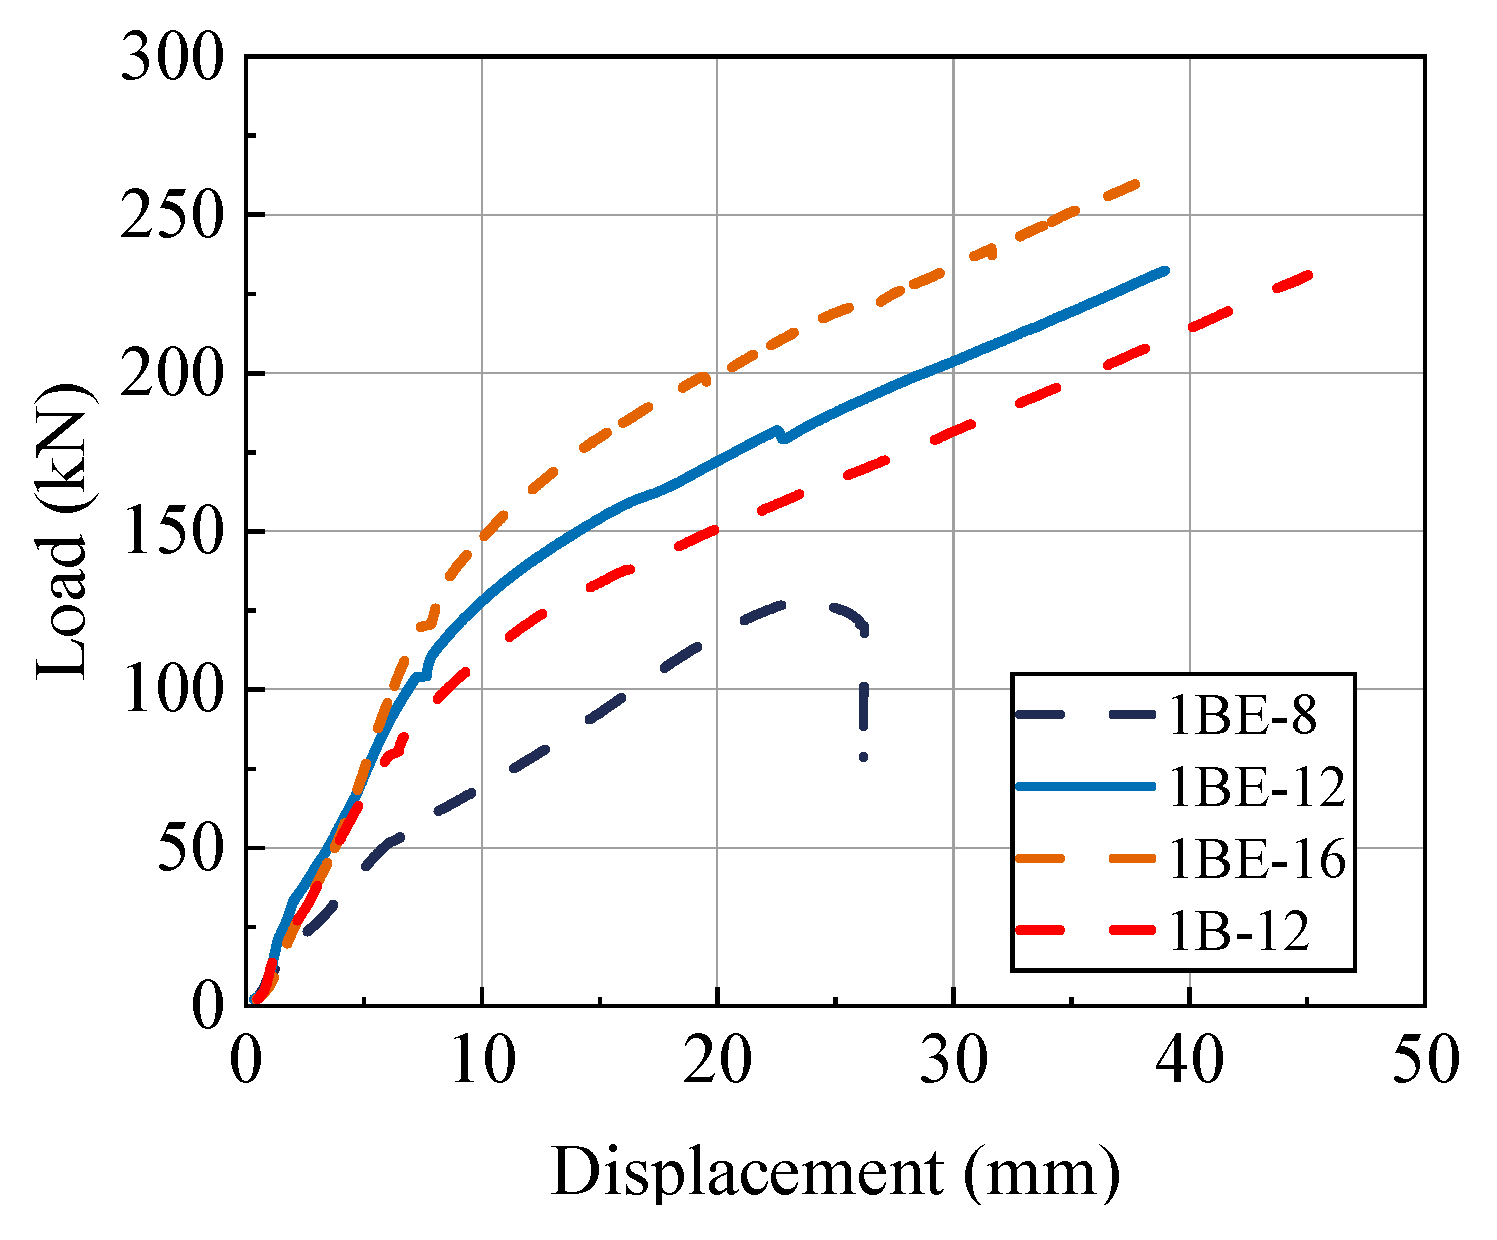
Figure 11 compares the load–displacement curves of 8.8-grade ordinary bolts and epoxy resin-bolted specimens. By comparing the 12 mm diameter ordinary bolt specimen group 1B-12 with the epoxy resin-bolted specimen group 1BE-12, it was confirmed that the introduction of an epoxy resin adhesive layer moderately improved the mechanical performance of the connection joints.
At any given displacement level, the load of the specimen group 1BE-12 was higher than that of the specimen group 1B-12. The ultimate load and initial stiffness were increased by 12% and 11.8%, respectively. The underlying mechanism behind this performance improvement lies in the high-strength epoxy resin forming a ‘rigid sleeve’ between the bolt hole wall and the timber dowel slot. In a conventional bolted connection, load is transferred directly from the bolt shank to the timber hole wall through a localized, high-stress region. This process inevitably causes stress concentration and can lead to the premature crushing of wood fibers. In the epoxy resin–bolt connection, however, the load is first transferred from the bolt to the epoxy sleeve, and then from the sleeve to the timber over a much larger contact area. The high compressive strength and stiffness of the epoxy allow it to effectively convert a line load from the bolt into a distributed surface load on the timber, thereby significantly reducing stress concentration at the hole wall and suppressing localized brittle failure of the wood. This effectively increases the load-bearing area, homogenizes the stress distribution transmitted from the bolt to the wood, significantly reduces stress concentration at the hole walls, and suppresses premature crushing of wood fibers, thereby forming a composite dowel system where the bolt, epoxy resin, and wood work synergistically. This enhancement is made possible by the excellent mechanical properties of the epoxy resin itself (as shown in Table 4). Its high compressive strength of 107.6 MPa, which is substantially greater than the transverse compressive strength of the wood (fc = 28.74 MPa), ensures that the sleeve is not crushed under the high bearing pressure from the bolt. Concurrently, its bending strength of 77.5 MPa allows the sleeve to maintain its integrity and deform synergistically as the bolt bends.
This reinforcement method significantly enhances strength and stiffness without sacrificing the ductility of the connection joints. As shown in Table 7, the unreinforced specimen group 1B-12 exhibited a ductility ratio (Δ) of 3.56, while the epoxy-reinforced specimen group 1BE-12 showed a slightly lower ratio of 3.35. According to Table 8, common dissipative connectors in CLT structures, like hold-downs and shear plates, are required to have a minimum ductility ratio of Δ = 1.5 to qualify for the medium ductility class (DC2). Both the ductility ratios of the reinforced specimen group 1BE-12 and the unreinforced specimen group 1B-12 are more than double this minimum requirement, demonstrating a positive plastic deformation capacity.
Comparing the epoxy resin–bolt specimen groups (1BE-8, 1BE-12, and 1BE-16), it was found that the bolt diameter was significantly positively correlated with the mechanical properties of the epoxy resin–bolt connection joints. Increasing the bolt diameter from 8 mm to 16 mm resulted in a significant improvement in the connection’s strength and stiffness. When displacement reached 20 mm, the load-bearing capacity of the specimen group 1BE-16 was approximately 20% and 80% higher than that of the specimen group 1BE-12 and 1BE-8, respectively. This directly reflects the higher shear stiffness and strength of bolts with larger diameters. The most critical finding is that bolt diameter directly determines the final failure mode of the epoxy resin–bolt connection specimens. The smallest diameter specimen group 1BE-8 experienced a sharp decline in load-bearing capacity after reaching a peak load of approximately 131.01 kN, exhibiting failure mode III with typical brittle fracture characteristics. This indicates that, for 8 mm bolts, their inherent strength became the weakest link in the composite connection system: after wood reinforcement, failure is controlled by the shear fracture of the bolts themselves. In contrast, specimens with diameters of 12 mm and 16 mm exhibited good ductility, with failure modes dominated by the plastic yielding of the bolts and the progressive crushing of the wood.

5. Conclusions and Design Recommendations

5.1. Conclusions

The interface performance between timber and H-steel is critical for designing STC joints. This study involved nine groups of double shear tests on STC joints. The investigation focused on the effects of connection component strength grades, screw construction, type, diameter, quantity, and epoxy resin reinforcement measures on the stiffness, shear bearing capacity, and ductility of STC joints. The specific conclusions are as follows:
(1)
Using high-strength bolts was found to be a direct way to enhance the ultimate load-bearing capacity of connection joints. Additionally, compared to fully threaded bolts, partially threaded bolts had a larger effective cross-sectional area, resulting in higher shear load-bearing capacity. Furthermore, by forming a plastic hinge at the root of the bolt, the failure mode of partially threaded bolts transitioned from brittle shear failure to the desired ductile failure.
(2)
Ordinary bolt specimens exhibited significantly higher ultimate load-bearing capacity than screw specimens of the same diameter due to the anchoring effect at the nut end. However, screw specimens effectively utilized the wood’s anchoring capacity through the close thread-wood engagement interface, thereby demonstrating superior initial stiffness. Regarding the number of screw rows, increasing the number of connection elements enhanced load-bearing capacity and stiffness. However, due to the ‘cluster nail effect,’ performance improvements were not linearly increased, and the efficiency reduction of group nails needs to be considered in the design.
(3)
Compared with ordinary bolts, the epoxy resin–bolt joint formed by injecting epoxy resin into the bolt slot increased the initial stiffness and ultimate load of the connection by 12% and 11.8%, respectively, without sacrificing ductility. However, when the wood end is sufficiently reinforced, smaller-diameter bolts became the weak link in the connection system, which caused the failure mode to shift from the ideal ductile yielding to unexpected bolt brittle fracture.

5.2. Design Recommendations

The epoxy resin–bolt connection method proposed in this paper has significant advantages and can effectively enhance the mechanical performance of connection joints. Based on the findings above, the following preliminary design recommendations are proposed to guide the application of this novel connection in engineering practice:
(1)
This study demonstrated that 12 mm and 16 mm diameter bolts can establish a good synergistic mechanism with the epoxy-reinforced timber, leading to ductile failure. To ensure the connection possesses adequate ductility and reliability by avoiding brittle failure of the bolt itself, it is recommended to use high-strength bolts with a diameter of no less than 12 mm.
(2)
The 2 mm epoxy layer thickness used in this study performed well experimentally. This thickness represents an effective balance between constructability and mechanical performance. In the absence of further parametric studies, a 2 mm thickness is recommended as a reference. Designers should ensure that the oversized hole is large enough for uniform epoxy filling but avoid excessive thickness that could increase material consumption and potential issues related to volumetric shrinkage.
(3)
To mitigate the group nail effect, proper spacing is essential. In this composite system, the load is transferred by the ‘epoxy resin-bolt’ composite dowel, which has a diameter of the hole (D). This is different from the bare bolt diameter. Therefore, all spacing calculations should be based on this composite diameter D. With reference to the provisions for dowel-type fasteners in Eurocode 5, we suggest: Spacing parallel to the load direction of no less than 4D and spacing perpendicular to the load direction of no less than 4D. This recommendation is a rational inference but requires validation through future dedicated experimental studies. Until more precise reduction factors for this specific composite connection are developed, a conservative approach should be taken in design by applying the capacity reduction factors for conventional multi-row bolted connections to ensure structural safety.
(4)
For the epoxy resin-bolted connections, which exhibited a ductile failure mode governed by bolt yielding and progressive wood crushing, Eurocode 5 provided a reasonable prediction of the bearing capacity, making it suitable for design applications.

Author Contributions

Conceptualization, Q.L. and B.F.; methodology, Q.L. and H.W.; software, J.X.; validation, Q.L. and B.F.; formal analysis, J.Y.; investigation, Q.L. and B.F.; resources, Y.X.; data curation, X.L.; writing—original draft preparation, J.Y.; writing—review and editing, Q.L. and B.F.; visualization, Z.Z.; supervision, Q.L.; project administration, Q.L. and H.W.; funding acquisition, J.X. All authors have read and agreed to the published version of the manuscript.

Funding

This research was funded by the Ningbo Science and Technology Bureau through the Public Welfare Research Plan Project of Ningbo, grant number 2024S080; the Department of Housing and Urban-Rural Development of Zhejiang Province through the Zhejiang Provincial Construction Science and Technology Research Project, grant number 2024K161; and the Ningbo University of Technology through the General Research Project (Postgraduate Special), grant number 2024NGYA001.

Data Availability Statement

The data presented in this study are available from the first author upon reasonable request.

Acknowledgments

Thanks are due to Xiaoai Fang and Renliang Fang for assistance with the experiments.

Conflicts of Interest

Authors Huake Wang and Jiale Xu were employed by the company Huaxing Steel Structure Co., Ltd. The remaining authors declare that the research was conducted in the absence of any commercial or financial relationships that could be construed as a potential conflict of interest.

Abbreviations

The following abbreviations are used in this manuscript:
CLTCross laminated timber
STCSteel–timber composite
GLTGlue laminated timber

References

  1. Quintana Gallo, P.; Carradine, D.M.; Bazaez, R. State of the art and practice of seismic-resistant hybrid timber structures. Eur. J. Wood Wood Prod. 2021, 79, 5–28. [Google Scholar] [CrossRef]
  2. Chiniforush, A.A.; Akbarnezhad, A.; Valipour, H.; Xiao, J. Energy implications of using steel-timber composite (STC) elements in buildings. Energy Build. 2018, 176, 203–215. [Google Scholar] [CrossRef]
  3. Liu, W.; Yang, H. Research progress on modern timber structures. J. Build. Struct. 2019, 40, 16–43. [Google Scholar]
  4. Brandner, R.; Flatscher, G.; Ringhofer, A.; Schickhofer, G.; Thiel, A. Cross laminated timber (CLT): Overview and development. Eur. J. Wood Wood Prod. 2016, 74, 331–351. [Google Scholar] [CrossRef]
  5. Fan, Y.; Zhang, L.; Chen, S.; Yamahiro, S. Technological Iteration and Design Evolution of Medium and Large Timber Architecture in Japan. Archit. J. 2023, 9, 24–31. [Google Scholar] [CrossRef]
  6. Svatoš-Ražnjević, H.; Orozco, L.; Menges, A. Advanced timber construction industry: A review of 350 multi-storey timber projects from 2000–2021. Buildings 2022, 12, 404. [Google Scholar] [CrossRef]
  7. Ataei, A.; Valipour, H.R.; Bradford, M.A.; Chiniforush, A.A. Experimental study of steel-timber composite beam-to-column joints with extended end plates. Constr. Build. Mater. 2019, 226, 636–650. [Google Scholar] [CrossRef]
  8. Ascione, F.; Esposito, F.; Iovane, G.; Faiella, D.; Faggiano, B.; Mele, E. Sustainable and efficient structural systems for tall buildings: Exploring timber and steel–timber hybrids through a case study. Buildings 2024, 14, 524. [Google Scholar] [CrossRef]
  9. Ataei, A.; Bradford, M.A.; Valipour, H.R. Sustainable high strength steel flush and plate beam-to-column composite joints with deconstructable bolted shear connectors. In Proceedings of the Second International Conference on Performance-Based and Lifecycle Structural Engineering, Brisbane, QLD, Australia, 9–11 December 2015; pp. 749–757. [Google Scholar]
  10. Wang, X.; He, Q.; An, Z.; Liu, G.; Wen, X.; Wang, Y.; Zhong, Z. Experimental study of perfobond rib shear connector under lateral force. Appl. Sci. 2021, 11, 9088. [Google Scholar] [CrossRef]
  11. Xu, X.; Liu, Y.; He, J. Study on mechanical behavior of rubber-sleeved studs for steel and concrete composite structures. Constr. Build. Mater. 2014, 53, 533–546. [Google Scholar] [CrossRef]
  12. Zhuang, B.; Liu, Y.; Yang, F. Experimental and numerical study on deformation performance of Rubber-Sleeved Stud connector under cyclic load. Constr. Build. Mater. 2018, 192, 179–193. [Google Scholar] [CrossRef]
  13. He, X.; Yam, M.C.; Ke, K.; Zhou, X.; Zhang, H.; Gu, Z. Behaviour insights on damage-control composite beam-to-beam connections with replaceable elements. Steel Compos. Struct. 2023, 46, 773–791. [Google Scholar]
  14. He, X.; Ke, K.; Chen, Y.; Yam, M.C.; Shao, T. An experimental study of steel-concrete composite connections equipped with fuse angles. J. Constr. Steel Res. 2022, 195, 107357. [Google Scholar] [CrossRef]
  15. Wang, C.-L.; Lyu, J.; Zhao, J.; Yang, H. Experimental investigation of the shear characteristics of steel-to-timber composite joints with inclined self-tapping screws. Eng. Struct. 2020, 215, 110683. [Google Scholar] [CrossRef]
  16. Ataei, A.; Chiniforush, A.; Bradford, M.; Valipour, H. Cyclic behaviour of bolt and screw shear connectors in steel-timber composite (STC) beams. J. Constr. Steel Res. 2019, 161, 328–340. [Google Scholar] [CrossRef]
  17. Yang, R.; Li, H.; Lorenzo, R.; Ashraf, M.; Sun, Y.; Yuan, Q. Mechanical behaviour of steel timber composite shear connections. Constr. Build. Mater. 2020, 258, 119605. [Google Scholar] [CrossRef]
  18. Chiniforush, A.A.; Valipour, H.R.; Bradford, M.A.; Akbarnezhad, A. Long-term behaviour of steel-timber composite (STC) shear connections. Eng. Struct. 2019, 196, 109356. [Google Scholar] [CrossRef]
  19. Li, Z.; Wang, X.; He, M.; Dong, W. Experimental investigation of timber-steel hybrid walls and seismic design method for timber-steel hybrid structural system. J. Build. Struct. 2018, 39, 191–197. [Google Scholar]
  20. Hassanieh, A.; Valipour, H.R.; Bradford, M.A. Experimental and numerical study of steel-timber composite (STC) beams. J. Constr. Steel Res. 2016, 122, 367–378. [Google Scholar] [CrossRef]
  21. Hassanieh, A.; Valipour, H.R.; Bradford, M.A. Load-slip behaviour of steel-cross laminated timber (CLT) composite connections. J. Constr. Steel Res. 2016, 122, 110–121. [Google Scholar] [CrossRef]
  22. Hassanieh, A.; Valipour, H.R.; Bradford, M.A. Experimental and analytical behaviour of steel-timber composite connections. Constr. Build. Mater. 2016, 118, 63–75. [Google Scholar] [CrossRef]
  23. Hassanieh, A.; Valipour, H.; Bradford, M.; Sandhaas, C. Modelling of steel-timber composite connections: Validation of finite element model and parametric study. Eng. Struct. 2017, 138, 35–49. [Google Scholar] [CrossRef]
  24. Hassanieh, A.; Valipour, H.R.; Bradford, M.A. Experimental and numerical investigation of short-term behaviour of CLT-steel composite beams. Eng. Struct. 2017, 144, 43–57. [Google Scholar] [CrossRef]
  25. Loss, C.; Piazza, M.; Zandonini, R. Connections for steel–timber hybrid prefabricated buildings. Part I: Experimental tests. Constr. Build. Mater. 2016, 122, 781–795. [Google Scholar] [CrossRef]
  26. Loss, C.; Piazza, M.; Zandonini, R. Connections for steel–timber hybrid prefabricated buildings. Part II: Innovative modular structures. Constr. Build. Mater. 2016, 122, 796–808. [Google Scholar] [CrossRef]
  27. He, M.; Ni, S.; Ma, R.; Bai, X. Loading Tests of Prestressed Tube Bolted Joint with Slotted-in Steel Plate. J. Tongji Univ. (Nat. Sci.) 2013, 41, 1353–1358. [Google Scholar]
  28. He, M.; Zhao, Y.; Ma, R. Experimental investigation on lateral performance of pre-stressed tube bolted connection with high initial stiffness. Adv. Struct. Eng. 2016, 19, 762–776. [Google Scholar] [CrossRef]
  29. Ling, Z.; Liu, C.; Zhang, H. Shear performance of grouted stud connections for steel-cross laminated timber composite beams. J. Build. Struct. 2024, 45, 232–242. [Google Scholar]
  30. Hassanieh, A.; Valipour, H.R.; Bradford, M.A. Composite connections between CLT slab and steel beam: Experiments and empirical models. J. Constr. Steel Res. 2017, 138, 823–836. [Google Scholar] [CrossRef]
  31. Hassanieh, A.; Valipour, H.R.; Bradford, M.A. Bolt shear connectors in grout pockets: Finite element modelling and parametric study. Constr. Build. Mater. 2018, 176, 179–192. [Google Scholar] [CrossRef]
  32. Zhao, Y.; Yuan, Y.; Wang, C.-L.; Zheng, J.; Zhou, Y. Experimental study on shear performance of steel-timber screw connectors with grout pockets. Eng. Struct. 2022, 266, 114535. [Google Scholar] [CrossRef]
  33. GB/T 50329-2012; Standard for Methods Testing of Timber Structures. China Architecture & Building Press: Beijing, China, 2012.
  34. GB/T 26899-2011; Structural Glued Laminated Timber. Standards Press of China: Beijing, China, 2011.
  35. GB/T 228.1-2021; Metallic Materials: Tensile Testing: Part 1, Method of Test at Room Temperature. Standards Press of China: Beijing, China, 2021.
  36. GB 50017-2017; Standard for Design of Steel Structures. China Architecture & Building Press: Beijing, China, 2017.
  37. GB 50011-2010; Code for Seismic Design of Buildings. China Architecture & Building Press: Beijing, China, 2016.
  38. BS EN 26891:1991; Timber Structures-Joints Made with Mechanical Fasteners-General Principles for the Determination of Strength and Deformation Characteristics. CEN: Brussels, Belgium, 1991.
  39. GB 50005-2017; Standard for Design of Timber Structures. China Architecture & Building Press: Beijing, China, 2017.
  40. BS EN 12512-2001; Timber Structures-Test Methods-Cyclic Testing of Joints Made with Mechanical Fasteners. CEN: Brussels, Belgium, 2001.
  41. prEN 1998-1-2:2023; Design of Structures for Earthquake Resistance—Part 1-2, Buildings. CEN: Brussels, Belgium, 2023.
  42. EN 1995-1-1; Eurocode 5, Design of Timber Structures—Part 1-1, General Common Rules and Rules for Buildings. European Committee for Standardization: Brussels, Belgium, 2004.
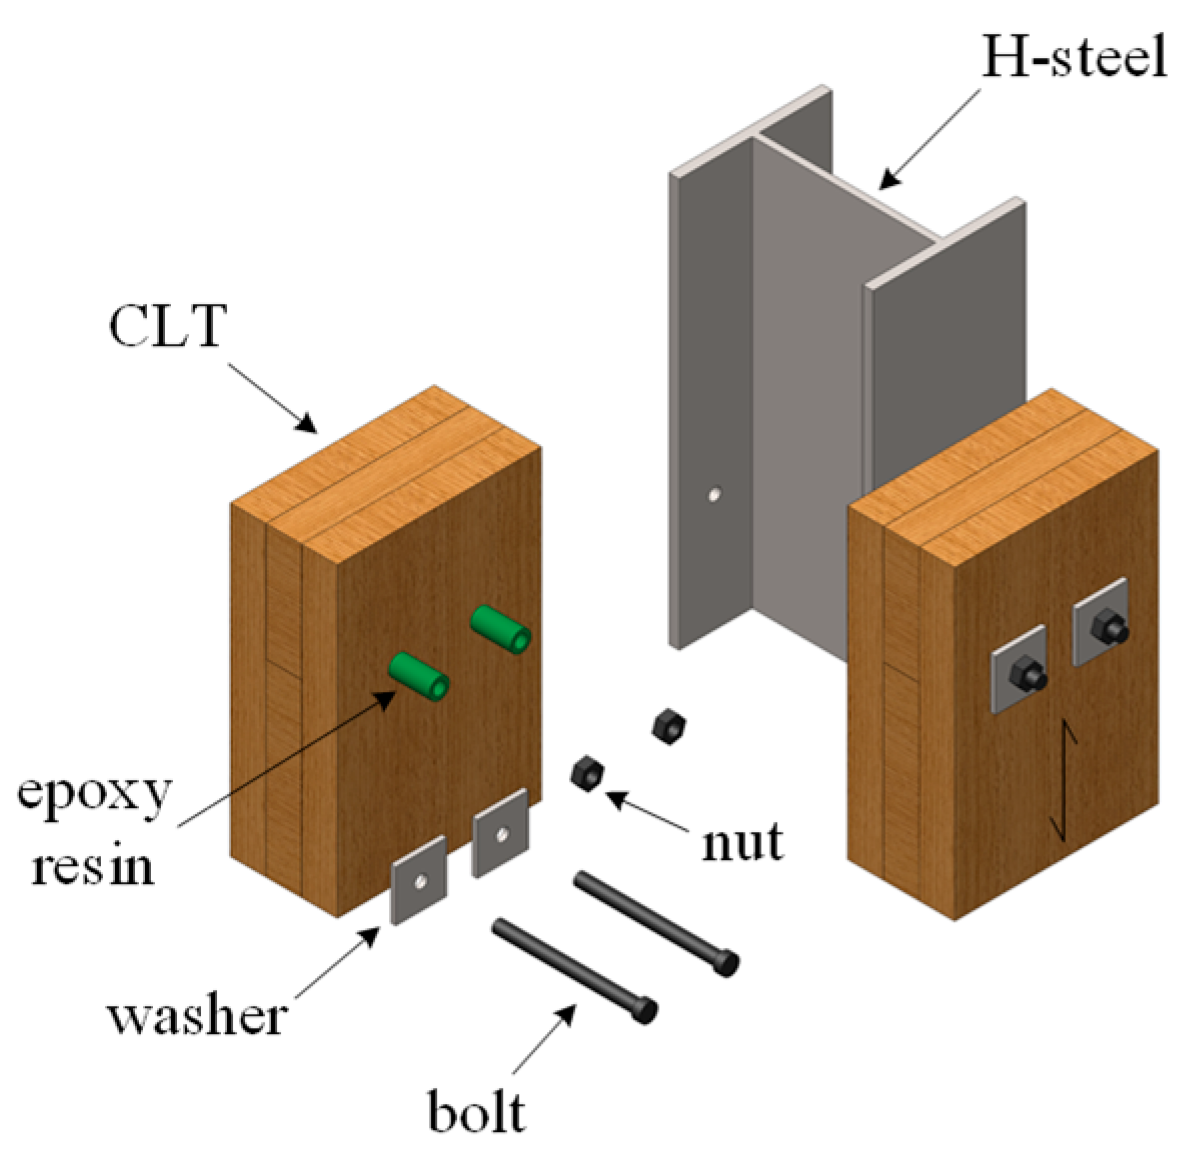
Figure 1. Epoxy resin–bolt connection schematics.
Buildings 15 03400 g001
Figure 2. Diagram of push-out test specimens: (a) Specimen with bolts; (b) Specimen with a single-row of screws; (c) Specimen with double-row of screws.
Buildings 15 03400 g002aBuildings 15 03400 g002b
Figure 3. Material property experiment: (a) CLT; (b) Connection type; (c) CLT compression test; (d) Tensile test of connectors.
Buildings 15 03400 g003
Figure 4. Experimental specimens and instruments: (a) Schematic of the test setup; (b) Photograph of the test setup.
Buildings 15 03400 g004
Figure 5. Loading procedure for push-out test: (a) Loading procedure; (b) Corresponding slip.
Buildings 15 03400 g005
Figure 6. Test load–displacement curve: (a) 1B-12; (b) 1BF-12; (c) 1B#-12; (d) 1BE-8; (e) 1BE-12; (f) 1BE-16; (g) 1S#-8; (h) 1S#-12; (i) 2S#-12.
Buildings 15 03400 g006
Figure 7. Experimental failure phenomenon: (a) 1B-12; (b) 1BF-12; (c) 1B#-12; (d) 1BE-8; (e) 1BE-12; (f) 1BE-16; (g) 1S#-8; (h) 1S#-12; (i) 2S#-12; (j) Washer; (k) CLT.
Buildings 15 03400 g007
Figure 8. Definition method of yield point for load–displacement curve: (a) Bolted connection; (b) Screwed connection.
Buildings 15 03400 g008
Figure 9. Load–displacement curve of ordinary bolt specimens.
Buildings 15 03400 g009
Figure 10. Load–displacement curve of 4.8-grade bolt and screw specimens.
Buildings 15 03400 g010
Figure 11. Load–displacement curve of ordinary bolt and epoxy resin–bolt specimens.
Buildings 15 03400 g011
Table 1. Primary design parameters of the push-out specimens.
GroupShear ConnectorEpoxy Resin
Number of RowsNumber of ColumnsD (mm)L (mm)TypeStrength Grade
1B-121212140Partially threaded bolt8.8Without
1BF-121212140Fully threaded bolt8.8Without
1B#-121212140Partially threaded bolt4.8Without
1BE-8128140Partially threaded bolt8.8With
1BE-121212140Partially threaded bolt8.8With
1BE-161216140Partially threaded bolt8.8With
1S#-812880Screw4.8Without
1S#-12121280Screw4.8Without
2S#-12221280Screw4.8Without
Note: The thickness of the epoxy resin adhesive layer is 2 mm; B represents bolted connection; S represents screw connection; E represents epoxy-reinforced connection; F represents fully threaded bolt; # represents 4.8-grade connection.
Table 2. Mechanical properties of CLT.
Fc, max
(kN)
Ec
(GPa)
fc
(MPa)
τc
(MPa)
ρ
(kg/m3)
ω
(%)
μ
362.118.4828.741.19464.8811.60.43
Note: The values presented in the table are the averages from the tested CLT specimens. Fc, max represents the peak compressive load; Ec represents the modulus of elasticity; fc represents the compressive strength; τc represents the rolling shear strength; ρ represents the specimen density; ω represents the moisture content and μ represents the Poisson’s ratio.
Table 3. Test results of tensile strength of connectors.
Strength GradeTypeNominal Diameter (mm)Maximum Load (kN)Average Value (kN)Tensile Strength (MPa)
Specimen 1Specimen 2Specimen 3
4.8Screw817.2418.2318.4217.96357.48
Screw1240.2540.0637.9339.41348.63
Partially threaded bolt1248.1448.8349.6148.86432.01
8.8Partially threaded bolt843.4341.4841.0141.97835.39
Partially threaded bolt12103.06101.03105.04103.04911.53
Partially threaded bolt16185.85181.36176.52181.24901.87
Fully threaded bolt1270.9379.5473.4674.64660.29
Table 4. Mechanical properties of the epoxy adhesive at room temperature.
Tensile Strength
(MPa)
Bending Strength (MPa)Compressive Strength
(MPa)
Steel-to-Steel Tensile Shear Strength
(MPa)
Complete Curing Time
(h)
19.5777.5107.621.324
Note: The data in this table are sourced from the test report provided by the Nanjing Mankate Science and Technology Co., Ltd. All test results were obtained under controlled conditions of (23 ± 2) °C and (50 ± 5)% RH. Tensile strength: the maximum tensile stress a standard specimen can withstand before fracture during a tensile test. Bending strength: the maximum bending stress of a standard specimen can withstand before failure during a bending test. Compressive strength: the maximum compressive stress a standard specimen can withstand before failure during a compression test. Steel-to-steel tensile shear strength: the maximum shear stress of the bonded interface can withstand when two lap-jointed steel plates are pulled apart.
Table 5. Durability properties of the epoxy adhesive.
Environmental ResistanceStress ResistanceResistance to Medium Corrosion
Damp-Heat Aging Resistance
(%)
Heat Aging Resistance
(%)
Freeze–Thaw Resistance (%)Long-Term Stress ResistanceFatigue Stress Resistance Salt Spray Resistance
(%)
Seawater Immersion Resistance
(%)
Resistance to Alkaline MediumResistance to Acidic Medium
−4.4−2.9−3.4Specimen does not failSpecimen does not fail−3.7−3.5Strength did not decrease, failure in concreteFailure in concrete
Note: The data in this table are sourced from the test report provided by the Nanjing Mankate Science and Technology Co., Ltd. Damp-heat aging resistance: Reduction rate of steel-to-steel tensile shear strength after aging for 90 days at 50 °C, 95% RH. Heat aging resistance: Reduction rate of steel-to-steel tensile shear strength after aging for 30 days at (80 ± 2) °C. Freeze–thaw resistance: Reduction rate of steel-to-steel tensile shear strength after 50 freeze–thaw cycles (−25 °C to +35 °C). Long-term stress resistance: Under 4.0 MPa sustained shear stress for 210 days at (23 ± 2) °C, (50 ± 5)%RH. Fatigue stress resistance: With-stand 2 × 10⁶ cycles of sine wave shear load (20 Hz, max stress 4.0 MPa) at room temp. Salt spray resistance: Reduction rate of steel-to-steel tensile shear strength after 90 days in a 5% NaCl salt spray environment. Sea-water immersion resistance: Reduction rate of steel-to-steel tensile shear strength after immersion in artificial seawater for 30 days. Resistance to alkaline medium: After immersion in saturated Ca(OH)2 solution for 60 days, conduct a concrete bond strength test. Resistance to acidic medium: After immersion in 3% H2SO4 solution for 30 days, conduct a concrete bond strength test.
Table 9. Evaluation of design code predictions for connection bearing capacity.
GroupFy
(kN)
Eurocode 5
(kN)
Error
(%)
GroupFy
(kN)
Eurocode 5
(kN)
Error
(%)
GroupFy
(kN)
Eurocode 5
(kN)
Error
(%)
1B-12113.4399.09−12.61BE-854.12 64.76+19.61S#-841.39 45.27+9.4
1BF-1293.1795.96+2.91BE-12137.18 99.09−27.71S#-1257.83 57.29−0.9
1B#-1269.55 93.08+33.81BE-16143.52 135.29−5.72S#-1254.09 44.63−17.5
Note: The error was calculated as [(Predicted − Experimental) / Experimental] × 100%.
Disclaimer/Publisher’s Note: The statements, opinions and data contained in all publications are solely those of the individual author(s) and contributor(s) and not of MDPI and/or the editor(s). MDPI and/or the editor(s) disclaim responsibility for any injury to people or property resulting from any ideas, methods, instructions or products referred to in the content.