Article

Study on Creep Behavior of Wenzhou Remolded Coastal Silt Under One-Dimensional and Triaxial Tests

1
Wenzhou Electrical Power Design Co., Ltd., Wenzhou 325000, China
2
College of Civil Engineering and Architecture, Wenzhou University, Wenzhou 325035, China
3
Key Laboratory of Engineering and Technology for Tideland Reclamation and Life-Cycle Intelligent Monitoring of Zhejiang Province, Wenzhou 325035, China
4
Key Laboratory of Earthquake Engineering and Engineering Vibration, Institute of Engineering Mechanics, China Earthquake Administration, Harbin 150010, China
5
Key Laboratory of Earthquake Disaster Mitigation, Ministry of Emergency Management, Harbin 150010, China
*
Author to whom correspondence should be addressed.
Buildings 2025, 15(18), 3378; https://doi.org/10.3390/buildings15183378
Submission received: 9 July 2025 / Revised: 14 September 2025 / Accepted: 15 September 2025 / Published: 18 September 2025
(This article belongs to the Special Issue Recycling of Waste in Material Science and Building Engineering)

Abstract

This study investigates the creep behavior of remolded Wenzhou (China) coastal silt through one-dimensional (1D) and triaxial creep tests. Results show that the secondary consolidation coefficient exhibits a non-monotonic response to stress levels, while it decreases with increasing overconsolidation ratios (OCRs). The e-lgt curves reveal four distinct creep stages, and the soil exhibits significant time-dependent behavior that diminishes with depth. Triaxial tests highlight nonlinear stress–strain characteristics, where increasing confining pressure elevates the deviatoric stress required for creep acceleration. A proposed structural parameter exhibits an inverse correlation with creep deformation, which suggests that enhanced soil cementation can improve long-term stability. This finding provides critical insights for the management of silt foundations in Wenzhou.

1. Introduction

Soft soils are widely distributed in China’s coastal regions, especially in the Yangtze River Delta and Pearl River Delta. Wenzhou soft soil, typical of coastal soft soils, exhibits poor engineering properties, including high natural water content, high void ratio, high compressibility, low permeability, and low bearing capacity [1,2,3], which poses challenges for construction. Excessive long-term settlement due to high compressibility is a critical issue [4,5,6,7], such as the widespread “bridge-head bump” problem in Wenzhou (Figure 1). This phenomenon primarily results from long-term uneven settlement, which consists of primary consolidation and creep deformation. Moreover, such soft soils are often treated with ground improvement techniques (e.g., preloading, cement mixing) to mitigate excessive primary consolidation, forming remolded soft soils where creep deformation becomes significant. For instance, secondary consolidation accounts for more than 50% of the total settlement in some sections of the Hangzhou-Ningbo Expressway (HNZ Expwy) and Ningbo-Taizhou-Wenzhou Expressway (NTW Expwy). Therefore, studying the creep behavior of remolded soft soils is essential for understanding the long-term settlement characteristics of improved foundations and ensuring their long-term stability.
In practical geotechnical engineering, soft soil foundations are widely distributed in coastal, deltaic, and alluvial regions, and their inherent high compressibility and low shear strength necessitate targeted treatment and reinforcement before engineering utilization [8,9]. Such interventions—including preloading, deep mixing, or pile-supported embankments—often alter the original consolidation state and induce varying degrees of disturbance in the soft soil structure [10]. These changes directly affect the long-term deformation behavior of the soil, making accurate prediction of settlement and stress distribution critical for ensuring engineering safety and stability [11]. A key challenge in characterizing soft soil deformation lies in its time-dependent creep behavior, which refers to continuous deformation under sustained loading even after primary consolidation is complete [12]. To reliably evaluate long-term settlement, it is essential to incorporate creep characteristics into classical consolidation theory, as neglecting such behavior can lead to significant underestimation of post-construction deformation [8]. Among the parameters governing creep analysis, the secondary consolidation coefficient is particularly critical, serving as a core index for quantifying the rate of long-term deformation in settlement calculations [10]. Creep in soft soils typically manifests as a near-constant settlement rate over extended periods, with its magnitude and duration strongly dependent on external stress conditions [11]. For instance, in loess and soft clay studies, creep deformation has been observed to increase monotonically with rising stress levels, highlighting the stress sensitivity of this behavior [12]. Beyond macroscopic deformation, creep in soft soils is inherently linked to the evolution of excess pore water pressure. During creep, the gradual rearrangement of soil particles induces the generation and subsequent dissipation of excess pore water pressure, which in turn drives additional settlement and influences the overall deformation process [13]. This macroscopic–microscopic interplay underscores the importance of studying microstructure evolution to unravel the mechanistic basis of creep. Numerous studies have confirmed that the macroscopic mechanical properties of silt—including its creep response—are tightly coupled with its microstructural characteristics, such as particle arrangement, pore size distribution, and interparticle bonding [14]. The mechanical behavior of silt under varying stress paths and initial confining pressures is fundamentally governed by changes in its microstructure [15,16,17]. For example, in marine silt, pore water content significantly modulates both microstructure (e.g., pore connectivity and particle aggregation) and macroscopic mechanical strength, often leading to issues such as inadequate bearing capacity and excessive deformation in engineering practice [18]. Under different drainage conditions, the progressive alteration of micropore characteristics (e.g., shrinkage or collapse of large pores) further reveals the microscopic mechanisms underlying soft soil creep [19]. Specifically, creep deformation has been linked to the reorientation of particles and pores, changes in pore interconnectivity, and irreversible grain rolling under sustained loading [20]. Recent advances have also shown that the inelastic strain accumulated during creep can be used to quantitatively characterize the microstructure of geomaterials, providing a potential bridge between microscopic features and macroscopic behavior [21,22].
Despite extensive research on soft soil creep, three critical gaps persist for remolded Wenzhou coastal silt (and analogous coastal remolded silts worldwide). First, existing studies often focus on either macroscopic creep parameters (e.g., secondary consolidation coefficient) or qualitative microstructure observations, but lack a quantitative link between mesoscopic pore evolution (e.g., macropore collapse, shifts in pore size distribution) and macroscopic creep behavior—this limits mechanistic understanding of creep drivers and the reliability of settlement prediction. Second, traditional theory assumes secondary consolidation is a stable, near-linear stage with a constant secondary consolidation coefficient, but limited long-term test data (exceeding 30 days) for remolded silt have prevented validating this assumption, leaving unaddressed a key question: whether prolonged loading triggers an “accelerated secondary consolidation stage” that increases long-term settlement beyond the scope of traditional predictions. Third, while the OCR reduces creep deformation and secondary consolidation rate, the critical OCR value—beyond which further increases no longer significantly lower the secondary consolidation coefficient—has not been quantified for remolded Wenzhou coastal silt. This gap hinders the optimized design of engineering treatments (e.g., preloading intensity), as it prevents cost-effective minimization of long-term settlement.
This study addresses these gaps by conducting comprehensive one-dimensional/triaxial creep tests and mesoscopic analyses (mercury intrusion porosimetry, MIP; scanning electron microscopy, SEM) on remolded Wenzhou coastal silt. It systematically investigates the effects of stress level, overconsolidation ratio, creep duration, and confining pressure, while establishing a link between macroscopic deformation and mesoscopic pore evolution. Its core contributions include: (1) establishing a multi-scale “macroscopic creep–mesoscopic pore” framework that quantifies correlations between macropore collapse (e.g., peak pore diameter reduced from 14.61 μm to 0.64 μm under 1600 kPa) and macroscopic creep parameters; (2) revising creep stage divisions via 90-day tests that identify an “accelerated secondary consolidation stage” (secondary consolidation coefficient increasing from 0.00522 to 0.01139 at 100 kPa), which avoids approximately 20% settlement underestimation; (3) quantifying the critical OCR (OCR = 2), where the secondary consolidation coefficient decreases by 64.18% from OCR = 1 and then stabilizes. The results advance theoretical understanding of remolded coastal silt creep and offer practical guidance for precise settlement prediction and optimized preloading design (e.g., for expressways and bridge approaches) to address the “bridge-head bump” problem and enhance the long-term stability of coastal infrastructure.

2. Experimental Methodology

2.1. Preparation of Wenzhou Remolded Silt Specimens

The remolded soil samples were obtained from a 3–4 m deep excavation at a construction site in Dongtou District, Wenzhou. For creep characterization, three types of test specimens were prepared: one-dimensional creep specimens, triaxial creep specimens, and microstructural observation specimens.

2.1.1. The Basic Physical Properties of Wenzhou Remolded Silt

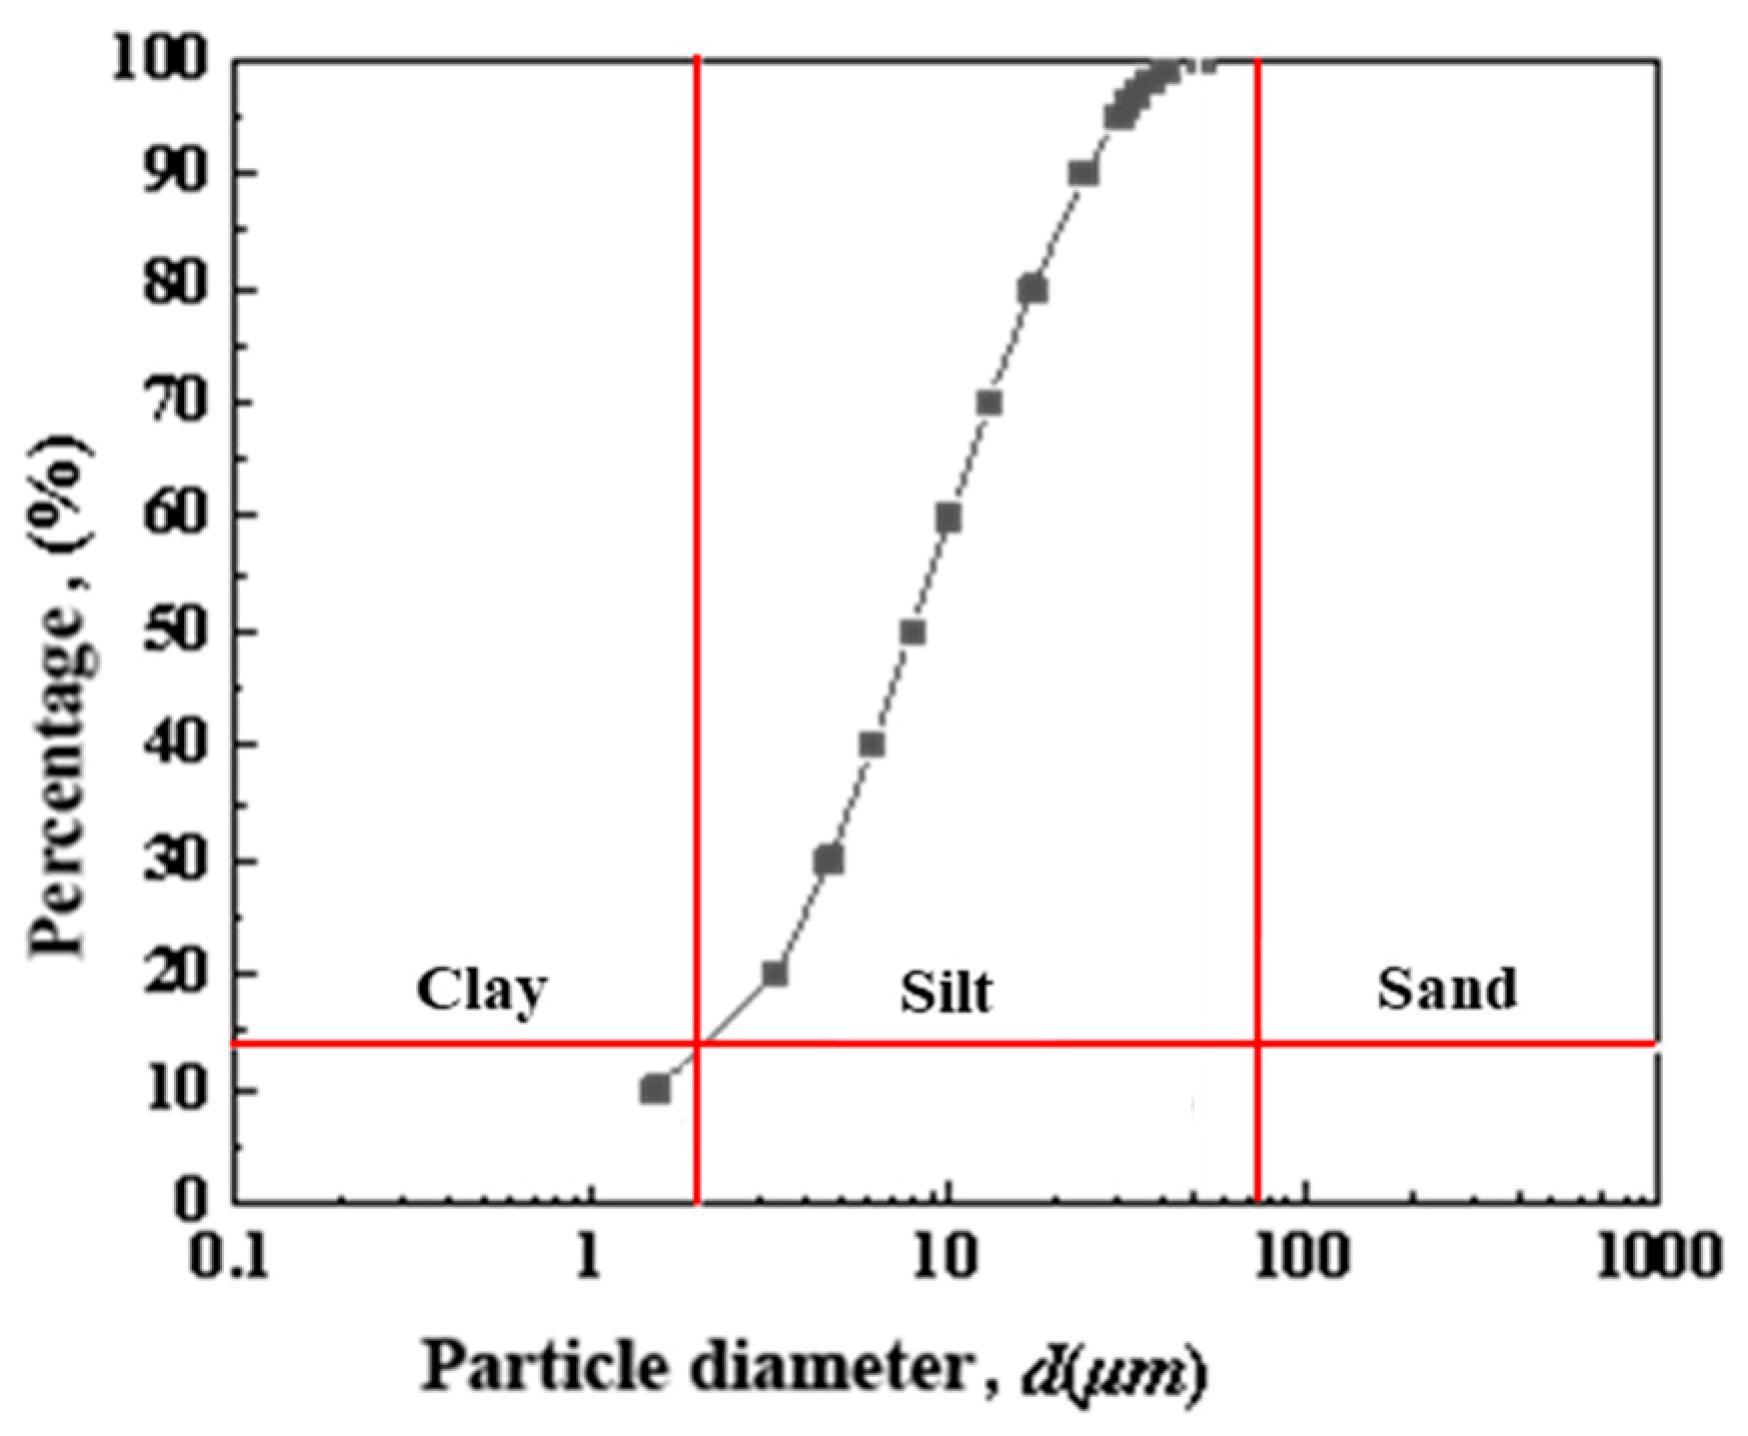
The particle size distribution of the remolded soft soil was determined using a particle size analyzer, as shown in Figure 2. Based on the particle size distribution results in Figure 2 and the Unified Soil Classification System [23], the remolded silt in this study is classified as silty clay. This classification is supported by its particle size composition: the silt fraction (86.53%) is the dominant component, with a minor clay fraction (13.47%). This aligns with the USCS definition of silty clay, which requires silt content >50% and clay content between 10% and 30%.
The void ratio of the soil under each load level can be calculated using one-dimensional consolidation tests and the following Formulas (1)–(3).
e 0 = G S 1 + 0.01 W 0 ρ 0 1 ,
S i = Δ h i h 0 × 1000 ,
e i = e 0 1 + e 0 S i 1000 ,
where e0 is the Initial void ratio of the specimen; GS is the Specific gravity of soil particles (g/cm3); W0 is the Initial water content of the specimen (%); ρ0 is the Initial density of the specimen (g/cm3); S i is the strain under a certain load; ΣΔhi is the Total deformation under a certain load level (mm); h0 is the Initial height of the specimen (mm); ei is the Void ratio under a certain pressure level.
The formulas for calculating the compression coefficient, compression index, and compression modulus are given in Formulas (4)–(6).
a v = e i e i + 1 P i + 1 P i × 10 3 ,
C C = e i e i + 1 lg P i + 1 lg P i ,
E S = 1 + e 0 a ,
where av is the Compression coefficient (MPa−1); CC is the Compression index; Pi is the A unit pressure value (kPa); ES is the Compression modulus (MPa).
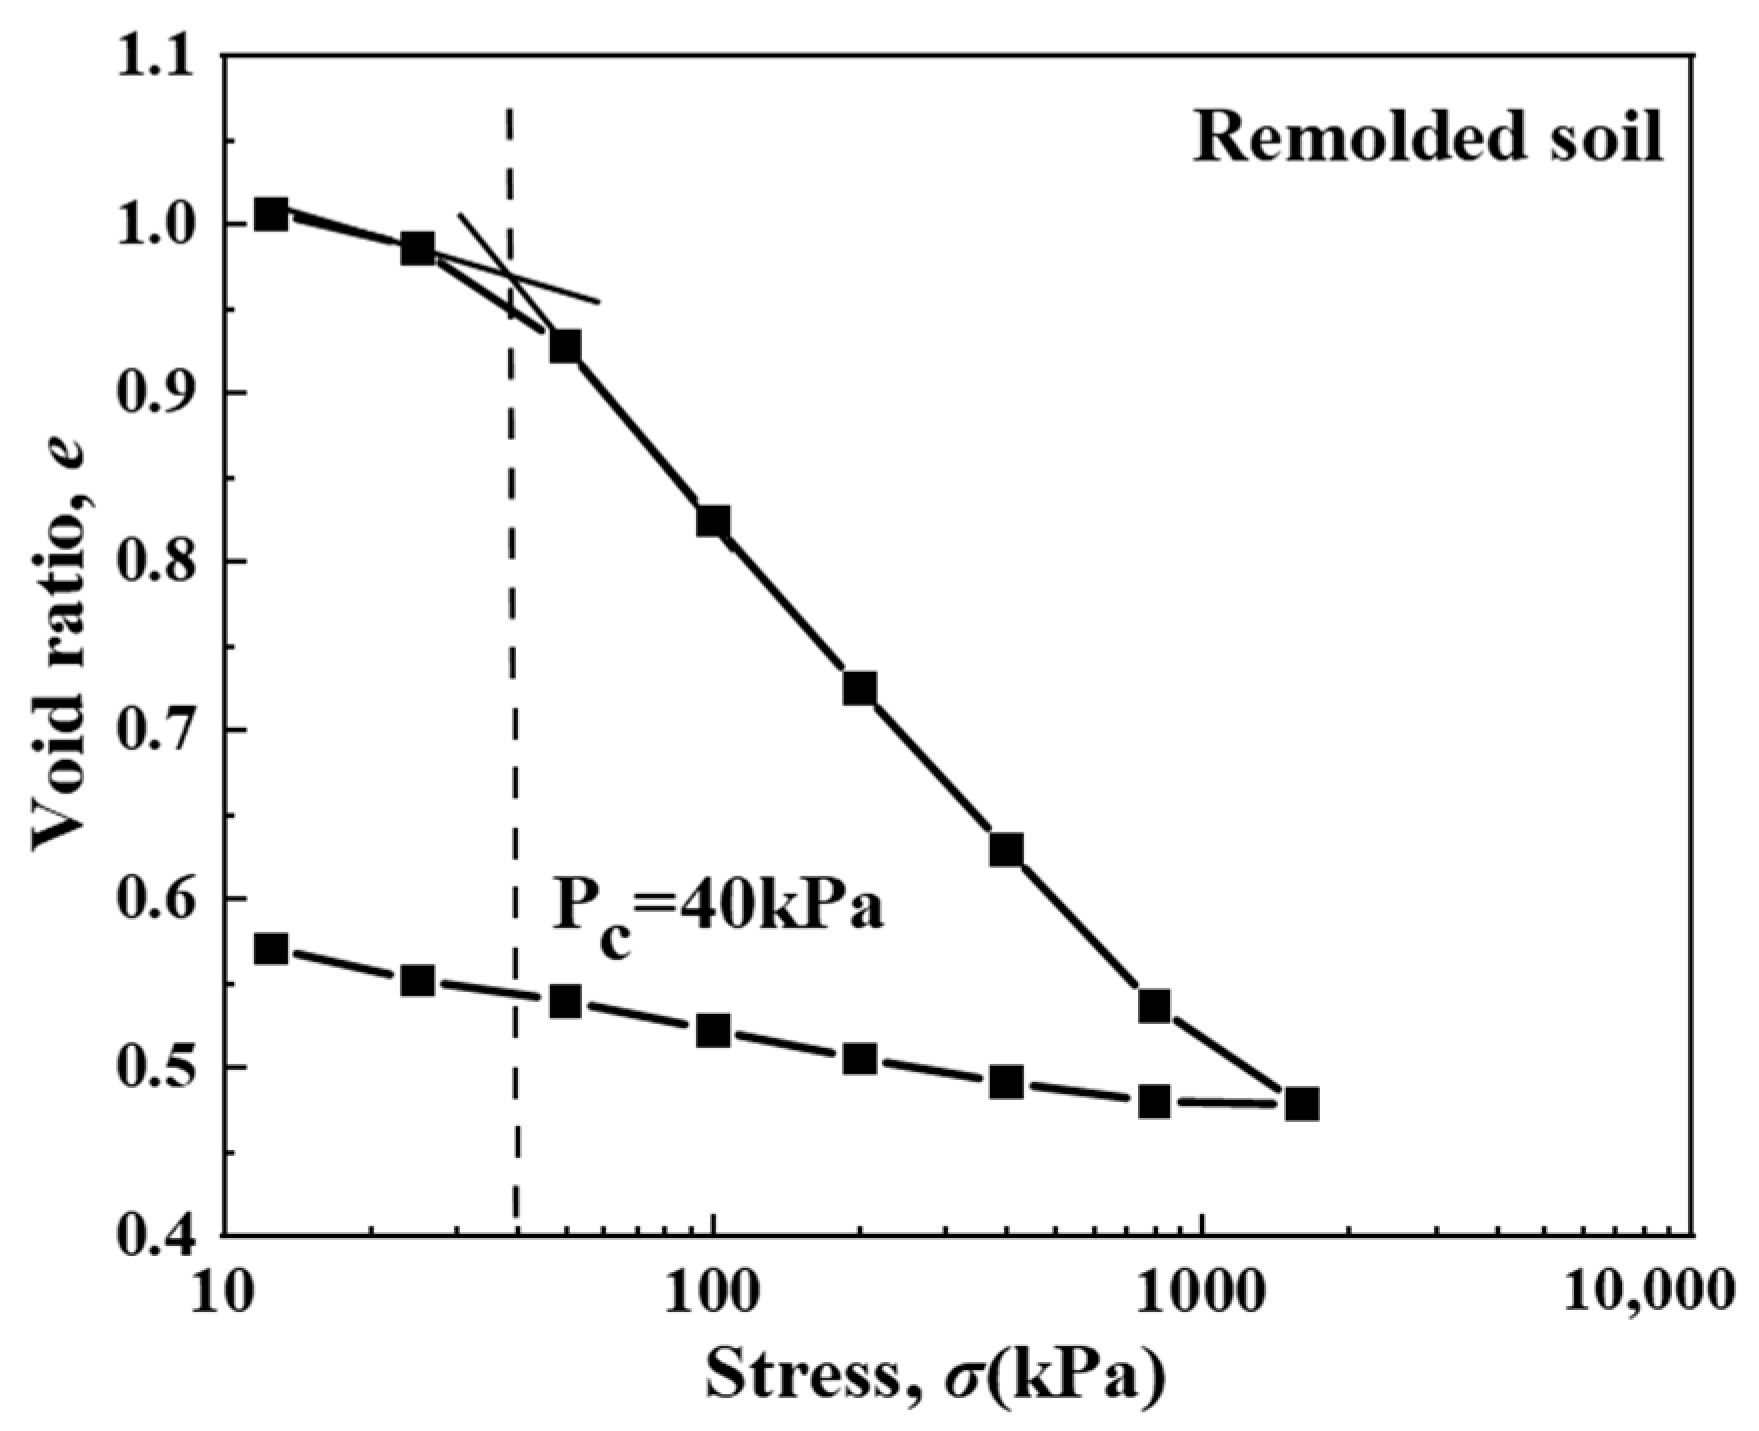
The study conducted multiple one-dimensional consolidation tests on the remolded soil. Figure 3 shows that pore deformation is not significant at low stress values, and the curve is relatively flat. As stress increases, a distinct inflection point appears on the compression curve. Based on the compression–rebound curve, the structural yield stress (preconsolidation pressure) was determined to be 40 kPa. The calculated compression coefficient of the remolded soft soil was 0.99 MPa−1, compression index was 0.329, and compression modulus was 1.843 MPa. The measured parameters collectively demonstrate the soil’s high compressibility.

2.1.2. Sample Preparation Process

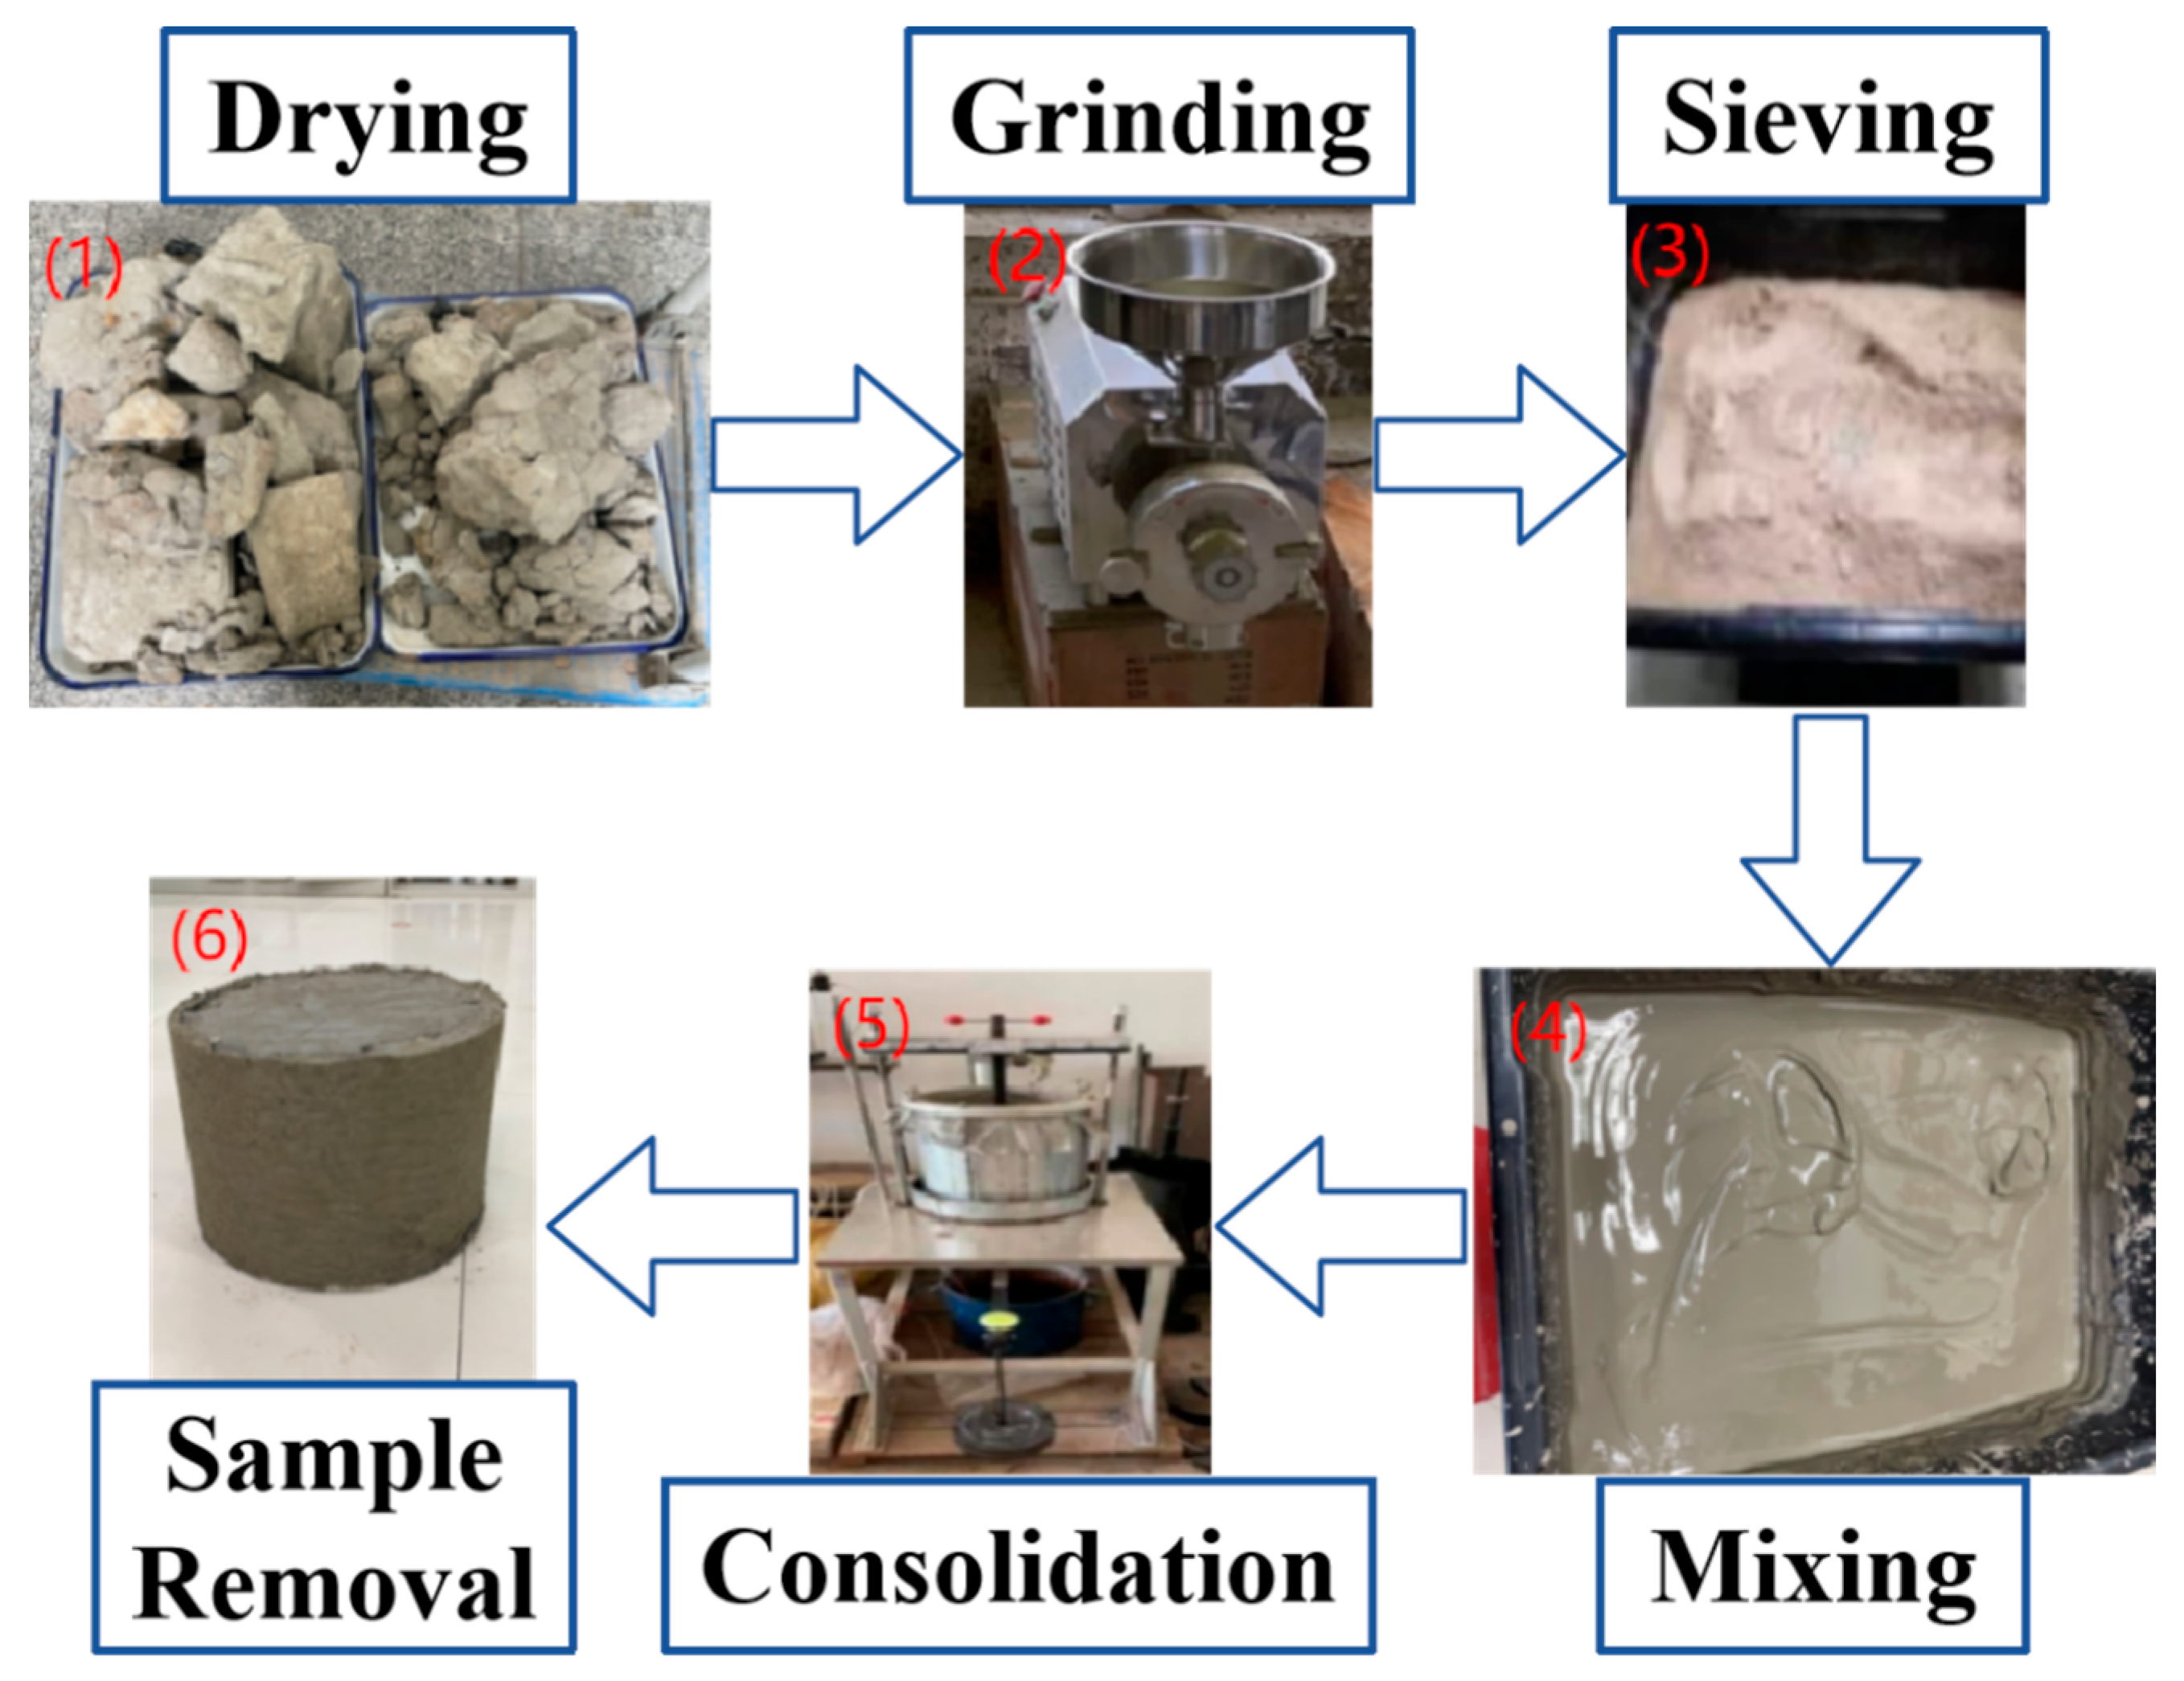
The remolded soil samples were prepared using a large-scale consolidometer (WG-3A type, inner diameter: 300 mm, height: 400 mm, thickness: 10 mm, lever ratio: 1:9) following a standardized procedure that adheres to the general technical requirements for remolded soil sample preparation in geotechnical creep tests, consistent with the guidelines outlined in Standard for Soil Test Methods (GB/T 50123-2019, China) [24] and ASTM D2435 [25] (Standard Test Method for One-Dimensional Consolidation Properties of Soils)—these standards specify uniform particle gradation, controlled moisture content, and incremental loading consolidation to simulate in situ stress states, ensuring the uniformity and consistency of prepared samples (Figure 4). The preparation process involved six steps: (1) drying the original soil at 105 °C for more than 24 h; (2) coarsely crushing the soil with a large crusher, followed by finely grinding it using a HYZ220 mill (Beijing Huanya Tianyuan Machinery Technology Co., Ltd., Haidian District, Beijing, China); (3) vibration sieving until obtaining a 0.03 mm powder; (4) mixing 24 kg of soil powder with de-aired water to form a slurry at 1.5 times the liquid limit (43.7%, Table 1), homogenized by an electric mixer—24 kg of soil powder ensures sufficient material to fill the WG-3A consolidometer and avoid edge effects during subsequent cutting, while 1.5× liquid limit slurry enables full dispersion of soil particles (preventing agglomeration) and effective compaction, helping replicate the natural “high water content, high void ratio” characteristics of Wenzhou coastal silt; (5) loading the slurry into the consolidometer for incremental loading consolidation (Table 2) lasting 14 days, with the final consolidation pressure (50 kPa) matching the preloading stress level of typical local soft soil foundations; (6) extracting cylindrical remolded soft soil samples (diameter: 30 cm, height: 28 cm) after consolidation. The entire preparation process targets replicating the “disturbed but stabilized” state of Wenzhou coastal silt after engineering treatments (e.g., preloading or deep mixing)—a common post-treatment state in local infrastructure projects (e.g., expressways, bridge approaches mentioned in Section 1). Post-consolidation, the remolded soil has a water content of 35.41% and initial void ratio of 0.96–1.07 (Table 1), consistent with the post-treatment in situ water content (30–40%) and void ratio (1.0–1.2) of undisturbed Wenzhou coastal silt reported in local geotechnical investigation data, ensuring test results support long-term settlement analysis for such treated foundations.

2.1.3. One-Dimensional Creep Sample Preparation Procedure

The sample preparation procedure for the 1D creep test on remolded soft soil is illustrated in Figure 5. A prepared remolded soil block was placed on a smooth ground glass plate, and a thin layer of Vaseline was applied to the inner wall of a stainless steel cutting ring (inner diameter: 61.8 mm, height: 20 mm, in accordance with the Chinese standard GB/T 50123-2019). The ring was then pressed vertically downward at a constant speed, and excess soil around the ring was trimmed with a sharp spatula until the soil surface was flush with the ring’s top and bottom edges. Circular filter papers (diameter: 61.8 mm, matching the cutting ring) were placed on both the top and bottom surfaces of the soil specimen. The assembled specimen (height: 20 mm, diameter: 61.8 mm) was then saturated under vacuum for 24 h to ensure full saturation—this is a prerequisite for 1D creep tests to eliminate errors caused by entrapped air. Finally, the saturated specimen was ready for 1D creep testing.

2.1.4. Preparation Procedure for Three-Dimensional Specimens

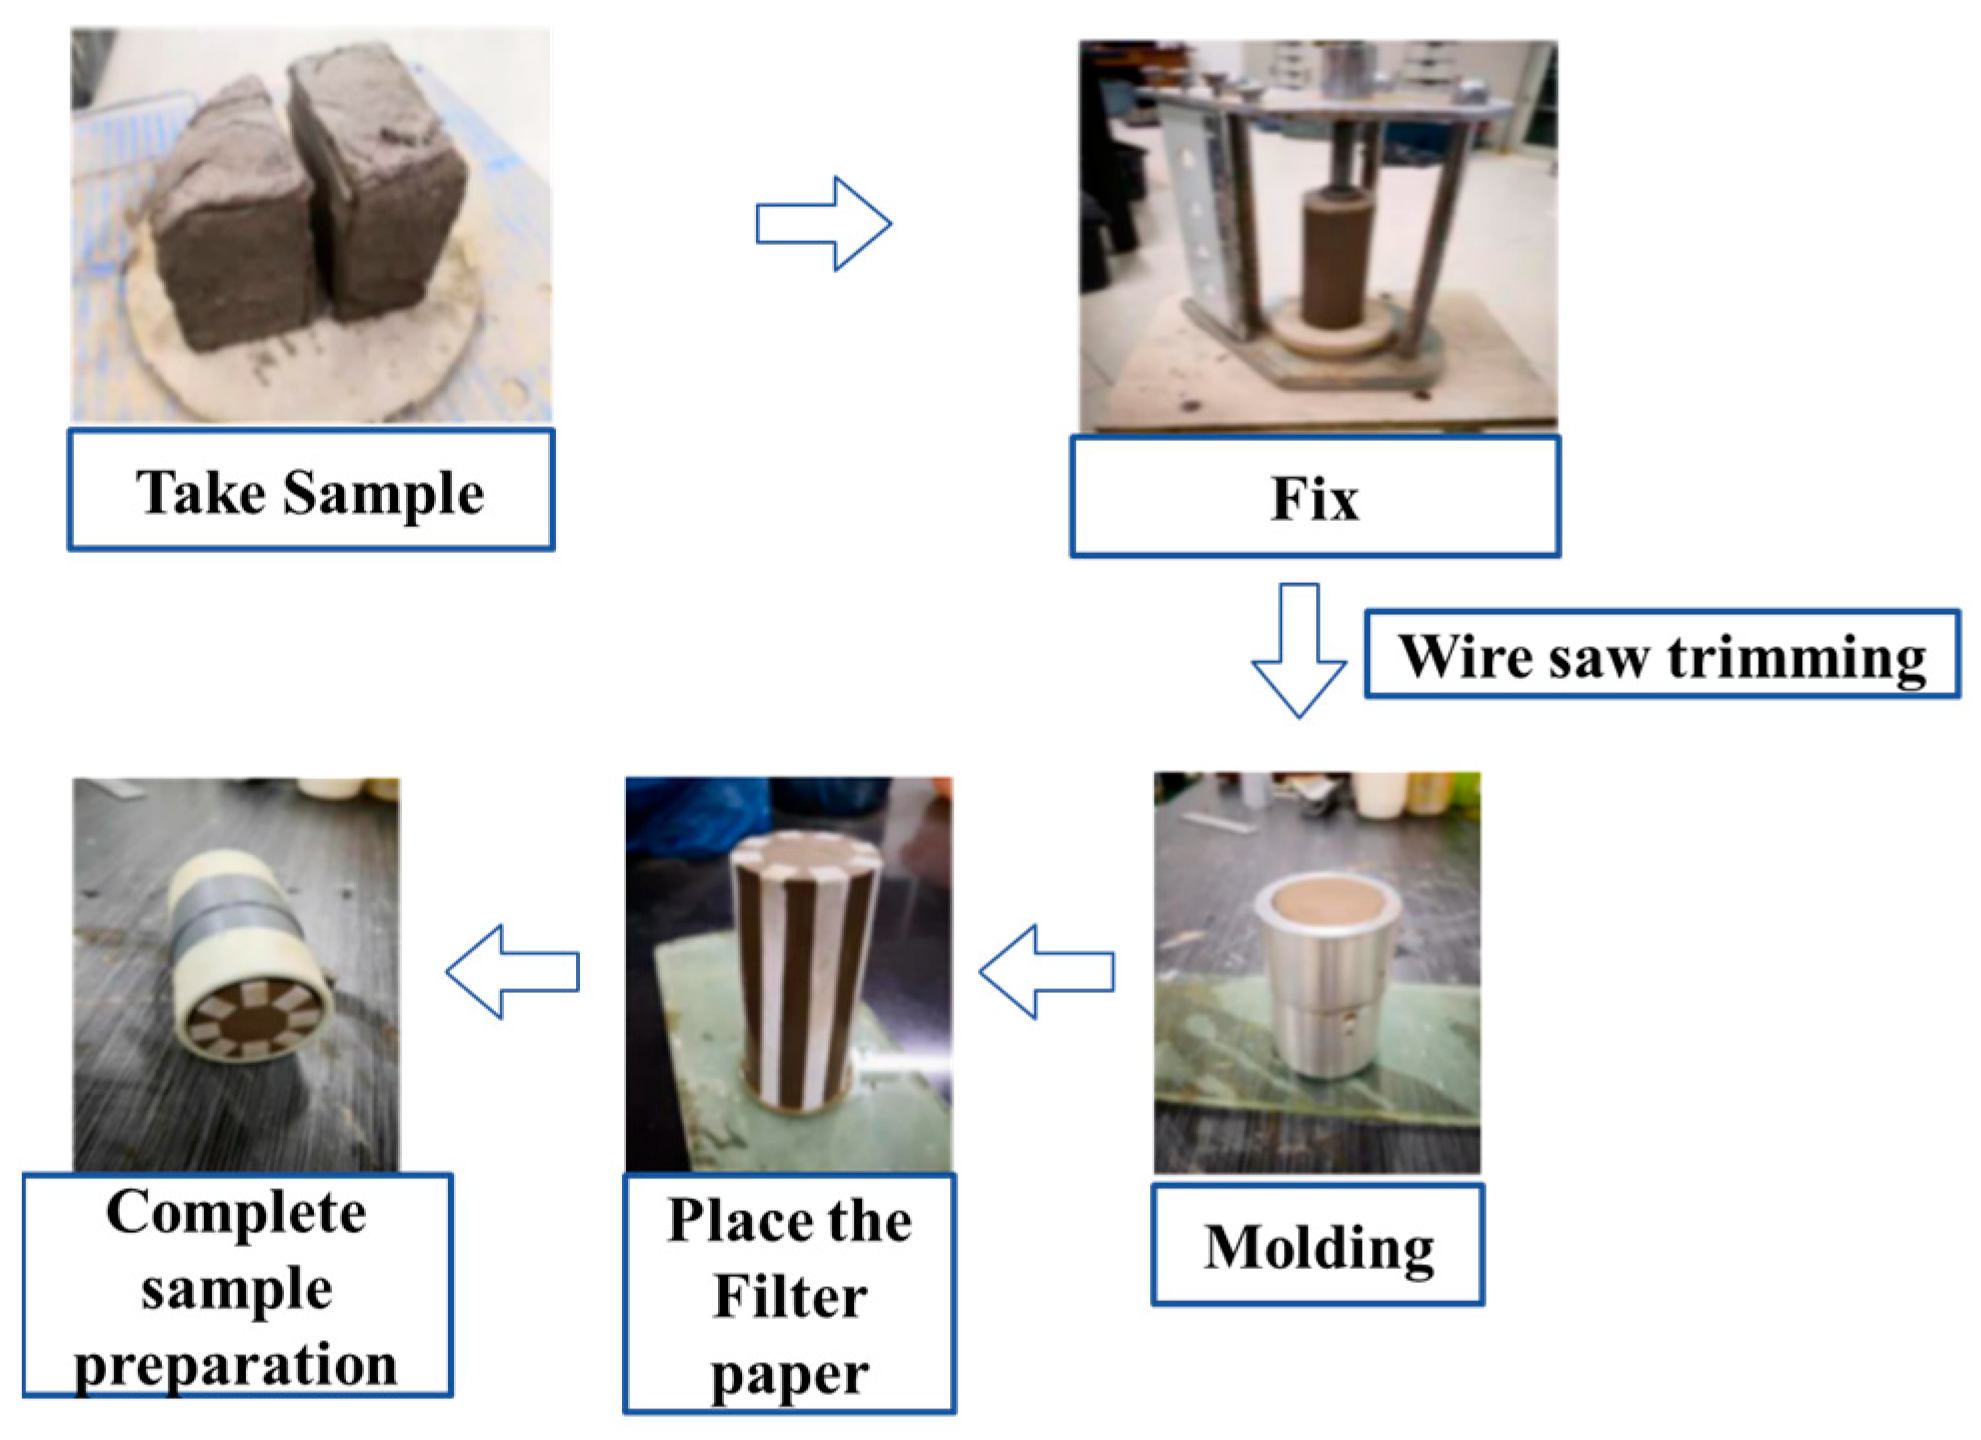
The preparation process of remolded soft soil triaxial specimens is illustrated in Figure 6, with the main steps detailed as follows: First, for specimen pre-trimming, cut a large block from the prepared remolded soft soil, with dimensions 5–10 mm larger than the target specimen size to allow subsequent trimming and avoid insufficient material. Second, conduct rough shaping by fixing the soil block on a soil trimming machine and using a wire saw to trim excess soil around the block from top to bottom, continuing until a cylindrical form with distinct, unbroken edges is formed (no soil fragmentation is allowed to prevent specimen damage). Third, perform fine trimming: use a sharp trimming knife to carefully scrape the edges of the preform along the vertical guide rod of the trimming machine from bottom to top, ensuring the specimen forms a smooth-sided cylinder with a diameter of 38 mm and height of 76 mm (height-to-diameter ratio = 2:1), which conforms to the standard for triaxial shear tests. Finally, carry out membrane assembly: (1) attach filter paper strips (width: 10 mm, length: 76 mm) vertically along the outer surface of the trimmed specimen—one strip every 120° around the specimen circumference—to facilitate pore water drainage during triaxial testing; (2) pre-inspect the rubber membrane (thickness: 0.2 mm) for defects (e.g., pinholes, cracks) under a light source and discard any membranes with defects to prevent pressure leakage; (3) cover the intact rubber membrane onto the inner wall of the membrane sleeve cylinder, carefully lower the specimen into the cylinder to avoid membrane damage, and finally seal both ends of the membrane with rubber O-rings (diameter: 38 mm) to complete the triaxial specimen preparation.

2.1.5. Preparation Process of Mesoscopic Test Specimens

The microscopic test requires special sample preparation to ensure uncontaminated surfaces, structural integrity, and minimal deformation. Since the test must be conducted under high vacuum conditions, freeze-drying was adopted for sample preparation (Figure 7). To obtain stable structural observation surfaces, the specimen was sectioned into small blocks (approximately 12 mm × 12 mm × 10 mm) with flat observation planes. The samples were rapidly immersed in liquid nitrogen (−196 °C) for flash-freezing (10 min) to vitrify soil moisture into amorphous ice while preventing ice crystal formation. Subsequently, the samples were transferred to a pre-cooled (−80 °C) freeze-dryer, where vacuum sublimation drying was conducted at ≤5 Pa. Primary drying was maintained at −40 °C for ice sublimation, followed by gradual warming to 25 °C for bound water removal, ultimately yielding dry soil specimens with preserved original pore structures. This ultra-rapid freezing coupled with low-temperature vacuum sublimation effectively prevents structural collapse induced by conventional drying methods [26].

2.2. Test Equipment

2.2.1. One-Dimensional Consolidometer

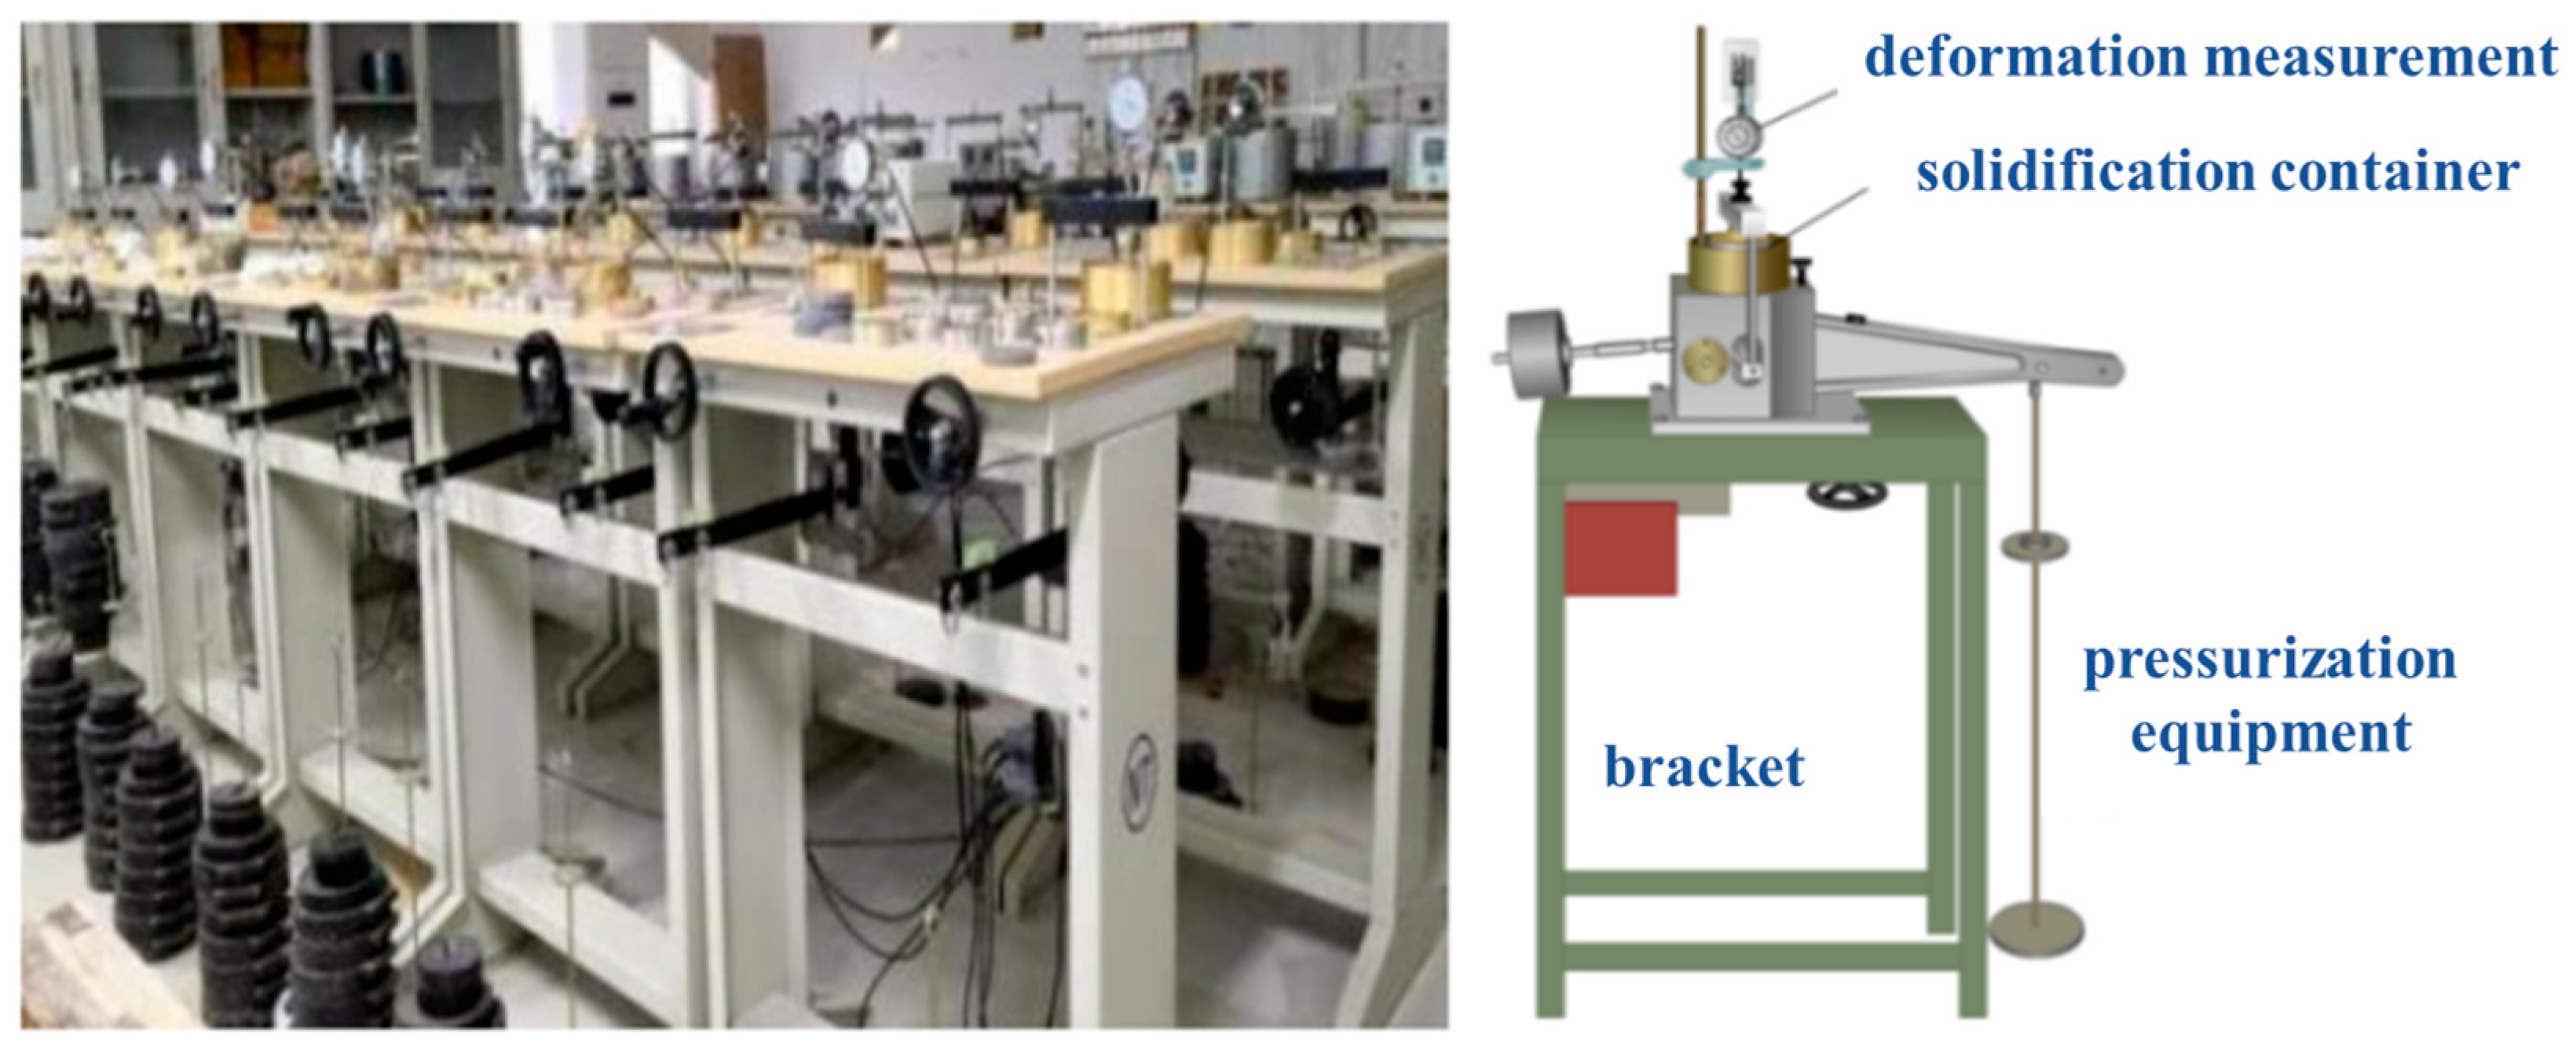
One-dimensional consolidation creep tests were conducted using a WG-2A dual-lever consolidometer (Jiangsu Shuyang Municipal Engineering Instrument Co., Ltd., Suqian, China), as shown in Figure 8. The specimen area was 30 cm2, specimen height was 2 cm, lever ratio was 1:12, and pressure range was 12.5~1600 kPa.

2.2.2. Triaxial Apparatus

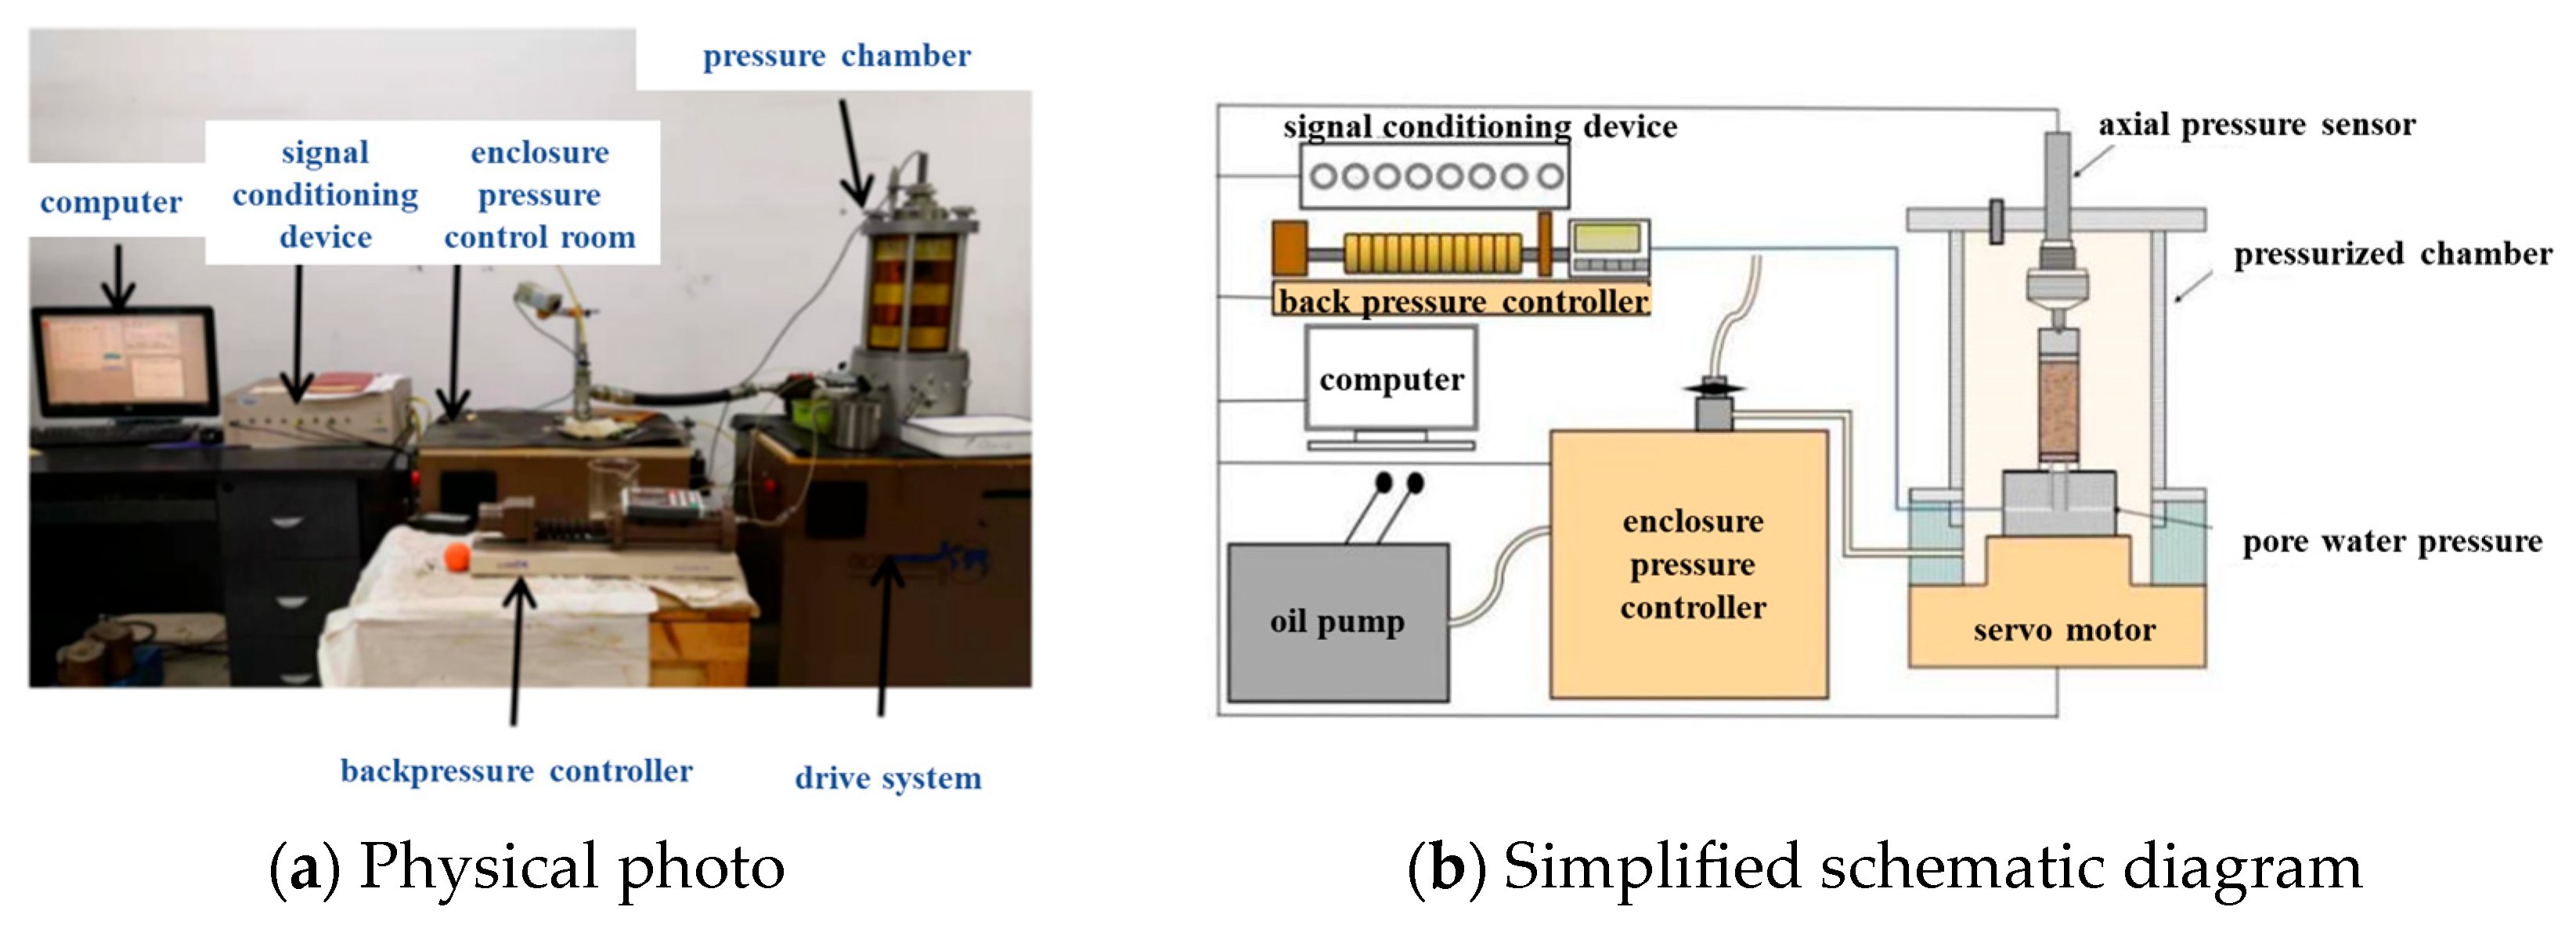
The triaxial creep test equipment used was the dynamic triaxial system (DYNTTS, GDS Instruments, Leicester, UK), as shown in Figure 9a. The system consists of an oil pump, confining pressure controller, servo motor, computer, Distributed Control System (DCS) signal conditioning device, back pressure controller, pressure chamber, etc. Figure 9b is a schematic diagram of the triaxial system. The oil pump fills and drains oil from the pressure chamber, controlled by the confining pressure controller. The drive system controls the servo motor to apply axial force. The back pressure controller provides back pressure. Data from the axial force sensor, pore pressure sensor, confining pressure sensor, and displacement sensor are transmitted to the computer via the DCS conditioning device. Main technical parameters are shown in Table 3.

2.2.3. Mesostructural Test Equipment

The main equipment used for mesostructural observation in this paper is shown in Figure 10Figure 10a on AutoPore IV 9500 (Micromeritics Instrument Corporation, Norcross, GA, USA)mercury intrusion porosimeter (MIP) and Figure 10b on SEM (scanning electron microscope). Specific parameters of the MIP are listed in Table 4. The magnification range of the scanning electron microscope is 20–30,000 times, with a resolution better than 30 nm.

2.3. Test Plan and Procedures

2.3.1. One-Dimensional Creep Test Plan

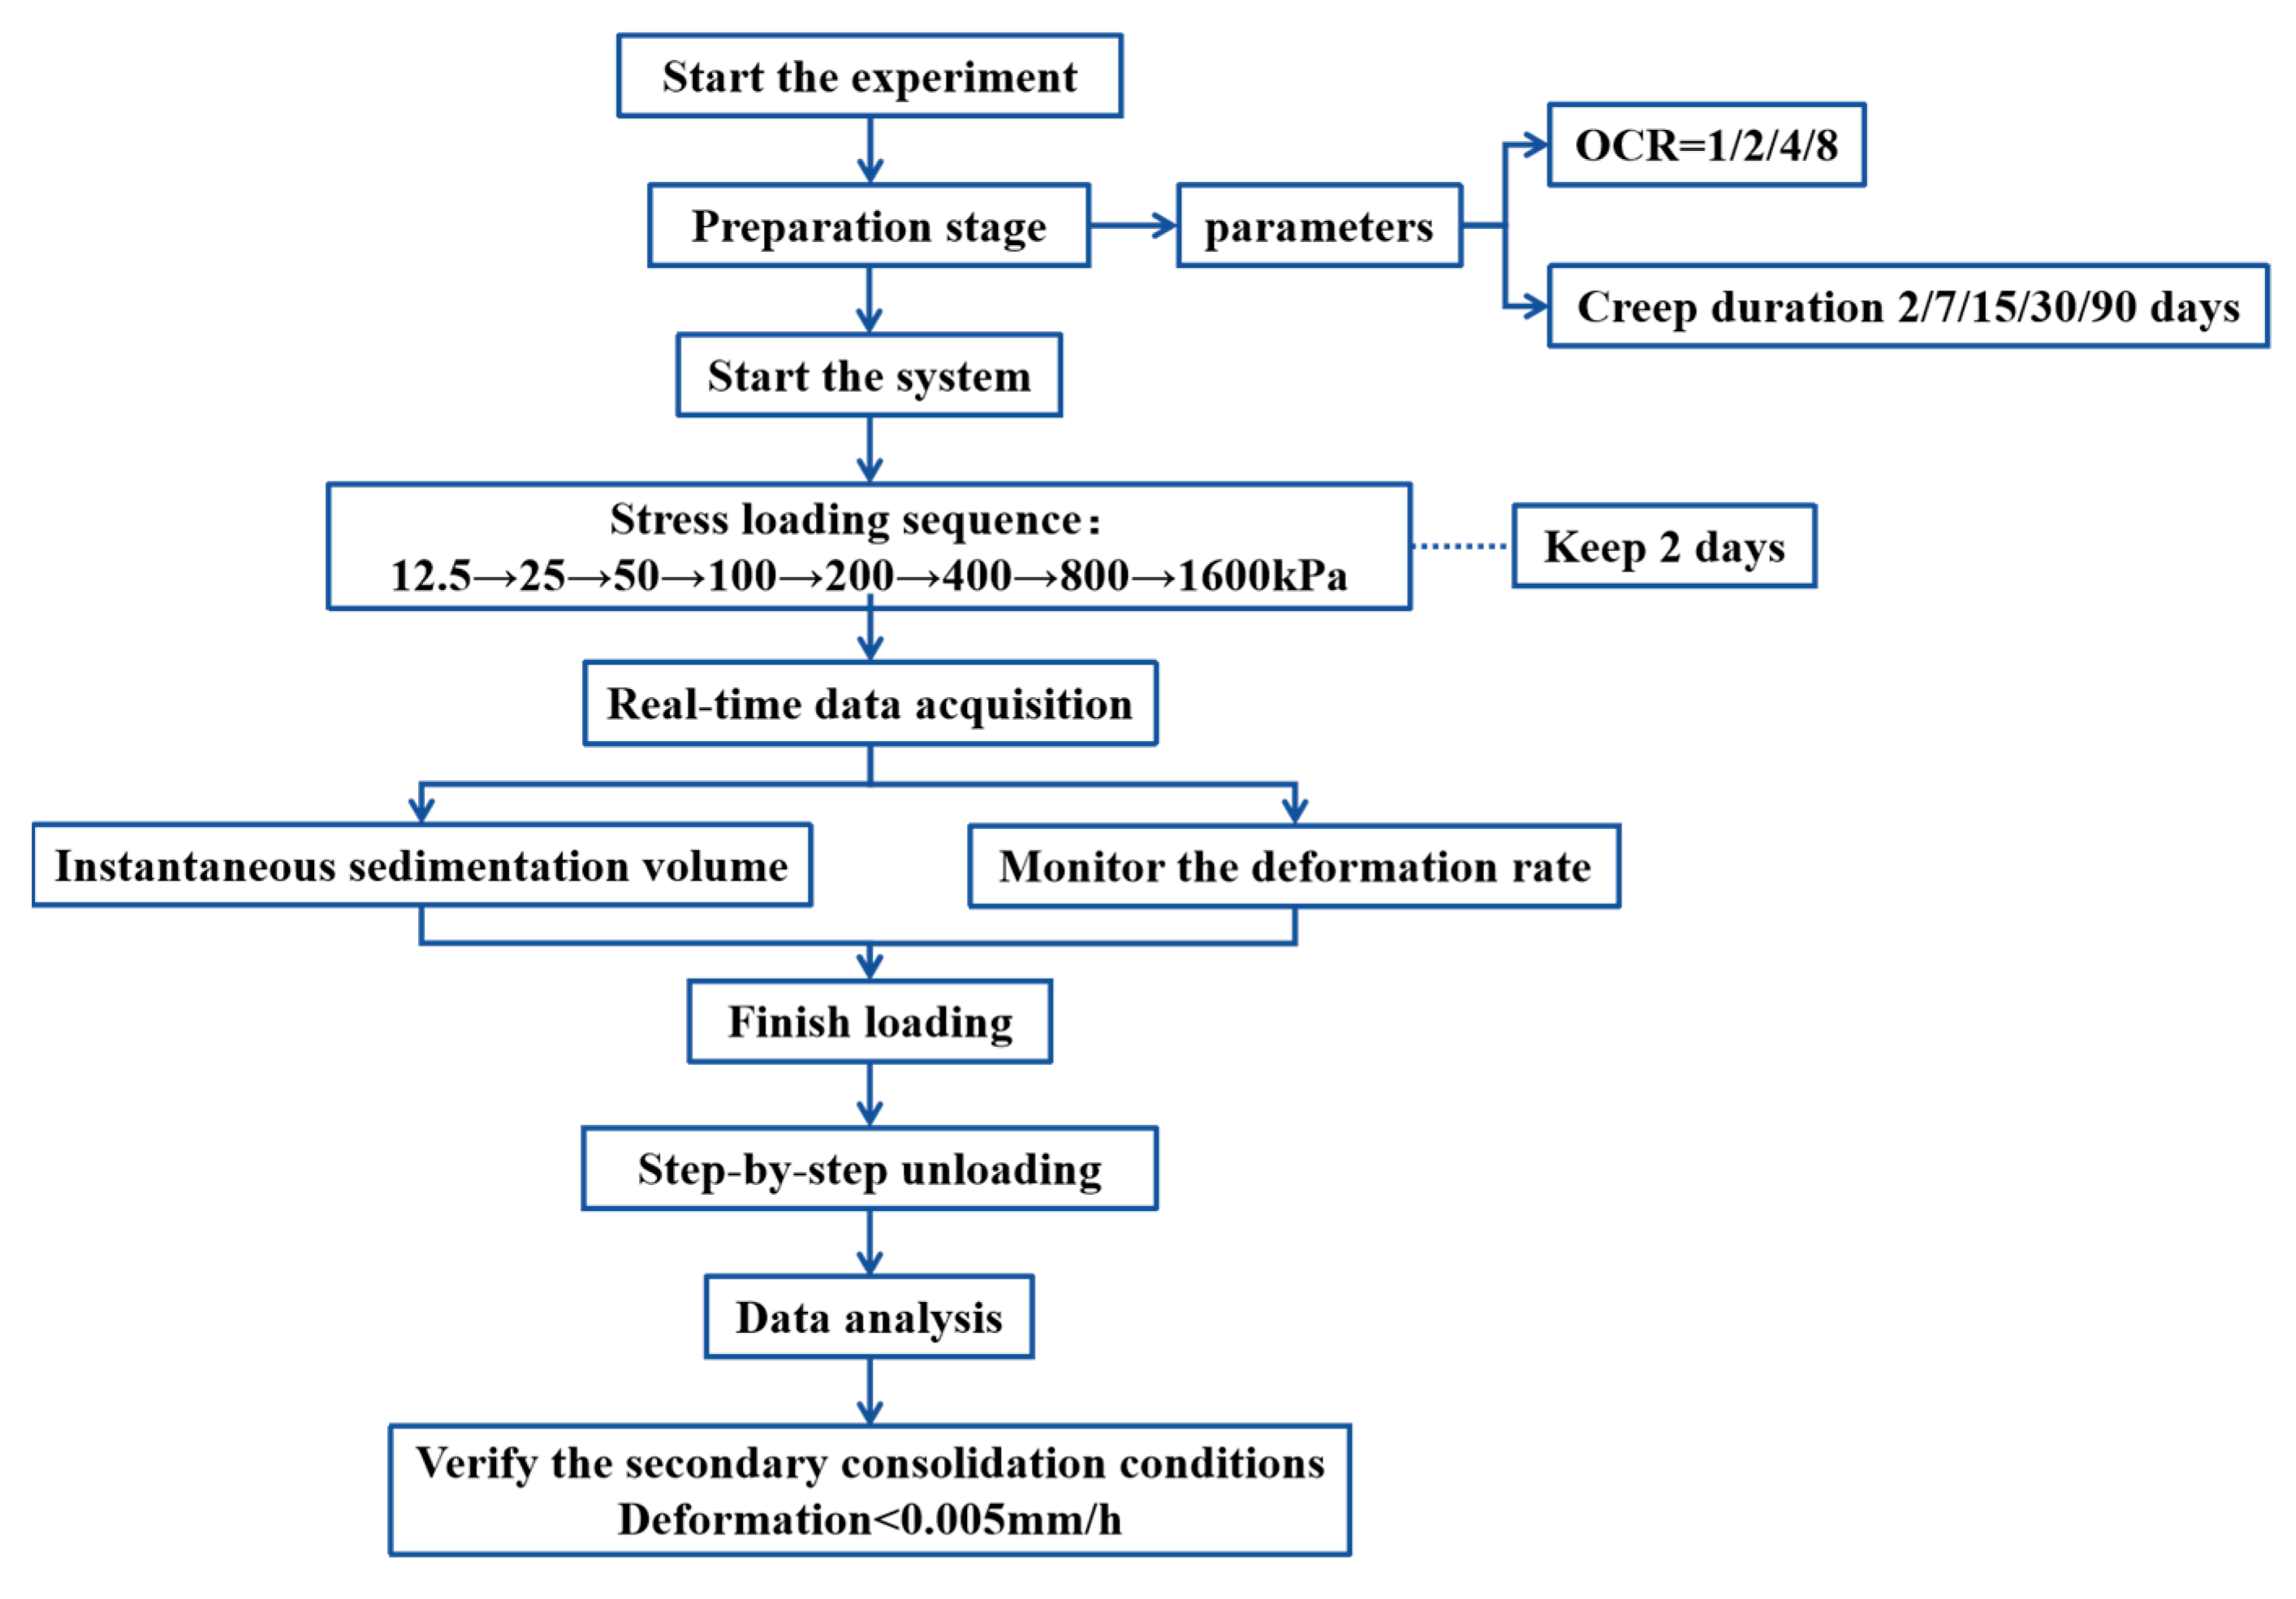
The one-dimensional creep tests primarily considered factors such as stress level, OCR, and time. The vertical stress variation range was 12.5 kPa–1600 kPa; OCR included four cases: OCR = 1, 2, 4, 8; creep durations were 2 days, 7 days, 15 days, 30 days, and 90 days. The one-dimensional creep test plan for remolded soft soil is shown in Table 5.
The 1D creep test employed a stress-controlled step loading protocol, with a loading rate of 1 kPa/s (to avoid instantaneous soil structure damage). For each test group—designed to investigate different vertical stresses, OCR, and creep durations (note: the data in Table 5 specifically correspond to the maximum vertical stress in the stepwise loading sequence of each group)—the vertical stresses were applied sequentially at 12.5, 25, 50, 100, 200, 400, 800, and 1600 kPa. Each stress level was maintained for 2 days to collect deformation data: instantaneous settlements were recorded every minute for the first 30 min after each loading increment (to capture rapid initial deformation), and then at 1 h intervals thereafter (to monitor long-term creep). Upon completion of the 2-day holding period for the final stress level (1600 kPa), stepwise unloading was performed at the same rate as loading (1 kPa/s), following the reverse sequence of the applied stresses (1600 → 800 → … → 0 kPa). The results indicated that secondary consolidation was attained at each stress level when the vertical deformation rate remained below 0.005 mm/h for 6 consecutive hours after the 2-day holding period.

2.3.2. Three-Dimensional (Triaxial) Creep Test Plan

Before triaxial creep testing, the samples were first subjected to vacuum saturation. The saturation degree calculation formula is shown in Equation (7).
S r = w s r G s e
where Sr is the Saturation degree of the specimen (%); wsr is the Water content of the specimen after saturation (%); Gs is the Specific gravity of soil particles.
This section of tests considered the influence of confining pressure on creep. The specific loading scheme is shown in Table 6. According to the test requirements, after deformation stabilized under a certain confining pressure σ3, the deviatoric stress q was increased step by step until the specimen underwent creep failure.

2.3.3. Mesostructural Test

In this thesis, mesostructural tests (MIP and SEM) were performed on Wenzhou remolded soft soil under one-dimensional creep test conditions, including the initial state before testing and specimens after testing under various conditions. Figure 11 illustrates the Test procedure.

3. One-Dimensional Creep Characteristics of Remolded Soft Soil

3.1. Influence of Stress Level

3.1.1. Void Ratio–Time Relationship

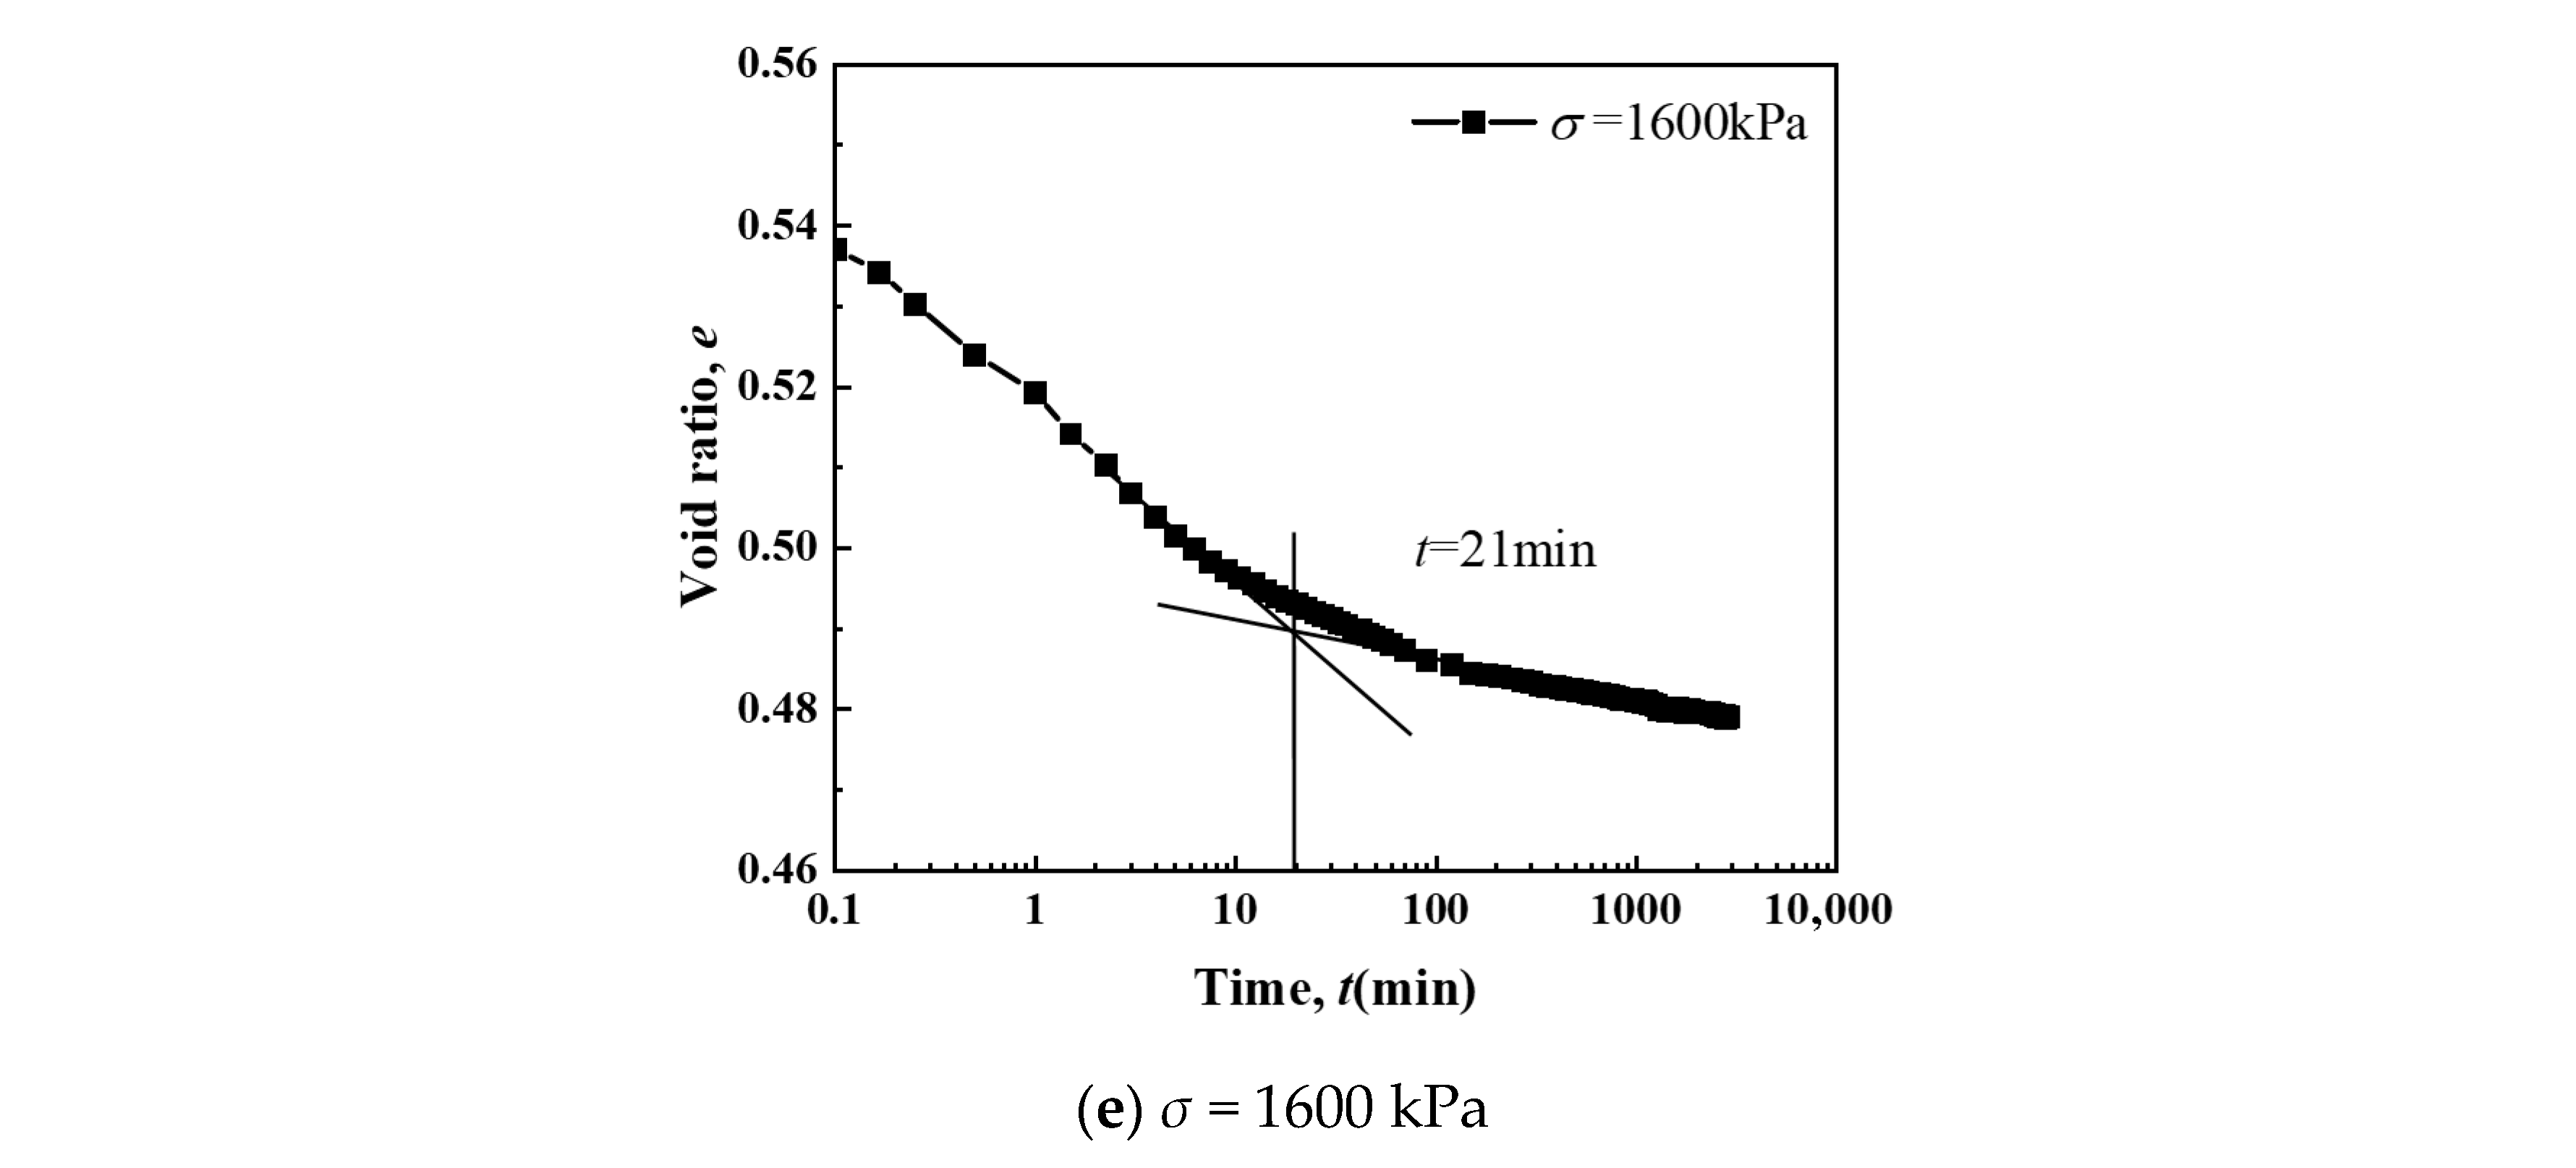
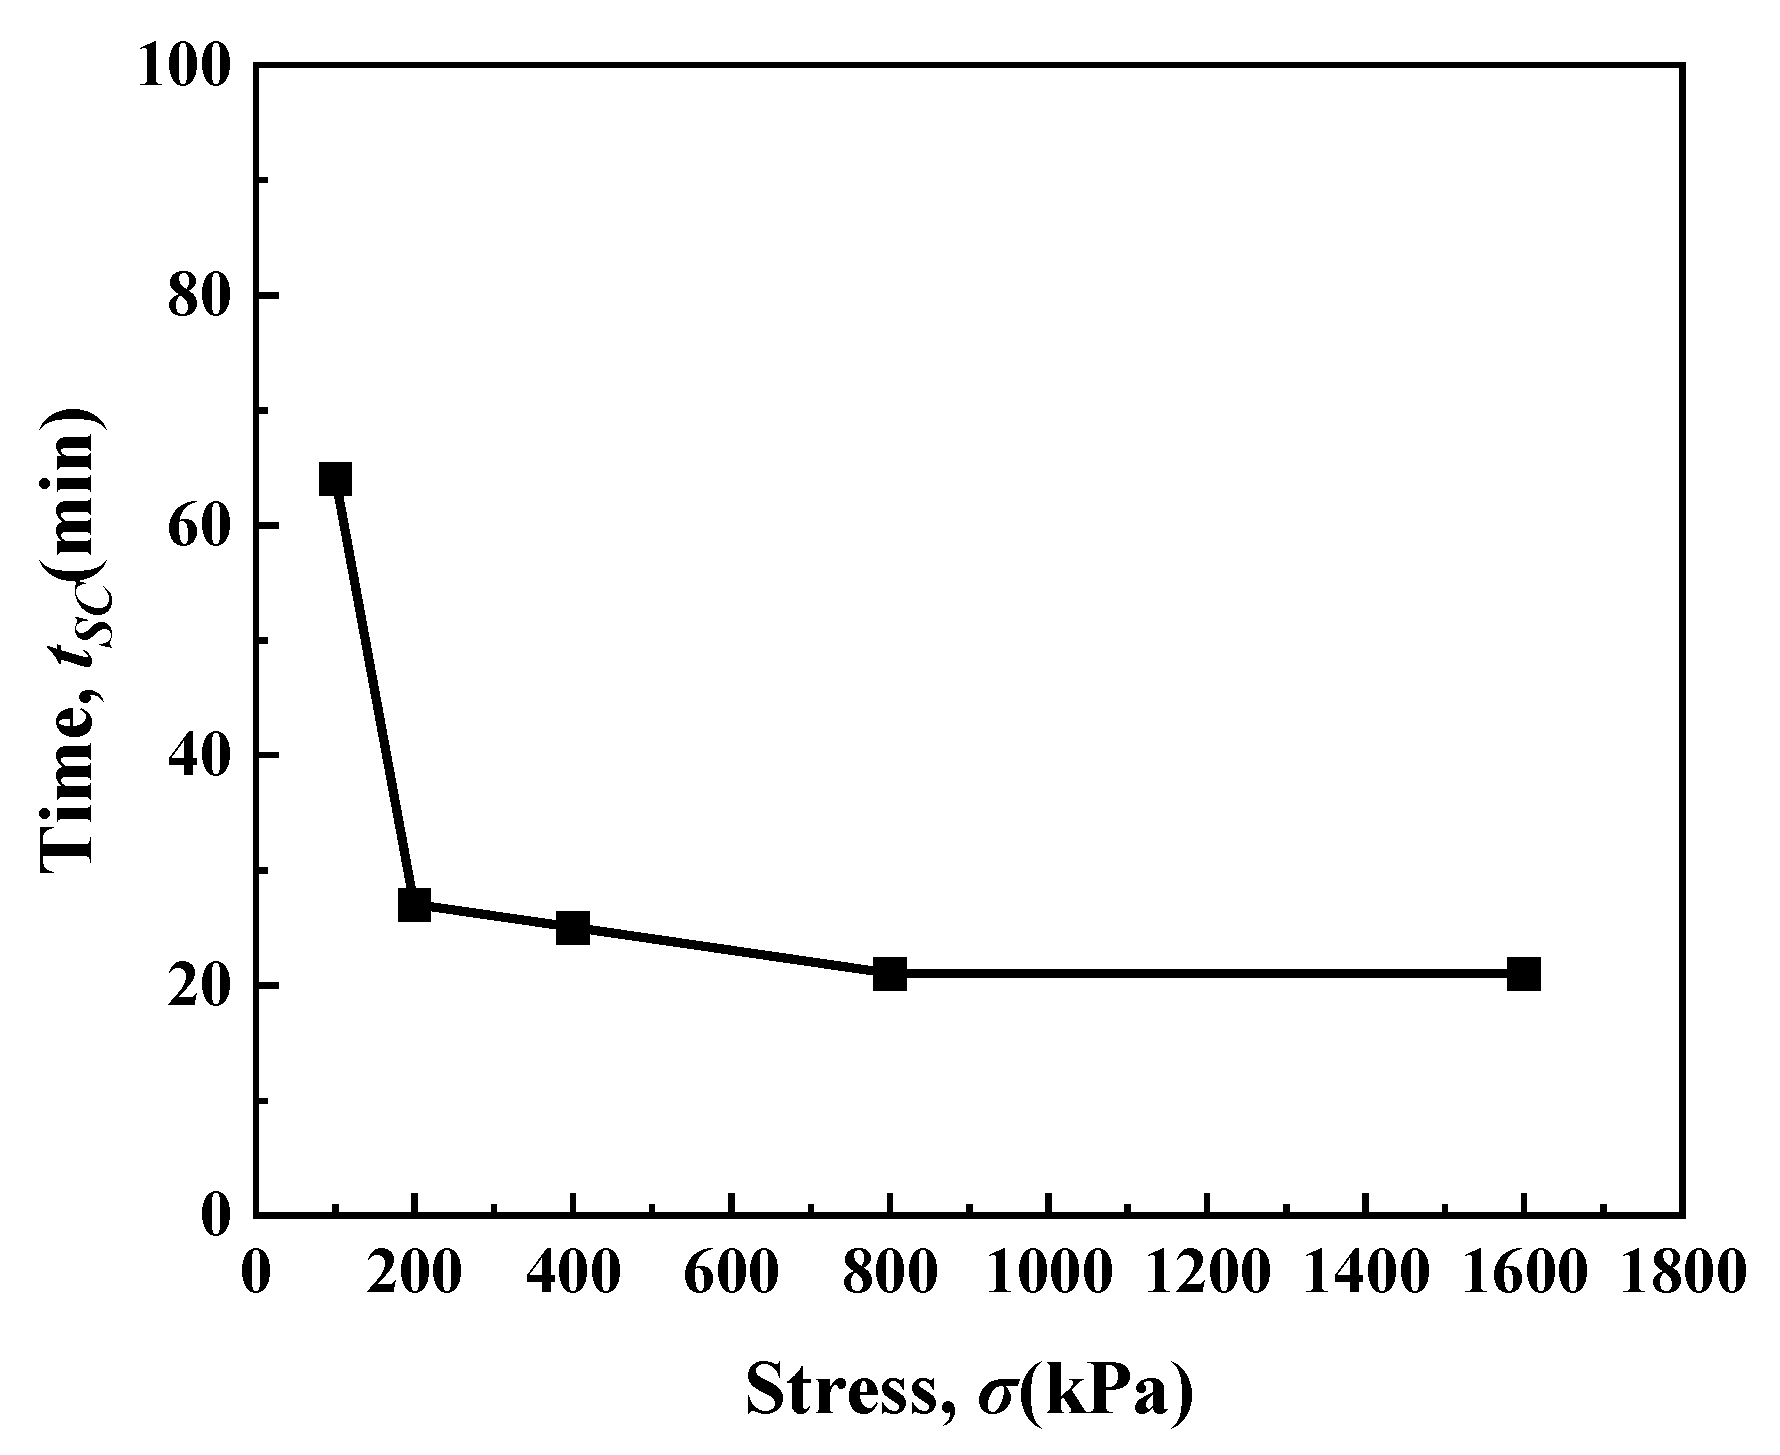
Figure 12 presents the void ratio–time relationships of remolded silt under different stress levels via stepwise loading. The results demonstrate a progressive decrease in void ratio with increasing load. The e-lgt curves of remolded silt under various stress levels all exhibit distinct inverse-S shapes with clear inflection points that demarcate the transition between primary and secondary consolidation. Soil mechanics principles indicate that the primary consolidation phase is characterized by an initially rapid decrease in void ratio, gradually transitioning to slower rates. The appearance of inflection points marks the onset of secondary consolidation, where the curves become nearly linear with minimal slopes. Experimental results revealed the transition times at vertical stresses of 100, 200, 400, 800, and 1600 kPa to be 33, 27, 25, 21, and 21 min, respectively.
To further investigate the consolidation characteristics, Figure 13 presents the relationship between the secondary consolidation initiation time (tsc) and vertical stress. The results demonstrate a clear trend of decreasing tsc with increasing vertical stress. This behavior can be attributed to enhanced soil densification under higher stresses, which accelerates the primary consolidation process and consequently leads to earlier transition into the secondary process.

3.1.2. Secondary Consolidation Coefficient

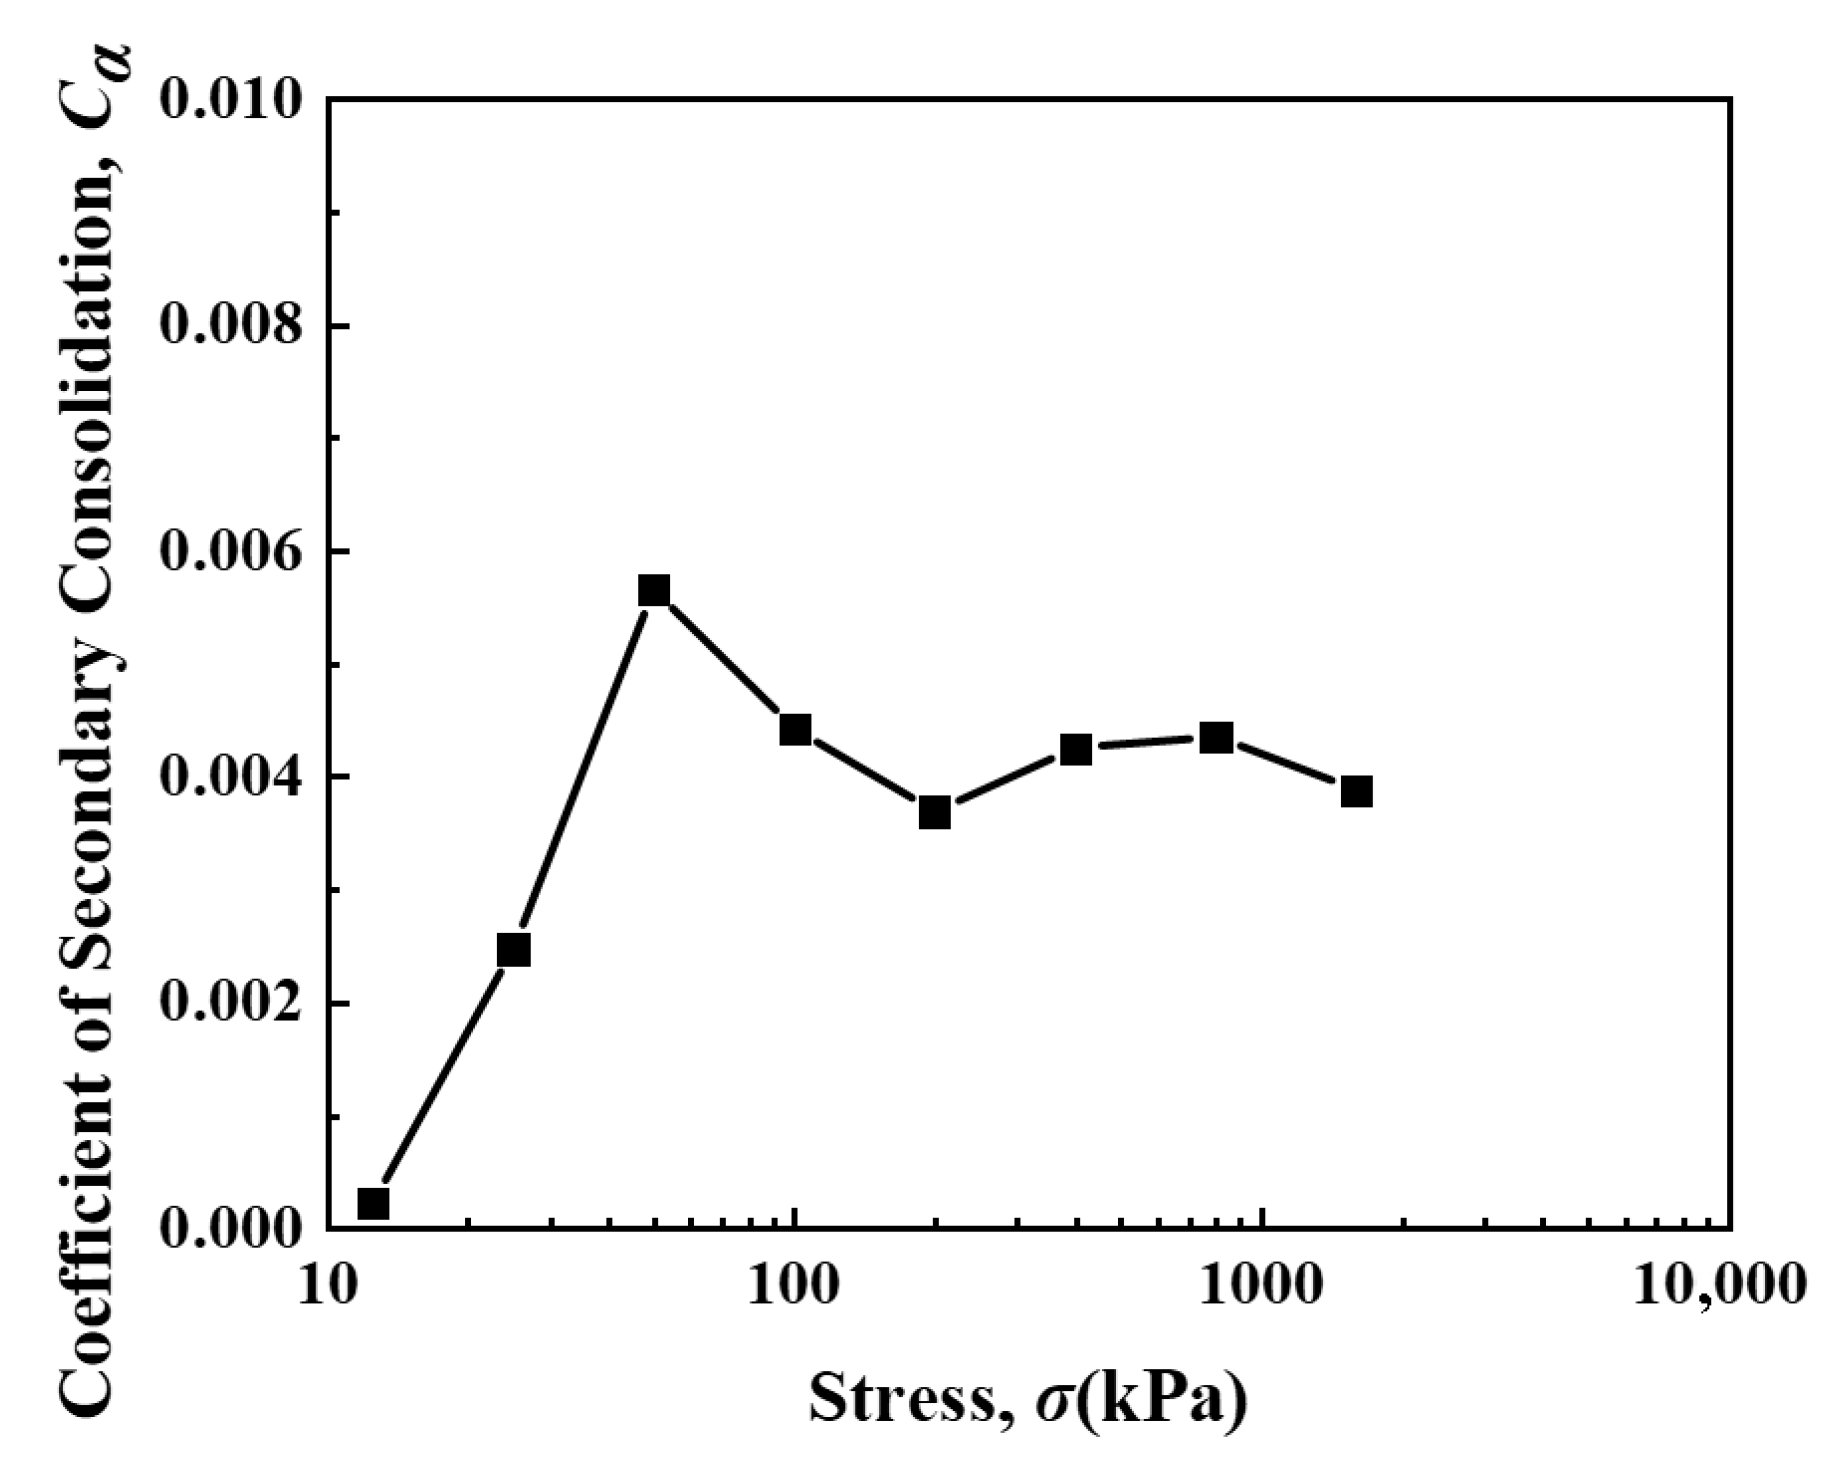
Figure 14 shows the relationship curve between the secondary consolidation coefficient and stress level. As shown in Figure 14, as vertical stress increases, the secondary consolidation coefficient first increases rapidly, then gradually decreases and finally stabilizes. The maximum value occurs near 50 kPa for the remolded soft soil, approximately 0.006. When the vertical stress is greater than 100 kPa, the secondary consolidation coefficient stabilizes around 0.004. There is a critical stress value: when the stress exceeds this value, the influence of stress level on the creep characteristics of remolded soft soil can be neglected in engineering analysis.

3.2. The Influence of OCR

3.2.1. Porosity-Time Relationship

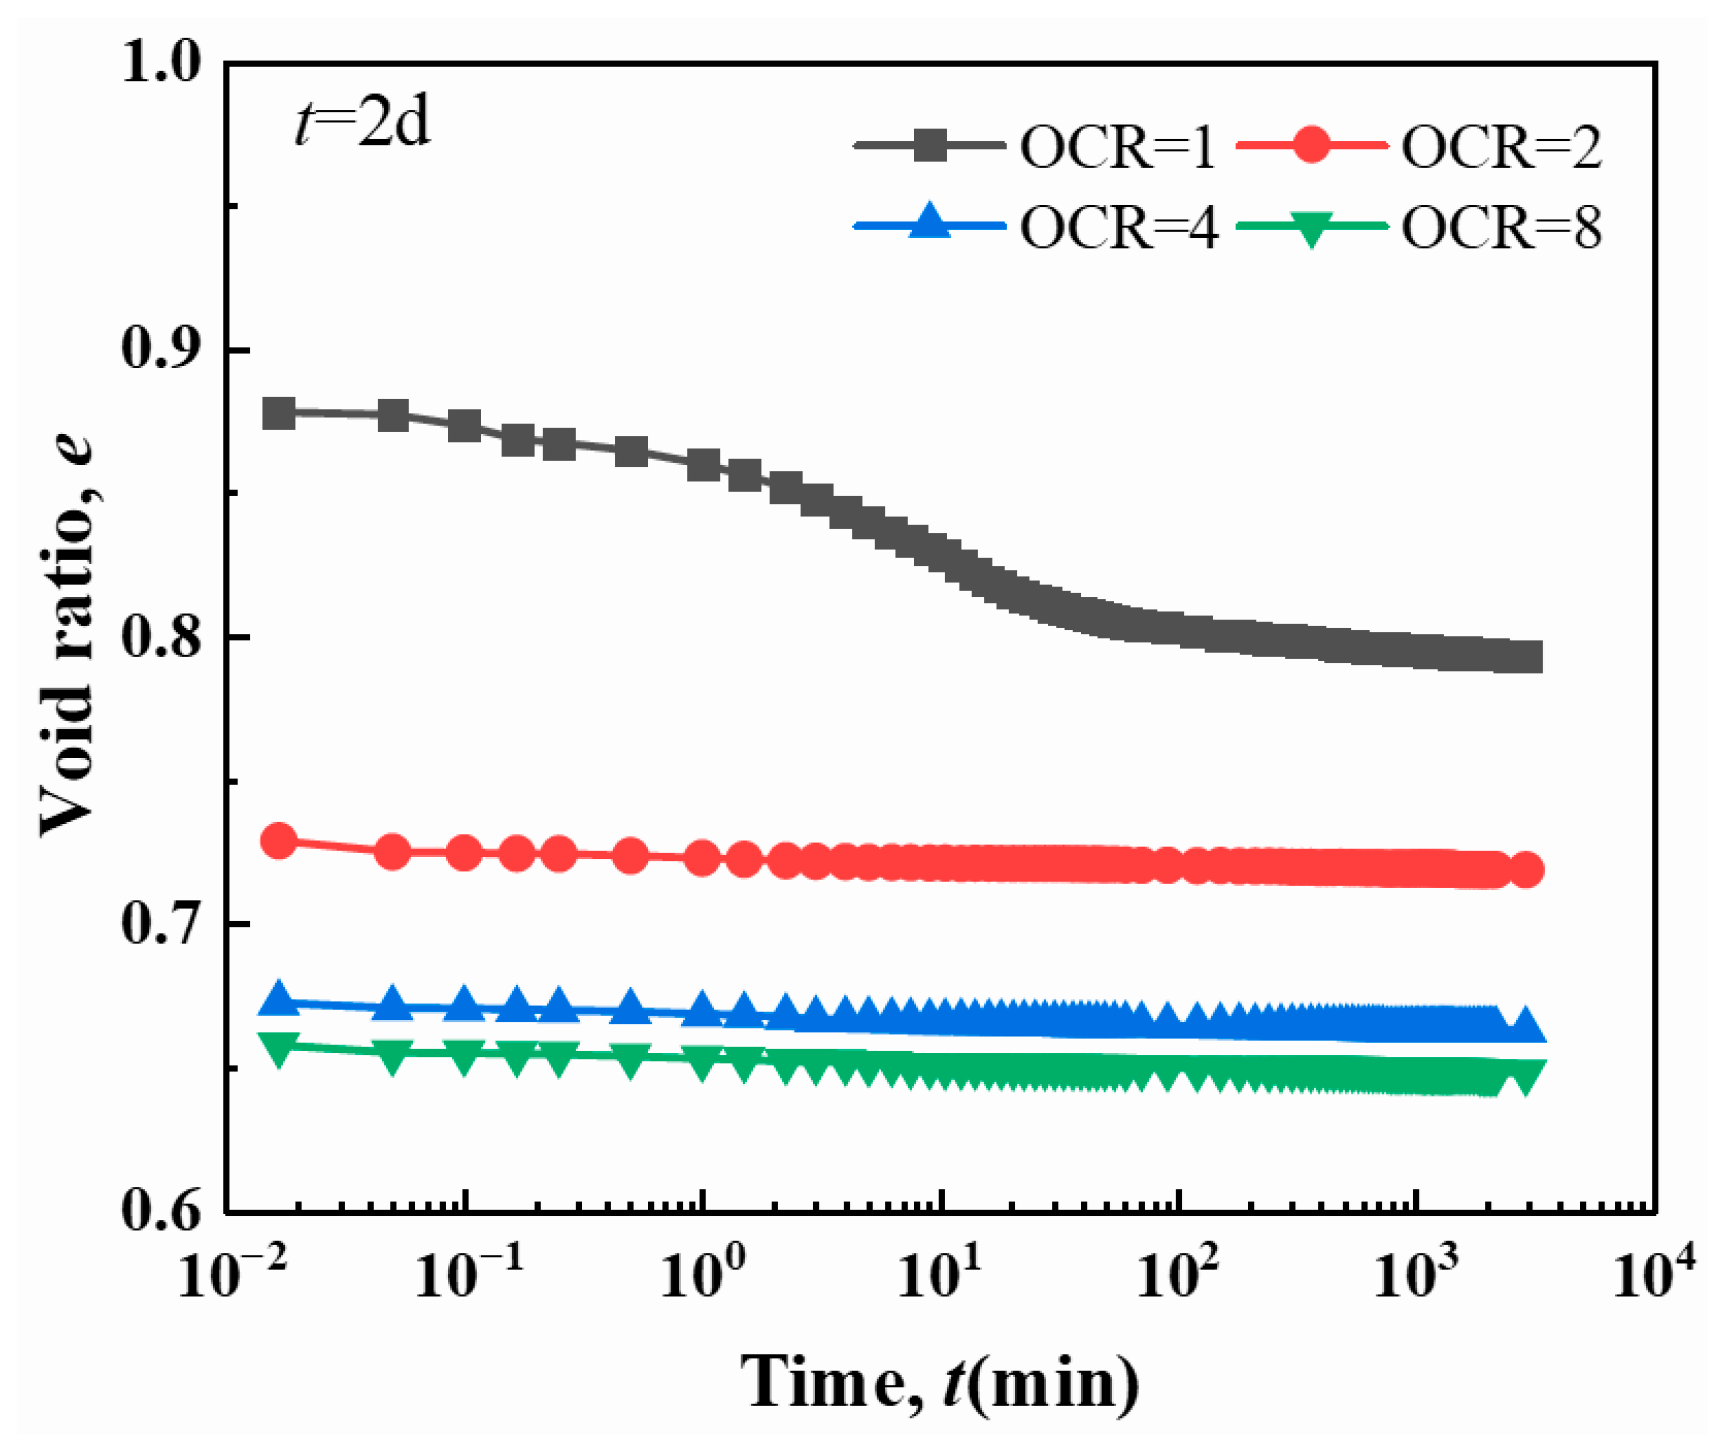
Creep tests were conducted on remolded soft soil under a vertical stress of 100 kPa at different OCRs, and the e-lgt curves are shown in Figure 15. Comparing the test curves under different OCRs, it was found that as the OCR increases, the void ratio gradually decreases, and the rate of change in void ratio over time also diminishes rapidly.
For OCR = 1, 2, 4, and 8, the void ratio ranges were 0.878–0.793, 0.729–0.719, 0.673–0.663, and 0.658–0.648, with corresponding variations of 0.085, 0.01, 0.01, and 0.01, respectively. This indicates that under the same load, the higher the degree of overconsolidation, the less compressible the remolded soil becomes.
Figure 16 further presents the e-lgt curves of remolded soft soil under different OCRs, respectively. As shown in Figure 16, when OCR = 1, the time tsc corresponding to the secondary consolidation starting point is 33 min, while when OCR = 2, 4, 8, the change in void ratio is relatively small and the secondary consolidation starting point tsc is not obvious. The above results indicate that the greater the OCR, the smaller the initial void ratio of the soil, and the denser the soil, resulting in the creep phenomenon becoming less and less obvious.

3.2.2. Secondary Consolidation Coefficient

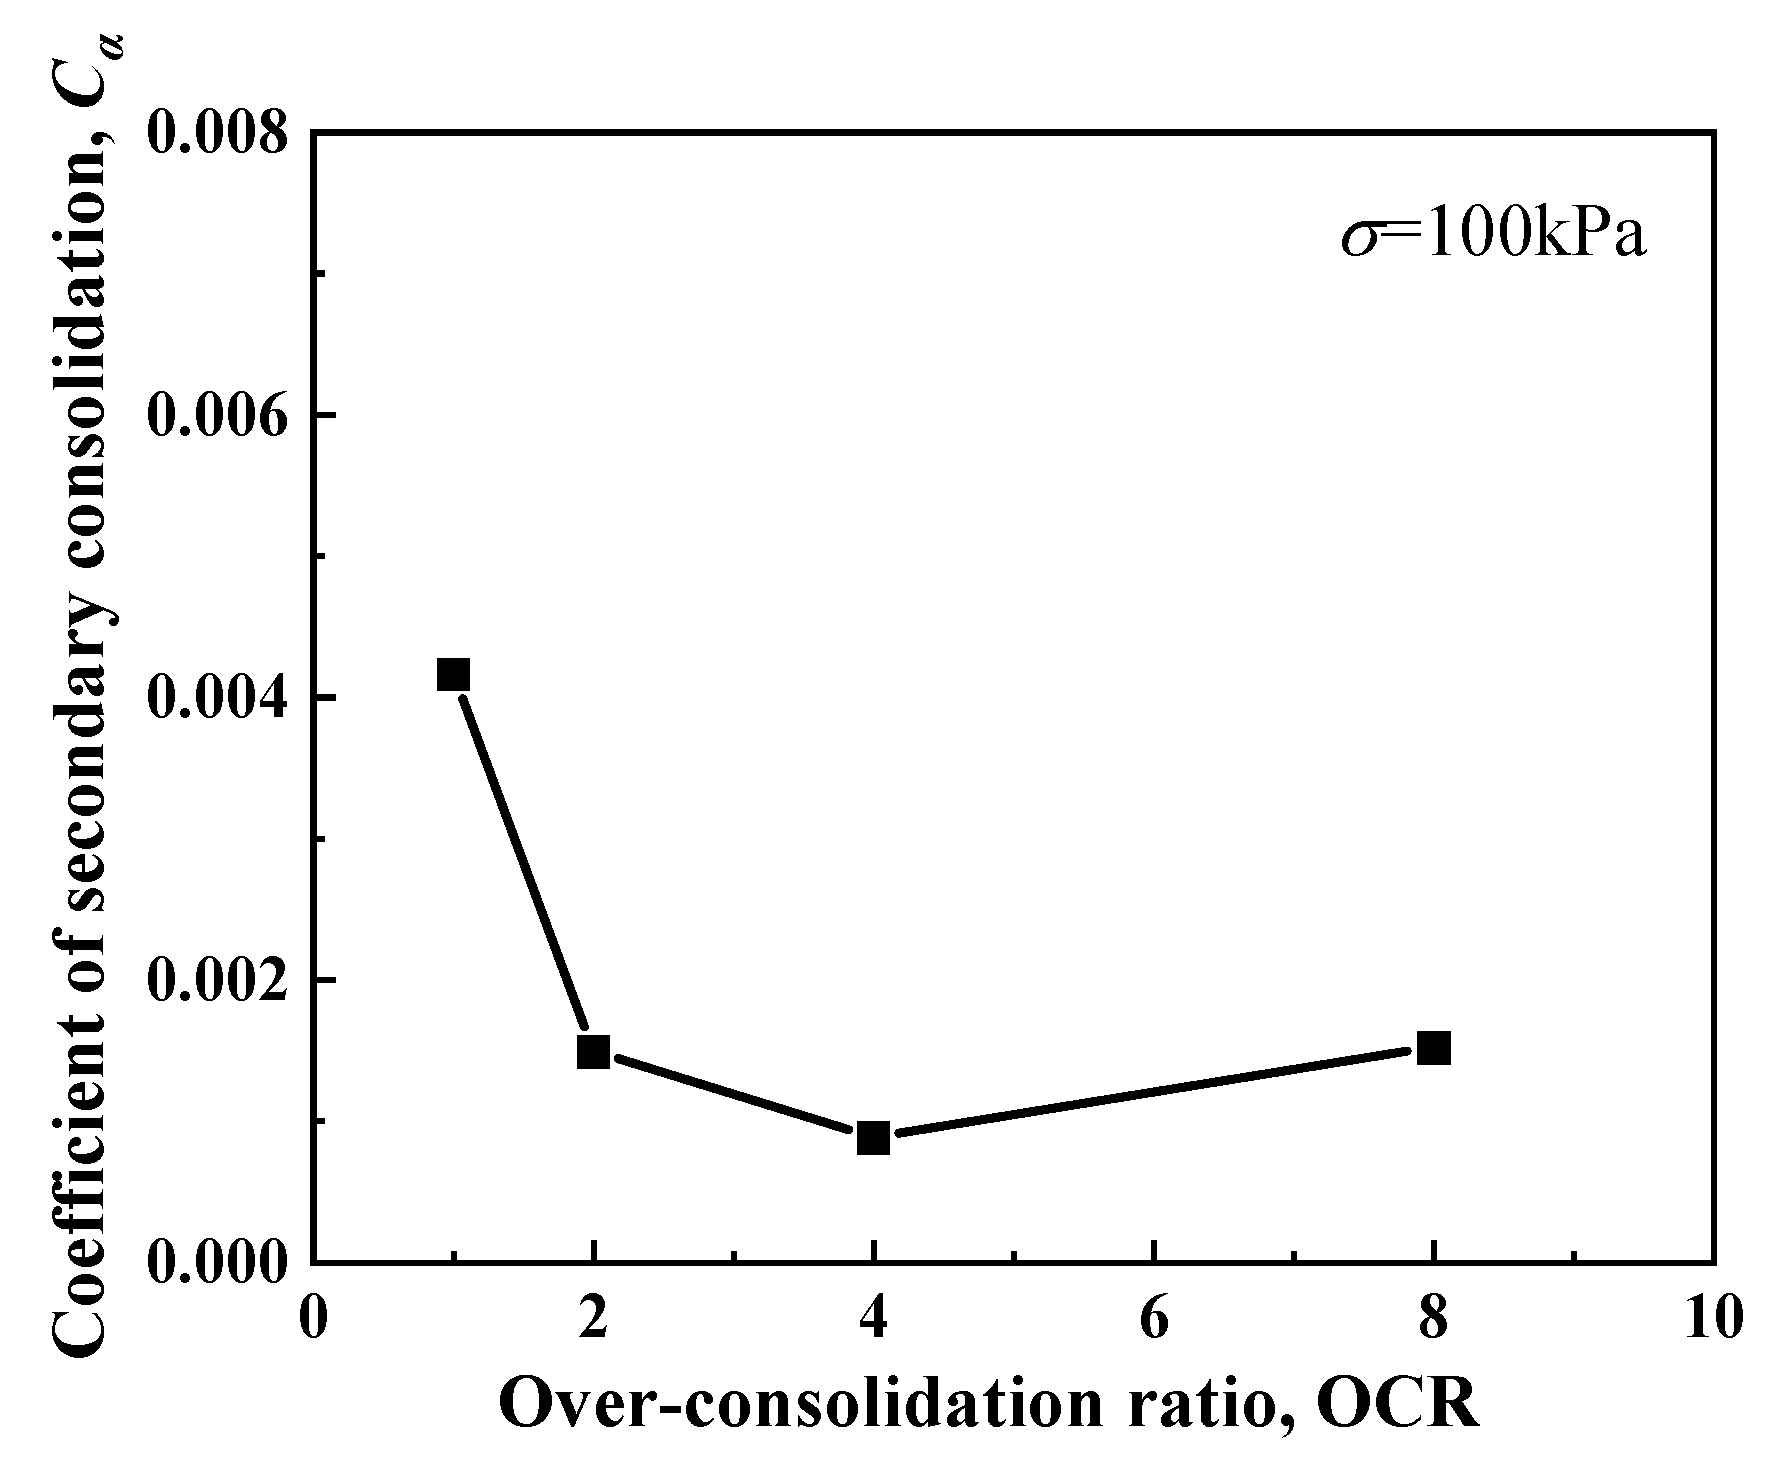
Figure 17 presents the relationship curve between the secondary consolidation coefficient and the OCR. When the OCR increases from 1 to 2, the secondary consolidation coefficient drops from 0.00416 to 0.00149, a decrease of 64.18%. The Cα calculation for all OCRs (including 2, 4, 8) adheres to the standard graphical method specified in ASTM D2435/D2435M-19 (Standard Test Method for One-Dimensional Consolidation Properties of Soils), which relies on the linear segment of the e-lgt curve during the secondary consolidation stage. For OCR = 2, 4, 8, the secondary consolidation stage in their respective e-lgt curves (Figure 16b–d) was first identified by two criteria: (1) the vertical deformation rate stabilized below 0.005 mm/h (indicating the end of primary consolidation), and (2) the e-lgt curve entered a near-linear segment (the hallmark of secondary consolidation.) after loading, where the curve transitions from the curved primary consolidation segment to a linear segment with a constant slope. As the OCR continues to increase, the secondary consolidation coefficient remains generally stable. This is mainly because when the OCR increases, the preconsolidation pressure on the soil increases, which significantly reduces the soil’s void ratio. This reduction in void ratio increases the frictional resistance between soil particles, thereby enhancing the soil’s cohesion and shear strength, and thus improving its resistance to deformation. Therefore, an increase in the OCR has a strong inhibitory effect on creep deformation. In practical engineering, overloading can be applied to soft soil foundations to reduce long-term settlement caused by creep. However, on the other hand, there is a limit value for the influence of the OCR on creep. When the OCR exceeds this limit value, the increase in overconsolidation has no significant effect on the secondary consolidation coefficient. The observed increase in the secondary consolidation coefficient at OCR = 8 is not consistent with the general mechanical trend of overconsolidated soils, which typically exhibit suppressed secondary consolidation with higher OCR. It is more likely attributed to experimental uncertainties in measuring subtle void ratio changes, transitional behavior near the influence limit of OCR, or soil-specific characteristics of remolded soft soil.

3.3. The Influence of Creep Time

3.3.1. Porosity Ratio–Time Relationship

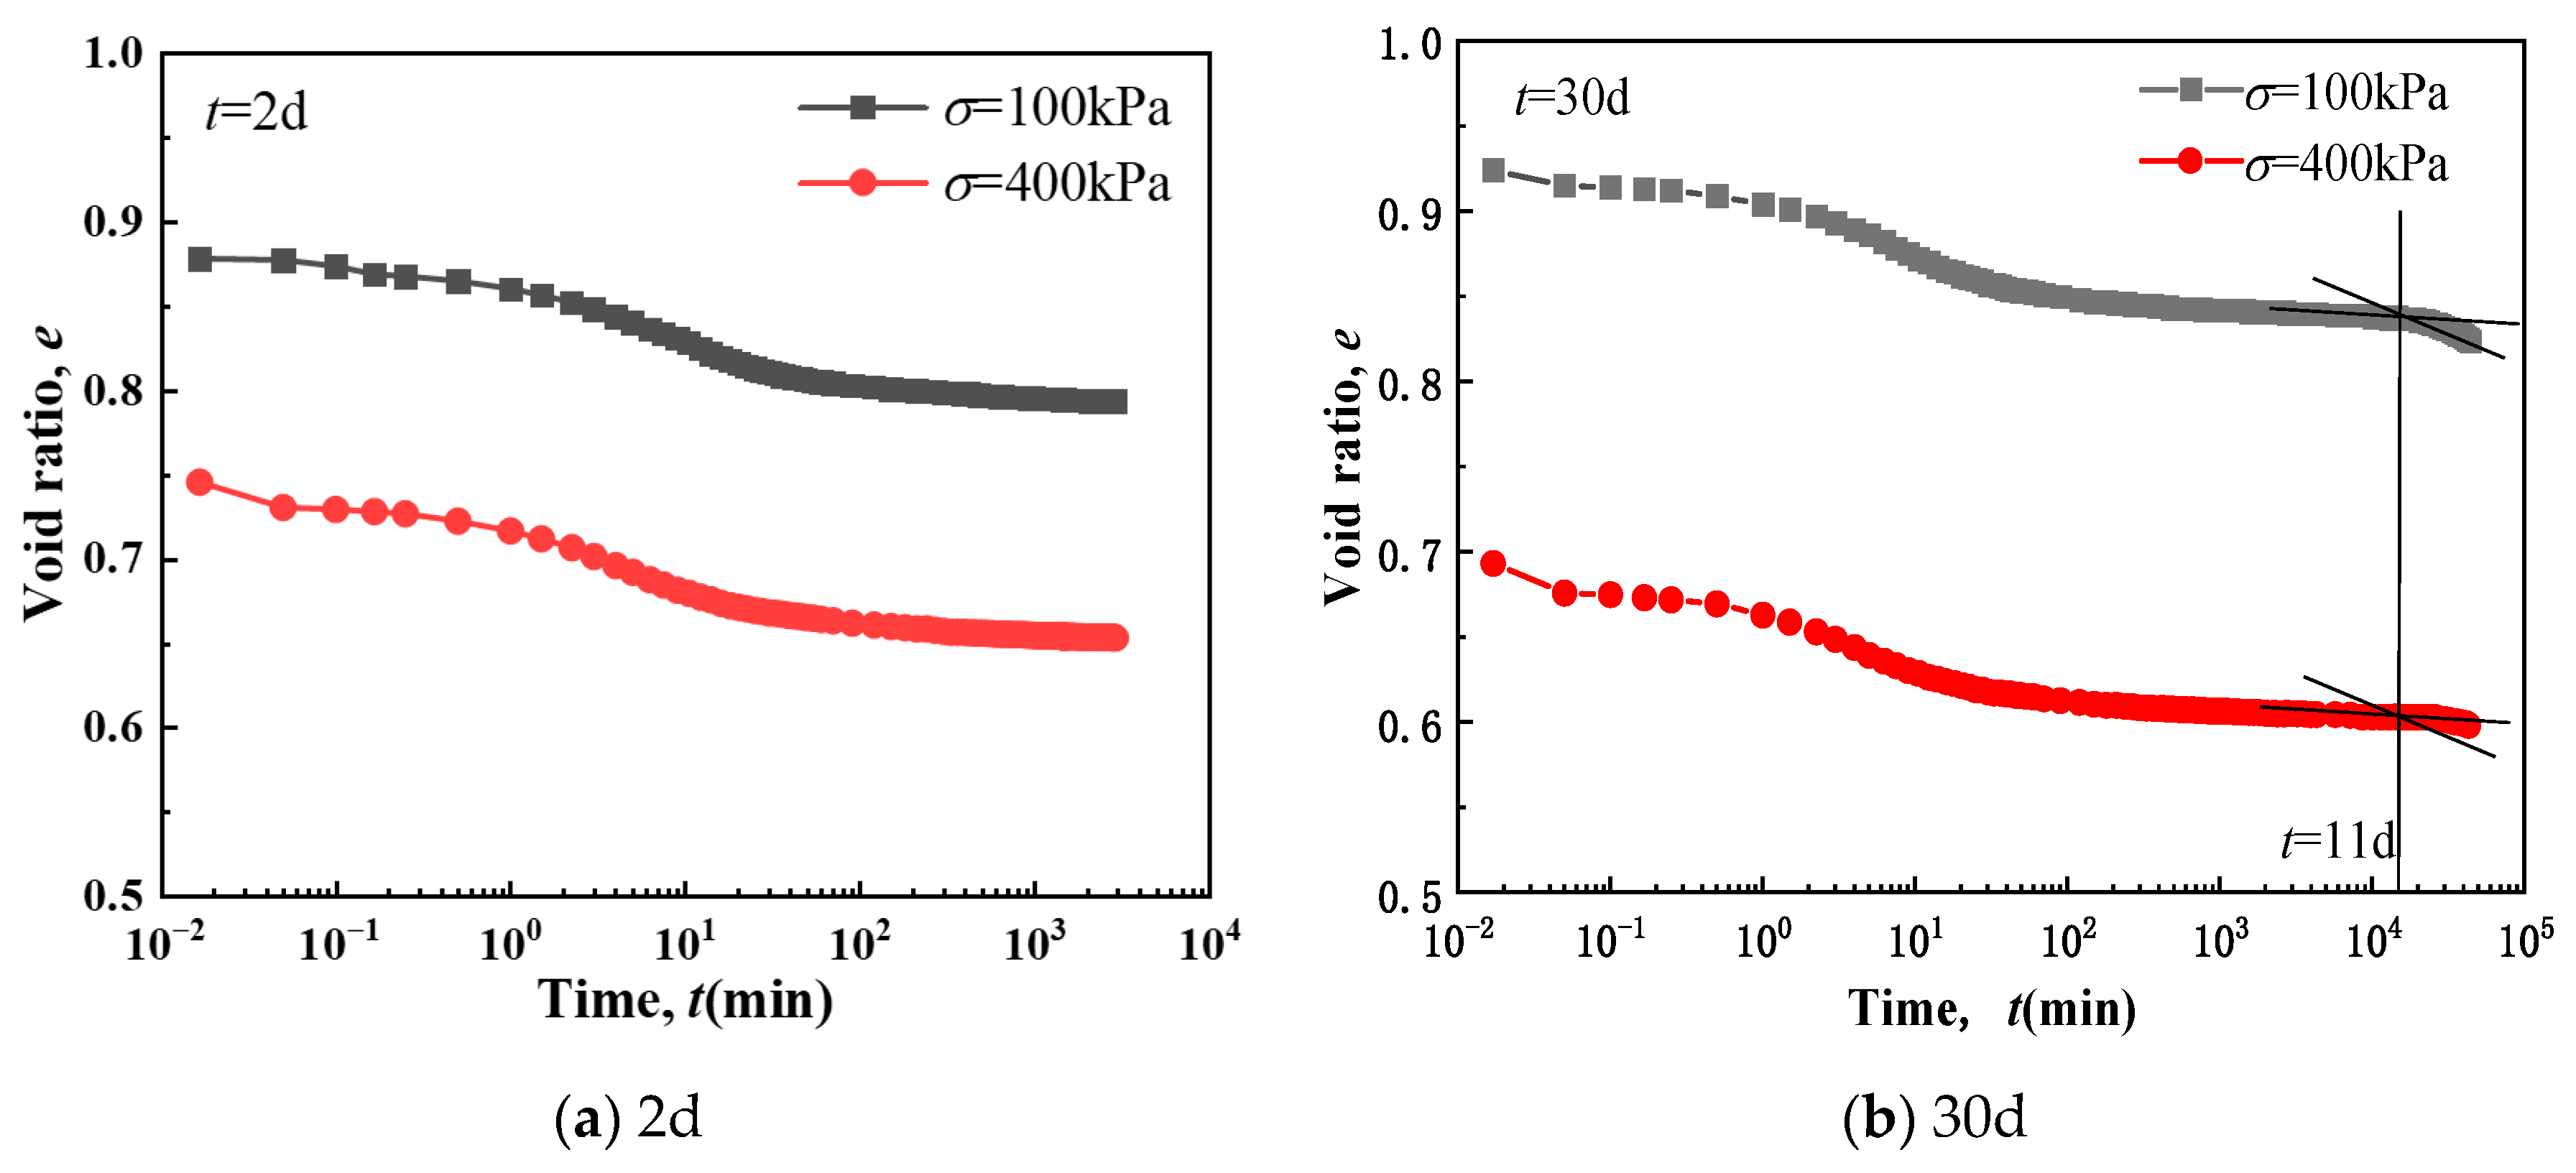
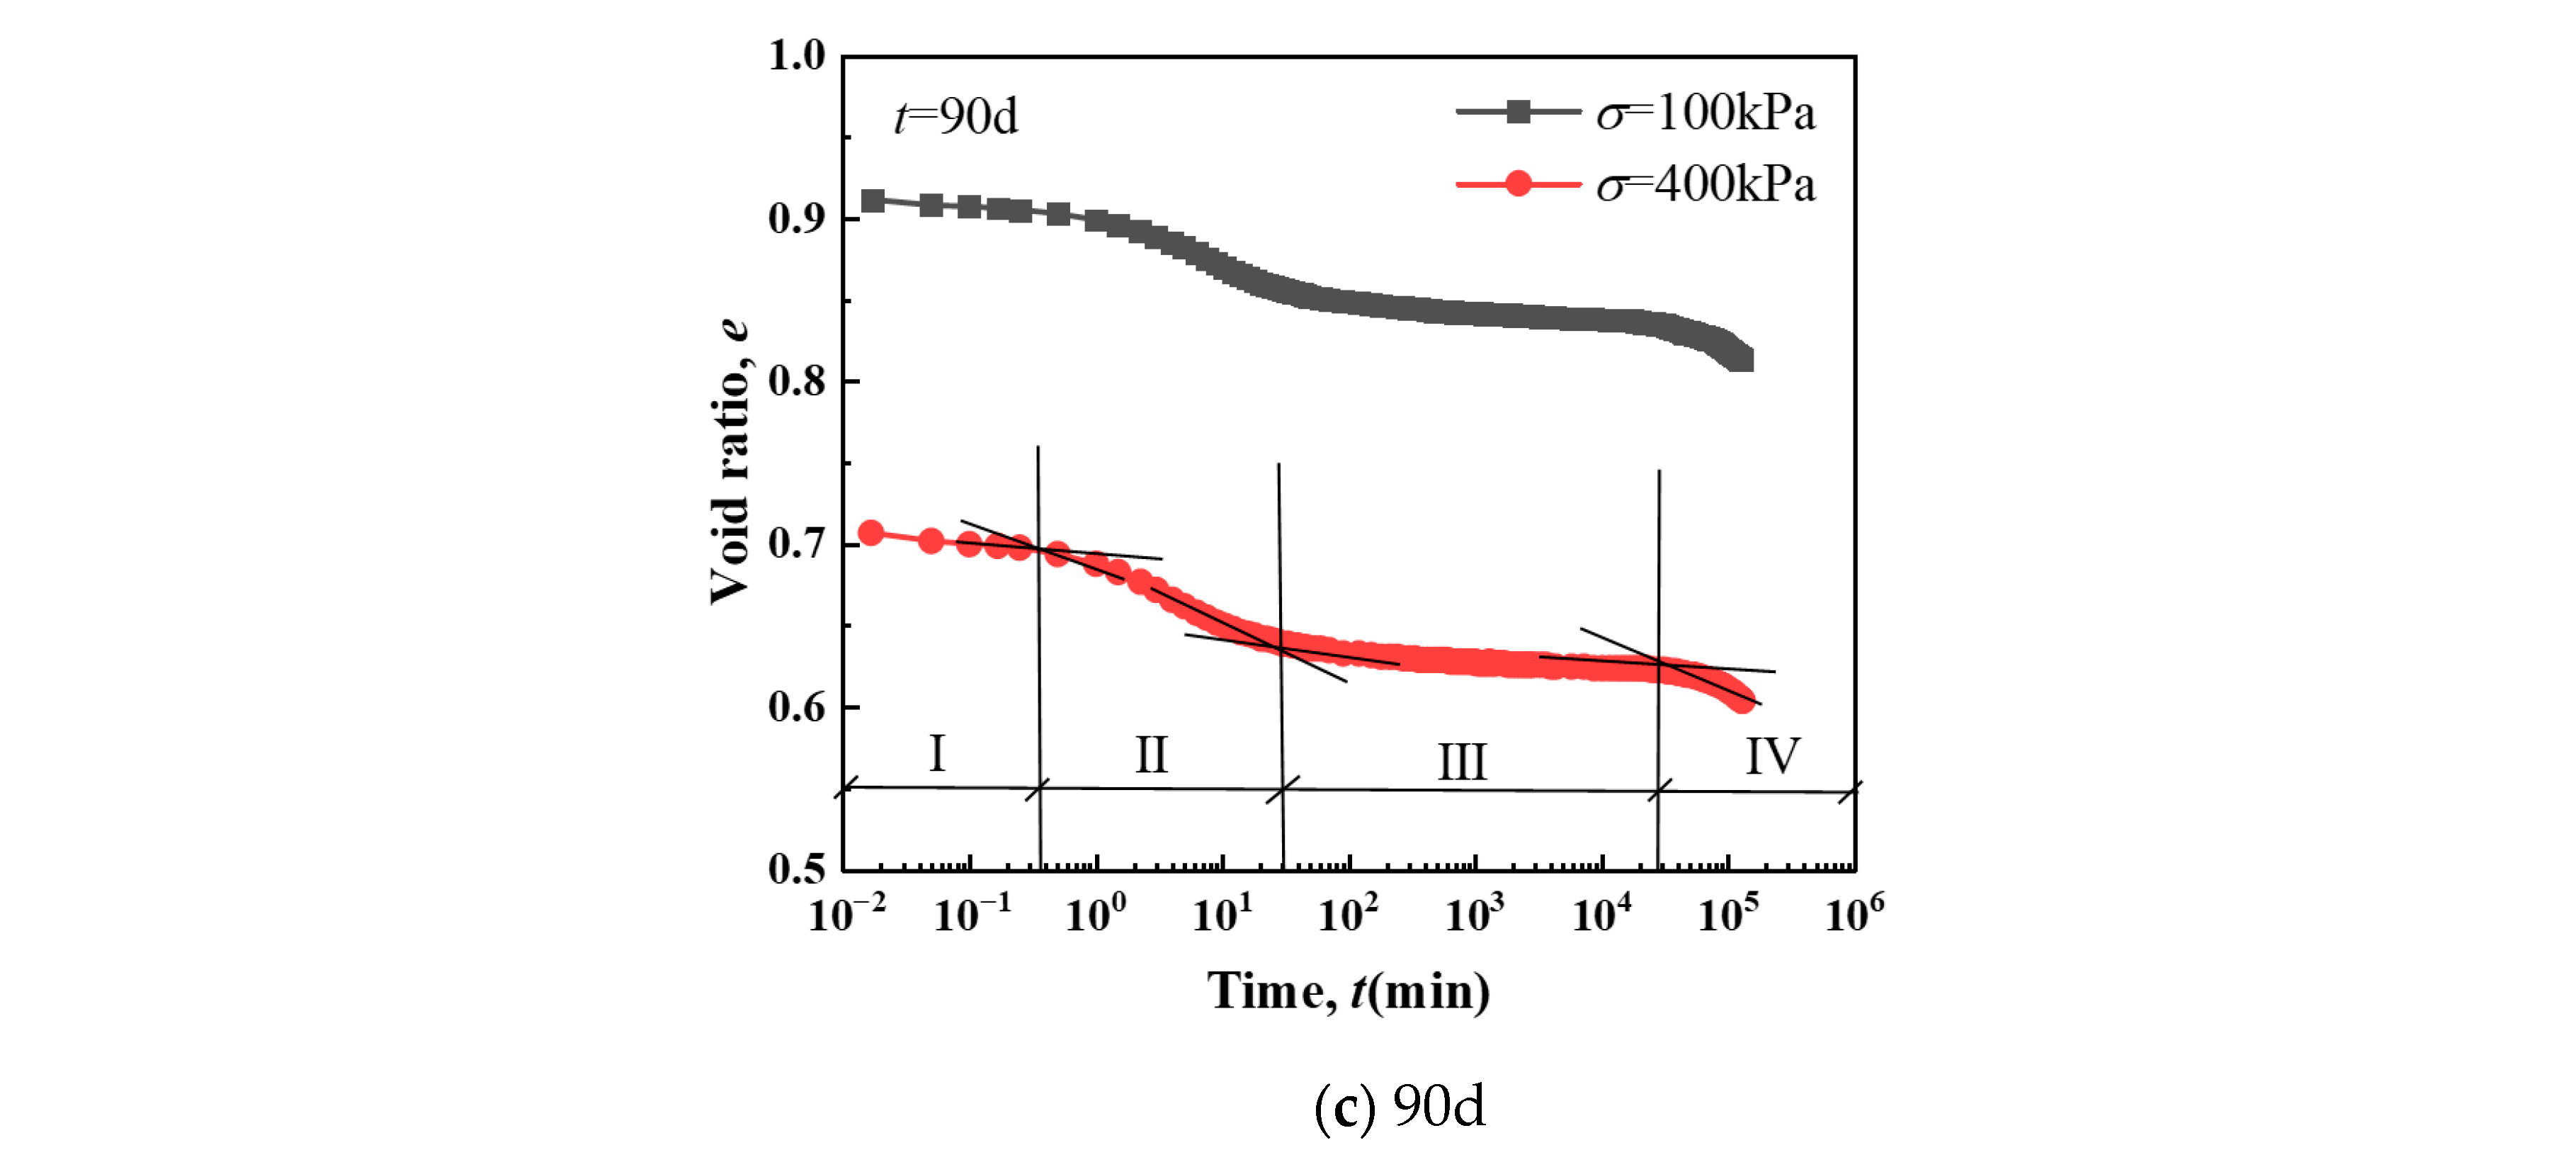
Figure 18 shows the e-lgt curves of remolded silt under various stress levels and loading durations. The 2-day loading exhibits near-linear creep-phase curves, indicating stable secondary consolidation coefficients. Extended loading to 30 days shows increased curve slopes after 11 days, demonstrating renewed coefficient growth. After 90 days, the coefficient continues increasing beyond 20 days. As Figure 18c illustrates, prolonged loading produces four distinct phases: I—instantaneous, II—primary, III—secondary, and IV—accelerated consolidation. The secondary consolidation phase clearly shows accelerating behavior, with progressively increasing curve slopes transitioning to accelerated creep. Quantitative measurements at 100 kPa reveal void ratio changes of 0.085 (2 days) and 0.102 (90 days), confirming that sufficiently long loading durations reactivate creep acceleration in silt.
Figure 19 presents the e-lgt curves of remolded silt under different OCR at a constant stress of 100 kPa. The 2-day results (Figure 19a) show no tertiary creep stage, while the 90-day data (Figure 19b) reveal four distinct creep stages, demonstrating time’s significant influence on both normally consolidated and overconsolidated soils. After 90 days, the void ratio changes were 0.102 (OCR = 1), 0.0265 (OCR = 2), 0.025 (OCR = 4), and 0.025 (OCR = 8), confirming that higher OCR values correspond to reduced void ratio changes and less pronounced creep behavior.
Notably, the traditional secondary consolidation framework assumes that long-term creep remains in a stable, near-linear secondary stage after primary consolidation, with a constant secondary consolidation coefficient. However, our 90-day extended creep tests revealed a fourth distinct ‘accelerated secondary consolidation stage’ (Figure 18 and Figure 19). In this stage, Cα no longer remains constant but increases gradually, and the void ratio decreases at an accelerated rate—this directly reflects a transition toward more substantial long-term settlement. Sustained loading drives continuous microstructural evolution that exceeds the scope of traditional theory, leading to additional settlement not predicted by the stable secondary consolidation assumption.

3.3.2. Secondary Consolidation Coefficient

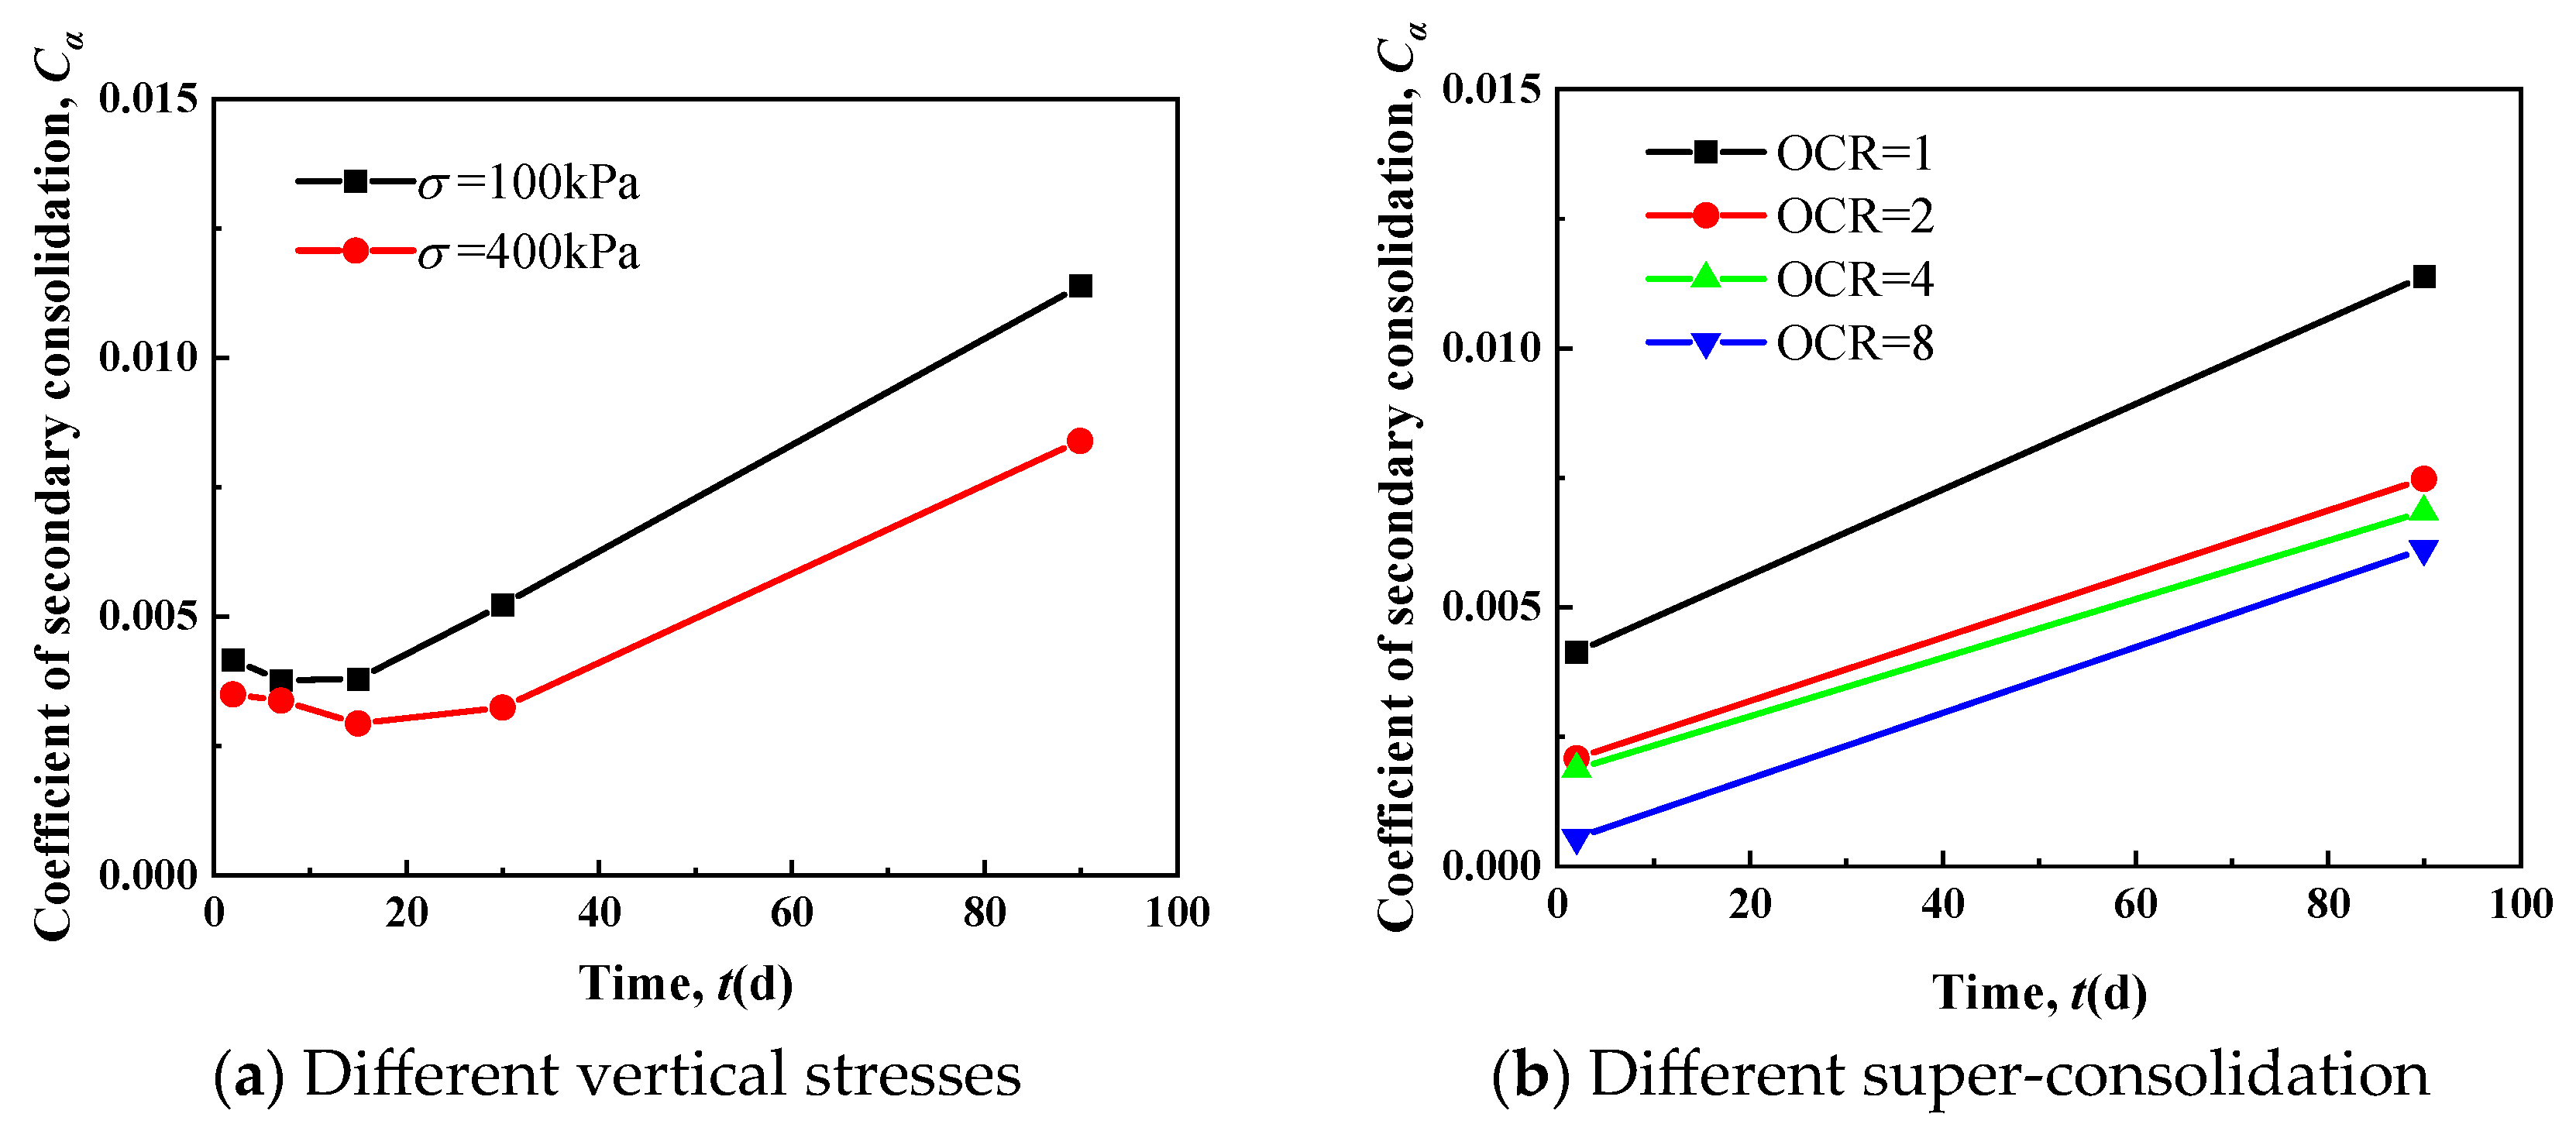
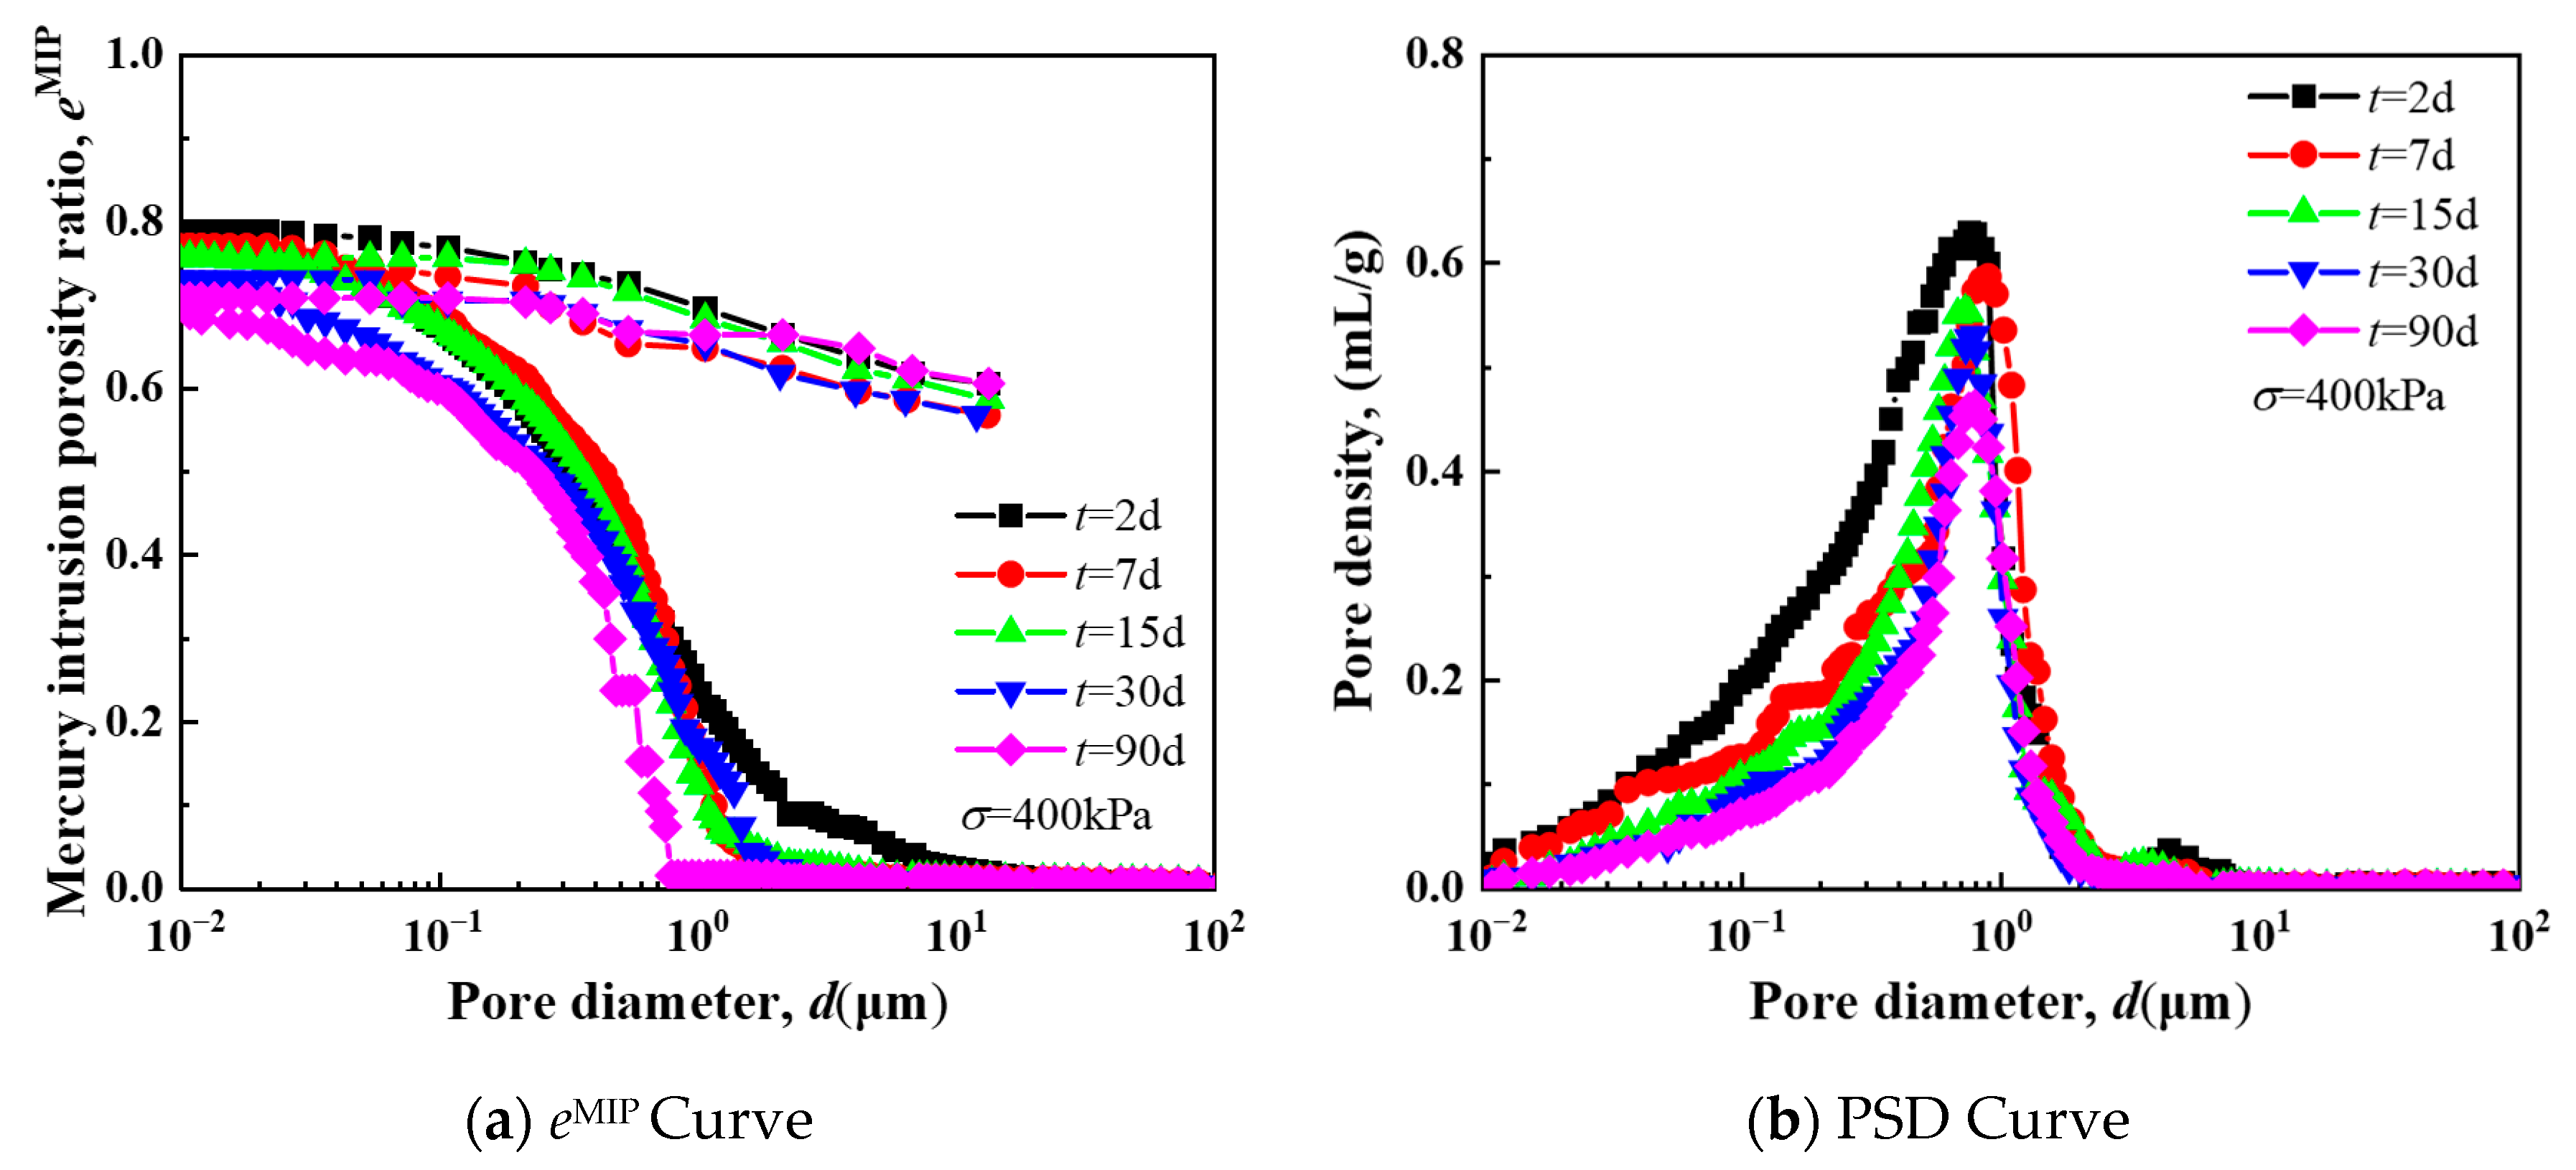
Figure 20 presents the relationship between the secondary consolidation coefficient and time for remolded silt. As shown in Figure 20a, the coefficient remains relatively constant within the first 20 days, then increases gradually, with accelerated growth between 30 and 90 days. For instance, at 100 kPa, it increases from 0.00522 (30 days) to 0.01139 (90 days); at 400 kPa, from 0.00324 to 0.00839. Figure 20b suggests similar time-dependent growth trends across different OCRs, though limited data points preclude definitive conclusions.

3.4. Stress–Strain Isochronous Relationship Curve

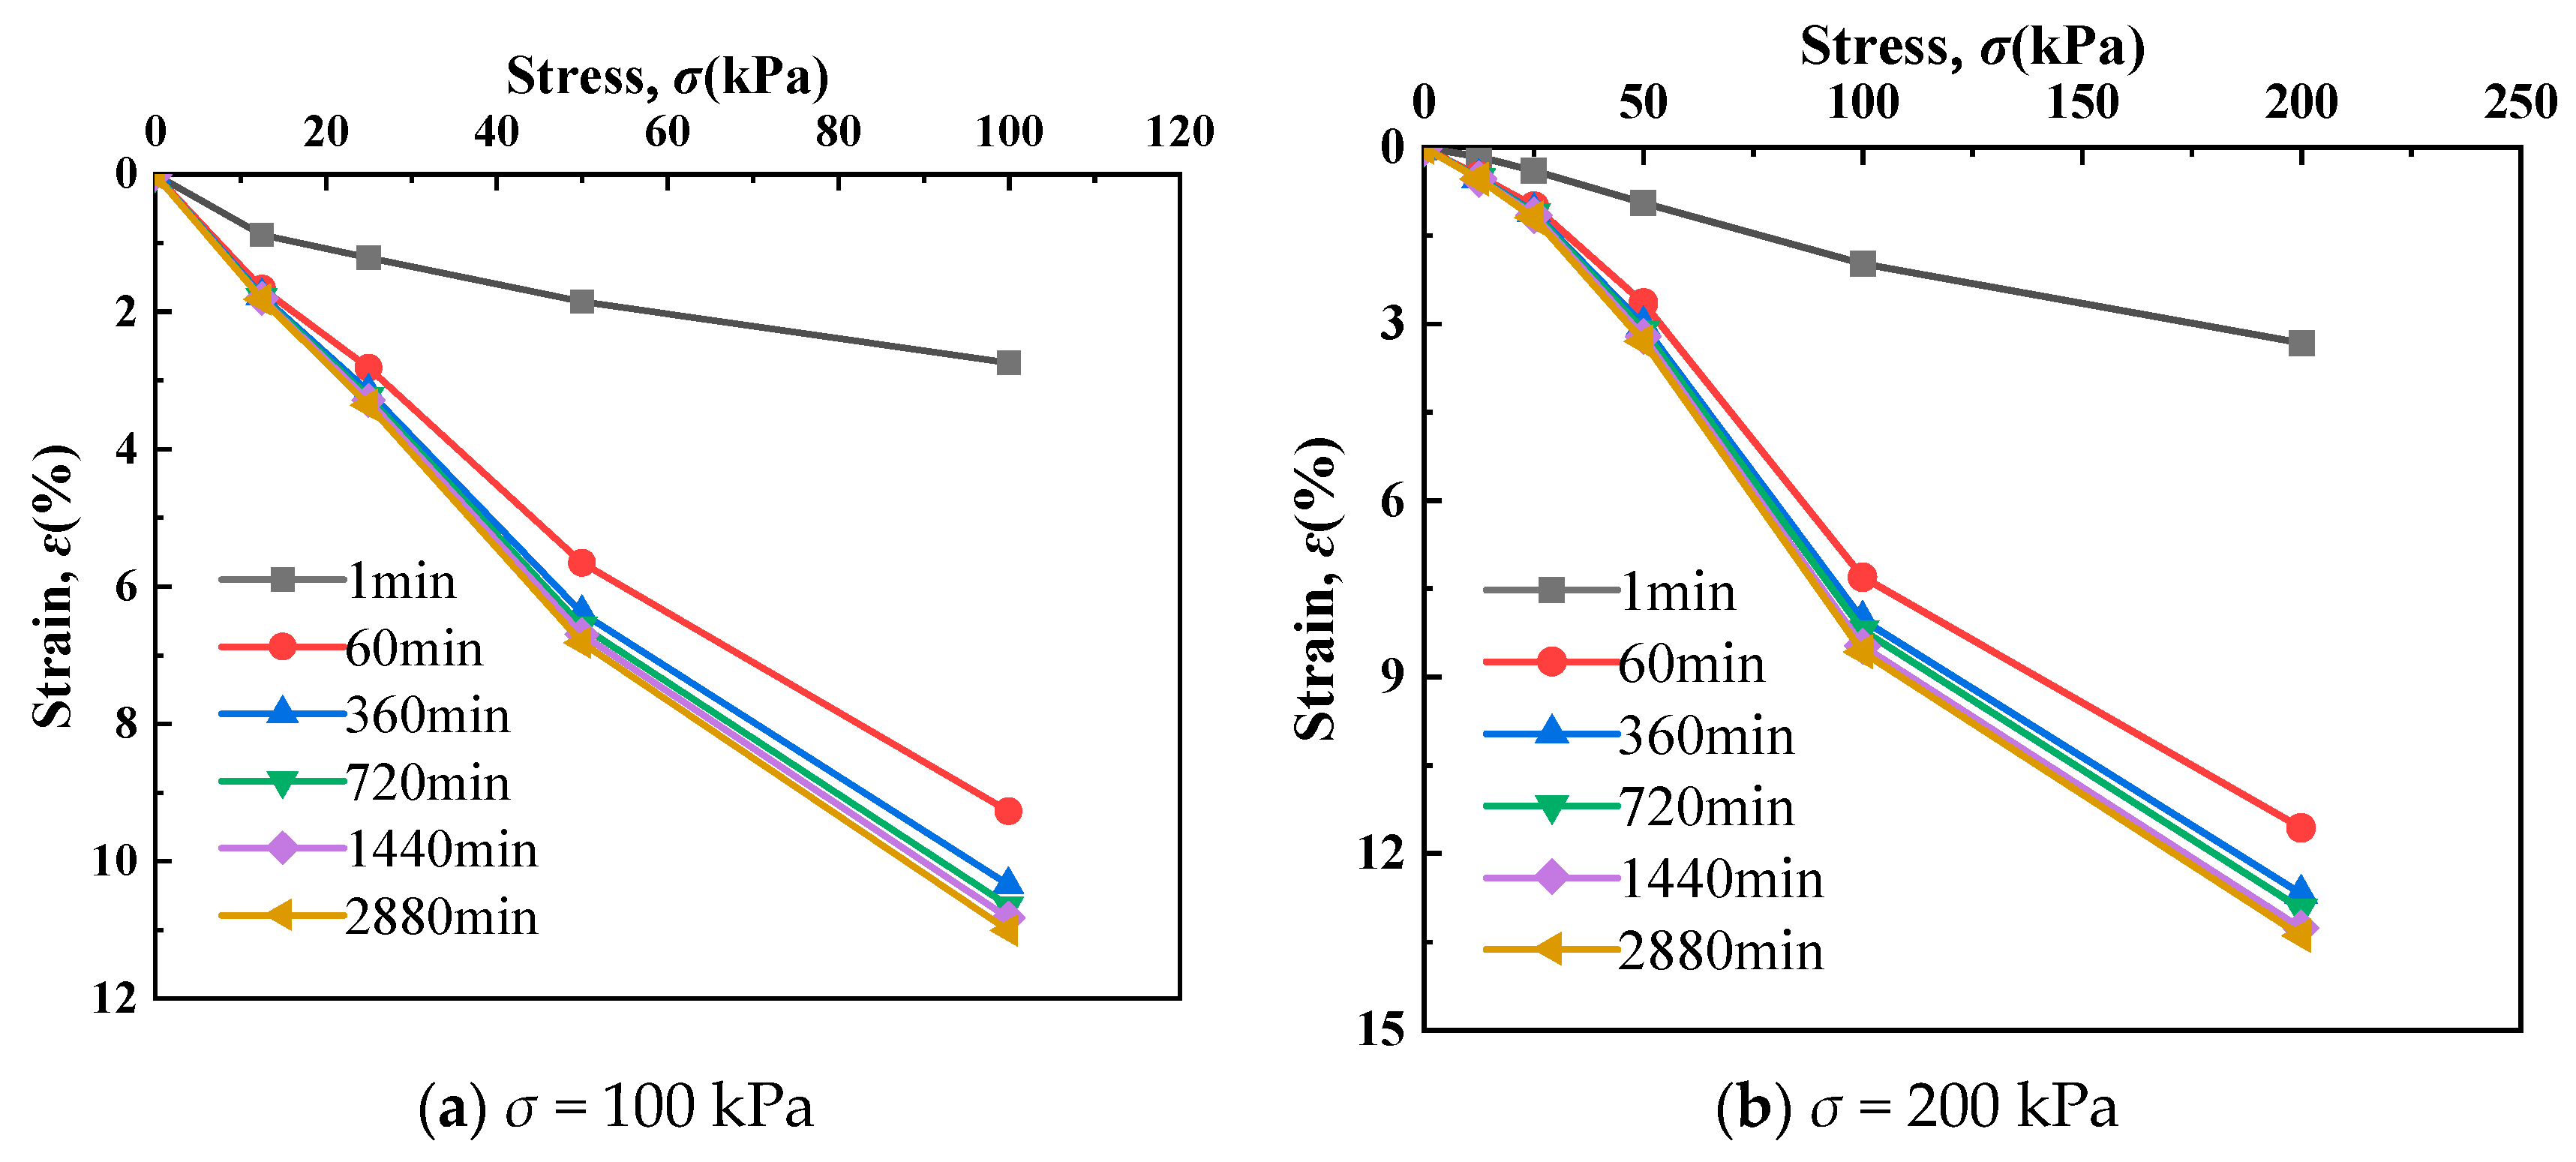
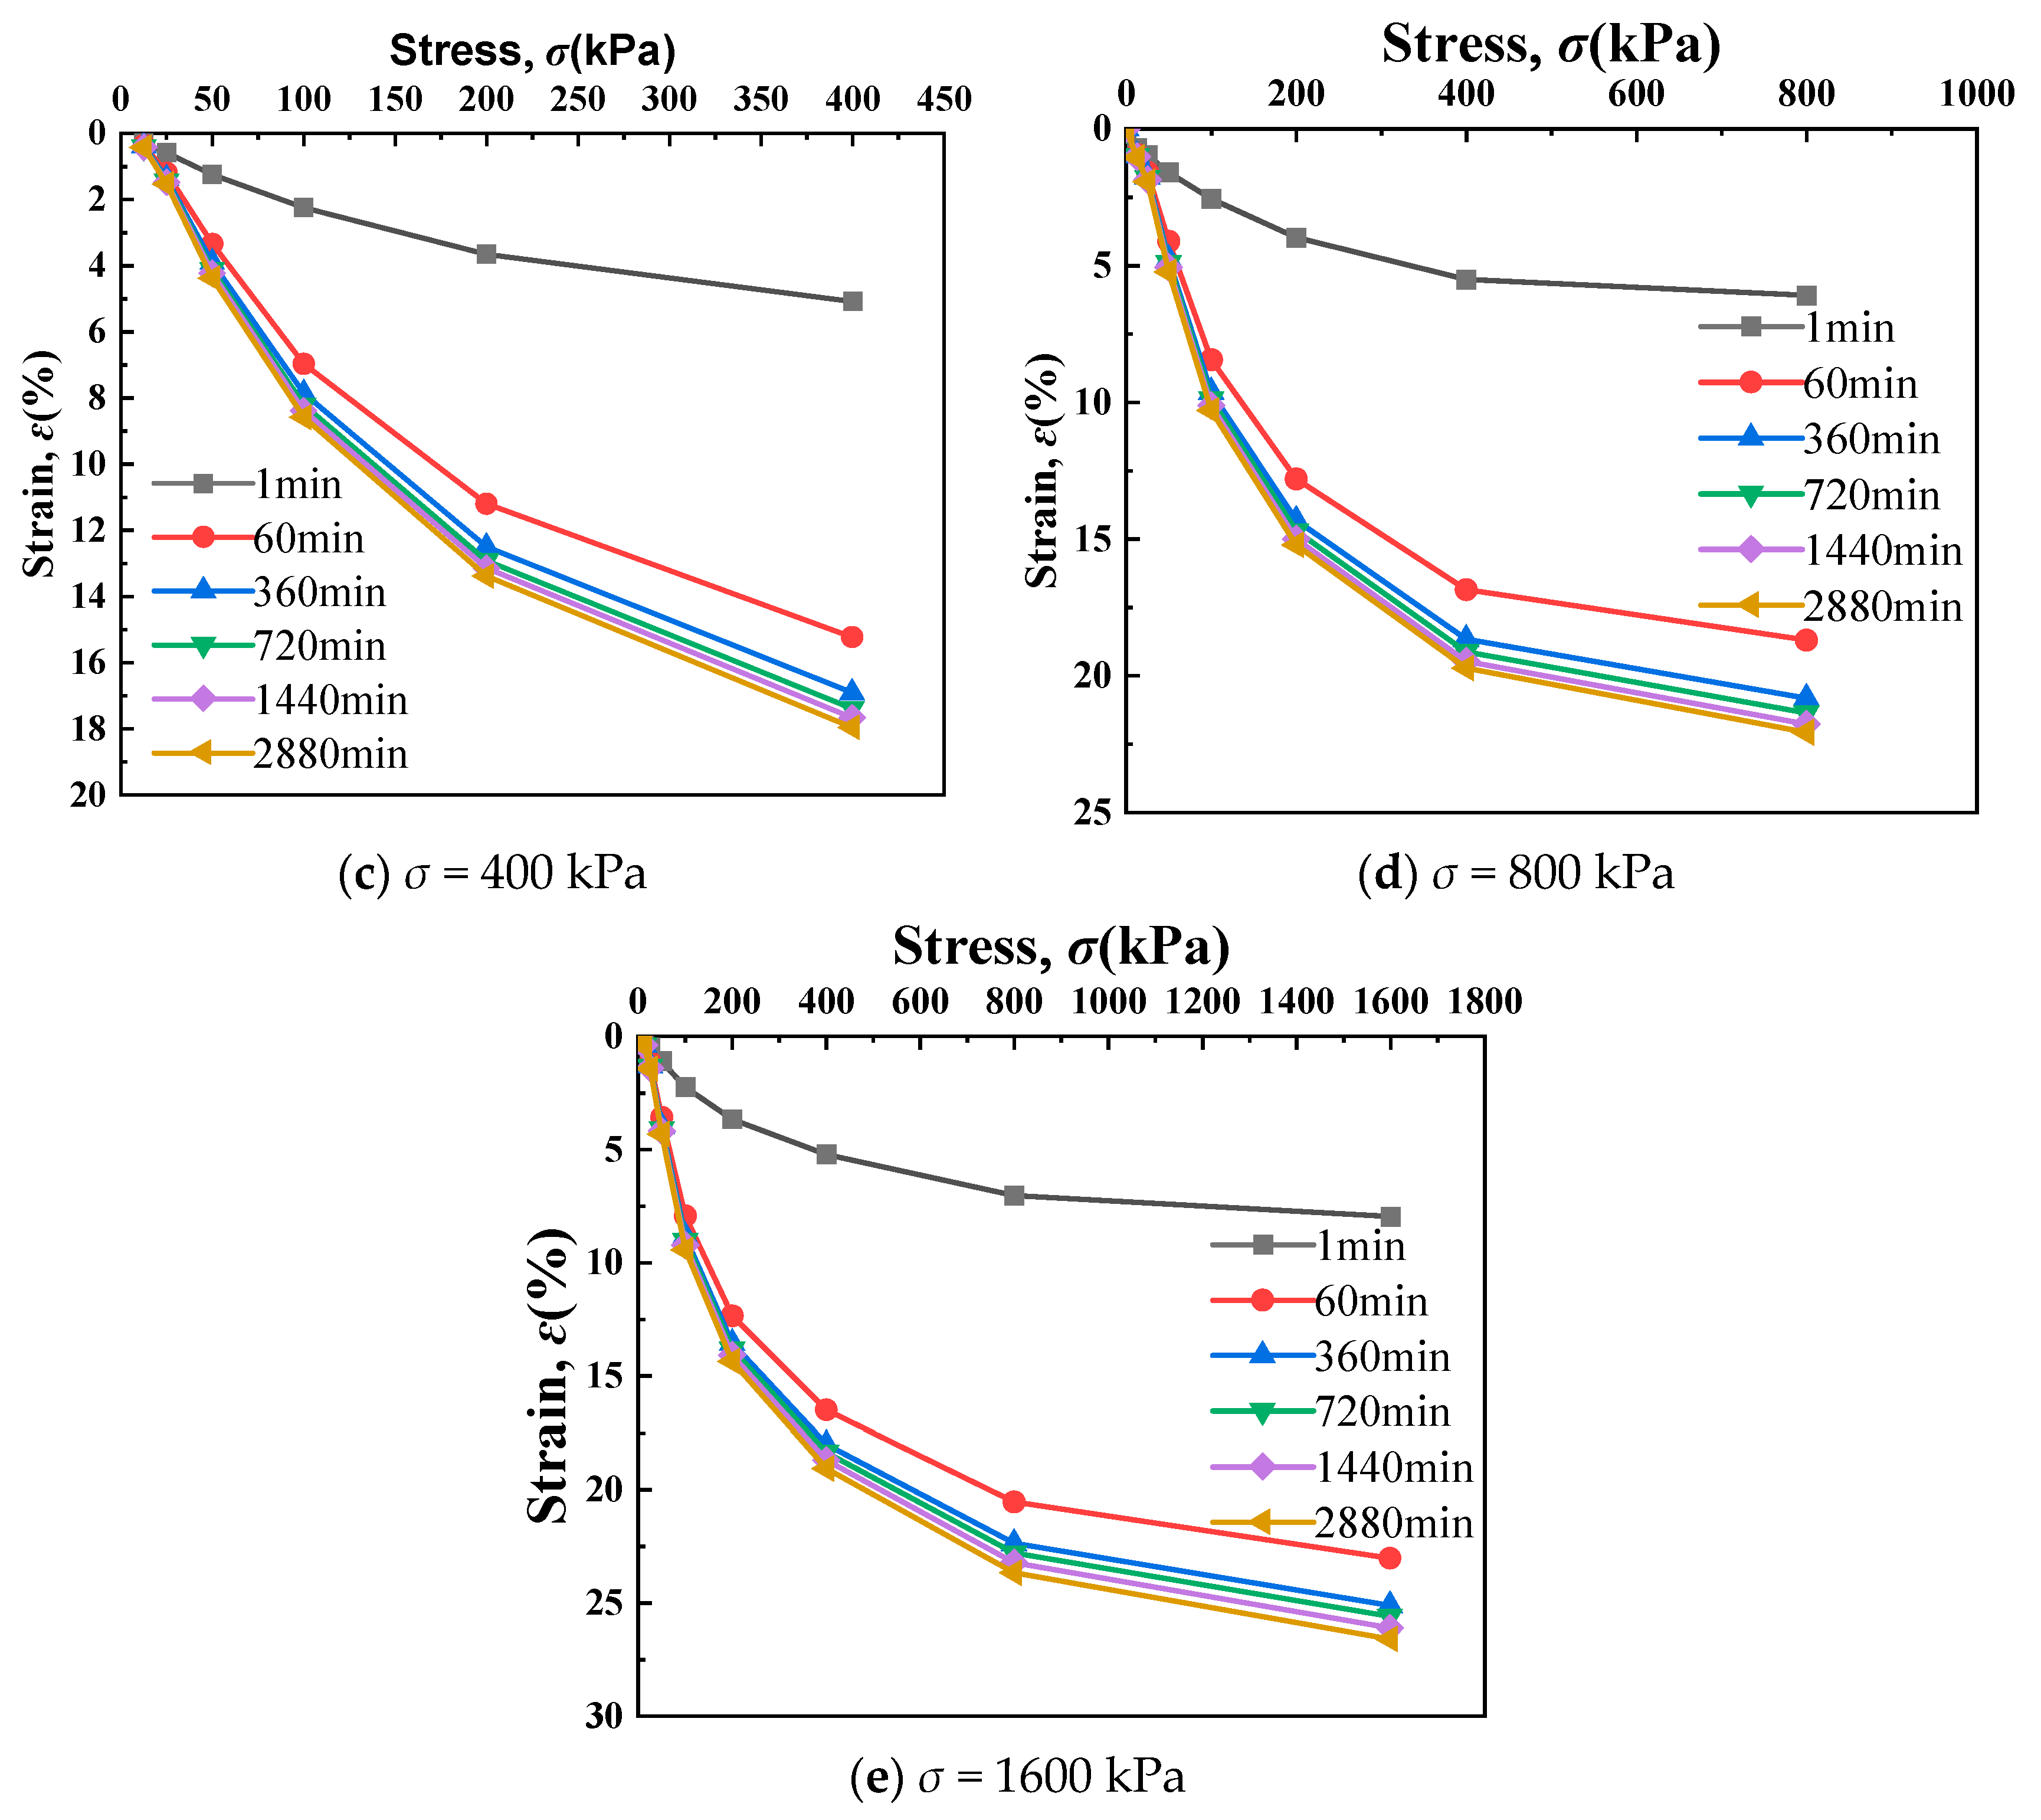
Figure 21 presents the stress–strain isochronous curves of remolded silt under different stress levels. The curves show near-linear behavior at low stresses but develop nonlinearity with time. High stress levels exhibit pronounced nonlinearity, indicating significant stress-dependent effects. Creep deformation progressively stabilizes with prolonged loading.
Notably, the t = 1 min and t = 60 min curves show distinct divergence, while curves from t = 360 min to t = 2880 min converge, demonstrating that strain rate decreases with loading duration. Higher stress intensities accelerate strain rates, with curve progression shifting toward the stress axis, reflecting increased time-dependent deformation characteristics.

4. Triaxial Creep Characteristics of Remolded Soft Soil

4.1. Axial Strain—Time Relationship

The triaxial creep test data were processed using Chen’s method: (1) maintaining the first loading stage’s strain–time curve; (2) extending it following stabilized creep behavior; (3) calculating differential strains between extended and second-stage curves; (4) proportionally superimposing differential strains to obtain the second-stage curve; and (5) repeating sequentially for all loading stages [27].
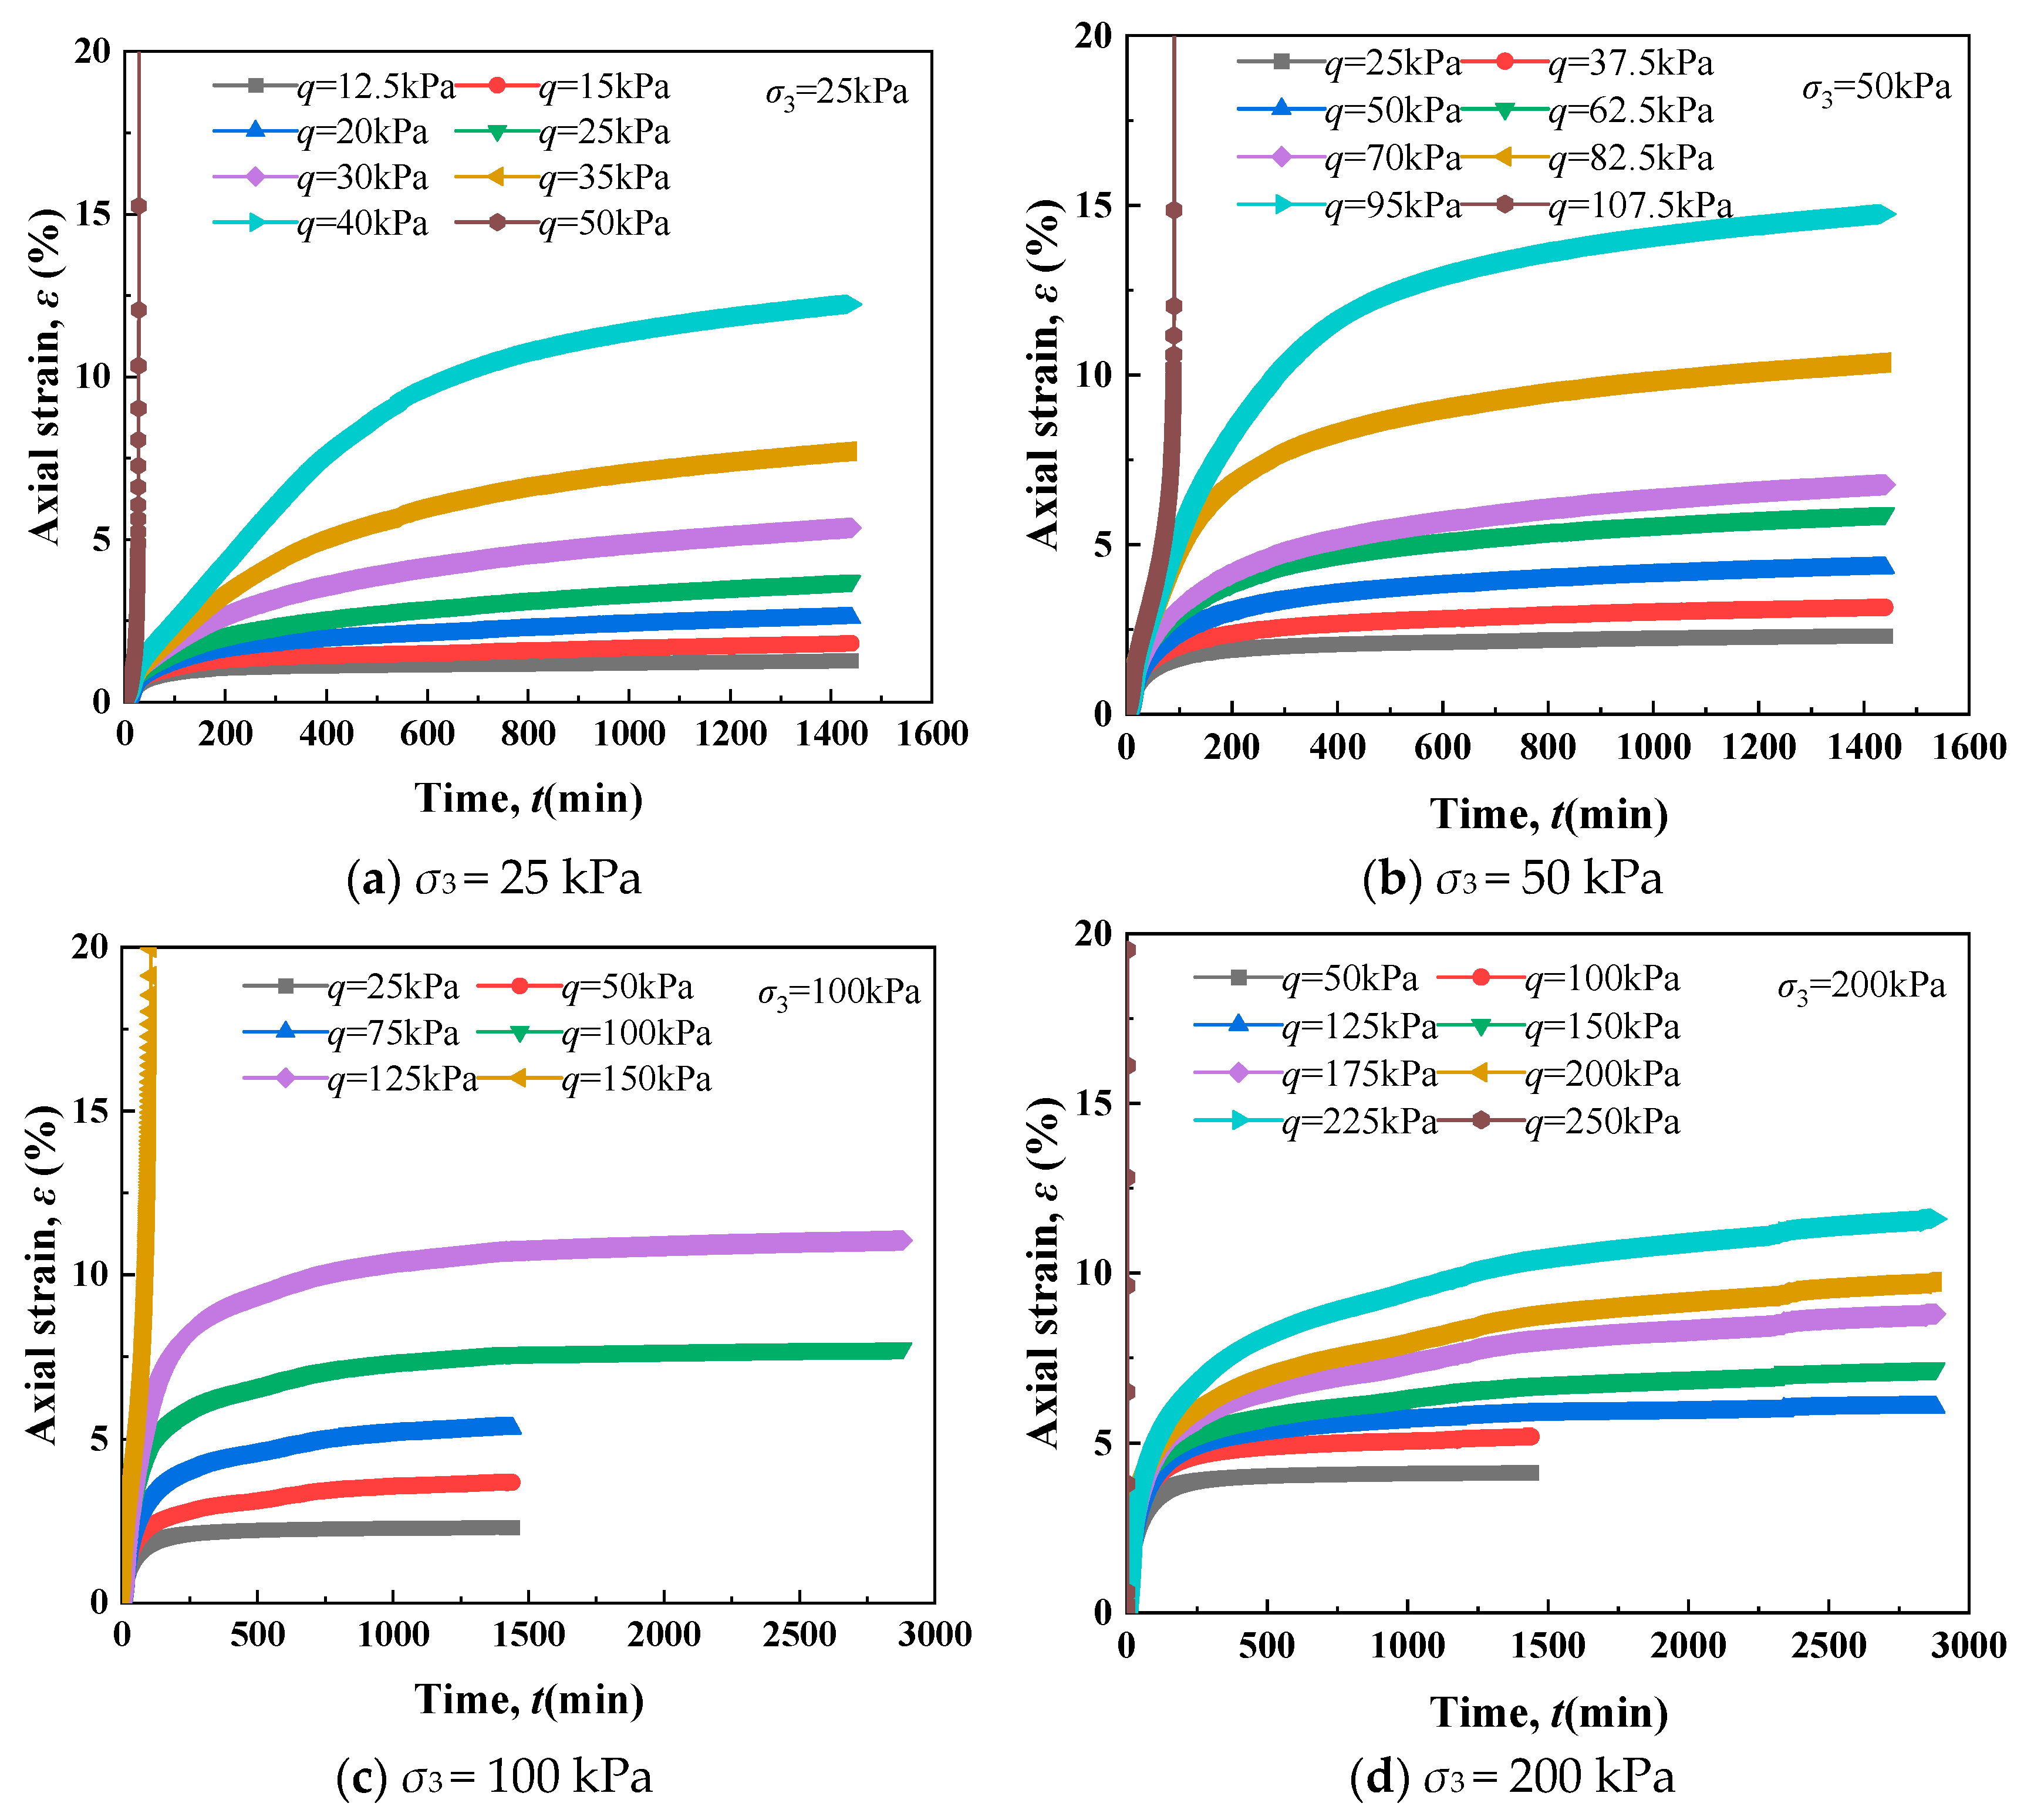
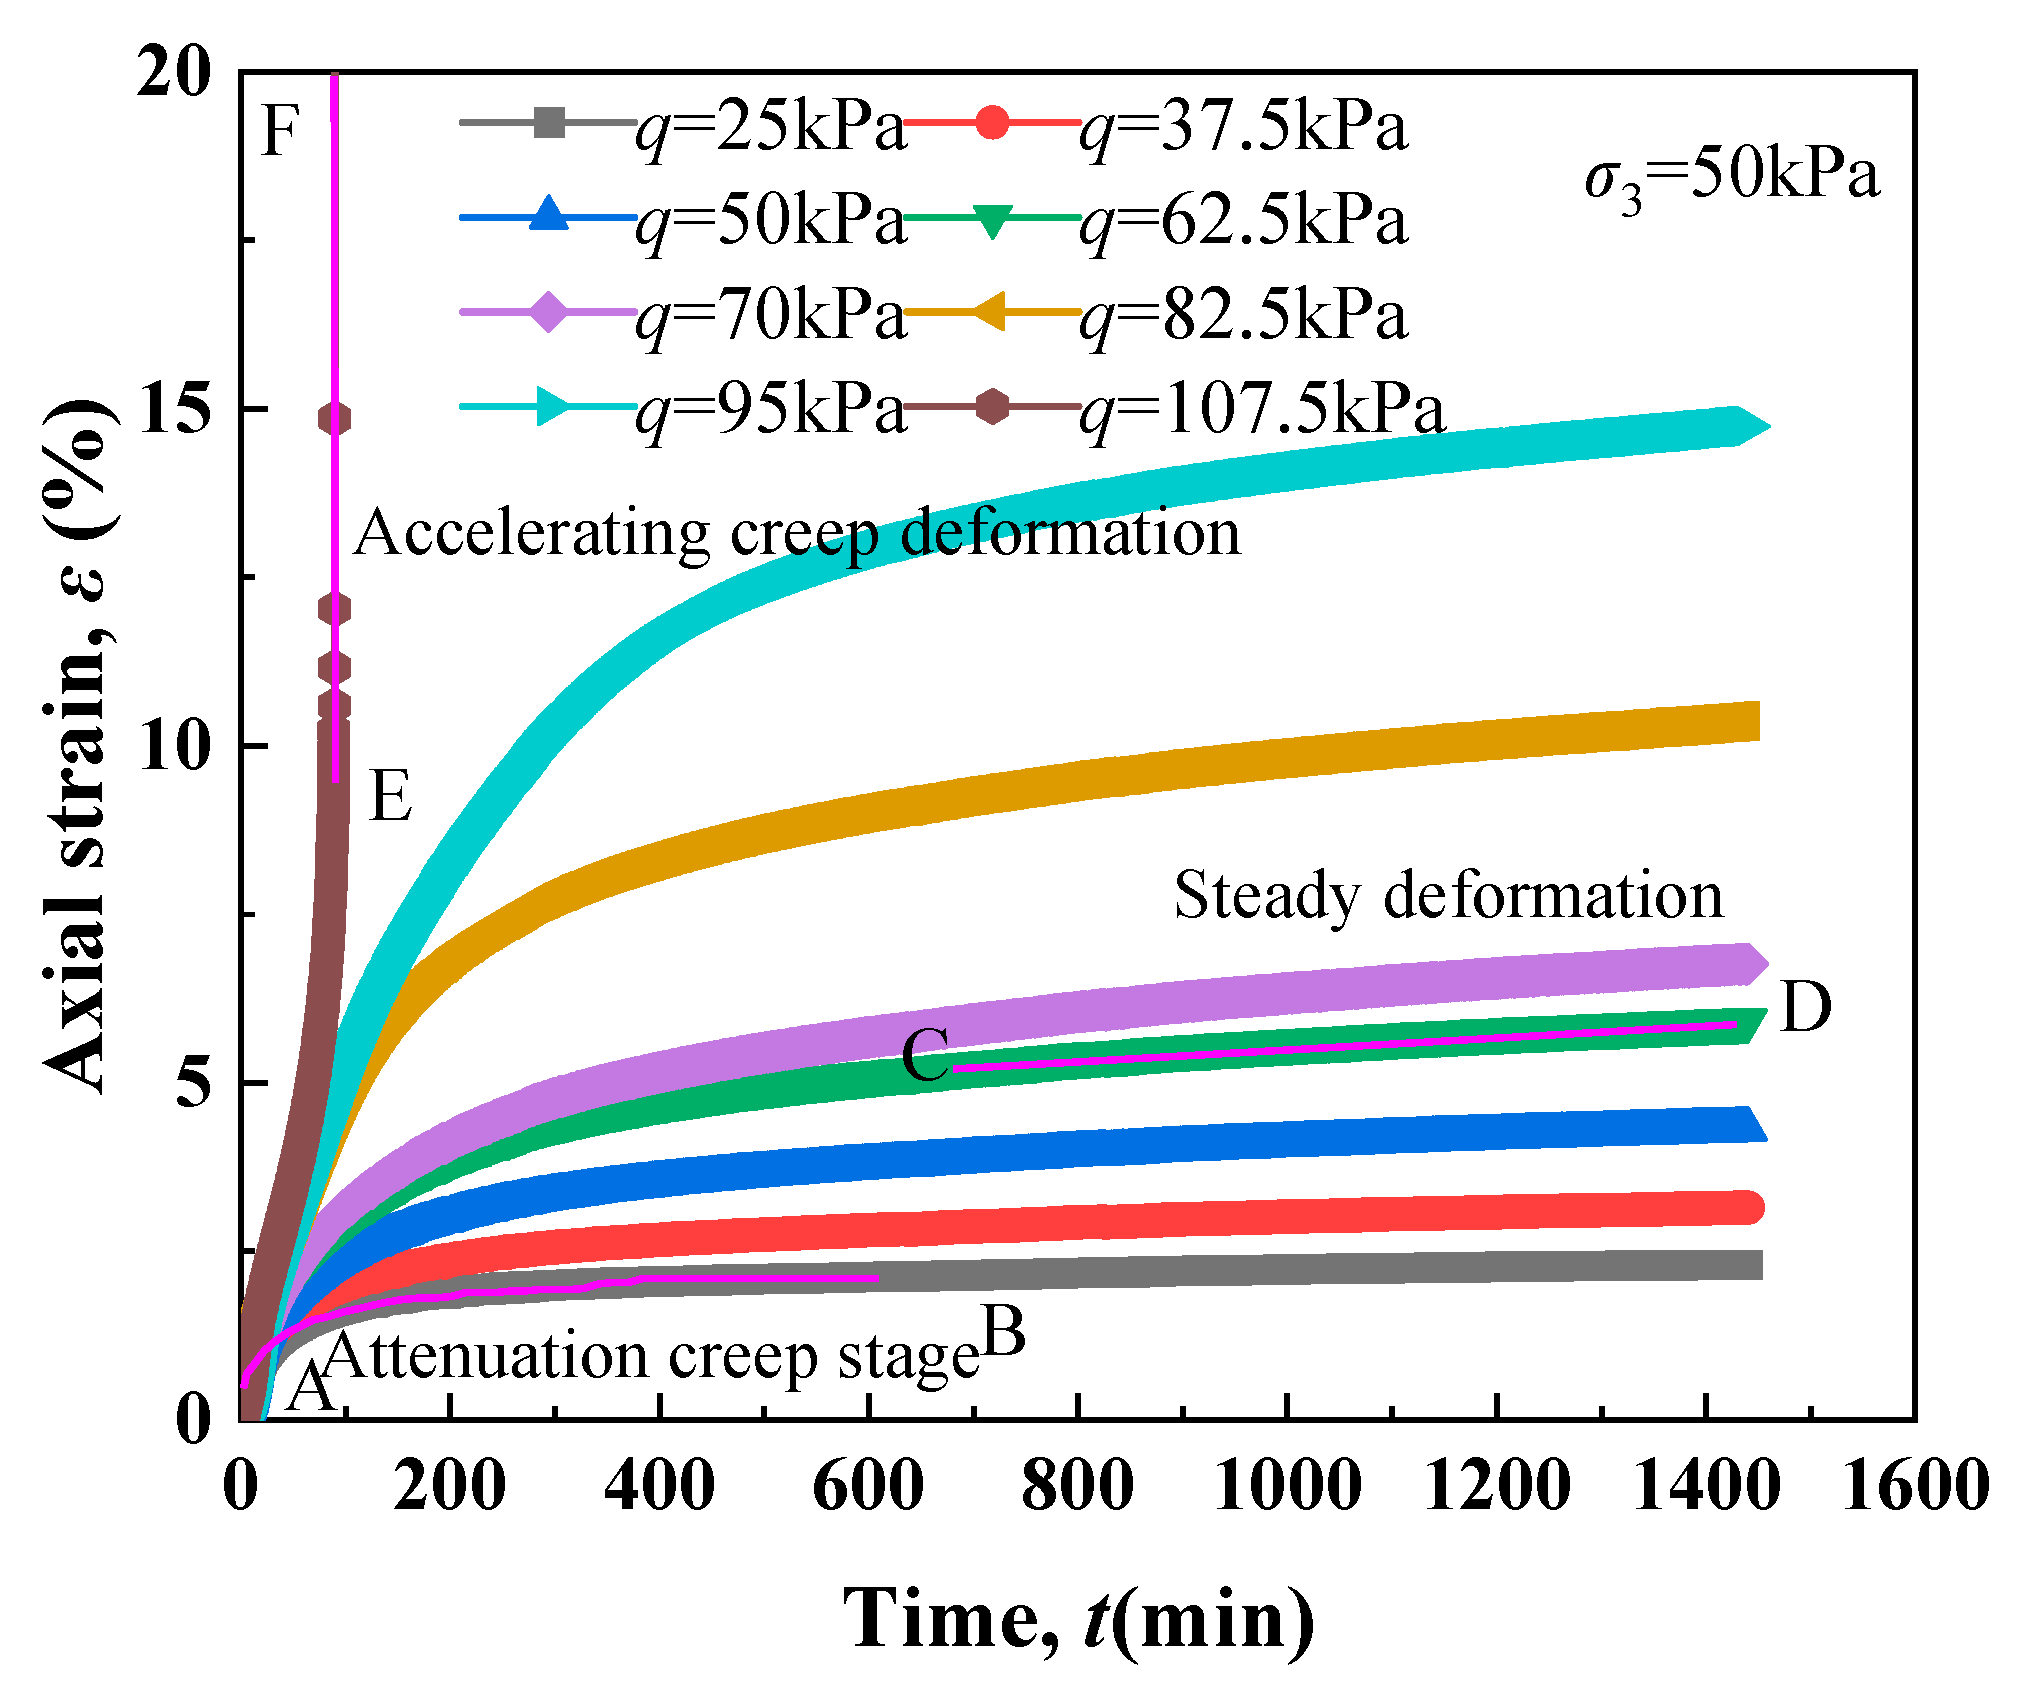
Figure 22a–d present the axial strain–time curves under confining pressures of 25, 50, 100, and 200 kPa, respectively, showing three creep phases: primary (decelerating), secondary (steady), and tertiary (accelerating). As exemplified by the 50 kPa case (Figure 22b), these phases exhibit distinct characteristics: primary creep (segment AB) with decreasing strain rate under low stress; secondary creep (CD) with constant rate at moderate stress; and tertiary creep (EF) with increasing rate leading to failure under high stress. Notably, under extreme stress, specimens may directly enter tertiary creep until failure.
Figure 23 shows that the failure deviatoric stress (q) is approximately twice the confining pressure under low confining pressure, but decreases to below 1.5 times the confining pressure under high confining pressure. With increasing deviatoric stress, both the creep stabilization time and deformation magnitude increase. The creep deformation exhibits a characteristic trend: initial acceleration followed by gradual deceleration until stabilization. This behavior reflects microstructural responses to stress—higher stresses induce greater particle rearrangement and initial deformation, followed by progressive structural reorganization that redistributes stresses and ultimately leads to stabilization.
The stress–strain behavior of remolded silt during triaxial creep reflects microstructural evolution under loading. External loads are initially shared between soil skeleton contact stresses and interparticle viscous resistance. As strain increases and void ratio decreases, the load progressively transfers from viscous resistance to skeletal contacts. Under low-strain-rate loading, creep manifests as gradually diminishing void ratio changes. Small loads permit static equilibrium between contact stresses and external loads, resulting in decaying-stable creep. When loads exceed the skeleton’s yield limit, insufficient skeletal resistance causes accelerating creep. Prolonged loading induces significant skeletal reorganization, leading to either: (1) strain hardening where skeletal contacts ultimately balance external loads, or (2) strain softening where structural collapse transfers load to viscous resistance, accelerating creep until failure.

4.2. Partial Stress—Strain Isochronous Relationship Curve

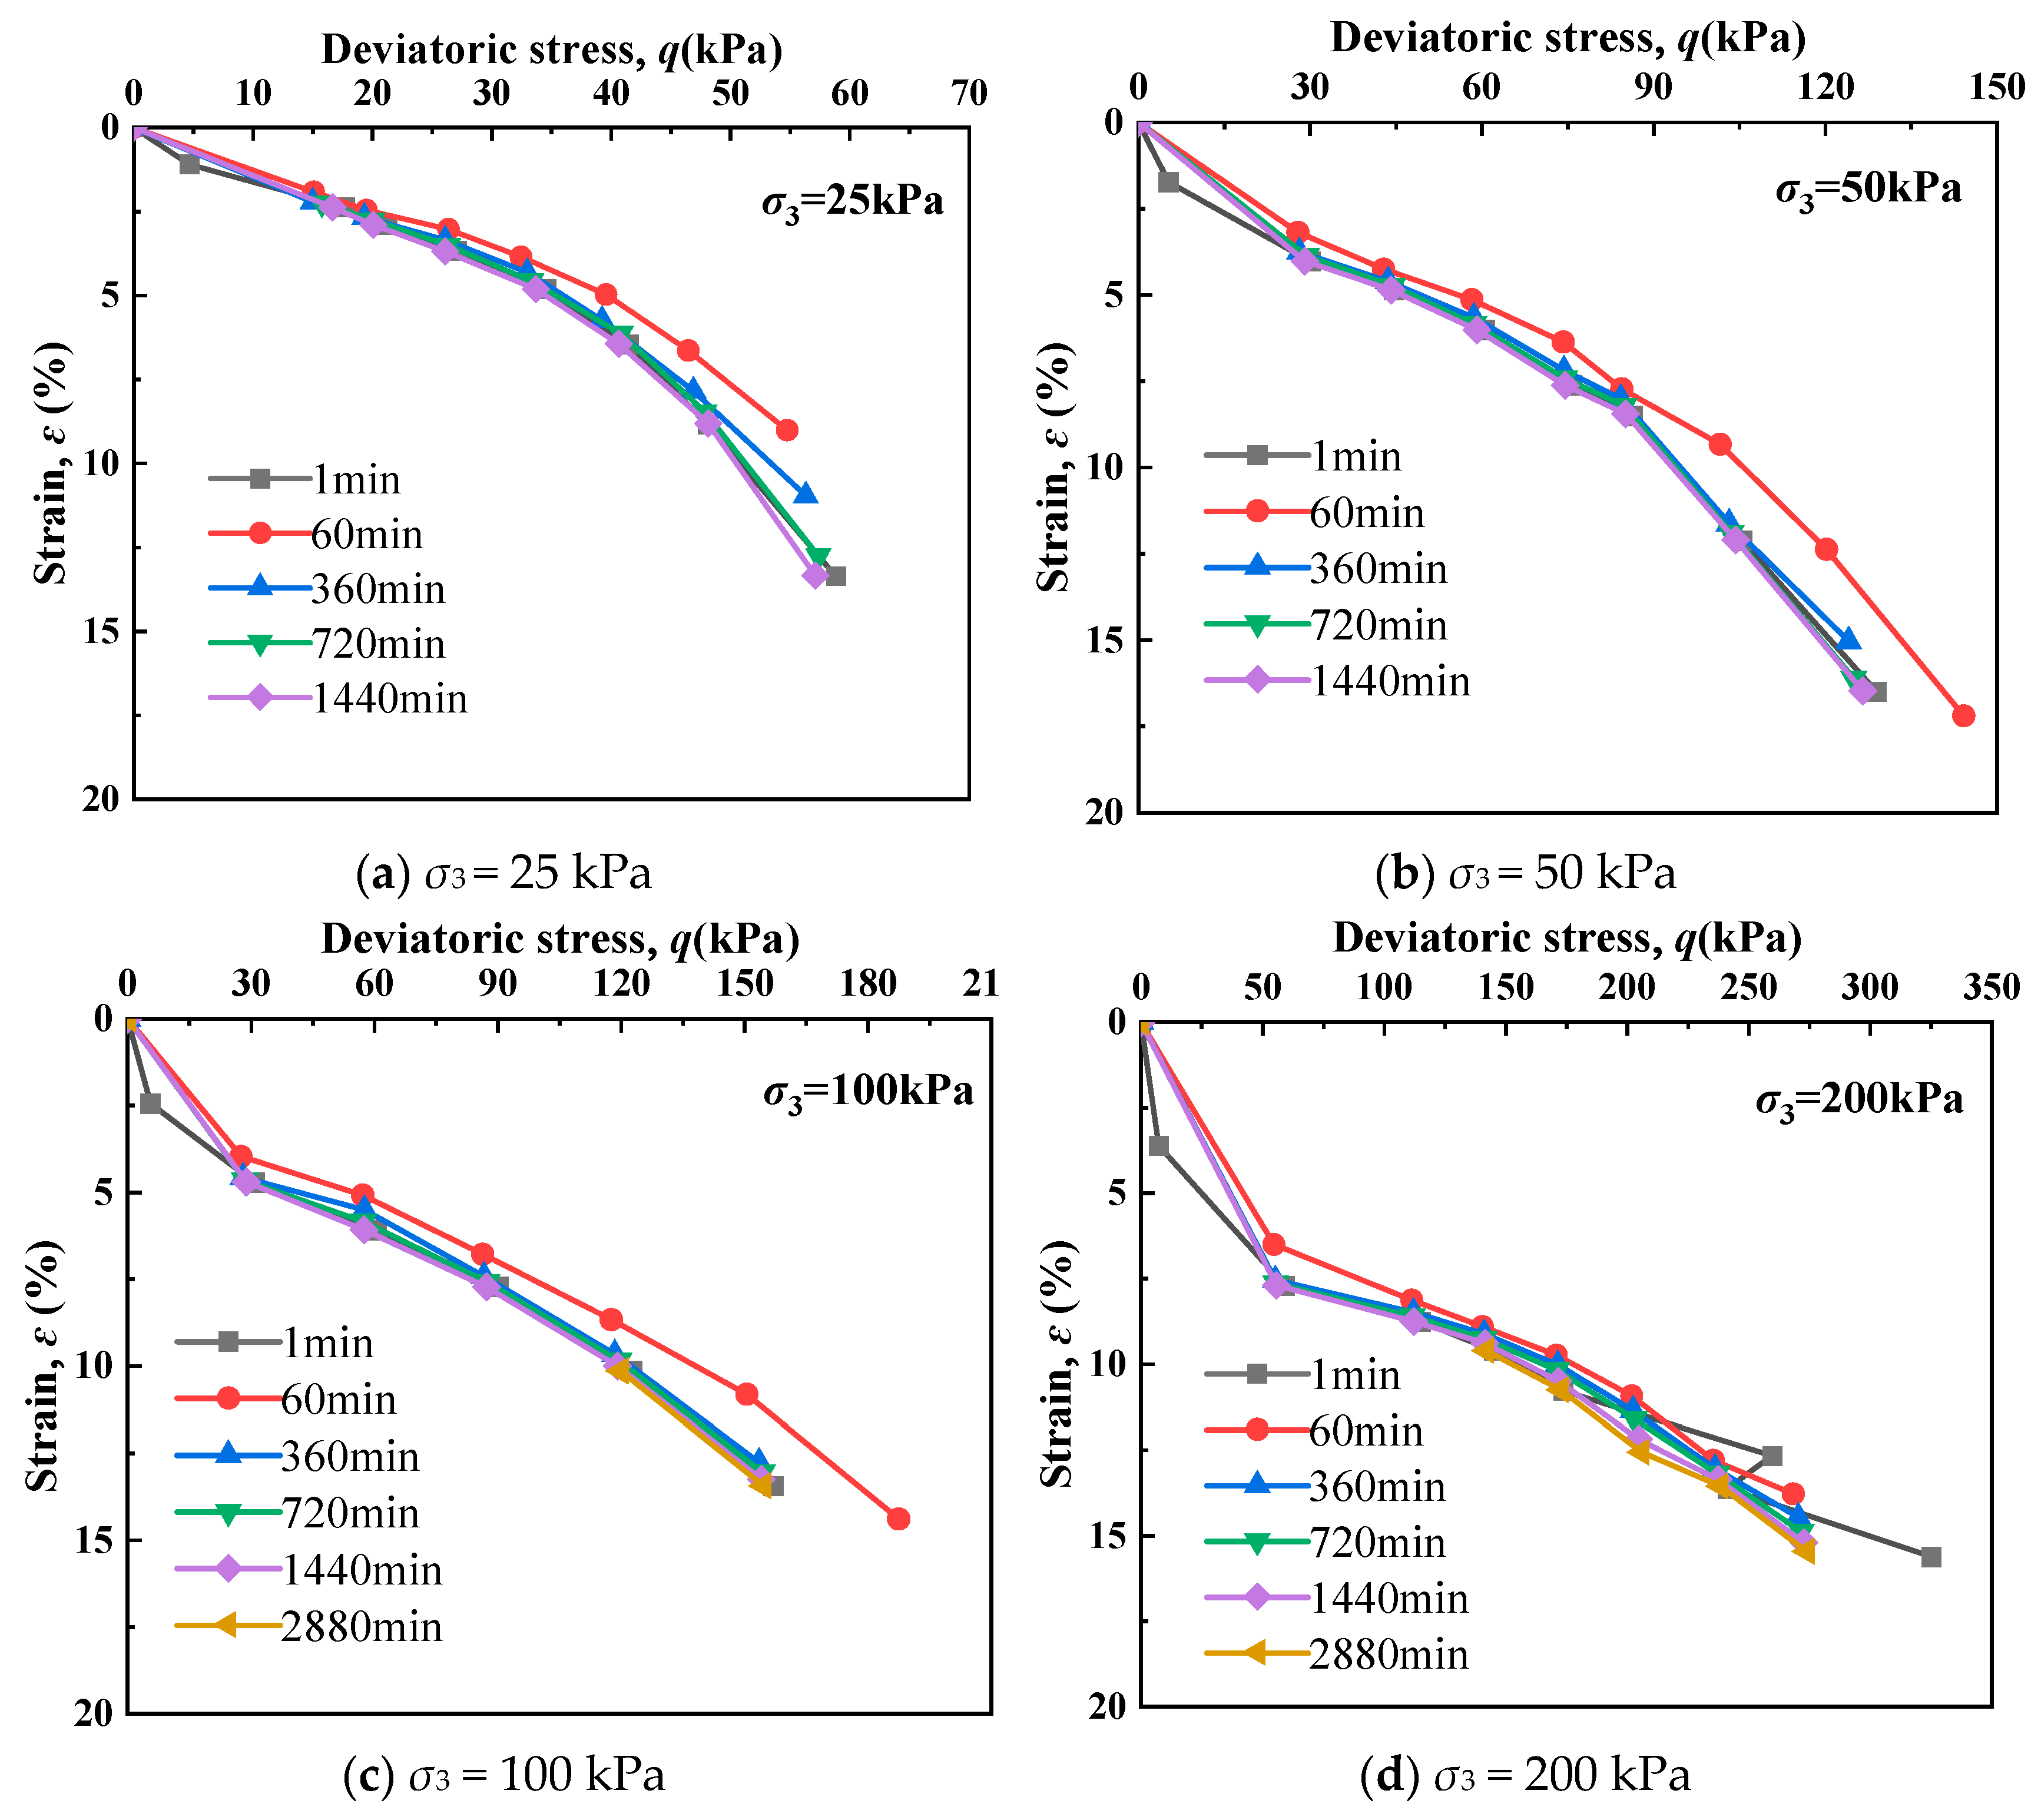
The strain values under different confining pressures and different eccentric stress states were selected at times of 1 min, 60 min, 360 min, 720 min, 1440 min and 2880 min, respectively. The time-dependent relationship curves of eccentric stress and axial strain were plotted as shown in Figure 24. It can be seen from the figure that the isochronous curves of eccentric stress–strain under different confining pressures show a certain degree of nonlinearity. However, at low confining pressures (25 kPa, 50 kPa), the isochrone relationship curve of eccentric stress and strain has no obvious yield point. As the confining pressure increases (100 kPa, 200 kPa), the isochrone curve shows inflection points when the eccentric stress is 25 kPa and 50 kPa, and yield occurs. Furthermore, as the confining pressure gradually increases, the isochronous relationship curve shows a transition from the stress axis to the strain axis, and the strain gradually flattens with the increase in stress, indicating that the reshaped silt has certain nonlinear creep characteristics.

5. Reconstruct the Evolution Characteristics of the Mesoscopic Creep Structure of Soft Soil

5.1. The Influence of Stress Levels

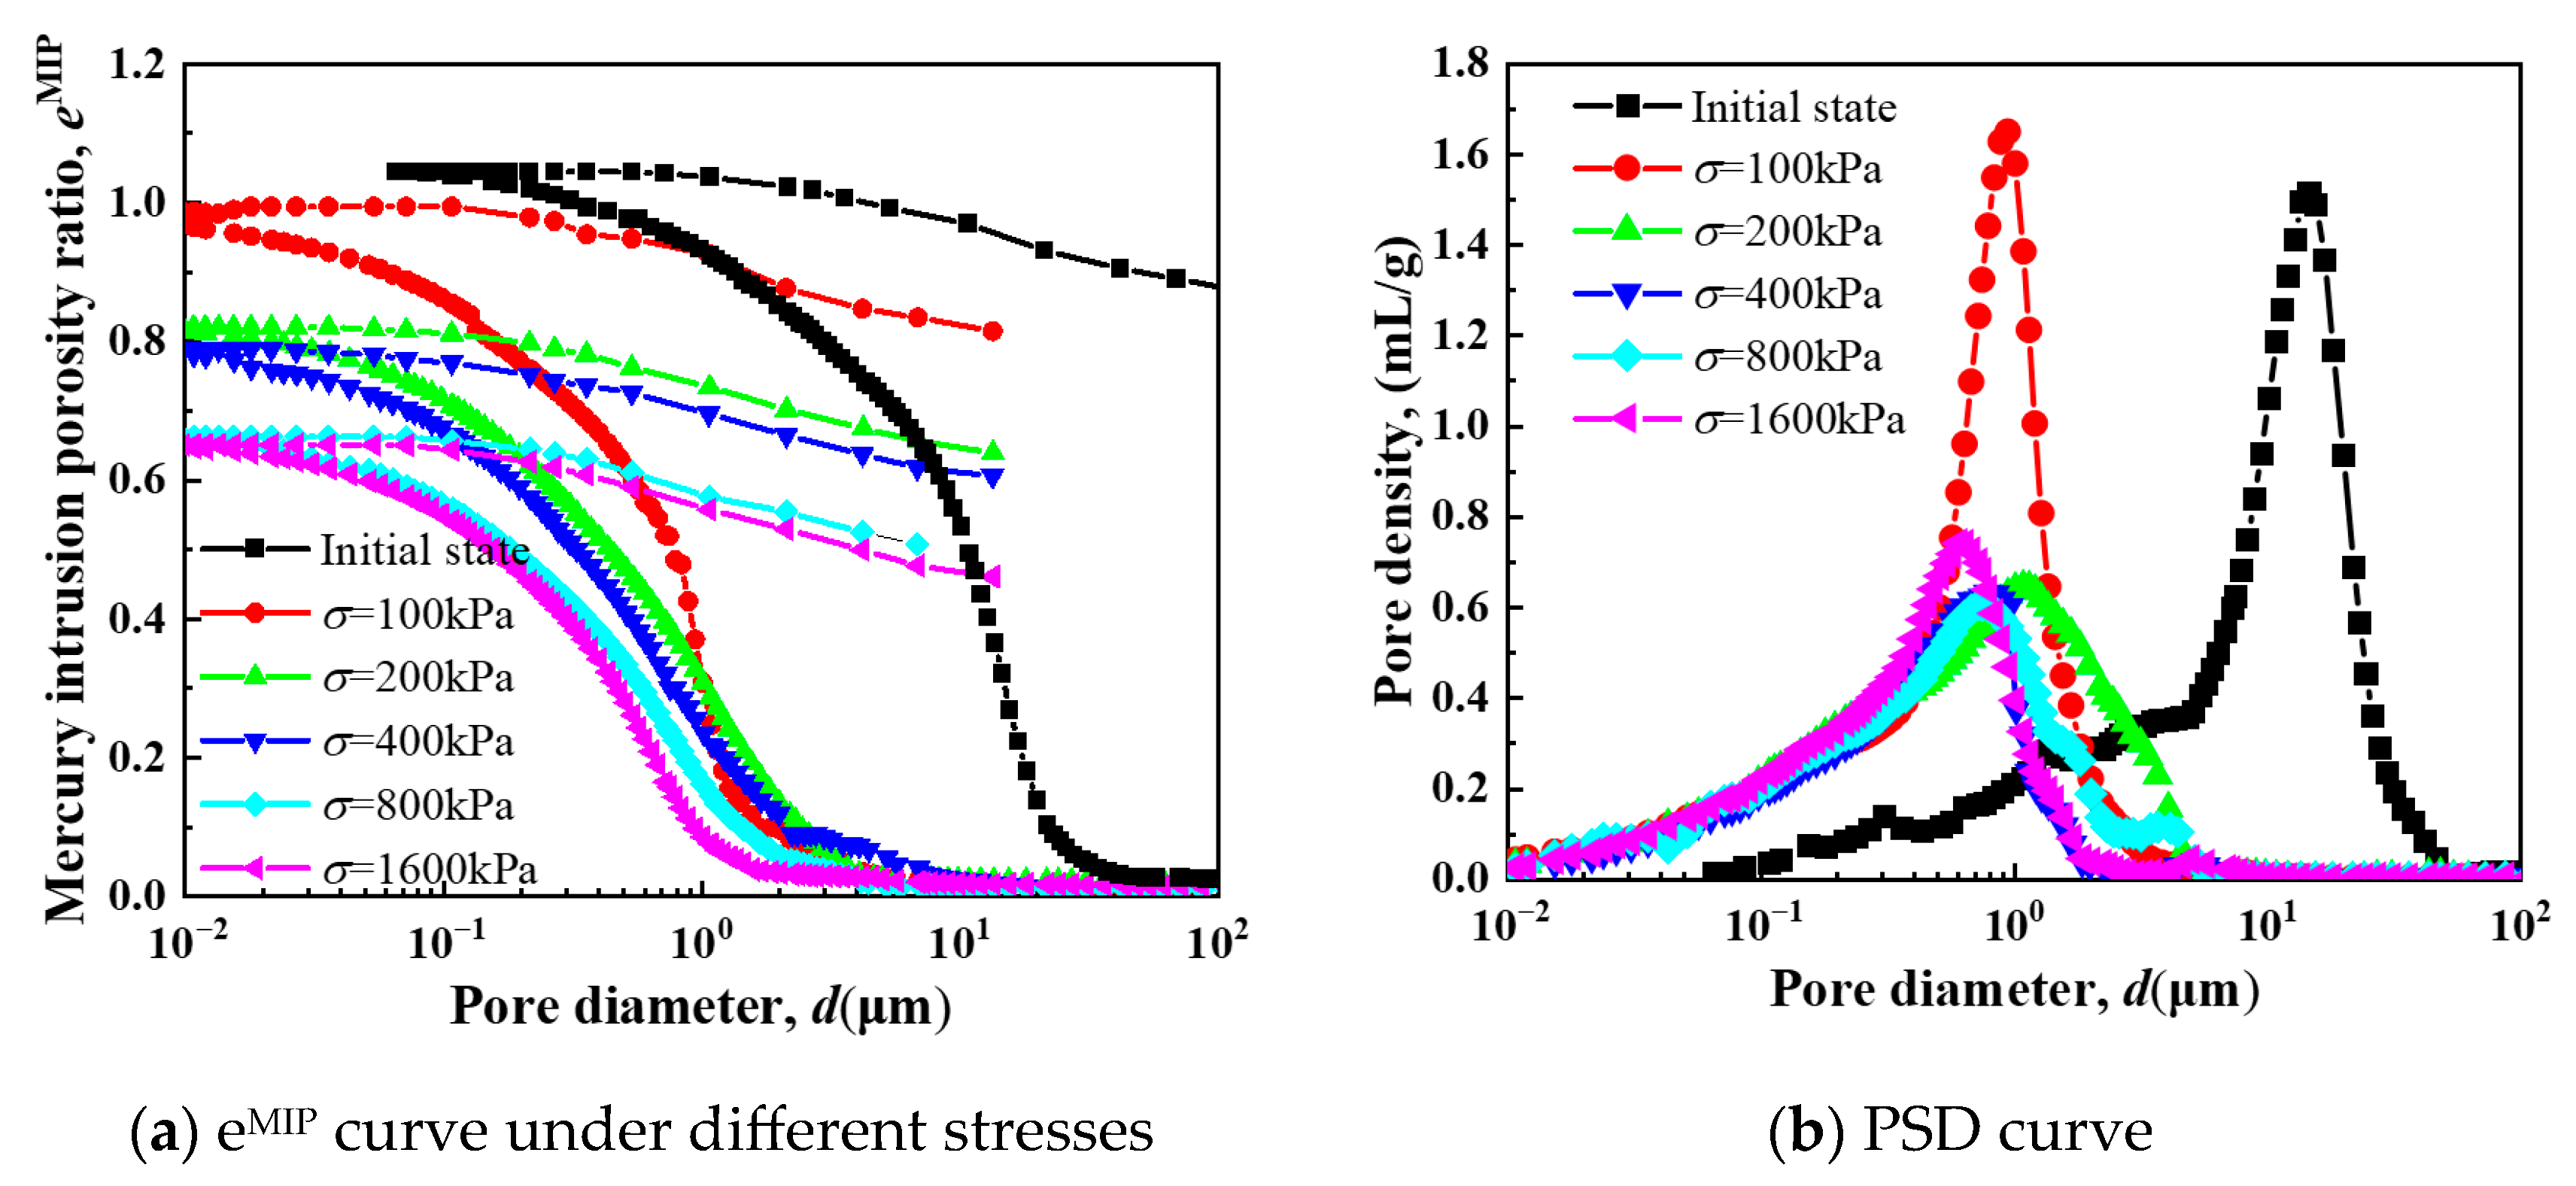
Figure 25a,b present the cumulative mercury intrusion porosity (eMIP) and pore size distribution (PSD) curves of remolded silt under different stress levels. The decreasing eMIP with increasing stress (Figure 25a) agrees with compression curves, validating the mercury intrusion tests. The PSD curves (Figure 25b) exhibit unimodal distributions, with peak pore diameters decreasing from 14.61 µm (0 kPa) to 0.64 µm (1600 kPa), accompanied by reduced peak densities. This shift indicates progressive compression of macropores (defined by peak diameters) under stress, confirming that soil compression primarily results from macropore collapse.
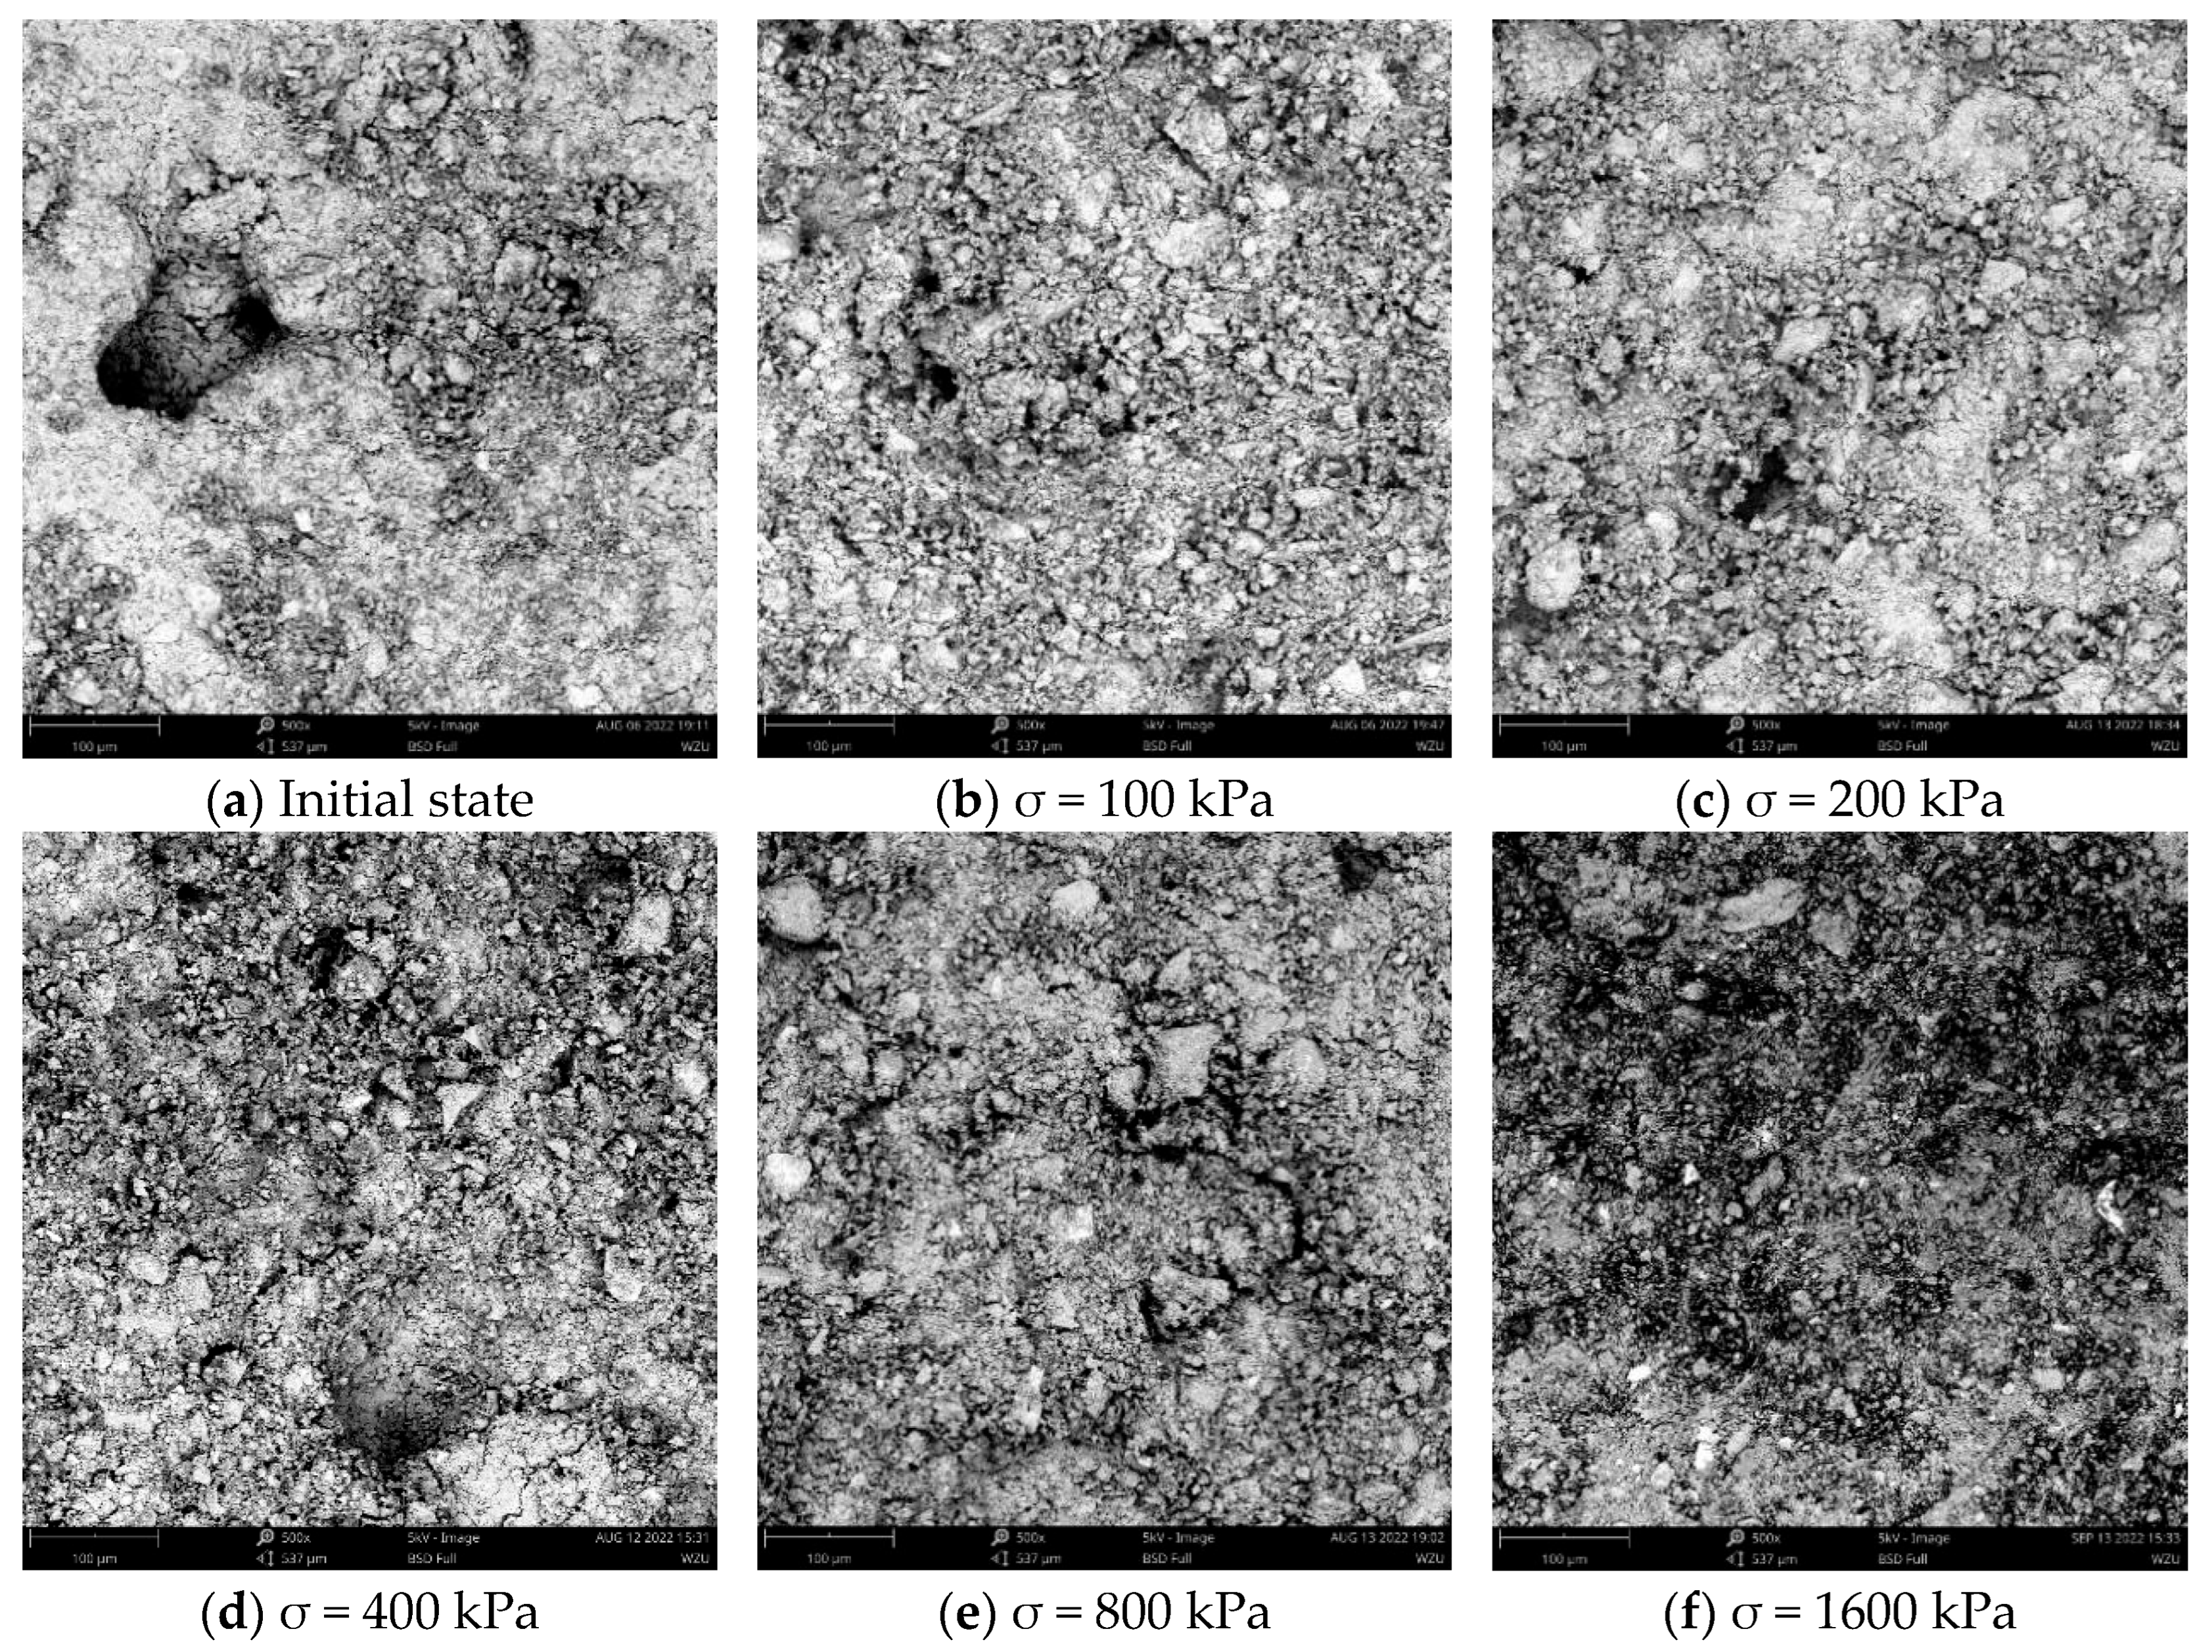
Figure 26 presents SEM images (500× magnification) where black areas represent pores and white areas show soil particles. Figure 26a reveals significant macro-pores, while Figure 26f demonstrates denser microstructure under higher stress levels, with compressed macro-pores evolving into meso-/micro-pores. These observations corroborate MIP test results, confirming stress-induced compression of pores and soil densification.

5.2. The Influence of the OCR

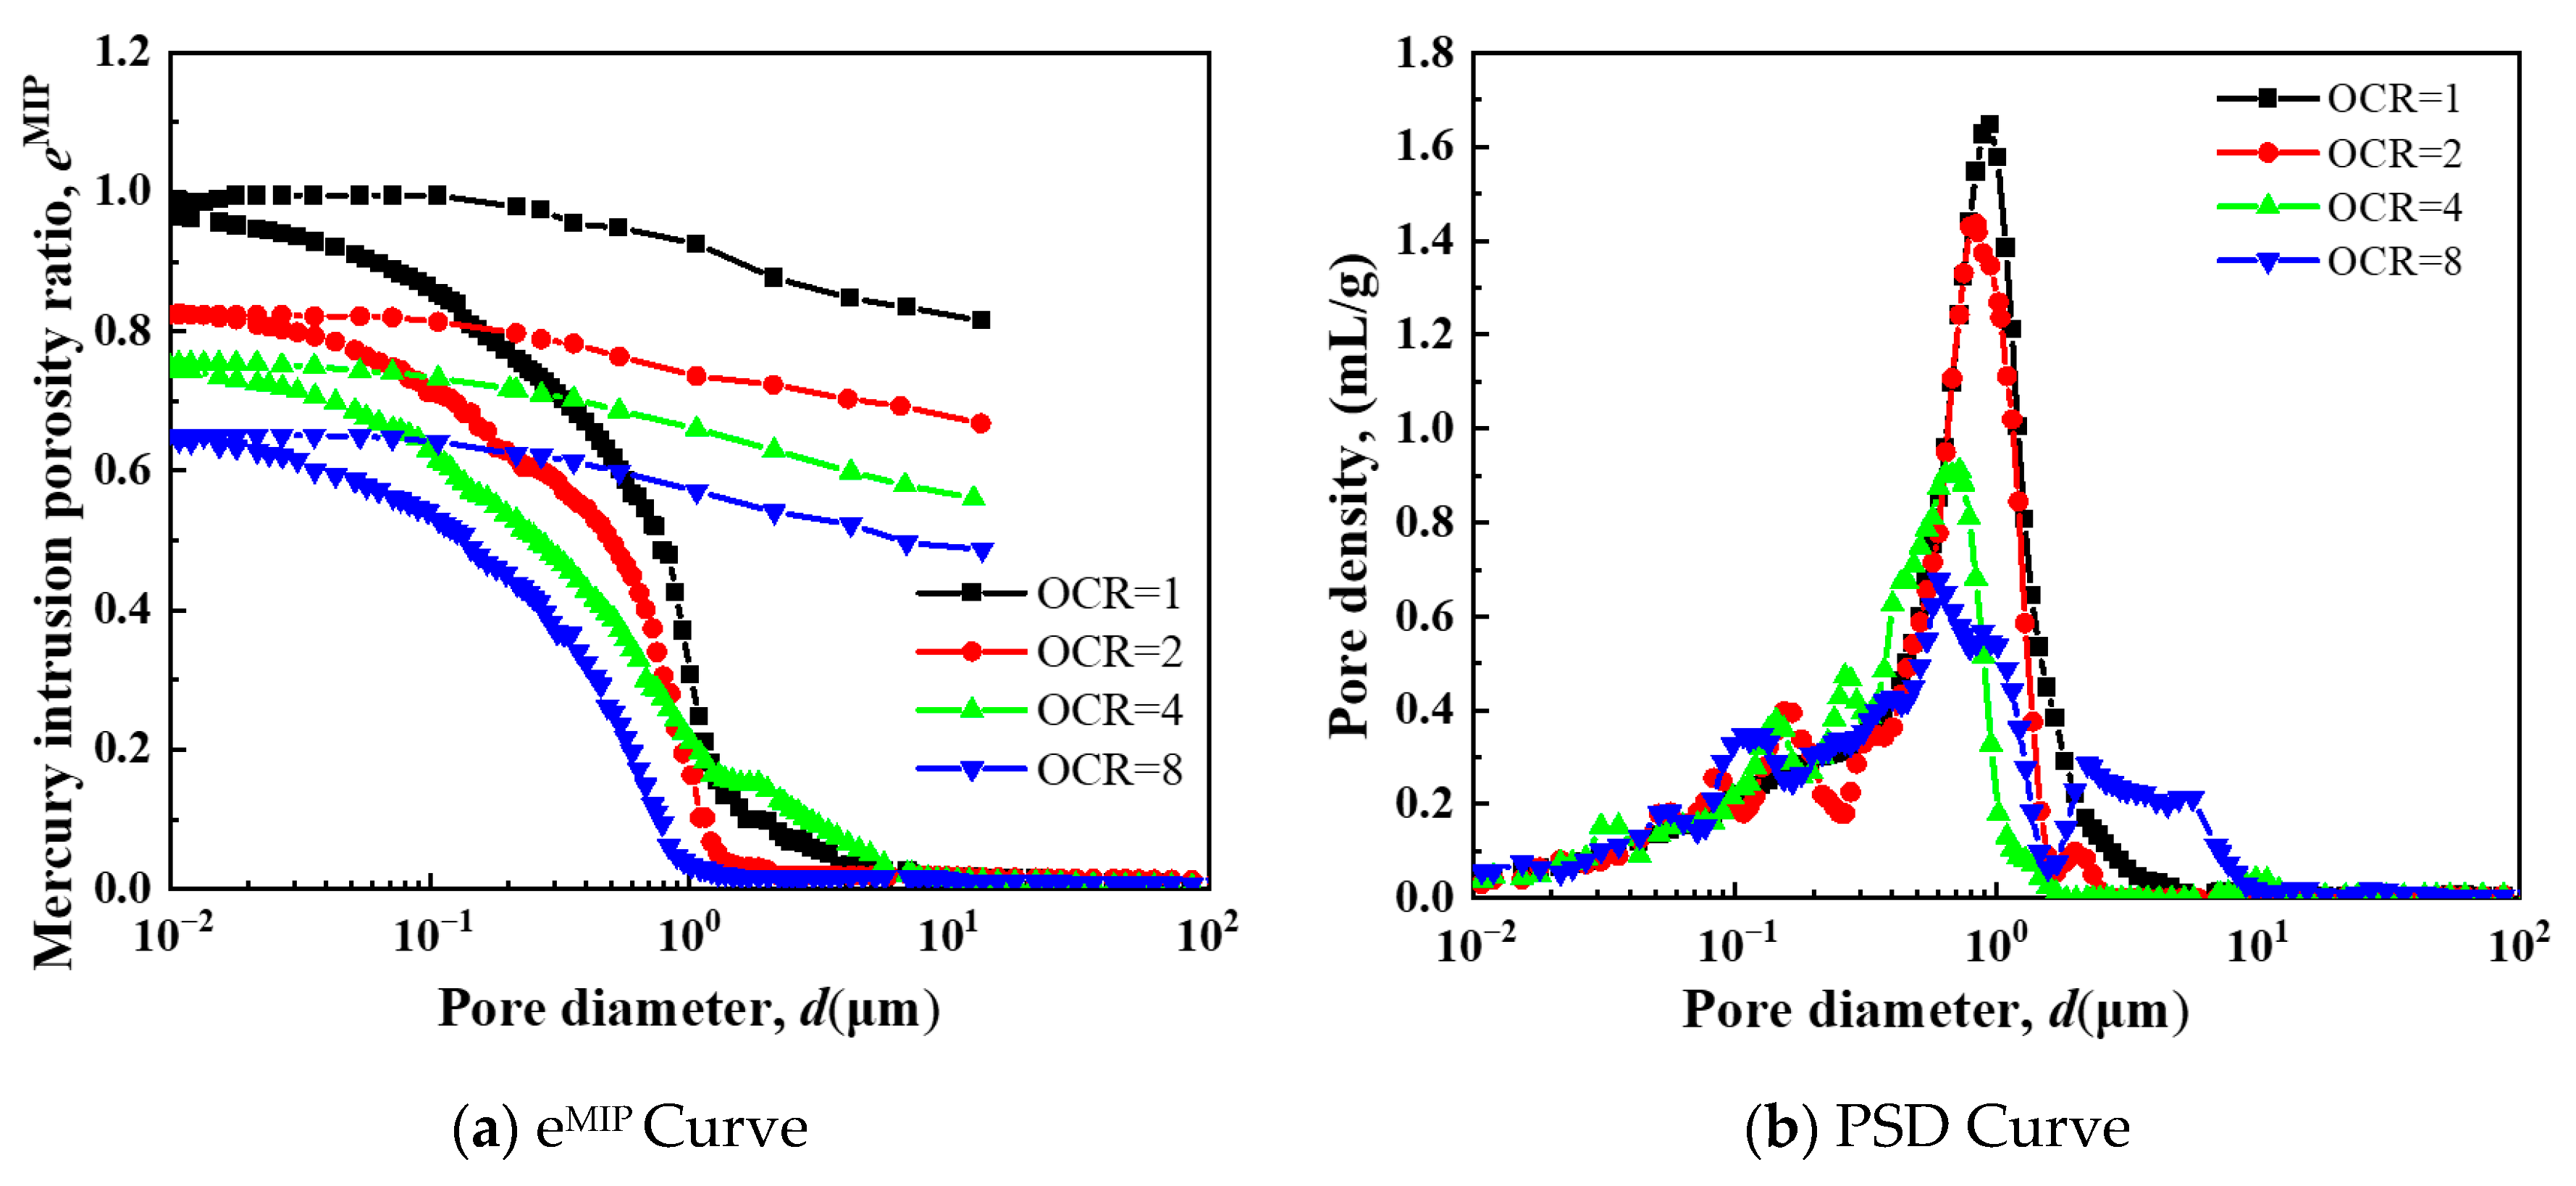
Figure 27 shows the eMIP and PSD curves under different OCRs. The decreasing eMIP with increasing OCR indicates denser particle packing and reduced porosity. All PSD curves exhibit unimodal distributions with minor peak variations, suggesting particle rearrangement and uniform microstructure. Notably, the decreasing peak pore density with higher OCR confirms reduced porosity and creep, consistent with macroscopic observations.
Figure 28 shows the SEM variation curves of reshaped soft soil under different super-consolidation ratios. It can be seen from the figure that as the super-consolidation ratio increases, the sample structure becomes denser, further confirming the pore variation observed by MIP.

5.3. The Influence of Creep Time

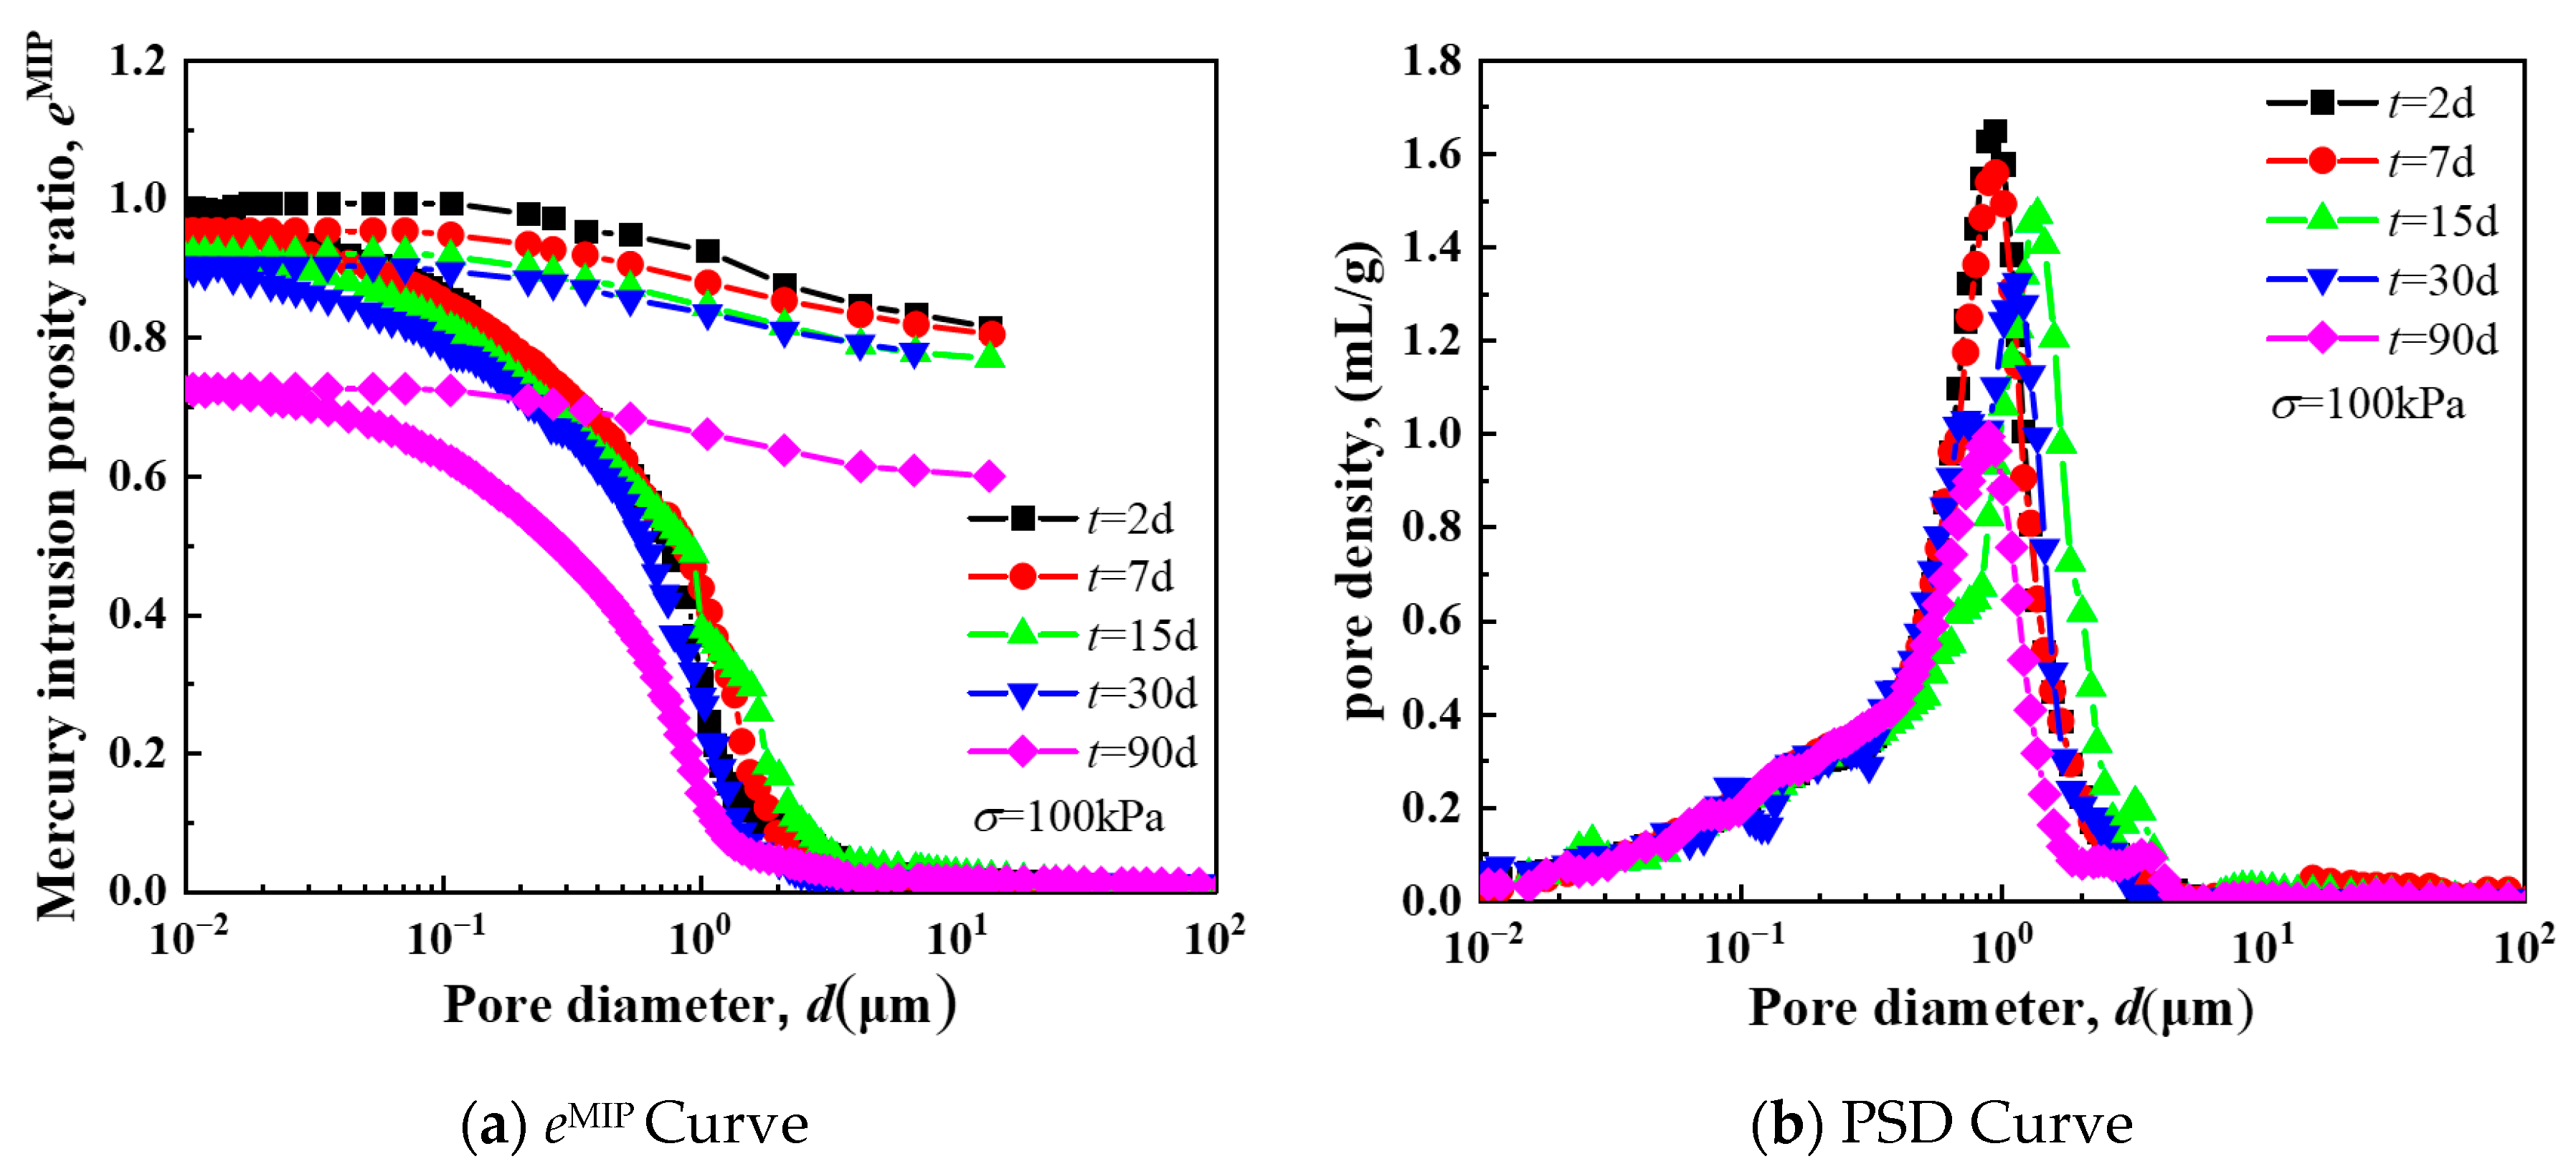
The eMIP and PSD curves of remolded silt under 100 kPa and 400 kPa after different creep durations are shown in Figure 29 and Figure 30, respectively. The results demonstrate a progressive decrease in both mercury intrusion porosity (e.g., from 0.992 to 0.725 at 100 kPa) and peak pore density (from 1.649 to 0.988 at 100 kPa; 0.630 to 0.464 at 400 kPa) with increasing creep time from 2 to 90 days. While the peak pore diameter remains relatively constant at 400 kPa, the consistent reduction in pore density indicates time-dependent compression of macropores through particle sliding and structural rearrangement under sustained loading.

6. Conclusions

Based on one-dimensional creep tests, triaxial creep tests and mesoscopic structure tests, this paper analyzes the influences of stress level, over-consolidation ratio and creep time on the creep characteristics of reshaped soft soil, and studies the evolution law of mesoscopic structure during the creep process of reshaped soft soil. The main conclusions are as follows:
  • The research reveals critical characteristics of remolded silt creep and mesoscopic evolution. First, the secondary consolidation coefficient exhibits distinct stress dependence: it increases rapidly with stress level, peaks at 0.006 under 50 kPa, then decreases and stabilizes. It also shows an inverse relationship with OCR, decreasing as OCR increases, with higher OCR values effectively reducing long-term creep deformation. Second, long-term creep deformation follows four stages (instantaneous, primary consolidation, secondary consolidation, and accelerated secondary consolidation), with the secondary consolidation coefficient increasing over time, confirming time-dependent instability in creep behavior. Third, triaxial creep curves display three stages (attenuation, steady-state, and accelerated creep), with nonlinear attenuation characteristics; higher confining pressures raise the deviatoric stress threshold for entering accelerated creep. Additionally, stress–strain isochronous curves transition from near-linear to nonlinear with increasing stress, exhibiting yield behavior and shifting toward the strain axis as confining pressure increases. Finally, mesoscopic tests show a single-peak pore size distribution (PSD) in remolded silt; with increasing stress, OCR, and creep time, peak pore size and density decrease, and large pores are compressed, indicating that creep deformation is primarily driven by macropore compression.
  • An innovative multi-scale experimental framework linking “macroscopic creep–mesoscopic pore structure” was established for remolded silty clays; using MIP and SEM, this framework quantified for the first time the stress-dependent correlation between macropore collapse and macroscopic creep parameters (e.g., secondary consolidation coefficient Cα, accelerated creep threshold)—filling the gap in previous single-scale studies that overlooked this correlation and offering a universal method for long-term creep prediction of similar soils worldwide. Second, a novel “accelerated secondary consolidation stage” was identified in remolded silt: unlike traditional theory assuming constant Cα in this stage increases continuously over time due to long-term particle sliding and pore structure evolution, revising classical creep stage divisions and avoiding the ~20% underestimation of long-term settlement by traditional methods—a geographically unrestricted conclusion applicable to optimizing settlement calculations in global remolded silt engineering. Third, the critical OCR for suppressing remolded silty clay creep was quantified.
  • Despite these insights, the study has limitations. First, the current analysis focuses on mechanistic trends rather than large-scale statistical validation. Additionally, the number of specimens used is not explicitly reported, which limits the detailed assessment of variability. Second, mesoscopic structural analyses remain primarily qualitative, with limited quantitative correlations between pore evolution and macroscopic creep. Third, tests were conducted under controlled laboratory conditions, and extrapolation to complex field environments (e.g., varying temperature, salinity, or soil heterogeneity) requires further validation.
  • To build on this work, future studies should: (1) incorporate quantitative statistical analyses of specimen variability to strengthen the reliability of results reliability; (2) develop quantitative models linking mesoscopic parameters (e.g., pore size distribution, particle alignment) to macroscopic creep using advanced techniques like 3D microstructure imaging or synchrotron-based characterization; (3) conduct field monitoring of engineered structures in Wenzhou to validate laboratory findings under real-world conditions; (4) explore extended test conditions, such as temperature effects or additive-based modifications (e.g., cementation), to expand understanding of creep mitigation strategies [28].

Author Contributions

Conceptualization, Y.S., X.Y. and W.Q.; Methodology, Y.C. and W.Q.; Software, W.Q., G.P., K.L. and Y.L.; Validation, Y.C., X.Y., W.Q., Z.Z., K.L. and Y.L.; Formal analysis, W.Q., G.P., K.L. and Y.L.; Investigation, Y.S., W.Q., G.P., K.L. and Y.L.; Resources, W.Q. and Z.Z.; Data curation, W.Q., G.P., K.L. and Y.L.; Writing—original draft, W.Q., Z.Z., G.P., K.L. and Y.L.; Writing—review & editing, W.Q., Z.Z., G.P. and K.L.; Visualization, W.Q. and Z.Z.; Supervision, W.Q.; Project administration, Y.S., Y.C., X.Y. and W.Q.; Funding acquisition, W.Q. All authors have read and agreed to the published version of the manuscript.

Funding

This study is supported by Wenzhou Science and Technology Commissioner Program (Grant No. X2023102); China Postdoctoral Science Foundation (Grant No. 2025T180892); Postdoctoral Science Foundation of Heilongjiang Province of China (Grant No. LBH-Z23037); National Natural Science Foundation of China (Grant No. 52178349); Education Department of Zhejiang Province (Grant No. Y202454521; Y202351959); Graduate Scientific Research Foundation of Wenzhou University (Grant No. 3162024003089).

Data Availability Statement

Some or all data, models, or code that support the findings of this study are available from the corresponding author upon reasonable request.

Conflicts of Interest

Authors Yi Shi, Yongwei Chen and Xiaohui Yi were employed by the company Wenzhou Electrical Power Design Co, Ltd. The remaining authors declare that the research was conducted in the absence of any commercial or financial relationships that could be construed as a potential conflict of interest.

References

  1. Qin, W.; Cai, S.; Dai, G.; Wang, D.; Chang, K. Soil Resistance during Driving of Offshore Large-Diameter Open-Ended Thin-Wall Pipe Piles Driven into Clay by Impact Hammers. Comput. Geotech. 2023, 153, 105085. [Google Scholar] [CrossRef]
  2. Chen, Z.; Deng, H.; Dai, G.; Zhu, M.; Gong, W.; Azadi, M.R. Study on the influence of unsymmetrical surcharge on adjacent pile foundations in a coastal soft soil area. Soil Dyn. Earthq. Eng. 2025, 194, 109365. [Google Scholar] [CrossRef]
  3. Wang, L.; Qiao, X.; Li, M.; Zhang, Y. Application and Development of Intelligent Systems in Monitoring and Early Warning of Coastal Soft Soil Foundation. Procedia Comput. Sci. 2024, 243, 577–584. [Google Scholar] [CrossRef]
  4. Liu, F.; Zheng, G.; Cui, G. Settlement deformation characteristics and control of soft soil through groundwater discharge zone. Desalin. Water Treat. 2021, 241, 282–287. [Google Scholar] [CrossRef]
  5. Peduto, D.; Giangreco, C.; Venmans, A.A. Differential settlements affecting transition zones between bridges and road embankments on soft soils: Numerical analysis of maintenance scenarios by multi-source monitoring data assimilation. Transp. Geotech. 2020, 24, 100369. [Google Scholar] [CrossRef]
  6. Qin, W.; Ye, C.; Gao, J.; Dai, G.; Wang, D.; Dong, Y. Pore water pressure of clay soil around large-diameter open-endedthin-walled pile (LOTP) during impact penetration. Comput. Geotech. 2025, 180, 107065. [Google Scholar]
  7. Qin, W.; Gao, J.; Chang, K.; Dai, G.; Wei, H. Set-up effect of large-diameter open-ended thin-walled pipe piles driven in clay. Comput. GeotechReshapeics 2023, 159, 105459. [Google Scholar]
  8. Li, P.; Yin, J.-H.; Yin, Z.-Y.; Chen, Z. One–dimensional nonlinear finite strain analysis of self–weight consolidation of soft clay considering creep. Comput. Geotech. 2023, 153, 105081. [Google Scholar] [CrossRef]
  9. Asgari, A.; Sorkhi, S.F.A. Wind turbine performance under multi-hazard loads: Wave, wind, and earthquake effects on liquefiable soil. Results Eng. 2025, 26, 104647. [Google Scholar] [CrossRef]
  10. Mendoza, C.; Caicedo, B.; Duque, J. Technical report on the compression, structure, and creep behaviors of lacustrine soil deposits in Bogotá, Colombia. Soils Found. 2022, 62, 101215. [Google Scholar] [CrossRef]
  11. Oliveira, P.J.V.; Correia, A.A.; Lemos, L.J. Numerical modelling of the effect of curing time on the creep behaviour of a chemically stabilised soft soil. Comput. Geotech. 2017, 91, 117–130. [Google Scholar] [CrossRef]
  12. Zhi, B.; Wang, S.; Wei, P.; Liu, E.; Han, W. Experimental Study on Creep Characteristics of Loess with Different Compactness. KSCE J. Civ. Eng. 2024, 28, 1702–1714. [Google Scholar] [CrossRef]
  13. Feng, W.Q.; Yin, J.H.; Chen, W.B.; Tan, D.Y.; Wu, P.C. A new simplified method for calculating consolidation settlement of multi-layer soft soils with creep under multi-stage ramp loading. Eng. Geol. 2020, 264, 105322. [Google Scholar] [CrossRef]
  14. Shen, Z.; Tian, Z.; Chen, X. Experimental Study on the Compression Creep Characteristics of Soft Soil in the West Area of Nanjing. J. Nanjing Inst. Technol. (Nat. Sci. Ed.) 2015, 13, 12–14. [Google Scholar]
  15. Sun, H.; Hou, M.; Chen, C.; Ge, X. Microstructure investigation of soft clay subjected to triaxial loading. Eng. Geol. 2020, 274, 105735. [Google Scholar] [CrossRef]
  16. Burton, G.J.; Pineda, J.A.; Sheng, D.; Airey, D. Microstructural changes of an undisturbed, reconstituted and compacted high plasticity clay subjected to wetting and drying. Eng. Geol. 2015, 193, 363–373. [Google Scholar] [CrossRef]
  17. Hicher, P.Y.; Wahyudi, H.; Tessier, D. Microstructural analysis of inherent and induced anisotropy in clay. Mech. Cohesive-Frict. Mater. 2000, 5, 341–371. [Google Scholar] [CrossRef]
  18. Yang, P.; Li, C.; Wu, Z.; He, Z. Study on the microstructure and strength characteristics of marine soft soil under wet-dry cycle condition. Alex. Eng. J. 2024, 102, 240–249. [Google Scholar] [CrossRef]
  19. Li, J.X.; Wang, C.M.; Zhang, X.W. Creep properties and micropore changes of soft soil under different drainage conditions. Rock Soil Mech 2010, 31, 3493–3498. [Google Scholar]
  20. Xie, X.; Qi, S.; Zhao, F.; Wang, D. Creep behavior and the microstructural evolution of loess-like soil from Xi’an area, China. Eng. Geol. 2018, 236, 43–59. [Google Scholar] [CrossRef]
  21. Wang, Z.; Wong, R.C. Strain-dependent creep behavior of Athabasca oil sand in triaxial compression. Int. J. Geomech. 2017, 17, 04016027. [Google Scholar] [CrossRef]
  22. Wang, Z.; Wong, R.C. Strain-dependent and stress-dependent creep model for a till subject to triaxial compression. Int. J. Geomech. 2016, 16, 04015084. [Google Scholar] [CrossRef]
  23. ASTM D2487—2017; Standard Practice for Classification of Soils for Engineering Purposes (Unified Soil Classification System). ASTM International: West Conshohocken, PA, USA, 2017.
  24. GB/T 50123-2019; Ministry of Housing and Urban-Rural Development of the People’s Republic of China, and State Administration for Market Regulation. Standard for Soil Test Methods. China Planning Press: Beijing, China, 2019.
  25. ASTM D2435/D2435M-19; ASTM International Standard Test Methods for Density and Unit Weight of Soil in Place by Nuclear Methods (Shallow Depth). ASTM International: West Conshohocken, PA, USA, 2019.
  26. Wang, E.L.; Ren, Z.F.; Han, H.W.; Tian, Y. Experimental study on uniaxial compressive strength of ultra-low temperature frozen clay. Chin. J. Geotech. Eng. 2021, 43, 1851–1860. [Google Scholar]
  27. Ruan, Y.; Zhu, S.; Qiao, W.; Wu, L.; Cai, L. Creep characteristics of lacustrine sedimentary peaty soil. Chin. J. Geotech. Eng. 2022, 44, 166–171. [Google Scholar]
  28. Asadoullahtabar, S.R.; Asgari, A.; Tabari, M.M.R. Assessment, identifying, and presenting a plan for the stabilization of loessic soils exposed to scouring in the path of gas pipelines, case study: Maraveh-Tappeh city. Eng. Geol. 2024, 342, 107747. [Google Scholar] [CrossRef]
Figure 1. Wenzhou Bridge-end bump. (Available online: https://wzzhzfj.wenzhou.gov.cn/art/2022/7/18/art_1269743_59017092.html (accessed on 14 September 2025)).
Buildings 15 03378 g001
Figure 2. Size distribution curve.
Buildings 15 03378 g002
Figure 3. e-lgσ curve for remodeled soft soil.
Buildings 15 03378 g003
Figure 4. Reinventing the Soft Soil Preparation Process.
Buildings 15 03378 g004
Figure 5. Reinventing the Sample Preparation Process for One-Dimensional Creep Tests on Soft Soils.
Buildings 15 03378 g005
Figure 6. Remodeling of soft soil triaxial specimen preparation process.
Buildings 15 03378 g006
Figure 7. Sample Preparation for Fine Structure Observation.
Buildings 15 03378 g007
Figure 8. One-Dimensional Consolidator.
Buildings 15 03378 g008
Figure 9. Triaxial Instrument.
Buildings 15 03378 g009
Figure 10. Equipment for microstructure observation. (a) AutoPore IV 9500 Mercury Intrusion Porosimeter; (b) SEM—Scanning Electron Microscope.
Buildings 15 03378 g010
Figure 11. Test procedure.
Buildings 15 03378 g011
Figure 12. e-lgt curves for remodeled soft soil under different vertical stresses.
Buildings 15 03378 g012aBuildings 15 03378 g012b
Figure 13. Stress versus time curve.
Buildings 15 03378 g013
Figure 14. Secondary consolidation coefficient versus stress curve.
Buildings 15 03378 g014
Figure 15. e-lgt curves of remodeled soft soil with different overconsolidation ratios.
Buildings 15 03378 g015
Figure 16. e-lgt curves of remodeled soft soils at different overconsolidation ratios.
Buildings 15 03378 g016
Figure 17. Curve of secondary consolidation coefficient versus overconsolidation ratio.
Buildings 15 03378 g017
Figure 18. Different time e-lgt curves for remodeled soft soil under different stress levels.
Buildings 15 03378 g018aBuildings 15 03378 g018b
Figure 19. Different time e-lgt curves for remodeled soft soil with different super-consolidation ratios.
Buildings 15 03378 g019
Figure 20. Plot of secondary consolidation coefficient vs. time.
Buildings 15 03378 g020
Figure 21. Stress–strain isochronous relationship curve.
Buildings 15 03378 g021aBuildings 15 03378 g021b
Figure 22. Axial strain–time relationship curves of remodeled soft soil under.
Buildings 15 03378 g022
Figure 23. Triaxial creep test curves of remodeled soft soil.
Buildings 15 03378 g023
Figure 24. Isochronous relationship curves of deviatoric stress–strain under different confining pressures.
Buildings 15 03378 g024
Figure 25. (a) eMIP curve under different stresses; (b) PSD curve.
Buildings 15 03378 g025
Figure 26. SEM (×500) photographs of remodeled soft soil at different stresses.
Buildings 15 03378 g026
Figure 27. (a) eMIP curves at different super consolidation ratios; (b) PSD curve.
Buildings 15 03378 g027
Figure 28. SEM (×500) photographs of remodeled soft soil with different super consolidation ratios OCR.
Buildings 15 03378 g028
Figure 29. (a) eMIP curves at different times at 100 kPa; (b) PSD curves.
Buildings 15 03378 g029
Figure 30. (a) eMIP curve at different times at 400 kPa; (b) PSD curve.
Buildings 15 03378 g030
Table 1. The basic physical properties of remolded soft soil.
Remolded Consolidation Pressure (kPa)Water Content (%)Initial Void Ratio of Remolded SoilDensity of Remolded Soil (g/cm3)Specific Gravity of Soil
Gs
Plastic Limit
WP (%)
Liquid Limit
WL (%)
Plasticity Index
IP
5035.410.96–1.071.8052.6819.743.724
Table 2. Step-by-step loading and consolidation of remolded soil.
Load (Pressure)Day 1Day 2Day 3Day 4Day 5
Load (kg)0153060120
Pressure (kPa)06.2512.52550
Table 3. Ranges and Accuracy of Each Sensor in the Dynamic Three Axes.
ParameterRangeAccuracy
Axial Stress10 kN10 N
Axial Displacement100 mm0.07%
Confining Pressure2 MPa1 kPa
Confining Volume200 cm31 mm3
Back Pressure2 MPa1 kPa
Back Volume200 cm31 mm3
Pore Water Pressure2 MPa1 kPa
Servo Motor0.1–5 Hz/
Table 4. AutoPore IV Model 9500 Mercury Pressure Meter Parameters.
ComponentMeasurement Range
ChamberLow PressurePressure Range: 345 kPa; Pore Size Range: 360–3.6 µm
High PressurePressure Range: Atmospheric to 228 MPa; Pore Size Range: 6–0.0055 µm
PorosimeterSensorAccuracy: +/−0.10% of full scale; Hysteresis: 0.05% of full scale
Capillary Volume0.38, 1.1, 1.7, 3.1, 3.9 cm3 (depending on penetrometer specification)
Max Sample Size2.5 cm × 2.5 cm × 2.5 cm
Table 5. One-dimensional remolded soil creep test program.
Soil Typeσ (kPa)OCRT (d)
Remolded Soft Soil1001, 2, 4, 82, 90
100, 200, 400, 800, 160012
10012, 7, 15, 30, 90
40012, 7, 15, 30, 90
Table 6. Triaxial creep test program.
Confining Pressure
σ3 (kPa)
Axial Stress
σ1 (kPa)
Deviatoric Stress q (kPa)Each Level of Time
(d)
2537.512.51
4015
4520
5025
5530
6035
5075251
87.537.5
10050
112.562.5
12070
12575
100125251
15050
17575
2001002
225125
250150
200250501
300100
3251252
350150
375175
400200
Disclaimer/Publisher’s Note: The statements, opinions and data contained in all publications are solely those of the individual author(s) and contributor(s) and not of MDPI and/or the editor(s). MDPI and/or the editor(s) disclaim responsibility for any injury to people or property resulting from any ideas, methods, instructions or products referred to in the content.