Article

Assessment of Solar Radiation Datasets for Building Energy Simulation

by
Angélica S. Walsh García
1,
Ana Paula de Almeida Rocha
2,
Olga de Castro Vilela
3 and
Nathan Mendes
1,2,*
1
Thermal Systems Laboratory, Mechanical Engineering Graduate Program, Pontifícia Universidade Católica do Paraná—PUCPR, Curitiba 80215-901, PR, Brazil
2
EXA Group—Energy and Environmental Simulation, Graduate Program in Smart and Sustainable Cities, Pontifícia Universidade Católica do Paraná—PUCPR, Curitiba 80215-901, PR, Brazil
3
Center for Renewable Energy, Graduate Program in Energy and Nuclear Technologies, Universidade Federal de Pernambuco, Recife 52171-900, PE, Brazil
*
Author to whom correspondence should be addressed.
Buildings 2025, 15(18), 3337; https://doi.org/10.3390/buildings15183337
Submission received: 12 July 2025 / Revised: 26 August 2025 / Accepted: 29 August 2025 / Published: 15 September 2025
(This article belongs to the Special Issue Research on Sustainable Energy Performance of Green Buildings)

Abstract

Accurate solar radiation data are essential for reliable building energy simulations, particularly for policy making. However, uncertainty in solar input, especially in regions with limited ground-based measurements, can significantly affect simulation outcomes. This study investigates the impact of different solar radiation datasets on building energy performance simulations across two climatically distinct years, 2015 and 2024, in a subtropical urban environment. Solar inputs from ERA5, CAMS, and NASA POWER were compared against a regional reference from the Brazilian National Institute for Space Research (INPE). In addition to energy simulations, the datasets were evaluated using statistical metrics including root mean square error (RMSE), mean bias error (MBE), and Pearson correlation. NASA POWER showed the best agreement with ground data and yielded simulation results that were reasonably aligned with observed cooling loads and thermal comfort in both years, with slight overestimations in cooling demand and overheating hours. CAMS maintained consistent performance across both years and produced the lowest cooling and overheating estimates, slightly underestimating results while closely matching monthly trends. ERA5 exhibited the largest positive bias in solar input, particularly in DNI, leading to substantial overestimation of cooling demand, up to 34% in 2024, especially during heatwaves. These discrepancies highlight the sensitivity of energy simulations to solar input selection and the importance of using validated high-quality datasets to ensure reliable modeling under increasing climate variability.

1. Introduction

Global warming and increasing climate variability are intensifying the need for reliable building energy simulations to support climate-resilient design and urban adaptation strategies [1,2,3]. Among the key inputs for these simulations, solar radiation plays a pivotal role in shaping the thermal behavior of buildings, influencing cooling and heating loads, as well as the efficiency of solar energy systems [4]. However, accurate solar radiation data remain a critical challenge, particularly in regions with limited ground-based measurements or incomplete long-term records [5].
In recent years, various gridded datasets and reanalysis products, such as NASA’s POWER [6], ECMWF’s ERA5 Reanalysis Datasets [7,8], and CAMS radiation services [9], have been widely adopted as alternatives to in situ measurements [10,11,12]. These datasets offer extensive spatial and temporal coverage and have been validated across diverse climatic conditions [13,14], improving access to solar irradiance data, mainly in locations with limited access to validated surface observations. Other high-resolution datasets, such as SARAH and MERRA-2, are also available and have been successfully applied in solar energy assessments [15,16,17]. They have become essential data sources for researchers, serving as core inputs for defining boundary conditions in climate models across multiple scales, including the Weather Research and Forecasting (WRF) model [18] and projections developed under initiatives like CORDEX [19], used in both present-day and future climate simulations. Additionally, they play an increasingly prominent role in the generation of synthetic weather files used in building performance simulations [4,20,21].
Significant improvements in the quality and consistency of these datasets have been achieved through international coordination efforts aimed at standardization and validation. Initiatives like the Baseline Surface Radiation Network (BSRN) [22] and the National Solar Radiation Database (NSRDB) [23] are central to this progress, providing benchmark-quality reference measurements. Observational records are often integrated with satellite-derived datasets, such as NASA POWER, through bias-correction techniques [24], significantly improving the reliability. This is particularly important for components like Direct Normal Irradiance (DNI) and Diffuse Horizontal Irradiance (DHI), which have a strong influence on building energy simulations.
Despite these advancements, uncertainties persist regarding the accuracy, consistency, and suitability of solar datasets for energy modeling [20,25]. Several studies have reported performance variability linked to geographic region, seasonality, and the specific irradiance component considered, especially for DNI and DHI [26]. These inconsistencies may introduce considerable uncertainty in energy demand estimations and thermal comfort assessments [25]. While satellite data provide broad spatial coverage, they often lack the accuracy of in-situ measurements, which, conversely, are spatially limited but highly accurate [27].
Although solar resource assessment has seen considerable progress in recent years, particularly for photovoltaic applications [28,29], its integration into the domain of building energy simulation—especially under evolving climate conditions—is still insufficiently explored. This gap is especially evident in Brazil, a country with vast climatic diversity and high solar energy potential. While studies such as Araujo et al. [30] have evaluated satellite-based solar datasets against ground measurements at multiple locations across Brazil, their focus was limited to Global Horizontal Irradiance (GHI), neglecting the DNI and DHI, which are components essential for detailed thermal modeling.
Furthermore, other contributions like Bre et al. [20] investigated the quality of solar radiation data in the two most recent Brazilian Typical Meteorological Year (TMY) databases [31]. Their analysis focused on the GHI, comparing different modeling approaches and assessing how variations in solar radiation inputs influence the TMY construction and, by extension, the performance of building simulations across 92 locations. Although the study used NASA POWER as a satellite-derived reference and included a preliminary validation with ground data from four cities, it did not incorporate high-resolution ground measurements or explicitly evaluate the influence of the DNI and DHI on building performance. Similarly, Tippett et al. [32] explored the sensitivity of TMY-based simulations to different data sources but did not assess how these differences affect building performance simulations. As a result, the extent to which dataset-specific biases propagate through energy models, influencing thermal comfort, system sizing, and operational energy use, remains an open question.
This gap is particularly relevant given recent climatic developments in Brazil. In 2024, the country recorded its hottest year since 1961 (INMET), marked by intense heatwaves, altered precipitation patterns, and unseasonal temperature anomalies across multiple regions [33]. The southern region was particularly impacted, experiencing both unprecedented flooding events [34] and anomalously high temperatures [33]. Several Brazilian capitals set historical temperature records, reflecting a broader global pattern of extreme heat [33,35,36]. For instance, Curitiba, traditionally known for its cold winters compared to other Brazilian capitals, experienced unusual climatic conditions in 2024, underscoring a shift in regional climate dynamics. Long-term records reinforce this trend, with annual mean maximum and minimum temperatures increasing at rates of 0.04 °C/year and 0.03 °C/year, respectively, alongside a rising frequency of hot nights (Tr20), indicating a moderate yet consistent warming pattern [37]. These evolving conditions highlight the urgency of incorporating accurate and context-specific solar input data into building energy modeling to support climate-resilient architectural and urban planning strategies, as well as the expansion of solar energy systems.
This study therefore undertakes a comprehensive evaluation of the solar radiation dataset influence on building energy simulations for two climatically distinct years, 2015 and 2024. Simulations based on the ERA5, CAMS, and NASA POWER datasets, supplemented with data from the Brazilian National Institute of Meteorology (INMET), are compared against a regional benchmark derived from high-quality ground-based measurements provided by the Brazilian National Institute for Space Research (INPE) and INMET automatic weather stations. Although other high-resolution products exist (e.g., SARAH and MERRA-2) [15], this study focused specifically on ERA5, CAMS, and NASA POWER, because they are widely adopted in building performance workflows, readily accessible to practitioners, and provide consistent long-term coverage for Brazil.
The analysis emphasizes the magnitude and seasonality of energy demand discrepancies, the implications for thermal comfort, and the consistency of dataset performance under unstable and evolving climate conditions. This integrated approach, combining high-resolution observational data, advanced statistical validation, and dynamic simulation across climatically distinct years, offers new insights into the role of solar data accuracy in energy modeling under a changing climate. By comparing multiple datasets across different years, stakeholders can better quantify uncertainties, identify the most reliable inputs for specific applications, and strengthen the confidence in building energy simulations and long-term planning.
The remainder of this paper is structured as follows. Section 2 presents the methodological framework. Section 2.1 describes the study area and the development of Actual Weather Years (AWYs) based on observational data. Section 2.2 introduces the modeled datasets and outlines the validation metrics used to compare them against ground-based data. Section 2.3 details the setup and execution of building simulations in EnergyPlus. The results are presented in Section 3, and the conclusions and recommendations are summarized in Section 4.

2. Materials and Methods

This study combines climate data analysis and building energy simulation to evaluate the influence of different solar radiation datasets on building energy performance and indoor thermal comfort. As outlined in Figure 1, the methodology comprises three main components. First, Section 2.1 presents the baseline scenario, including the characterization of the study area and the construction of AWYs based on the observed data. Second, Section 2.2 introduces the selected solar radiation datasets, NASA POWER, CAMS, and ERA5, details the generation of alternative AWYs using modeled solar inputs, and presents the statistical metrics used to evaluate the dataset performance against ground-based measurements. Finally, Section 2.3 describes the setup and execution of building energy simulations in EnergyPlus, using both observed and modeled AWYs, to assess their impact on annual energy demand and thermal comfort under two operational scenarios: ideal HVAC and natural ventilation.

2.1. Baseline Climate Scenario Based on Observed Data

This section outlines the baseline climate scenario, including the geographical and climatic context of the study area and the methodology for generating AWYs based on the observed data for use in building energy simulations.

2.1.1. Area of Study

The study focuses on Curitiba, the capital of Paraná State in southern Brazil, located at 25° S latitude, 49° W longitude, and 935 m of averaged altitude, within a subtropical highland climate zone. Although Brazil is globally recognized for its abundant solar resources, Curitiba experiences moderate solar irradiance due to frequent cloud cover and high annual precipitation. According to the Brazilian Solar Atlas [38], the city receives an average annual GHI of approximately 1500 kWh/m2. While this positions Curitiba among the lower solar potential regions within Brazil, its GHI is still higher than the average observed in countries such as Germany and The Netherlands, where values typically range between 1000 and 1200 kWh/m2 [39]. Moreover, Curitiba’s solar resource is comparable to that of Mediterranean countries like Italy, Greece, and parts of Spain, regions recognized for having the highest solar energy potential in Europe.
Given this context, Curitiba represents a relevant case study for international comparisons, offering solar conditions similar to those in many regions with available scientific references for global comparison. Its intermediate solar irradiance and complex and variable climatic conditions make it particularly suitable for assessing the performance and uncertainties of modeled solar radiation datasets used in building energy simulations.

2.1.2. Sources of Ground-Based Climate Observations

Ground-truth data were obtained from two main sources in Curitiba. The first is a high-precision solarimetric station operated by the Brazilian National Institute for Space Research (INPE) as part of the SONDA network (Brazilian Environmental Data Organization System) [40,41,42]. This station is also integrated into the Solar Energy Research Station Network (EPESOL), coordinated by the Solar Energy Laboratory of the Federal Technological University of Paraná (LABENS-UTFPR).
In Curitiba, this station provides high-quality sub-hourly (one-minute) ground measurements of the GHI, DNI, and DHI. These data are essential for capturing local solar resource variability with high temporal resolution and serve as a reliable benchmark for validating modeled solar radiation datasets.
Complementary meteorological variables, such as the air temperature, relative humidity, wind speed and direction, and atmospheric pressure, were obtained from a nearby automatic weather station (A807) operated by the Brazilian National Institute of Meteorology (INMET) [43]. This station is equipped with a MAWS301 system, which records environmental parameters with high precision at one-minute intervals. The data are aggregated hourly, transmitted via satellite or cellular network, and subjected to centralized quality control protocols at INMET’s headquarters to ensure consistency and reliability.
Together, these datasets provided a robust reference for validating the modeled solar radiation products and for generating the weather files Energy Plus Weather (EPW) format used in the energy simulations.

2.1.3. Climatic Characterization of the Area of Study

Curitiba, Brazil, has experienced gradual warming trends and shifts in precipitation patterns, alongside marked interannual climatic variability [36,37]. Projections indicate continued shifts in these patterns, together with rising energy demand associated with urbanization [44,45]. Such dynamics directly affect building energy performance, particularly regarding heating and cooling requirements. To establish a realistic baseline for subsequent analyses, two representative years (2015 and 2024) were selected, based on the observational data from the previously described stations.
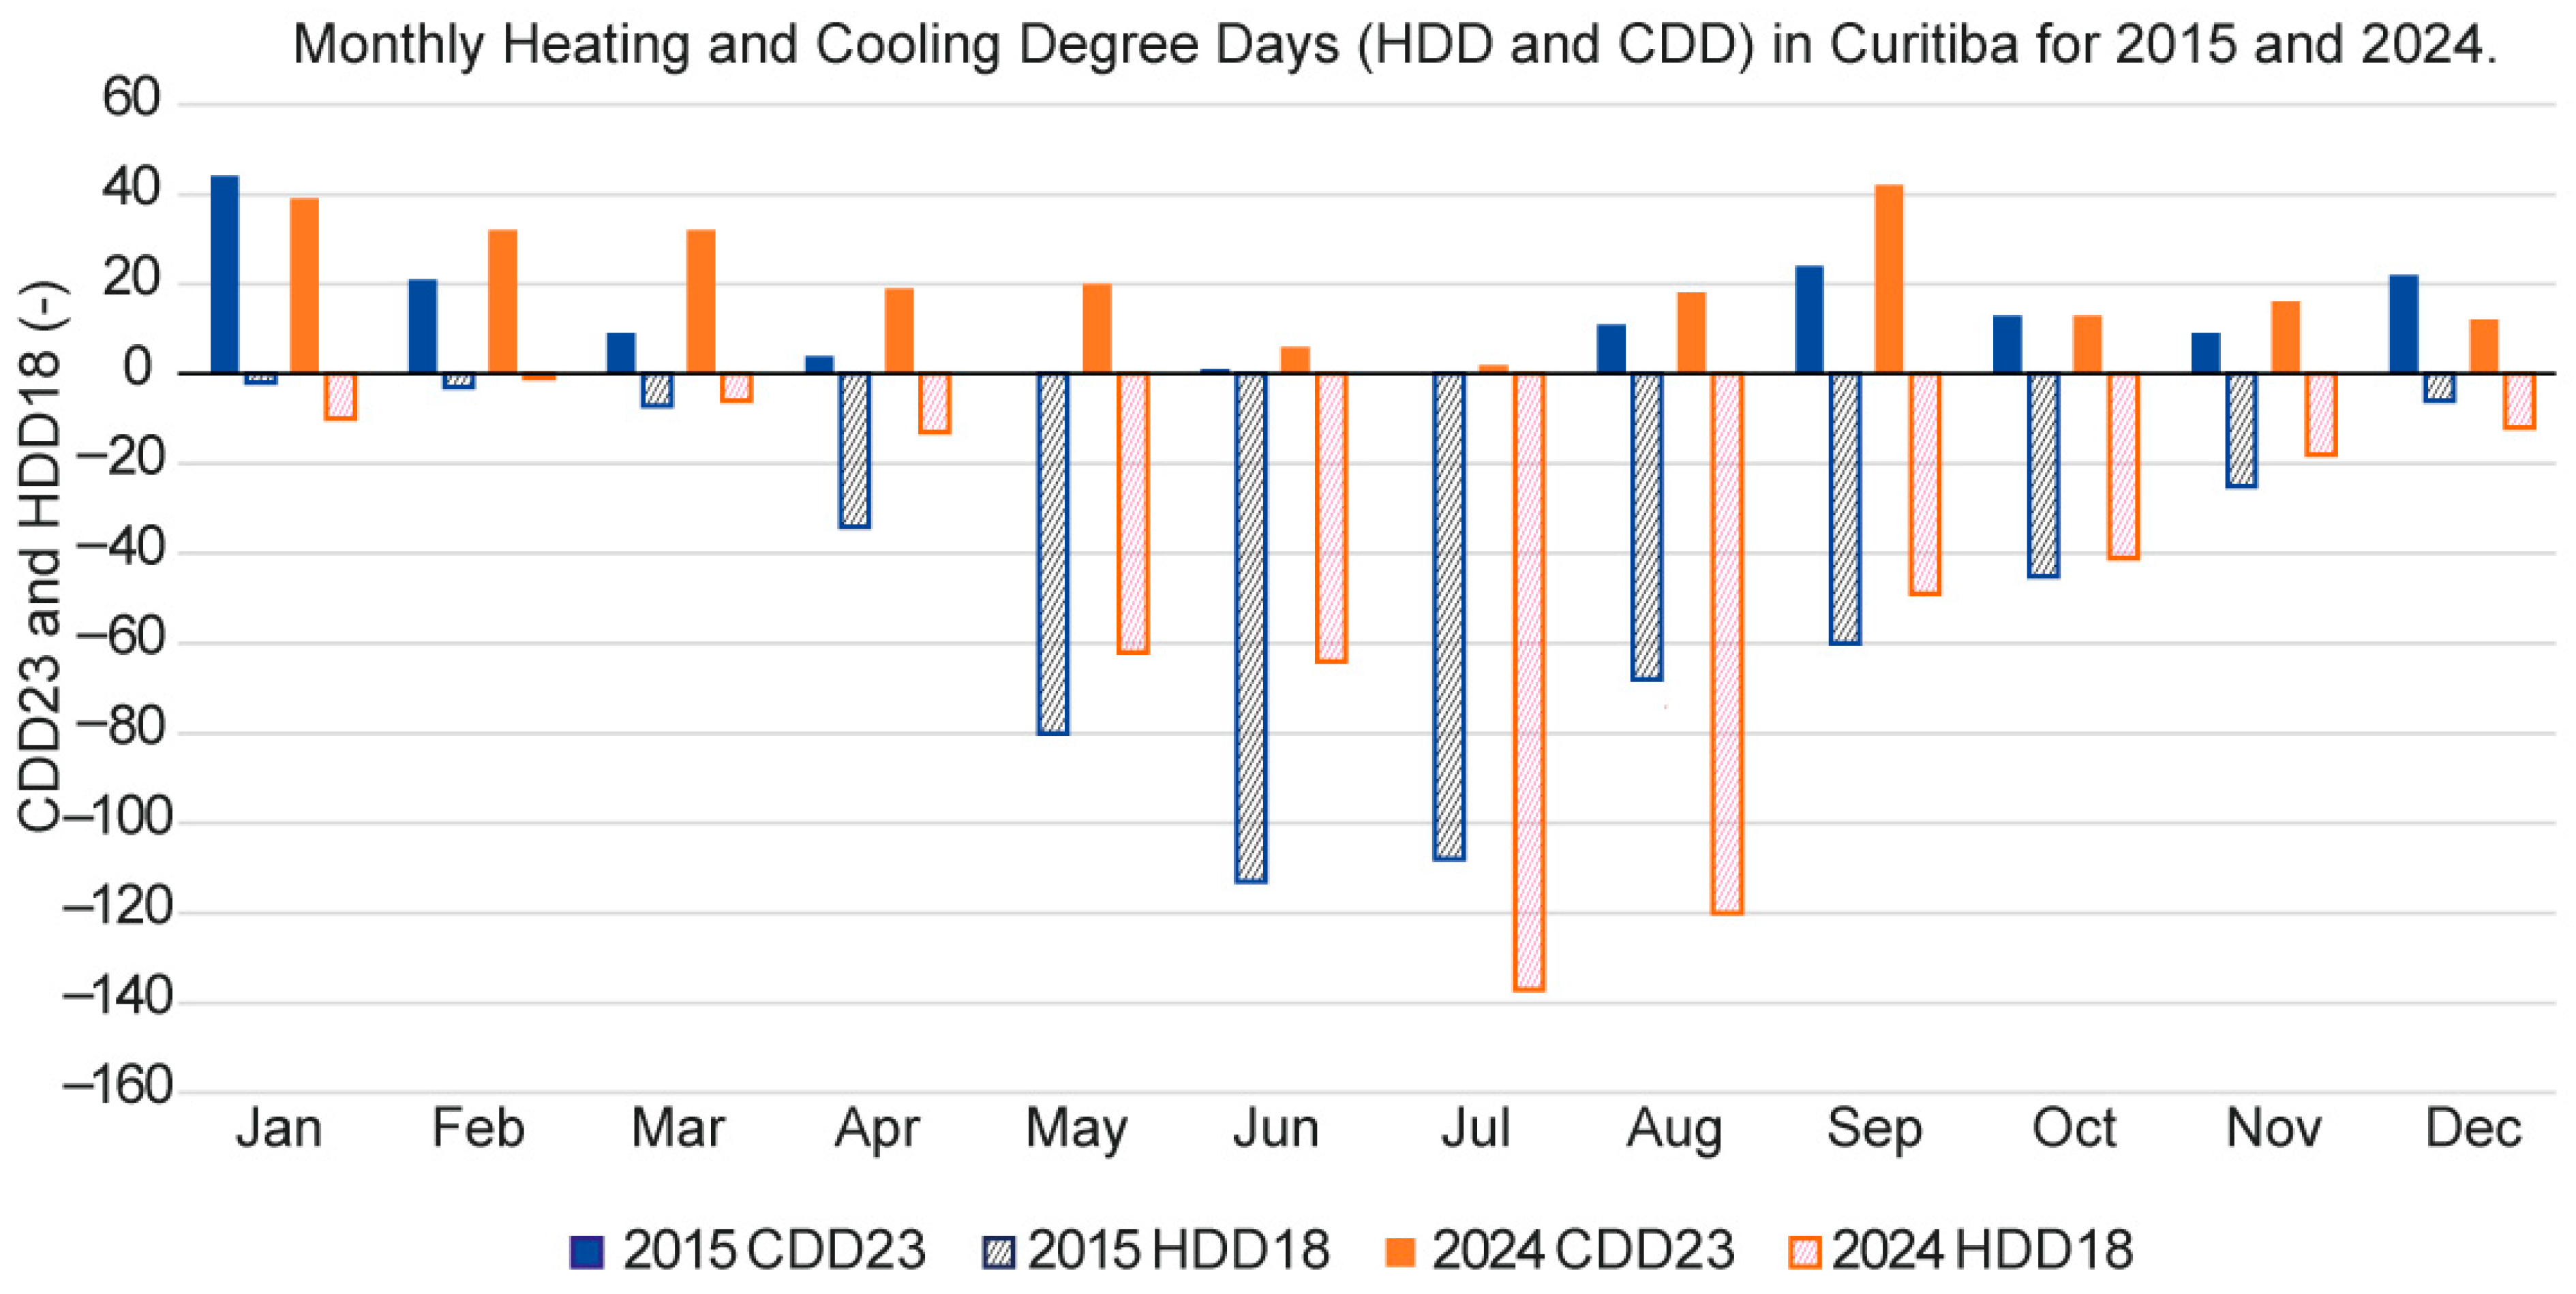
The climate characterization, which served as the basis for constructing the AWYs used throughout the study, relies on two key indicators: the annual distribution of solar irradiance and the seasonal patterns of heating and cooling degree days (HDD and CDD) [46], both directly linked to thermal performance and energy demand.
Figure 2 and Table 1 jointly describe the annual behavior of GHI recorded at the INPE station in 2015 and 2024. Figure 2 highlights the temporal distribution, showing that, in 2024, the irradiance exhibited greater intermittency, likely reflecting increased cloud cover or atmospheric instability. Table 1 complements this by reporting the monthly mean, peak, and standard deviation of GHI, which quantitatively confirm the visual trends. Specifically, 2024 presents consistently higher mean values (e.g., June: 324.4 Wh/m2 vs. 254.9 Wh/m2 in 2015; October: 365.9 Wh/m2 vs. 270.4 Wh/m2) and larger variability in several months (e.g., October: 321.4 Wh/m2 in 2024 vs. 267.8 Wh/m2 in 2015). The peak irradiance values are comparable between years, with both exceeding 1000 W/m2 during the summer months.
The seasonal thermal behavior is illustrated in Figure 3, which presents the monthly HDD and CDD values calculated using threshold temperatures of 18 °C and 23 °C, respectively. In 2015, the HDD values were predominant from April to October, peaking in June and July, while the cooling needs remained moderate and limited to the warmer months. The year 2024, however, displayed an extended cooling season, with notable CDD contributions from January to May and again in September to December. The heating needs also intensified, particularly in July and August, suggesting colder nighttime conditions or increased thermal amplitude.
This climate profile shows that the selected years presented contrasting conditions relevant for building energy simulations. Although two years alone cannot indicate a climate change trend, their patterns align with the broader increase in thermal variability and less stable weather observed in recent decades [36,37], reflecting a warming tendency driven by both climate change and urbanization and consistent with global patterns of global warming [47]. These trends highlight the need for resilient building strategies, including passive design, enhanced insulation, and adaptive systems to manage higher cooling demands and variable solar resources.

2.1.4. Construction of Baseline Actual Weather Years (AMYs)

While Typical Meteorological Year (TMY) datasets are widely used in building performance simulations to represent long-term average conditions, this study adopts AWYs [48,49,50] to better capture the interannual variability and specific climatic characteristics of the selected years. Unlike TMYs, which smooth out short-term fluctuations and extreme events, AWYs reflect the actual meteorological conditions of a given year, including climate anomalies and unusual weather patterns. This approach is particularly relevant in the current context of growing climate variability, as it allows for a more realistic assessment of solar resource inputs and a more accurate evaluation of the performance and uncertainty associated with modeled solar radiation datasets.
The development of AWYs followed a structured process to ensure data reliability and suitability for simulation. Raw meteorological data were initially collected from INMET and SONDA/INPE weather stations, followed by thorough quality assurance to detect and correct errors or inconsistencies. The missing data gaps were filled using supplementary data from the Meteorological System of Paraná (SIMEPAR) [51] to maintain temporal continuity. Variables not directly measured at the stations were calculated using established algorithms and meteorological relationships.
Once pre-processed and validated, the datasets were converted from CSV to EPW (EnergyPlus Weather) format using a dedicated online tool (https://ecoeficiente.es/conversor-epw-a-csv/ (accessed on 10 June 2025)), facilitating seamless integration with the energy simulation software. This workflow ensured that the AWYs accurately reflect the real climatic conditions of the study area. To verify their suitability, the AWY files were compared with other commonly used datasets for Curitiba through simulation output analysis.

2.2. Alternative Climate Scenarios Based on Modeled Solar Radiation

This section outlines the alternative climate scenarios developed using modeled solar radiation datasets, describing their main characteristics, the statistical methods used for validation against ground-based measurements, and their integration into AWYs to assess the impact of solar input variability on energy demand and thermal comfort.

2.2.1. Modeled Solar Radiation Datasets

Three widely used gridded solar radiation datasets, NASA POWER, CAMS, and ERA5, were assessed to evaluate their impact on the building energy performance under alternative scenarios.
  • NASA POWER (Prediction of Worldwide Energy Resources) [24]
    The NASA Prediction of Worldwide Energy Resources (POWER) dataset provides hourly estimates of the GHI, DNI, and DHI, derived from satellite imagery, reanalysis models, and ground-based observations. It offers global coverage at approximately 0.5° spatial resolution and spans from 1983 to the present [52].
    Hourly irradiance values were retrieved from the POWER Data Access Viewer (DAV), based on the CERES SYN1deg Edition 4.1 satellite product. These data undergo a bias-correction procedure developed by NASA, which is applied across bins of the cosine of the solar zenith angle (cos Z). This adjustment reduces the systematic errors in the GHI and DHI relative to measurements from the Baseline Surface Radiation Network (BSRN). The Direct Normal Irradiance is then computed from the corrected direct horizontal irradiance (DirHI) using the relation DNI = DirHI/cos(Z), with specific handling of high zenith angles to mitigate numerical instability [24].
    The final data were downloaded in comma-separated values (CSV) format and subsequently synchronized both temporally and spatially with the other datasets used in this study, ensuring consistency for comparative assessments and building energy simulations.
  • CAMS Radiation Service (Copernicus Atmosphere Monitoring Service)
    The CAMS Radiation Service provides solar radiation estimates based on satellite imagery, radiative transfer models, and atmospheric composition data. It offers high spatial (5–15 km) and temporal resolution (up to one minute) and has been validated across multiple climatic regions. The data are freely available through the Copernicus Climate Data Store [9,53] (https://ads.atmosphere.copernicus.eu (accessed on 9 March 2025)). In Brazil, validation of the CAMS solar radiation data is primarily conducted using measurements from the Florianopolis station, which is part of the Baseline Surface Radiation Network (BSRN). This station provides high-quality data on global, diffuse, and direct solar radiation at 1 min intervals. The data are accessed through the BSRN’s central archive, which ensures standard formatting for automated processing. The validation process involves comparing these ground-based measurements with the outputs of the CAMS Radiation Service to assess the accuracy and reliability [9].
  • ERA5 Reanalysis Dataset [7,54]
    Produced by the European Centre for Medium-Range Weather Forecasts (ECMWF), the ERA5 reanalysis dataset integrates historical observations with atmospheric modeling. It offers hourly solar radiation and meteorological data at ~0.25° spatial resolution from 1959 onward. ERA5 data are freely available through the Copernicus Climate Data Store (CDS) (https://cds.climate.copernicus.eu/ (accessed on 3 July 2025)), where users can customize downloads by selecting variables (e.g., surface solar radiation downwards), geographical region, and time range.
    Due to its temporal resolution (up to one hour), global coverage, and consistency, the ERA5 is widely used in climate research, energy modeling, and environmental assessments. In this study, ERA5 data were downloaded in NetCDF format and post-processed using custom MATLAB R2025a scripts to ensure spatial and temporal alignment with the other datasets under evaluation.
Table 2 presents a comparative overview of the spatial resolution, data format, units, and type of each dataset available to generate the AWYs.
All three datasets were analyzed for the years 2015, considered a climatologically stable reference with available ground measurements, and 2024, a year marked by extreme heat events and other climatic anomalies across Brazil. Ground-based measurements from INPE’s high-precision solarimetric station in Curitiba were used as the reference for validation.

2.2.2. Construction of Alternative Actual Weather Years (AMYs)

To assess the influence of different solar radiation datasets on the building energy performance, three alternative AWYs were constructed by combining the meteorological data from the INMET station with the solar radiation inputs from each modeled source, NASA POWER, CAMS, and ERA5.
As with the AMY used for the baseline scenario, all files were processed to ensure hourly continuity and were formatted according to the EPW format. This approach enables a consistent comparative analysis of the energy demand and thermal comfort under varying solar radiation inputs, while keeping all non-radiative variables (e.g., temperature, relative humidity, wind) identical across scenarios.

2.2.3. Performance Metrics for Solar Dataset Evaluation

To evaluate the accuracy and reliability of each solar radiation dataset, statistical comparisons were performed using hourly data for the GHI, DNI, and DHI, for the years 2015 and 2024. The choice of hourly resolution aligns with the input requirements of building energy simulation tools and provides greater diagnostic precision compared to daily or monthly aggregates.
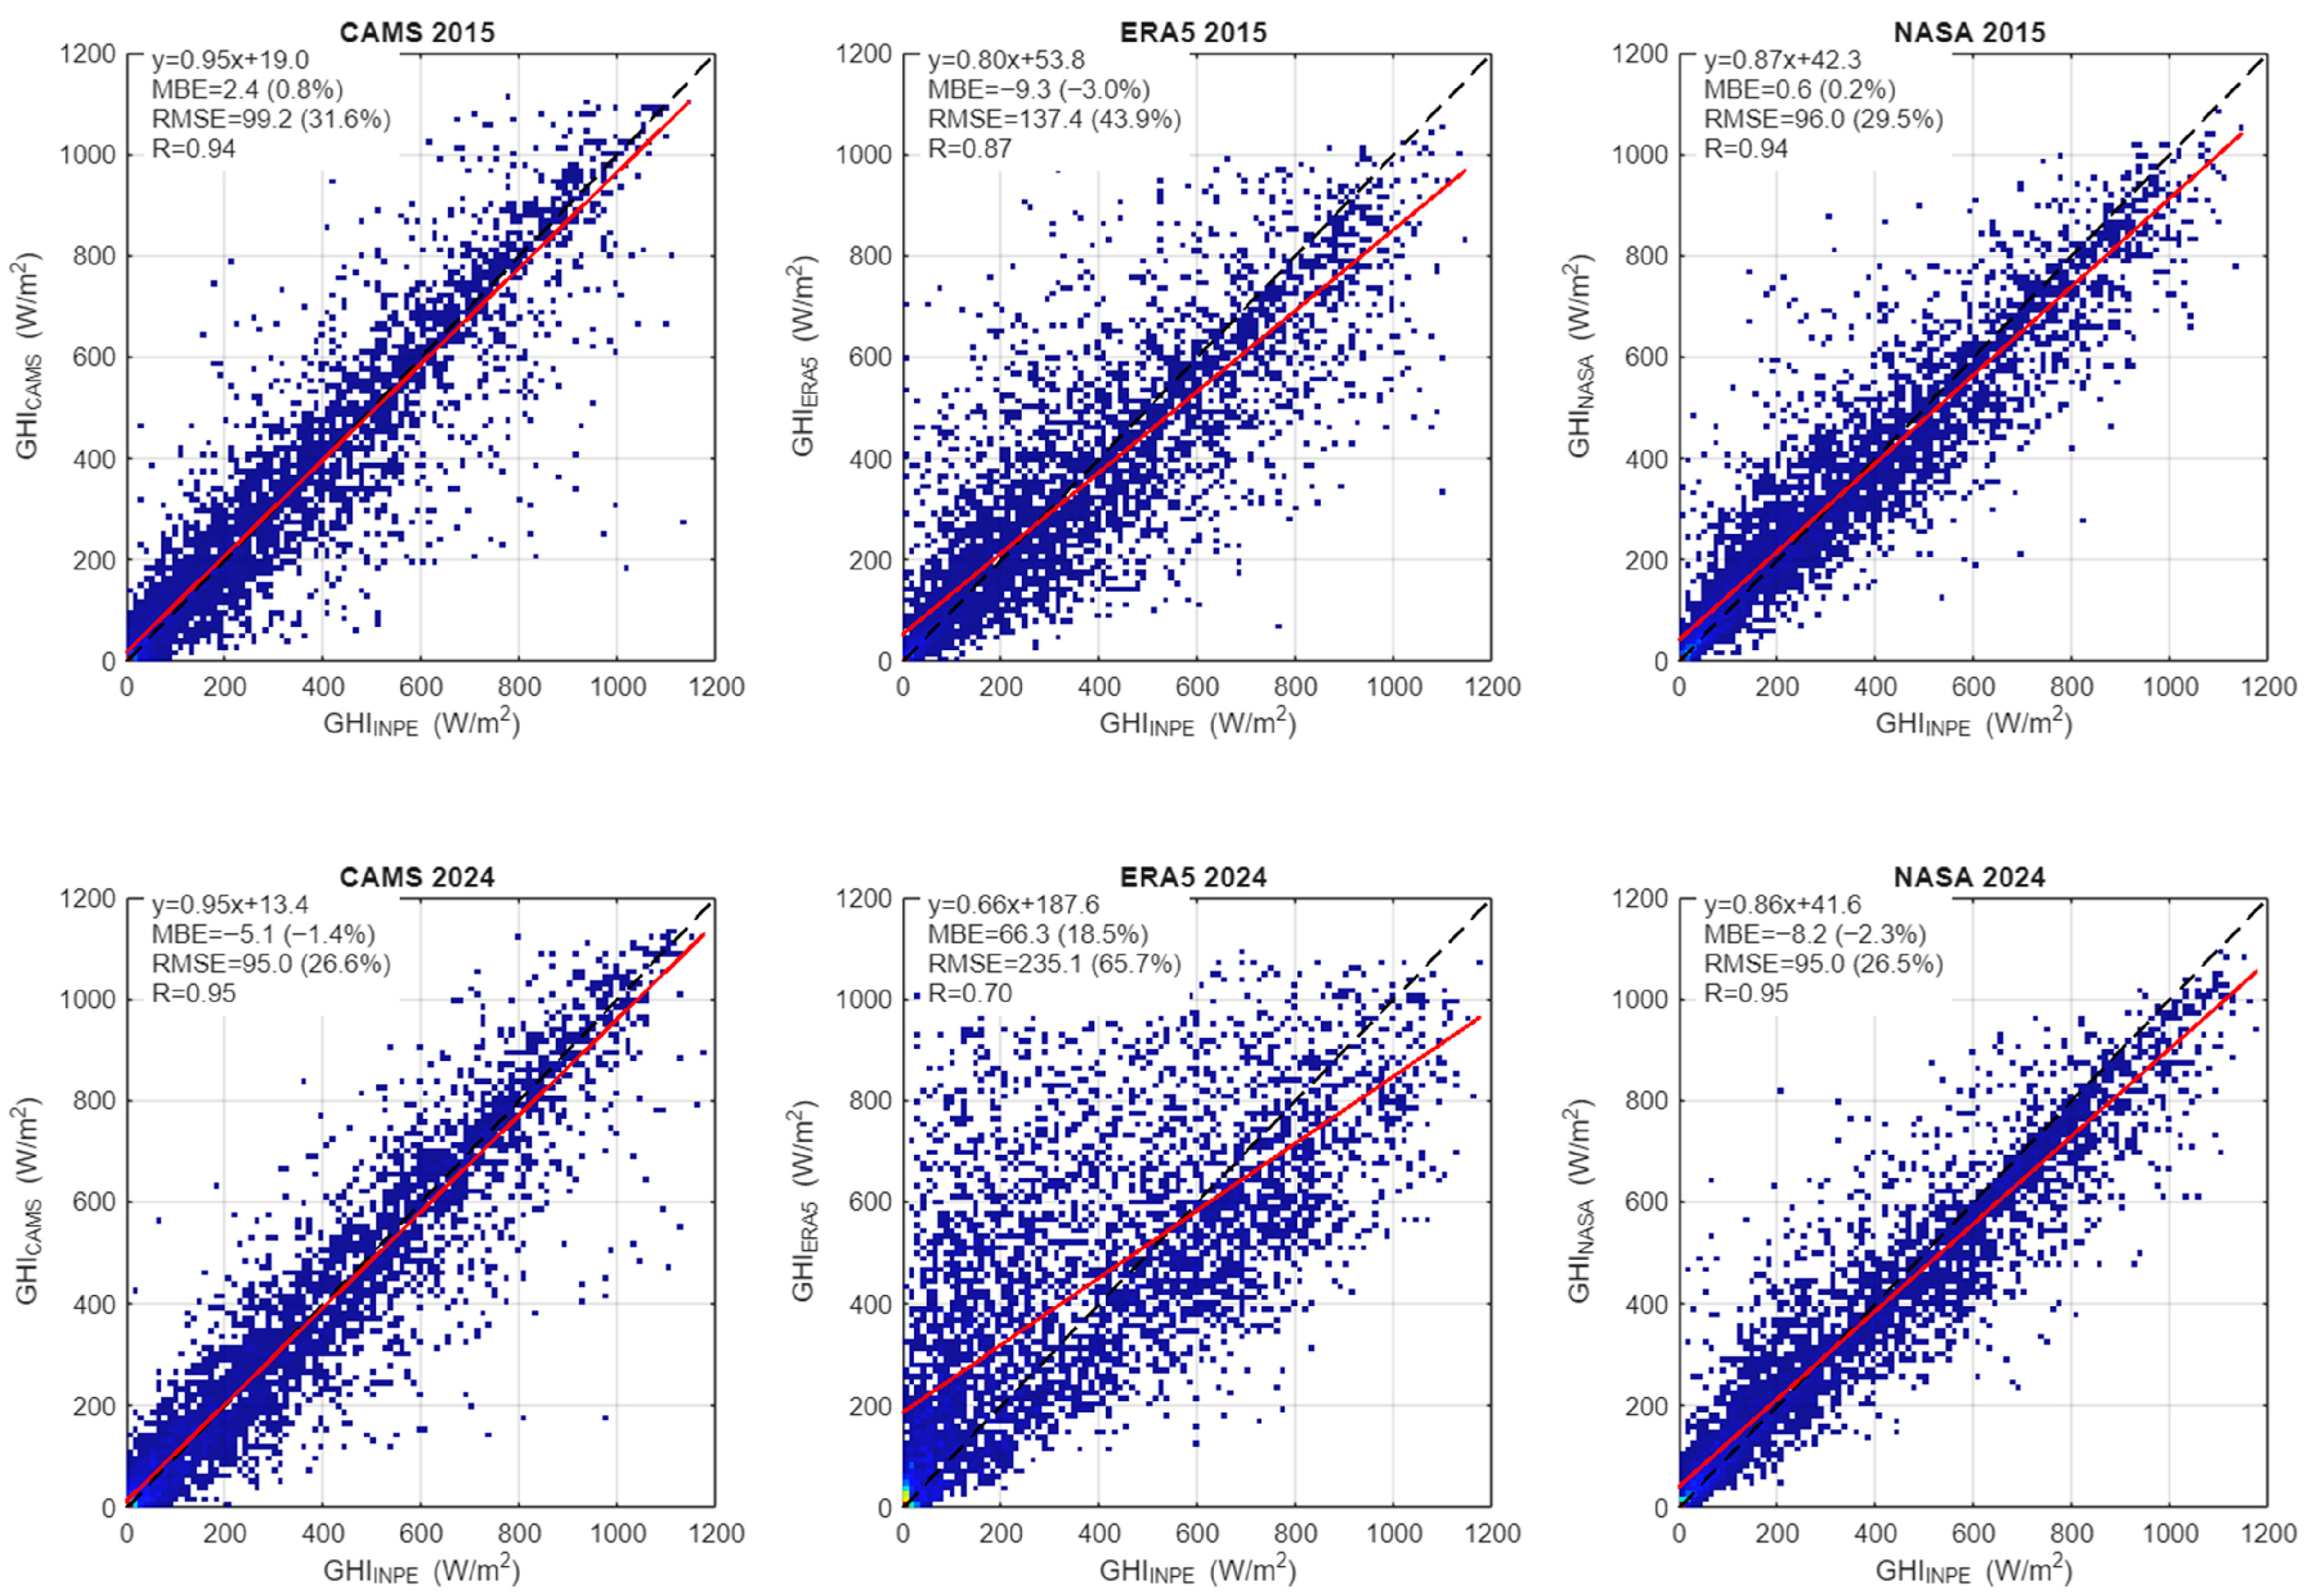
Modeled data from CAMS, ERA5, and NASA POWER were compared against ground-based measurements from the SONDA/INPE station. For each year and dataset, scatter plots were produced along with a 1:1 reference line and a linear regression fit to assess the agreement between the modeled and observed values.
Three widely used performance metrics were calculated: root mean square error (RMSE), which quantifies the magnitude of deviations; mean bias error (MBE), which captures systematic over- or underestimation; and the Pearson correlation coefficient (R), which reflects the temporal agreement with observed values [55]. These metrics were also expressed as percentages relative to the observed mean to facilitate normalized comparisons. In addition to the hourly analysis, the results were summarized on monthly and annual scales to highlight the seasonal and interannual variability.

2.3. Building Performance Simulation

This section describes the building prototype, simulation setup, and methodological approach used to assess the impacts of climatic variability and solar radiation datasets on the energy performance and thermal comfort.

2.3.1. Building Prototype and Simulation Outputs

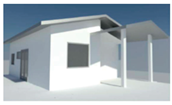
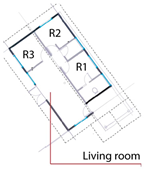
Building performance simulations were conducted using EnergyPlus, applying a single-family detached building prototype representative of a typical residential construction in Brazil [56]. The prototype has a total floor area of 54 m2 and adopts the occupancy definition established by the Brazilian standard ABNT NBR 15575-1:2013/Amendment 1:2021 [57].
The main construction characteristics of the building envelope are summarized in Table 3, which presents thermal properties such as U-values, solar absorptance, and the solar heat gain coefficient (SHGC).
Table 4 presents the complementary parameters, including the internal gains, HVAC setpoint temperatures, occupancy schedules, and the adopted comfort criterion. Occupancy schedules were defined according to the standard’s concept of occupancy pattern, distinguishing regularly and transiently occupied spaces [57]. Regularly occupied spaces refer to areas with continuous or prolonged use (e.g., bedrooms and living rooms), while bathrooms and circulation spaces were classified as transiently occupied, as follows:
  • Bedrooms (regularly occupied spaces): two occupants per bedroom (100% occupancy), mainly during nighttime (22:00–07:00).
  • Living room (regularly occupied space): number of occupants equivalent to two per bedroom, with a maximum of four occupants, typically during the evening (18:00–22:00).
  • Other transiently occupied spaces: short-term use, with negligible impact on thermal load modeling.
Two operational modes were simulated to evaluate the influence of the climatic variability and solar radiation datasets on the building energy performance and thermal comfort, using the AWYs previously described for both baseline and alternative climate scenarios.
The first mode assumed an ideal HVAC system, with perfect heating and cooling performance and no equipment limitations. This setup was used to estimate the annual energy demand for thermal conditioning (in kWh/m2). The energy demand was calculated for the entire dwelling using the ideal loads approach, with the results analyzed both annually and monthly. The monthly breakdown was conducted by individual room to capture the spatial influence of climate variability and avoid the masking effects of aggregated results.
The second mode relied exclusively on natural ventilation, without any mechanical systems. In this case, the indoor temperatures were allowed to fluctuate freely according to the outdoor conditions and predefined window operation schedules. The thermal comfort was evaluated based on the adaptive comfort model [58], using an 80% acceptability threshold. Discomfort was assessed in terms of the percentage of occupied hours in overheating and undercooling conditions. Both annual averages (across all regularly occupied spaces) and monthly room-level analyses were performed to examine seasonal patterns and localized comfort dynamics.
The inclusion of the free-running mode responds to the regional context, where natural ventilation remains the predominant strategy in Brazilian homes due to construction practices, cultural preferences, and limited penetration of air-conditioning (less than 20% nationwide) [59,60,61]; In cities such as Curitiba, passive strategies such as high thermal mass allow many dwellings to operate without mechanical cooling [62]. In this context, assessing thermal comfort in naturally ventilated buildings is particularly relevant, as these dwellings are more directly influenced by interannual climatic variability than HVAC-operated ones.
Moreover, differences in thermal comfort between free-running and HVAC dwellings are not strictly proportional to the energy demand. HVAC systems maintain narrower and more controlled comfort ranges, whereas free-running dwellings exhibit wider variations influenced by outdoor conditions, ventilation effectiveness, and occupant acclimatization [63,64]. The mechanisms of heat exchange with the environment also differ: naturally ventilated buildings are more sensitive to climatic drivers such as wind speed, while HVAC systems reduce this sensitivity by limiting air infiltration and mechanically controlling indoor environments [65,66].
Table 5 summarizes the operational scenarios, main simulation outputs, frequency of analysis, and the climate datasets (AWYs) used in each case.

2.3.2. Evaluation of Simulation Results Under Climatic Variability and Solar Dataset Effects

To assess the effects of interannual variability and the use of different solar radiation datasets on building energy performance and thermal comfort, the simulation results were analyzed along two main axes.
The first involved a comparison between the years 2015 and 2024, both using AWYs based on ground-measured data from the INPE station. This analysis enabled the evaluation of the interannual climatic variability by comparing the annual and monthly values of thermal discomfort, as well as the cooling and heating demands. The percentage deviations were also calculated to quantify the magnitude of change between the two years.
The annual thermal comfort analysis was based on the average values during the occupied hours in regularly occupied spaces, reflecting typical usage patterns. In contrast, the monthly analysis presented in this paper focuses on a single room as an example, aiming to more comprehensively capture the influence of different solar radiation datasets on the building’s thermal behavior.
The second axis focused on assessing the influence of the selected solar radiation datasets, NASA POWER, CAMS, and ERA5, on the simulation outcomes. For both 2015 and 2024, the results obtained with alternative AWYs were compared against the reference simulations using ground-based radiation data from INPE.

3. Results

This section describes the metrics results of the global and direct irradiation from the CAMS, NASA, and ERA5 data against the INPE measurement data (Section 3.1). Additionally, it discusses the impact of these datasets on the building energy performance, considering two case scenarios selected based on data availability and representativeness of recent climate records (Section 3.2).

3.1. Performance Metrics of Solar Radiation Datasets

The performance of the GHI and DNI estimates from CAMS, NASA POWER, and ERA5 was evaluated using hourly ground-based measurements from INPE. The key metrics included the Pearson correlation, root mean square error (RMSE), and mean bias error (MBE), calculated for the years 2015 and 2024.

3.1.1. Global Horizontal Irradiance (GHI)

As shown in Figure 4, all the datasets demonstrated strong agreement with the observed GHI values, particularly in 2015. The CAMS and NASA POWER performed notably well, with very high correlation coefficients (R = 0.94–0.95), low RMSE (~94–95 W/m2), and regression slopes close to 1.0. The bias remained minimal in both cases (MBE within ±2%), indicating low systematic deviation from the ground truth. The ERA5 also achieved reasonable accuracy in 2015 (R = 0.87), though with a higher RMSE (137.4 W/m2) and slight deviation in slope (0.79).
In 2024, the CAMS and NASA POWER maintained consistent performance, with similar correlation and RMSE values as in 2015. In contrast, the ERA5 showed a marked drop in accuracy. Its correlation fell to R = 0.70, the RMSE increased to 235.1 W/m2, and the slope dropped to 0.68, reflecting a tendency to deviate from the observed peak irradiance values.
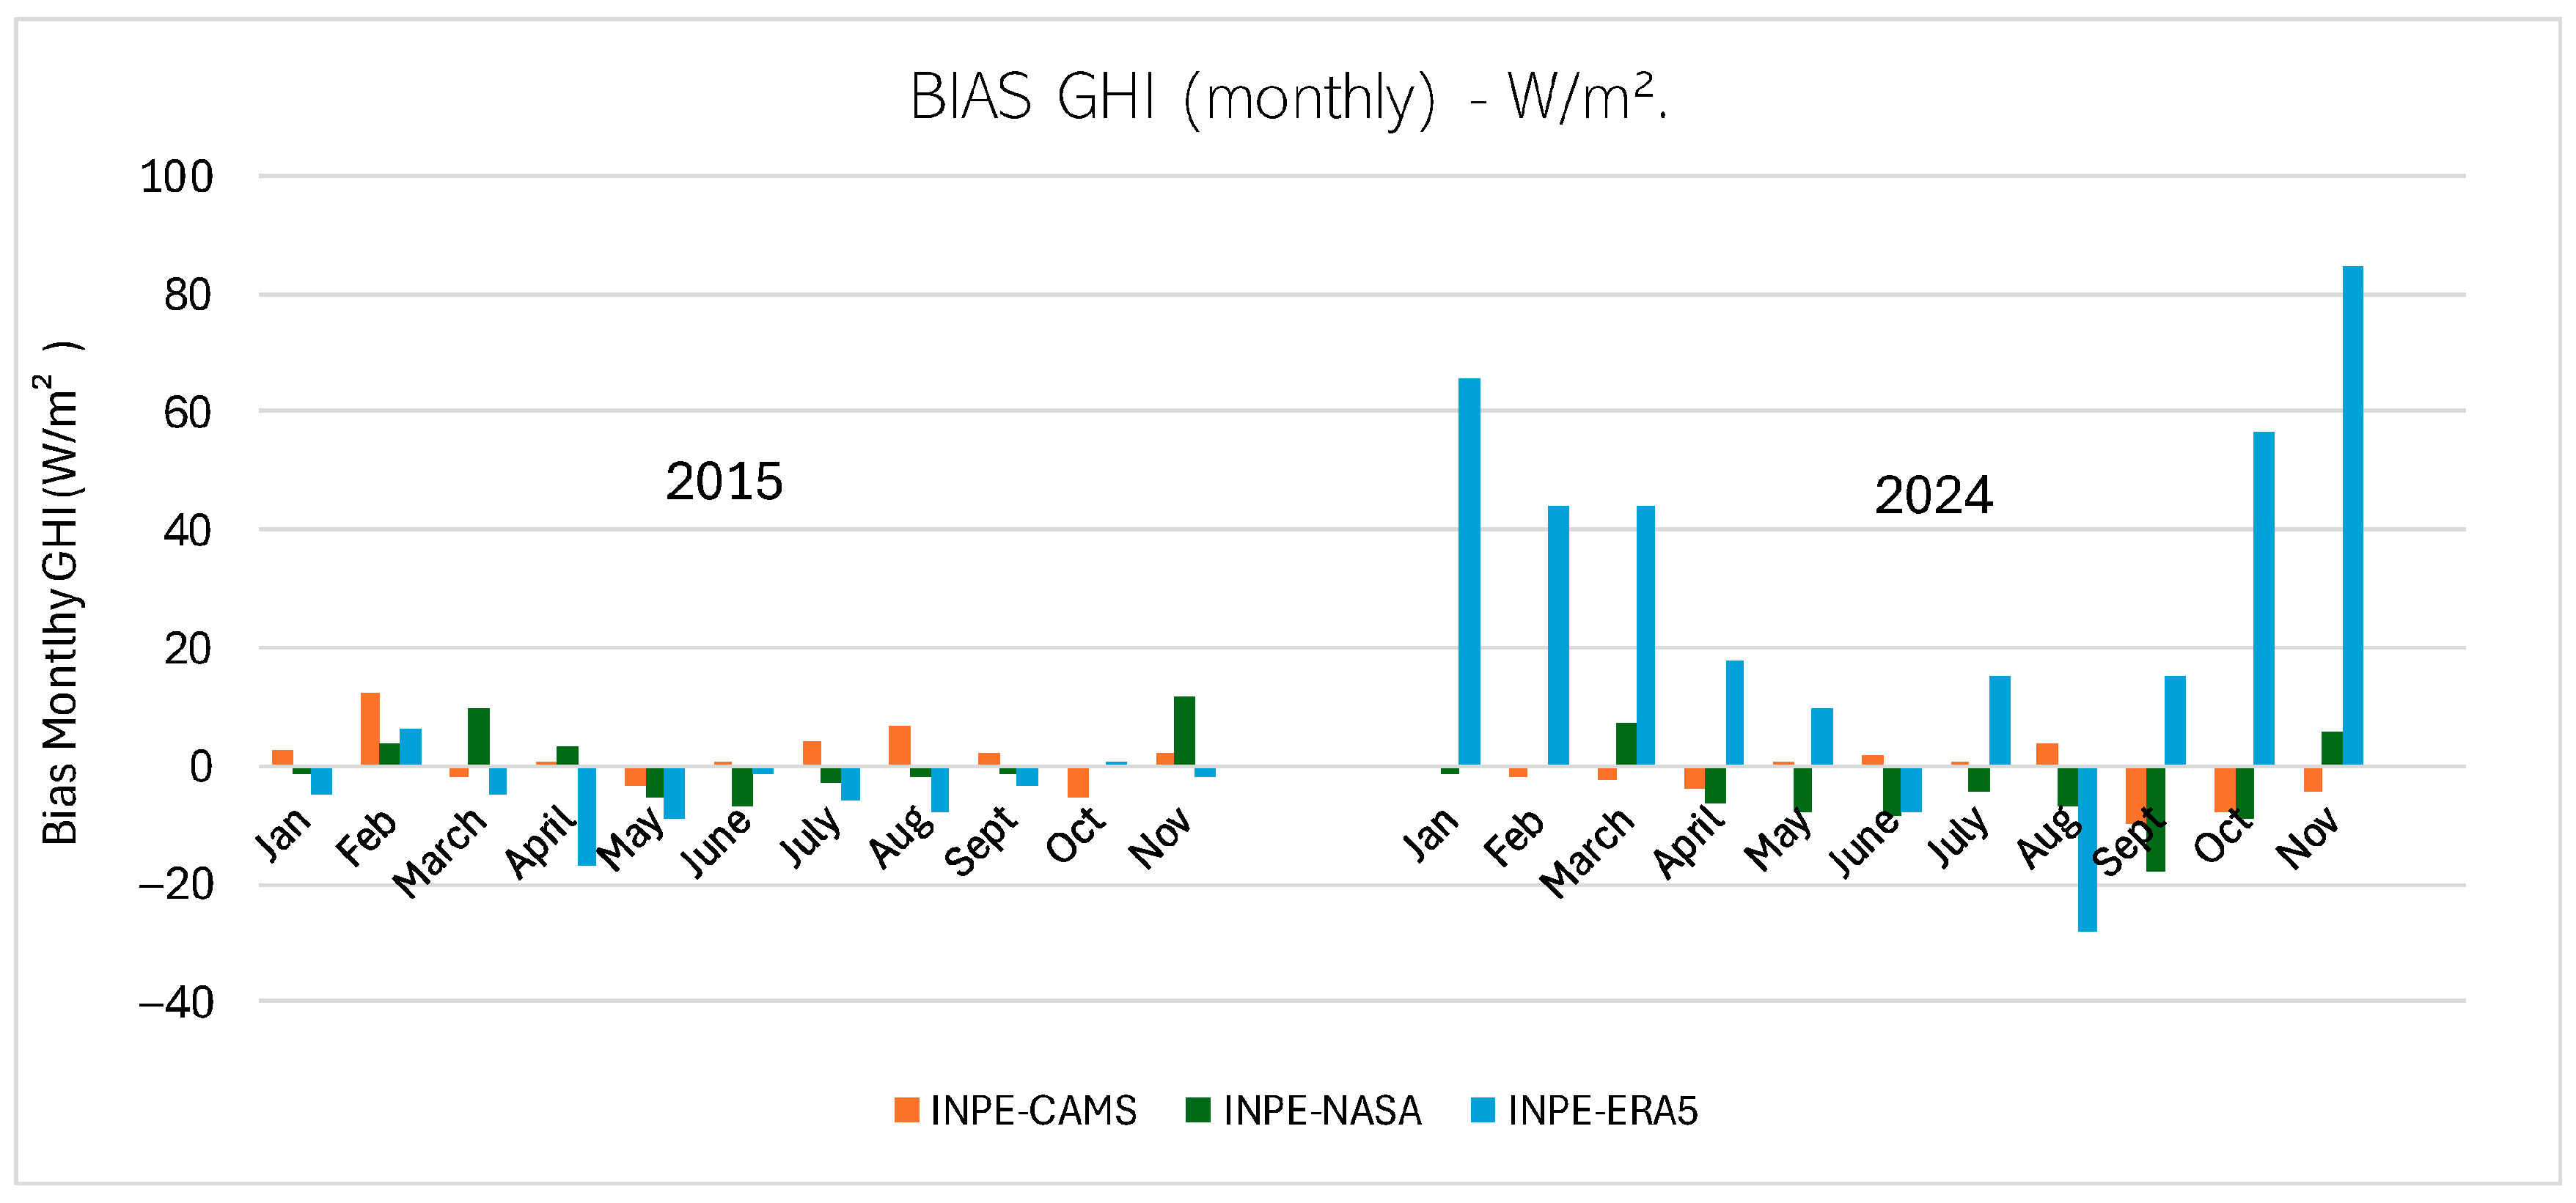
The monthly bias analysis (Figure 5) reinforces these patterns. In 2015, the modeled GHI values tracked closely with observations throughout the year. In contrast, 2024 revealed increased deviations—especially for the ERA5, which showed pronounced overestimations exceeding 60 W/m2 in January and December. These findings point to greater variability and reduced temporal fidelity in years with unstable climatic conditions.

3.1.2. Direct Normal Irradiance (DNI)

Figure 6 shows that the DNI estimates exhibited greater dispersion and dataset-dependent variability. NASA POWER provided the most balanced results, with high correlations (R = 0.83 in 2015 and 0.88 in 2024), relatively low RMSE values (170.1 and 146.1 W/m2), and regression slopes closer to unity (0.77 and 0.82, respectively). Although a slight overestimation tendency was observed, the lower dispersion compared to the other datasets suggests a more reliable performance.
CAMS also demonstrated good agreement, maintaining high correlations (R = 0.82 in 2015 and 0.84 in 2024). However, it consistently underestimated the DNI, with a substantial negative bias (MBE ≈ −26%) and elevated RMSE values (~184–189 W/m2), indicating systematic underprediction.
ERA5, on the other hand, showed only moderate agreement in 2015 (R = 0.63), with a strong underestimation (slope = 0.44) and large RMSE (241.2 W/m2). Its performance deteriorated in 2024, with a very low correlation (R = 0.21), extremely shallow slope (0.16), and the highest RMSE (337.8 W/m2). This dataset displays a significant phase shift compared to the measured data, resulting in no correlation and potentially severely compromising the building energy simulation results.
The monthly bias results (Figure 7) emphasize this temporal inconsistency. In 2015, the biases were more stable, particularly for CAMS and NASA POWER. In contrast, the ERA5 in 2024 exhibits pronounced seasonal swings, with underestimations during mid-year months and overestimations reaching up to +100 W/m2 between October and December. Throughout both years, NASA POWER maintains relatively stable bias values, generally within the range of ±30 W/m2. CAMS consistently underestimates the DNI across all months, with stronger deviations observed during the winter period.

3.1.3. Summary of GHI and DNI Dataset Performance

Table 6 provides a qualitative overview of each dataset’s performance for the GHI and DNI. While the GHI was generally well represented in all cases, the DNI posed greater modeling challenges. CAMS and NASA POWER offered consistent and accurate estimates across both years, with NASA slightly outperforming in magnitude. ERA5, although adequate in 2015, showed significant degradation in 2024, particularly for the DNI.
The performance was evaluated using hourly correlation (Pearson’s r: very high ≥0.90, high 0.70–0.89, medium 0.30–0.69, very low <0.30) and bias (mean bias error: low 1–3%, moderate 3–6%, high >6%) [67,68,69], providing a clear framework to compare the dataset strengths and limitations.
Based on these findings, the next section examines how such differences in solar input propagate through the simulation results, influencing the energy demand and comfort across distinct climatic contexts.

3.2. Impact on Building Energy Simulations

This section presents the results of the building performance simulations using AWYs, highlighting how interannual climatic variability and different solar radiation datasets affect energy demand and thermal comfort predictions.

3.2.1. Simulation Results with Baseline Climate Scenario

The simulations with INPE-based AWYs showed notable differences in energy demand and comfort conditions between 2015 and 2024.
As summarized in Table 7, the annual cooling energy demand increased from 46.8 kWh/m2 in 2015 to 58.6 kWh/m2 in 2024, an increase of approximately 25%, reflecting intensified heat gains during warmer periods. Thermal discomfort due to overheating rose from 18% to 23% of occupied hours. While this represents a 5 percentage point increase, the change remains within a moderate absolute range. A slight rise in heating demand and undercooling discomfort was also observed, indicating that 2024 experienced colder winter periods compared to 2015.
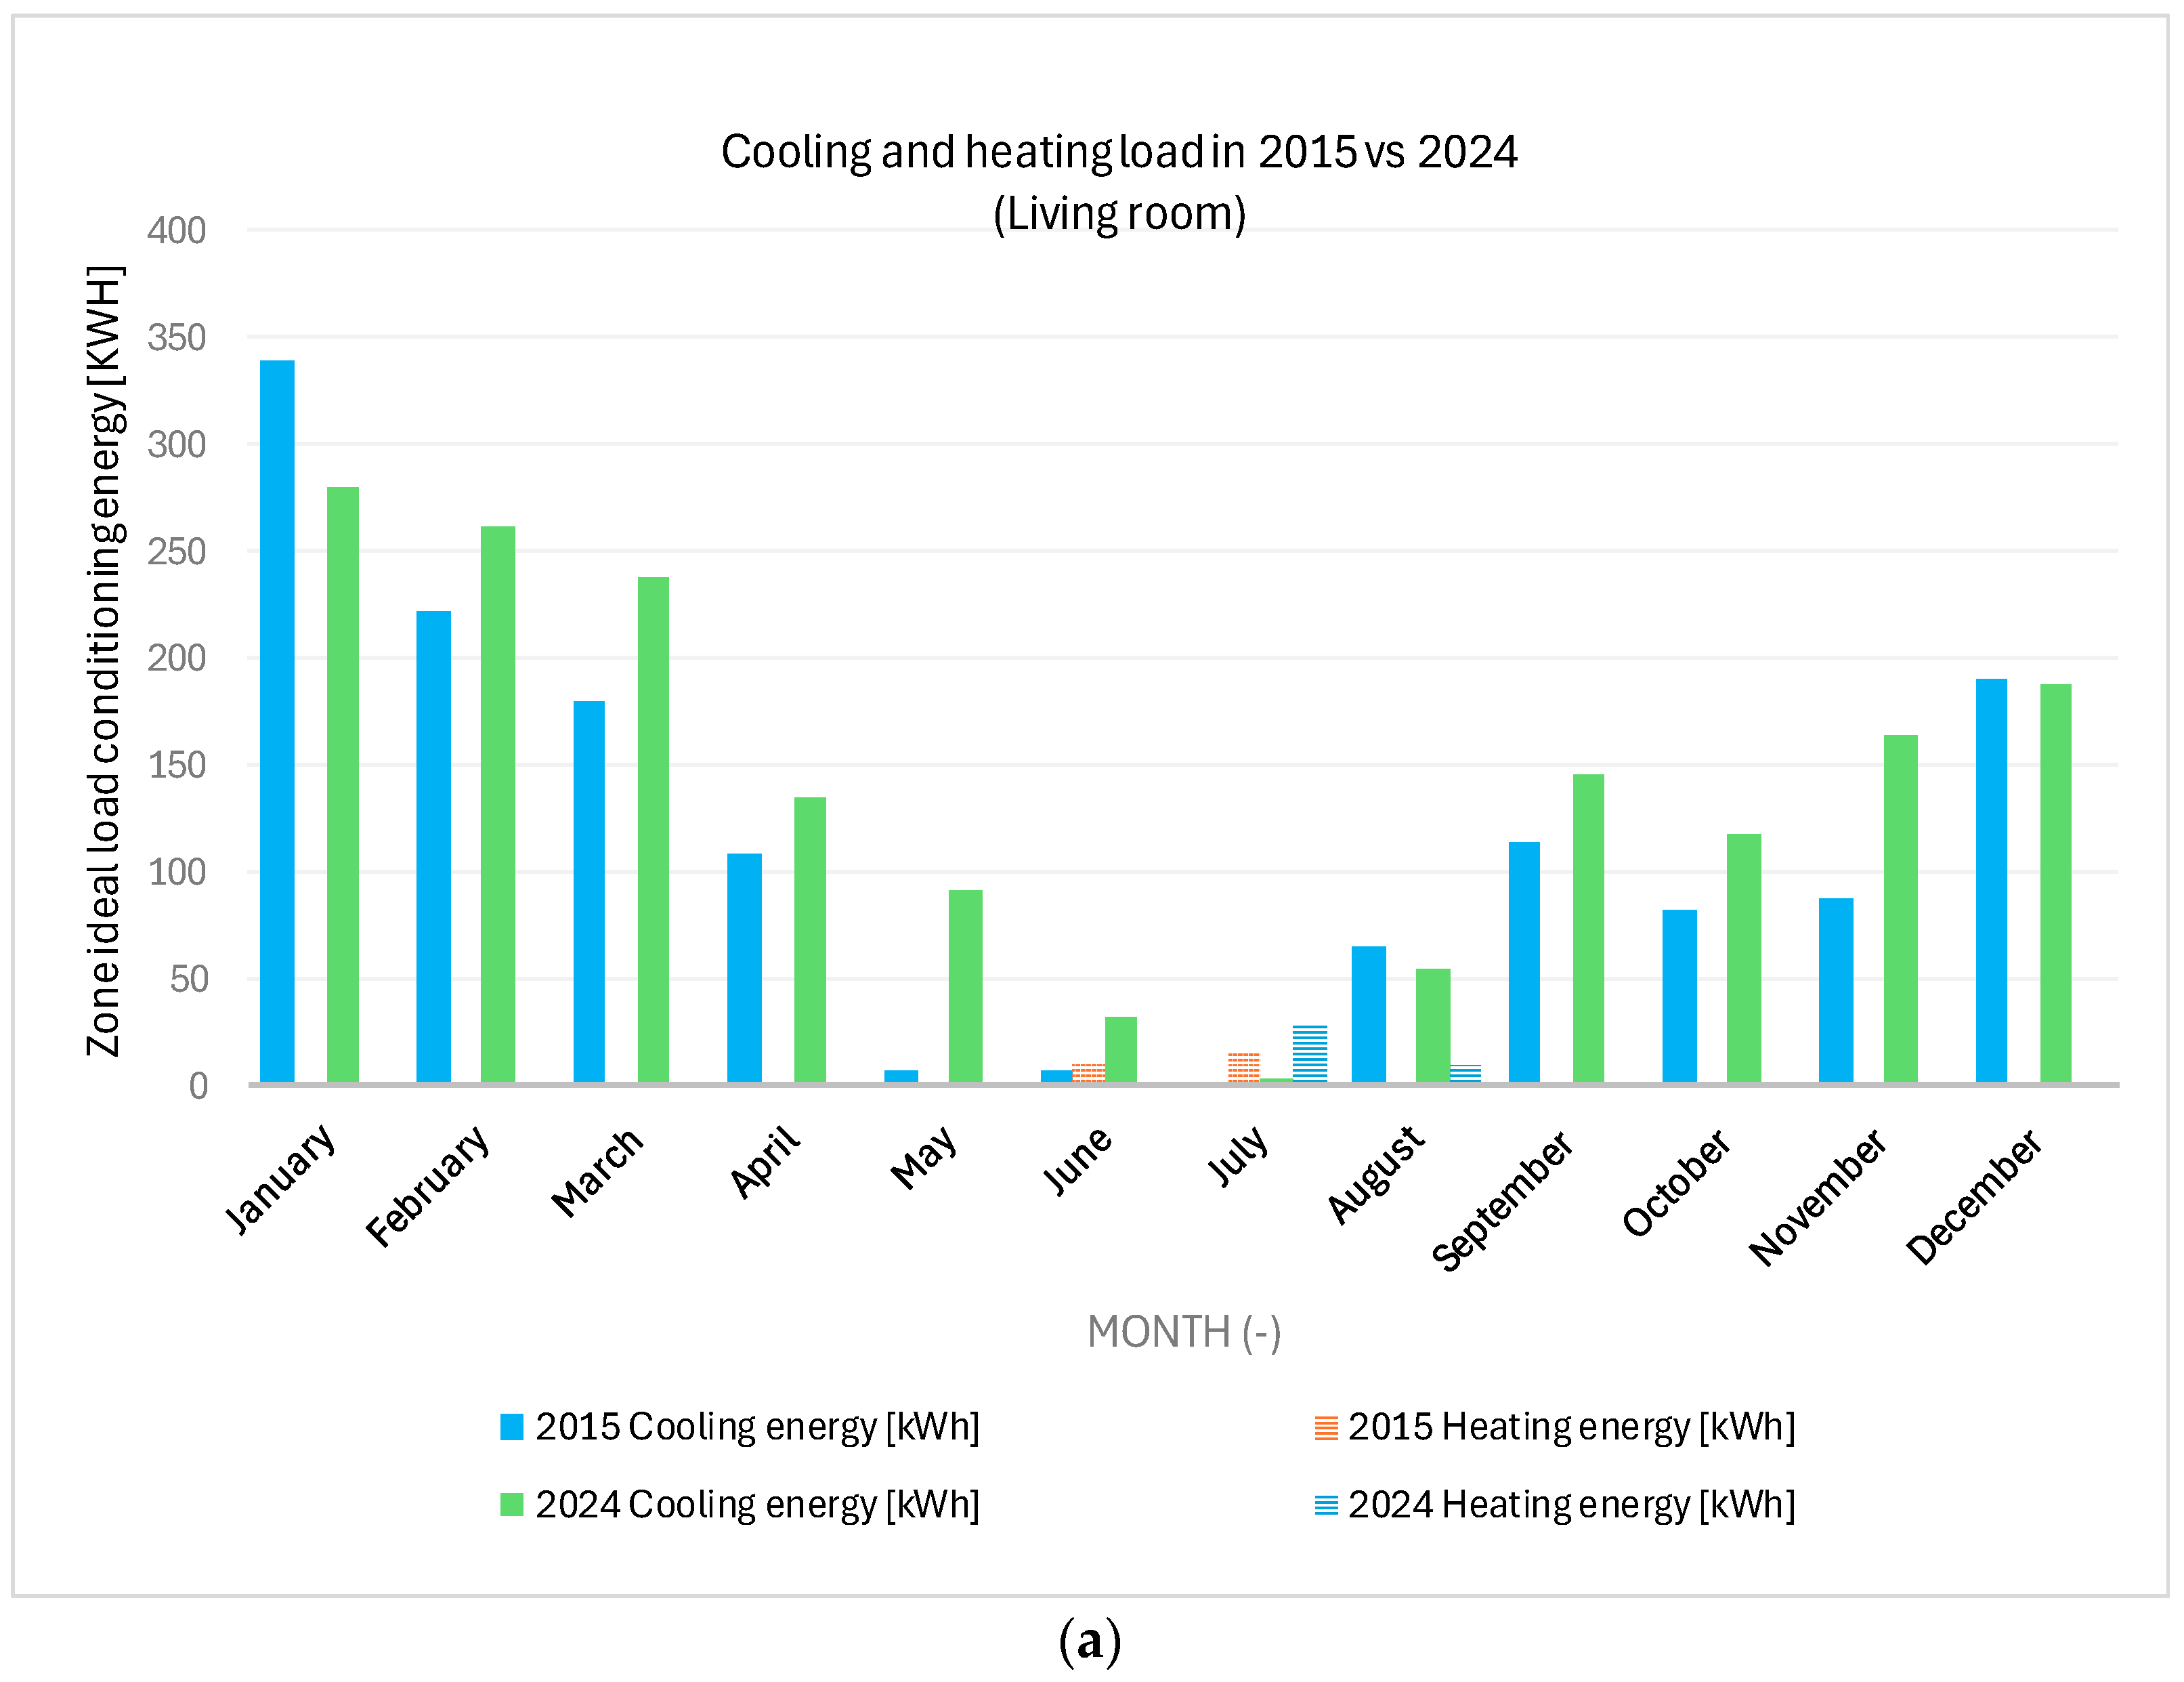
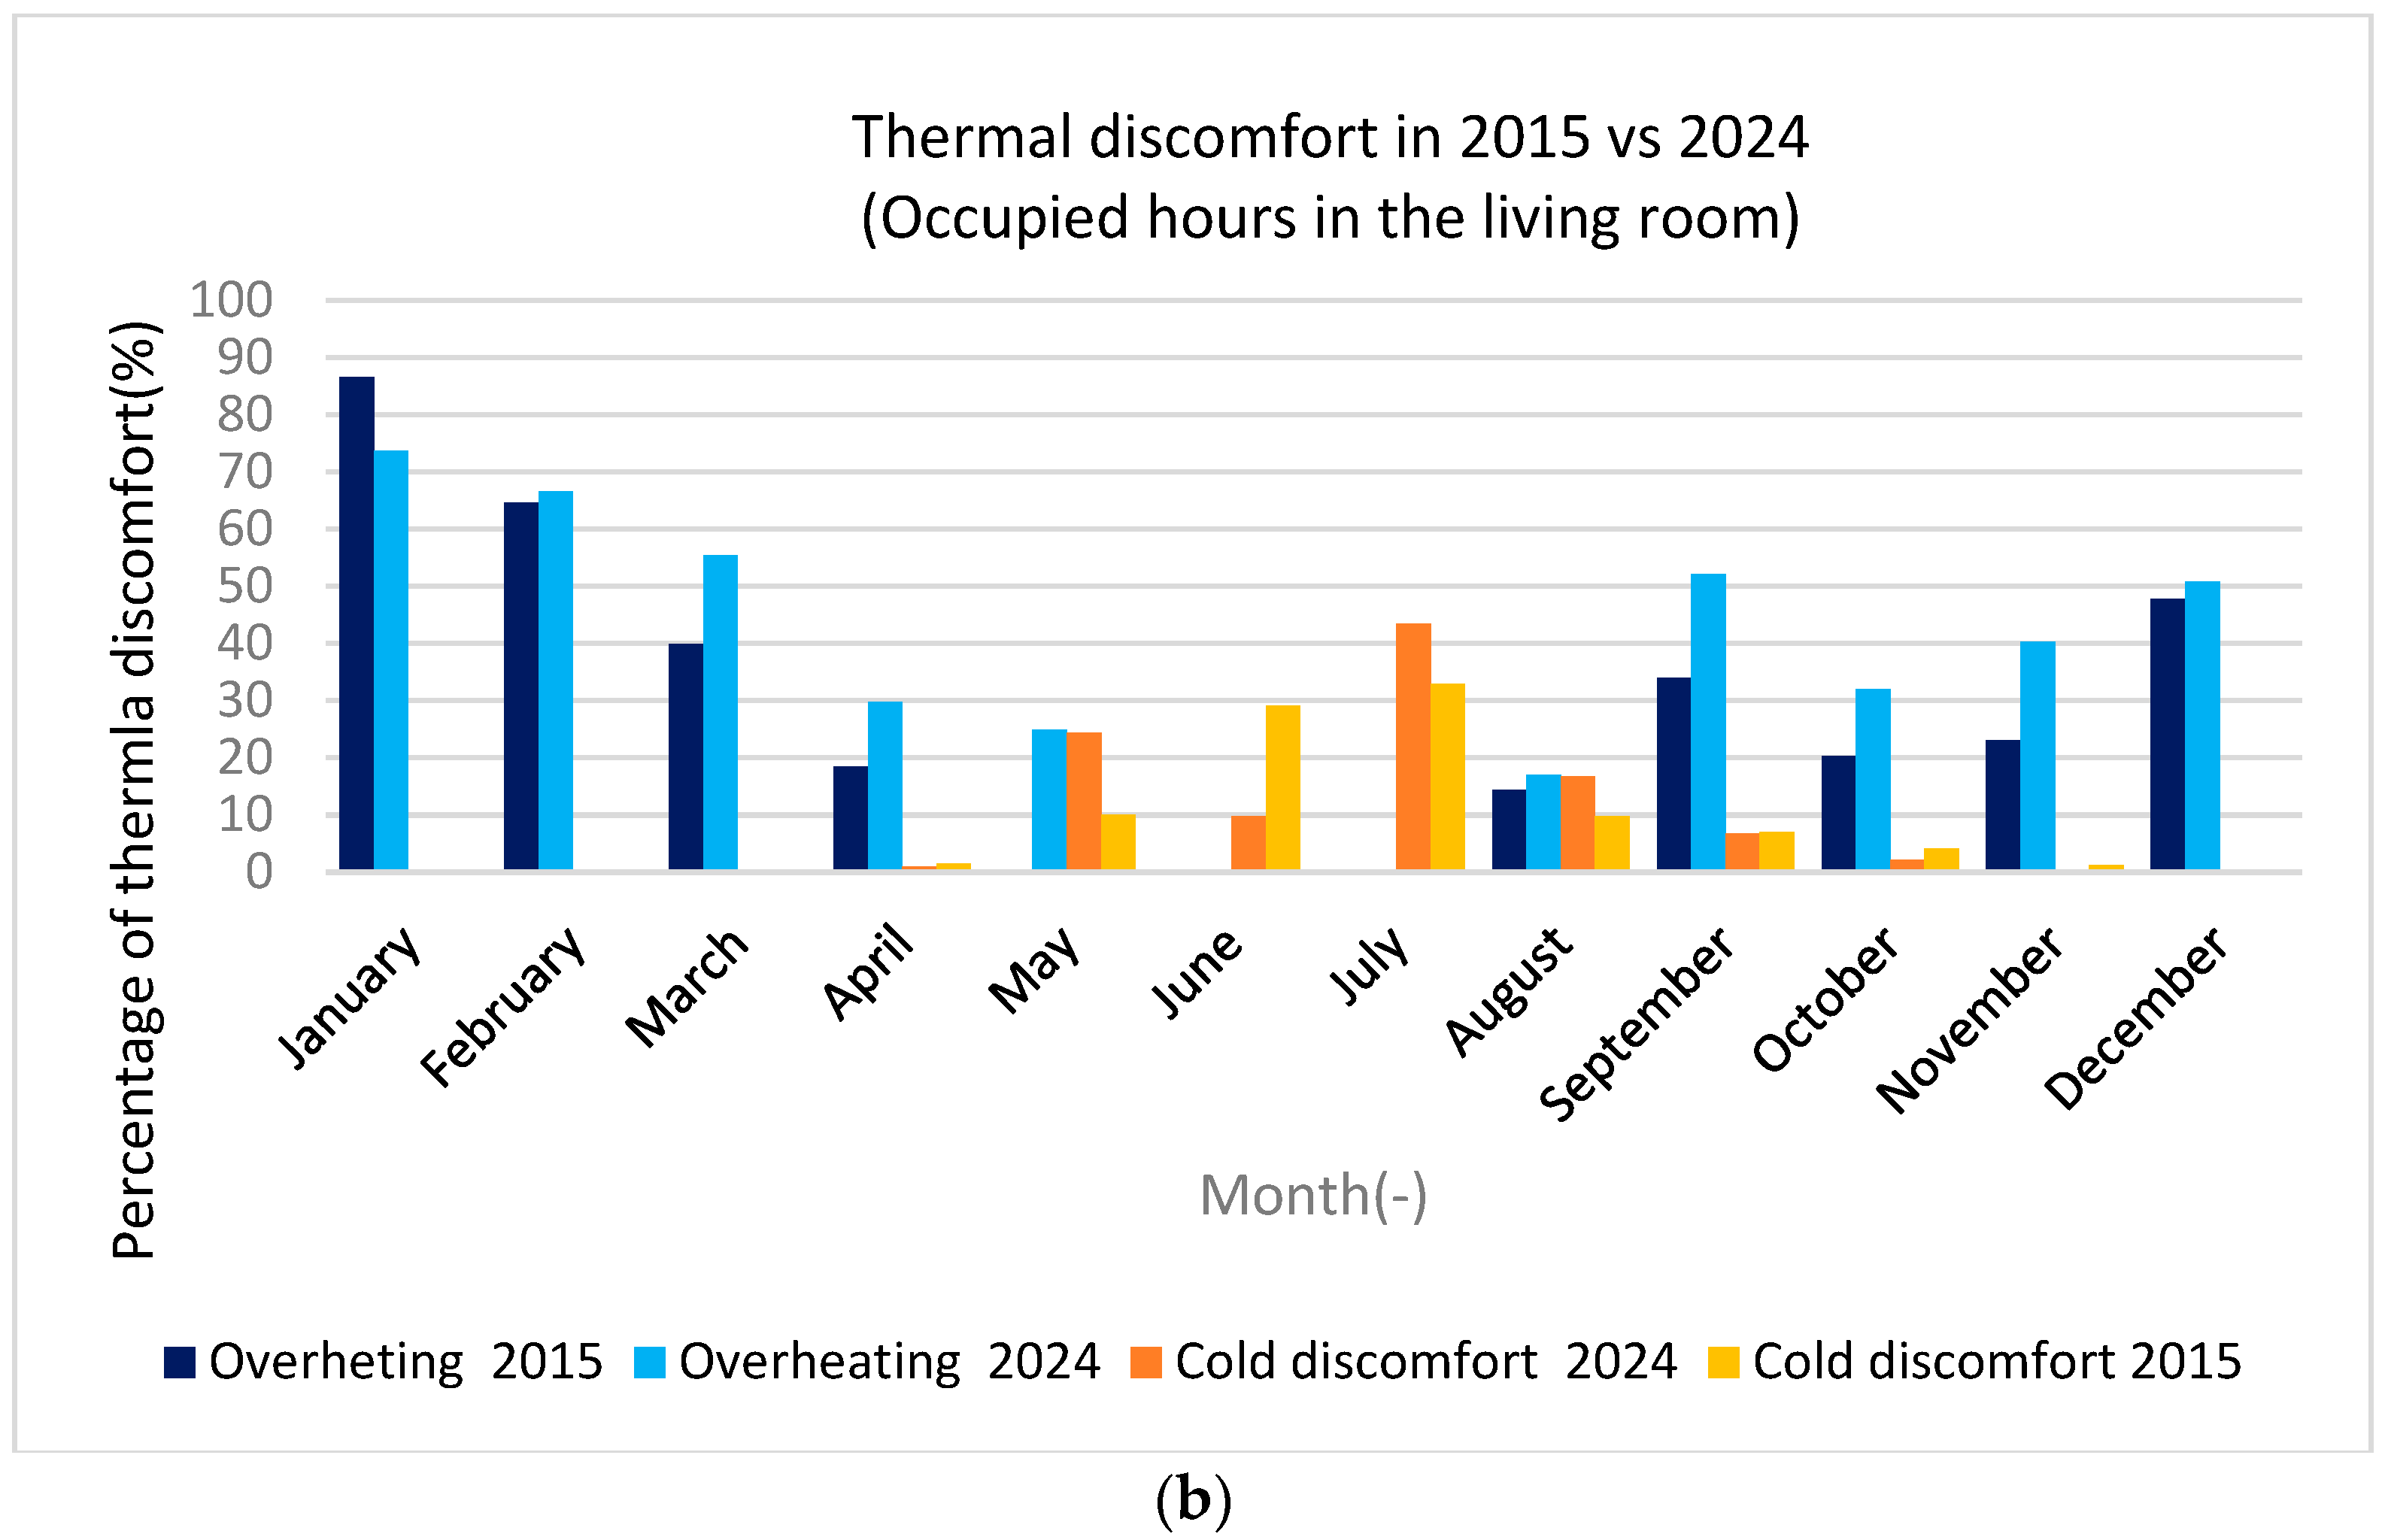
To explore the temporal dynamics in more detail, Figure 8 presents the monthly profiles of the energy demand and thermal discomfort, providing insights into the seasonal behavior of the living room used as an example.
Focusing on the energy demand, Figure 8a shows that although 2024 was warmer overall, January 2015 recorded the highest cooling demand, suggesting the occurrence of an intense early-summer warming period. In contrast, 2024 exhibited increased cooling loads in February, March, April, May, and from September to November, indicating a more prolonged and distributed cooling season. The heating demand remained relatively low in both years, consistent with Curitiba’s subtropical climate; however, slightly higher values in July and August in 2024 suggested colder late-winter conditions.
As illustrated in Figure 8b, the thermal discomfort patterns, calculated for occupied hours in the living room, varied noticeably between the two years. In 2015, the overheating discomfort peaked in January at 86%, while undercooling dominated during the winter, surpassing 32% in July. In 2024, overheating remained elevated in January (74%), but cold discomfort became more pronounced mid-year, peaking at 43% in July. From August to December, the discomfort levels were more comparable between the two years, although 2024 consistently showed slightly higher overheating, particularly in September.
These findings underscore the influence of interannual climatic variability not only on energy demand but also on indoor thermal comfort, with 2024 characterized by a longer cooling season and more pronounced discomfort peaks during winter.

3.2.2. Simulation Results with Modeled Solar Datasets

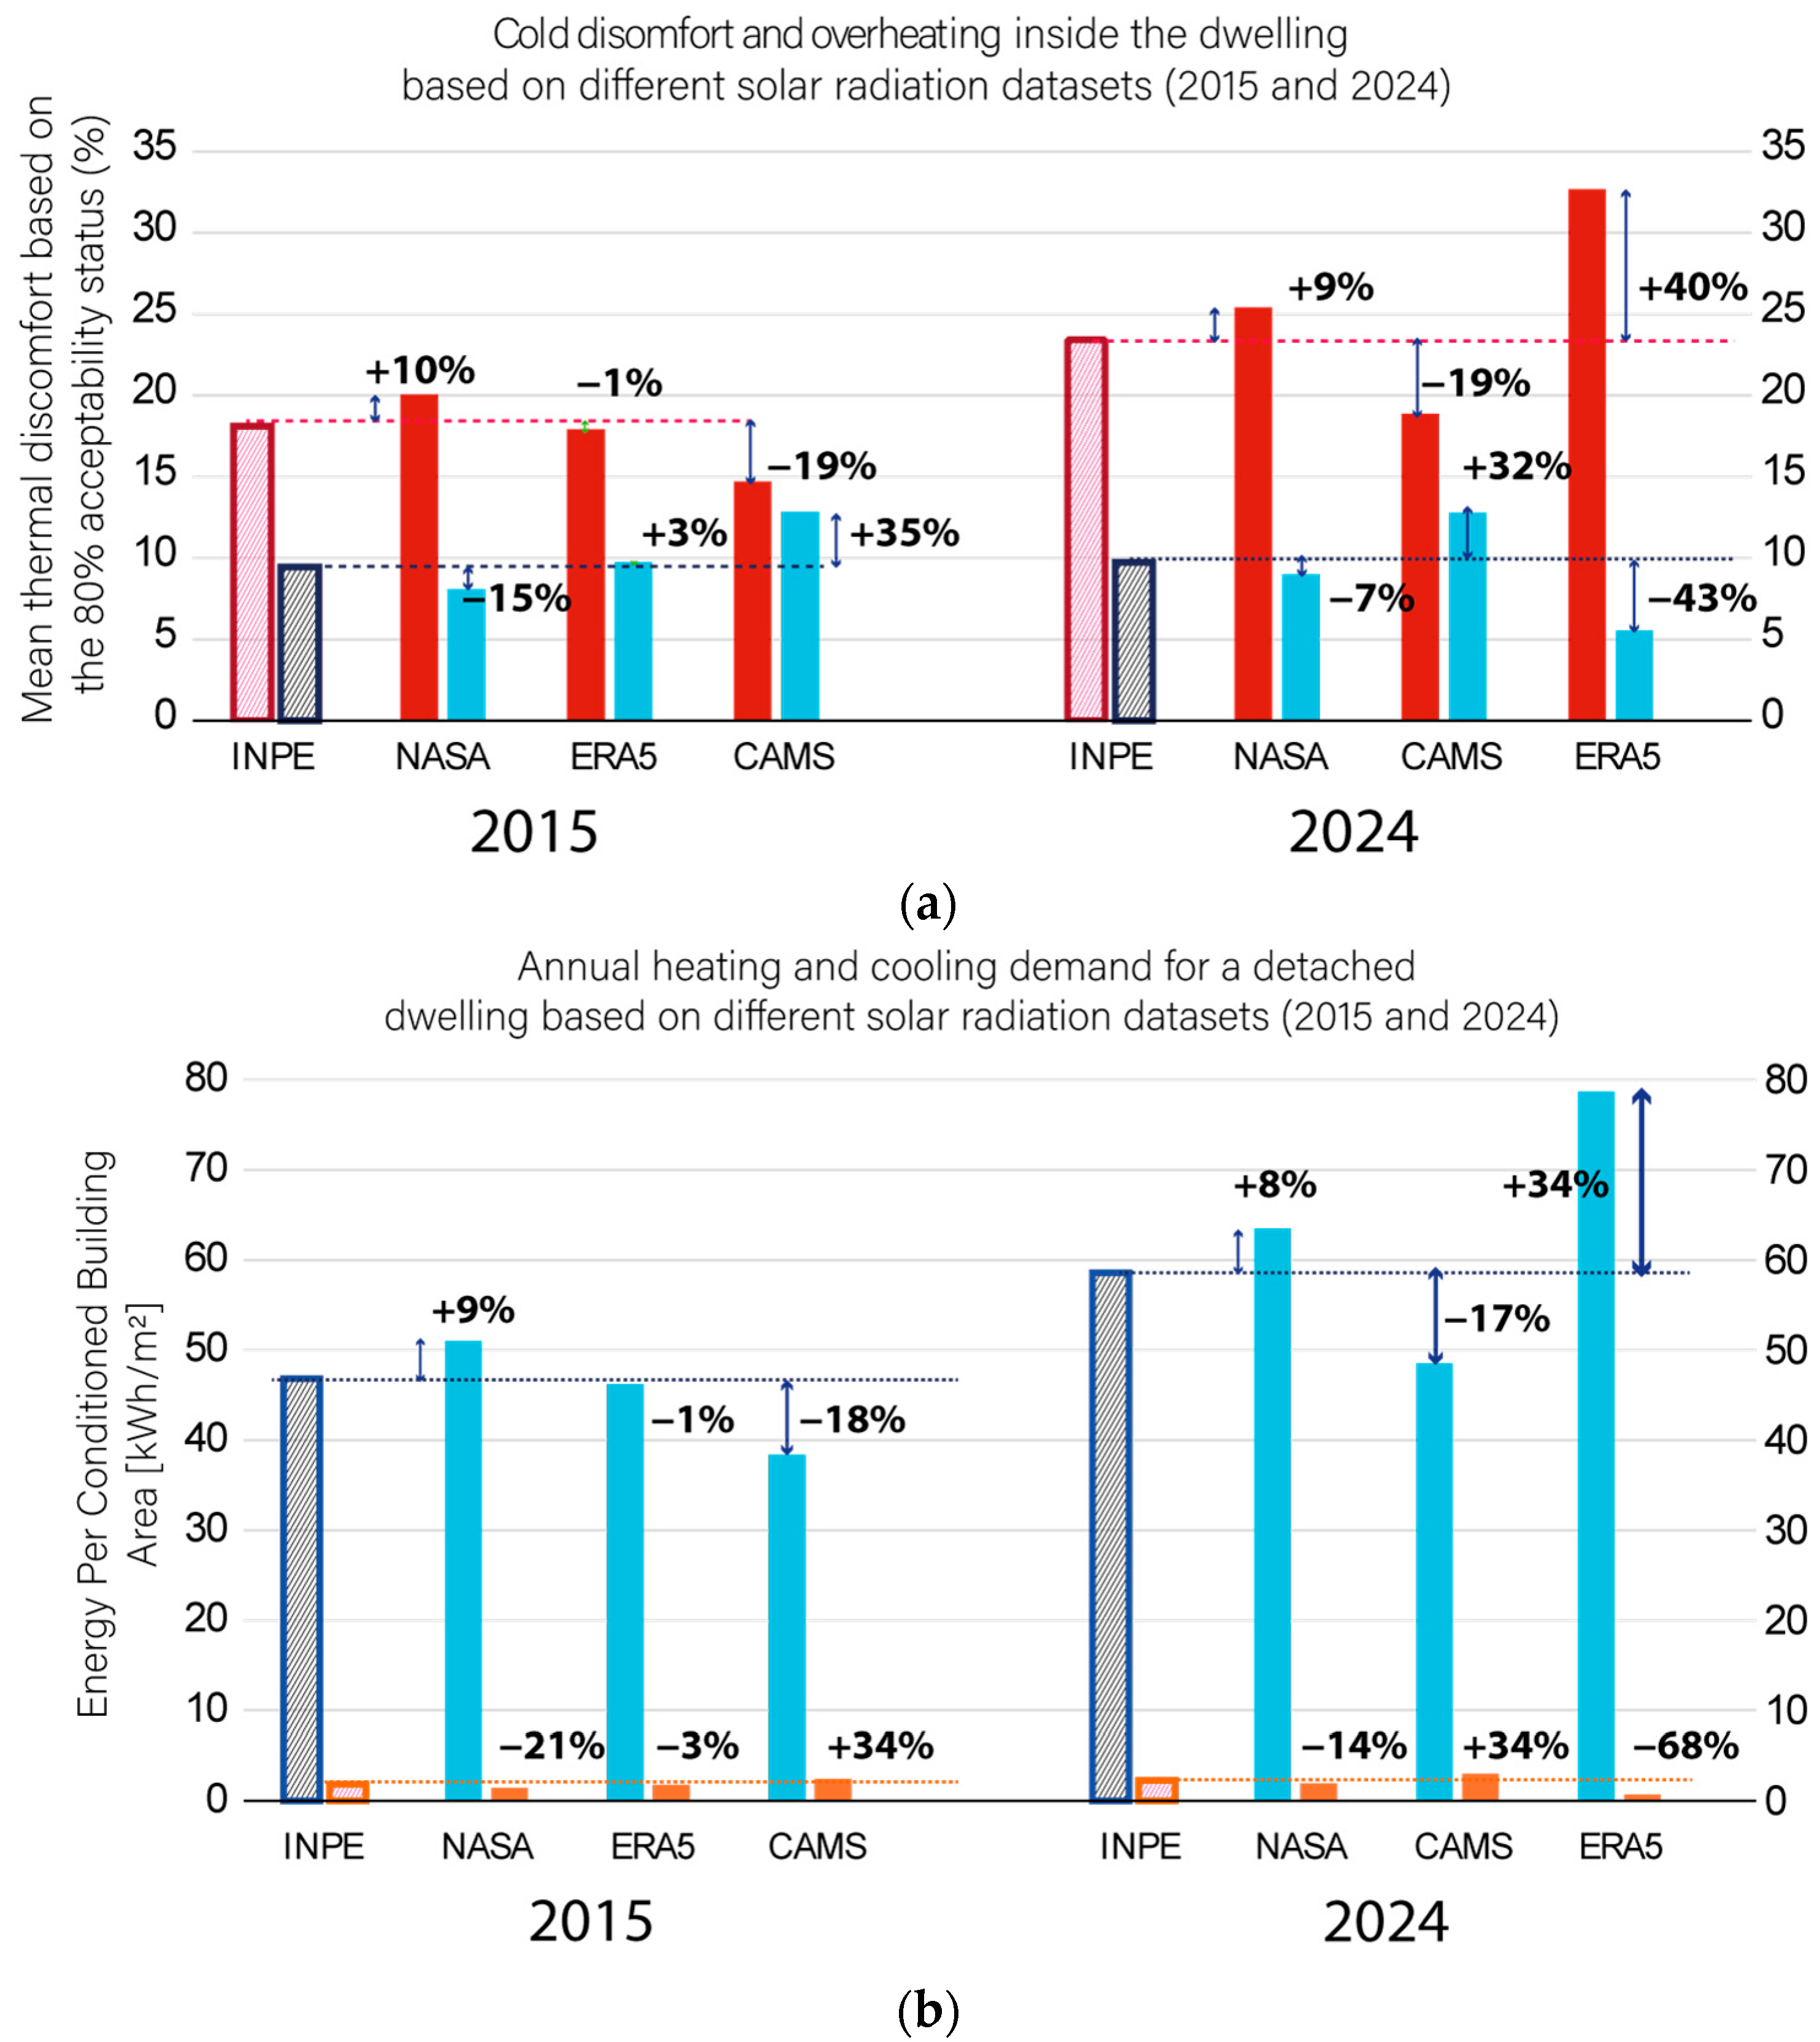
Figure 9 presents the comparison of the annual thermal discomfort (top) for the occupied hours and energy demand for heating and cooling (bottom) in the dwelling, using different solar radiation datasets (INPE, NASA POWER, CAMS, ERA5) for the years 2015 and 2024. Figure 9a distinguishes the cold discomfort (blue bars) and overheating (red bars) based on the adaptive comfort model (80% acceptability threshold), and Figure 9b shows the annual energy demand per conditioned area, with blue bars representing cooling and orange bars representing heating.
In 2015, the modeled datasets produced thermal performance results that were relatively close to the INPE reference. Among them, ERA5 demonstrated the best overall agreement on an annual basis, with only minor deviations in thermal discomfort (−1% in overheating hours and +3% in cold discomfort) and energy demand (−1% in cooling loads and −3% in heating loads) compared to the reference. NASA, by contrast, exhibited the largest overestimations, with overheating hours 10% higher and cooling loads 9% higher than the reference, while the cold discomfort hours and heating loads were lower by 15% and 21%, respectively. Conversely, the CAMS dataset showed the opposite pattern, reporting 19% fewer overheating hours and 18% lower cooling loads, with 35% more cold discomfort hours and 34% higher heating loads. Overall, the ERA5 provided the most balanced performance, whereas the NASA tended to overestimate heat gains and CAMS to underestimate them.
In 2024, the datasets showed substantial divergence in performance. ERA5 produced the highest levels of overheating (exceeding +40%) and the greatest total energy demand (+34%) compared to the reference. These results were accompanied by a −43% reduction in cold discomfort hours and a 68% decrease in heating loads, primarily due to an overestimation of solar input, particularly during the hotter months, which amplified the internal heat gains and, consequently, the cooling demand. By contrast, CAMS resulted in lower overheating (−19%) and reduced cooling demand (−17%), while maintaining a more balanced performance overall, though with higher cold discomfort hours (+32%) and heating loads (+34%). NASA POWER outperformed both datasets, showing a moderate increase in overheating hours (+9%) and cooling loads (+8%), while reducing the cold discomfort hours (−7%) and heating loads (−14%). Overall, its performance indicates a relatively sound balance between the solar input accuracy and energy simulation outcomes.
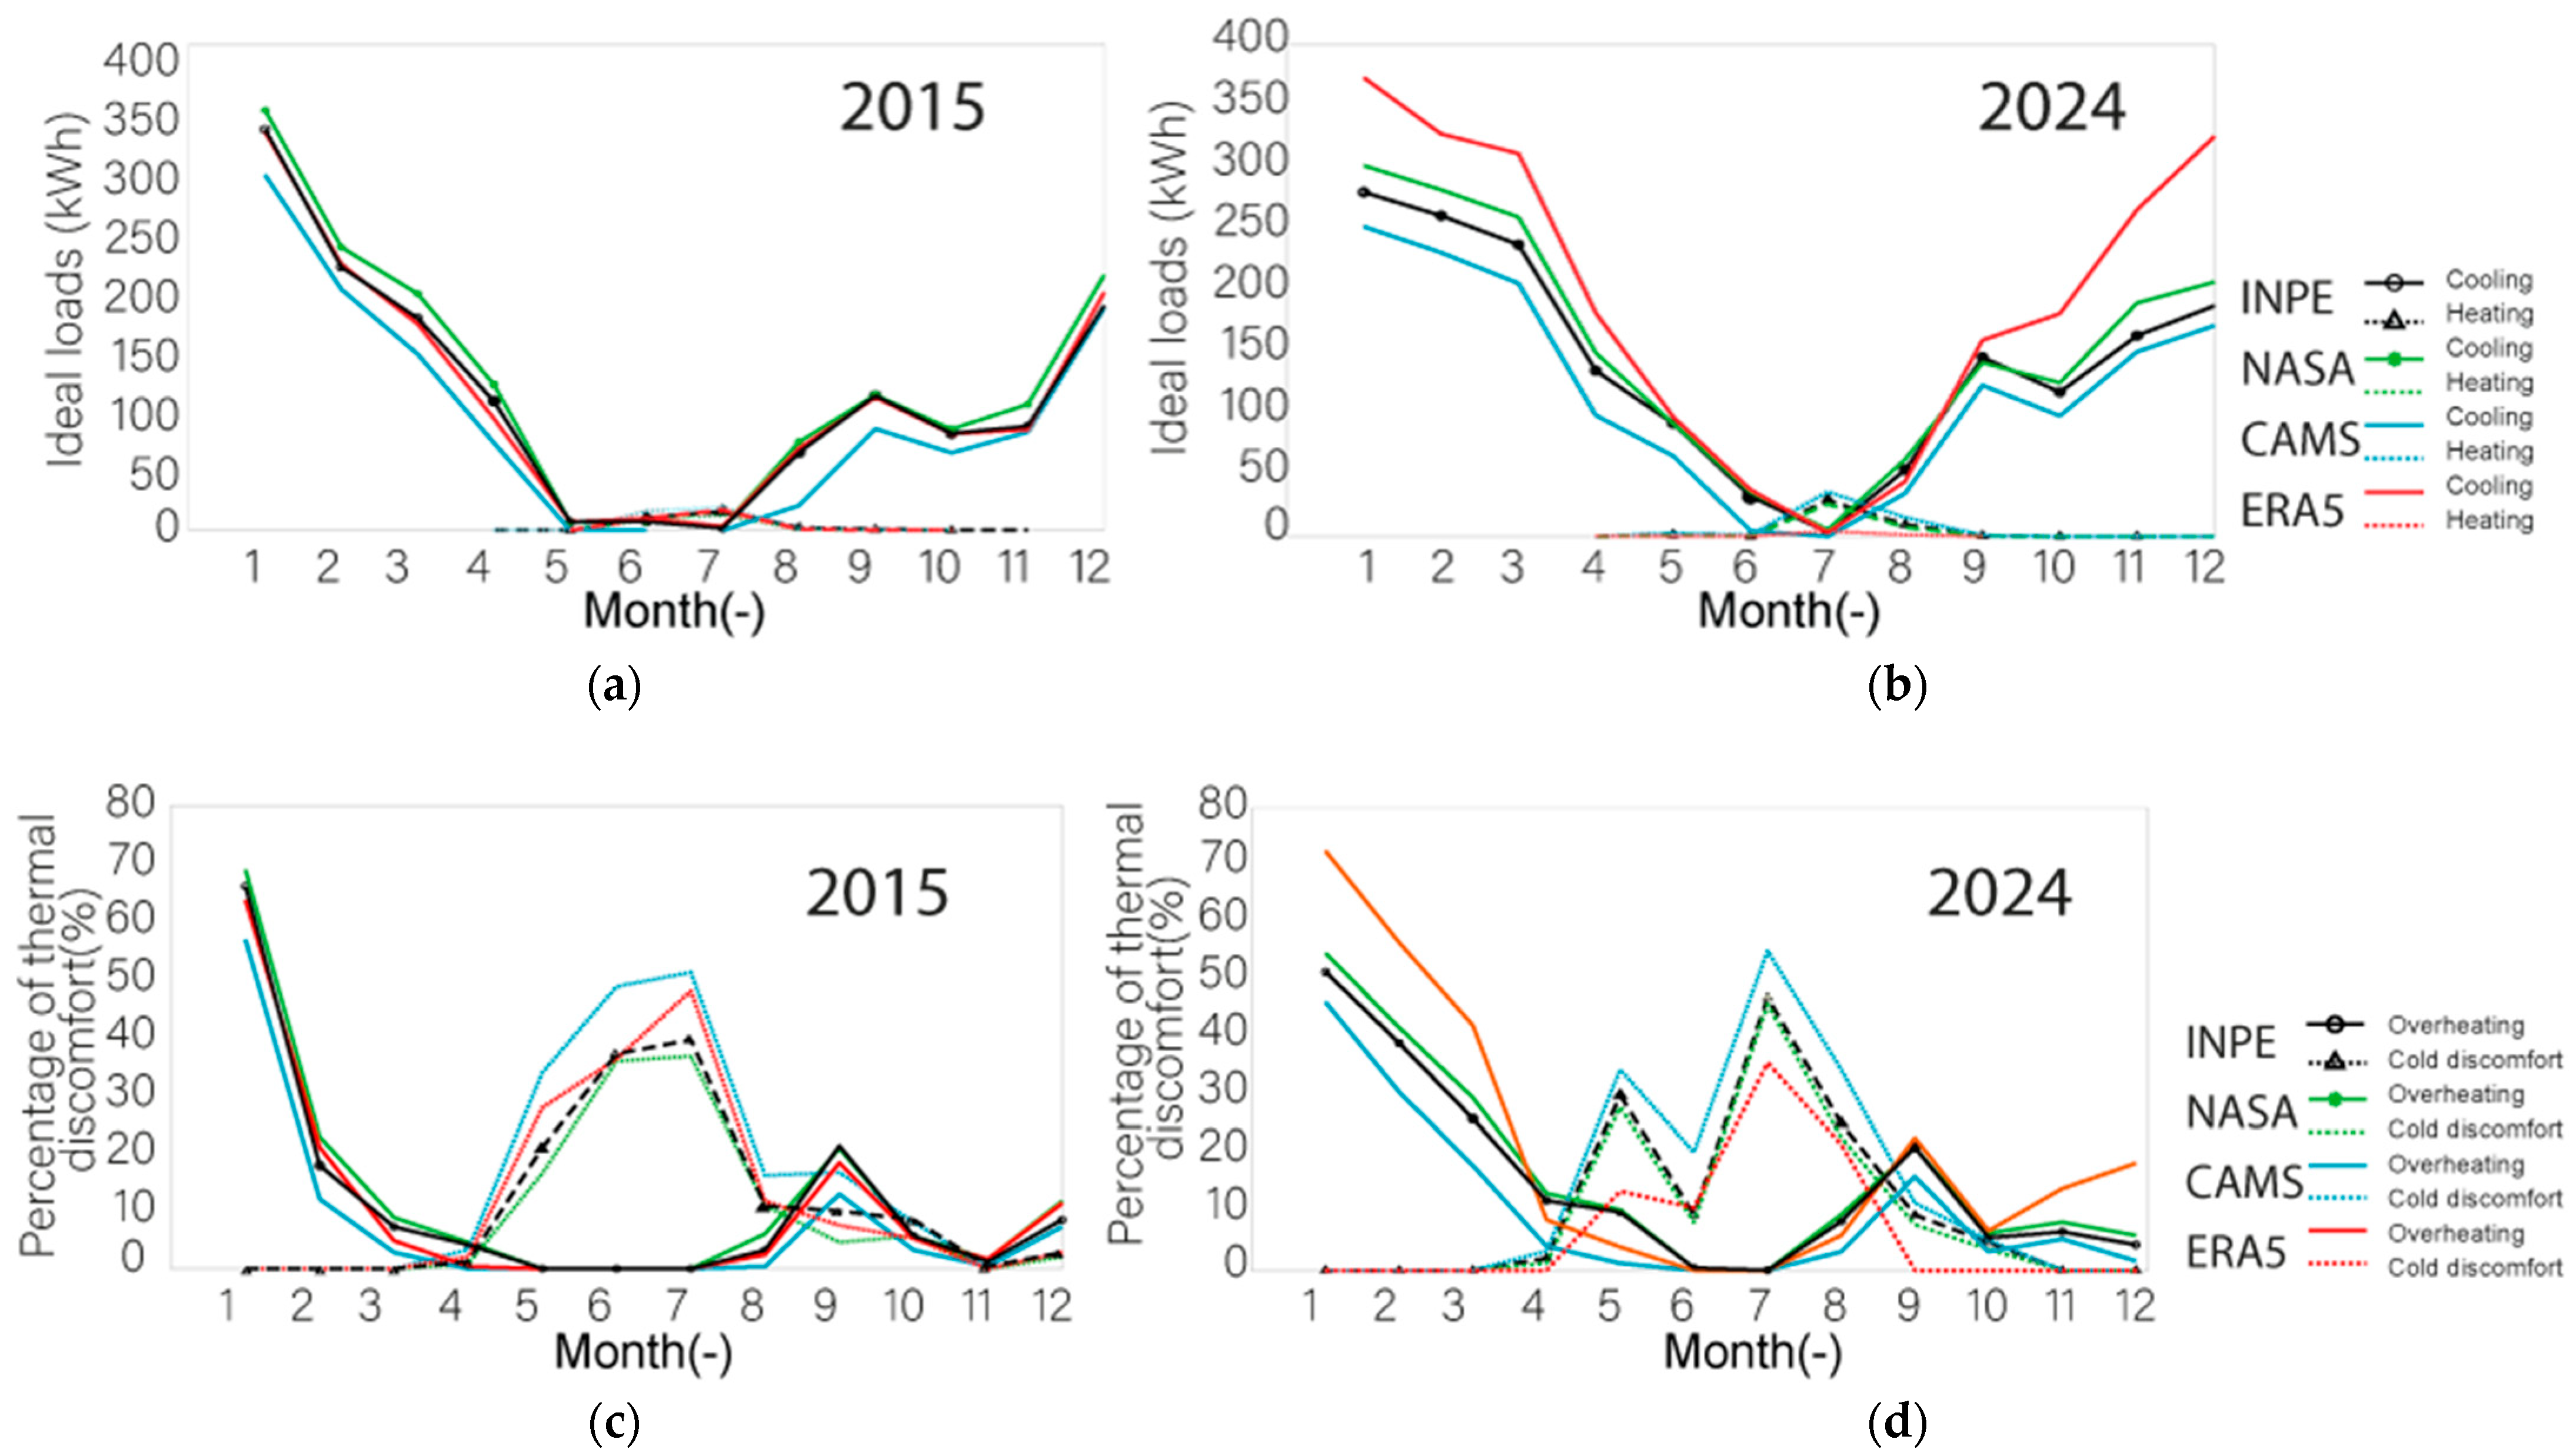
Figure 10 compares the cooling energy loads (top row) and thermal comfort conditions (bottom row) simulated with different climate datasets, CAMS (cyan), ERA5 (red), and NASA (green), against the INPE observational data (black) for Curitiba in the years 2015 (left) and 2024 (right).
In 2015, all the modeled datasets reasonably reproduced the seasonal trends of both the cooling demand and thermal comfort when compared to the INPE reference. NASA and ERA5 closely matched the magnitude of cooling loads, while CAMS slightly underestimated the peak values. In terms of the thermal comfort, all the datasets showed good overall agreement, with ERA5 demonstrating slightly better alignment. NASA was associated with higher overheating and lower cold discomfort, whereas CAMS exhibited the opposite pattern, with lower overheating and higher cold discomfort.
In 2024, however, the discrepancies became more pronounced. ERA5 tended to intensify the summer conditions, leading to the highest simulated cooling loads and thermal stress. In winter, it downplayed the cold discomfort, diverging from the observed seasonal trends. NASA remained the most consistent with the INPE for both variables, showing only modest overestimations. CAMS again displayed intermediate behavior, underestimating cooling loads, slightly overestimating cold discomfort, and underestimating overheating.

4. Conclusions

This study assessed the impact of different solar radiation datasets on building energy performance simulations for a subtropical urban context, using both statistical evaluation and dynamic building modeling. The findings highlight that, while the GHI estimates from satellite and reanalysis datasets are generally reliable, modeling the DNI remains more complex and prone to errors, especially under climatically unstable conditions. Accurate solar radiation inputs are critical for dependable building energy simulations, particularly in applications requiring precise thermal load estimation and comfort prediction. As climate variability intensifies, the limitations of the modeled datasets become increasingly relevant for both short-term design and long-term planning.
While this study focused on contrasting years (2015 vs. 2024) to illustrate differences in weather conditions relevant to building energy simulations, it is important to note that a two-year comparison does not provide statistical evidence of a climate trend. Instead, it highlights conditions that were particularly representative of the specific area and period under analysis.
A detailed comparison of the CAMS, ERA5, and NASA POWER against high-resolution ground measurements from INPE in Curitiba (Brazil) revealed distinct performance patterns:
  • NASA POWER showed the closest alignment with observed data, particularly in 2015, for both the GHI and DNI. It achieved a high correlation, low RMSE, and regression slopes close to unity, accurately capturing both the magnitude and seasonal behavior of solar irradiance.
  • CAMS delivered consistent results across both years, with strong correlation and low RMSE for the GHI and a systematic underestimation of the DNI (~–26%). This predictable bias, coupled with temporal stability, makes CAMS a practical dataset for calibrated simulations, supporting both energy demand estimation and thermal comfort assessments.
  • ERA5, while adequate for GHI in 2015, showed a considerable decline in accuracy in 2024, particularly for the DNI, where the correlation dropped to 0.21, and the RMSE exceeded 330 W/m2. This dataset exhibited a pronounced phase shift relative to measured data, resulting in negligible correlation and potentially severely compromising the building energy simulation outcomes.
The simulation results confirm that the selection of solar datasets has a direct impact on predicted energy use and indoor thermal comfort:
  • NASA POWER not only reproduced the correct irradiance magnitudes but also captured the seasonal dynamics, resulting in simulations that closely matched the observed building behavior.
  • CAMS, despite underestimating the DNI, produced balanced thermal performance predictions. Its seasonal alignment with the observed data supported reasonable heating and cooling estimates and a thermal comfort profile that closely mirrored real-world expectations.
  • ERA5’s overestimation of solar gains in 2024 led to exaggerated cooling demand and increased overheating discomfort, especially during warmer months. This could result in the oversizing of cooling systems and misalignment with actual occupant needs.
The observed differences in the dataset performance can also be explained by their underlying methodologies. NASA POWER and CAMS are primarily based on satellite-derived observations, which provide more direct measurements of surface irradiance and tend to better reproduce short-term variability. By contrast, ERA5 is a reanalysis dataset that integrates sparse historical observations into a global atmospheric model. While this approach ensures spatial and temporal coverage, it can smooth localized variability and introduce temporal phase shifts, especially under unstable or extreme climatic conditions such as those observed in 2024. This methodological distinction likely explains why the NASA POWER and CAMS showed closer alignment with the ground data, while ERA5 presented larger deviations.
In summary, NASA POWER proved to be the most accurate dataset for the region studied, offering the best agreement with the ground-truth data and leading to the most dependable simulation outputs. CAMS is a strong option that closely follows the short-term behavior of real observations. However, it consistently underestimates irradiance values, a systematic bias that should be considered when using the dataset in simulations. ERA5, while valuable for climate research and long-term averages, is less appropriate for high-resolution or seasonally dependent building performance simulations due to its pronounced variability and temporal inconsistency, especially evident in recent years.
Future research should focus on improving the correction methods for modeled solar datasets, exploring ensemble approaches, and extending validation across diverse scenarios. Continuous comparison with high-resolution ground data is essential to enhance predictive capacity and support climate-adapted building design and urban planning. Beyond building-scale applications, short-term dataset reliability supports operational design decisions, while long-term consistency is crucial for informing energy and urban resilience policies. Although this study focused on detached dwellings under current climate conditions, the findings provide valuable insights and underscore the need for further validation across other building types and climatic contexts.

Author Contributions

Conceptualization, A.S.W.G. and A.P.d.A.R.; methodology, A.S.W.G. and A.P.d.A.R.; investigation, A.S.W.G. and A.P.d.A.R.; writing—original draft, A.S.W.G. and A.P.d.A.R.; writing—review and editing, N.M. and O.d.C.V.; funding acquisition, N.M.; supervision, N.M. and O.d.C.V. All authors have read and agreed to the published version of the manuscript.

Funding

The authors gratefully acknowledge the financial support provided by Fundação Araucária (CP 12/2023—Programa Institucional Profissionais Top Manager) and Empresa Brasileira de Participações em Energia Nuclear e Binacional (PD&I No. 1/2025–PROCEL–ENBPar). The authors also acknowledge the continued support from the National Council for Scientific and Technological Development (CNPq).

Data Availability Statement

The data presented in this study are available in article.

Conflicts of Interest

The authors declare no conflicts of interest.

References

  1. Tuluxun, N.; Halike, S.; Liu, H.; Yelaixi, B.; Ailaitijiang, K. Climate Adaptation of Folk House Envelopes in Xinjiang Arid Region: Evaluation and Multi-Objective Optimization from Historical to Future Climates. Buildings 2025, 15, 1240. [Google Scholar] [CrossRef]
  2. Kutty, N.A.; Barakat, D.; Darsaleh, A.O.; Kim, Y.K. A Systematic Review of Climate Change Implications on Building Energy Consumption: Impacts and Adaptation Measures in Hot Urban Desert Climates. Buildings 2024, 14, 13. [Google Scholar] [CrossRef]
  3. Shen, P.; Li, Y.; Gao, X.; Chen, S.; Cui, X.; Zhang, Y.; Zheng, X.; Tang, H.; Wang, M. Climate Adaptability of Building Passive Strategies to Changing Future Urban Climate: A Review. Nexus 2025, 2, 100061. [Google Scholar] [CrossRef]
  4. Parker, D.S.; Panchabikesan, K.; Crawley, D.B.; Lawrie, L.K. Impact of Newer Climate Data for Technical Analysis of Residential Building Energy Use in the United States. Energy Build. 2024, 323, 114828. [Google Scholar] [CrossRef]
  5. Gürel, A.E.; Ağbulut, Ü.; Bakır, H.; Ergün, A.; Yıldız, G. A State of Art Review on Estimation of Solar Radiation with Various Models. Heliyon 2023, 9, e13167. [Google Scholar] [CrossRef] [PubMed]
  6. NASA. NASA POWER Homepage. Available online: https://power.larc.nasa.gov/ (accessed on 9 July 2025).
  7. Hersbach, H.; Bell, B.; Berrisford, P.; Biavati, G.; Horányi, A.; Muñoz Sabater, J.; Nicolas, J.; Peubey, C.; Radu, R.; Rozum, I.; et al. ERA5 Hourly Data on Single Levels from 1940 to Present; Copernicus Climate Change Service (C3S) Climate Data Store (CDS): Brussels, Belgium, 2023. [Google Scholar] [CrossRef]
  8. Hersbach, H.; Bell, B.; Berrisford, P.; Hirahara, S.; Horányi, A.; Muñoz-Sabater, J.; Nicolas, J.; Peubey, C.; Radu, R.; Schepers, D.; et al. The ERA5 Global Reanalysis. Q. J. R. Meteorol. Soc. 2020, 146, 1999–2049. [Google Scholar] [CrossRef]
  9. Copernicus Atmosphere Monitoring Service. CAMS Solar Radiation Time-Series; Copernicus Atmosphere Monitoring Service (CAMS) Atmosphere Data Store: Brussels, Belgium, 2020. [Google Scholar] [CrossRef]
  10. Yang, D.; Bright, J.M. Worldwide Validation of 8 Satellite-Derived and Reanalysis Solar Radiation Products: A Preliminary Evaluation and Overall Metrics for Hourly Data over 27 Years. Sol. Energy 2020, 210, 3–19. [Google Scholar] [CrossRef]
  11. Yang, D. SolarData: An R Package for Easy Access of Publicly Available Solar Datasets. Sol. Energy 2018, 171, A3–A12. [Google Scholar] [CrossRef]
  12. Jensen, A.R.; Anderson, K.S.; Holmgren, W.F.; Mikofski, M.A.; Hansen, C.W.; Boeman, L.J.; Loonen, R. Pvlib Iotools—Open-Source Python Functions for Seamless Access to Solar Irradiance Data. Sol. Energy 2023, 266, 112092. [Google Scholar] [CrossRef]
  13. Pfenninger, S.; Staffell, I. Long-Term Patterns of European PV Output Using 30 Years of Validated Hourly Reanalysis and Satellite Data. Energy 2016, 114, 1251–1265. [Google Scholar] [CrossRef]
  14. Aliana, A.; Chang, M.; Østergaard, P.A.; Victoria, M.; Andersen, A.N. Performance Assessment of Using Various Solar Radiation Data in Modelling Large-Scale Solar Thermal Systems Integrated in District Heating Networks. Renew. Energy 2022, 190, 699–712. [Google Scholar] [CrossRef]
  15. Borujeni, M.S.; Ofetotse, E.L.; Nebel, J.C. A Solar Backup System to Provide Reliable Energy in Presence of Unplanned Power Outages. J. Energy Storage 2022, 47, 103653. [Google Scholar] [CrossRef]
  16. Khan, M.U.; Jama, M.A. Evaluation and Correction of Solar Irradiance in Somaliland Using Ground Measurements and Global Reanalysis Products. Heliyon 2024, 10, e35256. [Google Scholar] [CrossRef]
  17. Herdies, B.R.; Vendrasco, E.P.; Herdies, D.L.; de Oliveira, C.E.L.; de Quadro, M.F.L. The Use of Atmospheric Reanalysis Data for the Estimation of Solar Irradiation Considering the Effect of Atmospheric Aerosols over Brazil. Atmosphere 2025, 16, 124. [Google Scholar] [CrossRef]
  18. Amorim, A.C.B.; de Almeida Dantas, V.; dos Reis, J.S.; de Assis Bose, N.; Emiliavaca, S.d.A.S.; Cruz Bezerra, L.A.; de Matos, M.dF.A.; de Mello Nobre, M.T.C.; Oliveira, L.d.L.; de Medeiros, A.M. Analysis of WRF-Solar in the Estimation of Global Horizontal Irradiation in Amapá, Northern Brazil. Renew. Energy 2024, 235, 121361. [Google Scholar] [CrossRef]
  19. Ndiaye, A.; Wane, D.; Dione, C.; Gaye, A.T. Assessing Solar Energy Production in Senegal under Future Climate Scenarios Using Regional Climate Models. Sol. Energy Adv. 2025, 5, 100101. [Google Scholar] [CrossRef]
  20. Bre, F.; e Silva Machado, R.M.; Lawrie, L.K.; Crawley, D.B.; Lamberts, R. Assessment of Solar Radiation Data Quality in Typical Meteorological Years and Its Influence on the Building Performance Simulation. Energy Build. 2021, 250, 111251. [Google Scholar] [CrossRef]
  21. Wu, Y.; An, J.; Gui, C.; Xiao, C.; Yan, D. A Global Typical Meteorological Year (TMY) Database on ERA5 Dataset. Build. Simul. 2023, 16, 1013–1026. [Google Scholar] [CrossRef]
  22. Driemel, A.; Augustine, J.; Behrens, K.; Colle, S.; Cox, C.; Cuevas-Agulló, E.; Denn, F.M.; Duprat, T.; Fukuda, M.; Grobe, H.; et al. Baseline Surface Radiation Network (BSRN): Structure and Data Description (1992–2017). Earth Syst. Sci. Data 2018, 10, 1491–1501. [Google Scholar] [CrossRef]
  23. Sengupta, M.; Xie, Y.; Lopez, A.; Habte, A.; Maclaurin, G.; Shelby, J. The National Solar Radiation Data Base (NSRDB). Renew. Sustain. Energy Rev. 2018, 89, 51–60. [Google Scholar] [CrossRef]
  24. Zhang, T.; Stackhouse, P.W.; Macpherson, B.; Colleen Mikovitz, J. A CERES-Based Dataset of Hourly DNI, DHI and Global Tilted Irradiance (GTI) on Equatorward Tilted Surfaces: Derivation and Comparison with the Ground-Based BSRN Data. Sol. Energy 2024, 274, 112538. [Google Scholar] [CrossRef]
  25. Copper, J.K.; Sproul, A.B. Comparative Building Simulation Study Utilising Measured and Estimated Solar Irradiance for Australian Locations. Renew. Energy 2013, 53, 86–93. [Google Scholar] [CrossRef]
  26. Salazar, G.; Gueymard, C.; Galdino, J.B.; de Castro Vilela, O.; Fraidenraich, N. Solar Irradiance Time Series Derived from High-Quality Measurements, Satellite-Based Models, and Reanalyses at a near-Equatorial Site in Brazil. Renew. Sustain. Energy Rev. 2020, 117, 109478. [Google Scholar] [CrossRef]
  27. Qin, Y.; McVicar, T.R.; Huang, J.; West, S.; Steven, A.D.L. On the Validity of Using Ground-Based Observations to Validate Geostationary-Satellite-Derived Direct and Diffuse Surface Solar Irradiance: Quantifying the Spatial Mismatch and Temporal Averaging Issues. Remote Sens. Environ. 2022, 280, 113179. [Google Scholar] [CrossRef]
  28. Lima, F.J.L.d.; Martins, F.R.; Costa, R.S.; Gonçalves, A.R.; dos Santos, A.P.P.; Pereira, E.B. The Seasonal Variability and Trends for the Surface Solar Irradiation in Northeastern Region of Brazil. Sustain. Energy Technol. Assess. 2019, 35, 335–346. [Google Scholar] [CrossRef]
  29. Sánchez-Hernández, G.; Jiménez-Garrote, A.; López-Cuesta, M.; Galván, I.M.; Aler, R.; Pozo-Vázquez, D. A Novel Method for Modeling Renewable Power Production Using ERA5: Spanish Solar PV Energy. Renew. Energy 2025, 240, 122120. [Google Scholar] [CrossRef]
  30. Araujo, M.A.d.S.G.; Aguilar, S.; Souza, R.C.; Cyrino Oliveira, F.L. Global Horizontal Irradiance in Brazil: A Comparative Study of Reanalysis Datasets with Ground-Based Data. Energies 2024, 17, 5063. [Google Scholar] [CrossRef]
  31. Crawley, D.B.; Lawrie, L.K. Climate.OneBuilding.Org. Available online: http://climate.onebuilding.org/papers/default.html (accessed on 1 July 2025).
  32. Tippett, A.; Gonçalves, A.R.; Pereira, E.B.; Martins, F.R.; Fisch, G.; Costa, R.S. Data Source Sensitivity in Solar Radiation Typical Meteorological Year (TMY) for Five Different Regions of Brazil. Tellus Ser. A Dyn. Meteorol. Oceanogr. 2024, 76, 29–41. [Google Scholar] [CrossRef]
  33. Da Cunha Bustamante, M.M. Climate Change and Children’s Health: Resilience Challenges for Brazil. J. Pediatr. 2025, 101, S3–S9. [Google Scholar] [CrossRef]
  34. Mantovani, J.R.; Alcântara, E.; Baião, C.F.; Pampuch, L.; Curtarelli, M.P.; Mariano Ribeiro, J.V.; Guimarães, Y.C.; Londe, L.; Massi, K.; Marengo, J.; et al. Unprecedented Flooding in Porto Alegre Metropolitan Region (Southern Brazil) in May 2024: Causes, Risks, and Impacts. J. S. Am. Earth Sci. 2025, 160, 105533. [Google Scholar] [CrossRef]
  35. Schaeffer, R.; Schipper, E.L.F.; Ospina, D.; Mirazo, P.; Alencar, A.; Anvari, M.; Artaxo, P.; Biresselioglu, M.E.; Blome, T.; Boeckmann, M.; et al. Ten New Insights in Climate Science 2024. One Earth 2025, 8, 101285. [Google Scholar] [CrossRef]
  36. Krüger, E.; Gobo, J.P.A.; Tejas, G.T.; da Silva de Souza, R.M.; Neto, J.B.F.; Pereira, G.; Mendes, D.; Di Napoli, C. The Impact of Urbanization on Heat Stress in Brazil: A Multi-City Study. Urban Clim. 2024, 53, 101827. [Google Scholar] [CrossRef]
  37. Terassi, P.M.d.B.; da Silva Oscar-Júnior, A.C.; Galvani, E.; de Oliveira-Júnior, J.F.; Sobral, B.S.; Biffi, V.H.R.; de Gois, G. Daily Rainfall Intensity and Temporal Trends in Eastern Paraná State—Brazil. Urban Clim. 2022, 42, 101090. [Google Scholar] [CrossRef]
  38. Pereira, E.B.; Martins, F.R.; Pereira, E.B.; Martins, F.R.; Gonçalves, A.R.; Costa, R.S.; Lima, F.J.L.d.; Rüther, R.; Abreu, S.L.d.; Tiepolo, G.M.; et al. Atlas Brasileiro de Energia Solar. INPE 2017, 2, 80. [Google Scholar]
  39. Solargis Global Solar Atlas. Available online: https://globalsolaratlas.info/map (accessed on 6 July 2025).
  40. INPE Sistema de Organização Nacional de Dados Ambientais. Available online: https://sonda.ccst.inpe.br/ (accessed on 1 July 2025).
  41. Dias da Silva, P.E.; Pereira, E.; Martins, F.; Pereira, S. Quality Control of Solar Radiation Data within Sonda Network in Brazil: Preliminary Results. In EuroSun; International Solar Energy Society (ISES): Freiburg, Germany, 2015; pp. 1–9. [Google Scholar]
  42. UFTPR Rede de Estações de Pesquisa Em Energia Solar-EPESOL Da UFTPR. Available online: https://utfpr.curitiba.br/labens/sobre/rede-de-estacoes-de-pesquisa-em-energia-solar/ (accessed on 1 July 2025).
  43. INMET Dados históricos anuais. Available online: https://portal.inmet.gov.br/dadoshistoricos (accessed on 1 July 2025).
  44. Veloso, A.C.O.; Souza, R.V.G. Climate Change Impact on Energy Savings in Mixed-Mode Ventilation Office Buildings in Brazil. Energy Build. 2024, 318, 114418. [Google Scholar] [CrossRef]
  45. Viezzer, J.; Schmidt, M.A.R.; dos Reis, A.R.N.; Freiman, F.P.; de Moraes, E.N.; Biondi, D. Restoration of Urban Forests to Reduce Flood Susceptibility: A Starting Point. Int. J. Disaster Risk Reduct. 2022, 74, 102944. [Google Scholar] [CrossRef]
  46. Betti, G.; Tartarini, F.; Nguyen, C.; Schiavon, S. CBE Clima Tool: A Free and Open-Source Web Application for Climate Analysis Tailored to Sustainable Building Design. Build. Simul. 2024, 17, 493–508. [Google Scholar] [CrossRef]
  47. Instituto Nacional de Meteorologia (INMET). Normais Climatológicas Do Brasil (1991–2020); INMET: Brasília, Brasil, 2022. [Google Scholar]
  48. Siu, C.Y.; Liao, Z. Is Building Energy Simulation Based on TMY Representative: A Comparative Simulation Study on Doe Reference Buildings in Toronto with Typical Year and Historical Year Type Weather Files. Energy Build. 2020, 211, 109760. [Google Scholar] [CrossRef]
  49. Bianchi, C.; Smith, A.D. Localized Actual Meteorological Year File Creator (LAF): A Tool for Using Locally Observed Weather Data in Building Energy Simulations. SoftwareX 2019, 10, 100299. [Google Scholar] [CrossRef]
  50. Hong, T.; Chang, W.; Lin, H. A Fresh Look at Weather Impact on Peak Electricity Demand and Energy Use of Buildings Using 30-Year Actual Weather Data. Appl. Energy 2013, 111, 333–350. [Google Scholar] [CrossRef]
  51. SIMEPAR Meteorological System of Paraná (SIMEPAR). Available online: https://www.simepar.br/ (accessed on 4 July 2025).
  52. NASA. NASA POWER DAV. Available online: https://power.larc.nasa.gov/data-access-viewer/ (accessed on 30 June 2025).
  53. Copernicus CAMS Solar Radiation Time-Series. Available online: https://ads.atmosphere.copernicus.eu/datasets/cams-solar-radiation-timeseries?tab=overview (accessed on 9 March 2025).
  54. ECMWF ECMWF: Parameter Database. Available online: https://codes.ecmwf.int/grib/param-db/ (accessed on 3 July 2025).
  55. Gueymard, C.A. A Review of Validation Methodologies and Statistical Performance Indicators for Modeled Solar Radiation Data: Towards a Better Bankability of Solar Projects. Renew. Sustain. Energy Rev. 2014, 39, 1024–1034. [Google Scholar] [CrossRef]
  56. Triana, M.A.; Lamberts, R.; Sassi, P. Characterisation of Representative Building Typologies for Social Housing Projects in Brazil and Its Energy Performance. Energy Policy 2015, 87, 524–541. [Google Scholar] [CrossRef]
  57. ABNT NBR 15575-1:2013 Amendment 1: 2021; Residential Buildings—Performance—Part 1: General Requirements. Brazilian Association of Technical Standards: Rio de Janeiro, Brasil, 2021.
  58. ANSI/ASHRAE Standard 55-2013; ANSI/ASHRAE Thermal Environmental Conditions for Human Occupancy Standard. ASHRAE: Peachtree Corners, GA, USA, 2013; p. 58.
  59. Eli, L.G.; Krelling, A.F.; Olinger, M.S.; Melo, A.P.; Lamberts, R. Thermal Performance of Residential Building with Mixed-Mode and Passive Cooling Strategies: The Brazilian Context. Energy Build. 2021, 244, 111047. [Google Scholar] [CrossRef]
  60. André, M.; Kamimura, A.; Bavaresco, M.; Giaretta, R.F.; Fossati, M.; Lamberts, R. Achieving Mid-Rise NZEB Offices in Brazilian Urban Centres: A Control Strategy with Desk Fans and Extension of Set Point Temperature. Energy Build. 2022, 259, 111911. [Google Scholar] [CrossRef]
  61. Pavanello, F.; De Cian, E.; Davide, M.; Mistry, M.; Cruz, T.; Bezerra, P.; Jagu, D.; Renner, S.; Schaeffer, R.; Lucena, A.F.P. Air-Conditioning and the Adaptation Cooling Deficit in Emerging Economies. Nat. Commun. 2021, 12, 6460. [Google Scholar] [CrossRef]
  62. Krelling, A.F.; Lamberts, R.; Malik, J.; Hong, T. A Simulation Framework for Assessing Thermally Resilient Buildings and Communities. Build. Environ. 2023, 245, 110887. [Google Scholar] [CrossRef]
  63. Rackes, A.; Melo, A.P.; Lamberts, R. Naturally Comfortable and Sustainable: Informed Design Guidance and Performance Labeling for Passive Commercial Buildings in Hot Climates. Appl. Energy 2016, 174, 256–274. [Google Scholar] [CrossRef]
  64. Rupp, R.F.; Vásquez, N.G.; Lamberts, R. A Review of Human Thermal Comfort in the Built Environment. Energy Build. 2015, 105, 178–205. [Google Scholar] [CrossRef]
  65. Walsh, A.; Cóstola, D.; Hensen, J.L.M.; Labaki, L.C. Multi-Criterial Performance-Based Climatic Zoning of Brazil Supported by Local Experts. Build. Environ. 2023, 243, 110591. [Google Scholar] [CrossRef]
  66. Walsh, A.; Cóstola, D.; Labaki, L.C. Performance-Based Validation of Climatic Zoning for Building Energy Efficiency Applications. Appl. Energy 2018, 212, 416–427. [Google Scholar] [CrossRef]
  67. Cogliani, E.; Ricchiazzi, P.; Maccari, A. Generation of Operational Maps of Global Solar Irradiation on Horizontal Plan and of Direct Normal Irradiation from Meteosat Imagery by Using SOLARMET. Sol. Energy 2008, 82, 556–562. [Google Scholar] [CrossRef]
  68. Kambezidis, H.D.; Psiloglou, B.E.; Karagiannis, D.; Dumka, U.C.; Kaskaoutis, D.G. Meteorological Radiation Model (MRM v6.1): Improvements in Diffuse Radiation Estimates and a New Approach for Implementation of Cloud Products. Renew. Sustain. Energy Rev. 2017, 74, 616–637. [Google Scholar] [CrossRef]
  69. Kleissl, J. Solar Energy Forecasting and Resource Assessment; Elsevier Ltd.: Amsterdam, The Netherlands, 2013; ISBN 9780123971777. [Google Scholar]
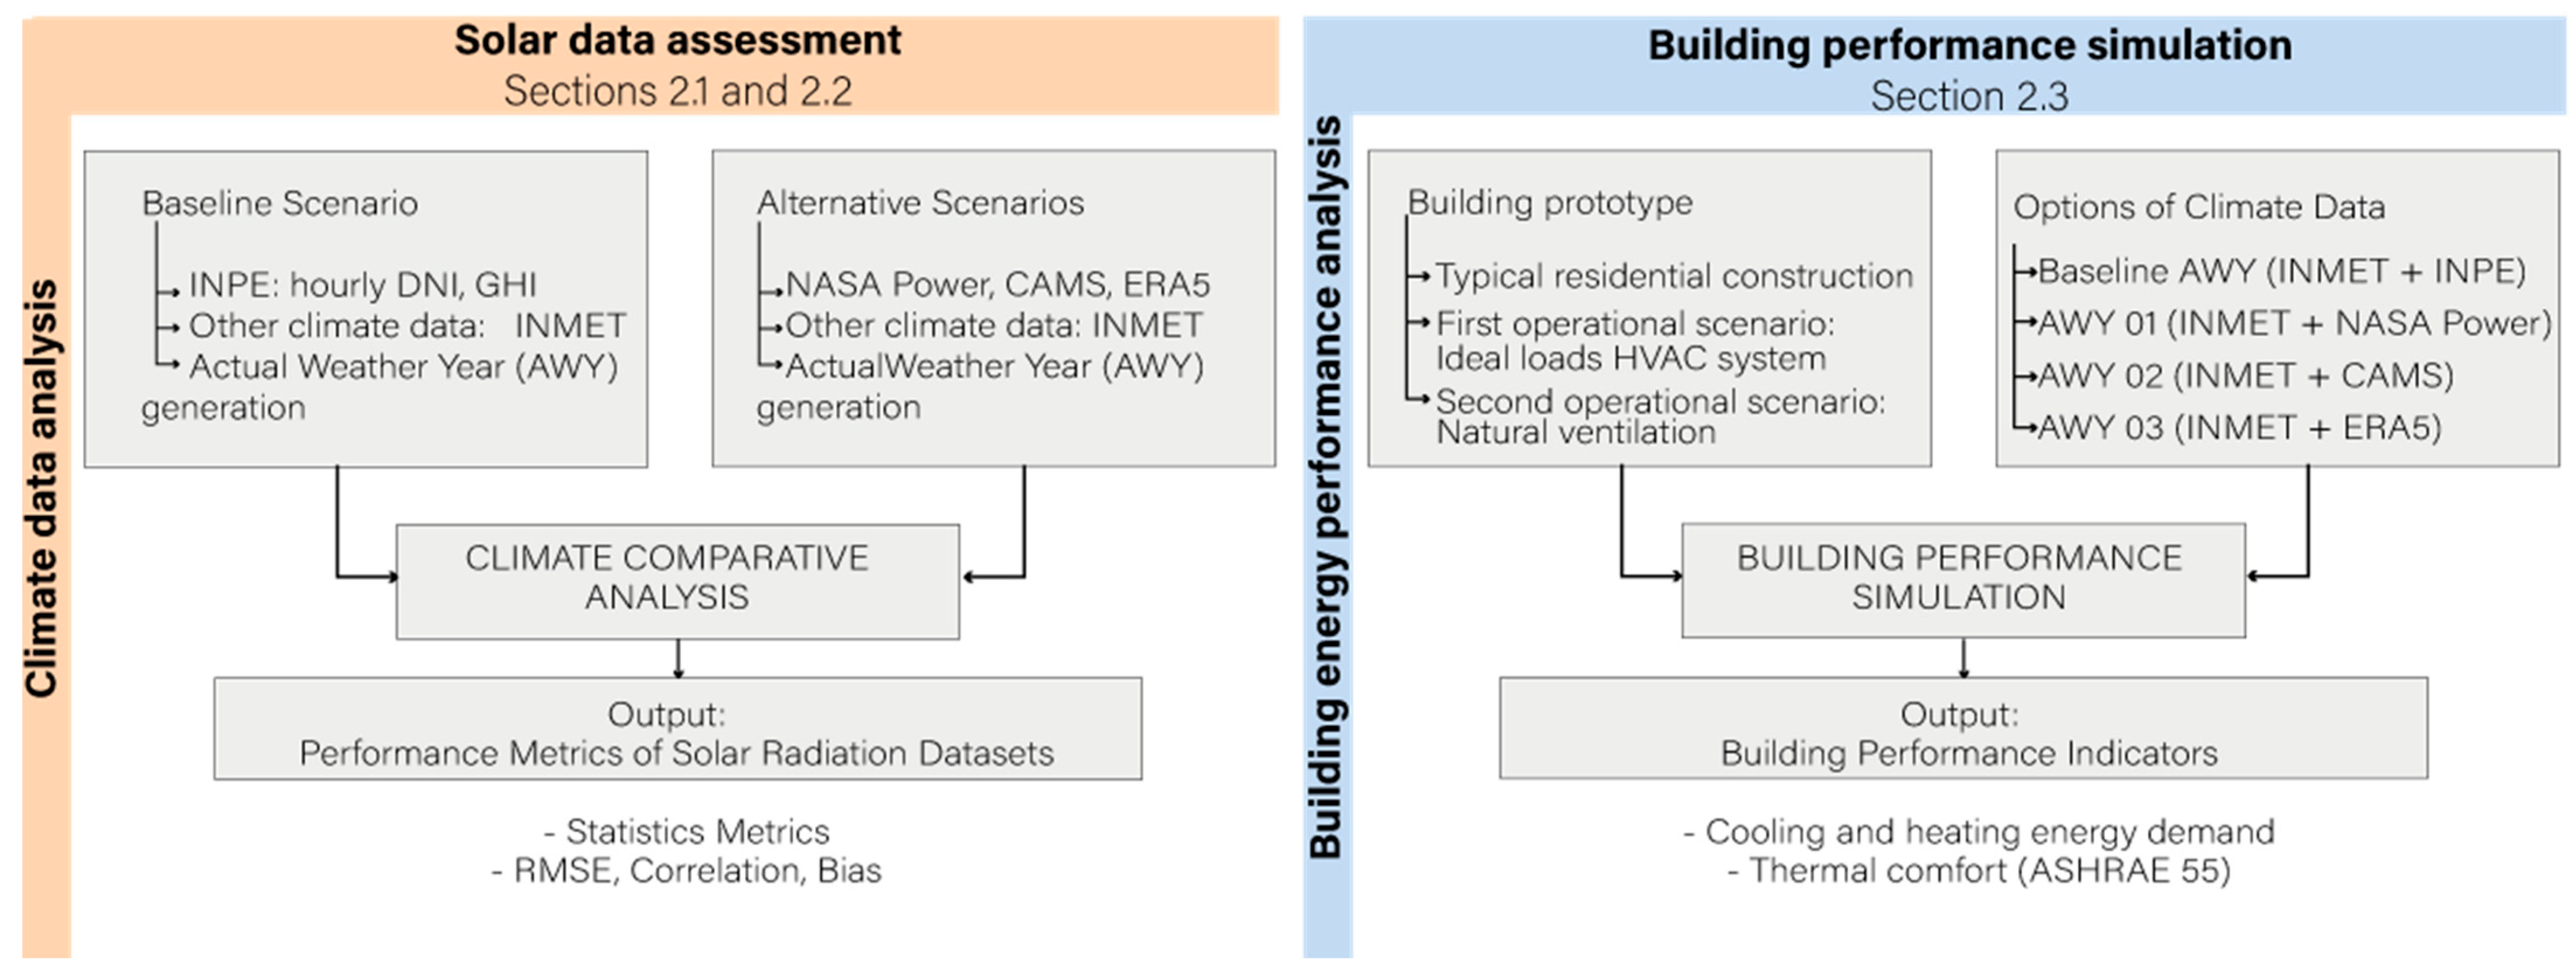
Figure 1. Methodological workflow combining climate data analysis and building energy simulation based on observed and modeled solar radiation datasets.
Buildings 15 03337 g001
Figure 2. Annual variation of GHI in Curitiba for 2015 and 2024, based on SONDA/INPE data.
Buildings 15 03337 g002
Figure 3. Monthly heating and cooling degree days (HDD and CDD) in Curitiba for 2015 and 2024.
Buildings 15 03337 g003
Figure 4. Comparison of GHI estimates from CAMS, ERA5, and NASA POWER against INPE measurements for 2015 and 2024.
Buildings 15 03337 g004
Figure 5. Monthly bias of GHI compared to INPE measurements (2015 and 2024) (W/m2).
Buildings 15 03337 g005
Figure 6. Comparison of DNI estimates from CAMS, ERA5, and NASA POWER against INPE measurements for 2015 and 2024.
Buildings 15 03337 g006
Figure 7. Monthly bias of DNI compared to INPE measurements (2015 and 2024).
Buildings 15 03337 g007
Figure 8. Monthly variation of energy demand and thermal discomfort in 2015 and 2024, based on INPE-derived AWYs. (a) Cooling and heating load; (b) thermal discomfort due to overheating and undercooling.
Buildings 15 03337 g008aBuildings 15 03337 g008b
Figure 9. Mean thermal discomfort based on the adaptive comfort model 80 acceptability status. (a) Overheating (in red bars) and cold discomfort (in blue bars); (b) cooling demand (in blue bars) and heating demand (in orange bars).
Buildings 15 03337 g009
Figure 10. Monthly variation in energy demand and thermal comfort for each scenario and dataset. (a) Monthly energy demand under ideal HVAC mode—2015; (b) monthly energy demand under ideal HVAC mode—2024; (c) monthly thermal discomfort (overheating/cold) under natural ventilation—2015; (d) monthly thermal discomfort (overheating/cold) under natural ventilation—2024.
Buildings 15 03337 g010
Table 1. Monthly GHI variation in 2015 and 2024.
Months
GHI (Wh/m2)123456789101112
Mean 2015399.9358.3319.6314.1244.7254.9239.9352.6331.4270.4253.9326.9
Mean 2024420.3410.1361.1331.6308.1324.4271.1399.9374.8365.9351.2344.4
Peak 20151144.91048.61100.7973.5794.5699.0753.7914.6993.21005.7976.71089.0
Peak 20241175.21129.21061.2975.4789.3717.5744.8897.91009.61045.11118.61132.4
Std 2015342.5312.8276.9263.0212.1218.4218.1272.5300.2267.8245.4287.7
Std 2024336.0337.6301.0277.6258.3226.6241.5281.4305.0321.4303.7299.0
Table 2. Key properties of the gridded solar radiation datasets (NASA POWER, CAMS, ERA5).
DatasetData AvailabilityFormatUnitsType
NASA POWER1983–present.CSV, JSON, ASCII, NetCDFW/m2Satellite-based
CAMS2004 to present.CSV, NetCDFW/m2Satellite-based
ERA51959–presentNetCDF, GRIBJ/m2/h → W/m2Reanalysis
Table 3. Properties of the building envelope.
GeometryInput ParametersBase Case Properties
Buildings 15 03337 i001Buildings 15 03337 i002U value
(Wm−2 K 1)
External walls2.43
Roof1.75
Windows5.7
Solar absorptance (–)External walls
Roof
0.55
0.6
SHGC (–)Windows0.8
Table 4. Internal gains, HVAC setpoint temperatures, and occupancy schedule.
Internal Gains Parameters Daily Occupancy Schedules
Cooling setpoint
temperature
25 °CPercentage of occupancy
or usage (%)
Buildings 15 03337 i003
Time of day (-)
Heating setpoint
temperature
20 °C
Gross floor area54 m2
Number of users5
Light power density5 W/m2
Comfort criteriaAdaptive comfort model, 80% acceptability
Table 5. Summary of building operation scenarios, performance indicators, and climate data employed in simulations.
Building Operational ModeMain OutputsOutput UnitsAnalysis FrequencyWeather Files (AWYs)
Ideal HVACHeating and cooling energy demand kWh/m2Annual (whole building);
monthly (individual rooms)
AWYs based on:
INPE (baseline)
NASA POWER
CAMS
ERA5
Natural VentilationThermal comfort (overheating and cold discomfort)% of occupied hoursAnnual (mean per occupied zones for occupied hours) and monthly (per room for occupied hours)
Table 6. Qualitative summary of GHI and DNI dataset performance (2015 and 2024).
DatasetYearGHIDNI
CorrelationBiasCorrelationBias
NASA2015Very HighLowHighHigh
2024
CAMS2015Very HighLowHighHigh
2024
ERA52015HighModerateMediumHigh
2024MediumHighVery LowLow
Table 7. Performance results for a single detached dwelling using AWY for 2015 and 2024.
ScenarioCooling
(kWh/m2)
Heating
(kWh/m2)
Overheating
(%)
Cold Discomfort
(%)
201546.81.85189.5
202458.62.26239.7
Disclaimer/Publisher’s Note: The statements, opinions and data contained in all publications are solely those of the individual author(s) and contributor(s) and not of MDPI and/or the editor(s). MDPI and/or the editor(s) disclaim responsibility for any injury to people or property resulting from any ideas, methods, instructions or products referred to in the content.