Article

Development of Seismic Fragility Curve for Railway Tunnel Crossing Fracture Zone

1
Urban Life Network, Yongun-ro 1-3, 2F, Dae-dong, Dong-gu, Daejeon 34648, Republic of Korea
2
Department of Fire Safety Engineering and Disaster Management, University of Seoul, 163, Seoulsiripdae-ro, Dongdaemun-gu, Seoul 02504, Republic of Korea
3
Department of Civil & Environmental Engineering, Gachon University, 1342, Seongnam-daero, Sujeong-gu, Seongnam-si 13120, Gyeonggi-do, Republic of Korea
4
Department of Geotechnical Engineering Research, Korea Institute of Civil Engineering and Building Technology (KICT), 283, Goyang-dearo, Ilsan-seogu, Goyang-si 10223, Gyeonggi-do, Republic of Korea
*
Authors to whom correspondence should be addressed.
Buildings 2025, 15(18), 3304; https://doi.org/10.3390/buildings15183304
Submission received: 16 July 2025 / Revised: 20 August 2025 / Accepted: 9 September 2025 / Published: 12 September 2025
(This article belongs to the Special Issue Seismic Response Analysis of Underground Structure)

Abstract

This study investigates the seismic fragility of railway tunnels intersecting fractured geological zones using a nonlinear numerical approach. A series of dynamic analyses was performed on tunnel models subjected to multiple ground motions with varying frequency contents. The structural response was evaluated in terms of maximum bending moment, and the resulting damage indices were used to classify damage states. Based on these classifications, seismic fragility functions were developed for tunnels passing through fractured zones using a lognormal cumulative distribution with peak ground acceleration (PGA) as the intensity measure. The fragility curves indicated that the probabilities of exceeding minor, moderate, and extensive damage states surpassed 50% at PGAs of approximately 0.289 g, 0.578 g, and 0.91 g, respectively. These findings highlight the elevated seismic risk in tunnels intersecting fractured ground and emphasize the necessity of incorporating geological conditions into seismic design frameworks.

1. Introduction

With the rapid urbanization and increasing complexity of cities, the availability of above-ground space has become limited, emphasizing the importance of utilizing underground space. In response, the role of tunnel structures as a means of transportation infrastructure has expanded significantly. Particularly, the demand for long-distance tunnel construction connecting intercity routes is rising. Concurrently, the frequency and intensity of earthquakes have been increasing globally, making seismic resilience a critical concern for these extended underground structures.
Long tunnels are more likely to intersect fracture zones. These zones are characterized by a sharp reduction in stiffness and an increase in damping due to fractured rock mass properties. This results in large nonlinear displacements and significant dynamic amplification, especially in the low-frequency range, which substantially increases the stress and deformation acting on tunnel structures. As a result, seismic vulnerability is considerably higher in tunnel sections intersecting fracture zones [1]. Therefore, developing a reliable analysis method to quantitatively evaluate the seismic fragility of tunnel crossing fracture zones is essential.
To address this demand, numerous studies have been conducted on the seismic behavior of tunnel structures. Pakbaz and Yareevand [2] employed a finite difference analysis program (CA2) to analyze the interaction between soil and tunnel lining, verifying the consistency between closed-form solutions and numerical simulations. Asheghabadi and Matinmanesh [3] used two-dimensional finite element analysis with ABAQUS to study soil–tunnel interaction under seismic loading. They modeled both dense and loose sand, finding that dense sand exhibited higher amplification under high-frequency seismic waves, while loose sand responded more significantly to low-frequency waves. Jiang et al. [4] compared shaking table test results and 2D dynamic numerical simulations for underground tunnels, confirming that displacement, acceleration, amplification factor, and strain values from the numerical models matched experimental results.
Bao et al. [5] conducted FE-FD coupled analyses to investigate the seismic behavior of large metro tunnels embedded in liquefiable ground, focusing on buoyancy effects, excess pore water pressure, vertical ground motion, and soil improvement. Tsinidis et al. [6] studied circular tunnels in dry sand using dynamic analysis, showing that increasing the stiffness of tunnel linings reduced residual deformation and that interface conditions between soil and tunnel significantly influenced dynamic axial forces. Do et al. [7] analyzed the effects of segment joints on tunnel lining behavior during seismic events, concluding that segmental linings performed better than continuous linings, and that an increased number of joints mitigated the impact of joint orientation.
Several studies have also addressed the dynamic behavior of tunnel crossing fractured zones. Nong et al. [8] performed dynamic numerical simulations on tunnel construction through fault fracture zones, confirming that reduced cohesion in the fault zone led to increased settlement and lateral displacement. Cho and Park [9] used 2D and 3D dynamic analyses to show that compressive stress in tunnel shotcrete linings significantly increased with steeper fracture zone angles, while tunnel deformation indicators decreased as the distance from the fracture zone increased. Ji et al. [10] found that wider fracture zones slightly increased TBM displacements and that shear stress in the surrounding rock decreased and then increased with increasing dip angle.
Seismic fragility curves are widely used to quantitatively assess structural vulnerability based on dynamic analysis results. These curves represent the probability of exceeding various damage states under different levels of seismic intensity. Yang et al. [11] proposed fragility functions for 33 subway station structures considering different soil types and burial depths, finding that seismic vulnerability increased with deeper burial and weaker ground. Kwon et al. [12] conducted dynamic numerical analyses using PLAXIS2D on Korean underground station structures with varying soil types, rock depths, and seismic intensities, and proposed corresponding fragility curves. Osmi and Ahmad [13] developed fragility curves for tunnels under different ground conditions through 3D dynamic analysis, demonstrating lower damage probabilities for tunnels embedded in stiffer soils. Argyroudis and Pitilakis [14] proposed a numerical methodology for developing fragility curves for subway tunnels in alluvial deposits, considering tunnel geometry, ground properties, and associated uncertainties. Zhong et al. [15] applied a similar approach to subway stations embedded in layered ground and verified their model against empirical fragility functions. Hu et al. [16] analyzed the seismic fragility of tunnels with different burial depths in soft soils, finding that failure probability did not decrease monotonically with increasing depth.
Despite the growing research on seismic fragility curves, studies focused on tunnels intersecting fractured zones remain scarce. There is a need for dynamic numerical modeling that accurately reflects fractured ground conditions and enables the development of fragility functions based on multiple input parameters.
In this study, three-dimensional dynamic numerical models were developed for tunnels embedded in hard rock and for tunnels intersecting fracture zones of different widths. Seismic waves with various frequency contents and peak ground accelerations were applied to the models to analyze the dynamic behavior of the tunnel structures. Based on the results of these numerical simulations, seismic fragility curves were derived specifically for tunnel segments crossing fractured zones.

2. Numerical Modeling

2.1. Numerical Modeling Methodology

A three-dimensional time-domain dynamic response analysis was conducted using the finite difference method. To minimize the influence of reflected waves during the dynamic analysis, free-field boundary conditions were applied along the lateral boundaries of the model. FLAC3D, a widely recognized general purpose finite difference analysis program, was employed for the numerical simulations.
The numerical model incorporated different ground types, including soil, rock, and fractured zones. A Mohr–Coulomb elastoplastic model was adopted to represent the nonlinear behavior of ground materials, while the tunnel lining segments were modeled using shell elements with elastic properties. The Mohr–Coulomb elastoplastic constitutive model was adopted to represent the nonlinear behavior of ground materials, particularly fractured zones. This model has been widely used in dynamic analyses of tunnels due to its ability to simulate shear failure mechanisms with minimal computational cost, while still capturing the key characteristics of pressure-sensitive materials. In particular, it is effective for modeling rock masses and faulted zones where a significant reduction in strength and stiffness occurs under seismic loading.
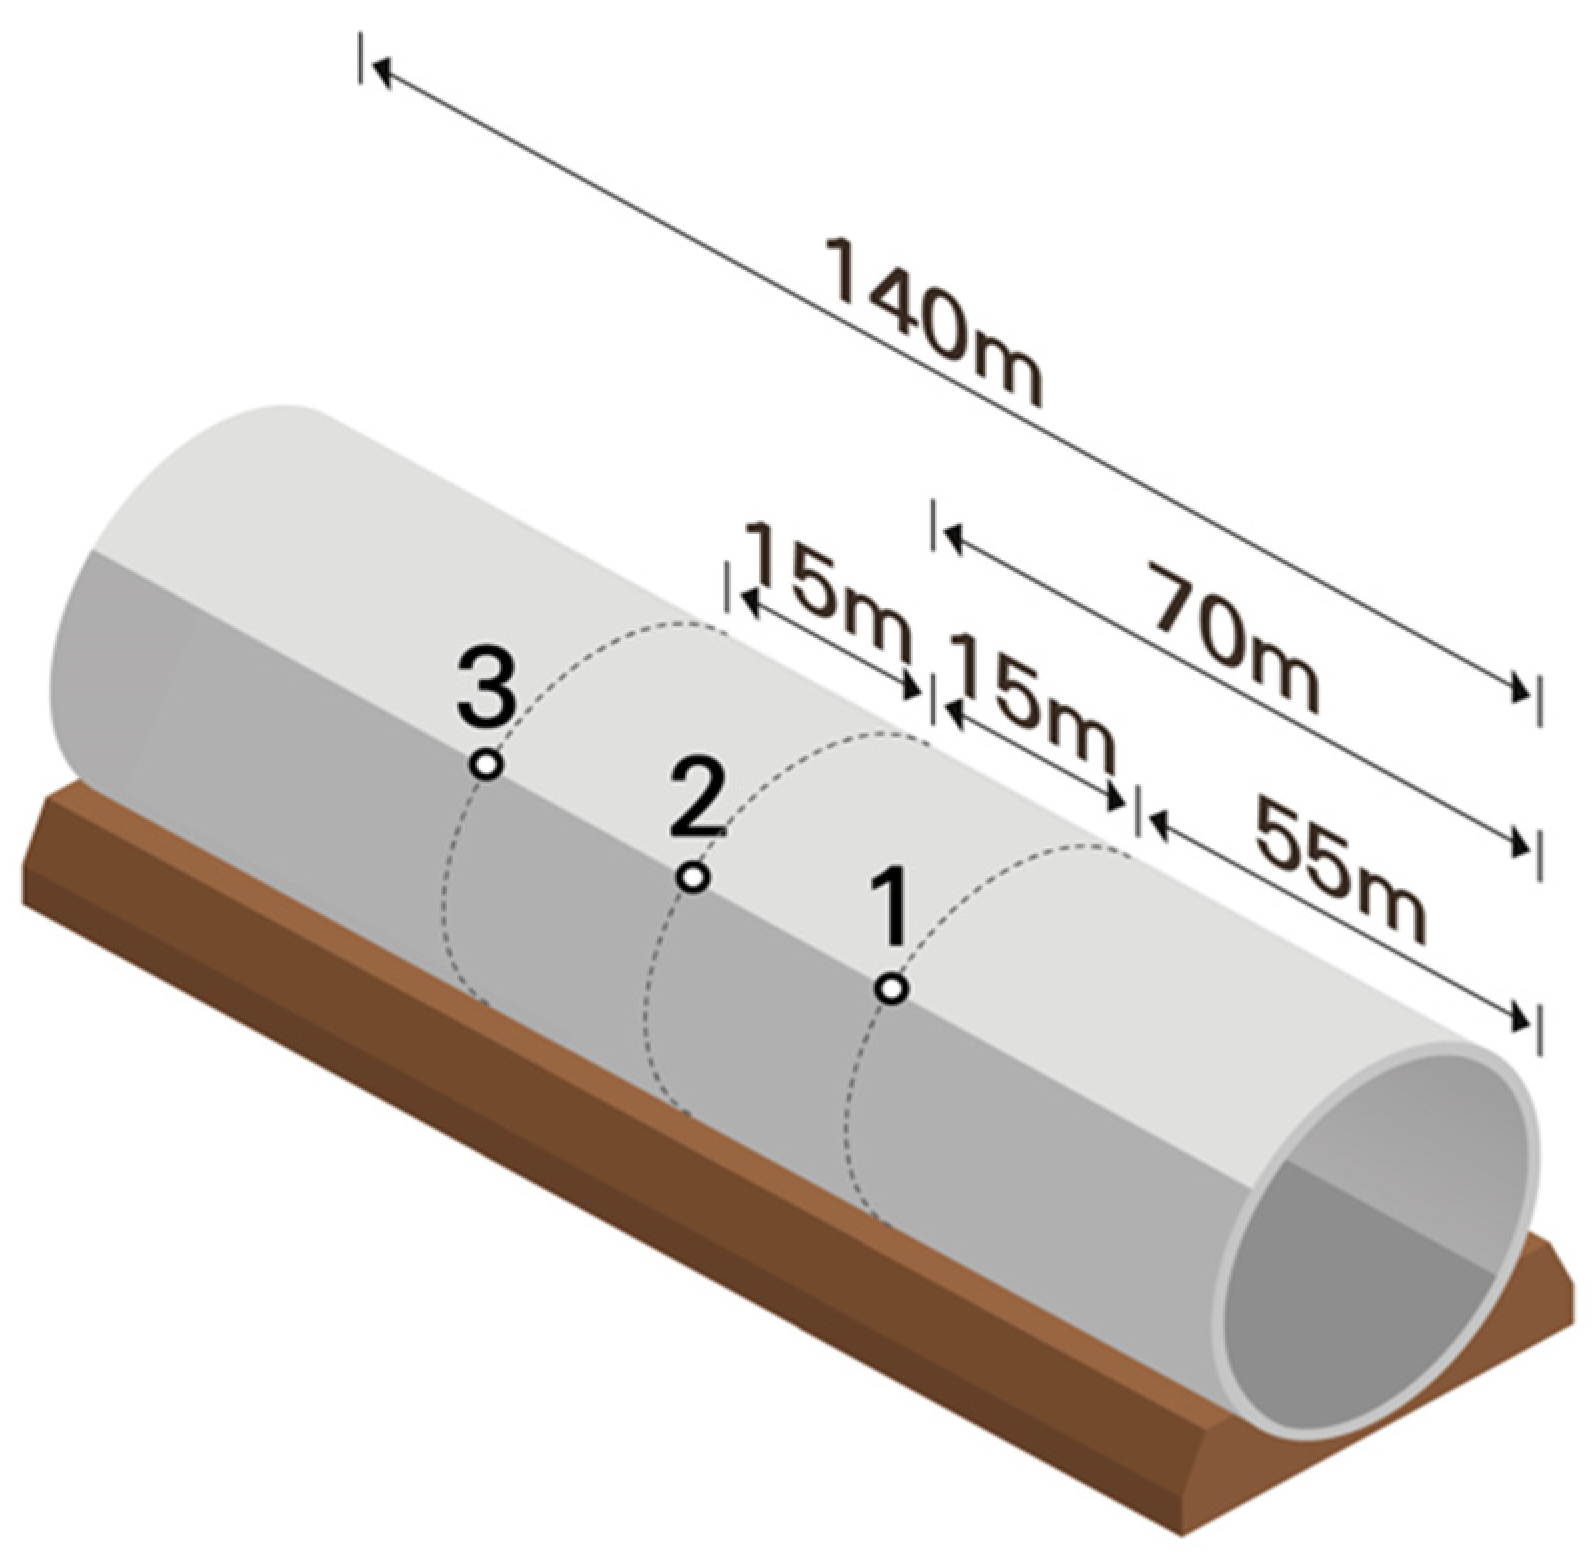
Considering the characteristics of long-distance tunnels intersecting fractured zones, a shield TBM tunnel configuration was adopted in this study. Accordingly, the tunnel was assumed to have a circular cross-section, as illustrated in Figure 1.
To ensure computational stability and accuracy, the mesh size within the model was adjusted based on proximity to the tunnel. Specifically, the tunnel lining had an element size of 0.5 m, the adjacent ground had element sizes as small as 0.64 m, and the far-field ground region used element sizes ranging from 3.5 m to 4.15 m. As shown in Figure 2, three monitoring points were defined to extract dynamic responses, including displacement and structural forces: Point-2 (crown at tunnel center), Point-1 (15 m upward from the center), and Point-3 (15 m downward from the center).
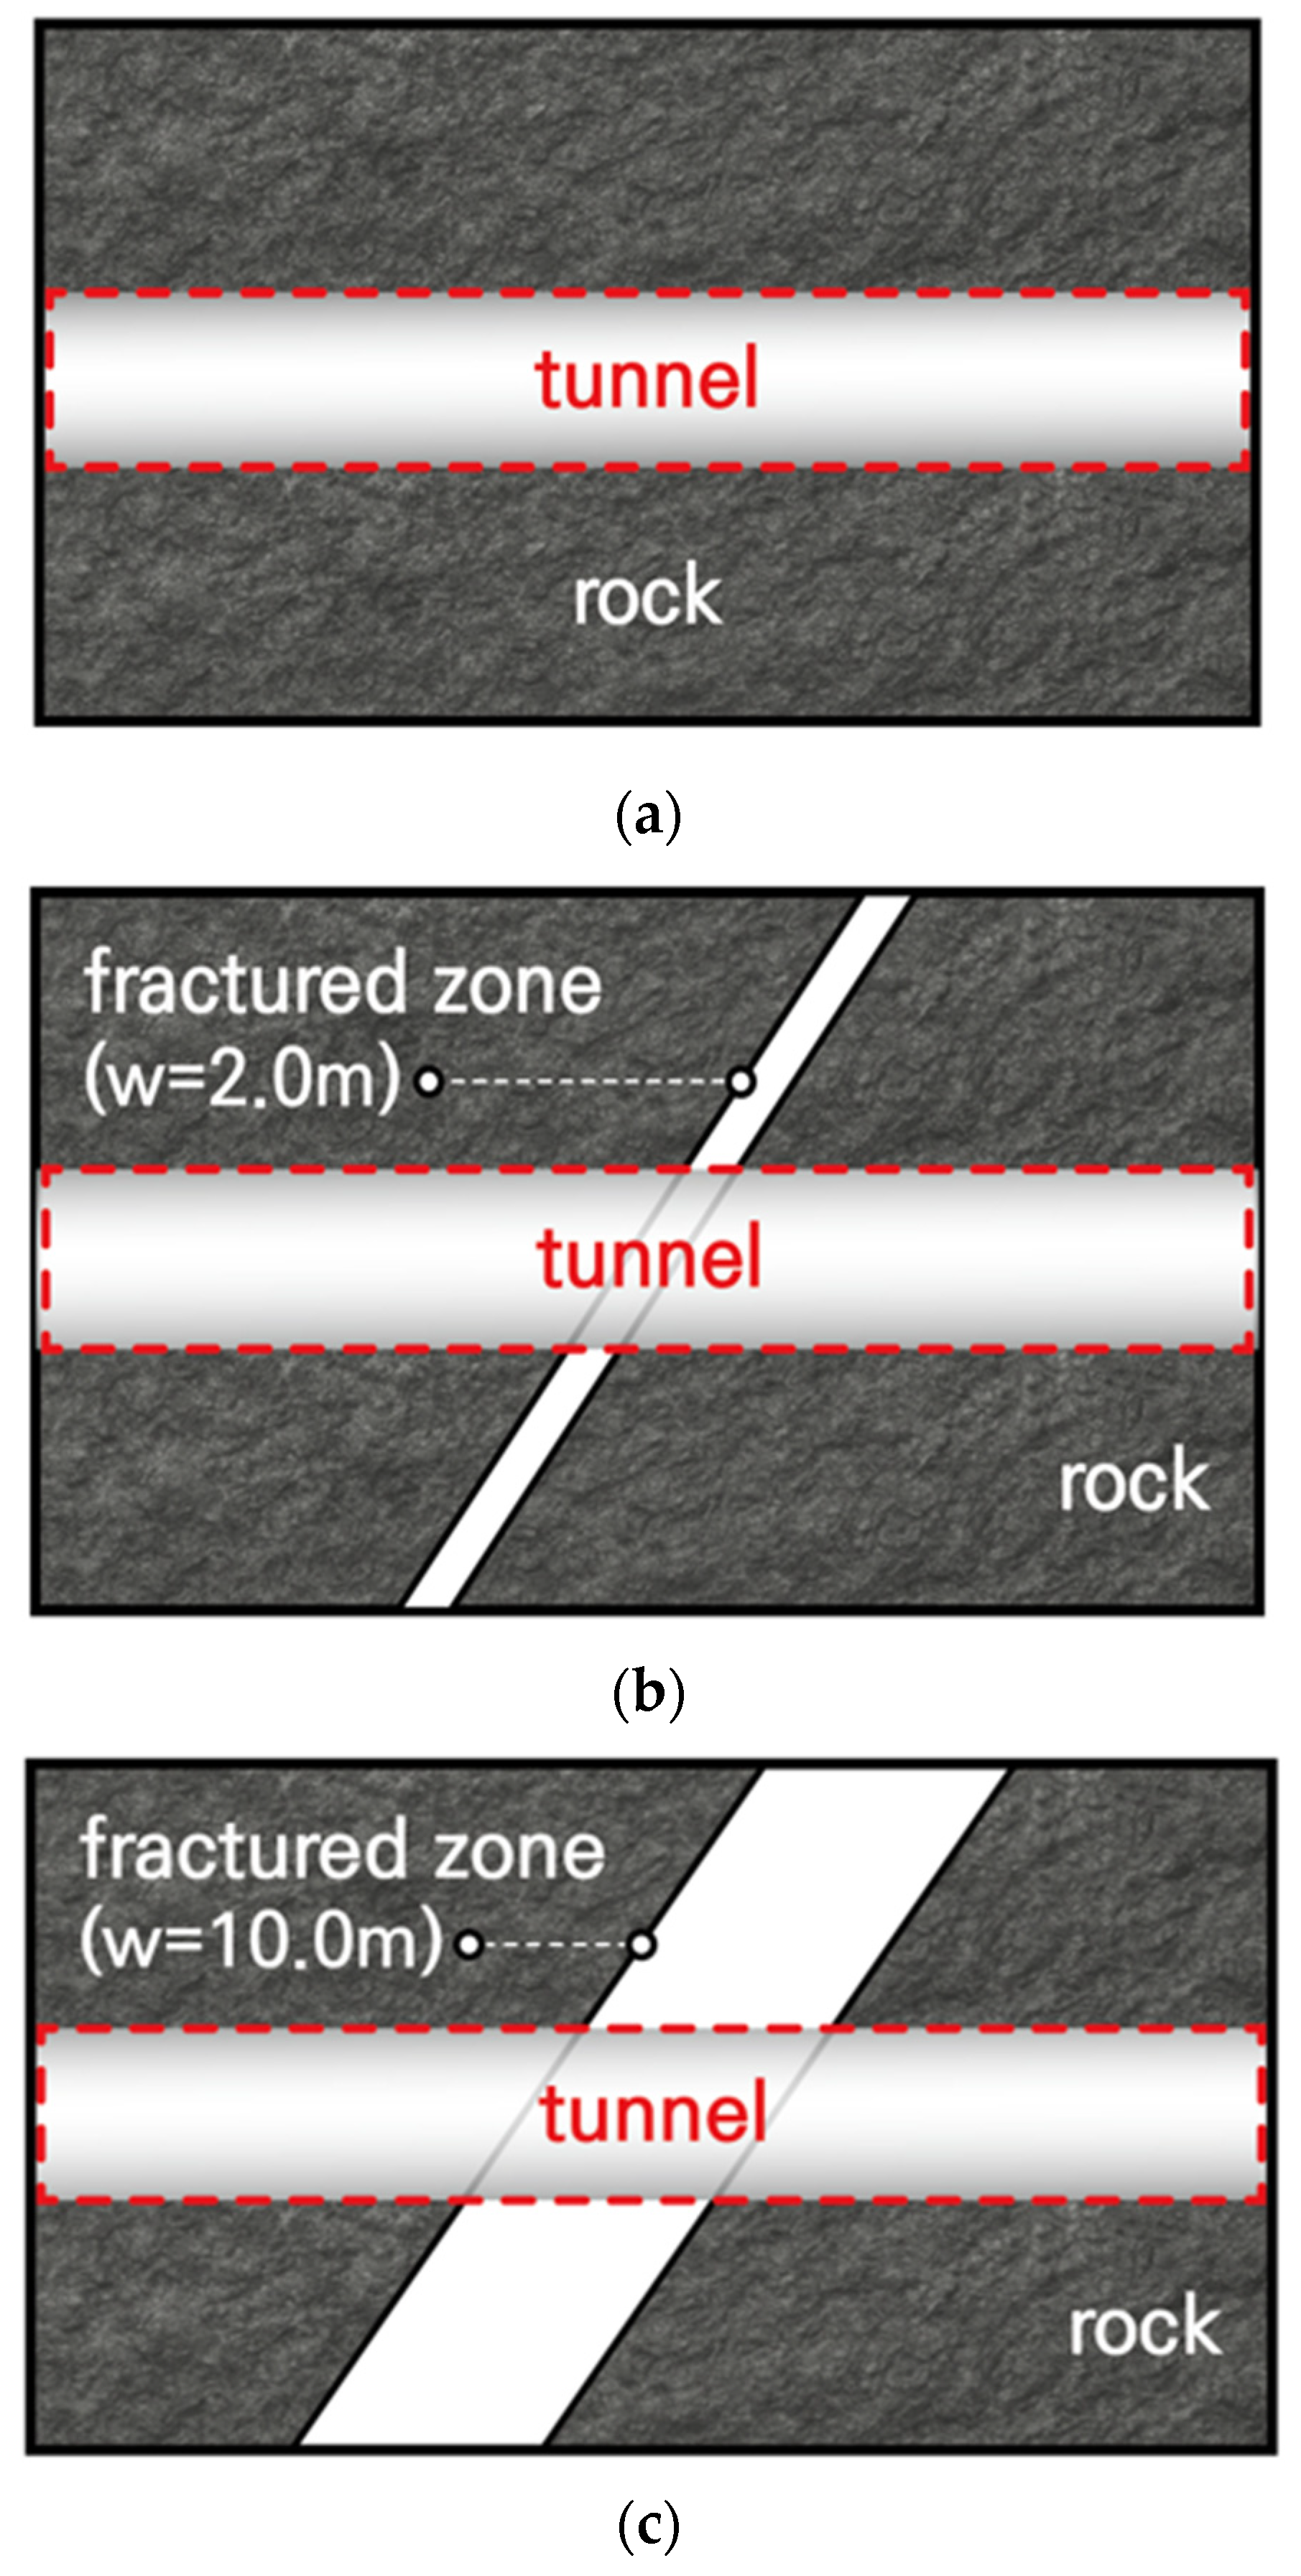
For the surrounding ground condition, the entire tunnel–ground system was modeled using a finite difference method, considering interaction effects during seismic loading. Based on previous studies, three analysis cases were defined depending on the presence and width of the fractured zone: Case 1 (entirely hard rock), Case 2 (tunnel intersecting a narrow 2.0 m wide fractured zone), and Case 3 (tunnel intersecting a wide 10.0 m fractured zone). Schematic diagrams of each case are presented in Figure 3.
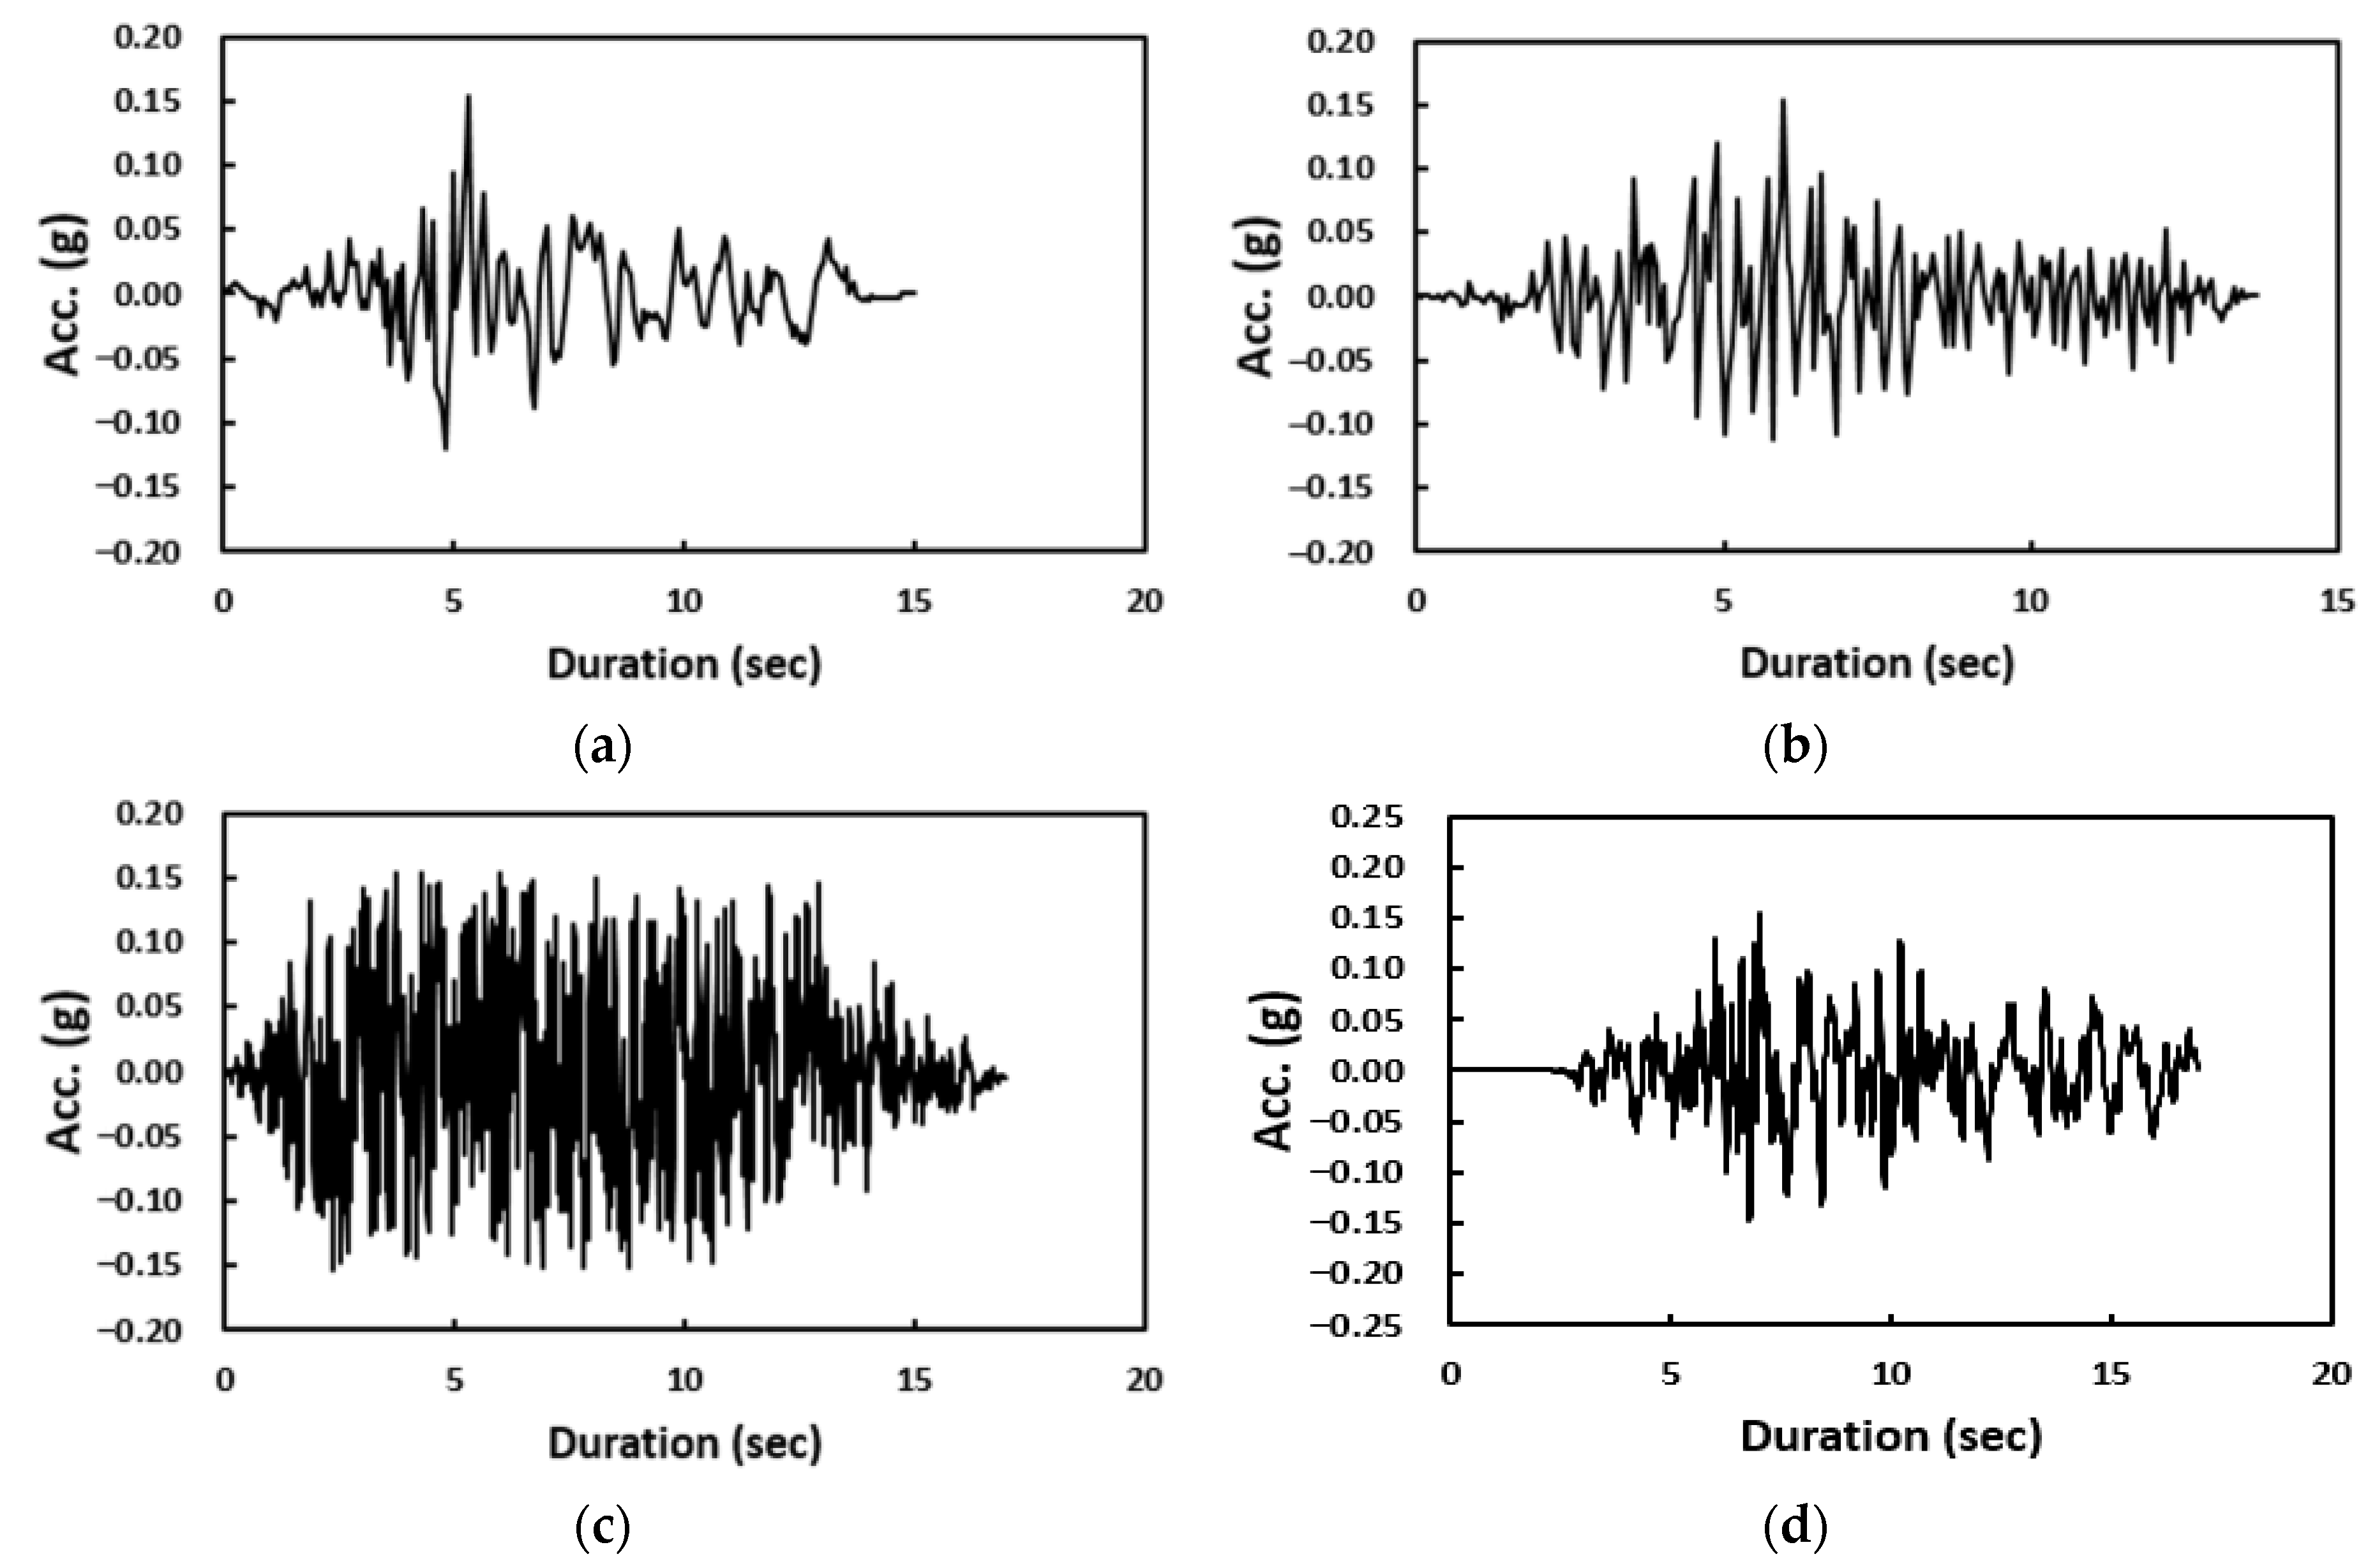
To evaluate the structural response under a range of seismic characteristics, four ground motions were selected: a long-period motion (Hachinohe), a short-period motion (Ofunato), an artificial ground motion with both long- and short-period content, and a real recorded motion (Kobe). These input motions were applied with six different peak ground acceleration (PGA) levels: 0.110 g, 0.154 g, 0.220 g, 0.340 g, 0.500 g, and 0.700 g. These levels included design PGA values stipulated in the Korean seismic design standard (KDS 17 10 00) [17], as well as higher values to simulate extreme events. Specifically, PGA values of 0.110 g, 0.154 g, 0.220 g, and 0.340 g corresponded to the seismic hazard levels for return periods of 500, 1000, 2400, and 4800 years defined in KDS 17 10 00 [17]. The higher values of 0.500 g and 0.700 g were included to represent extreme earthquake scenarios beyond the design basis, allowing the evaluation of tunnel performance under rare but severe seismic events. Figure 4 illustrates the acceleration time histories of the input motions, and Table 1 summarizes the overall analysis conditions. The material properties of the rock, fractured zone, and tunnel lining used in the numerical simulations are provided in Table 2. The elastic modulus of the fractured zone was set to 0.4 GPa, which corresponds to the lower bound of the range (0.4–3.2 GPa) reported from field measurements of fault damage zones (Nieto-Samaniego et al., 2020 [18]). This conservative choice was intended to represent the most vulnerable condition of fractured zones in the seismic fragility assessment. In addition to the static properties listed in Table 2, dynamic input parameters were explicitly defined for the nonlinear time-domain analyses. The shear wave velocity (Vs) for each material was calculated from its elastic modulus and unit weight, yielding values representative of hard rock, fractured rock, and concrete lining. A damping ratio of 5% was applied to the ground materials and 2% to the tunnel lining, following common practice for underground structures. Rayleigh damping coefficients (α and β) were computed to achieve the target damping ratio over the predominant frequency range of the model, based on the first and dominant vibration modes. Wave propagation and energy dissipation effects were modeled using free-field boundary conditions along the lateral boundaries in combination with Rayleigh damping, ensuring the realistic simulation of seismic wave transmission through the tunnel–ground system.

2.2. Numerical Analysis Result

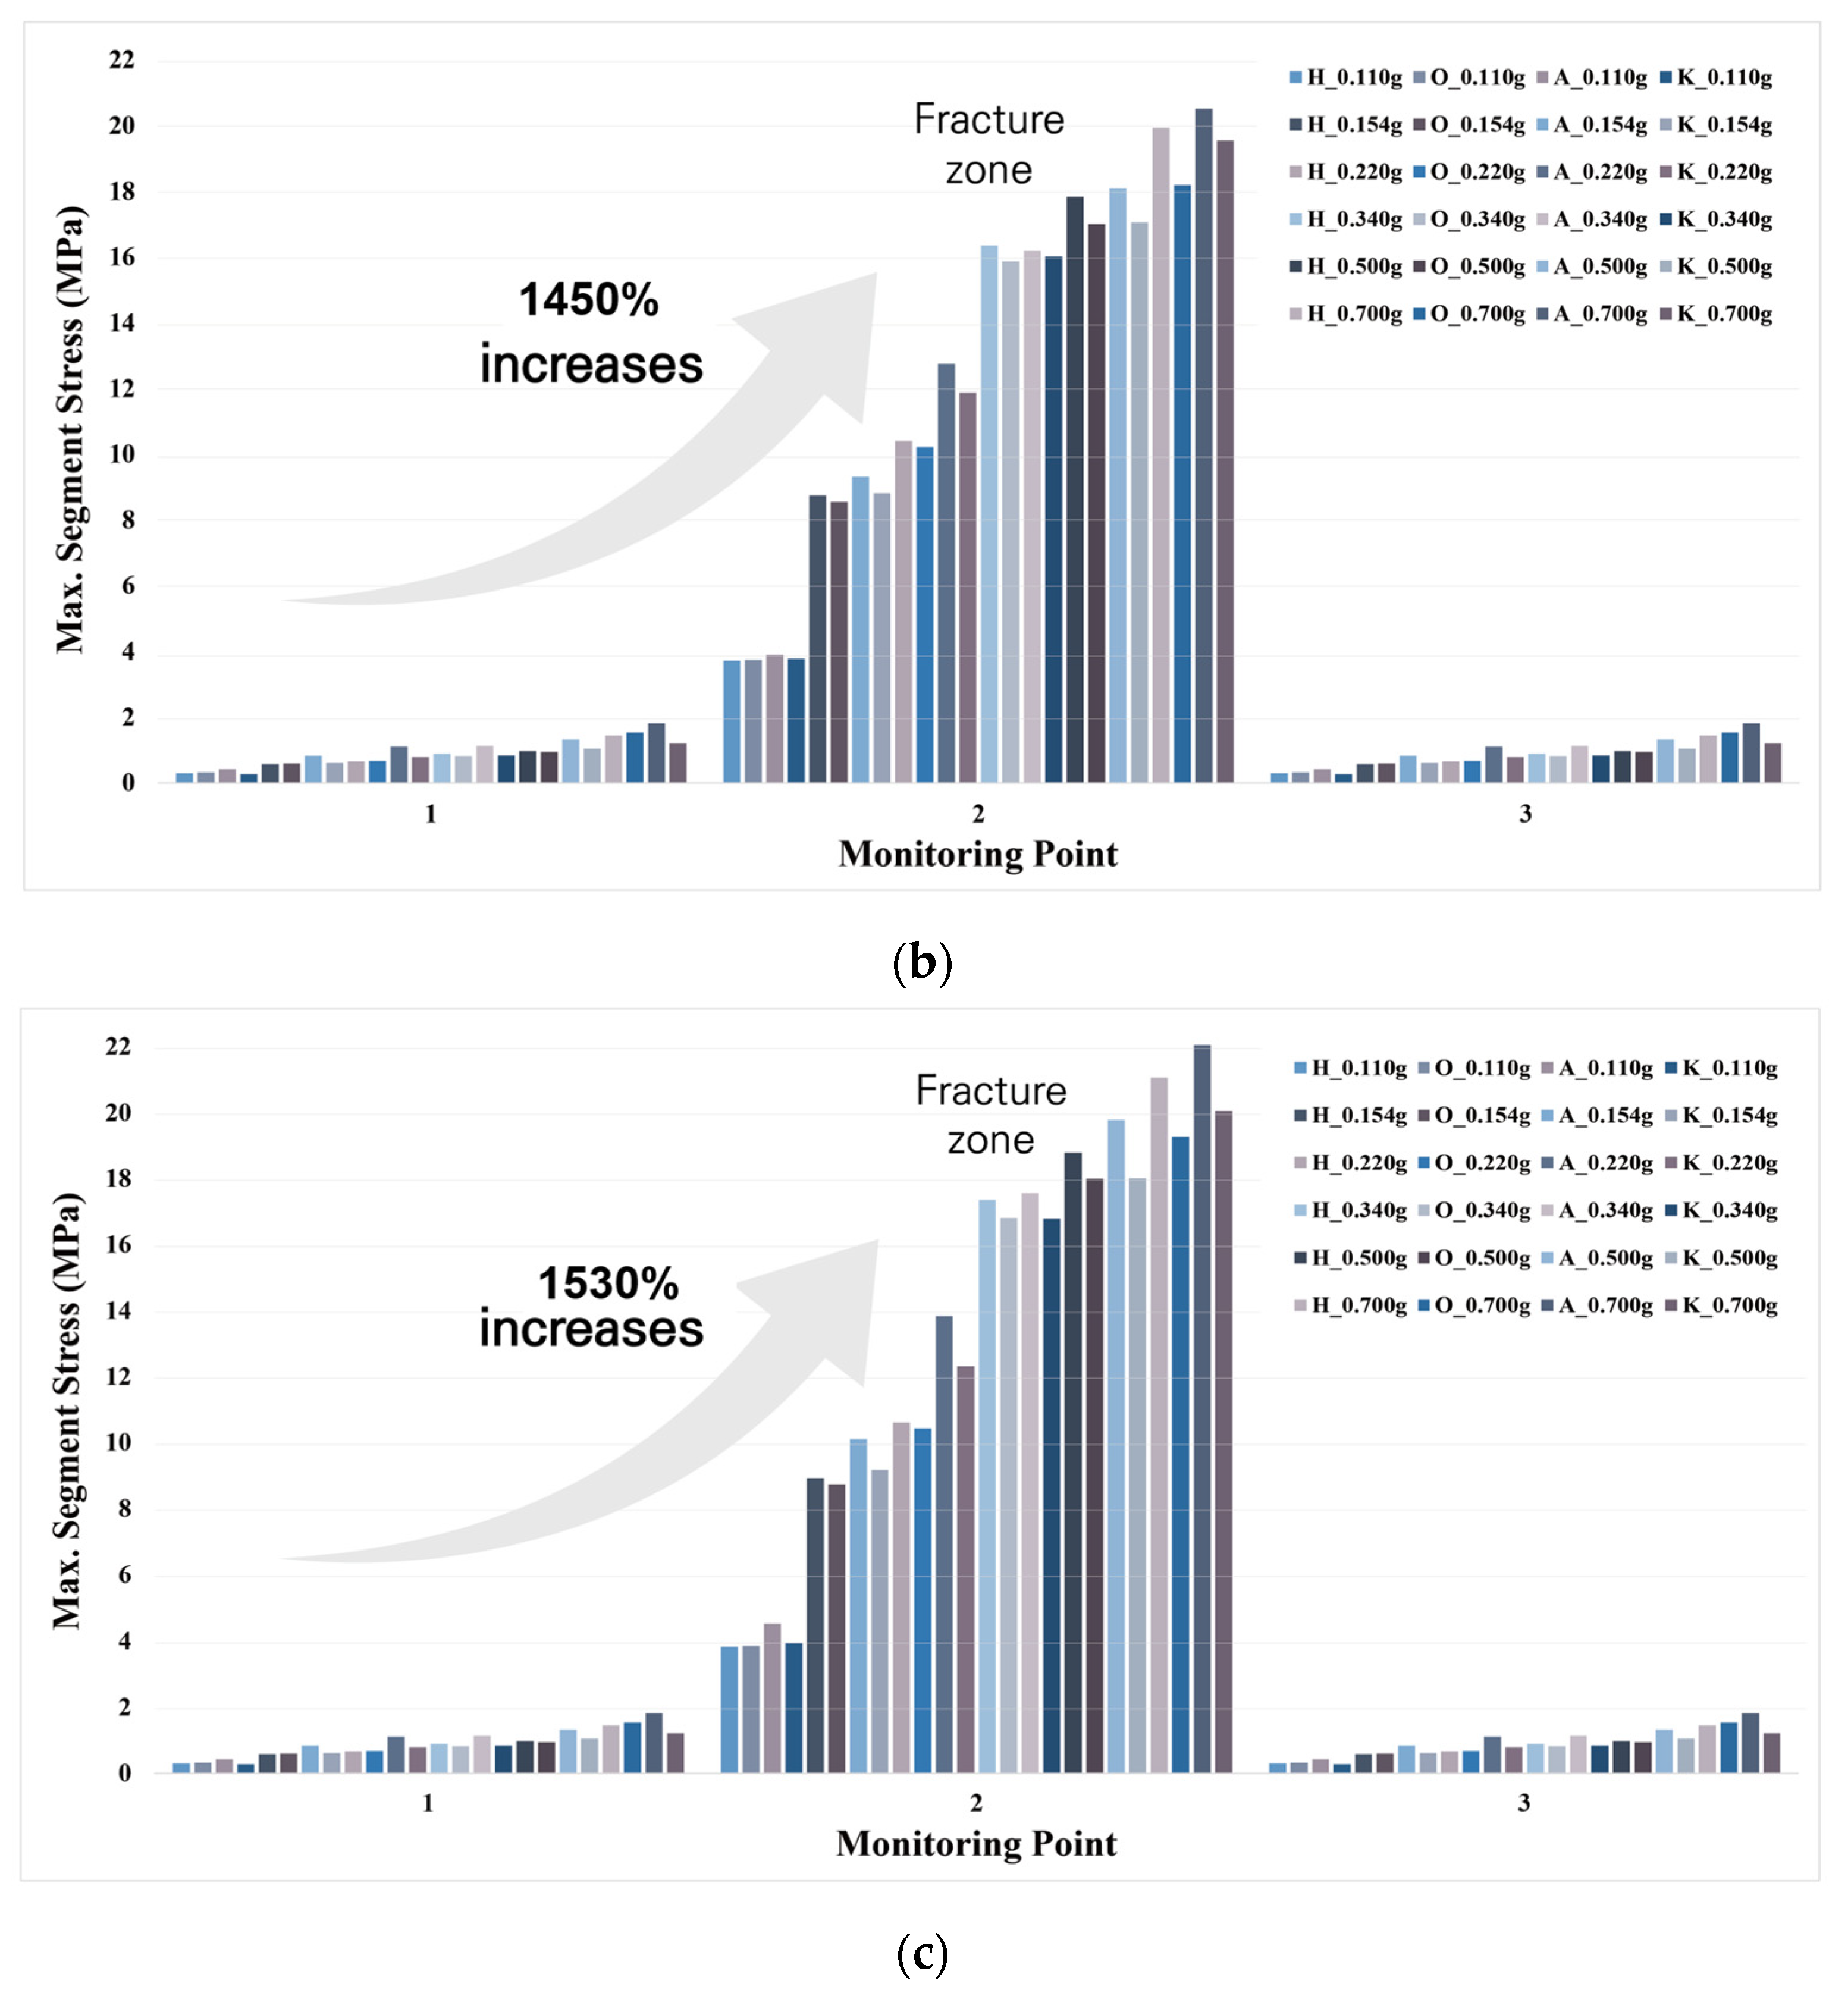
The three-dimensional dynamic numerical analysis results focused on evaluating the seismic response of tunnel lining segments under various ground and seismic conditions. Lining stress values were extracted from the tunnel crown at three monitoring points, with particular attention to Point-2, which corresponded to the location intersecting the fractured zone in Cases 2 and 3.
The lining stresses were calculated based on the maximum compressive stress observed at the end of each tunnel segment. For each analysis case, maximum lining stresses were obtained under the full range of input ground motions and peak ground acceleration levels.
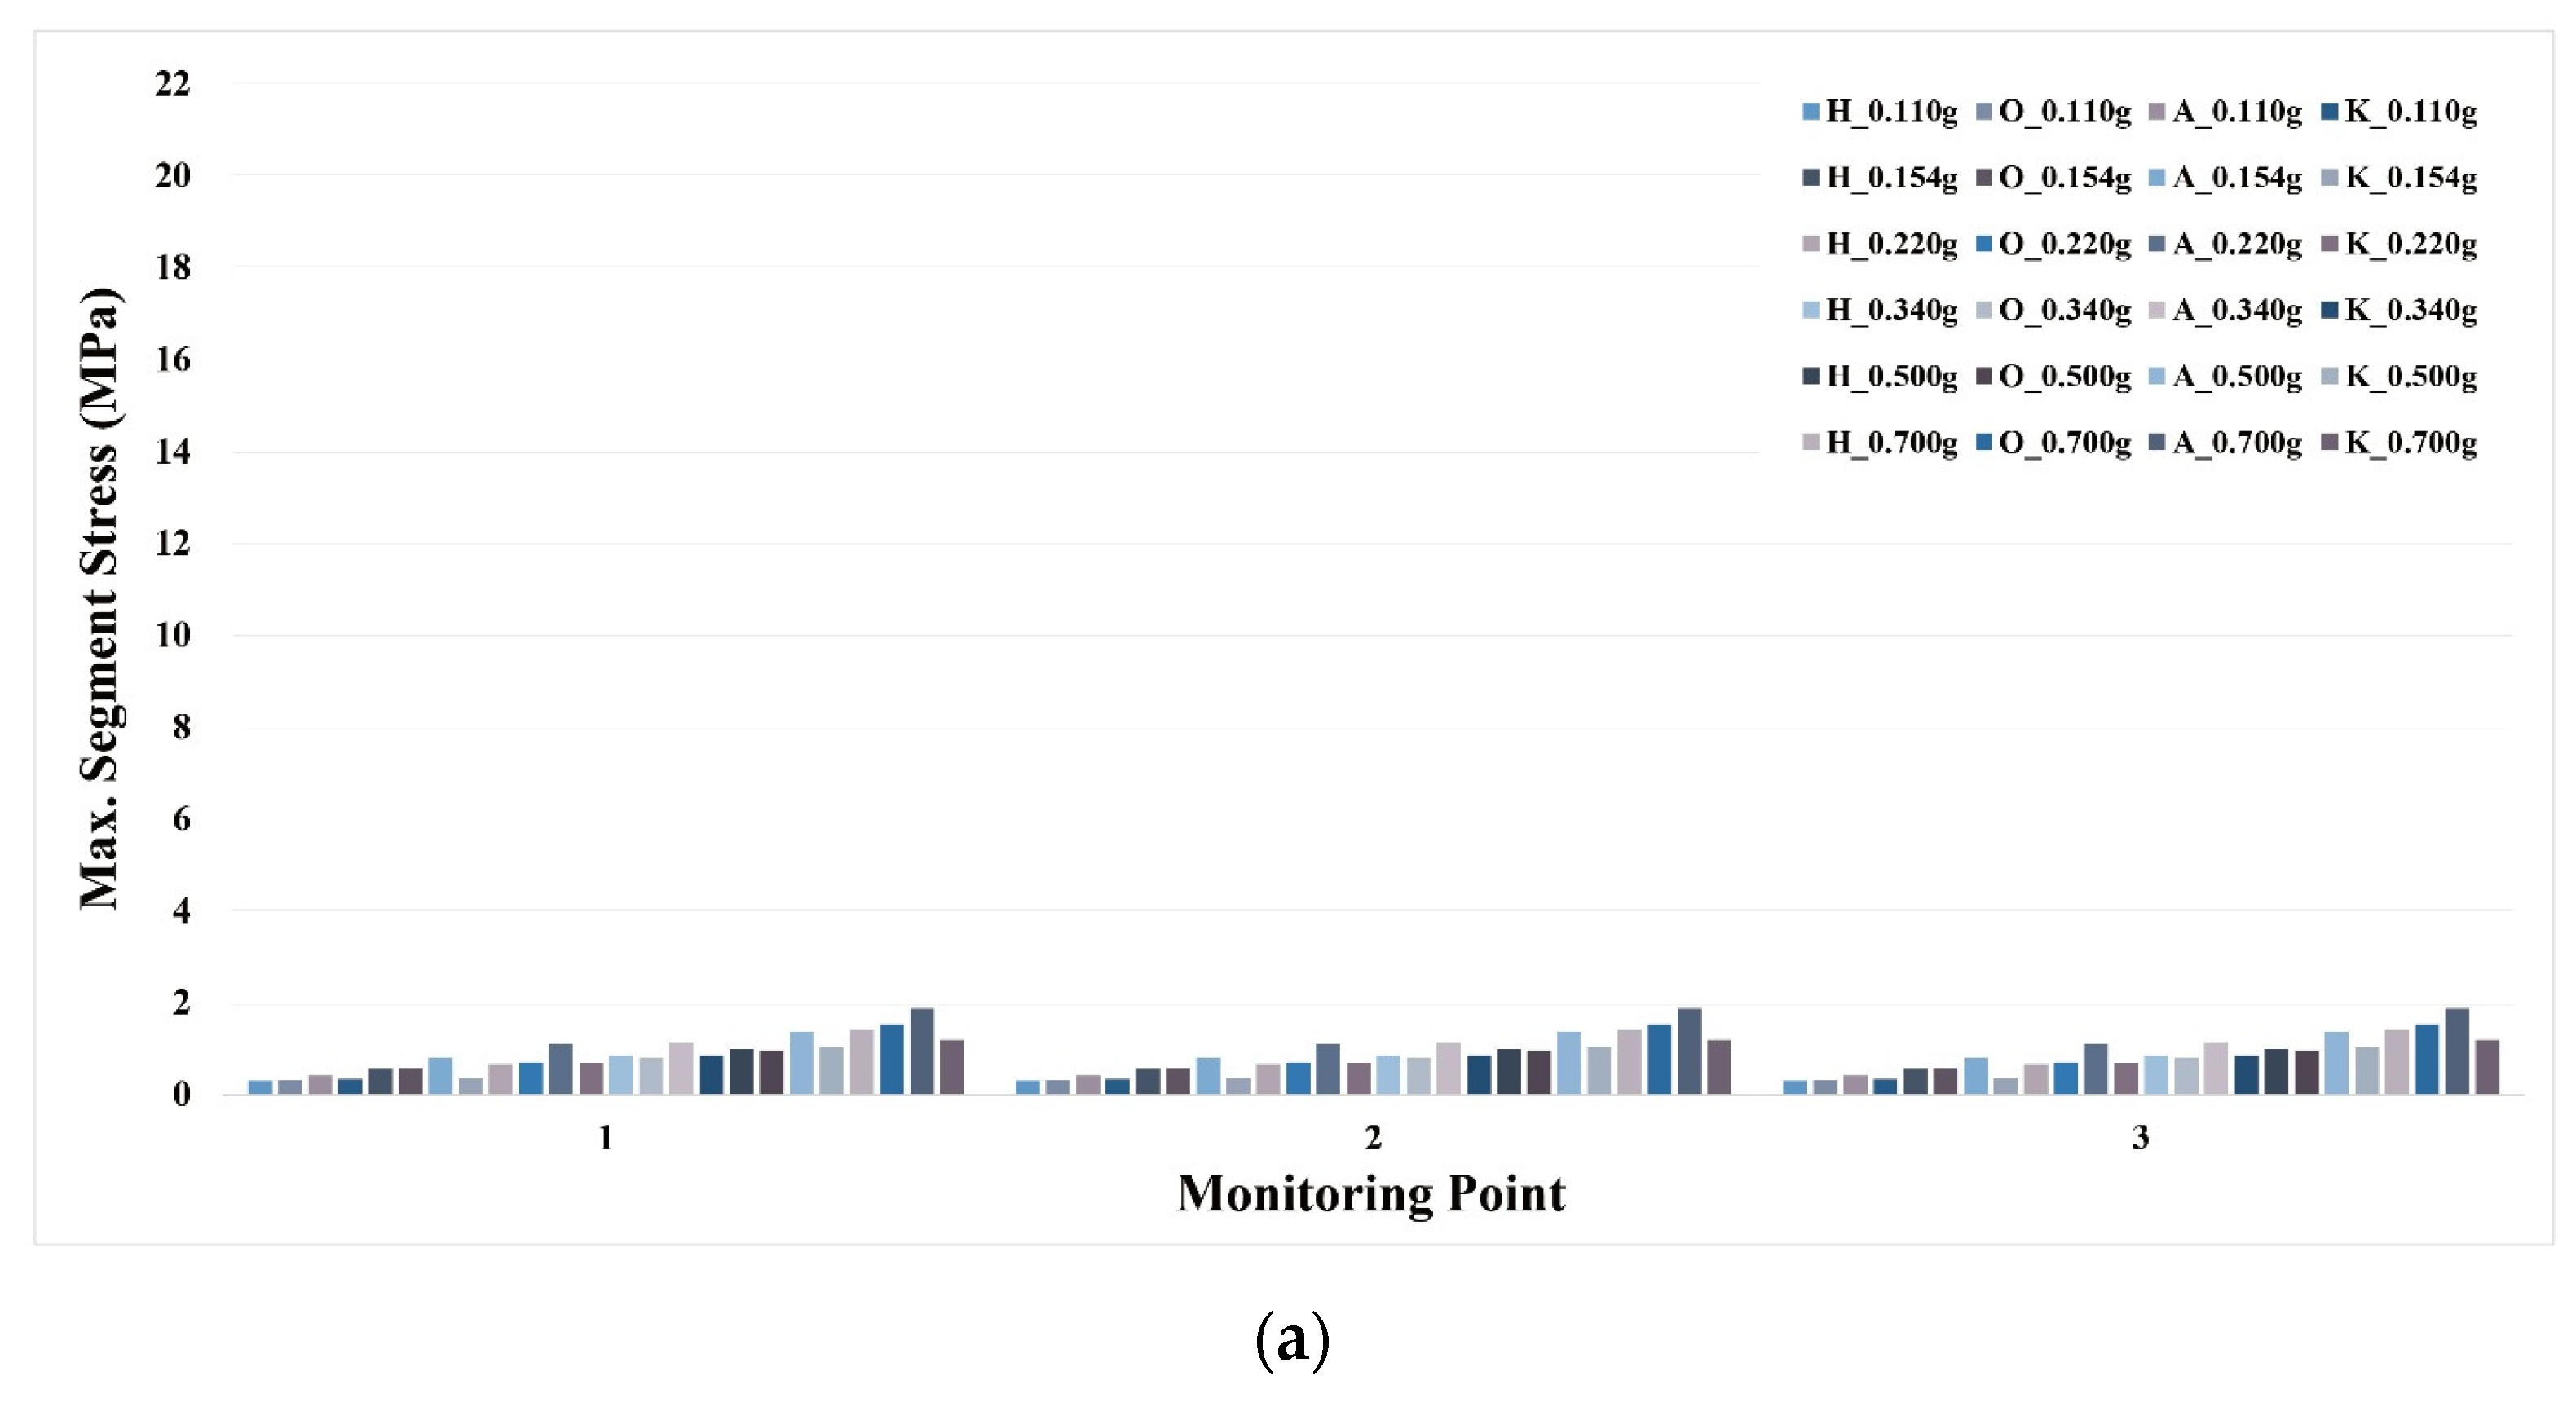
In Case 1 (entire hard rock), the results revealed that the lining stresses at all three monitoring points were relatively uniform and gradually increased with higher PGA levels, as shown in Figure 5a. This behavior indicates a consistent response in the absence of geologic irregularities.
In contrast, Cases 2 and 3, which involved fractured zones, exhibited pronounced stress concentration at Point-2. As shown in Figure 5b,c, the lining stress at Point-2 significantly exceeded those at the other points, especially under higher PGA conditions. For instance, in Case 2, the maximum compressive stress at Point-2 under 0.7 g ground motion reached approximately 2.05 times the allowable moment value, while in Case 3, it exceeded 2.2 times the allowable limit. This localized stress amplification confirms that the presence of fractured zones dramatically increases the seismic demand on tunnel structures, particularly when the tunnel intersects the fractured zone directly. As such, the structural integrity of tunnel segments in these zones is at greater risk under seismic excitation. The selection of monitoring points was based on engineering judgment anticipating localized stress concentrations near the fractured zone. Point-2 was defined at the tunnel crown where the fractured zone intersected the lining, and Points 1 and 3 were placed 15 m vertically above and below to capture the distribution of seismic response in the vertical direction. These points were intended to reflect the most critical region influenced by the fractured ground without requiring full-length stress mapping.
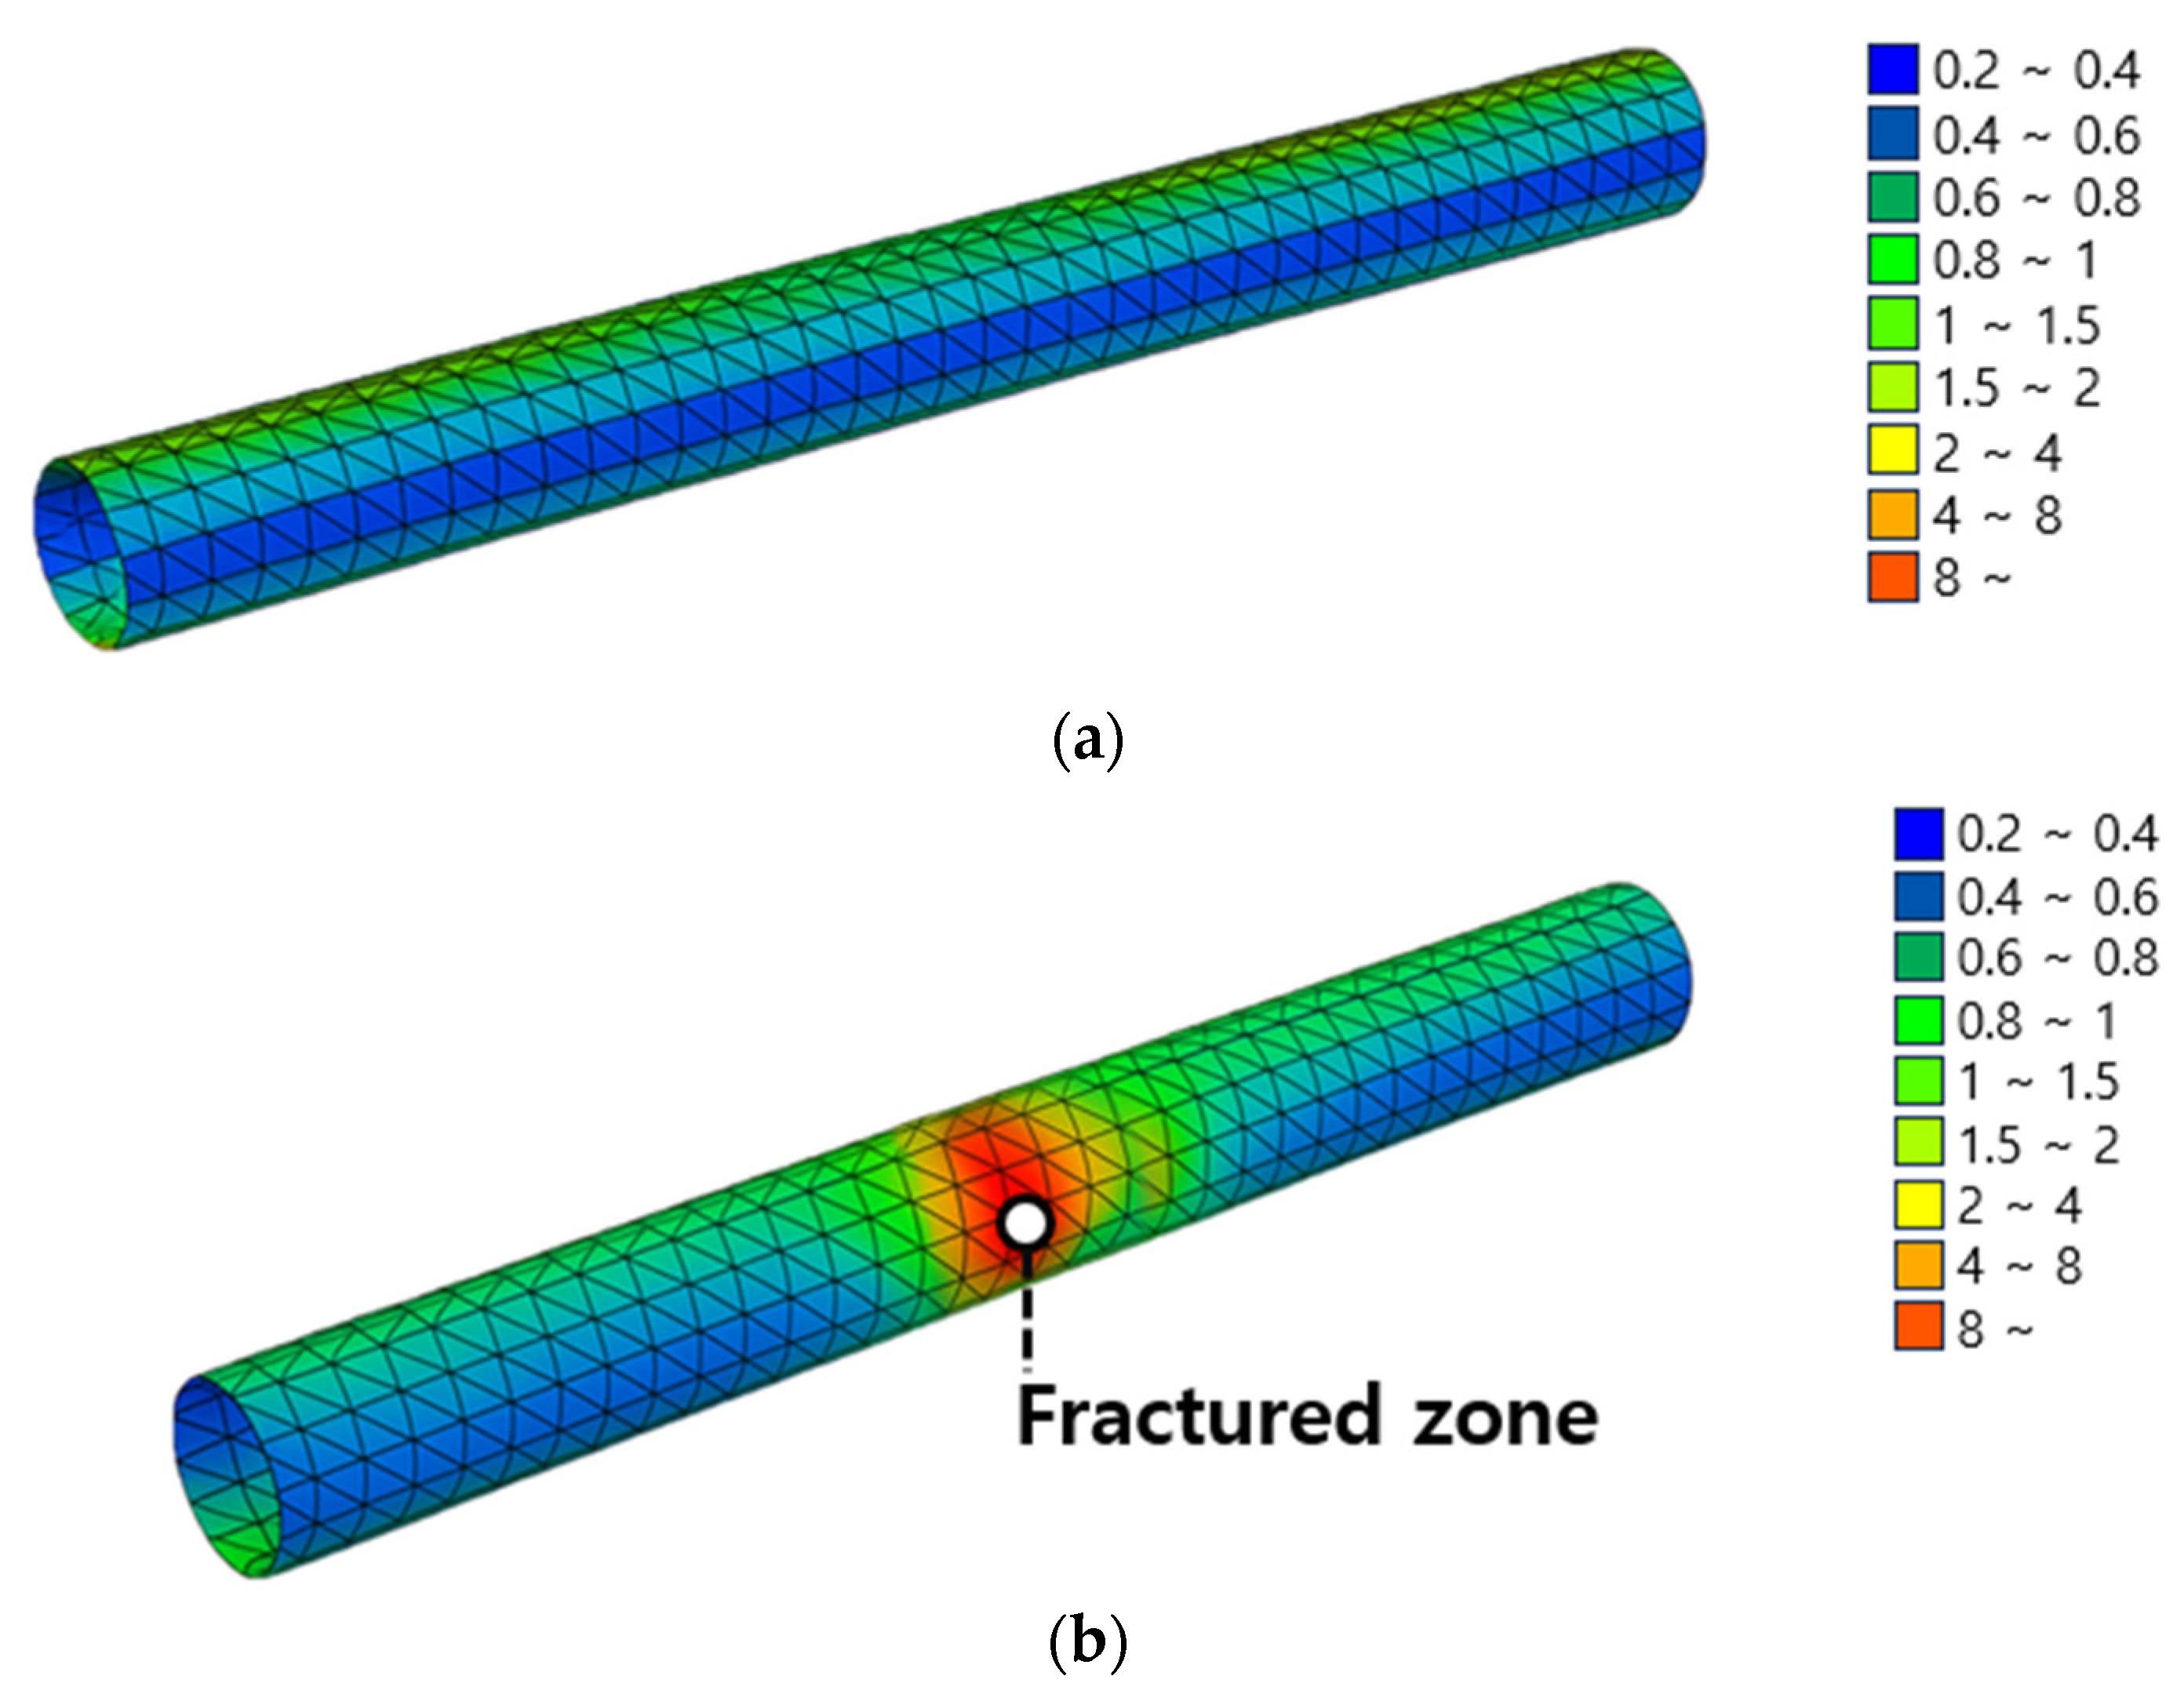
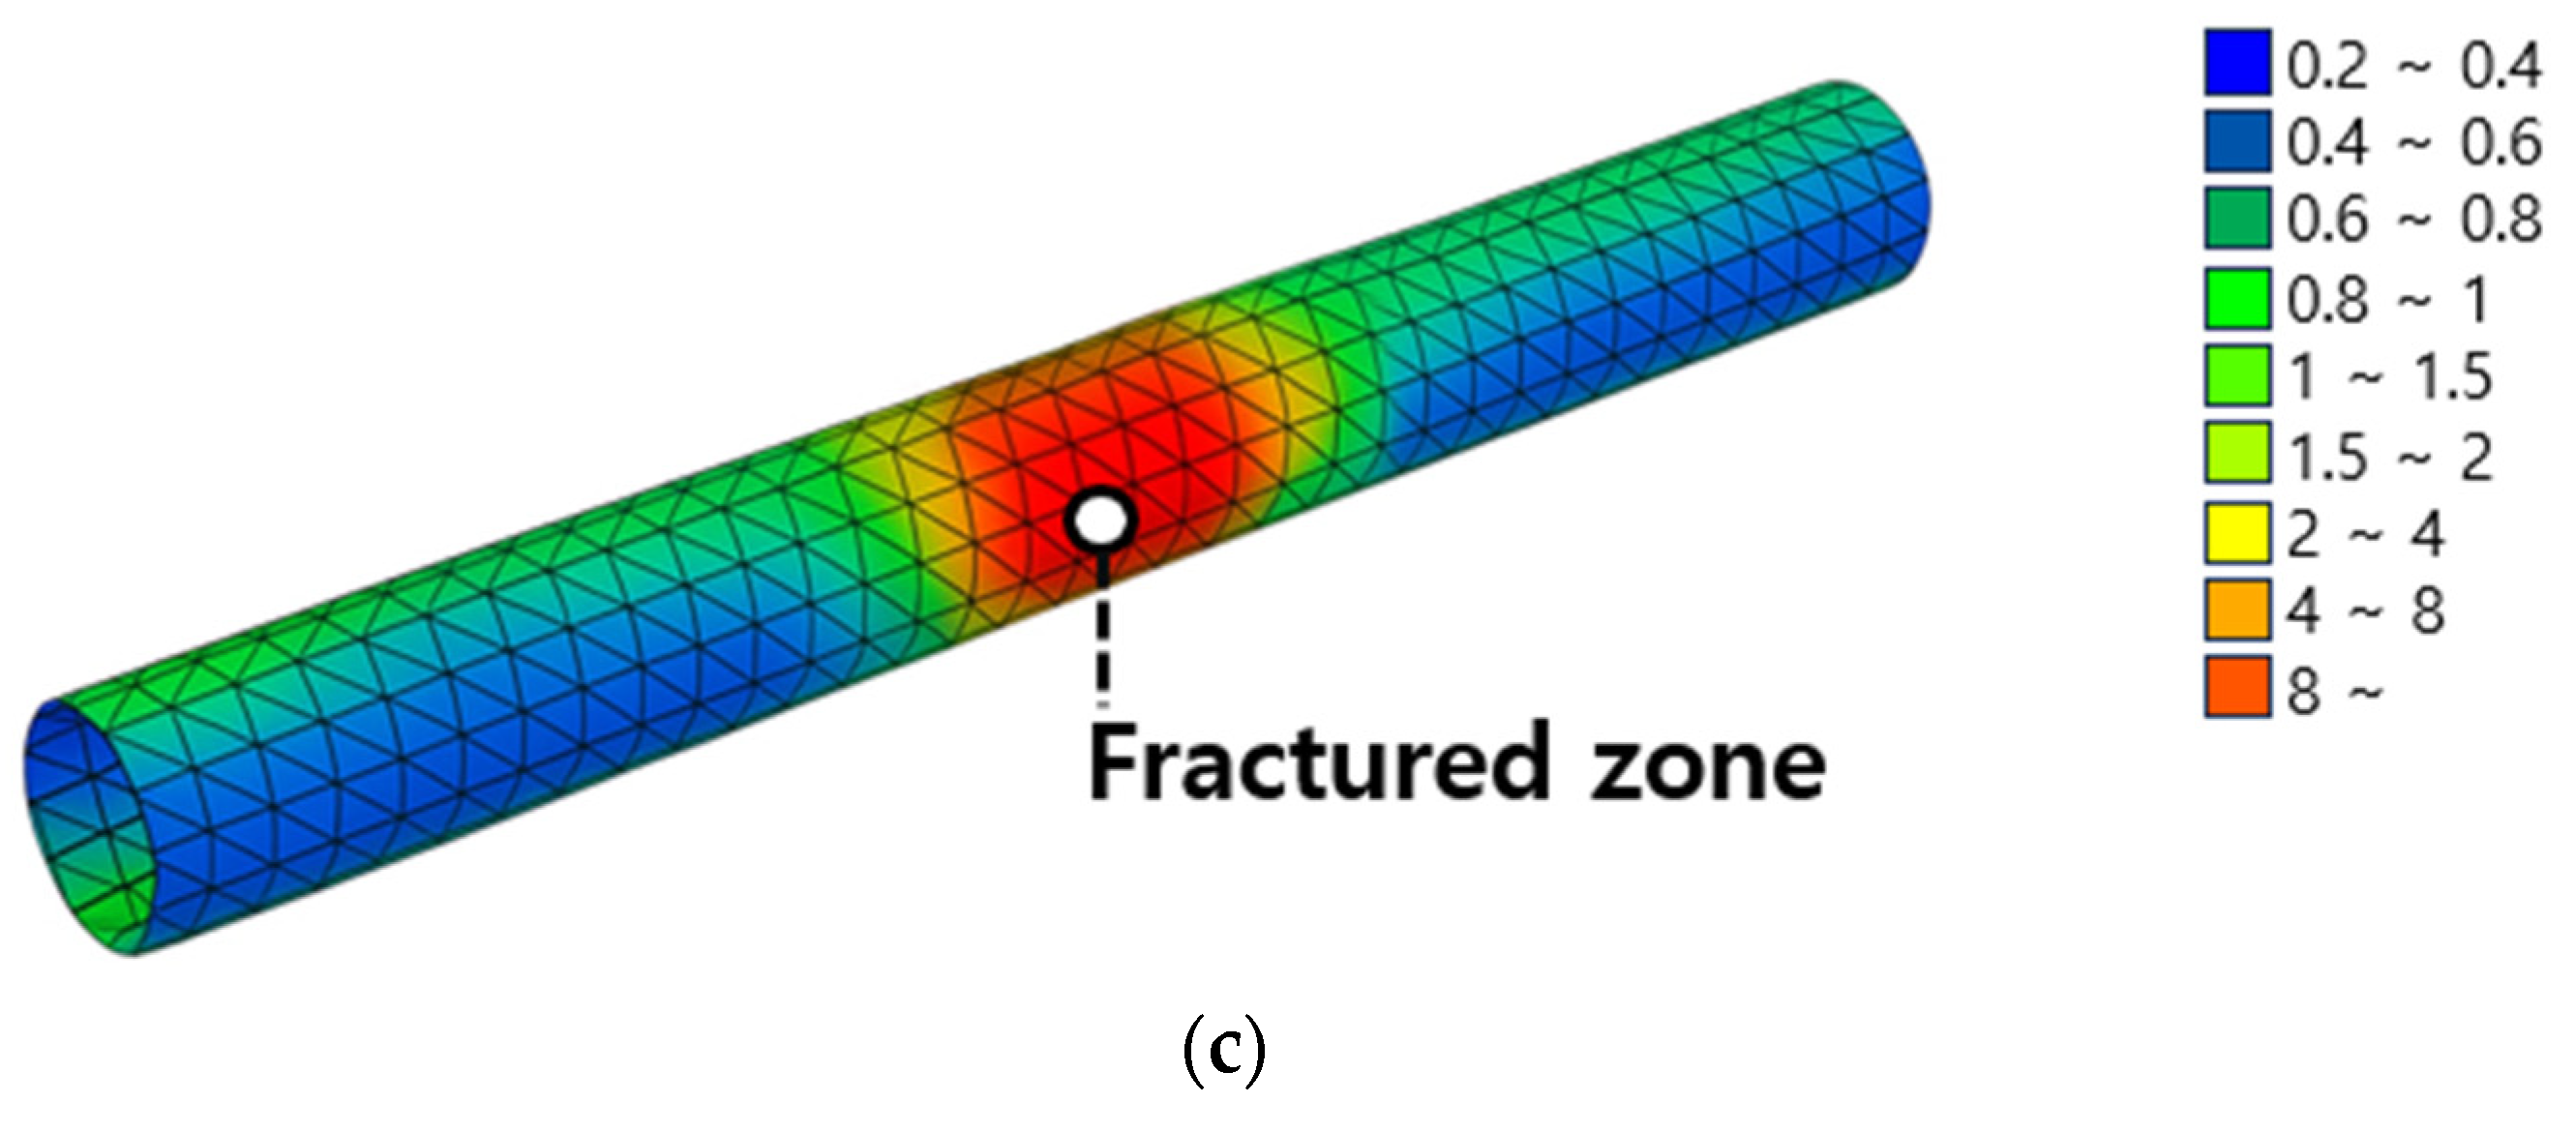
Figure 6 presents stress contour plots of the tunnel lining for the Kobe earthquake record with an input acceleration of 0.154 g. Three site conditions are shown: (i) Case 1—hard rock, (ii) Case 2—hard rock with a narrow fracture zone, and (iii) Case 3—hard rock with a wide fracture zone. The contours corresponded to the maximum compressive stress during the dynamic response and visually confirmed the localized stress concentration at the fractured zone in Cases 2 and 3 compared with the uniform stress distribution in Case 1.
These findings clearly demonstrate the necessity for region-specific seismic fragility assessment. The notable stress escalation observed at fractured zones justifies the development of corresponding seismic fragility curves that reflect the increased vulnerability of tunnel linings in such conditions.

3. Development of Seismic Fragility Curve for Railway Tunnel Crossing Fracture Zone

As highlighted in Section 2, the dynamic responses of tunnel segments intersecting fractured zones significantly exceed those of tunnels embedded in hard rock. This increased response necessitates the development of seismic fragility curves specific to fractured zone conditions. Accordingly, this section presents the methodology and results of deriving seismic fragility functions using the maximum response at Monitoring Point-2 in Case 2, where the tunnel directly intersects the fractured zone.

3.1. Derivation of Damage Index

To quantitatively assess the structural demand imposed on tunnel linings by seismic ground motions, a damage index (DI) was introduced in this study. The DI is a dimensionless parameter representing the ratio of the maximum bending moment generated in the structure to the allowable moment capacity. It is defined as:
D I = M M a
where M is the maximum bending moment observed in the tunnel lining during dynamic analysis and Ma is the allowable bending moment.
The maximum compressive stresses generated during each dynamic analysis were first extracted. From these stress values, the corresponding bending moments M were calculated using the geometric and material properties of the tunnel lining section. Specifically, the bending moment M was calculated using the flexural stress formula:
M = σ m a x · I y
where σmax is the maximum compressive stress obtained from the numerical analysis, I is the moment of inertia of the tunnel lining cross-section, and y is the distance from the neutral axis to the extreme compression point. The section properties were defined based on the structural specifications for the double-track tunnel lining as specified in the Korea National Railway Construction Standard (KR C-12040).
For reference, the double-track tunnel lining in this study had an outer diameter of 10.0 m and a thickness of 0.5 m, giving I = 168.8 m4 and y = 5.0 m. For example, Case 2, Hachinohe motion at 0.154 g at Monitoring Point-2, σmax = 3.731 MPa, the bending moment can be calculated as follows.
M = 8.815 × 10 6   N / m 2 × 168.8   m 4 5.0   m = 297.6   M N · m
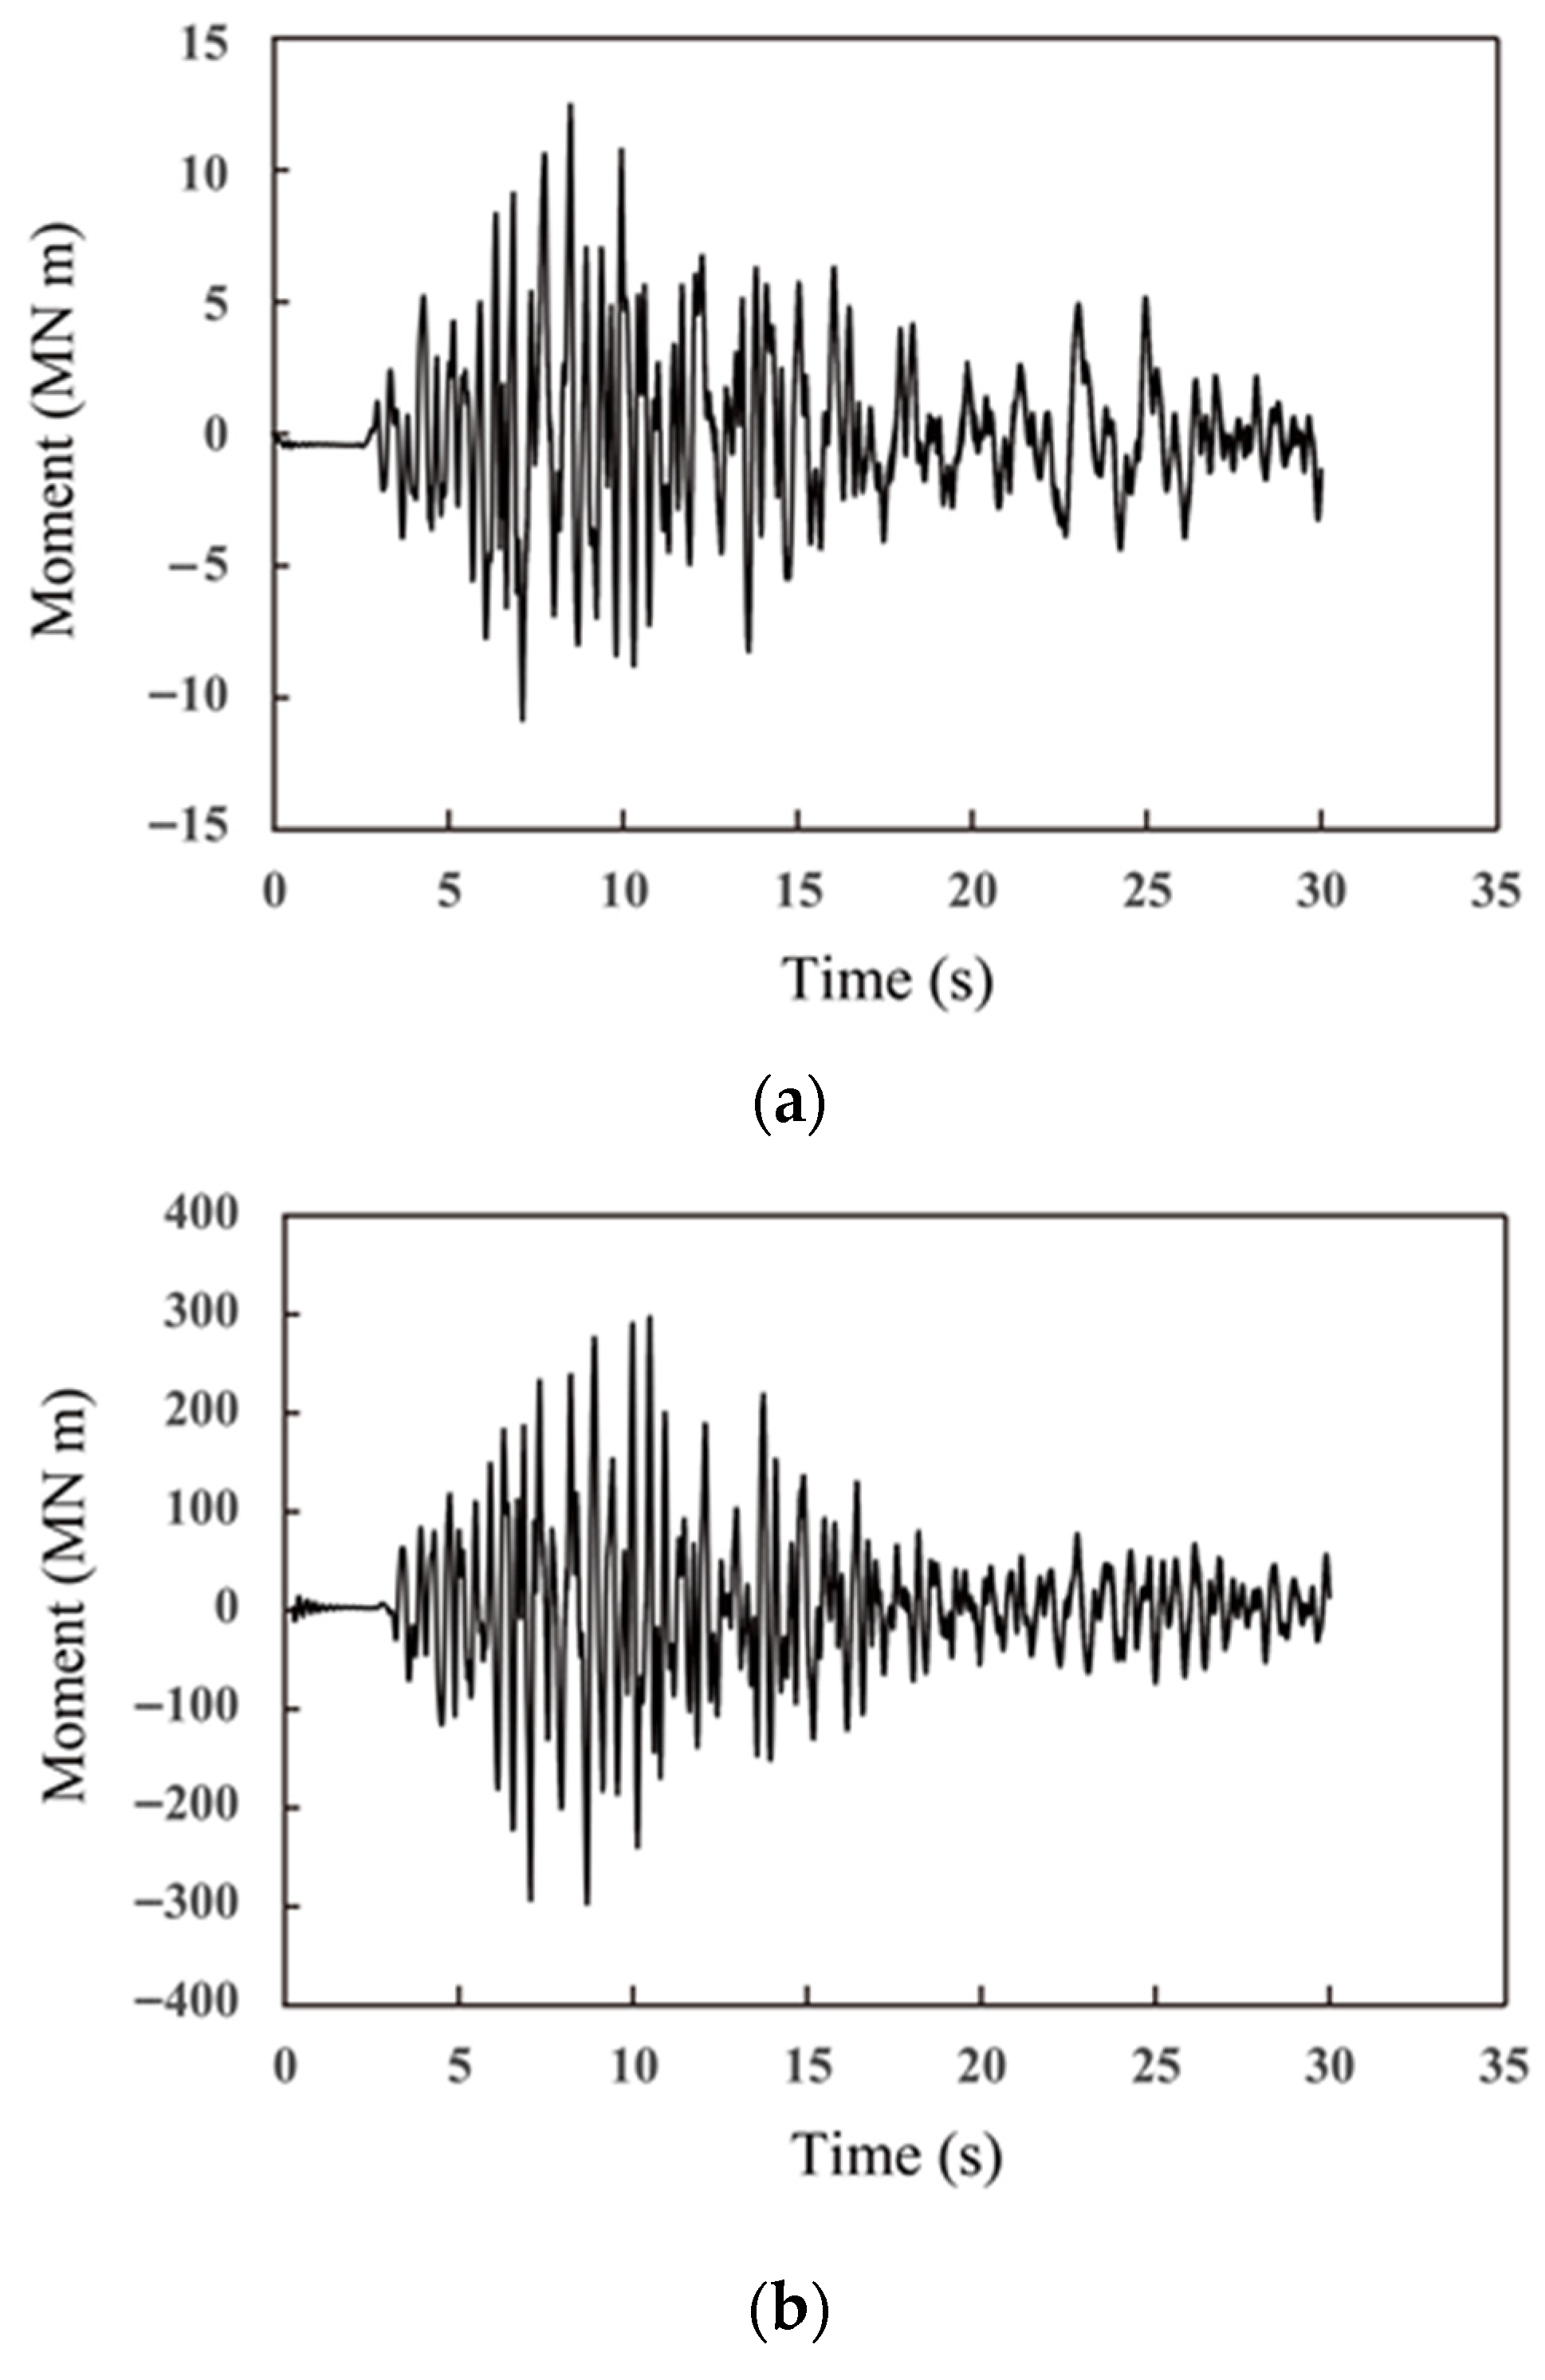
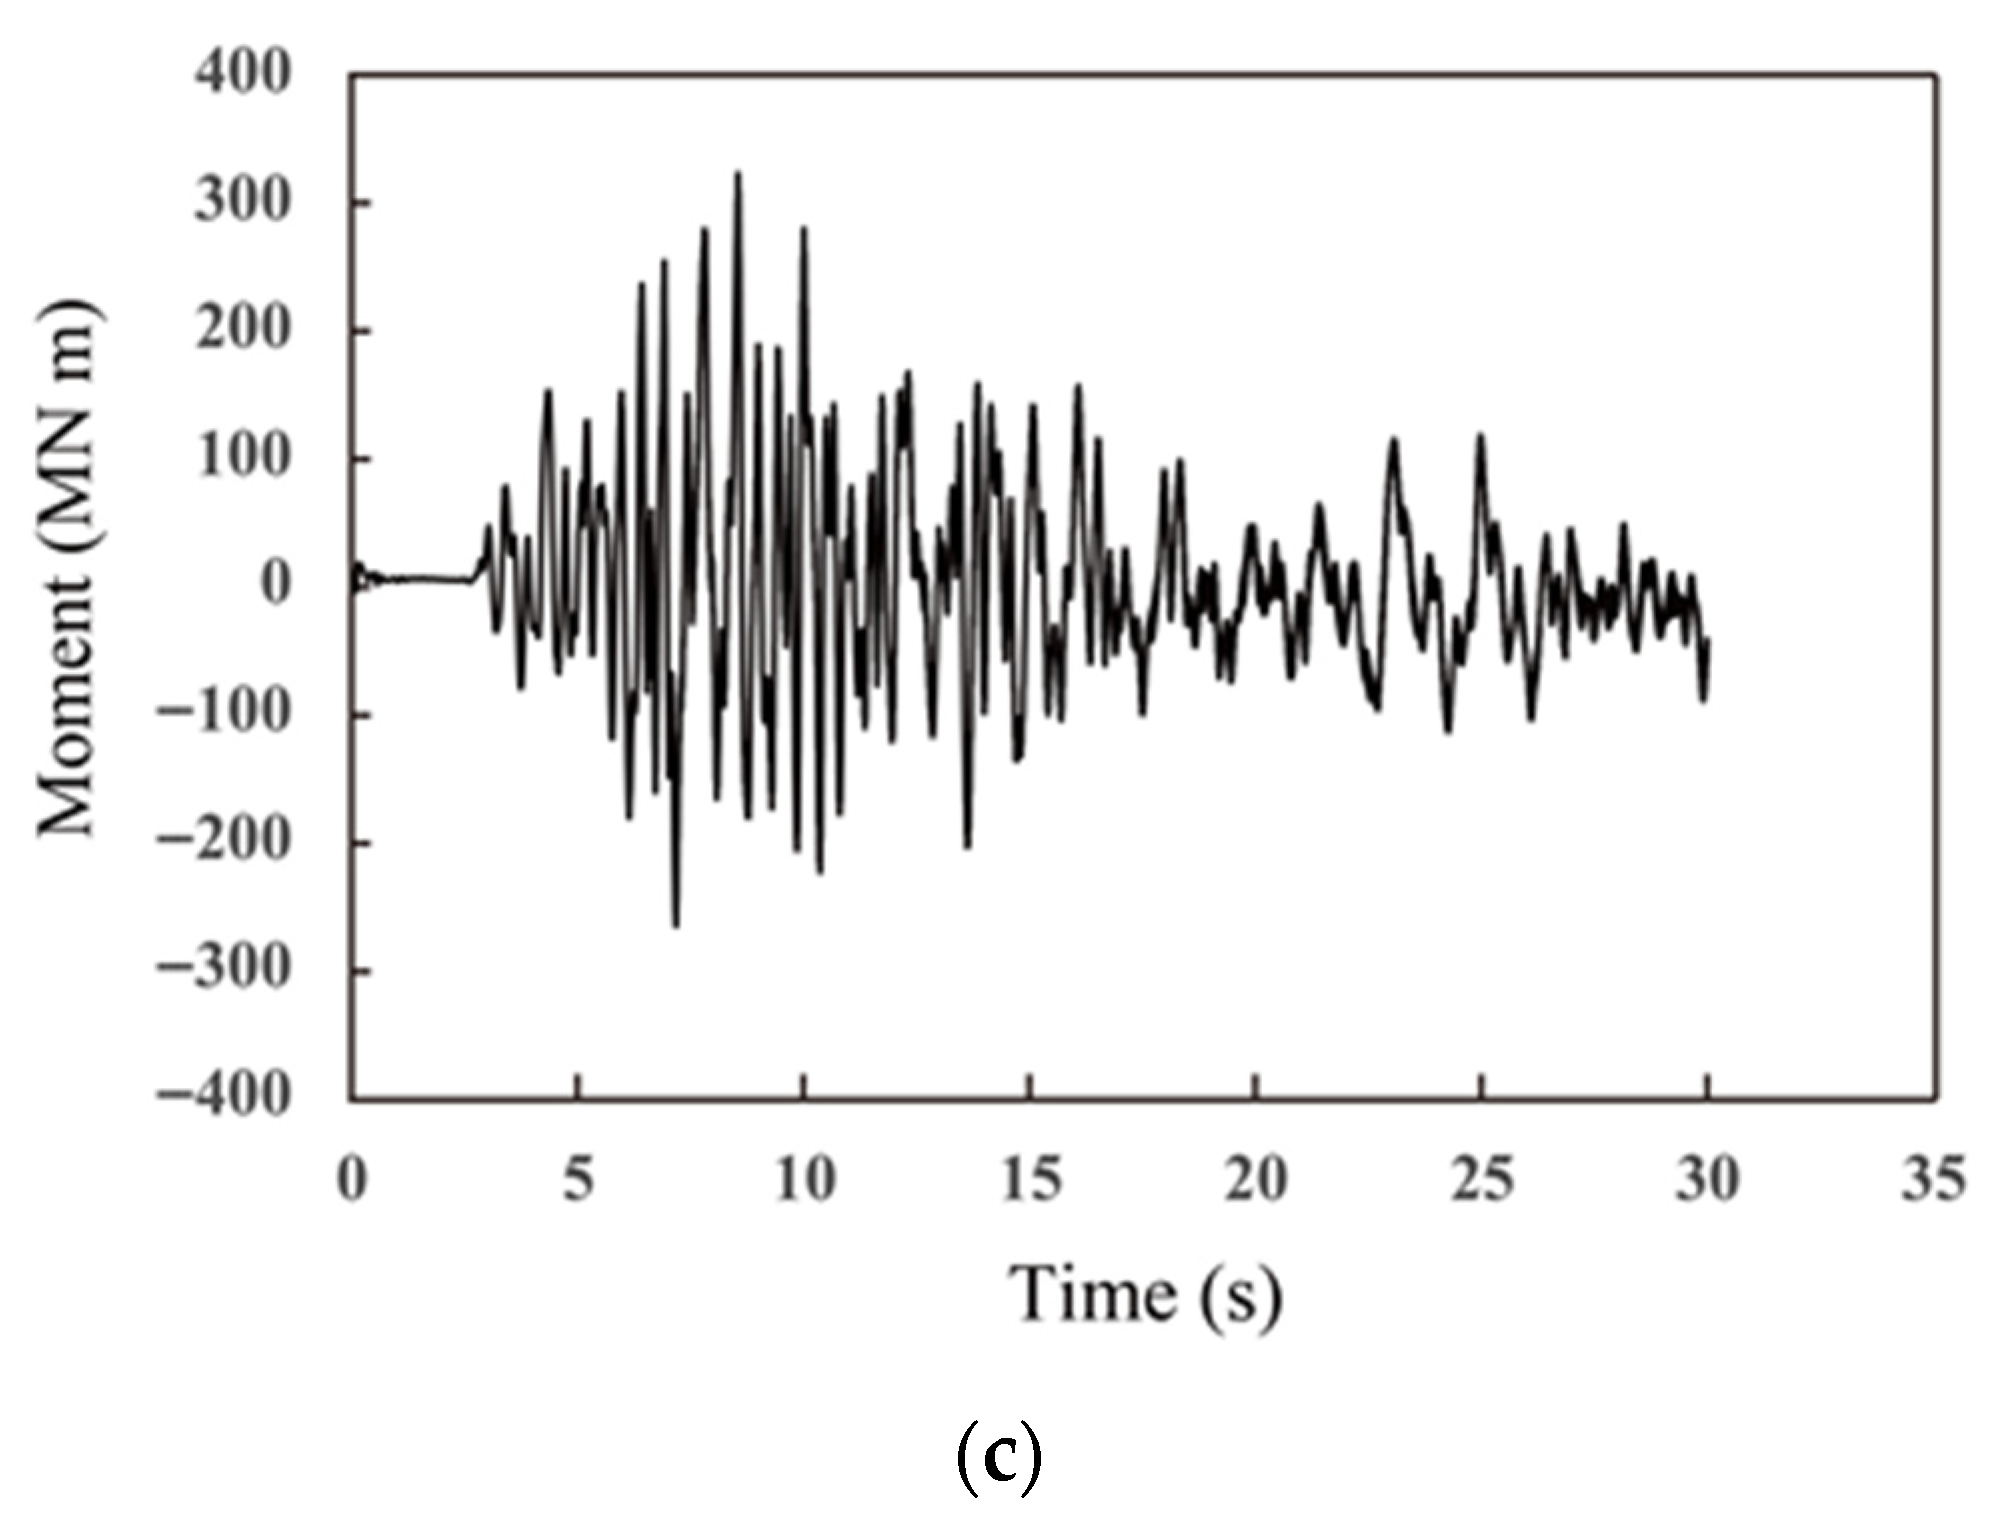
This example illustrates the direct conversion from FLAC3D output stresses to bending moments used in the DI calculation. A representative bending moment time history was obtained and is presented in Figure 7. This case corresponds to the results for the Kobe earthquake record with an input acceleration of 0.154 g, derived from the moment response at Point 2.
In addition, based on the structural specifications of a double-track tunnel and in accordance with the Korea National Railway Construction Standard (2021) [19], the allowable moment was set to Ma = 337.62 MN m. Table 3 presents the peak bending moment obtained for each ground motion case. Based on these results, the DI values were computed using Equation (1) and are summarized in Table 4. These values provide a quantitative basis for evaluating the seismic demand imposed on the tunnel lining structure.

3.2. Determination Procedure of Seismic Fragility Curve

Seismic fragility refers to the probability that a structure will exceed a specified damage state given a certain level of ground motion intensity, typically represented by peak ground acceleration (PGA). In this context, exceedance probability indicates the likelihood of sustaining damage greater than a predefined threshold. The construction of a seismic fragility model therefore requires a prior estimation of the exceedance probability associated with each intensity level.
Two principal methodologies are available for estimating this probability: empirical and numerical approaches. The empirical approach relies on observed damage records from past earthquake events, where the frequency of damage exceedance is correlated with recorded seismic intensity measures [20]. The numerical approach, in contrast, uses validated numerical models to simulate structural behavior under increasing levels of ground motion and derives exceedance probabilities from the resulting damage indices [21].
Due to the lack of sufficient statistical damage data for tunnels subjected to seismic events, the present study employed a numerical approach to derive fragility functions. Based on nonlinear dynamic analysis results, seismic fragility functions were developed through a multi-step procedure. Although only four ground motions were used at each PGA level, they were carefully selected to cover a wide range of frequency characteristics, including long-period (Hachinohe), short-period (Ofunato), artificial, and recorded motion. These motions were also selected to reflect the seismic hazard characteristics relevant to the study area in Korea, as specified in KDS 17 10 00 [17]. The long-period Hachinohe record represents large-magnitude subduction-type events, while the short-period Ofunato record reflects nearby crustal earthquakes. The artificial motion was generated to match the target design response spectrum for the study area, and the Kobe record represents a strong near-fault crustal event with mixed frequency content. This selection ensures that both long- and short-period hazard scenarios are adequately represented in the fragility assessment. These motions were also each scaled to 6 different intensity levels, yielding a total of 24 simulation cases for each tunnel scenario.
In deriving the fragility curves, each of the four selected ground motion types was assigned equal weight to avoid bias toward any particular frequency content. For each PGA level, the exceedance probabilities for the defined damage states were calculated by integrating the results from all motion types, ensuring that the curves represent the combined influence of diverse seismic scenarios. Although a disaggregated analysis by ground motion type could reveal frequency-dependent trends, the present study aimed to incorporate the full variability of seismic inputs into a unified probabilistic framework. This approach is consistent with the purpose of fragility functions, which are designed to reflect overall seismic vulnerability while accounting for inherent variability in earthquake ground motions.
First, multiple input ground motions with varying frequency content were selected to represent diverse seismic scenarios. These motions were applied to a validated finite element model of the tunnel system, and nonlinear time history analyses were conducted. The maximum bending moment responses of the tunnel lining were extracted and compared with the structural limit moment to calculate a corresponding damage index (DI) for each case.
Next, the DI values were used to define discrete damage states. For each damage state, the PGA values of the ground motions that triggered that specific level of damage were collected. The mean and standard deviation of the PGA values in each damage state group were then computed. Finally, these statistical parameters were used to construct a cumulative lognormal distribution function, which defines the seismic fragility curve for each damage state.
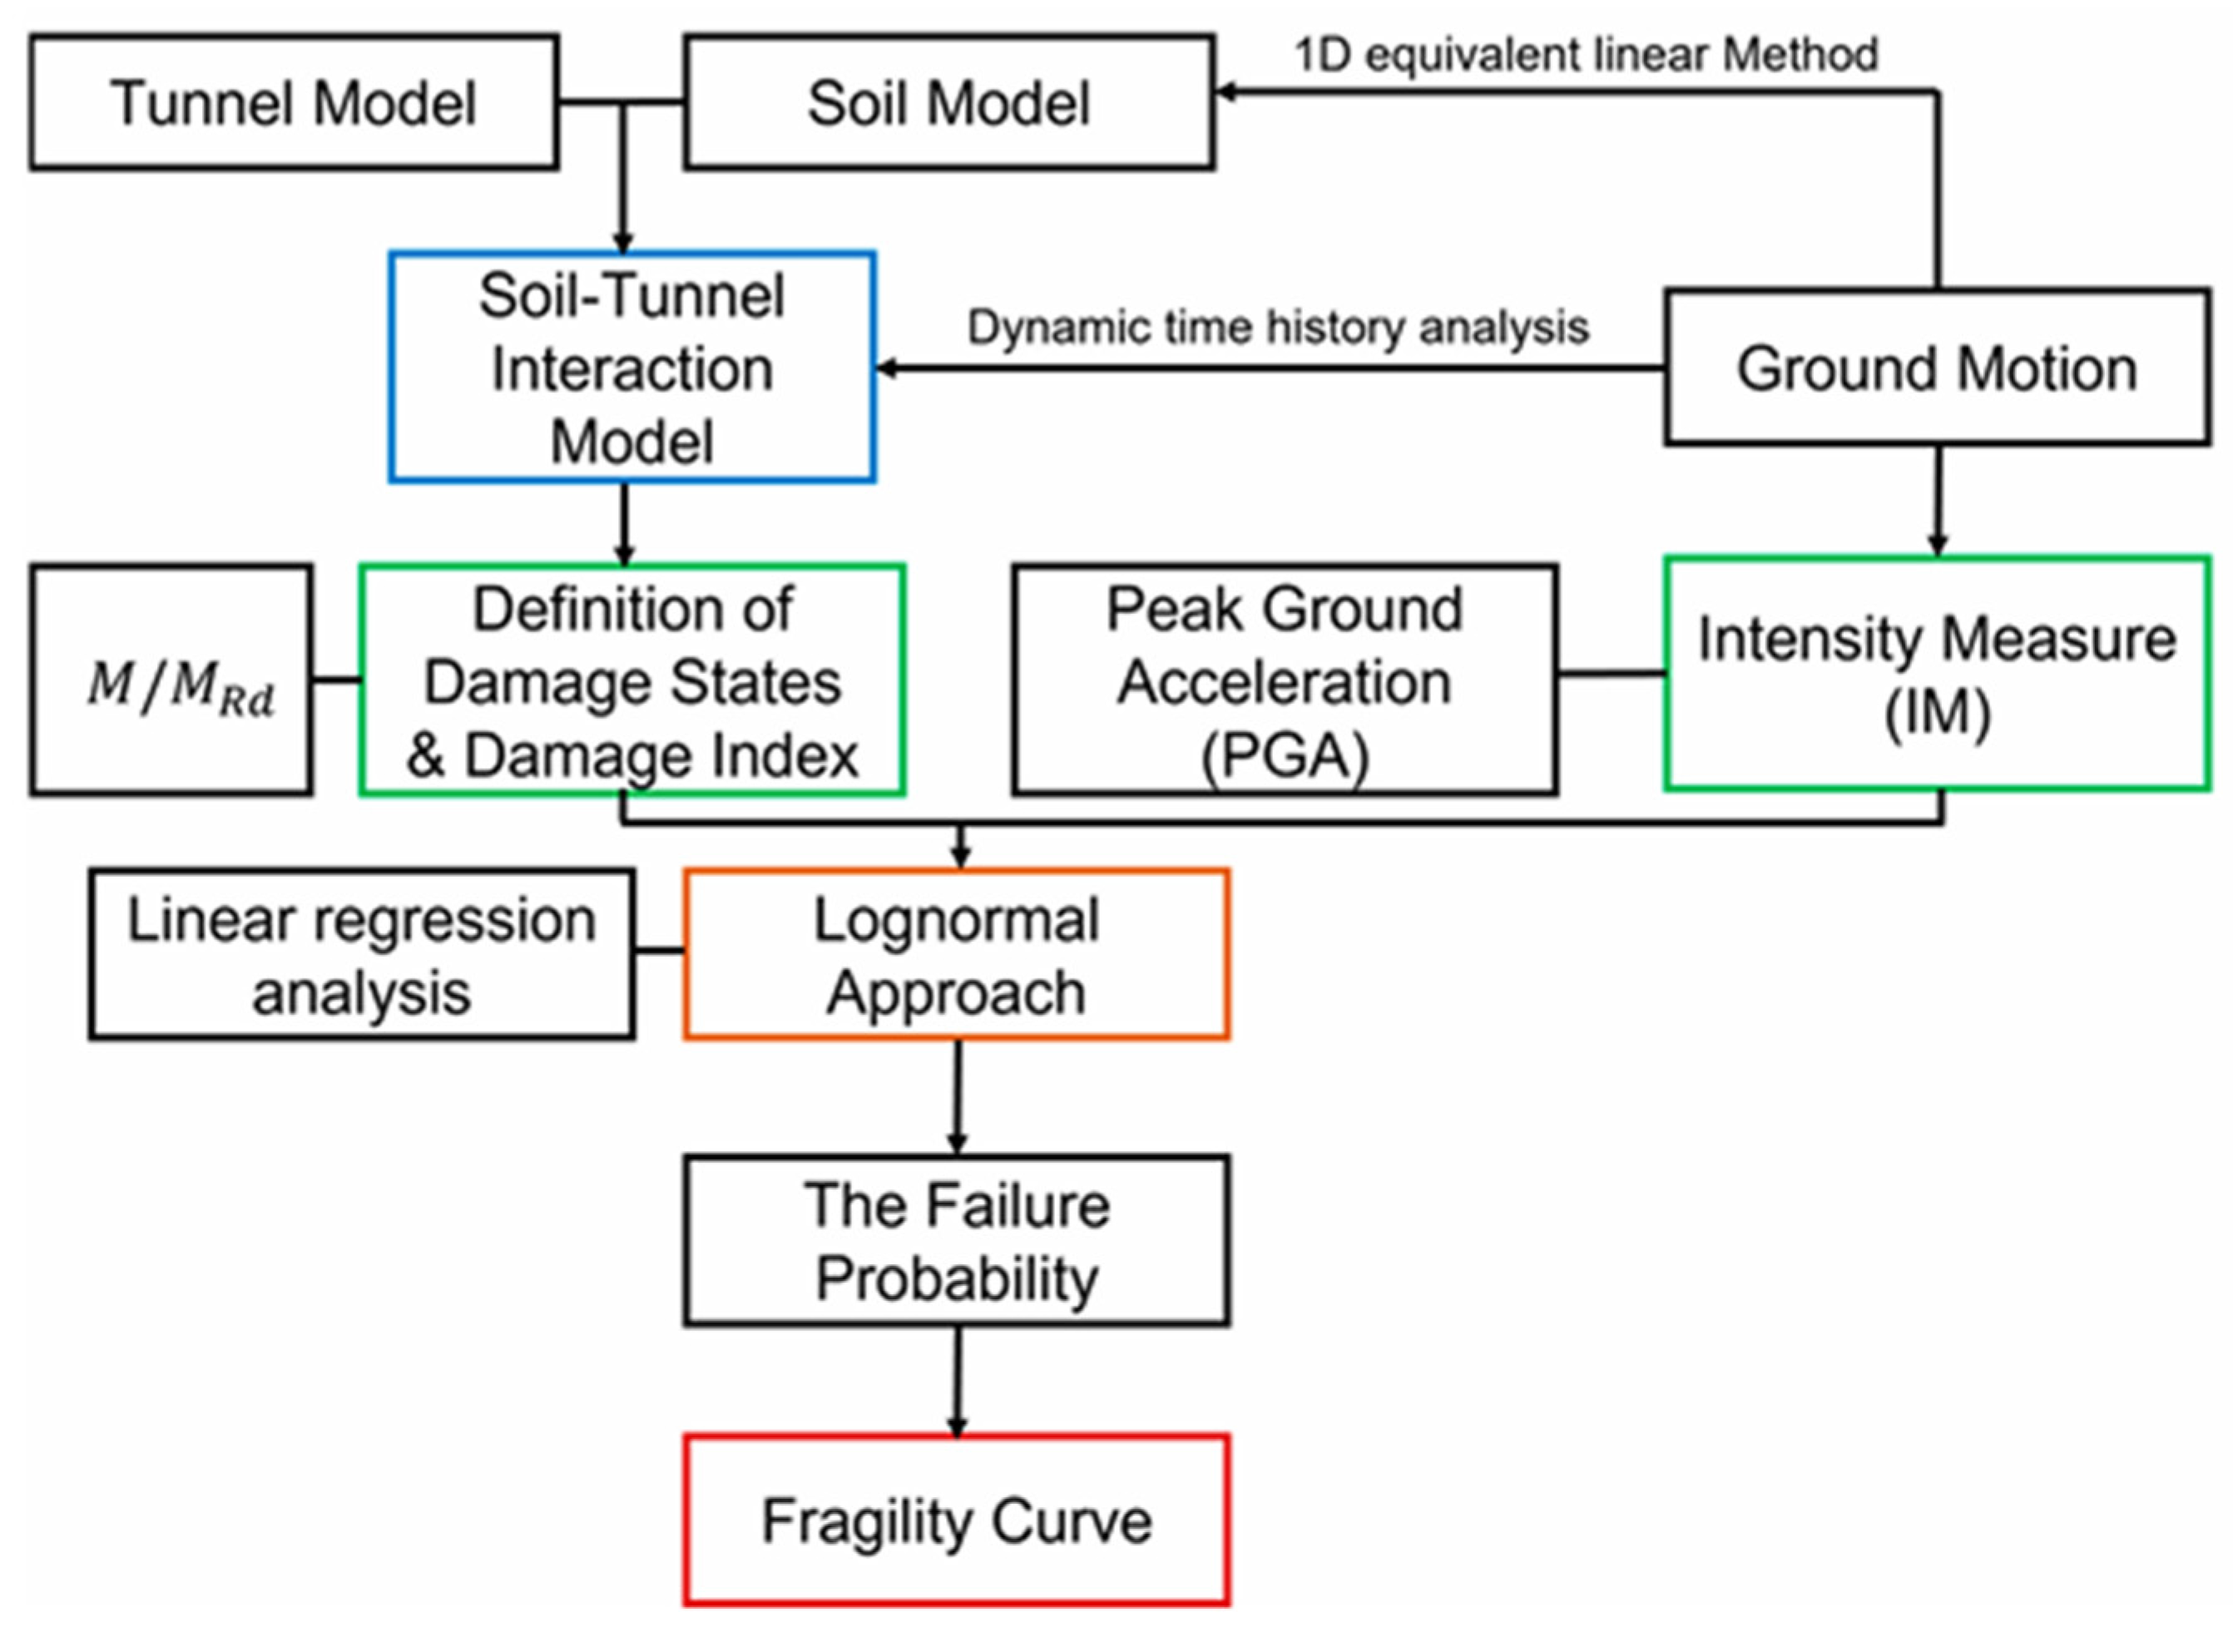
Figure 8 presents a flowchart summarizing the overall procedure for deriving the seismic fragility functions using the numerical method adopted in this study.
In this study, the damage state thresholds based on the damage index (DI) were adopted from the classification proposed by Argyroudis and Pitilakis [14], as summarized in Table 5. The resulting damage state assigned to each ground motion case based on the computed DI values is presented in Table 6.
Based on the damage state classifications described above and the corresponding ground motion groupings presented in Table 5 and Table 6, the final seismic fragility functions were derived. These functions characterize the probability of exceeding each damage state as a function of peak ground acceleration (PGA), and can be mathematically expressed using a lognormal cumulative distribution function, as shown in Equation (4).
P [ DS   |   IM = X ]   =   Φ   ( ( lnX     μ )/ β )
where P[DS | IM = X] denotes the probability that the structural damage will exceed a specified state ds given an intensity measure X, where Φ() represents the standard normal cumulative distribution function. The variable X corresponds to the peak ground acceleration (PGA), while μ and β indicate the logarithmic mean and standard deviation of PGA, respectively.
The dispersion parameter β incorporates multiple sources of uncertainty, including those associated with the damage index (βDS), the structural resistance capacity (βC), and the variability of ground motion characteristics (βD), as described in Equation (5). Given the lack of site-specific resistance data for tunnel linings, the uncertainty in structural capacity (βC) was conservatively assumed to be 0.3, following the approach recommended by Argyroudis and Pitilakis [14].
β = β D s 2 + β c 2 + β D 2
In this study, the dispersion parameter β was designed to capture three distinct sources of uncertainty. The first, βDS, quantifies the uncertainty inherent in the damage index itself. For a given damage state, βDS was calculated as the standard deviation of damage index values from all ground motion cases assigned to that state. The second, βD represents the uncertainty arising from seismic ground motion uncertainty and was calculated as the standard deviation of the peak ground acceleration (PGA) values for the same set of cases. The third, βC accounts for the uncertainty in structural capacity and was conservatively set to 0.3 following the recommendation of Argyroudis and Pitilakis [14]. These three components were then combined using Equation (3) to obtain the total dispersion β for each damage state.

3.3. Seismic Fragility Curve for Tunnel Structure Crossing the Fracture Zone

Through the aforementioned procedure, seismic fragility functions were developed for tunnel structures intersecting fractured zones. Each fragility function describes the probability of exceeding a specific damage state as a function of peak ground acceleration (PGA), represented by a lognormal cumulative distribution.
The PGA values corresponding to each dynamic case were obtained from the free-field response of the nonlinear time history analyses. Cases that triggered the same damage state—minor, moderate, or extensive—were grouped accordingly. For each group, the PGA values were compiled, and their logarithmic mean and standard deviation (β) were calculated.
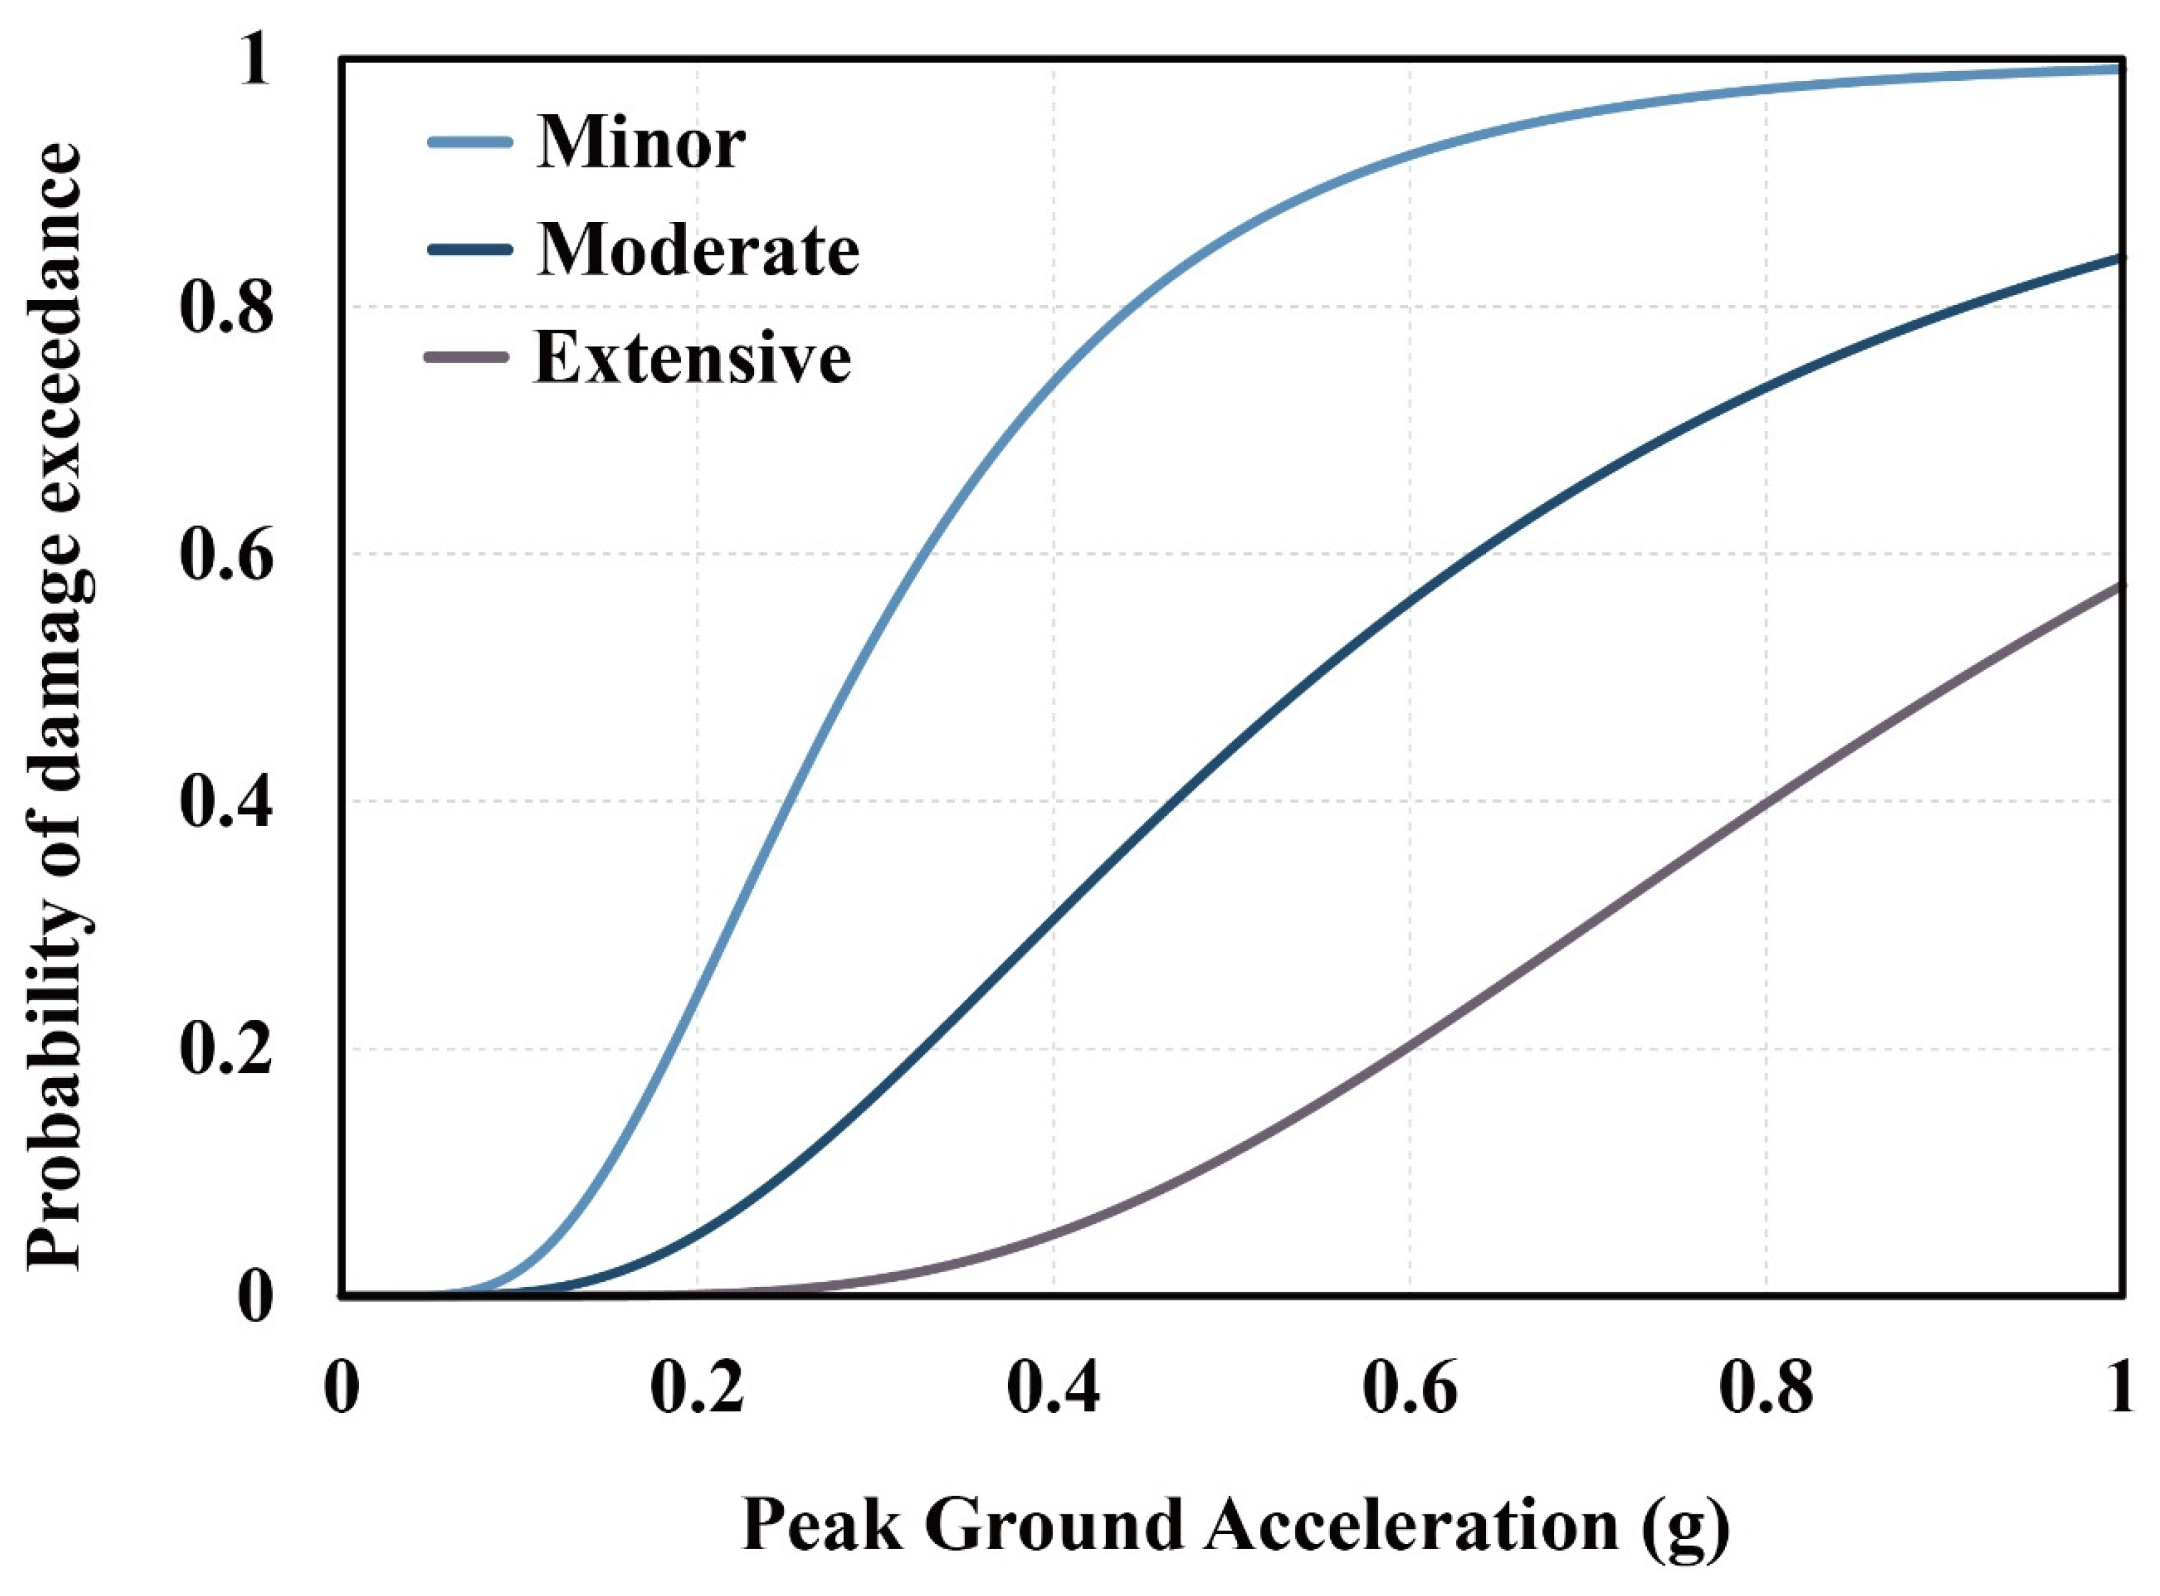
The resulting fragility functions for tunnel segments intersecting fractured zones are summarized in Table 7, and the corresponding fragility curves are illustrated in Figure 9. The analysis revealed that the probability of exceeding minor damage reaches 50% at a PGA of approximately 0.289 g. Similarly, the probability of exceeding moderate damage exceeds 50% at a PGA of about 0.578 g, while the likelihood of extensive damage surpasses 50% at a PGA of approximately 0.91 g. In addition to the median values, the PGA ranges corresponding to 5% and 95% exceedance probabilities were also derived. For minor damage, the exceedance probability ranges from 0.12 g (5%) to 0.70 g (95%). For moderate damage, the range is from 0.26 g to 1.16 g, and for extensive damage, it extends from 0.44 g to 1.88 g. These ranges reflect the dispersion and uncertainty associated with each fragility curve and provide additional information for reliability-based seismic design.
As described in Section 3.2, the β values in Table 7 integrate the three uncertainty components: βDS reflecting the inherent scatter in the damage index; βD representing the variability of ground motion intensity; and βC representing structural capacity uncertainty. This approach ensures that the fragility functions explicitly account for both the structural response variability and the randomness in seismic input motions.
It should be noted that for Case 1 (hard rock), all analysis results corresponded to the “none” damage state, indicating no structural damage even under the highest input motion considered. Therefore, a fragility curve could not be derived for this case, and it is not included in Figure 9. For statistical robustness and to provide a conservative assessment, the fragility functions presented in this study were developed by pooling the results of Case 2 (narrow fracture zone) and Case 3 (wide fracture zone). This approach was adopted because the limited number of ground motions available for each case made it statistically unreliable to derive separate fragility curves for different fracture zone widths, and the analysis results indicated that the presence of a fracture zone itself caused a much greater increase in seismic demand than the incremental effect of its width.

3.4. Analysis and Discussion

Unlike previous studies (Yang et al. [11] and Argyroudis and Pitilakis [14]) that mainly focused on underground stations or tunnels in uniform ground conditions, existing research has not developed seismic fragility functions specifically for tunnels intersecting fractured zones. This gap is critical because field experience and numerical results consistently indicate that the seismic vulnerability of tunnels increases significantly when passing through fracture zones due to stress concentration and stiffness degradation.
The present study addresses this gap by explicitly deriving fragility functions for tunnel segments intersecting fractured rock masses. By considering the reduced elastic modulus and mechanical properties of fractured zones, the results demonstrate that even a relatively narrow fracture zone can drastically elevate seismic demand compared with intact hard rock conditions.
This distinction underlines the novelty and significance of the current research. It shows that tunnels crossing fractured zones require site-specific seismic evaluation and design considerations, as conventional fragility assessments based only on intact rock or soil may underestimate the true seismic risk. Therefore, the fragility functions presented herein provide an essential contribution toward improving the reliability and safety of long-distance railway tunnels in complex geological environments.

4. Conclusions

This study conducted a seismic fragility assessment of railway tunnel structures intersecting fractured zones using a numerical approach. The following conclusions were drawn based on the nonlinear dynamic analysis results and fragility modeling:
  • The presence of fractured zones significantly amplified the seismic response of tunnel linings. Compared with tunnels embedded in hard rock, those intersecting fractured zones exhibited higher bending moments and larger deformations under identical ground motion conditions.
  • Damage indices (DI) were computed using moment-based structural responses, and the tunnel damage states were classified accordingly. The DI-based classification allowed for a systematic quantification of seismic damage levels.
  • Using the DI-derived classifications, the seismic fragility functions were established for tunnels intersecting fractured zones. The fragility curves were constructed based on a lognormal cumulative distribution, with PGA as the intensity measure.
  • The resulting fragility curves indicated that the probability of exceeding minor, moderate, and extensive damage states surpassed 50% at PGAs of approximately 0.289 g, 0.578 g, and 0.91 g, respectively. These results demonstrate the increased seismic vulnerability of tunnels traversing fractured geological formations and underscore the need for site-specific seismic design considerations.
  • It is acknowledged that the limited number of input ground motions may affect the statistical robustness of the derived fragility curves. This limitation stems from the significant computational cost associated with FLAC3D-based 3D nonlinear dynamic analyses, which constrained the number of ground motions in this initial study. Future work will address this limitation by incorporating a larger suite of input motions through cloud analysis or incremental dynamic analysis (IDA) frameworks, thereby enhancing the statistical reliability and general applicability of the fragility functions. In addition, while both 2.0 m and 10.0 m fracture zone cases were analyzed, the limited number of ground motions within each case made it statistically unreliable to derive separate fragility curves. Moreover, the presence of a fracture zone itself caused a much greater increase in seismic demand than the incremental effect of its width. Therefore, the fragility functions were developed by pooling all fracture zone cases, and the effect of fracture zone thickness will be further investigated in future work using a larger set of seismic inputs.

Author Contributions

W.S.S.: writing—original draft preparation, methodology. S.H.: conceptualization. S.K.L.: visualization. H.S.: methodology. J.K.: writing—review and editing, methodology. M.Y.: writing—methodology, review and editing, visualization, supervision. S.K.: writing—review and editing, project administration. The authors confirm that this work has not been published before, and its publication has been approved by all co-authors. All authors have read and agreed to the published version of the manuscript.

Funding

This research was supported by the Korea Agency for Infrastructure Technology Ad-vancement (KAIA) grant funded by the Ministry of Land, Infrastructure and Transport (Grant No. RS-2023-00238018) and the Gachon University research fund of 2022 (GCU-202300790001).

Data Availability Statement

Data are contained within the article.

Conflicts of Interest

The authors declare no conflicts of interest.

References

  1. Yoo, M.; Kwak, C.; Lee, H.U.; Park, J. Development of seismic fragility curve for subsea railway tunnel based on 3D numerical analysis. KSCE J. Civ. Eng. 2024, 29, 100149. [Google Scholar] [CrossRef]
  2. Pakbaz, M.C.; Yareevand, A. 2-D analysis of circular tunnel against earthquake loading. Tunn. Undergr. Space Technol. 2005, 20, 411–417. [Google Scholar] [CrossRef]
  3. Asheghabadi, M.S.; Matinmanesh, H. Finite element seismic analysis of cylindrical tunnel in sandy soils with consideration of soil-tunnel interaction. Procedia Eng. 2011, 14, 3162–3169. [Google Scholar] [CrossRef]
  4. Jiang, L.; Chen, J.; Li, J. Seismic response of underground utility tunnels: Shaking table testing and FEM analysis. Earthq. Eng. Eng. Vib. 2010, 9, 555–567. [Google Scholar] [CrossRef]
  5. Bao, X.; Xia, Z.; Ye, G.; Fu, Y.; Su, D. Numerical analysis on the seismic behavior of a large metro subway tunnel in liquefiable ground. Tunn. Undergr. Space Technol. 2017, 66, 91–106. [Google Scholar] [CrossRef]
  6. Tsinidis, G.; Pitilakis, K.; Anagnostopoulos, C. Circular tunnels in sand: Dynamic response and efficiency of seismic analysis methods at extreme lining flexibilities. Bull. Earthq. Eng. 2016, 14, 2903–2929. [Google Scholar] [CrossRef]
  7. Do, N.A.; Dias, D.; Oreste, P. 2D seismic numerical analysis of segmental tunnel lining behaviour. Bull. N. Z. Soc. Earthq. Eng. 2014, 47, 206–216. [Google Scholar] [CrossRef]
  8. Nong, X.; Bai, W.; Yi, S.; Lu, Z.; Lu, Y. Numerical simulation for risk assessment of tunnel construction through fault fracture zones. Buildings 2024, 14, 3161. [Google Scholar] [CrossRef]
  9. Cho, Y.G.; Park, J.G. Effect of orientation of fracture zone on tunnel behavior—Numerical investigation. J. Korean Tunn. Undergr. Space Assoc. 2013, 15, 253–270. [Google Scholar]
  10. Ji, M.; Wang, X.; Luo, M.; Wang, D.; Teng, H.; Du, M. Stability analysis of tunnel surrounding rock when TBM passes through fracture zones with different deterioration levels and dip angles. Sustainability 2023, 15, 5243. [Google Scholar] [CrossRef]
  11. Yang, S.; Kwak, D.; Kim, S.; Yoo, B.; Yoo, M. Evaluation and Development of Seismic Fragility Models for Cut-and-Cover Underground Station. J. Korean Soc. Railw. 2024, 27, 202–212. Available online: https://scholarworks.bwise.kr/gachon/handle/2020.sw.gachon/90831 (accessed on 1 July 2025). [CrossRef]
  12. Kwon, S.Y.; Kim, J.; Kwak, D.; Yang, S.; Yoo, M. Development of seismic fragility function for underground railway station structures in Korea. Buildings 2024, 14, 1200. [Google Scholar] [CrossRef]
  13. Osmi, S.K.C.; Ahmad, S.M. Seismic fragility curves for shallow circular tunnels under different soil conditions. World Acad. Sci. Eng. Technol. Int. J. Civ. Environ. Eng. 2016, 10, 1281–1287. [Google Scholar]
  14. Argyroudis, S.A.; Pitilakis, K.D. Seismic fragility curves of shallow tunnels in alluvial deposits. Soil Dyn. Earthq. Eng. 2012, 35, 1–12. [Google Scholar] [CrossRef]
  15. Zhong, Z.; Shen, Y.; Zhao, M.; Li, L.; Du, X.; Hao, H. Seismic fragility assessment of the Daikai subway station in layered soil. Soil Dyn. Earthq. Eng. 2020, 132, 106044. [Google Scholar] [CrossRef]
  16. Hu, X.; Zhou, Z.; Chen, H.; Ren, Y. Seismic fragility analysis of tunnels with different buried depths in a soft soil. Sustainability 2020, 12, 892. [Google Scholar] [CrossRef]
  17. KDS 17 10 00; Korean Design Standard 17 10 00: Seismic Design Standard. Ministry of Land. Infrastructure and Transportation: Sejong, Republic of Korea, 2024.
  18. Nieto-Samaniego, A.F.; Alaniz-Álvarez, S.A.; Velázquez-Morales, L.; Xu, S.; Ramos-Arias, M.A.; Delgado-Granados, H. Effect of Mineral Processes and Deformation on the Petrophysical Properties of Soft Rocks during Active Faulting. Minerals 2020, 10, 444. [Google Scholar] [CrossRef]
  19. KR C-12040:Concrete Lining; Korea National Railway Construction Standard. Korea Rail Network Authority: Daejeon, Republic of Korea, 2021.
  20. Straub, D.; Der Kiureghian, A. Improved seismic fragility modeling from empirical data. Struct. Saf. 2008, 30, 320–336. [Google Scholar] [CrossRef]
  21. Ghosh, S.; Ghosh, S.; Chakraborty, S. Seismic fragility analysis in the probabilistic performance-based earthquake engineering framework: An overview. Int. J. Adv. Eng. Sci. Appl. Math. 2021, 13, 122–135. [Google Scholar] [CrossRef]
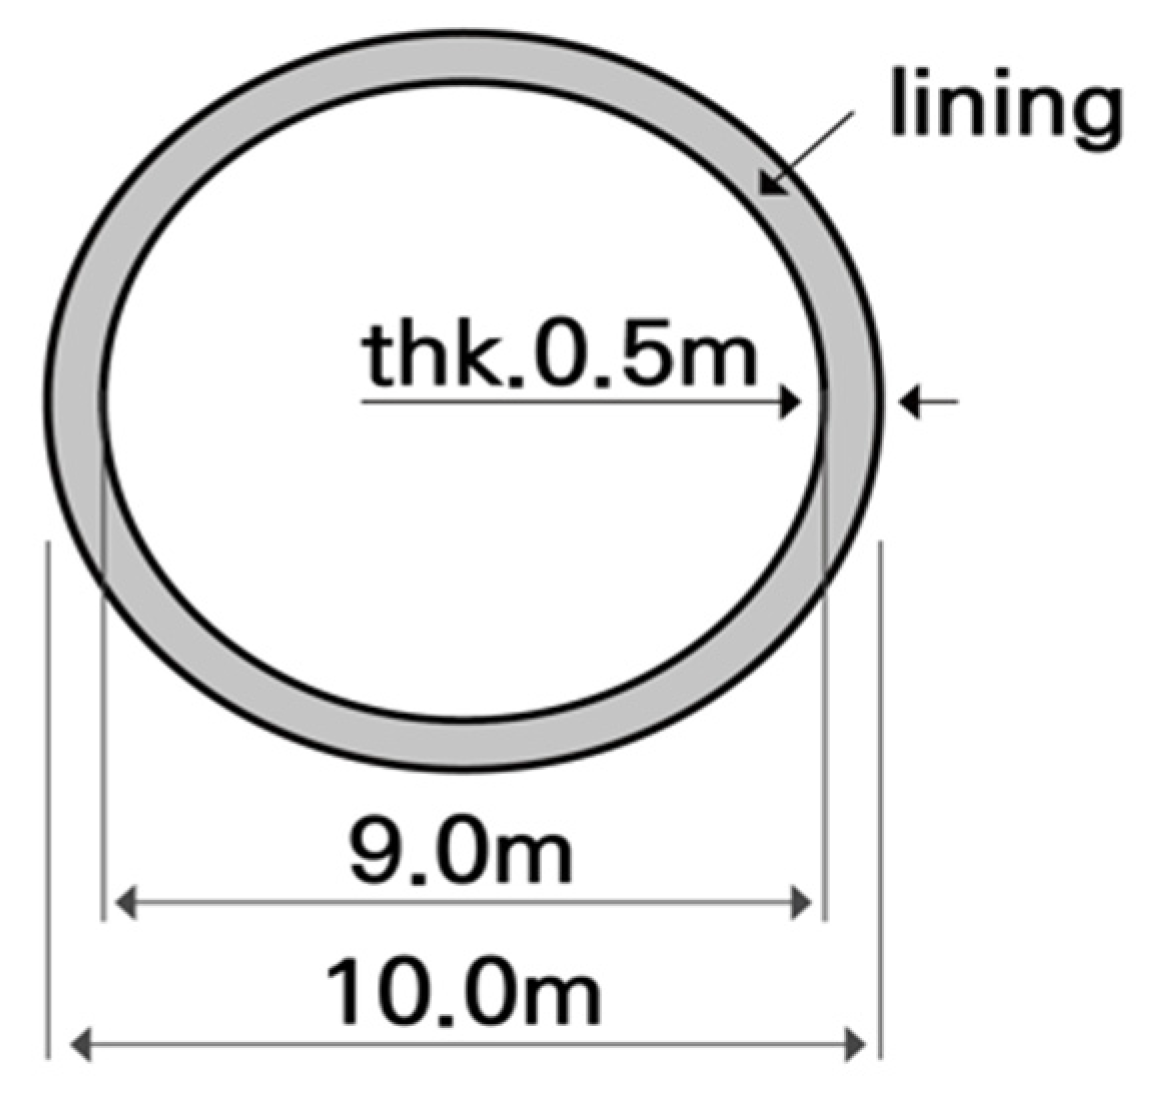
Figure 1. Schematic drawing of tunnel structure section.
Buildings 15 03304 g001
Figure 2. Dynamic response monitoring points.
Buildings 15 03304 g002
Figure 3. Schematic drawing of numerical analysis cases: (a) Case 1 (hard rock), (b) Case 2 (w/narrow fracture zone), and (c) Case 3 (w/wide fracture zone).
Buildings 15 03304 g003
Figure 4. Input earthquake time history: (a) Hachinohe (long period), (b) Ofunato (short period), (c) artificial, (d) Kobe (medium period).
Buildings 15 03304 g004
Figure 5. Maximum compressive stress distribution in tunnel lining: (a) Case 1—hard rock, (b) Case 2—narrow fracture zone, (c) Case 3—wide fracture zone.
Buildings 15 03304 g005aBuildings 15 03304 g005b
Figure 6. Stress contour plots of the tunnel lining for the Kobe earthquake record (PGA = 0.154 g) under three site conditions: (a) Case 1—hard rock, (b) Case 2—narrow fracture zone, and (c) Case 3—wide fracture zone.
Buildings 15 03304 g006aBuildings 15 03304 g006b
Figure 7. Bending moment time history at point 2: (a) Case 1—hard rock, (b) Case 2—narrow fracture zone, (c) Case 3—wide fracture zone.
Buildings 15 03304 g007aBuildings 15 03304 g007b
Figure 8. Flowchart of seismic fragility curve determination procedure (Kwon et al., [12]).
Buildings 15 03304 g008
Figure 9. Seismic fragility curve for tunnel structure crossing fracture zone.
Buildings 15 03304 g009
Table 1. Numerical analysis condition.
CASESite ConditionSeismic WaveMaximum Amplitude (g)
1Hard rockHachinohe, Ofunato, Artificial, Kobe0.110 g/0.154 g/0.220 g/0.340 g
/0.500 g/0.700 g
2Hard rock w/narrow fracture zone
3Hard rock w/wide fracture zone
Table 2. Material properties.
TypeYoung’s Modulus
(MPa)
Unit Weight
(kN/m3)
Poisson’s RatioFriction Angle
(deg)
Cohesion
(kPa)
Hard rock35,00026.2640.20456000
Fractured zone40020.9720.303050
Lining25,60024000.20--
Table 3. Maximum moment for each analysis case.
Case123
Input Acc.Point123123123
0.110 gHachinohe10.410.410.410.4126.010.511.3129.110.9
Ofuato11.011.011.011.0126.711.011.8130.011.5
Artificial14.314.314.314.3132.013.816.3153.216.6
Kobe11.511.511.59.2127.716.112.8133.512.5
0.154 gHachinohe19.219.219.219.3295.519.420.8301.220.2
Ofuato19.819.819.819.8288.919.821.2294.820.8
Artificial27.127.127.127.1314.926.231.0341.331.5
Kobe12.312.312.320.0297.617.120.7310.020.7
0.220 gHachinohe22.922.922.923.0351.423.124.8358.224.1
Ofuato23.623.623.623.7345.123.725.3352.124.8
Artificial37.137.137.137.1430.935.842.4467.143.0
Kobe23.523.523.523.5401.123.627.6415.926.1
0.340 gHachinohe28.728.728.728.7552.028.437.5585.837.5
Ofuato27.227.227.227.0536.227.131.1567.531.4
Artificial38.938.938.938.6546.938.553.8592.854.6
Kobe28.928.928.928.8541.228.732.1566.532.0
0.500 gHachinohe33.833.833.833.4602.032.936.5634.436.3
Ofuato32.532.532.531.1574.330.933.4608.133.8
Artificial46.146.146.144.6611.044.347.6667.848.3
Kobe34.934.934.934.1575.733.837.5608.437.8
0.700 gHachinohe47.947.947.947.5672.847.251.3711.450.6
Ofuato51.751.751.751.0614.450.954.4650.654.3
Artificial63.463.463.462.6692.462.466.5744.565.7
Kobe40.540.540.537.5660.037.444.2676.940.8
Table 4. Damage index for each analysis case.
Case123
Input Acc.Point123123123
0.110 gHachinohe0.030.030.030.030.370.030.030.380.03
Ofuato0.030.030.030.030.380.030.040.390.03
Artificial0.040.040.040.040.390.040.050.450.05
Kobe0.030.030.030.030.380.050.040.400.04
0.154 gHachinohe0.060.060.060.060.880.060.060.890.06
Ofuato0.060.060.060.060.860.060.060.870.06
Artificial0.080.080.080.080.930.080.091.010.09
Kobe0.040.040.040.060.880.050.060.920.06
0.220 gHachinohe0.070.070.070.071.040.070.071.060.07
Ofuato0.070.070.070.071.020.070.081.040.07
Artificial0.110.110.110.111.280.110.131.380.13
Kobe0.070.070.070.071.190.070.081.230.08
0.340 gHachinohe0.090.090.090.091.640.080.111.740.11
Ofuato0.080.080.080.081.590.080.091.680.09
Artificial0.120.120.120.111.620.110.161.760.16
Kobe0.090.090.090.091.600.090.101.680.10
0.500 gHachinohe0.100.100.100.101.780.100.111.880.11
Ofuato0.100.100.100.091.700.090.101.800.10
Artificial0.140.140.140.131.810.130.141.980.14
Kobe0.100.100.100.101.710.100.111.800.11
0.700 gHachinohe0.140.140.140.141.990.140.152.110.15
Ofuato0.150.150.150.151.820.150.161.930.16
Artificial0.190.190.190.192.050.190.202.210.20
Kobe0.120.120.120.111.960.110.132.010.12
Table 5. Damage state according to damage index (Argyroudis S and Pitilakis K [14]).
Damage StateDamage Index
NoneDI < 1.0
Minor1.0 < DI < 1.2
Moderate1.2 < DI < 2.0
Extensive2.0 < DI
Table 6. Damage state for each analysis case.
Input Acc.Input motionCase 1Case 2Case 3
0.110 gHachinoheNoneNoneNone
OfuatoNoneNoneNone
ArtificialNoneNoneNone
KobeNoneNoneNone
0.154 gHachinoheNoneNoneNone
OfuatoNoneNoneNone
ArtificialNoneNoneMinor
KobeNoneNoneNone
0.220 gHachinoheNoneMinorMinor
OfuatoNoneMinorMinor
ArtificialNoneModerateModerate
KobeNoneMinorModerate
0.340 gHachinoheNoneModerateModerate
OfuatoNoneModerateModerate
ArtificialNoneModerateModerate
KobeNoneModerateModerate
0.500 gHachinoheNoneModerateModerate
OfuatoNoneModerateModerate
ArtificialNoneModerateModerate
KobeNoneModerateModerate
0.700 gHachinoheNoneModerateExtensive
OfuatoNoneModerateExtensive
ArtificialNoneExtensiveExtensive
KobeNoneModerateExtensive
Table 7. Fragility curve parameters.
Damage StateMedian (μ)Standard Deviation (β)
Minor0.2890.519
Moderate0.5780.609
Extensive0.910.5
Disclaimer/Publisher’s Note: The statements, opinions and data contained in all publications are solely those of the individual author(s) and contributor(s) and not of MDPI and/or the editor(s). MDPI and/or the editor(s) disclaim responsibility for any injury to people or property resulting from any ideas, methods, instructions or products referred to in the content.