Article

Experimental and Finite Element Investigation of Bond Strength of Earthen Mortar–Brick Interfaces in Historic Masonry Structures

1
School of Civil Engineering, Xi’an University of Architecture & Technology, Xi’an 710055, China
2
Key Lab of Structural Engineering and Earthquake Resistance, Ministry of Education (XAUAT), Xi’an 710055, China
3
XAUAT Engineering Technology Co., Ltd., Xi’an 710055, China
*
Author to whom correspondence should be addressed.
Buildings 2025, 15(18), 3278; https://doi.org/10.3390/buildings15183278
Submission received: 12 August 2025 / Revised: 5 September 2025 / Accepted: 9 September 2025 / Published: 11 September 2025
(This article belongs to the Special Issue Structural Assessment and Strengthening of Masonry Structures)

Abstract

This study aims to investigate the bond behavior at earthen mortar–brick interfaces in historic masonry structures. To that end, a series of combined compression–shear tests were conducted to systematically assess the influence of varying water–soil ratios and applied lateral compression on interfacial bond behavior. A fully decoupled microscopic finite element (FE) framework employing cohesive elements was developed to simulate the bond strength of earthen mortar–brick interfaces and validated using Spearman correlation analysis. The results indicate that increasing lateral compression markedly enhances both the peak displacement and shear strength, although it also reduces inter-specimen correlation by 18%. Notably, even under high lateral compression, the finite element predictions maintained a strong correlation with experimental data (R = 0.86), with a maximum deviation of less than 5%, demonstrating the model’s capability to accurately simulate the bond behavior of loess earthen mortar in masonry. These findings provide essential data and a robust computational framework for the preventive conservation of historic masonry structures.

1. Introduction

Historic buildings serve as vital vessels of cultural heritage: they not only embody the aesthetic vision and craftsmanship of past societies but also underscore the continuity of a nation’s cultural identity. Among the various materials employed in these enduring edifices, brick masonry has been widely adopted due to its superior mechanical properties, its construction efficiency, and the ready availability of raw materials [1,2,3,4,5]. However, over the centuries, historic brick masonry increasingly suffers from weathering, crack propagation, and interfacial debonding, all of which critically undermine its structural safety and long-term durability [6,7,8,9,10].
To date, numerous studies have investigated masonry bond performance. For instance, Sarangapani et al. [11] experimentally demonstrated that the bond strength between mortar and brick is relatively low, and that failure typically occurs by joint debonding. Moreover, the strength of the bond interface is governed by intrinsic factors such as interface roughness [12], mortar composition [13,14,15,16], masonry unit characteristics [17], unit moisture content [18,19,20,21,22], and joint geometry [23]. In addition, extrinsic variables—including loading regime, environmental fluctuations, and overall structural configuration—further influence interfacial behavior [24,25]. Lourenço et al. [26] studied the Church of Kuño Tambo, where loess was used as the bonding material, and conducted an assessment and reinforcement of it. Notably, prior to the Ming Dynasty in China, especially across the Northwest and Central Plains regions, loess-based mud grout was commonly used as the bonding material for ancient brick masonry [27]. As shown in the Qingyang Ningshou Temple Pagoda (Figure 1a) and the Xi’an Daqin Temple Pagoda (Figure 1b), the entire structure is built with traditional blue-gray fired brick and loess earthen mortar. However, most existing research has concentrated on other mortar types, thereby limiting direct applicability to historic masonry systems that employ loess earthen mortar.
Numerical models developed in recent years to simulate masonry behavior can be broadly classified into macroscopic and microscopic approaches. Macroscopic models treat the masonry assemblage as a homogeneous continuum, thereby neglecting the bond interaction between units and mortar [28,29,30]. Consequently, the choice of the masonry constitutive law becomes the critical determinant of a macroscopic model’s accuracy. Although such models can capture the global response, they typically fail to reproduce localized failure modes—most notably interface cracking. By contrast, simplified microscopic models represent each masonry unit together with half its surrounding mortar thickness as a single element, employing zero-thickness interface elements to simulate contact behavior [31,32]. While this approach improves the representation of debonding mechanisms, it still abstracts away much of the mortar geometry.
Fully microscopic models are considered the most precise, since they explicitly mesh brick units, mortar joints, and the interfaces between them with minimal simplification [33,34,35]. By assigning distinct constitutive laws to each component, these models can accurately reproduce all pertinent failure modes. The present study adopts a fully microscopic finite element (FE) framework to precisely simulate the bond–slip behavior of loess–mud grout interfaces in historic brick masonry.
In light of the foregoing, and following the “Test Methods for Fundamental Mechanical Properties of Masonry” [36], specimens of historic brick masonry incorporating loess earthen mortar were fabricated under varying mortar strengths and lateral compression levels. A series of combined compression–shear tests were then performed to systematically investigate both bond strength and slip behavior. Cohesive contact elements were employed to simulate the interface’s shear response, thereby elucidating the shear behavior of the loess earthen mortar interface. Model accuracy was confirmed through direct comparison with experimental measurements. The findings furnish a theoretical foundation and technical support for seismic assessment and retrofitting of similar historic masonry structures.

2. Material Test

2.1. Test of Loess Earthen Mortar

In accordance with the Standard Test Methods for Basic Properties of Construction Mortars (JGJ/T 70-2009) [37], loess earthen mortars were prepared at water–soil ratios of 0.25, 0.30, and 0.35, with six cubic specimens per ratio. The loess was sourced from the clay deposits near the Daqin Temple Pagoda. This location was carefully selected because the Daqin Temple Pagoda is a typical example of Tang Dynasty brick and stone architecture in Northwest China, and its original building materials—including mortar made from loess—reflect the traditional masonry techniques widely used in the region. In this study, locally sourced loess was used to ensure that experimental results accurately reflect the actual mechanical properties of heritage masonry structures in similar historical buildings. The loess was first dried. Subsequently, deionized water was added in batches under continuous stirring to ensure the mortar’s uniformity, while accounting for the loess’s specific rheological properties.
In accordance with the requirements specified in the Standard for Test Methods of Basic Properties of Construction Mortar (JGJ/T 70-2009), a 70.7 mm × 70.7 mm × 70.7 mm cubic mold was selected for the experiment. The molds were then placed on a vibration table until no further air bubbles emerged. Subsequently, each mold was covered with plastic film for 24 h, followed by one week of curing at room temperature. Afterward, the test specimen was removed from the mold and placed in a curing chamber for 28 days of normal-temperature curing.
Upon completion of curing, specimen dimensions and masses were recorded to calculate bulk density (see Table 1). Table 1 also shows the compressive strength and modulus of elasticity. The Poisson’s ratios of the brick and the mortar are, respectively, 0.21 and 0.27 according to relative references. Finally, compressive strength tests were conducted on each cube using a WE-30 universal testing machine at a constant loading rate of 1 mm/min.

2.2. Test of Traditional Blue-Gray Fired Brick

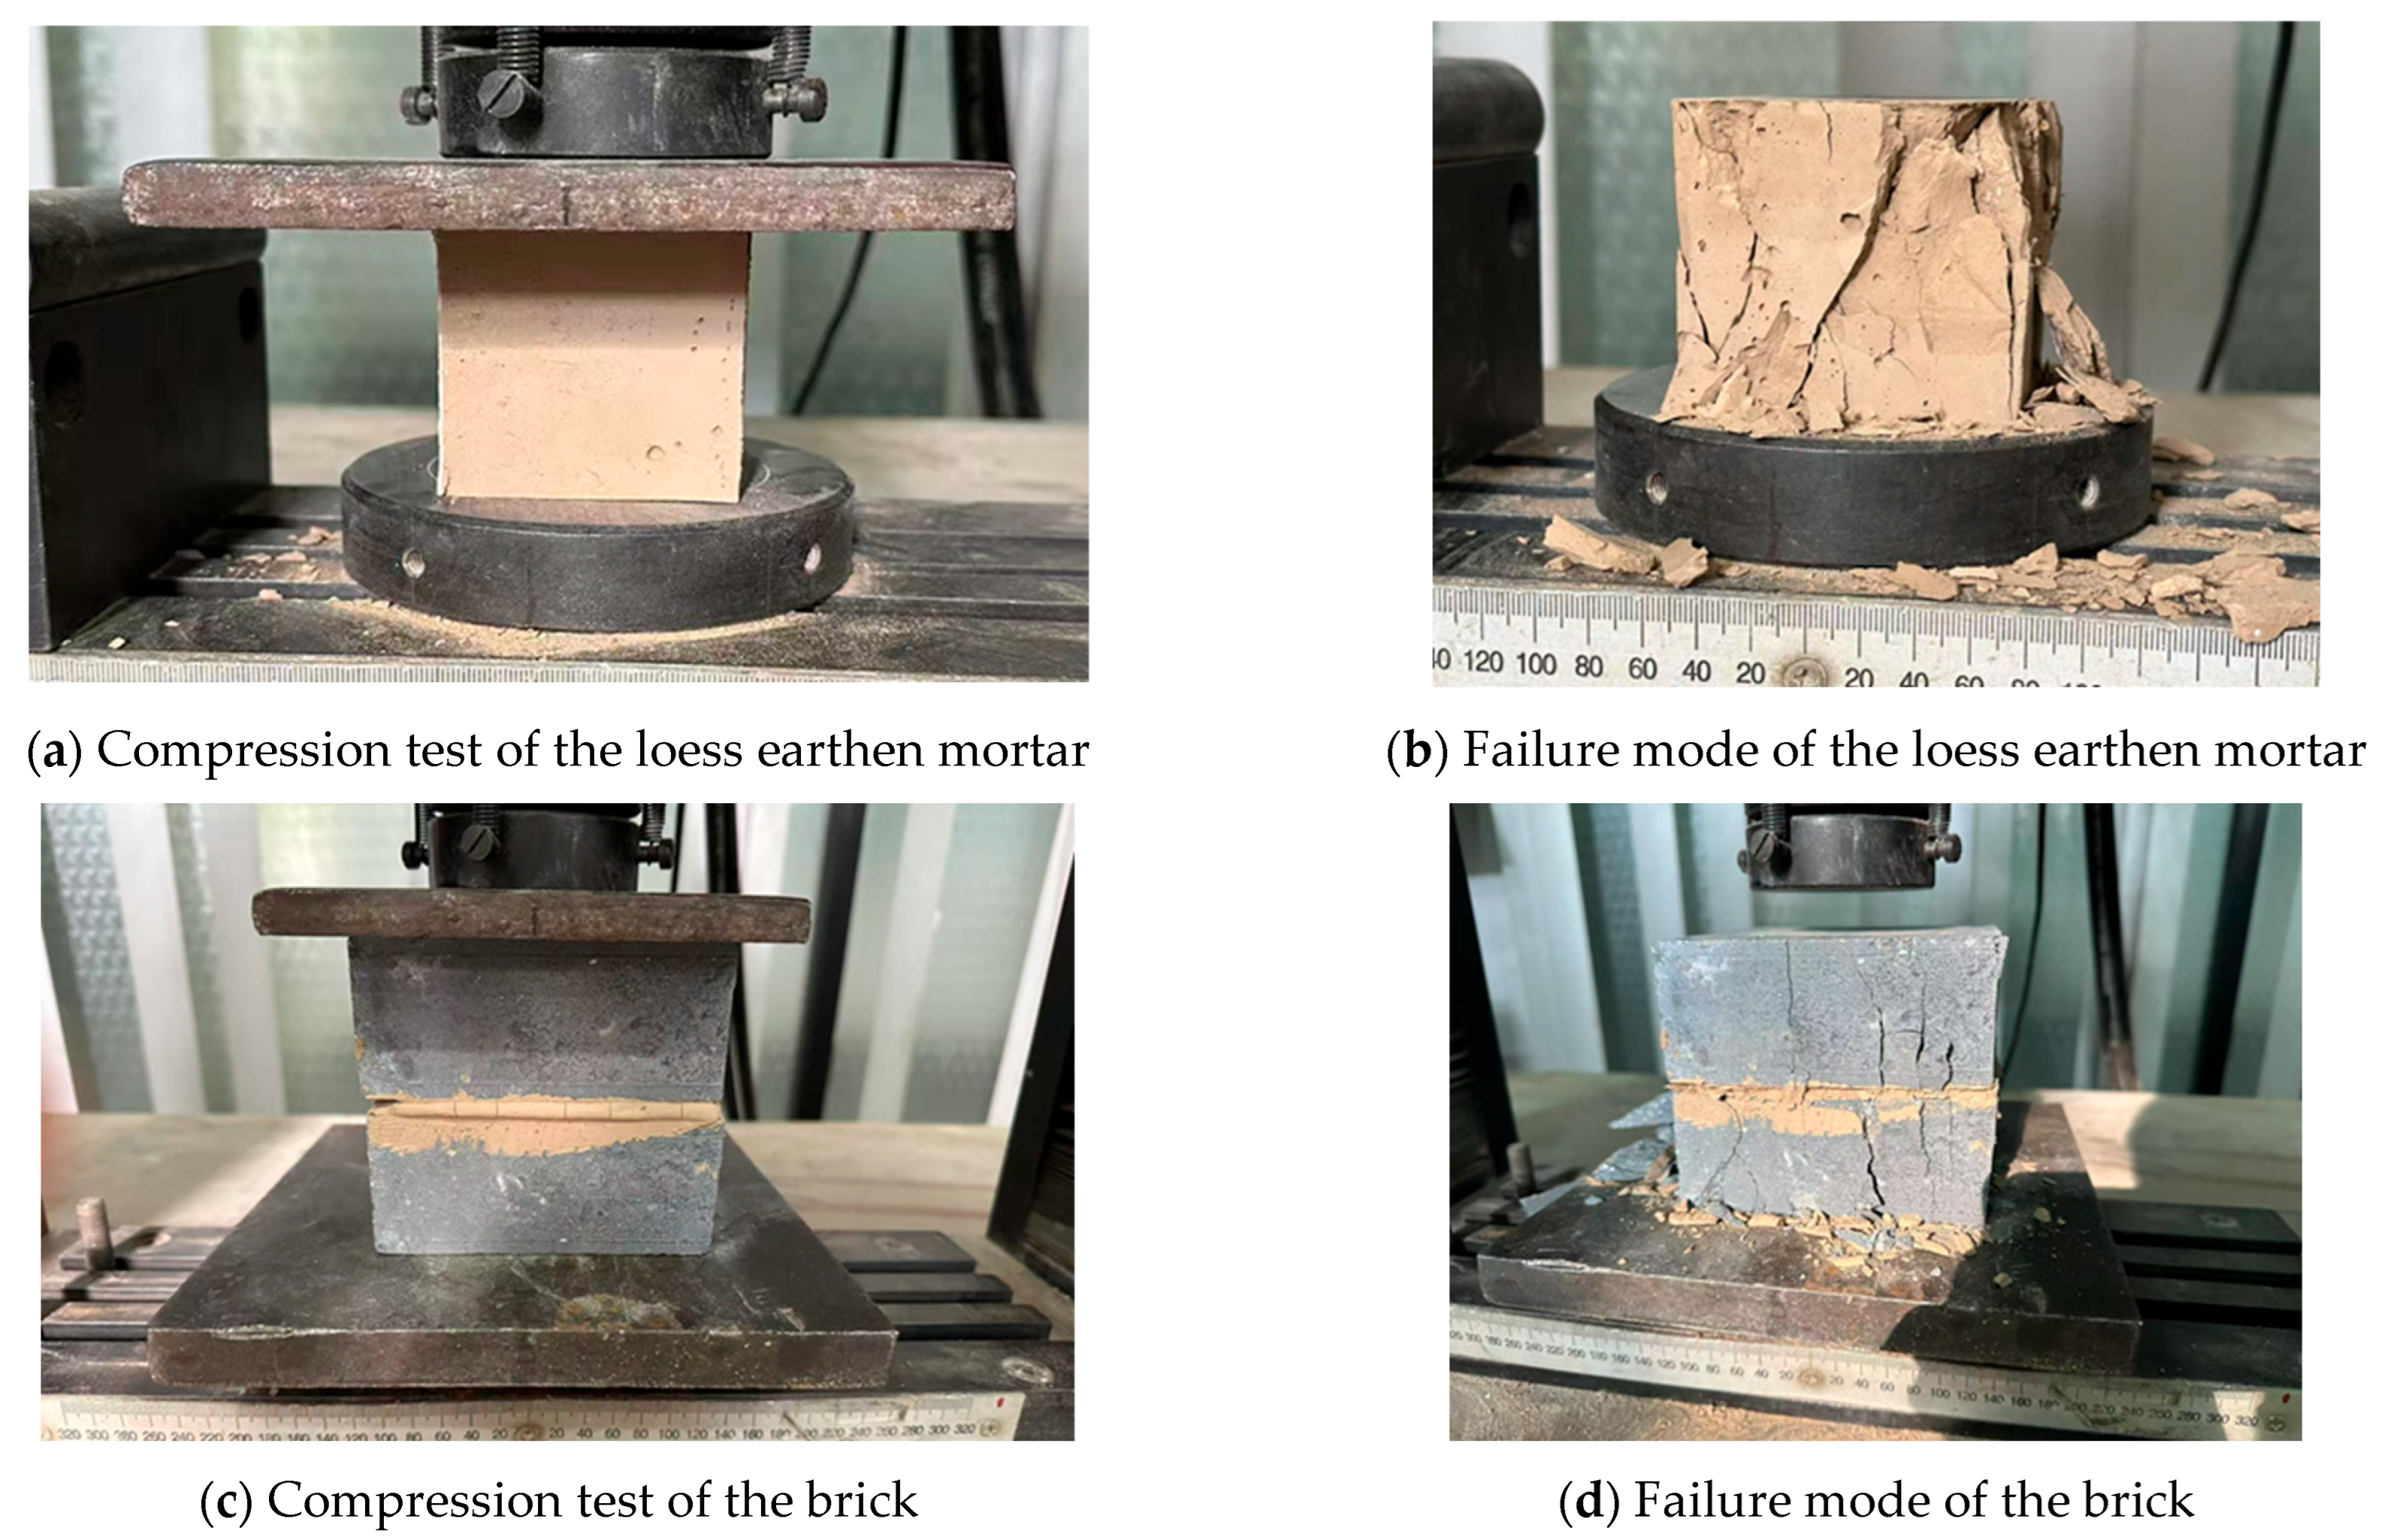
Due to the particularity of historic buildings, it is difficult to obtain ancient bricks. Therefore, in this study, traditional blue-gray fired bricks with the same manufacturing process were selected. Twenty bricks were randomly sampled, their surface dust was cleaned, and they were placed in an oven to dry to a constant weight, after which their bulk density was measured. A water absorption test was conducted on the traditional blue-gray fired brick, and its water absorption rate was measured to be 16.78%.
In accordance with the “Test Methods for Masonry Bricks” (GB/T 2542–2012) [38], six of these bricks were randomly split at mid-height. The specimen consists of two bricks with loess earthen mortar in between. The resulting halves were then reversed, overlapped over a minimum interface length of 100 mm, and bonded using the loess–mud grout. These bonded specimens were cured together with the grout cubes for 30 days.
Finally, compressive strength tests were performed on a WE-30 universal testing machine at a loading rate of 0.5 mm/min. The test specimens and failure modes are depicted in Figure 2, and the corresponding results are presented in Table 1.

3. Experimental Test

3.1. Specimen Configuration and Fabrication

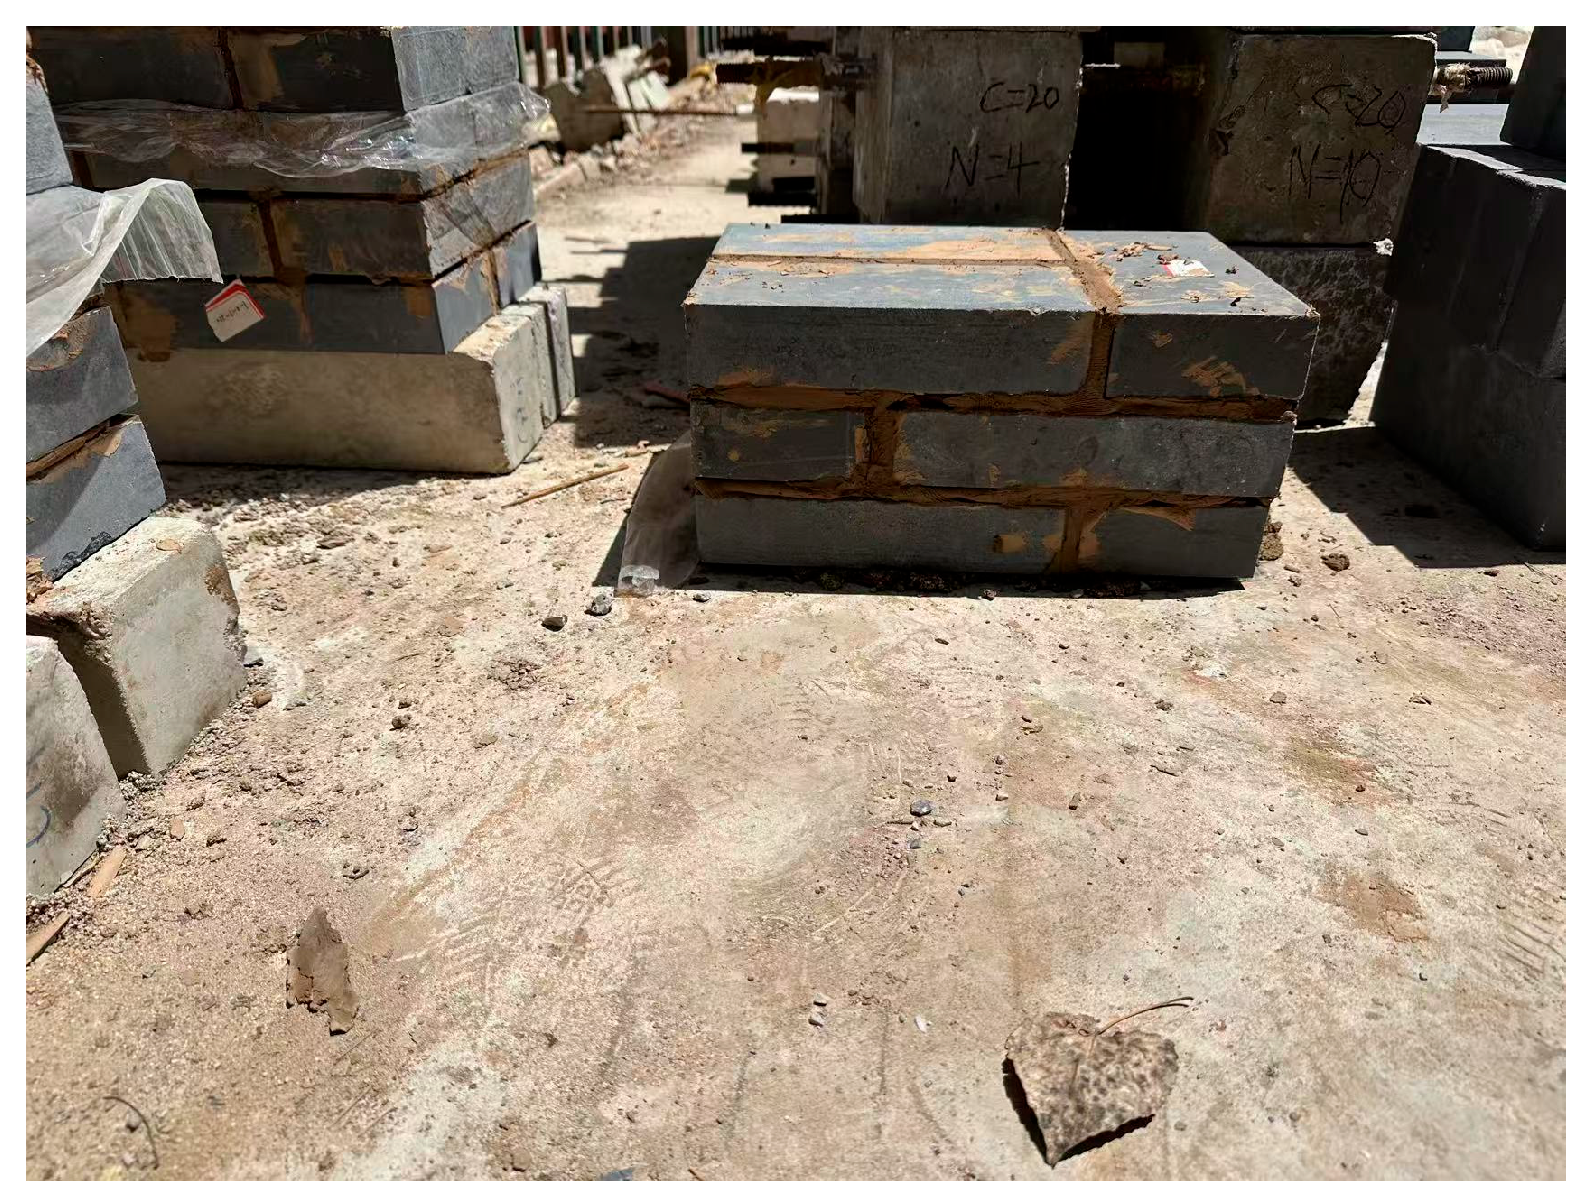
This experimental program considered the effects of two key parameters on the bond performance at the loess earthen mortar–brick interface: (a) the water–soil ratio of the loess earthen mortar (0.25, 0.30, and 0.35); and (b) lateral compression levels (0.2 MPa, 0.4 MPa, and 0.6 MPa). A total of 21 specimens were designed, which were divided into 7 groups (see Figure 3) and which conformed to the “Test Methods for Fundamental Mechanical Properties of Masonry” [36]. The dimensions of the brick are 240 × 115 × 50 (unit: mm), and the thickness of the mortar joint is 10 mm. Due to the preciousness of historic buildings, it is difficult to use the original bricks from ancient pagodas themselves. Therefore, the traditional blue-gray fired bricks selected in this study were fired in strict accordance with traditional production processes, going through eight steps: soil collection, clay refining, molding, air-drying, kiln loading, firing, and kiln quenching (clean water is used for quenching to turn the bricks from red to blue-gray). Traditional blue-gray fired bricks are fired through the following procedures, including being fired in a kiln at a controlled temperature ranging from ambient temperature to 300 °C for a duration of 12 h, ranging from 300 to 900 °C for a duration of 24 h, and ranging from 900 to 1150 °C for a duration of 14 h. The duration of kiln quenching is 2–3 h, and the duration of natural cooling is 3–5 days. In summary, the total firing duration for traditional blue-gray fired bricks ranges from 5 to 7 days. The fundamental parameters of each group are summarized in Table 2.

3.2. Loading Protocol and Instrumentation

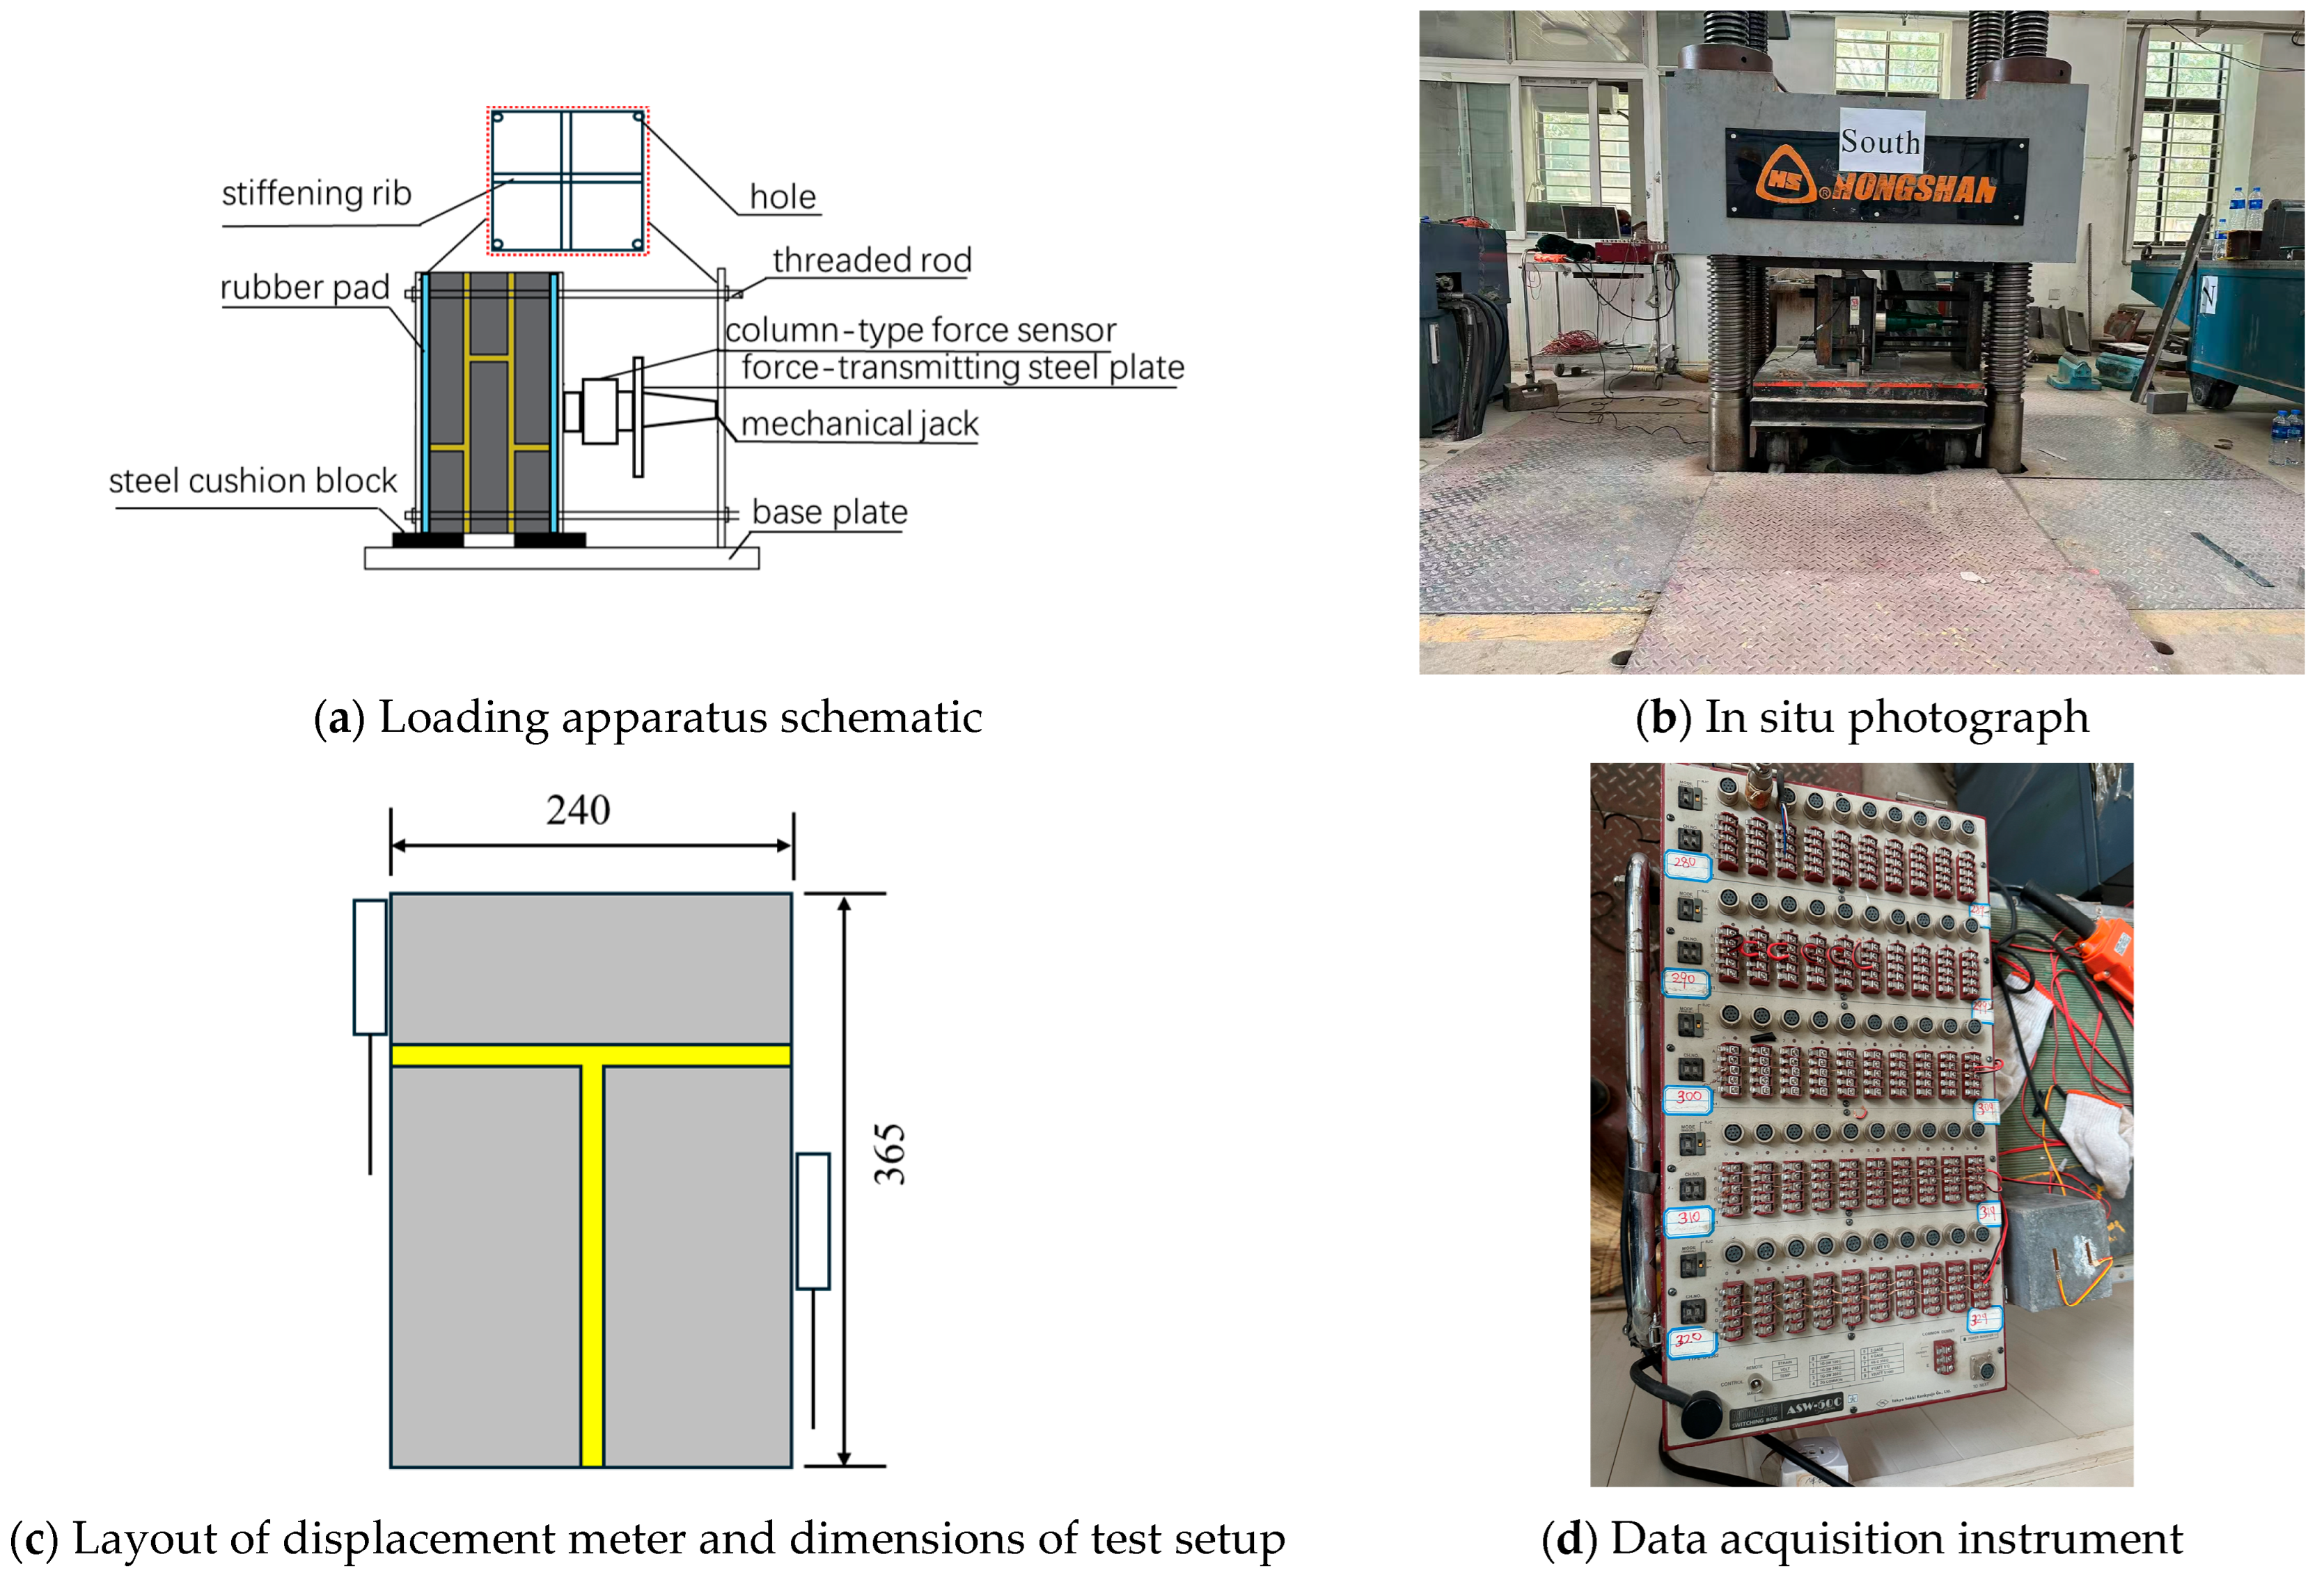
Combined compression–shear tests were performed on a YAW-5000 electro-hydraulic servo test machine. Each loess earthen mortar masonry specimen was placed on the lower platen, with its vertical centerline carefully aligned to the machine’s loading axis to ensure uniform contact. A lateral loading assembly was then mounted atop the lower platen. To avoid pressure decay commonly encountered with hydraulic jacks, a mechanical jack was adopted for lateral loading. Stiffening ribs were welded to the side steel plates to prevent bending under high lateral load, and rubber shims were inserted between the specimen and plates to guarantee intimate contact and even stress distribution (see Figure 4a).
Once the prescribed lateral compression was applied, the combined compression–shear test commenced. Vertical loading was applied continuously and uniformly at a displacement rate of 0.3 mm/min to eliminate impact effects. The test was terminated when the actuator displacement indicated contact between the central brick and the lower platen; at that point, the peak load and failure mode were recorded (see Figure 4b).
Shear loads were recorded automatically by the servo control system. To correct for any compressive deformation within the joint, linear variable differential transformers (LVDTs) were affixed to the top and bottom faces of the second bricks, as illustrated in Figure 4c. Displacement signals were acquired via a TDS-602 static data acquisition unit (see Figure 4d).

4. Test Results and Analysis

4.1. Observed Failure Modes and Mechanisms

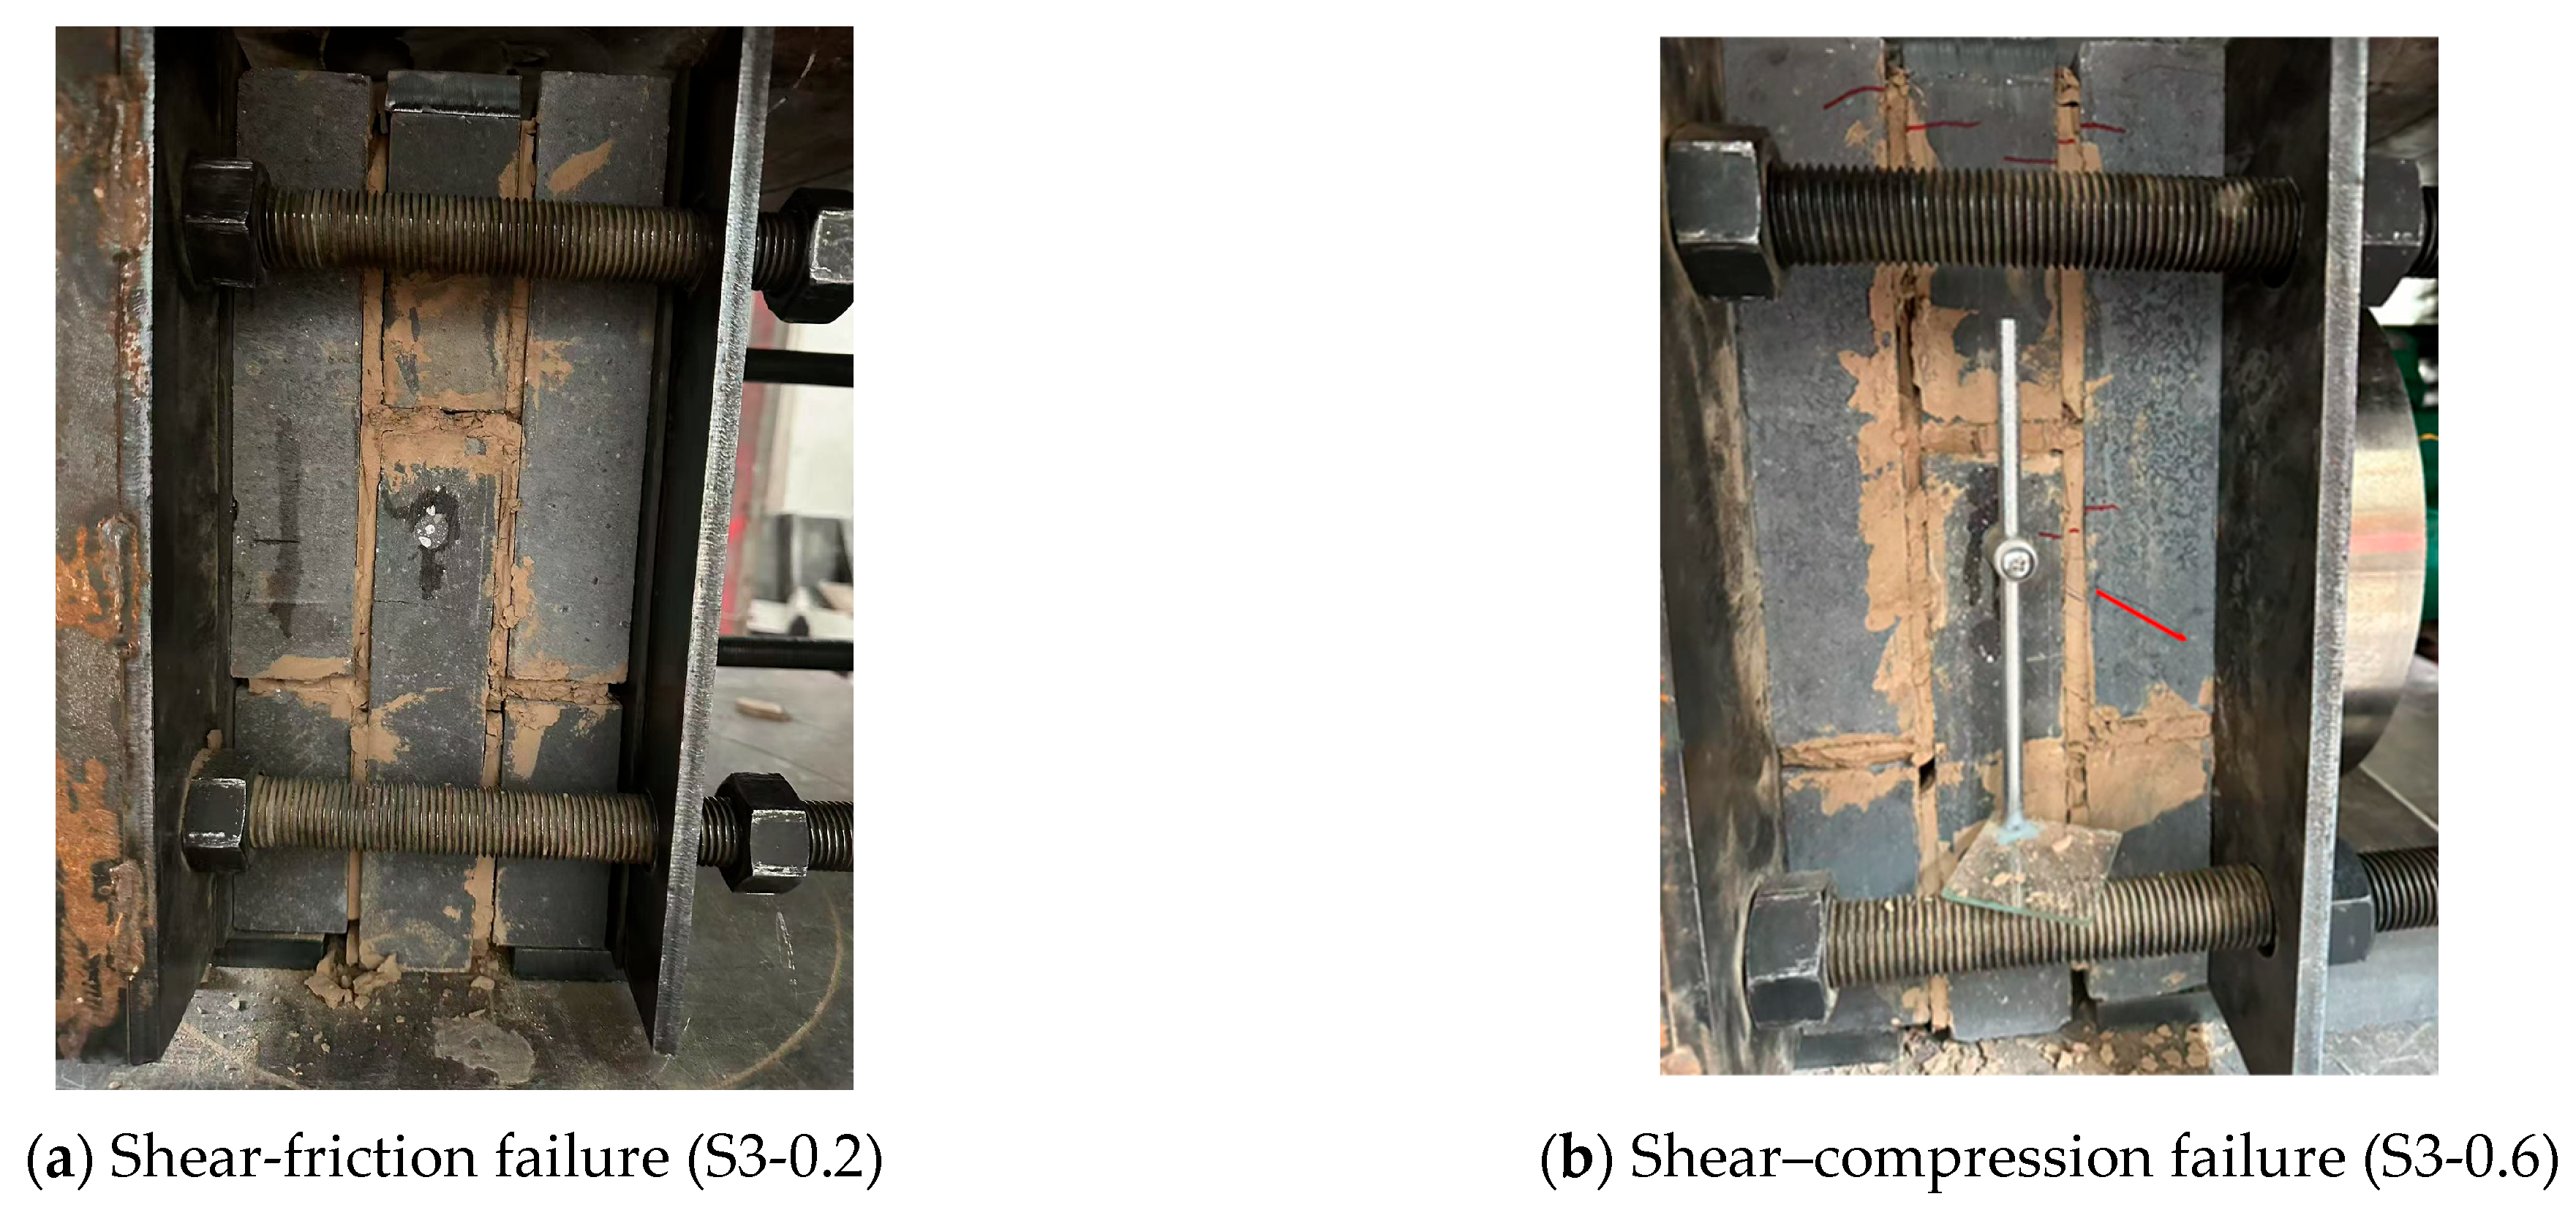
Given the use of loess earthen mortar and relatively low applied lateral compress, only shear-friction and combined shear–compression failures were observed. Under lateral compressions of 0.2 MPa and 0.4 MPa, specimens exhibited shear-friction damage localized at the loess earthen mortar–brick interface (Figure 5a). During the initial loading phase, no visible cracks appeared; however, as shear force increased, cracks first developed just below the vertical mortar joints on either side of the central brick. These cracks then propagated upward through the joint. Due to the confining effect of the lateral compression, specimens did not undergo catastrophic collapse—instead, continued loading caused the shear resistance to decline gradually and tended to remain constant.
At a lateral compression of 0.6 MPa, specimens subjected to combined shear–compression loading exhibited a markedly different failure mode. In the initial loading phase, no visible surface cracks were observed, although faint cracking noises emanated from within. As the load increased, cracks first developed above the vertical mortar joints on either side of the central brick and then propagated downward. With further elevation of shear force, oblique cracks formed above one mortar joint at each end of the specimen, advancing at an angle of approximately 45°. Once these shear cracks reached the specimen’s mid-height, their downward progression halted, and the compression face of the central brick began to crush. Simultaneously, the oblique cracks at the tops of the end bricks rapidly propagated, culminating in mixed-mode failure (Figure 5b).

4.2. Interfacial Shear Strength

Shear strength was selected as the principal experimental metric to systematically evaluate the effects of varying water–soil ratios and lateral compressions on the bond performance of loess earthen mortar in historic brick masonry. To ensure data reliability and representativeness, each test condition was replicated three times, and the mean shear strength across the triplicate specimens was taken as the definitive value. Based on the experimental results from these loess earthen mortar–brick shear tests, the shear strength (τ) was calculated using Equation (1) and reported to a precision of 0.001 MPa. The average shear strengths for all specimen groups are summarized in Table 3.
τ u = P u A
In the formula, Pu is the load in the load–slip curve, kN; A is the area of a single shear plane of the specimen, with a contact surface with a size of 365 mm × 240 mm.
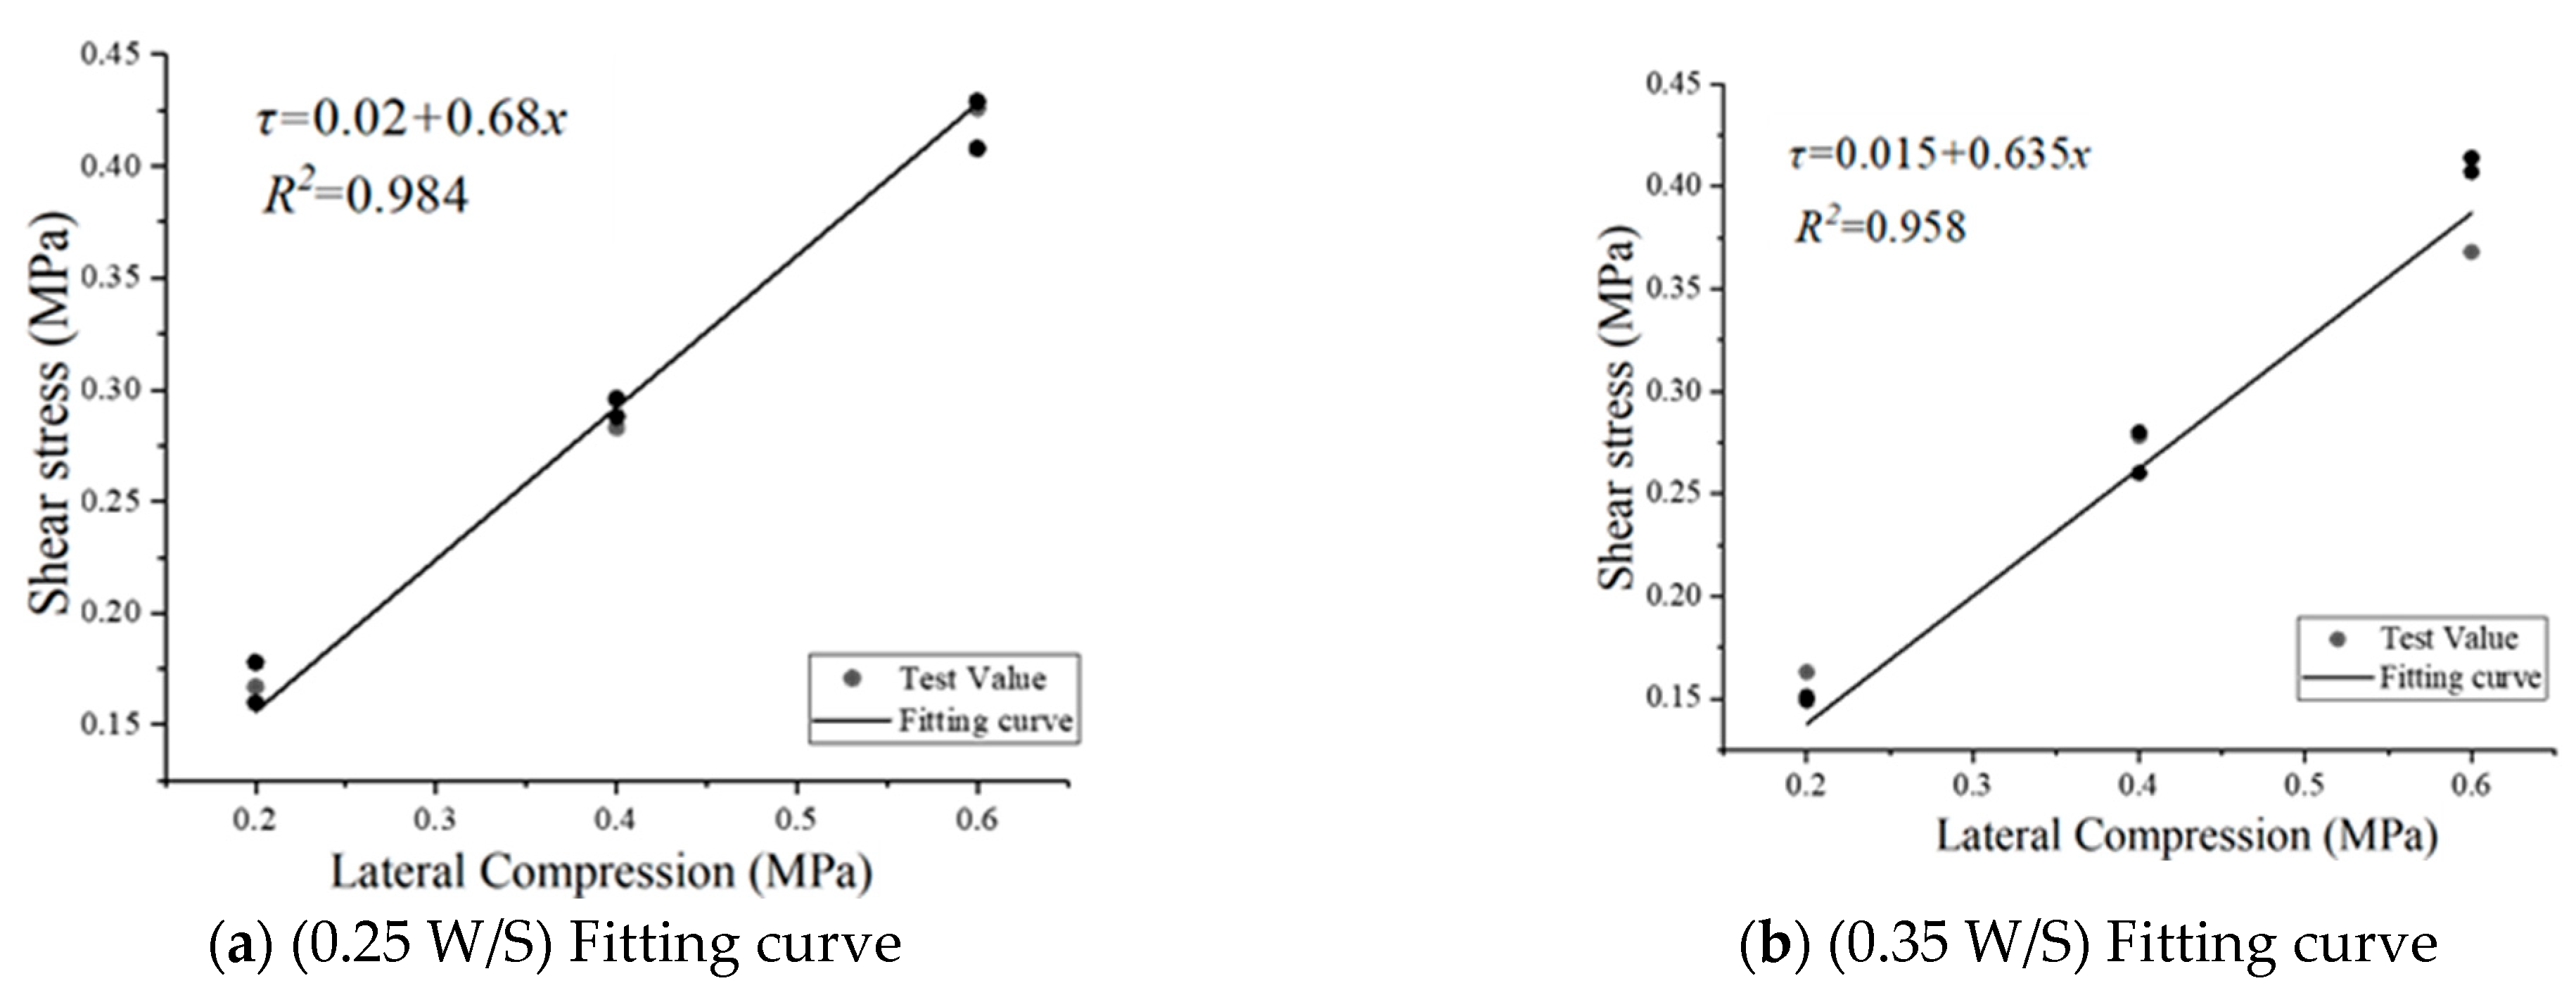
The maximum shear stress increases with the increase in normal stress, which is consistent with Coulomb’s theory. Through regression fitting, the cohesion (c) and internal friction coefficient (μ) of the specimens with water–soil ratios of 0.25 and 0.35 were obtained. The regression curves are shown in Figure 6.
From Table 3, it can be observed that lateral compression exerts a significant influence on the interfacial mechanical response. For all water–soil ratios, increasing the applied lateral compression from 0.2 MPa to 0.6 MPa markedly enhances the interface shear stiffness, initial damage displacement, peak load, and shear strength. In particular, the initial damage displacement is postponed from 2.115 mm to 3.779 mm, indicating that higher confinement effectively delays the onset of interfacial degradation and promotes a more ductile failure response.
Regarding the effect of the water–soil ratio, under constant lateral compression, higher ratios (0.25 to 0.35) lead to reductions in shear stiffness, peak load, and shear strength. For example, at a lateral compression of 0.2 MPa, the shear strength decreases from 0.167 MPa to 0.152 MPa, representing a decline of approximately 9%. This trend can be attributed to the reduction in matrix strength and the weakening of mechanical interlocking at the interface when the loess earthen mortar exhibits higher moisture content.

4.3. Analysis of Test Data

Figure 7 shows the load–displacement curves of each specimen with a water–soil ratio of 0.35 under different lateral compressions.
As illustrated in Figure 7, the shear load rapidly rises with increasing tangential displacement during the initial phase; once the peak shear load is reached, the shear stress begins to decline. In the later stage of the test, the shear load stabilizes and is sustained entirely by frictional resistance, during which displacement increases at a noticeably higher rate than the shear load.
Following the methodology of [39], the slope of the shear-stress versus tangential-displacement curve is defined as the interface shear stiffness, and the displacement corresponding to the peak shear stress is taken as the initial damage displacement. These parameters are presented in Table 3.
Both Figure 7 and Table 2 show that the bond performance of the masonry decreases as the water–soil ratio increases. Conversely, with higher lateral compression levels, the initial damage displacement is postponed, while both the interface shear stiffness and peak shear strength increase. This behavior is consistent with the findings of [40], indicating that elevated lateral compression not only enhances interface shear strength but also delays the onset of initial damage displacement.
Under low lateral confinement, once the interface reaches its peak bond strength, cracks rapidly coalesce and propagate, resulting in extensive debonding that manifests as pronounced brittle failure. The residual shear resistance is then carried primarily by intact masonry fragments or the shear-bond action of micro-asperities on the interface. However, as lateral compression increases, crack initiation still occurs at the same stress threshold, but the elevated confinement forces the crack faces into tighter contact, impeding full crack opening and thus concentrating damage within a smaller zone. Moreover, crack closure and the compaction of surface asperities reengage mechanical interlock, allowing the interface to sustain additional loading [41].

5. FE Numerical Simulation

5.1. Model Overview

As illustrated in Figure 8, the simplified discrete model treats each brick together with half the surrounding mortar thickness as a single composite unit, with cohesive contact elements employed to capture cracking and slip behavior. By contrast, the fully discrete model explicitly represents brick elements, mortar elements, and the zero-thickness cohesive interfaces between them, thereby providing a more detailed simulation of interfacial debonding and post-peak slip.
Specifically, eight-node linear reduced integration solid elements (C3D8R) were used to discretize both the traditional blue-gray fired brick and loess earthen mortar volumes, while zero-thickness cohesive elements were inserted along the interface mesh. To ensure consistency with the experimental boundary conditions, three steel bearing plates were modeled as rigid bodies and tied to corresponding reference points. The lower reference point was fully fixed, whereas the upper reference point was subjected to a controlled displacement of 15 mm at a rate of 0.3 mm/min—identical to the laboratory loading protocol. The overall model configuration is depicted in Figure 9.
ABAQUS Version 2020 (Johnston, RI, USA) was selected as the software for numerical analysis, primarily because its Concrete Damaged Plasticity (CDP) model is well-suited to characterize the inelastic behavior of brittle materials. Indeed, several investigators [42,43] have successfully applied the CDP formulation to both masonry units and mortar. Consequently, this study adopts the CDP model for traditional blue-gray fired brick and loess earthen mortar. The plasticity parameters employed in the CDP model are listed in Table 4. The densities for the historic bricks and the mortar are taken from Section 2.1 and Section 2.2.
Yang [44] proposed a masonry compression constitutive model based on the strength distribution characteristics of masonry units at the microlevel, which accurately reflects the deformation characteristics of masonry structures. Therefore, this constitutive model is adopted for the uniaxial compression constitutive model of traditional blue-gray fired brick in this paper, as shown in Equation (2), where η is taken as 1.633. The tensile constitutive model for traditional blue-gray fired brick adopts the modified masonry tensile constitutive model proposed by Zheng [45] based on the tensile constitutive model for concrete, as shown in Equation (3).
σ b f b = η 1 + η 1 ε b / ε b 0 η / ( η 1 ) ε b ε b 0
σ t f t 0 = ε t ε t 0 0 ε t / ε t 0 1 σ t f t 0 = ε t / ε t 0 2 ε t / ε t 0 1 1.7 + ε t / ε t 0 ε t / ε t 0 > 1
In the equation, fb is the compressive strength of the brick, and εb0 represents the corresponding strain; ft0 is the peak tensile strength of the brick, and εt0 represents the corresponding strain.
The constitutive model for compressed loess earthen mortar adopts the constitutive model for compressed mortar proposed by Yang [46], as shown in Equation (4). The constitutive model for tensile stress adopts the constitutive model for tensile stress in mortar proposed by Guo [47], as shown in Equation (5).
σ m f m = 1.6 ε m / ε m 0 0.2 ε m / ε m 0 2 0.4 ε m / ε m 0 3 0 ε m / ε m 0 1 σ m f m = ε m / ε m 0 11 ε m / ε m 0 1 2 + ε m / ε m 0 ε m / ε m 0 > 1
σ m t f m t = 1.2 ε m t ε m t 0 0.2 ε m t ε m t 0 6 0 ε m t ε m t 0 1 σ m t f m t = ε m t / ε m t 0 2 ε m t / ε m t 0 1 1.7 + ε m t / ε m t 0 ε m t / ε m t 0 > 1
In the equation, fm is the compressive strength of the mortar, and εm0 represents the corresponding strain; fmt is the peak tensile strength of the mortar, and εmt0 represents the corresponding strain.
In the CDP model, damage parameters need to be introduced to define damage behavior under compression and tension. The damage parameters are calculated using the energy equivalence principle [48], as shown in Equation (6).
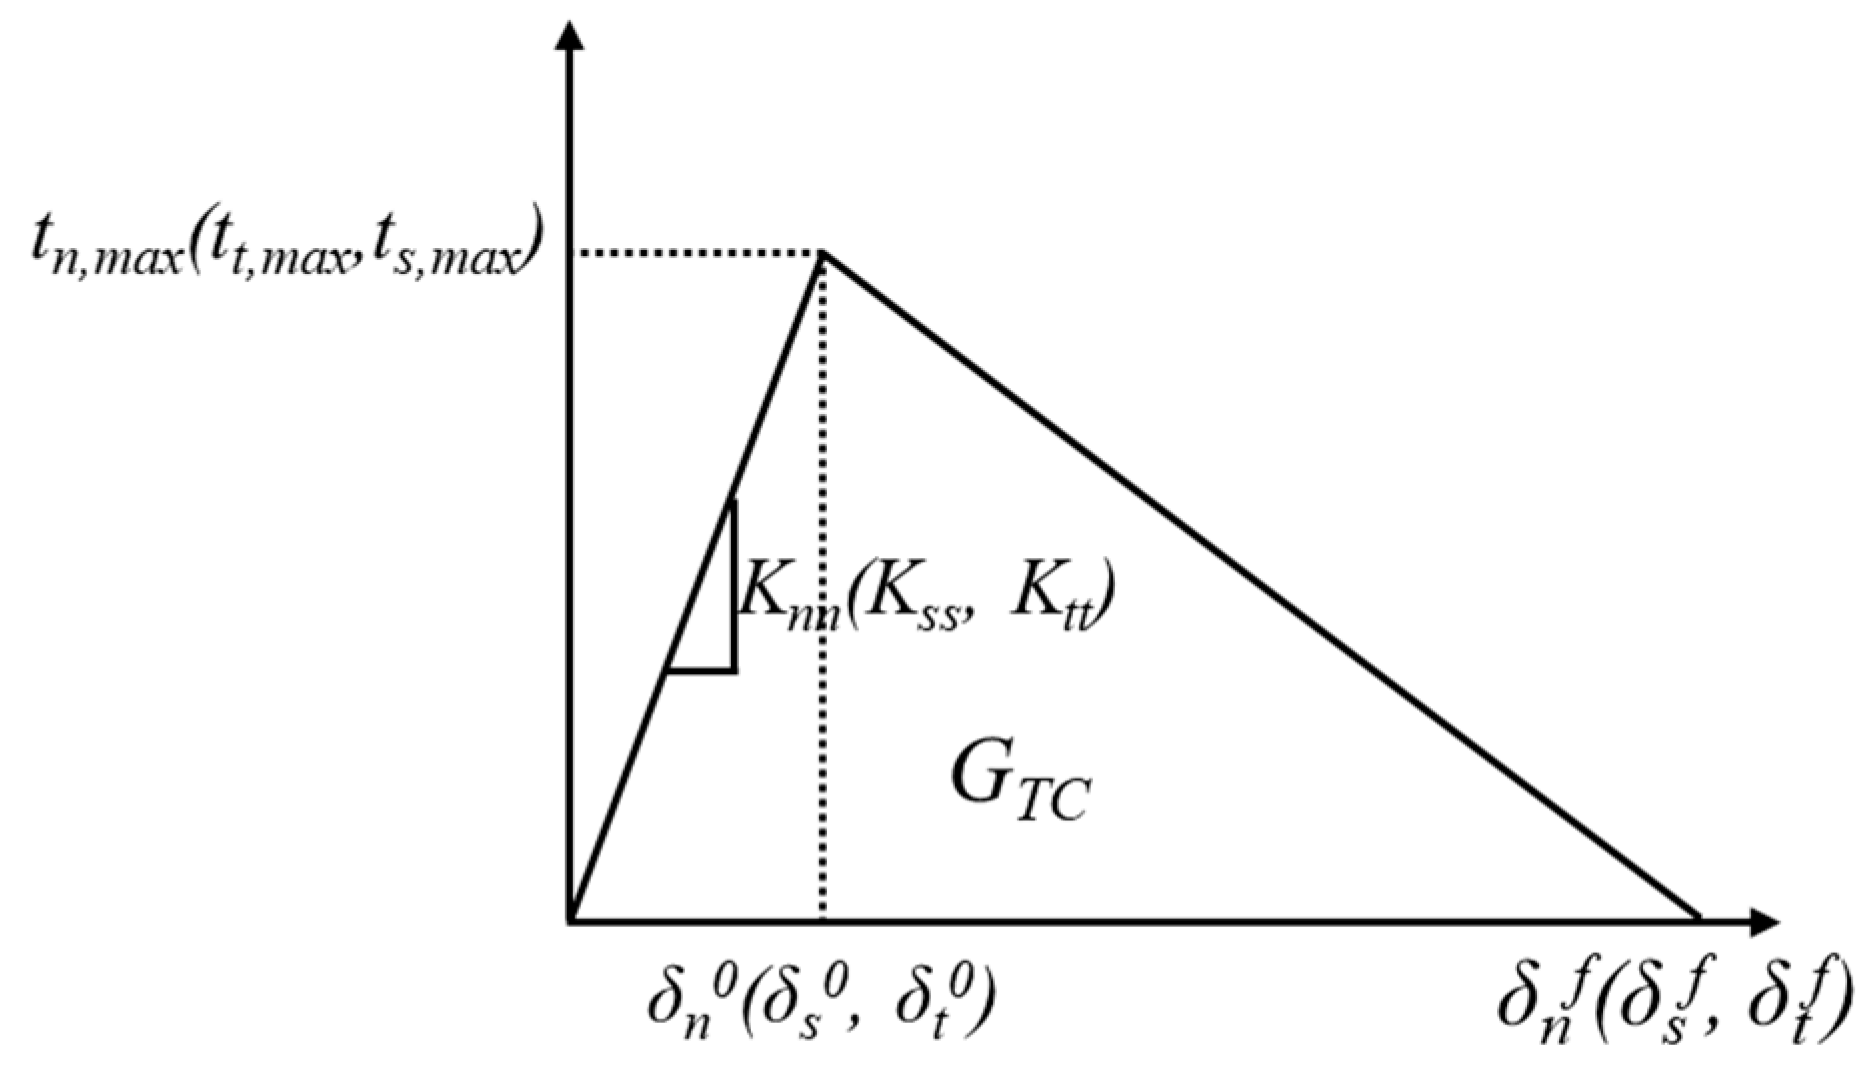
The contact between traditional blue-gray fired brick and loess earthen mortar is modeled using cohesive contact. This model is based on the bilinear traction separation criterion, as shown in Figure 10. Before the separation force reaches the damage criterion, the linear behavior of the contact interface is defined by the elastic stiffness matrix, as shown in Equation (7):
d = 1 σ / E ε
t = t n t s t t = K n n 0 0 0 K s s 0 0 0 K t t δ n δ s δ t = K δ
In the equation, t n , t s , t t represents the separation force in the three directions of the interface, K n n , K s s , K t t represents the corresponding stiffness in the three directions of the interface, and δ n , δ s , δ t represents the displacement in the three directions of the interface.
This paper selects the quadratic stress criterion to define the damage state of the interface. Under multiple loads, this criterion can effectively predict the damage performance of the interface, as shown in the cohesive-zone model n in Equation (8).
t n t n , max 2 + t s t s , max 2 + t t t t , max 2 = 1
In the equation,   represents the Macaulay bracket, which expresses the effect of ignoring the normal fracture energy at the interface. t n , max , t s , max , t t , max represents the maximum tensile stress in three directions.
The fracture energy of masonry interfaces is the integral area under the interface force and displacement curve, which is corrected using the Benzeggagh–Kenane (BK) criterion. The expression is as follows:
G c = G n + G s + G t G n G s + G t G A k
In the equation, G c is the critical mixed-mode fracture energy, G n , G s , G t represents the fracture energy in the three directions of the interface, G A is the sum of the fracture energies in the three directions, and k is the BK index.
According to Benzeggagh [49], when the fracture energy in the first shear direction at the contact interface is equal to the fracture energy in the second shear direction, the contact interface is assumed to be a brittle connection, and the exponent k is defined as 2.

5.2. Mesh Sensitivity Analysis

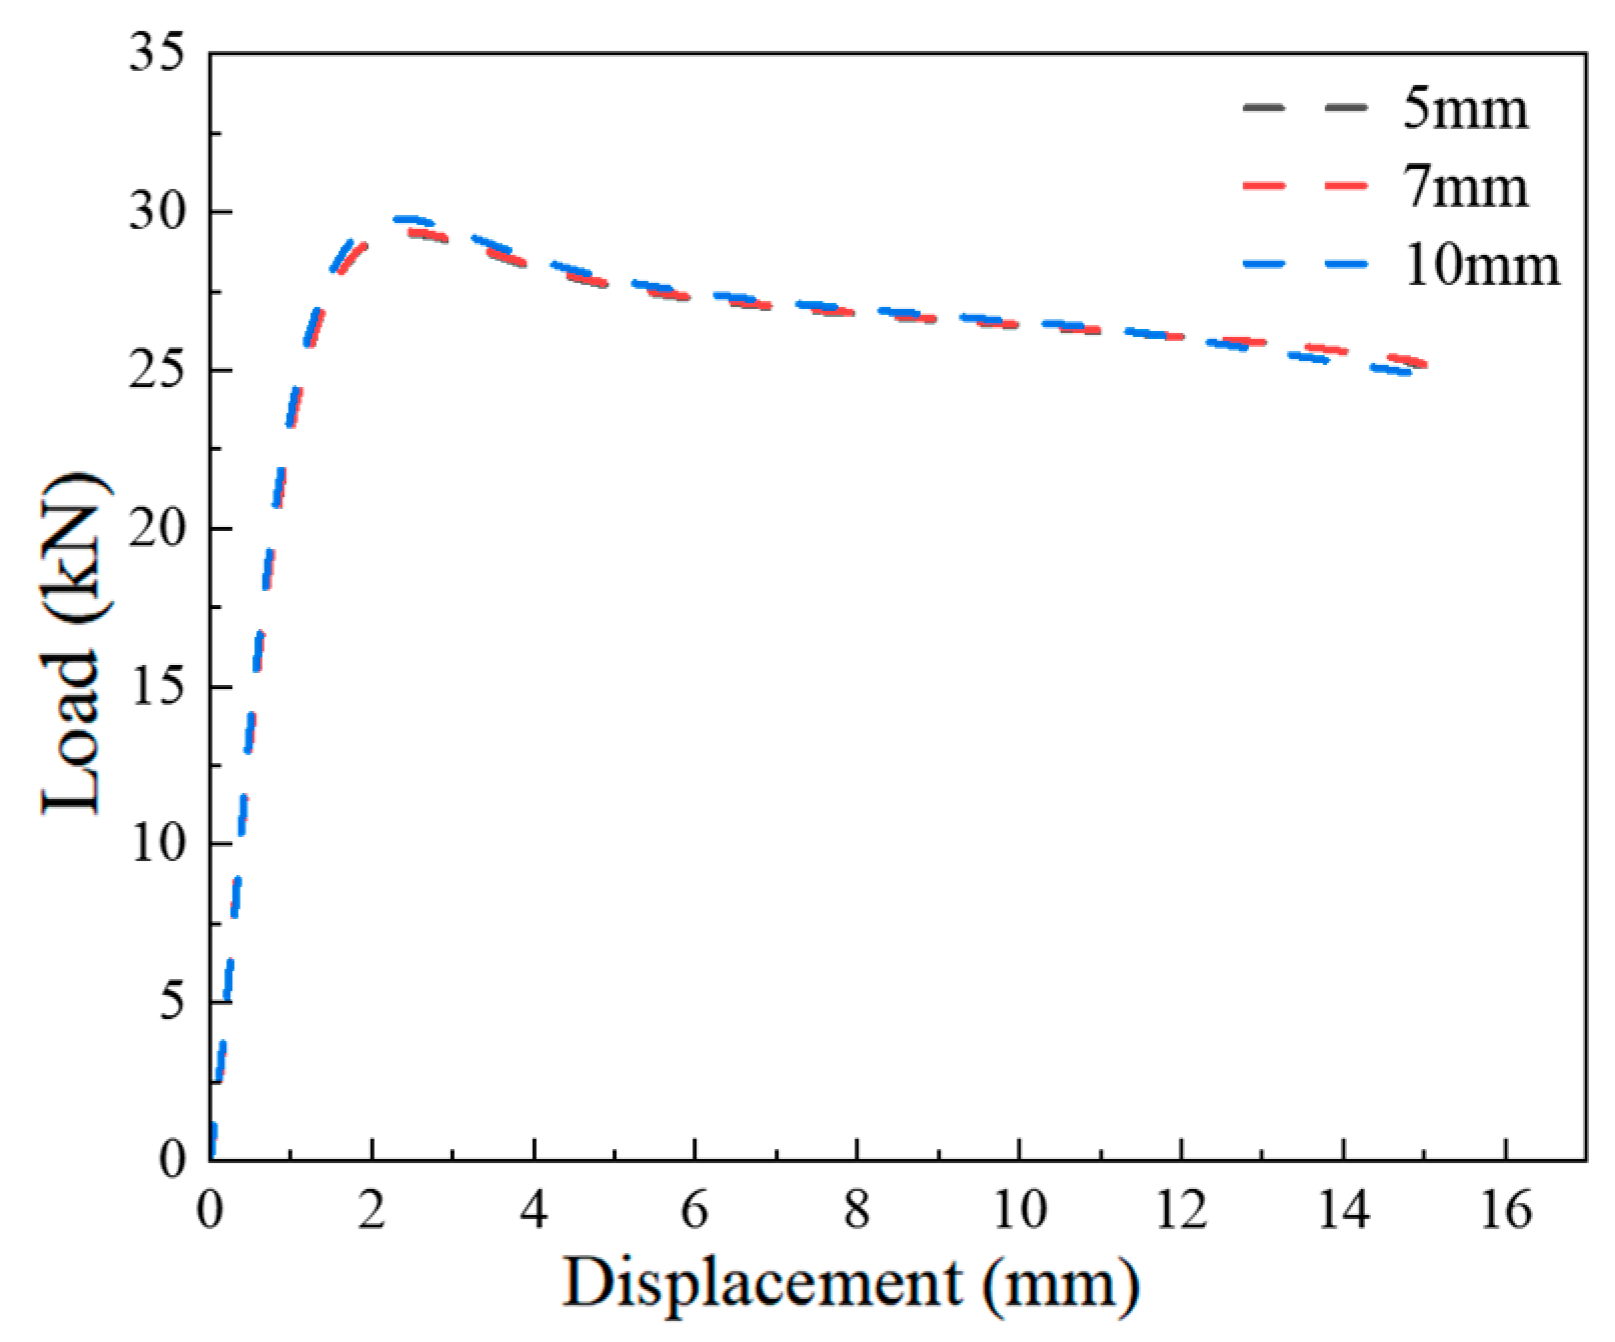
To evaluate the impact of mesh discretization on simulation accuracy, a representative specimen with a water–soil ratio of 0.30 and a lateral compression of 0.2 MPa was selected for mesh sensitivity analysis. The initial model was meshed using a grid size of 10 mm, followed by increased mesh densities of 7 mm and 5 mm for comparative simulation.
During meshing, the loess earthen mortar region was locally refined to ensure at least three mesh layers through its thickness, as shown in Figure 9. The load–displacement curves obtained under compression–shear interaction (Figure 11) indicate that the simulation responses converge with finer mesh sizes. In particular, the results for 7 mm and 5 mm mesh sizes show minimal differences, suggesting that further refinement has limited influence on accuracy while increasing computational cost.
Considering the trade-off between accuracy and computational efficiency, a 7 mm mesh size was selected for subsequent numerical simulations, striking a practical balance between result fidelity and resource consumption.

5.3. Comparison and Verification of Test and Simulation Results

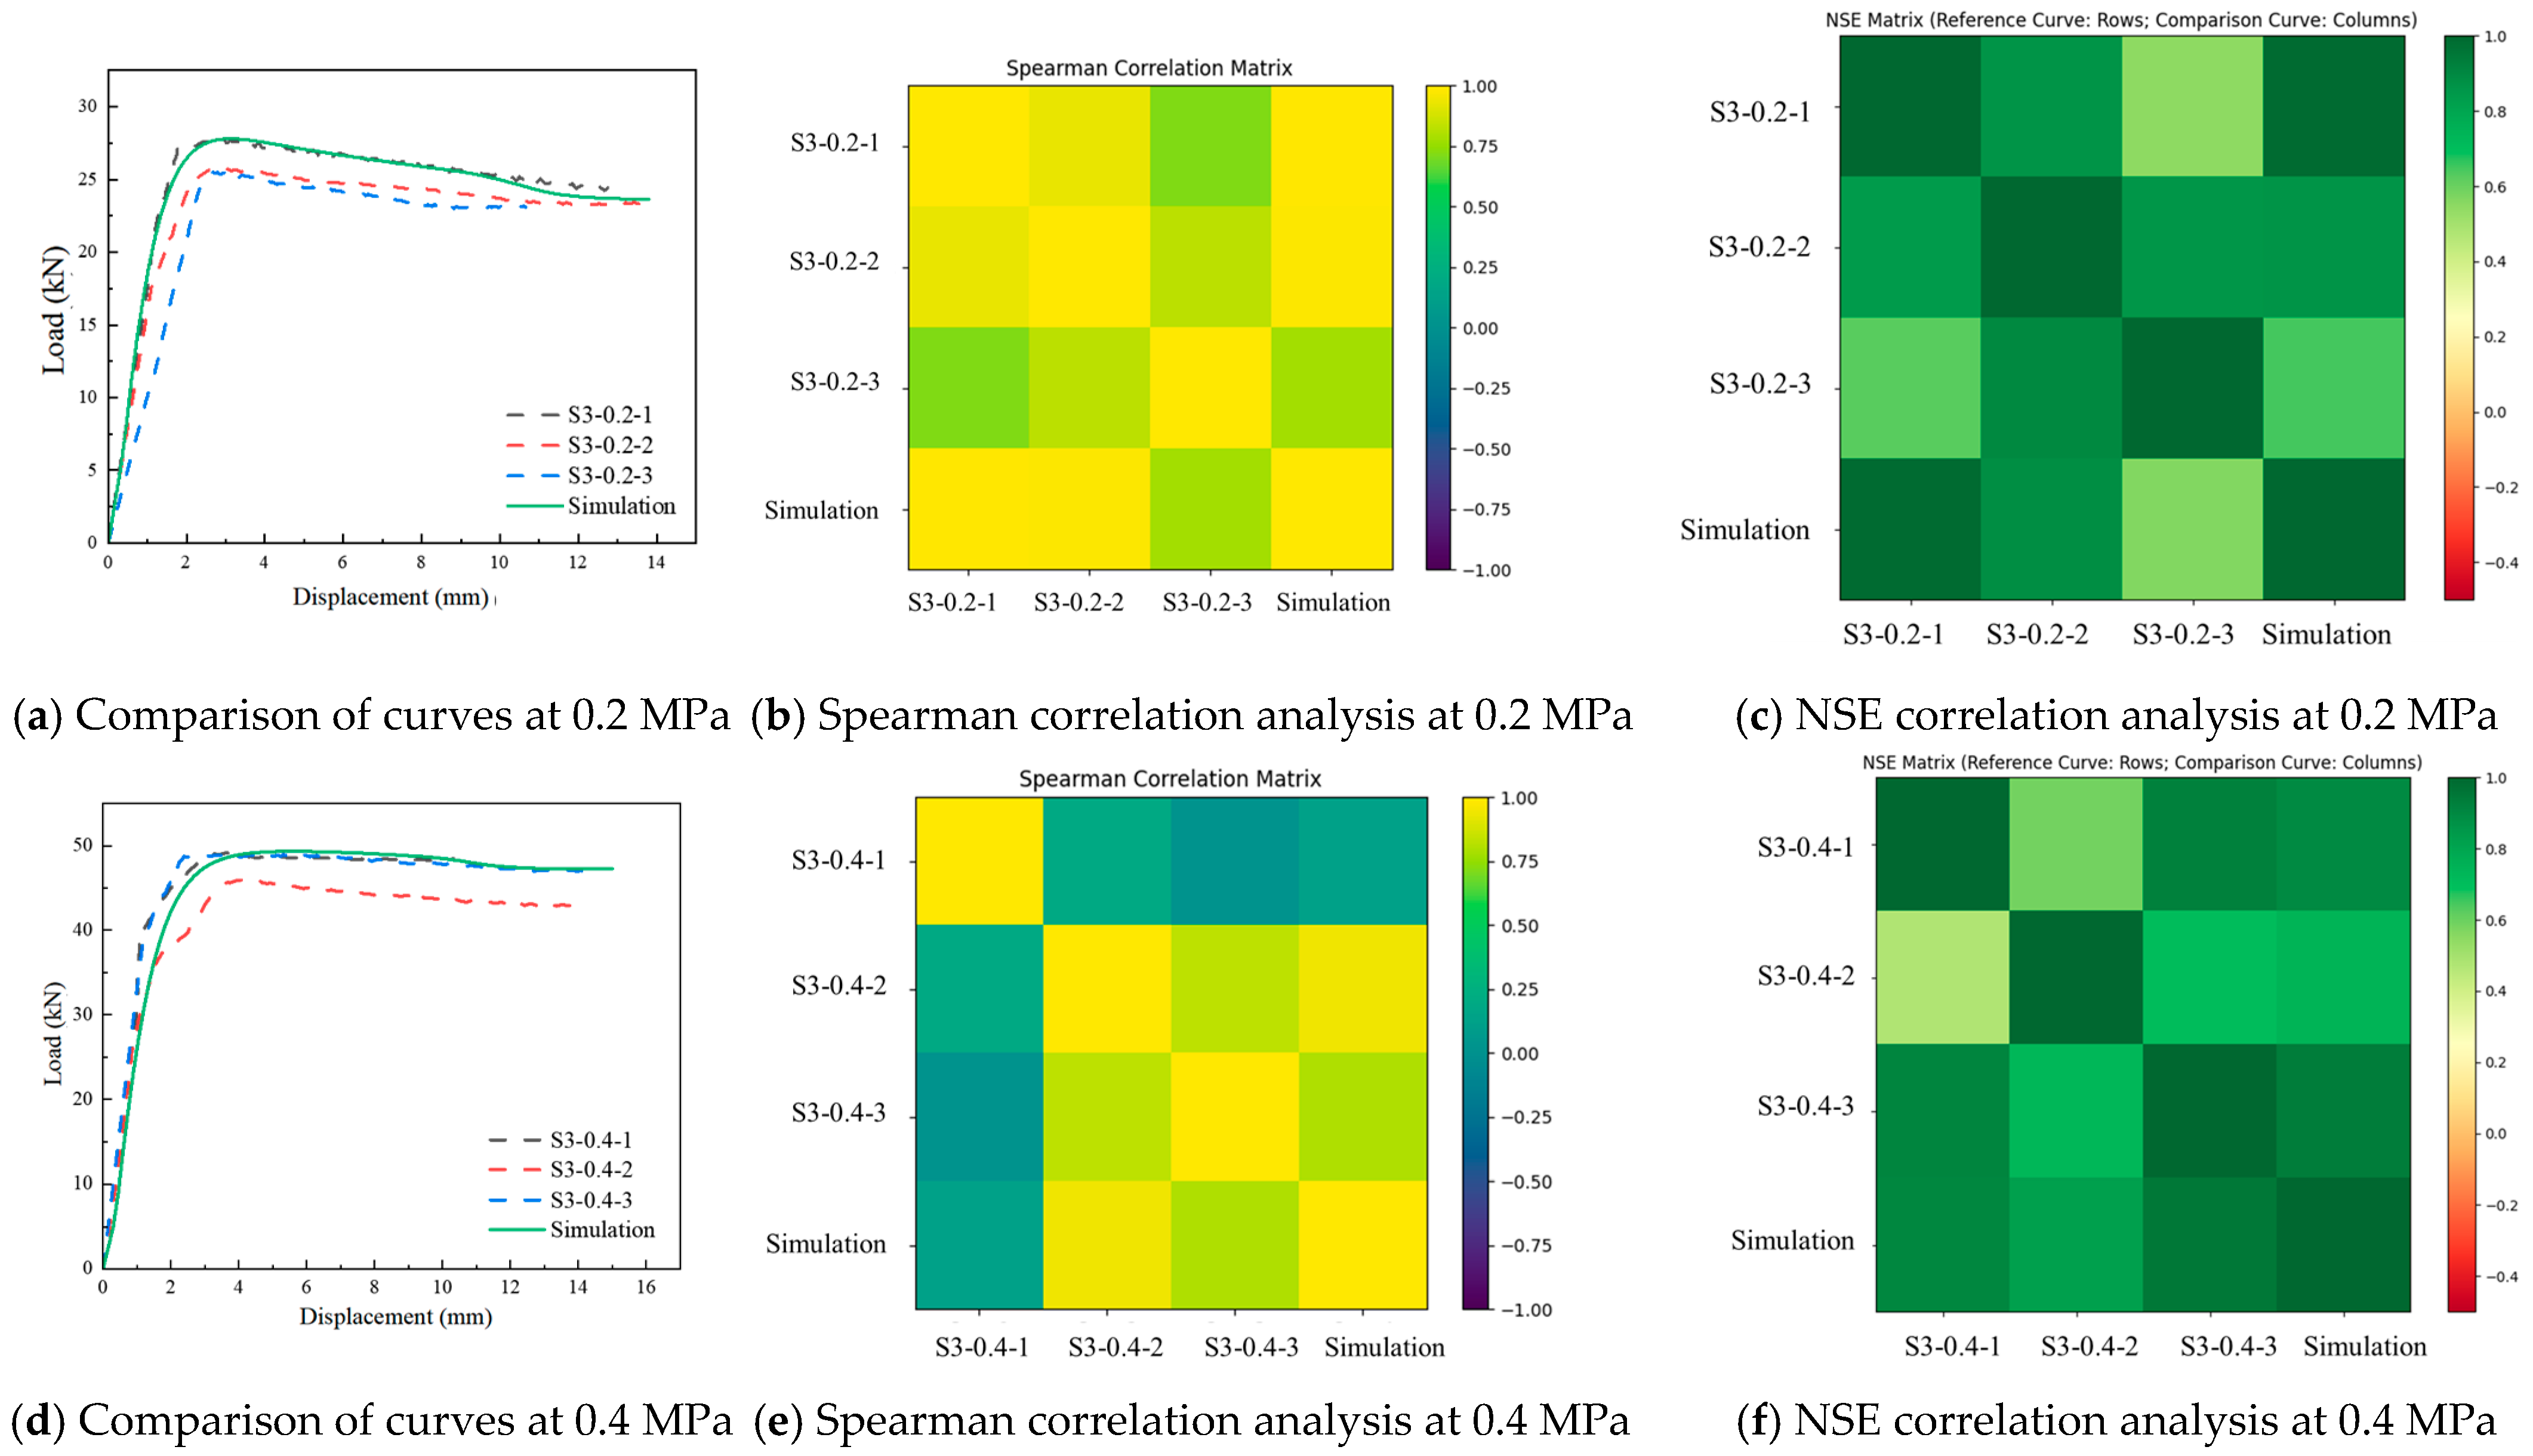
The comparison results of the load–displacement curves of some tests and ABAQUS FE numerical simulation results, as well as the Spearman correlation analysis and Nash–Sutcliffe efficiency analysis, are shown in Figure 12.
Figure 12 compares the experimental results and numerical simulations under different lateral stresses for specimens with a water–soil ratio of 0.35. At a lateral compression of 0.2 MPa, the interface between the traditional blue-gray fired brick and loess earthen mortar has not yet undergone significant plastic damage. Most specimens remain in a comparable elastic-to-inelastic transition phase, and their load–displacement curves are smooth and highly repeatable. The experimental curves demonstrate strong consistency, with a correlation coefficient reaching 0.928. The simulation results exhibit near-perfect agreement with the test data, yielding a Spearman correlation coefficient of 0.98. Additionally, in the Nash–Sutcliffe efficiency (NSE) analysis, the correlation degree between the test and simulation curves reaches 0.987, thereby validating the accuracy of the numerical model.
At a lateral compression of 0.4 MPa, variability in the distribution of microscopic flaws among specimens led to differences in crack initiation sites and propagation rates, reducing the inter-specimen correlation to 0.83. Nevertheless, the numerical simulations—based on an idealized cohesive contact model—still captured the overall behavioral trends accurately, with a simulation-to-experiment Spearman correlation remaining as high as 0.94. Additionally, in the Nash–Sutcliffe efficiency (NSE) analysis, the correlation degree between the test and simulation curves reached 0.95.
At a lateral compression of 0.6 MPa, specimens transitioned into a combined shear–compression failure mode. During this phase, pronounced material nonlinearity and highly localized interface damage meant that micro-defects—such as mortar porosity and uneven joint thickness—exerted a marked influence on crack propagation paths. Consequently, the correlation between samples decreased by 18%, indicating increased variability under high constraints. However, the numerical model, relying on a damage-evolution law and cohesive-damage contact formulation, nonetheless captured the overall hardening–softening response accurately. A Spearman correlation coefficient of 0.86 was achieved between the simulation and experiment, and in the Nash–Sutcliffe efficiency (NSE) analysis, the correlation degree between test and simulation curves reached 0.90.
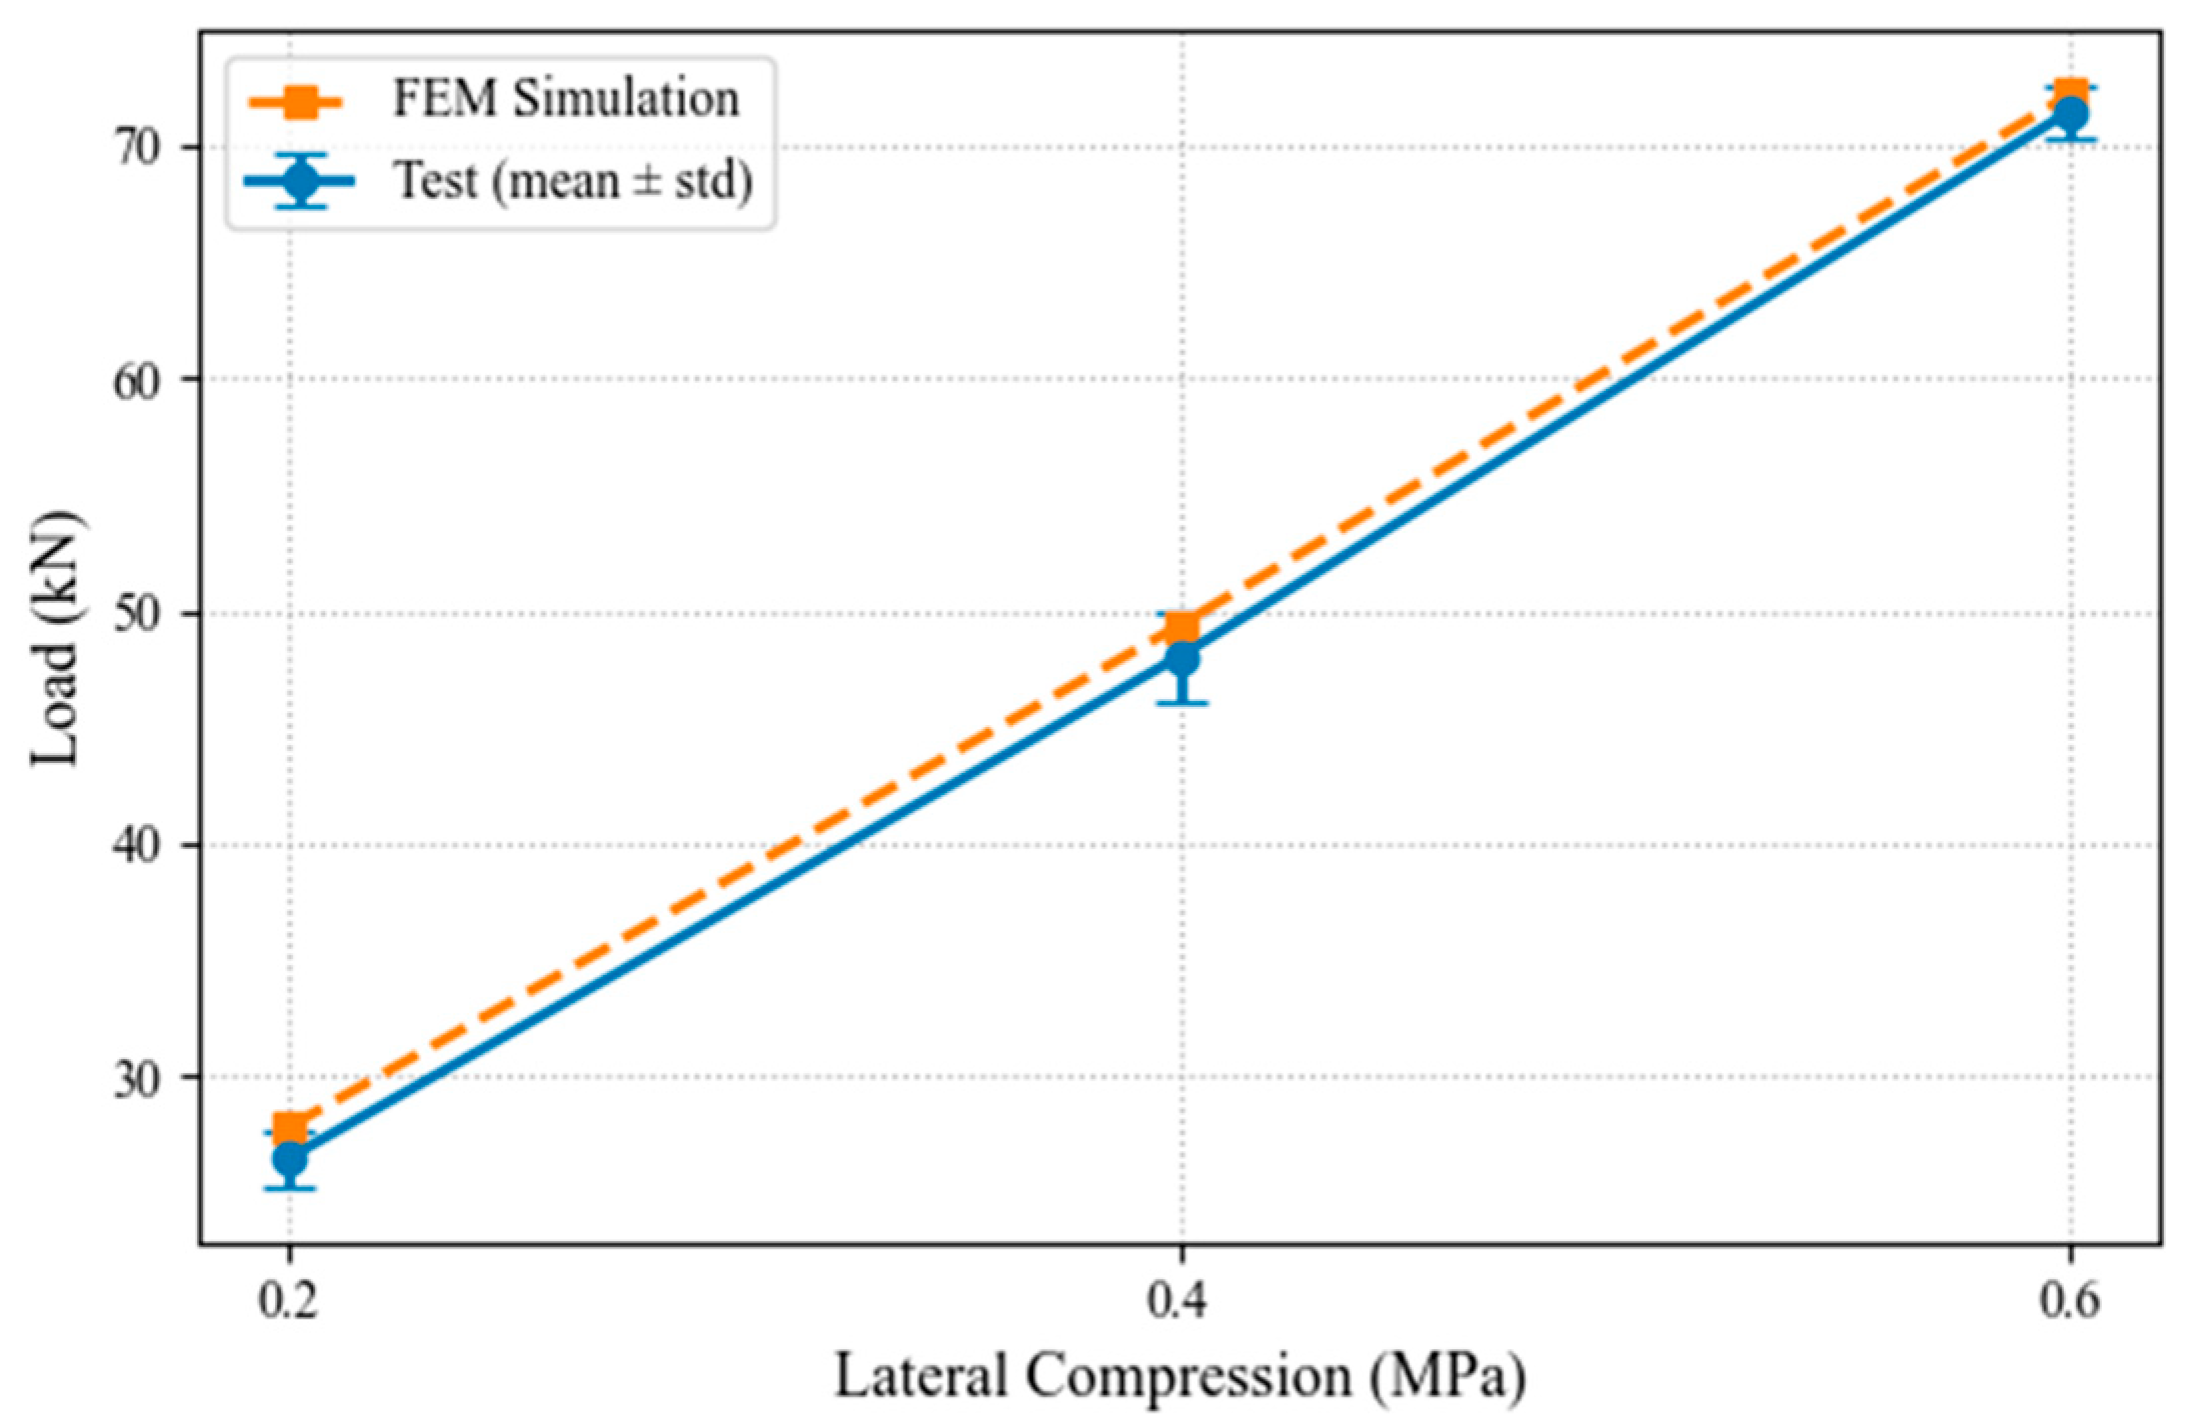
By comparing the load–displacement curves from the numerical simulations and the experiments, a high degree of agreement in the overall trend is evident, demonstrating that the model effectively captures the interface’s damage evolution. Notably, the simulated peak loads closely match the experimental mean values, with a maximum deviation of less than 5%. Moreover, the simulation curves exhibit a slightly higher response than the test data (Table 5 and Figure 13), which further validates the accuracy of the developed finite element model.

6. Conclusions

This study systematically investigated the bond strength of loess earthen mortar–brick interfaces in historic masonry by examining the effects of varying lateral compressions and water–soil ratios, with cohesive contact elements employed to model the loess earthen mortar–brick interface. The main conclusions are as follows:
(1)
Increasing lateral compression from 0.2 MPa to 0.6 MPa markedly enhances the bond strength at the loess earthen mortar–brick interface, with peak shear strength from 0.155 MPa to 0.396 MPa and the initial damage displacement postponed from 2.303 mm to 3.881 mm, showing that confinement has a beneficial effect on shear resistance. Conversely, higher water–soil ratios reduce the peak shear capacity of the masonry.
(2)
As lateral compression increases, internal micro-defects exert a greater influence, reducing the consistency among experimental load–displacement curves. This effect accounts for the observed 18% drop in inter-specimen correlation under high confinement.
(3)
Spearman rank correlation analysis reveals a very high agreement (r = 0.98) between experimental and numerical results under low confinement. Additionally, in the Nash–Sutcliffe efficiency (NSE) analysis, the correlation degree between experimental and numerical curves reaches 0.987 under low confinement, further confirming the good consistency between the two. Although under higher confinement, the Spearman correlation decreases to r = 0.86 due to increased scatter, the NSE analysis still shows a favorable correlation degree of 0.95 between the experimental and simulated curves. Moreover, the simulated and experimental peak shear loads remain essentially identical, with a maximum deviation of less than 5%. This collectively confirms the validity and predictive accuracy of the proposed FE modeling approach for investigating bond strength of loess earthen mortar–brick interfaces.

Author Contributions

Writing—original draft preparation, T.Z.; conceptualization, methodology, resources, project administration, and funding acquisition, J.X.; investigation and validation, C.W.; software and formal analysis, Y.S.; data curation, Y.F. All authors have read and agreed to the published version of the manuscript.

Funding

This research was funded by the Key Research and Development Program Project of China (No. 2023YFF0906001), the National Natural Science Foundation of China (No. 52308328), the China Postdoctoral Science Foundation (No. 2023M732748), and the Preventive Conservation and Inheritance of Ancient Architecture “Scientist + Engineer” Teams (No. 2024QCY-KXJ-169).

Data Availability Statement

The data presented in this study are available on request from the corresponding author.

Conflicts of Interest

Author Yan Sui was employed by the company XAUAT Engineering Technology Co., Ltd. The remaining authors declare that the research was conducted in the absence of any commercial or financial relationships that could be construed as a potential conflict of interest.

References

  1. Fan, Y.; Song, S.; Huang, J.; Lu, Y.; Liu, J.; Zhen, Q.; Bashir, S. Study on weathering mechanism of masonry bricks of ancient temples in Shanxi province using Dingxiang Hongfu temple masonry brick. Constr. Build. Mater. 2019, 222, 500–510. [Google Scholar] [CrossRef]
  2. Qian, K.; Song, Y.; Lai, J. Characterization of historical mortar from ancient city walls of Xindeng in Fuyang, China. Constr. Build. Mater. 2022, 315, 125780. [Google Scholar] [CrossRef]
  3. Jin, P.; Zhang, Y.; Wang, S. Characterization of the superficial weathering of bricks on the City Wall of Xi’an, China. Constr. Build. Mater. 2017, 149, 139–148. [Google Scholar] [CrossRef]
  4. Orlando, M.; Becattini, G.; Betti, M. Multilevel structural evaluation and rehabilitation design of an historic masonry fortress. J. Build. Eng. 2023, 63, 105379. [Google Scholar] [CrossRef]
  5. Tsiavos, A.; Sextos, A.; Stavridis, A. Low-cost hybrid design of masonry structures for developing countries: Shaking table tests. Soil Dyn. Earthq. Eng. 2021, 146, 106675. [Google Scholar] [CrossRef]
  6. Uranjek, M.; Bokan-Bosiljkov, V. Influence of freeze–thaw cycles on mechanical properties of historical brick masonry. Constr. Build. Mater. 2015, 84, 416–428. [Google Scholar] [CrossRef]
  7. Cavalagli, N.; Kita, A.; Castaldo, V.L.; Ubertini, F. Hierarchical environmental risk mapping of material degradation in historic masonry buildings: An integrated approach considering climate change and structural damage. Constr. Build. Mater. 2019, 215, 998–1014. [Google Scholar] [CrossRef]
  8. Erkal, A.; D’Ayala, D.; Sequeira, L. Assessment of wind-driven rain impact, related surface erosion and surface strength reduction of historic building materials. Build. Environ. 2012, 57, 336–348. [Google Scholar] [CrossRef]
  9. Pineda, P. Collapse and upgrading mechanisms associated to the structural materials of a deteriorated masonry tower. Nonlinear assessment under different damage and loading levels. Eng. Fail. Anal. 2016, 63, 72–93. [Google Scholar] [CrossRef]
  10. Christy, C.F.; Shanthi, R.M.; Tensing, D. Bond strength of the brick masonry. Int. J. Civ. Eng. Technol. 2012, 3, 380–386. [Google Scholar]
  11. Groot, C. Effects of Water on Mortar-Brick Bond; Technische Universiteit Delft: Delft, The Netherlands, 1993. [Google Scholar]
  12. Dehghan, S.M.; Najafgholipour, M.A.; Baneshi, V. Mechanical and bond properties of solid clay brick masonry with different sand grading. Constr. Build. Mater. 2018, 174, 1–10. [Google Scholar] [CrossRef]
  13. Kumble, P.; Prashant, S.; Achar, N. Bond strength of alkali-activated flyash based masonry system for sustainable construction. SN Appl. Sci. 2023, 5, 360. [Google Scholar] [CrossRef]
  14. Lourenço, P.B.; Barros, J.O.; Oliveira, J.T. Shear testing of stack bonded masonry. Constr. Build. Mater. 2004, 18, 125–132. [Google Scholar] [CrossRef]
  15. Zhou, Z.; Walker, P.; D’Ayala, D. Strength characteristics of hydraulic lime mortared brickwork. Proc. Inst. Civ. Eng.-Constr. Mater. 2008, 161, 139–146. [Google Scholar] [CrossRef]
  16. Singh, S.B.; Munjal, P. Bond strength and compressive stress-strain characteristics of brick masonry. J. Build. Eng. 2017, 9, 10–16. [Google Scholar] [CrossRef]
  17. Briceño, C.; Azenha, M.; Vasconcelos, G. Influence of conditioning of clay bricks over shear strength of brick masonry. J. Build. Eng. 2024, 82, 108138. [Google Scholar] [CrossRef]
  18. Segura, J.; Bernat, E.; Mendizabal, V. Experimental comparison of two testing setups for characterizing the shear mechanical properties of masonry. J. Build. Eng. 2021, 44, 103277. [Google Scholar] [CrossRef]
  19. Costigan, A.; Pavía, S. Influence of the Mechanical Properties of Lime Mortar on the Strength of Brick Masonry. In Historic Mortars: Characterisation, Assessment and Repair; Springer: Dordrecht, The Netherlands, 2012; pp. 359–372. [Google Scholar]
  20. Behera, B.; Nanda, R.P. In-plane shear strengthening of brick masonry panel with geogrid reinforcement embedded in bed and bed-head joints mortar. Eng. Struct. 2021, 227, 111411. [Google Scholar] [CrossRef]
  21. Briceño, C.; Azenha, M.; Vasconcelos, G. Influence of Type of Mortar and Unit Conditioning in the Shear Bond Strength of Brick-Mortar Assemblages. In International Brick and Block Masonry Conference; Springer Nature: Cham, Switzerland, 2024; pp. 451–462. [Google Scholar]
  22. Fonseca, F.S.; Fortes, E.S.; Parsekian, G.A. Compressive strength of high-strength concrete masonry grouted prisms. Constr. Build. Mater. 2019, 202, 861–876. [Google Scholar] [CrossRef]
  23. Barr, S.; McCarter, W.J.; Suryanto, B. Bond-strength performance of hydraulic lime and natural cement mortared sandstone masonry. Constr. Build. Mater. 2015, 84, 128–135. [Google Scholar] [CrossRef]
  24. Sarhosis, V.; Garrity, S.W.; Sheng, Y. Influence of brick–mortar interface on the mechanical behaviour of low bond strength masonry brickwork lintels. Eng. Struct. 2015, 88, 1–11. [Google Scholar] [CrossRef]
  25. Lourenço, P.B.; Ciocci, M.P.; Greco, F. Traditional techniques for the rehabilitation and protection of historic earthen structures: The seismic retrofitting project. Int. J. Archit. Herit. 2019, 13, 15–32. [Google Scholar] [CrossRef]
  26. Chen, T.S.; Chen, H. An Analysis of the Reasons for the Slow Development of Brick and Stone Structures in Ancient Chinese Architecture. Jiangsu Archit. 2010, 6, 47–50. (In Chinese) [Google Scholar] [CrossRef]
  27. Zizi, M.; Corlito, V.; Lourenço, P.B. Seismic vulnerability of masonry churches in Abruzzi region, Italy. Structures 2021, 32, 662–680. [Google Scholar] [CrossRef]
  28. Valente, M.; Milani, G. Damage survey, simplified assessment, and advanced seismic analyses of two masonry churches after the 2012 Emilia earthquake. Int. J. Archit. Herit. 2019, 13, 901–924. [Google Scholar] [CrossRef]
  29. Scamardo, M.; Zucca, M.; Crespi, P. Seismic vulnerability evaluation of a historical masonry tower: Comparison between different approaches. Appl. Sci. 2022, 12, 11254. [Google Scholar] [CrossRef]
  30. Malcata, M.; Ponte, M.; Tiberti, S. Failure analysis of a Portuguese cultural heritage masterpiece: Bonet building in Sintra. Eng. Fail. Anal. 2020, 115, 104636. [Google Scholar] [CrossRef]
  31. Kumar, N.; Amirtham, R.; Pandey, M. Plasticity based approach for failure modelling of unreinforced masonry. Eng. Struct. 2014, 80, 40–52. [Google Scholar] [CrossRef]
  32. Kumar, N.; Barbato, M. New constitutive model for interface elements in finite-element modeling of masonry. J. Eng. Mech. 2019, 145, 04019022. [Google Scholar] [CrossRef]
  33. Zhang, S.; Mousavi, S.M.T.; Richart, N. Micro-mechanical finite element modeling of diagonal compression test for historical stone masonry structure. Int. J. Solids Struct. 2017, 112, 122–132. [Google Scholar] [CrossRef]
  34. Zhang, S.; Richart, N.; Beyer, K. Numerical evaluation of test setups for determining the shear strength of masonry. Mater. Struct. 2018, 51, 110. [Google Scholar] [CrossRef]
  35. Zhang, S.; Hofmann, M.; Beyer, K. A 2D typology generator for historical masonry elements. Constr. Build. Mater. 2018, 184, 440–453. [Google Scholar] [CrossRef]
  36. GB/T50129-2011; Standard Test Method for Basic Mechanical Properties of Masonry. China Construction Industry Press: Beijing, China, 2011. (In Chinese)
  37. JGJ/T 70-2009; Standard of Test Method for Basic Performance of Construction Mortar. China Construction Industry Press: Beijing, China, 2009. (In Chinese)
  38. GB/T 2542-2012; Wall Brick Test Method. China Construction Industry Press: Beijing, China, 2012. (In Chinese)
  39. Shi, S.; Wang, D.; Li, Z. Shear Performance of New-to-Old Concrete Under Different Interface Treatments. Coatings 2025, 15, 805. [Google Scholar] [CrossRef]
  40. Yang, N.; TENG, D. Shear performance of Tibetan stone masonry under shear-compression loading. Eng. Mech. 2020, 37, 221–229. [Google Scholar]
  41. Alfano, G.; Sacco, E. Combining interface damage and friction in a cohesive-zone model. Int. J. Numer. Methods Eng. 2006, 68, 542–582. [Google Scholar] [CrossRef]
  42. Mehmood, T.; Abid, M.A.; Chatveera, B. Sustainable Reinforcement Methods for Brick Masonry Walls: An Experimental and Finite Element Analysis Approach. Buildings 2025, 15, 2180. [Google Scholar] [CrossRef]
  43. Hashemi, S.M.; Ayoub, A. Improved Bond Stress-Slip Relationships for Carbon Fibre-Reinforced Polymer-Strengthened Masonry Triplets. Buildings 2024, 14, 257. [Google Scholar] [CrossRef]
  44. Yang, W.Z. Constitutive relationship model for masonry under compression. Build. Struct. 2008, 38, 80–82. [Google Scholar] [CrossRef]
  45. Zheng, N. Research on the Seismic Performance of Prefabricated Structural Columns Constrained Masonry Structures; Chongqing University: Chongqing, China, 2010. [Google Scholar]
  46. Yang, W.; Yuan, S.; Yang, C. Experimental study on the full stress-strain curve of mortar under uniaxial compression. Build. Struct. 2019, 49, 114–119. [Google Scholar] [CrossRef]
  47. Guo, Z.H.; Shi, X.D. Principles and Analysis of Reinforced Concrete; Tsinghua University Press: Beijing, China, 2003. [Google Scholar]
  48. Page, A.W. The biaxial compressive strength of brick masonry. Proc. Inst. Civ. Eng. 1981, 71, 893–906. [Google Scholar] [CrossRef]
  49. Benzeggagh, M.L.; Kenane, M. Measurement of mixed-mode delamination fracture toughness of unidirectional glass/epoxy composites with mixed-mode bending apparatus. Compos. Sci. Technol. 1996, 56, 439–449. [Google Scholar] [CrossRef]
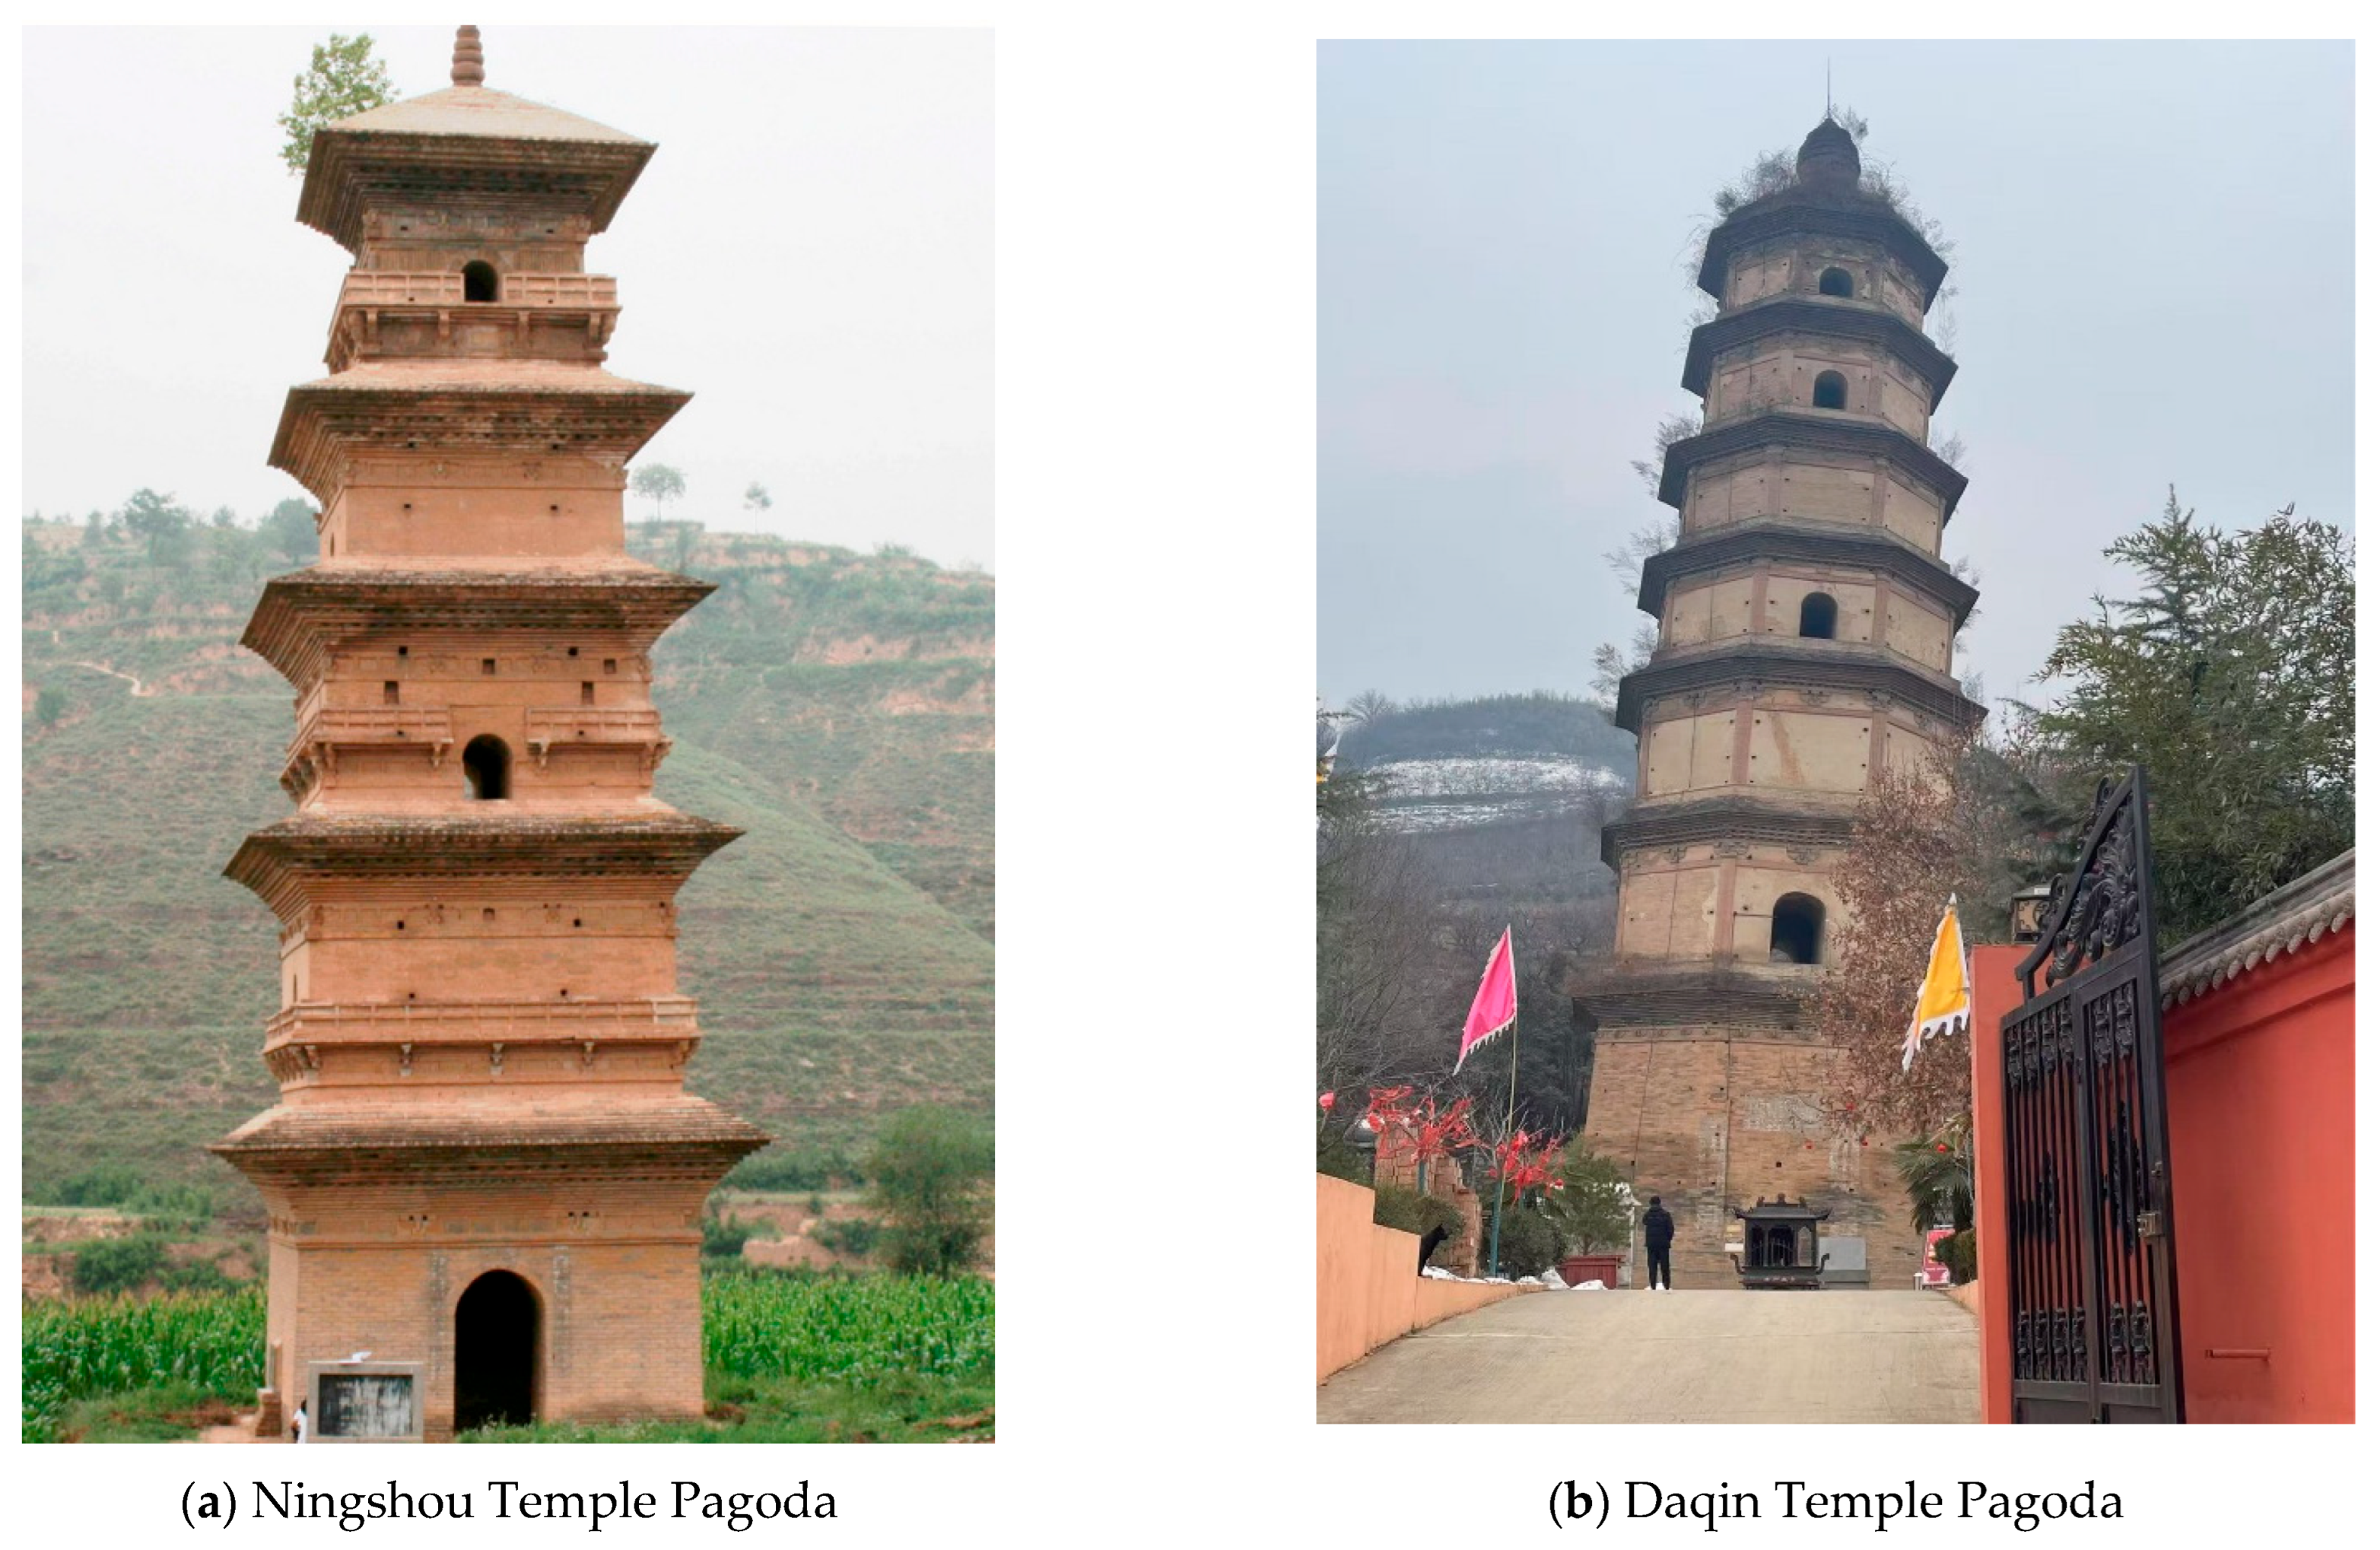
Figure 1. Ancient pagodas.
Buildings 15 03278 g001
Figure 2. Material performance test.
Buildings 15 03278 g002
Figure 3. Specimen preparation.
Buildings 15 03278 g003
Figure 4. Compression–shear composite test.
Buildings 15 03278 g004
Figure 5. Specimen failure modes.
Buildings 15 03278 g005
Figure 6. Test results for shear stress and fitting curves of specimens.
Buildings 15 03278 g006
Figure 7. Load–displacement diagram for a water–soil ratio of 0.35.
Buildings 15 03278 g007
Figure 8. Simplified separation modeling.
Buildings 15 03278 g008
Figure 9. FE model of combined compression and shear test.
Buildings 15 03278 g009
Figure 10. Bilinear cohesive-zone model.
Buildings 15 03278 g010
Figure 11. Convergence analysis of different grid sizes.
Buildings 15 03278 g011
Figure 12. Comparison of simulation and test results.
Buildings 15 03278 g012aBuildings 15 03278 g012b
Figure 13. Comparative analysis of simulation errors under varying lateral compressions at 0.35 water–soil ratio.
Buildings 15 03278 g013
Table 1. Density and compressive strength of traditional blue-gray fired brick and loess earthen mortar specimens.
MaterialsQuantityDensity (g/cm3)Compressive Strength (MPa)Modulus of Elasticity (MPa)
Traditional blue-gray fired brick61.49613.9441504.743
Loess earthen mortar (0.25 W/S)61.7883.055186.825
Loess earthen mortar (0.30 W/S)61.7432.802166.548
Loess earthen mortar (0.35 W/S)61.7182.670158.822
Table 2. Detailed parameters of specimens.
Specimen NumberWater–Soil RatioLateral Compression (MPa)Quantity
S1-0.20.250.23
S1-0.40.250.43
S1-0.60.250.63
S2-0.20.300.23
S3-0.20.350.23
S3-0.40.350.43
S3-0.60.350.63
Note: In the specimen number format Sa-b, a denotes the water–soil ratio level, and b represents the applied lateral compression.
Table 3. Results of the compression–shear composite test.
Specimen NumberInterface Shear Stiffness (N/mm3)Initial Damage Displacement (mm)Maximum Load (kN)Shear Strength (MPa)
S1-0.20.0692.21329.4930.168
S1-0.40.0863.68550.6470.289
S1-0.60.1013.77973.7410.421
S2-0.20.0592.59528.2670.161
S3-0.20.0552.30327.0850.155
S3-0.40.0763.18747.7610.273
S3-0.60.0923.88169.4340.396
Note: In the specimen number format Sa–b, a denotes the water–soil ratio level, and b represents the applied lateral compression.
Table 4. Plasticity parameters of the CDP model.
Typeψefb0/fc0Kµ
Bricks300.11.160.66670.001
Mortar300.11.160.66670.001
Note: ψ is the expansion angle; e is the eccentricity; fb0 is the biaxial compressive strength; fc0 is the uniaxial compressive strength; K is the stress ratio; µ is the viscosity coefficient.
Table 5. Comparison of simulated values and test values for test specimens.
Specimen NumberTest Load (kN)Simulated Load (kN)Error%
S1-0.229.49329.380.383
S1-0.450.64751.932.533
S1-0.673.74175.52.385
S2-0.228.26728.40.470
S3-0.227.08527.82.64
S3-0.447.76149.343.306
S3-0.669.43472.153.911
Note: In the specimen number format Sa–b, a denotes the water–soil ratio level, and b represents the applied lateral compression. The error calculation method is (simulated value − test value)/test value × 100%.
Disclaimer/Publisher’s Note: The statements, opinions and data contained in all publications are solely those of the individual author(s) and contributor(s) and not of MDPI and/or the editor(s). MDPI and/or the editor(s) disclaim responsibility for any injury to people or property resulting from any ideas, methods, instructions or products referred to in the content.