Article

Numerical Study: Substrate Thickness and Type of Roof Structure and Their Impact on the Thermal Behavior of Green Roofs

Department of Building Engineering and Urban Planning, Faculty of Civil Engineering, University of Zilina, Univerzitna 8215/1, 010 26 Zilina, Slovakia
*
Author to whom correspondence should be addressed.
Buildings 2025, 15(17), 3240; https://doi.org/10.3390/buildings15173240
Submission received: 30 July 2025 / Revised: 25 August 2025 / Accepted: 26 August 2025 / Published: 8 September 2025
(This article belongs to the Section Building Energy, Physics, Environment, and Systems)

Abstract

The aim of this article is to provide a parametric analysis of the thermal behavior of green roofs, focusing on the influence of the thickness of the vegetation substrate and the type of supporting structure. The simulation model is implemented on the roof structure of an industrial hall in Dubnica nad Váhom, Slovakia, which was created and successfully validated based on real measurements of temperatures and climatic conditions during eight days in September 2023. After validating the model, a series of simulations of three structural variants was performed over three days in the summer. The results demonstrated that the greatest impact on reducing temperature fluctuations was achieved by increasing the thickness of the vegetation substrate (variant V2), which contributed to a reduction in heat flows fluctuations of up to 82% and caused a favorable phase shift in maximum temperatures. The introduction of a reinforced concrete supporting structure (variant V1) brought a partial improvement in the lower layers, while the combined variant (V3) demonstrated the best results—stabilization of temperatures and heat flows throughout the structure, eliminating overheating and cooling of the interior, and overall improvement in the thermal balance of the roof system. The results point to the high potential of green roofs in improving the thermal properties of buildings in summer conditions.

1. Introduction

In the context of current demands for sustainable architecture and climate change adaptation in buildings, green roofs are becoming an important element of passive environmental design [1,2]. In addition to their ecological and aesthetic benefits, they play a significant role in regulating the thermal regime of building structures, thereby contributing to reducing building energy consumption and improving the microclimate in the built environment [3,4,5]. Green structures integrated into buildings have great potential to reduce the negative effects of urban heat islands [6] through their added value of evaporation and the possibility of restoring disappearing greenery to city centers [7,8].
In order to analyze these benefits more accurately, compare them, and propose more effective green roof solutions, digital evaluation methods are coming to the fore. Simulation tools have become a common part of the design process in construction today [9,10]. They enable the testing of technical solutions and the optimization of designs prior to implementation, minimizing the risk of problems during construction. Similarly, in scientific and research activities, dynamic simulations are an effective way to predict the behavior of structures under various conditions [11]. This makes it possible to identify the potential advantages and disadvantages of a given technical solution at the design stage and to objectively assess its impact [12]. Such modeling not only increases knowledge about the thermophysical behavior of individual layers of the vegetation system but also allows for the comparison of different design alternatives already at the design stage [13].
In the field of research and simulation of vegetation structures, especially green roofs, there are several scientific studies that deal in detail with the evaluation of these systems. Simulation models focus in particular on the influence of living organisms, such as plant growth, and on the role of water, which, through capillarity, changes the distribution of moisture in the substrate [14]. In addition, the simulations consider significant phase changes in water, which vary throughout the year depending on seasonal conditions. In article [15], the authors focused on simulating a green roof in the WUFI program, where they determined that the presence of water was able to reduce heat flow through the roof by up to 11% in the summer months, which significantly contributed to the elimination of summer overheating. They pointed out that an important aspect of the simulation model is the correct setting of the input parameters of the materials, as well as also the length of the simulation period under investigation.
Sailor [16] developed a green roof model for simulation in the EnergyPlus program. The model currently allows the simulation of only one green roof structure and does not consider the drainage layer, but future versions are expected to support multiple roof types, smart irrigation, and improved numerical solutions using finite difference schemes. Verification was based on field measurement data from Florida, with the simulation accurately reproducing daily soil temperature changes. Sensitivity analyses showed the expected behavior: coarser soil reduced energy requirements for both heating and cooling, especially in colder climates; denser vegetation reduced summer electricity consumption but slightly increased winter consumption due to shading; and irrigation had a greater benefit in drier conditions.
In the article [17], the authors identified slight discrepancies between real measurements and the simulation tool. The substrate layer, which was assessed as less significant in the simulations, proved to be a decisive factor influencing the delay and intensity of heat flow in the experiments. A thicker substrate (150–200 mm) significantly reduces heat transfer into the building and delays the heat maximum by up to 8 h. An interesting finding is that the difference in heat output between 150 mm and 200 mm substrates is minimal, while both variants provide significantly better performance compared to a 100 mm layer. A key finding is that Sailor’s model in EnergyPlus did not reveal these advantages of the substrate, as the simulation output was located at the interface between the vegetation and the substrate, rather than between the green roof and the building structure itself. This methodological limitation leads to the conclusion that simulation outputs must always be verified by experimental data to avoid erroneous design decisions, especially in different climate zones.
In contraposition, the study [18] confirmed a high degree of accuracy between simulations and experimental data in evaluating the thermal behavior of green roofs, with the lowest deviations recorded for substrate thicknesses of 200 mm and 300 mm. It was these thicker layers that demonstrated the most significant insulating effect, confirming their potential to replace traditional insulation materials. The optimal combinations of plants and substrate layers identified in the study exhibited a heat transfer coefficient comparable to traditional thermal insulation, supporting their use in low-energy and environmentally oriented buildings.
The study [19] focused on the analysis of extensive roofs with a thinner substrate. The study demonstrated that green roofs on container modules effectively reduce internal temperature fluctuations. Without vegetation, the daily temperature difference reached up to 38.7 °C, while with a 4 cm thick substrate it dropped to 13.8 °C and with the thickest layer to 9.7 °C. The time delay in heat transfer ranged from 0.72 to 1.67 h depending on the day but was not significantly affected by thickness. The reduction factor (heat flow reduction) decreased significantly with increasing substrate thickness—from 0.95 to 0.67 on the first day. Even a thin layer of substrate had a significant effect, but a thickness of 8 cm or more is recommended for greater comfort.
A study [20] conducted in situ in the semi-arid climate of Santiago (Chile) compared the performance of green roofs with different substrate thickness (5, 10, and 20 cm). The results indicated that thin layers (5 cm) exhibited high thermal fluctuations, with substrate maximums exceeding 50 °C, which exceeded the critical thresholds for both plants and materials. In contrast, substrates with depths of 10 cm and 20 cm demonstrated a significant damping effect (up to 13 °C lower temperatures compared to the air) and more stable moisture, which supports their suitability for more extreme conditions. The article confirms the importance of proper layer design and sufficient substrate thickness to ensure the functionality and sustainability of green roofs in drier climatic regions.
The article [21] used DesingBuilder and EnergyPlus to examine the impact of leaf area index (LAI), plant height, soil moisture, and tree cover. These design scenarios were compared with baseline scenarios. The study [22] compared the energy balance of white, vegetated, and hybrid roofs for the purpose of reducing the thermal load of buildings. It was found that green roofs with moisture-controlled irrigation can achieve up to ~9.68 MJ/m2 of energy and water savings in dry climates, which significantly exceeds the results without irrigation (~5.23 MJ/m2). A simulation study [23] investigated the effectiveness of green roofs in 45 cities in different climate zones. The simulation of the energy efficiency of buildings was performed using DesignBuilder software, which integrates the EnergyPlus engine. The results indicate that green roofs effectively reduce cooling loads but increase energy consumption for heating. They found that the highest total savings were achieved in the arid zone, followed by the tropical and temperate zones, with the cold zone achieving the worst results. A comparison with the study overview in [24] revealed that studies in temperate climates have shown a reduction in annual energy consumption for cooling of up to 20%. At the same time, it was found that in tropical areas, green roofs reduce maximum indoor temperatures by up to 6 °C, offering significant energy savings. The review includes results from several sophisticated modeling techniques, including thermodynamic simulations with TRNSYS and EnergyPlus, as well as environmental modeling using FASST, FFT, and Newton’s iterative algorithm. In both temperate and tropical climates, empirical data and simulation outputs consistently show that green vegetation on building envelopes can reduce heat flow through the roof by up to 70%, drastically reducing energy demand for air conditioning and heating systems. In addition, model studies using the ENVI-met system have highlighted the microclimatic benefits of green infrastructure, such as mitigating the urban heat island effect by reducing ambient temperatures in cities by up to 2 °C while improving air quality in cities by filtering particulate matter and absorbing CO2. From an environmental perspective, the article [25] presented three experimental protocols for measuring evapotranspiration on a large green roof in the Paris area, thereby deepening the understanding of the spatial and temporal variability of evapotranspiration (ET) processes on roofs.
The literature conclusively confirms the contribution of substrate thickness to thermal stability and the importance of hygrothermal validation of simulations based on experimental data [26,27]. However, most previous studies focus either exclusively on the properties of vegetation and substrate or on the overall energy performance of buildings, without thoroughly examining the combined effect of substrate thickness and the structural composition of the supporting layer. This aspect is particularly critical for industrial and lightweight hall buildings, where structural allowances are limited, and additional loads from green roofs can pose significant engineering challenges.
Moreover, there is a lack of parametric studies validated with in situ measurements that systematically compare different structural alternatives under identical climatic conditions. Using an uncalibrated model introduces uncertainties in the outputs, which can reduce the accuracy and credibility of the findings. Therefore, this study develops a validated model of an extensive green roof located in Dubnica nad Váhom, Slovakia, and performs a parametric analysis of three variants (V1–V3), combining substrate thickness and the type of supporting structure.
The aim of this work is to quantify the impact of these factors on temperature stability, heat flux, and suitability for the practical design and optimization of green roofs in a Central European context. The novelty of the approach lies in validating the hygrothermal simulation model WUFI using actual measurement data from an industrial hall, conducting a parametric analysis of three structural variants (reference roof, reinforced concrete slab, and thicker vegetation substrate), and quantifying their influence on temperature stabilization, phase shift of maximum temperatures, and cumulative heat fluxes.
By addressing this gap in the research, our work contributes to a better understanding of how structural modifications can enhance the performance of extensive green roofs in lightweight industrial buildings, thereby supporting more informed design and renovation strategies.

2. Materials and Methods

2.1. Research Design

The aim of the research was to analyze the thermal dynamics of green roofs in the context of Central European climatic conditions. The research focused primarily on the influence of the thickness of the vegetation substrate and the type of supporting structure on the temperature regime of green roofs during the summer season through dynamic simulation analysis. The research was carried out in the form of numerical simulation using a step-by-step parametric study, preceded by detailed validation of the simulation model. The validation was performed by comparing the simulation results with experimental data obtained from a real flat roof structure of an industrial hall in Dubnica nad Váhom, Slovakia. The experimental roof consisted of a flat accessible roof finished with white waterproofing and a green roof. Once the required accuracy was achieved, the simulation was used as the basis for a parametric study with three variants (V1 to V3), the aim of which was to assess the impact of different structural modifications on the behavior of the green roof compared to the reference (real structure) green roof.

2.2. Methodology

The choice of the simulation tool is essential for the validity of the presented parametric study. For this research, software WUFI Pro 6.5 (WUFI® Pro—Wärme und Feuchte Instationär—Professional) was employed, as it provides a well-established platform for coupled heat and moisture transport (HAM) simulations. The software is widely validated against experimental data and is frequently applied in the field of green roof and façade studies [28,29]. Its main advantage lies in the ability to simulate transient hygrothermal processes in multilayer assemblies, while also allowing the parametrization of vegetation and substrate layers in a simplified, yet physically consistent manner.
To better contextualize this choice, Table 1 summarizes the key features of the most commonly used simulation environments in green roof research. The comparison highlights that WUFI provides a more detailed description of coupled heat and moisture compared to general energy simulation tools (e.g., EnergyPlus, TRNSYS), while maintaining lower computational demand than fully coupled multiphysics models (e.g., COMSOL Multiphysics). Therefore, WUFI represents a suitable balance between accuracy, usability, and computational efficiency for parametric studies such as the present work. Nevertheless, it should be noted that the vegetation layer is represented using simplified assumptions (empirical parameters of evapotranspiration and moisture storage), whereas advanced multiphysics tools (e.g., COMSOL Multiphysics) would allow a more detailed process description of plant physiology. Finally, our institution has been working with WUFI for a long time, so its program settings are the most relevant to us.

2.2.1. Simulation Model

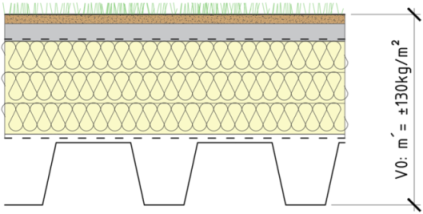
The model was developed based on the actual green roof structure (Figure 1) of an industrial hall, classified as a single-layer flat roof, without a massive accumulation layer. The roof structure consisted of a supporting layer of trapezoidal sheet metal, on which a light vapor barrier (PE foil) was placed. This was followed by layers of mineral wool (MW) thermal insulation and a waterproofing membrane. In the case of the vegetation variant, additional layers were included: hydro-accumulation boards manufactured from recycled materials originating from the automotive industry [33], with a thickness of 50 mm; a vegetation substrate in the form of crushed expanded clay with a thickness of 30 mm; and a vegetation layer. A drip irrigation system was installed above the hydro-accumulation boards, providing a water supply of 2 L/m2/day. A detailed description of this experimental roof is provided in article [34]. The thickness, thermal conductivity coefficient, volume weight, diffusion resistance, and sorption characteristics were then defined for each material. The material properties in each layer are specified in Table 2. The boundary conditions of the external environment are shown in Table 3. Figure 1 illustrates the observed locations in the structure, indicating the sensor locations within the actual experimental setup.

2.2.2. Boundary Conditions

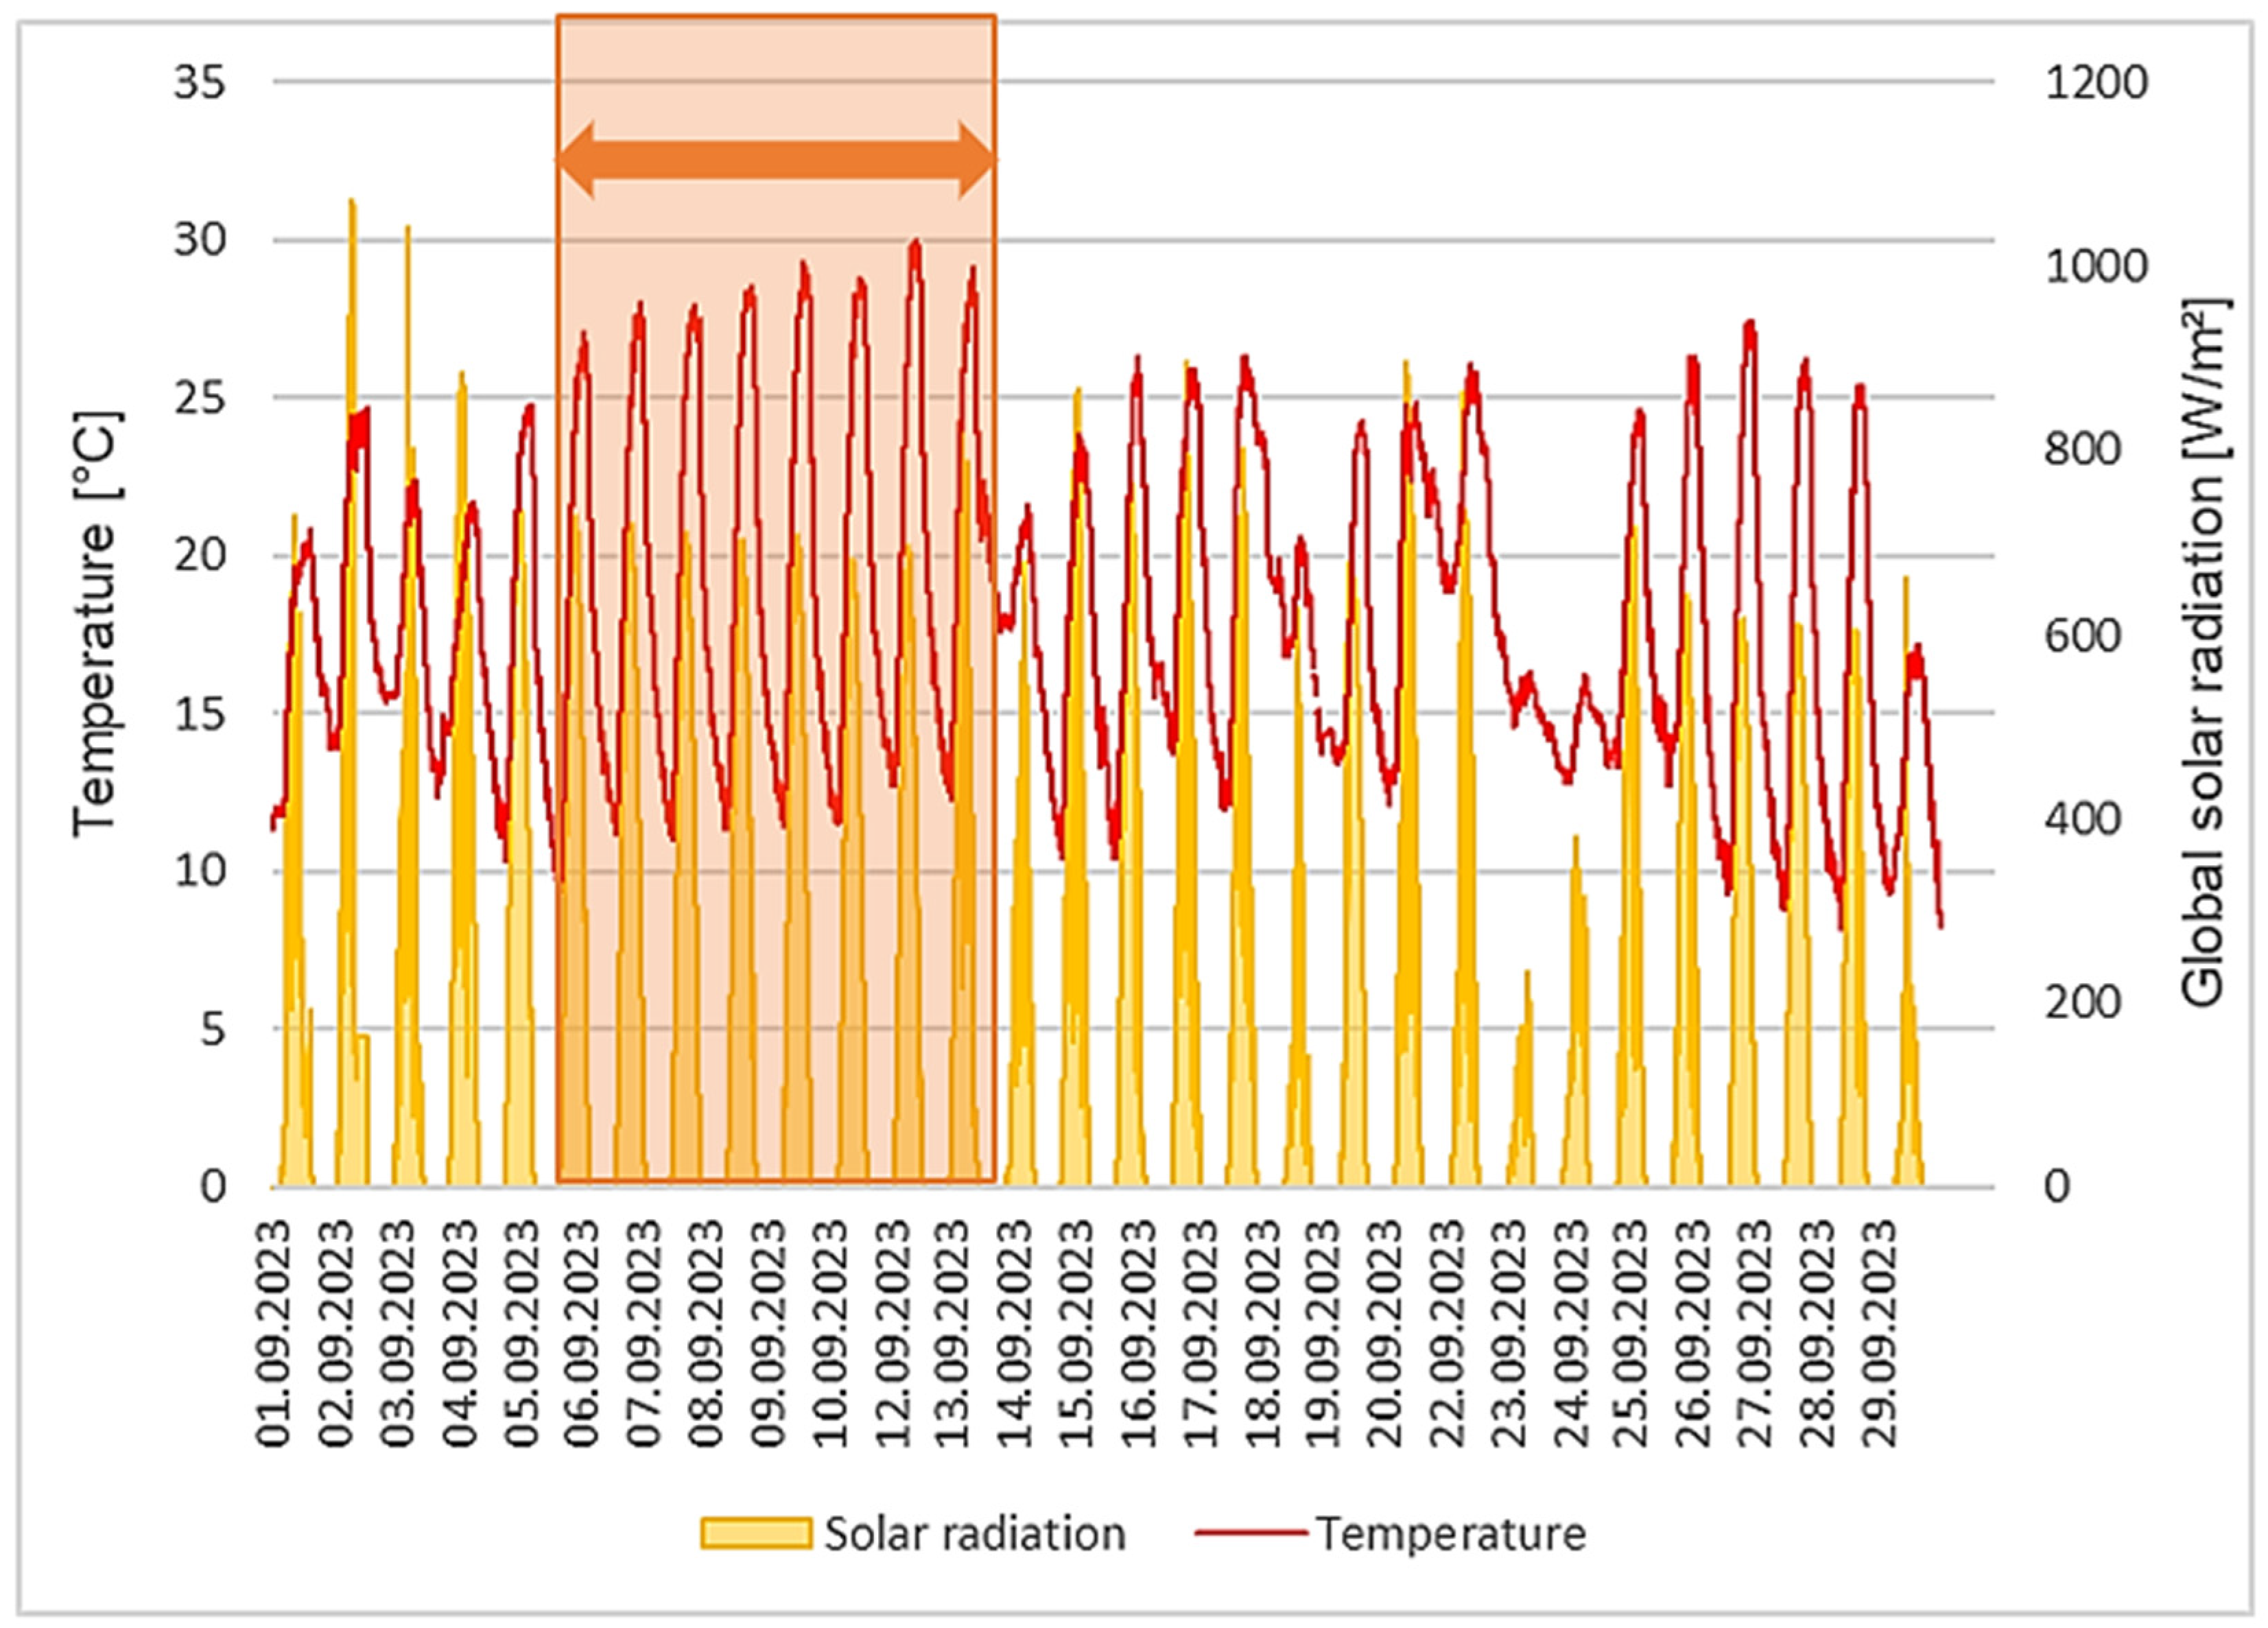
In order to ensure the relevance of the outputs in terms of boundary conditions, it was necessary to obtain climate data from the location of the experimental roof. Climatic data were obtained using a fixed weather station installed directly on the experimental roof. Based on the data collected and subsequent adjustment from the analyzed period, a WAC file was processed, containing hourly values: direct and diffusing solar radiation, outdoor temperature and relative humidity, air flow direction and speed, and air pressure. At the same time, the sensors inside the building recorded values for indoor temperature and relative humidity. This data served as the basis for processing and running the simulations. The course of the outside temperature and solar radiation, which are among the most important input variables, during the analyzed month of September 2023 is presented in Figure 2. Between 6 September 2023 and 13 September 2023, there is a favorable warming trend, characterized by steadily increasing outdoor temperatures and a regular trend in solar radiation. Although it is the end of summer, the temperatures are stable and above 25 °C.

2.3. Validation of the HAM Simulation Model with In-Situ Measurements

Data collection for validation took place over an eight-day period (6–13 September 2023), during which stable climatic conditions suitable for monitoring the effects of solar radiation and temperature fluctuations were recorded. During this period, it was possible to observe a sufficient daily difference between the maximum and minimum temperatures, which is desirable for testing the accumulation capabilities of a green roof.
The following were installed on the actual experimental roof:
  • Sensors in individual layers of the roof (especially in the substrate, thermal insulation, under the waterproofing, and at the level of the vapor barrier);
  • A temperature and relative humidity sensor in the interior;
  • A complete weather station with CSV output, operating with one-minute sampling intervals.
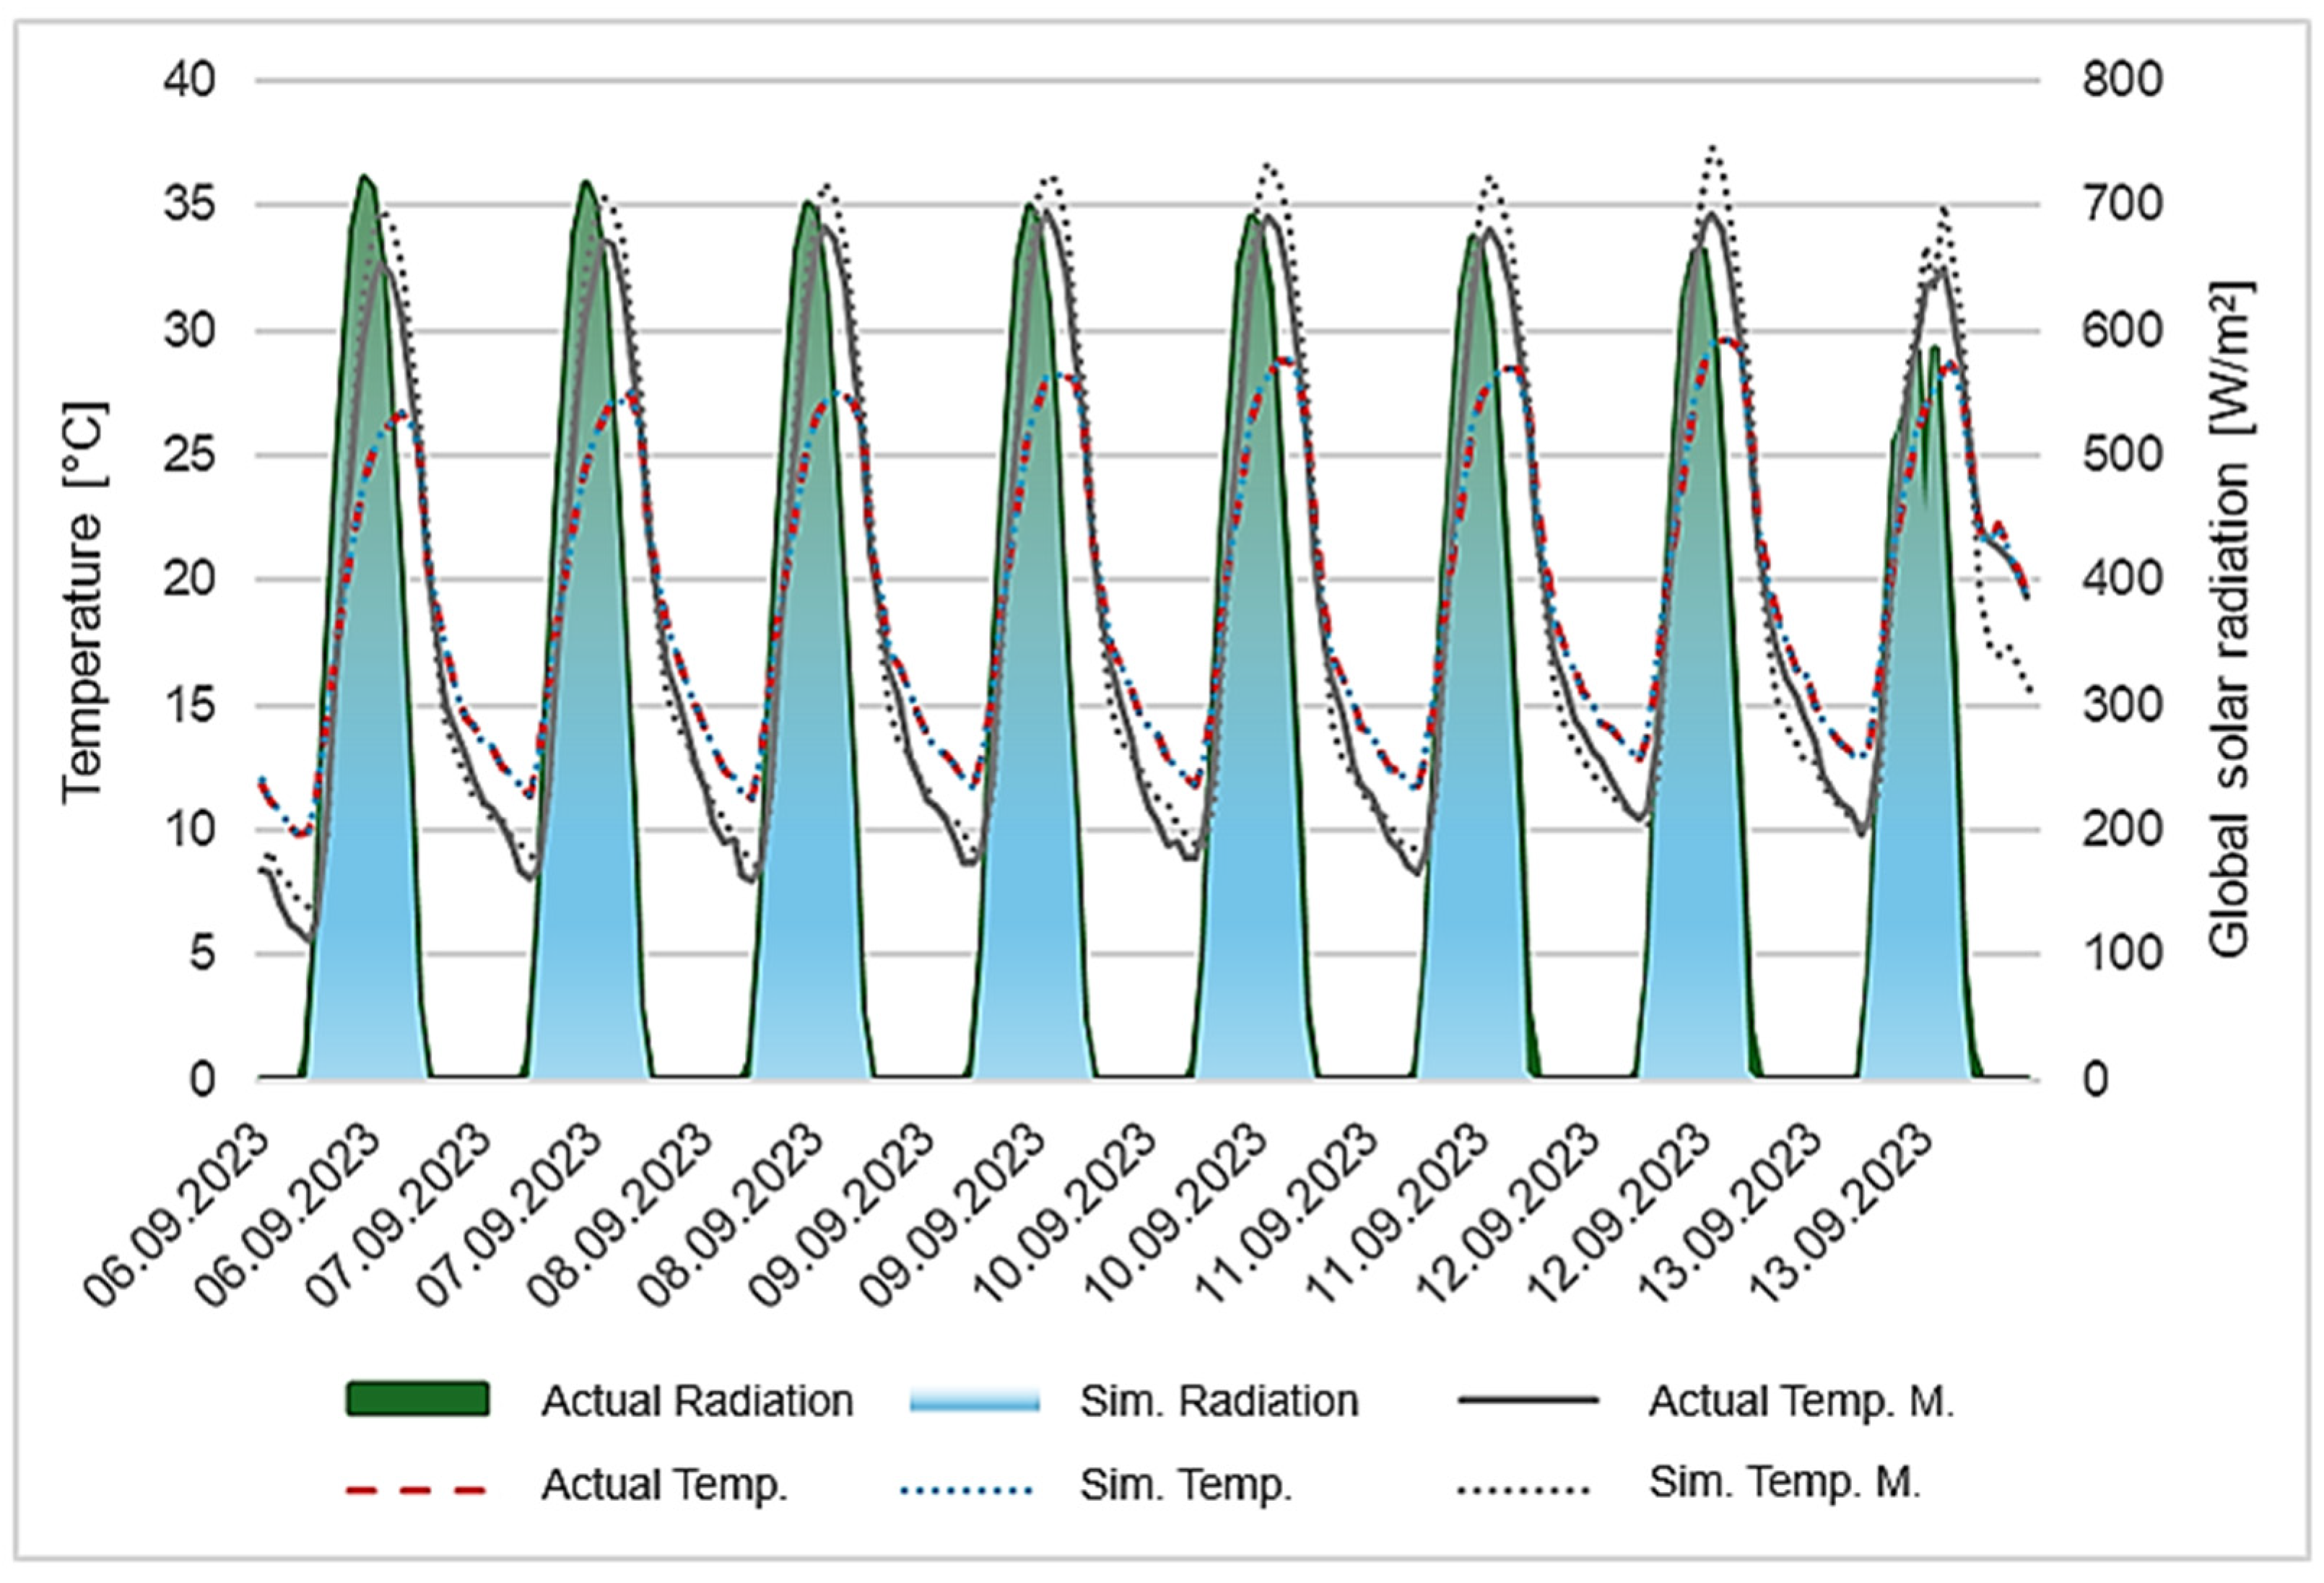
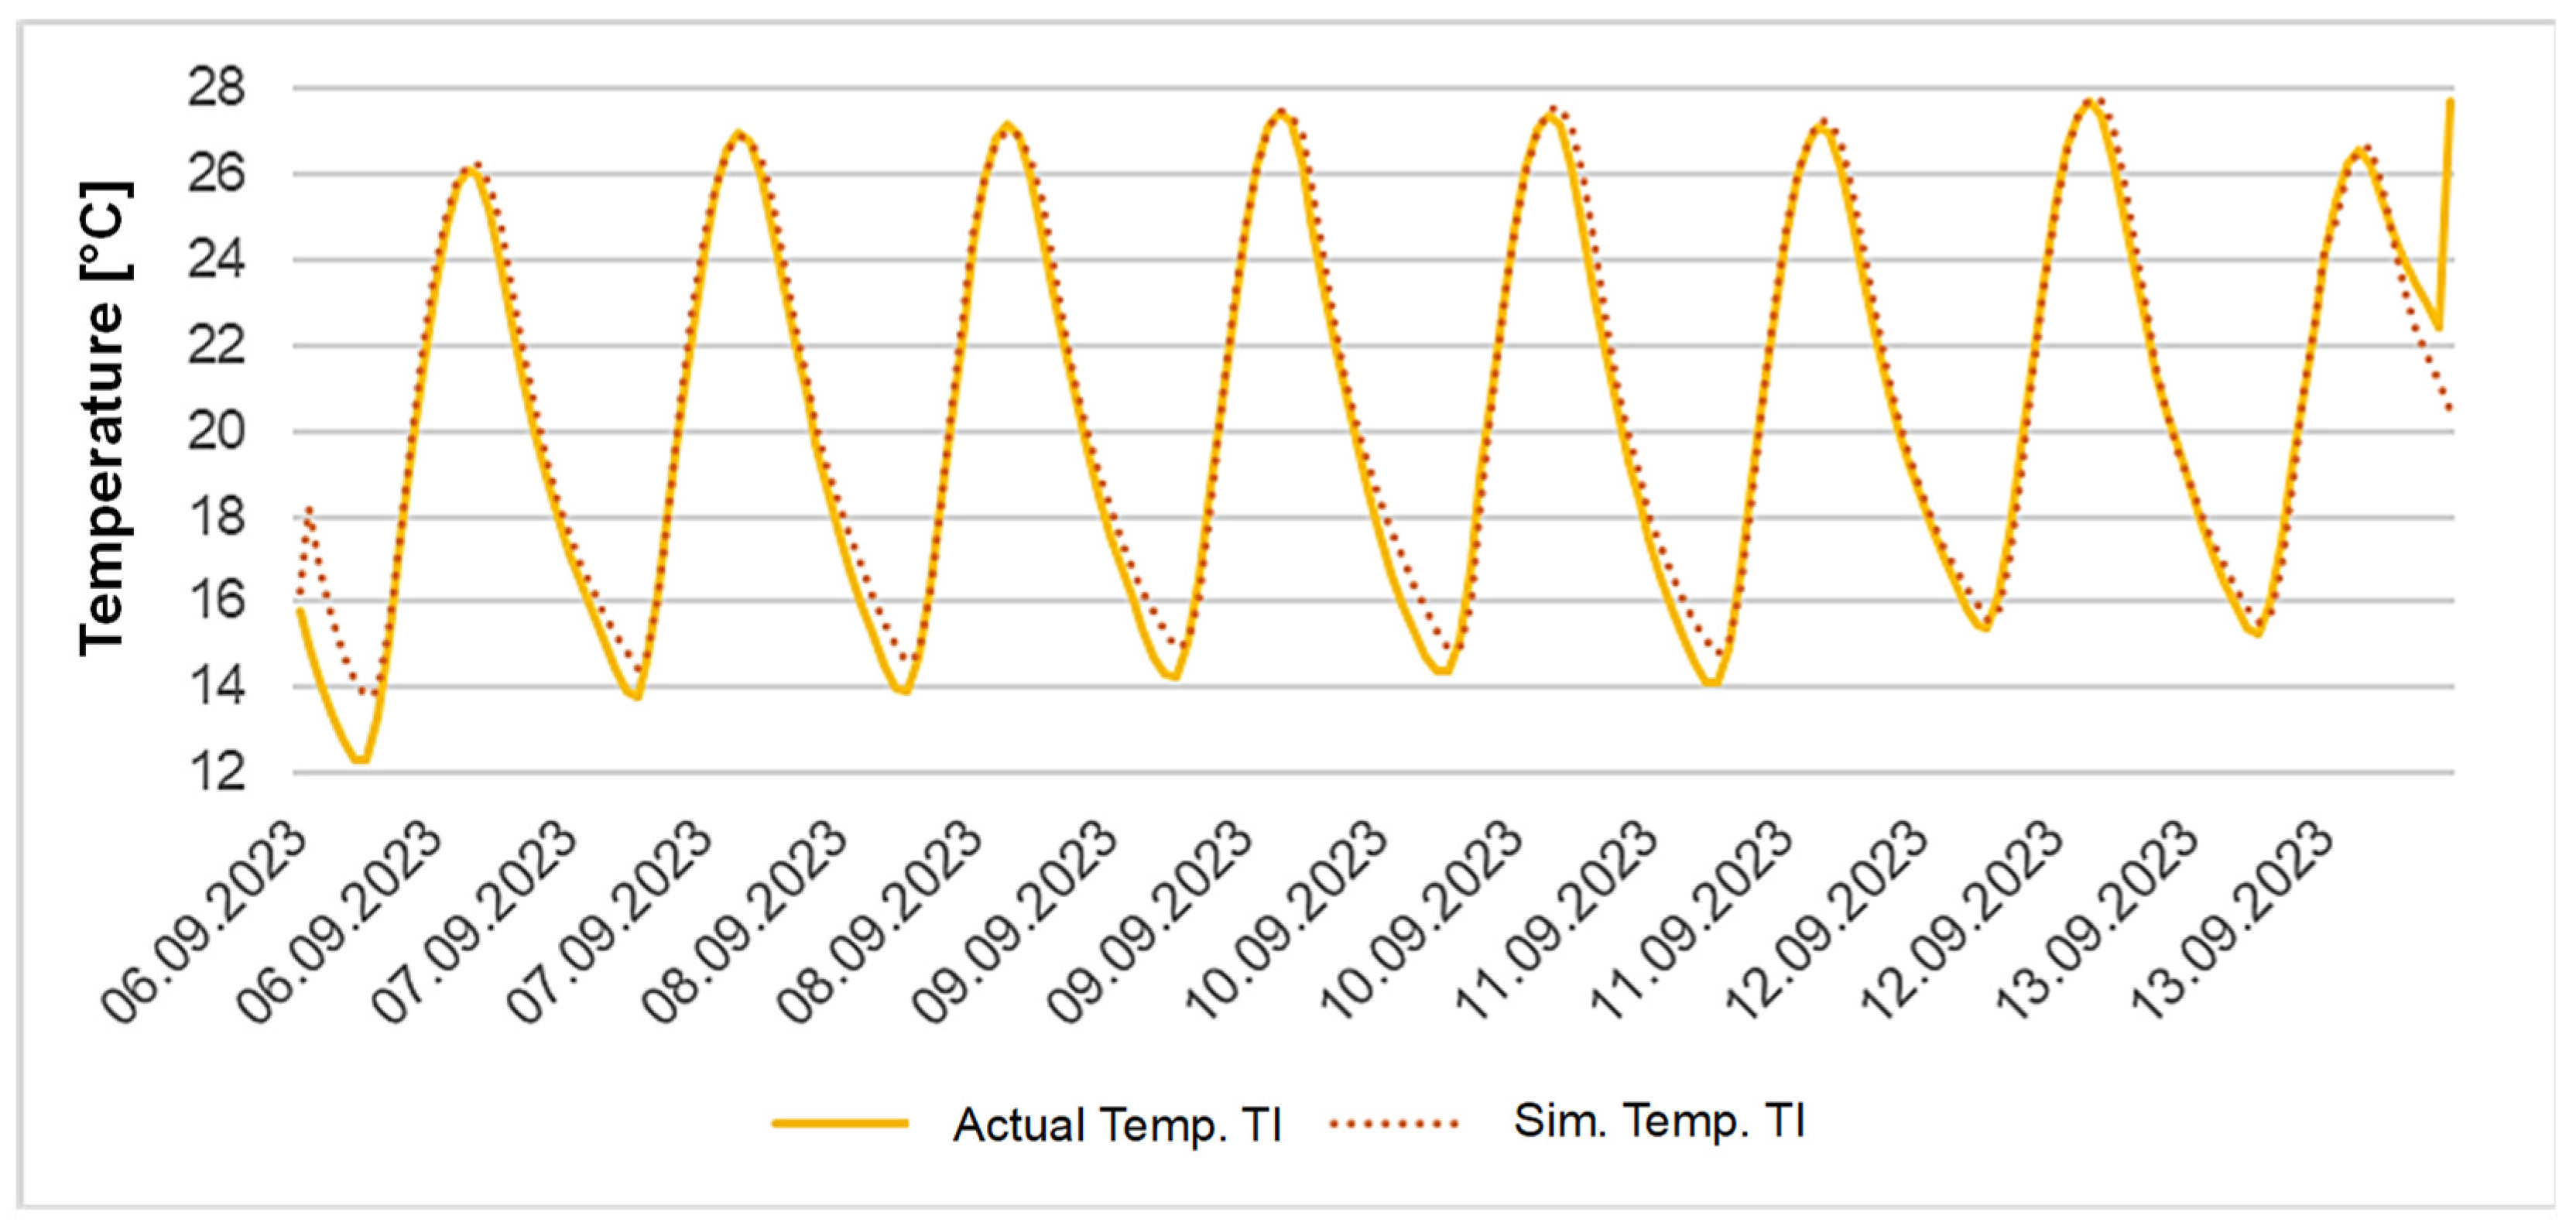
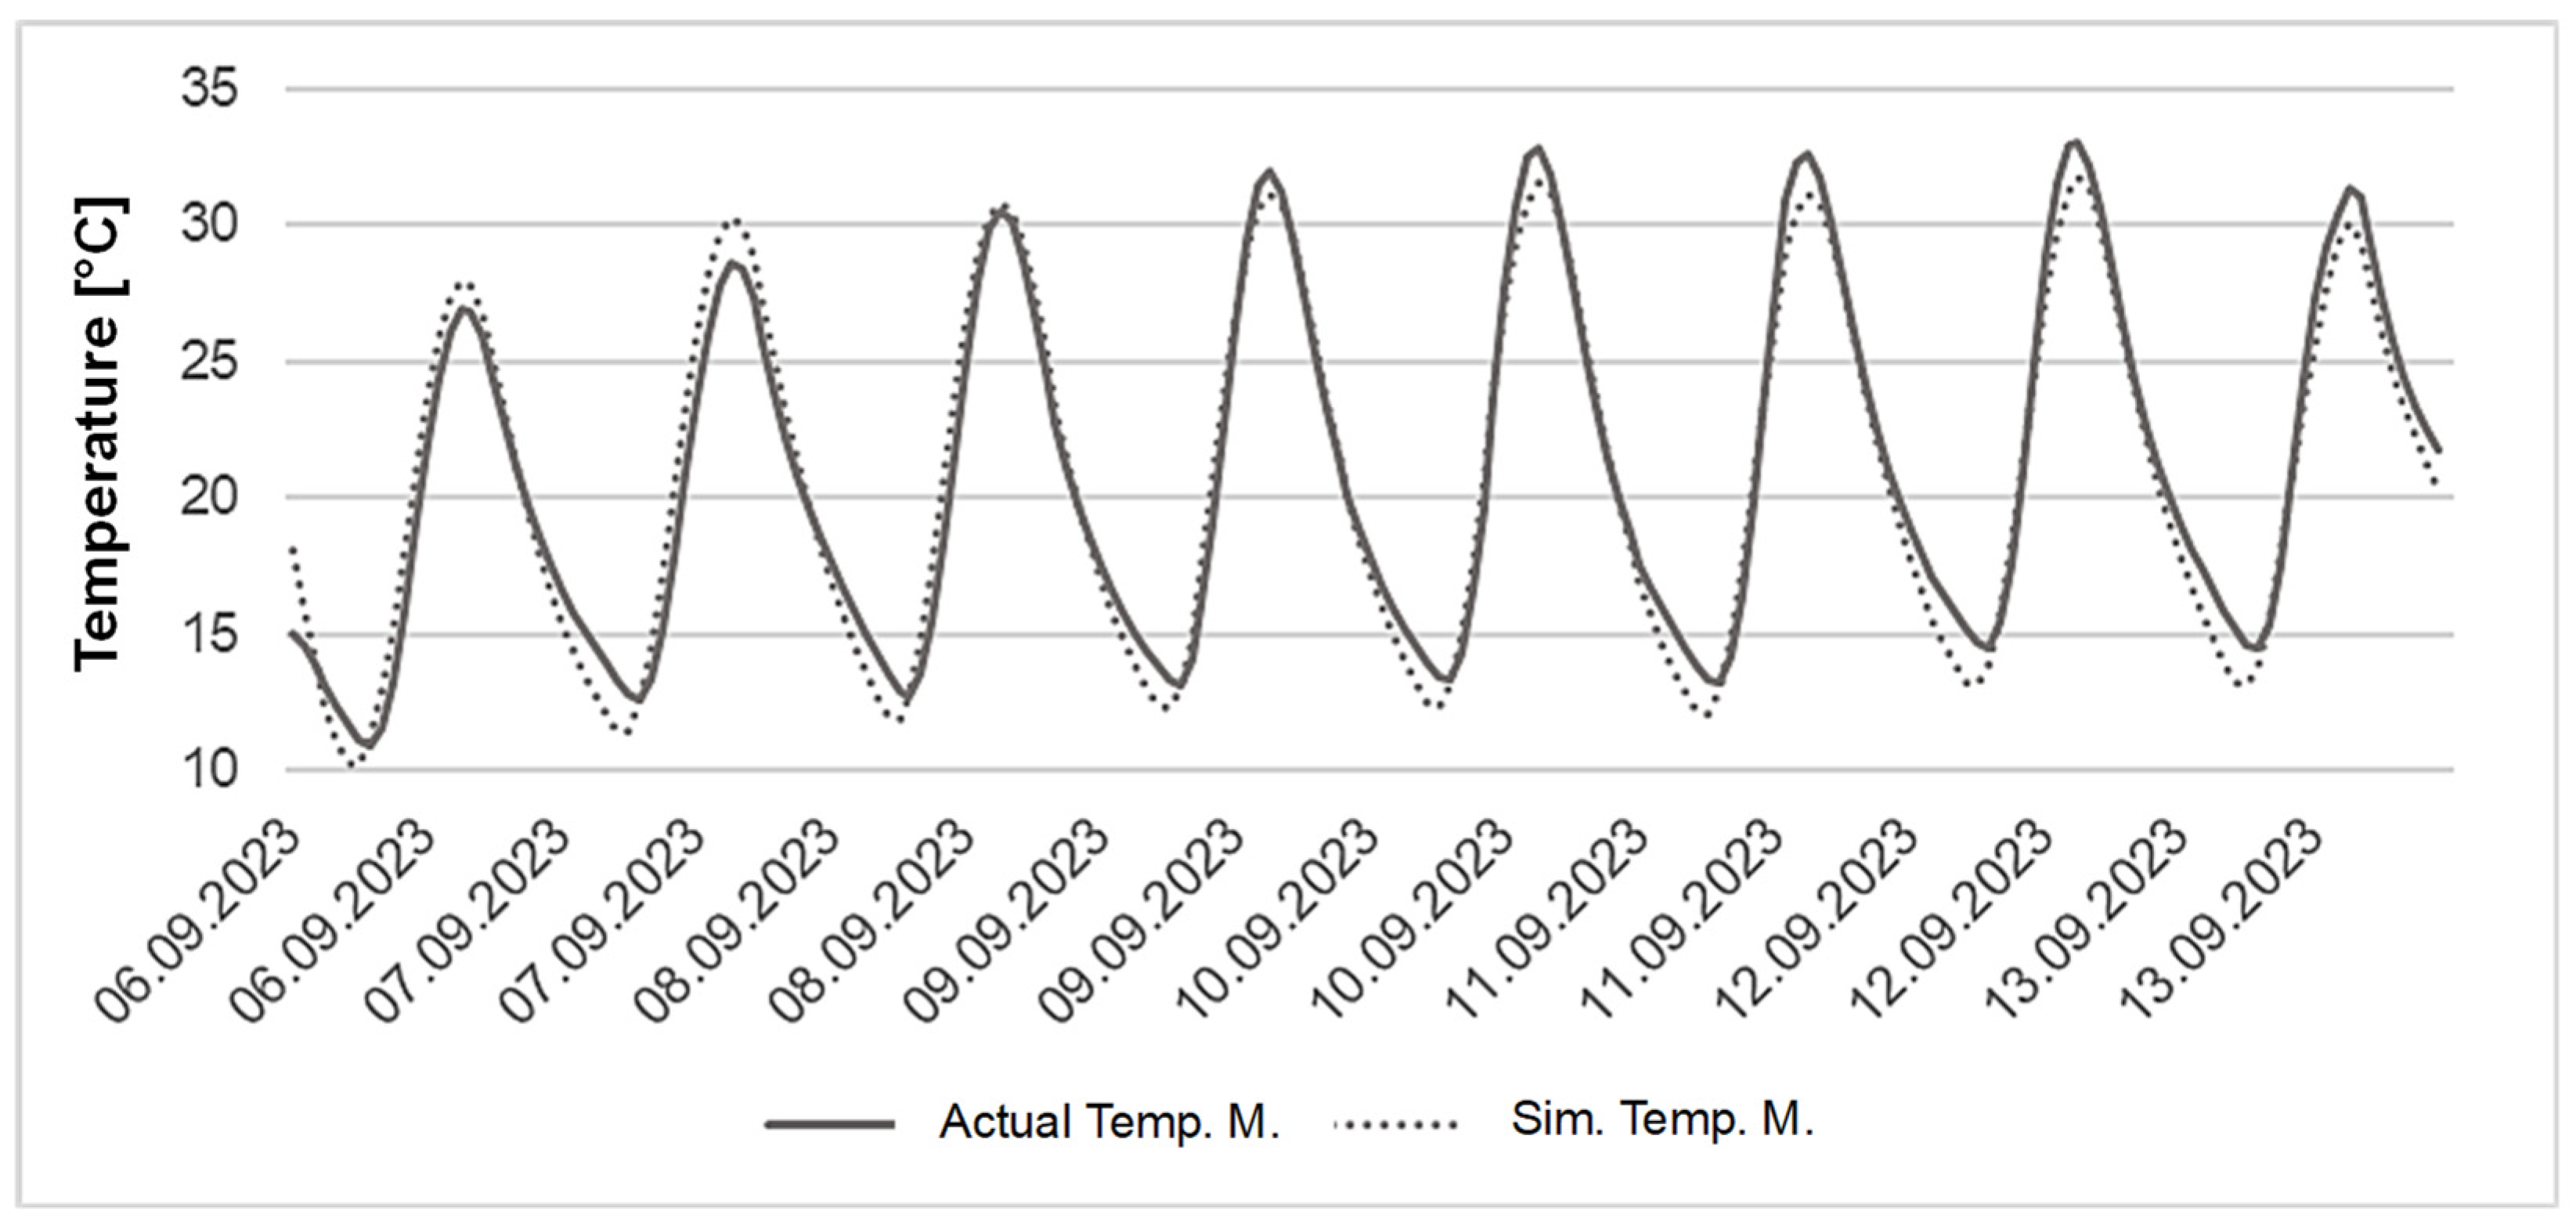
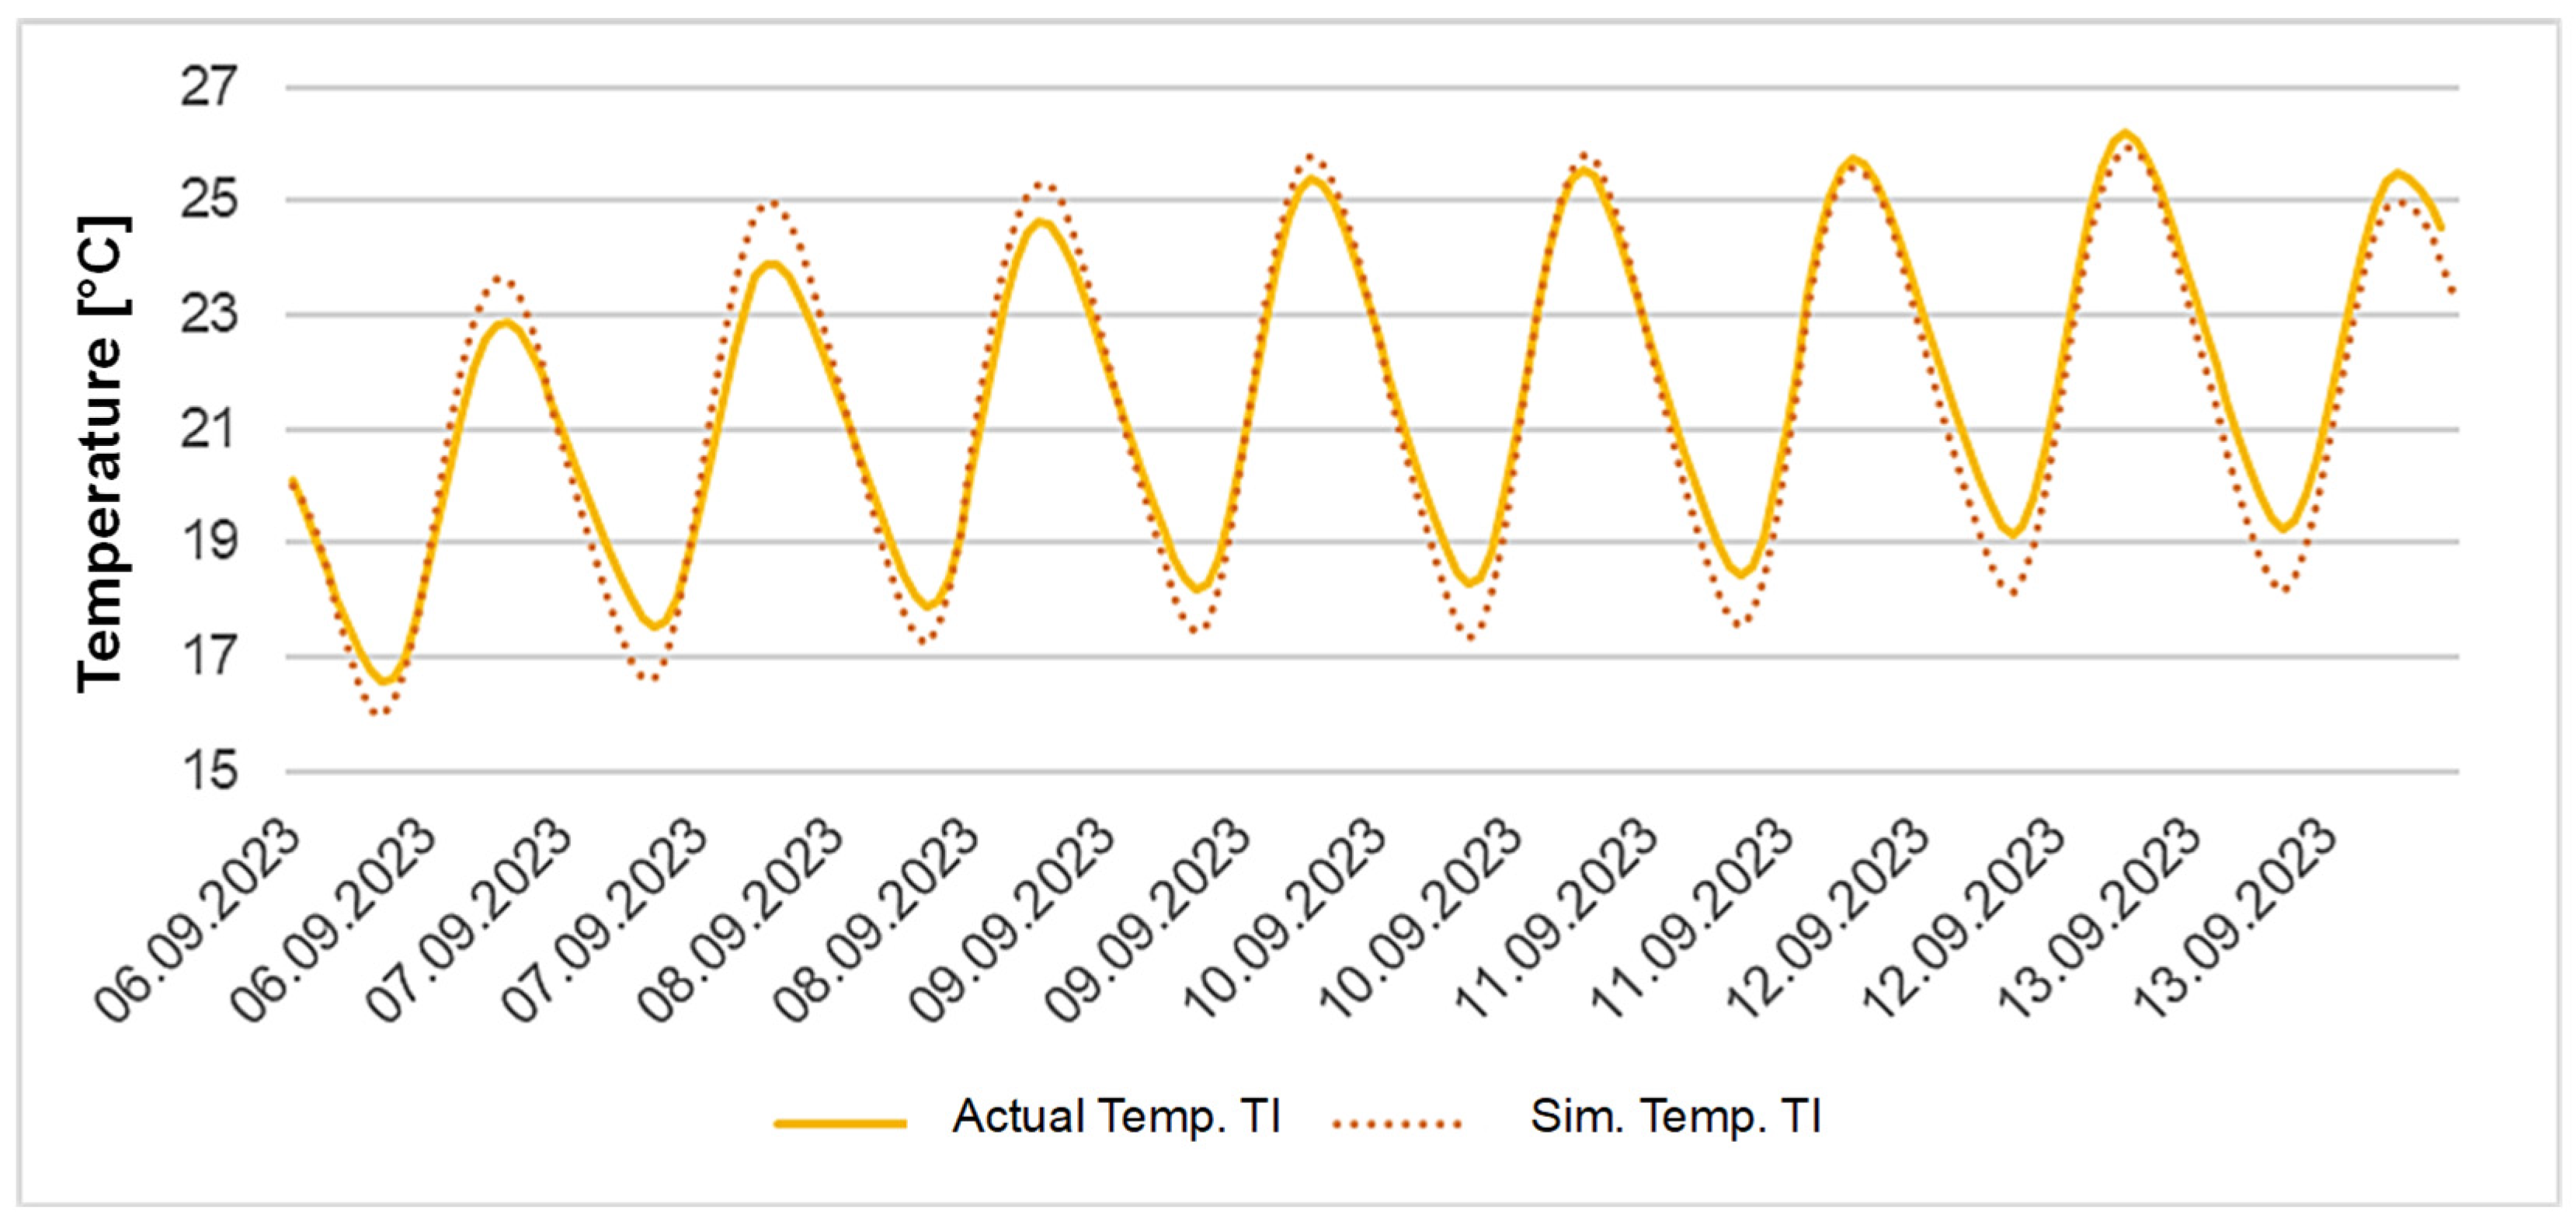
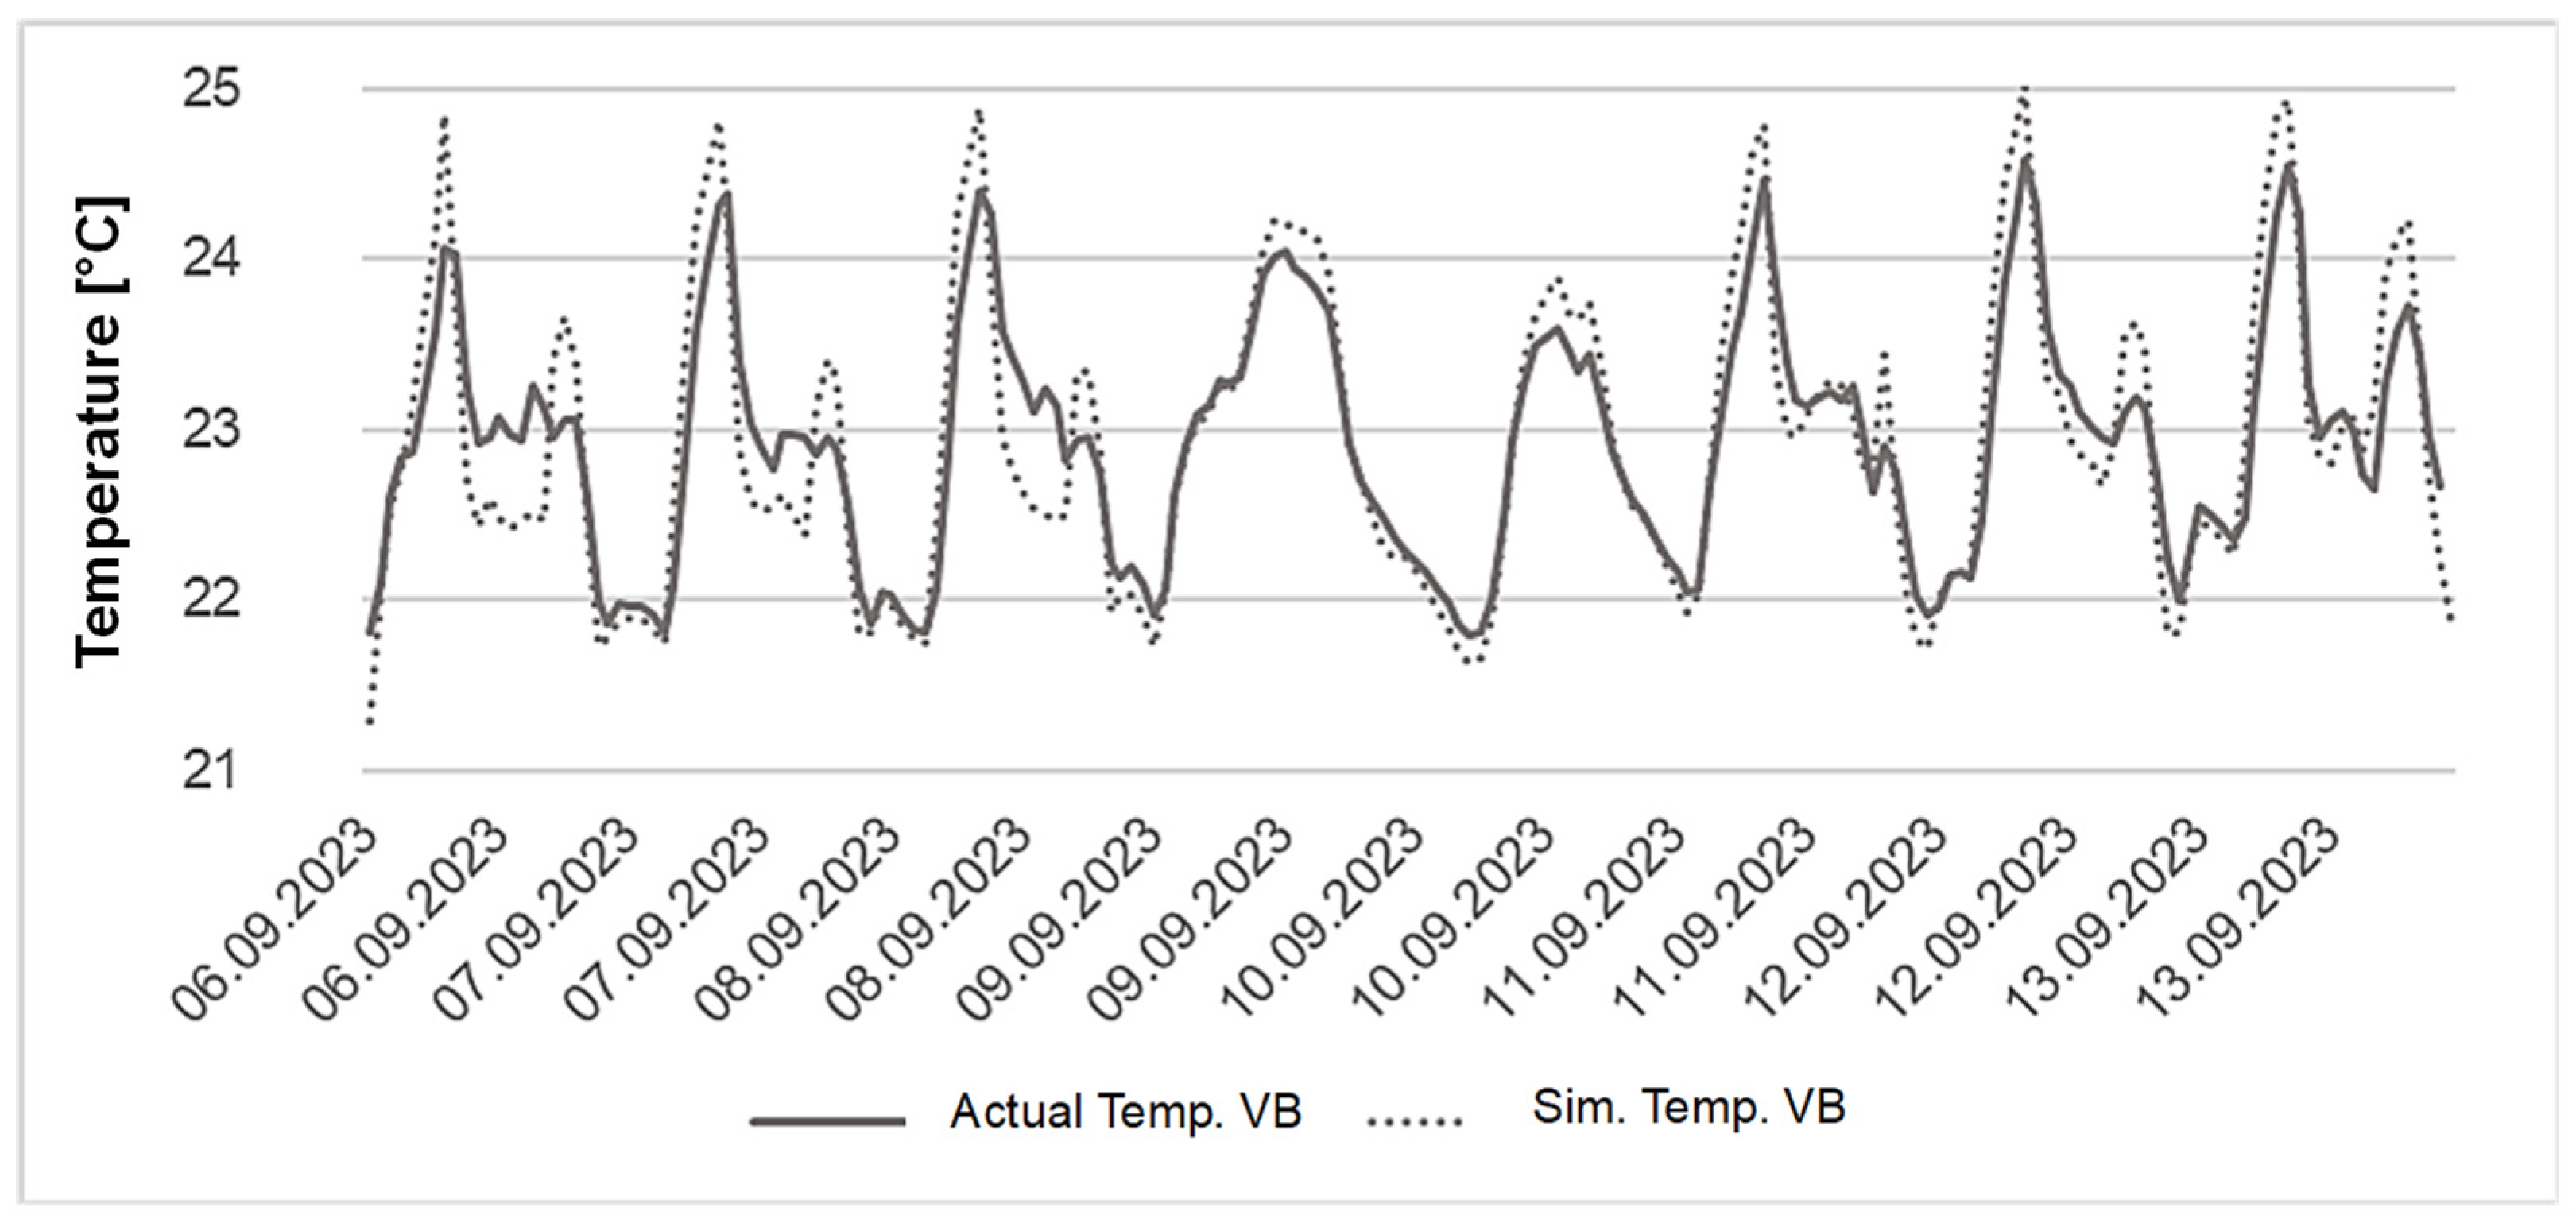
The model was initially validated on a reference roof without vegetation (marked as RR), then on a roof with a vegetation layer (EGR-H) [34]. The basic simulation model V0 was validated by comparing the simulation results with actual measured data. Subsequently, the input material parameters—in particular the volume weight, diffusion resistance, thermal conductivity coefficient and sorption curves—were iteratively refined until both a visually and numerically satisfactory agreement of the measured and simulated data was achieved. The results of the simulation model validation are shown in the graphs in Figure 3, Figure 4 and Figure 5, where the solid line represents the actual measured values, and the dotted line represents the simulated results.
For better readability, Table 4 presents the differences between the values from the simulation and the experimental roof. The differences between the maximum and minimum temperatures are presented, as well as the difference in temperature fluctuations in the individual layers of the structure and the percentage error of the simulation. The simulation error for thermal fluctuations was quantified using the mean absolute percentage error (MAPE) between the measured and simulated values [35]:
M A P E = 1 n i = 1 n M i S i M i 100
where Mi is measured values and Si is the simulated values. The mean absolute percentage error is presented (in percentage) in Table 4.
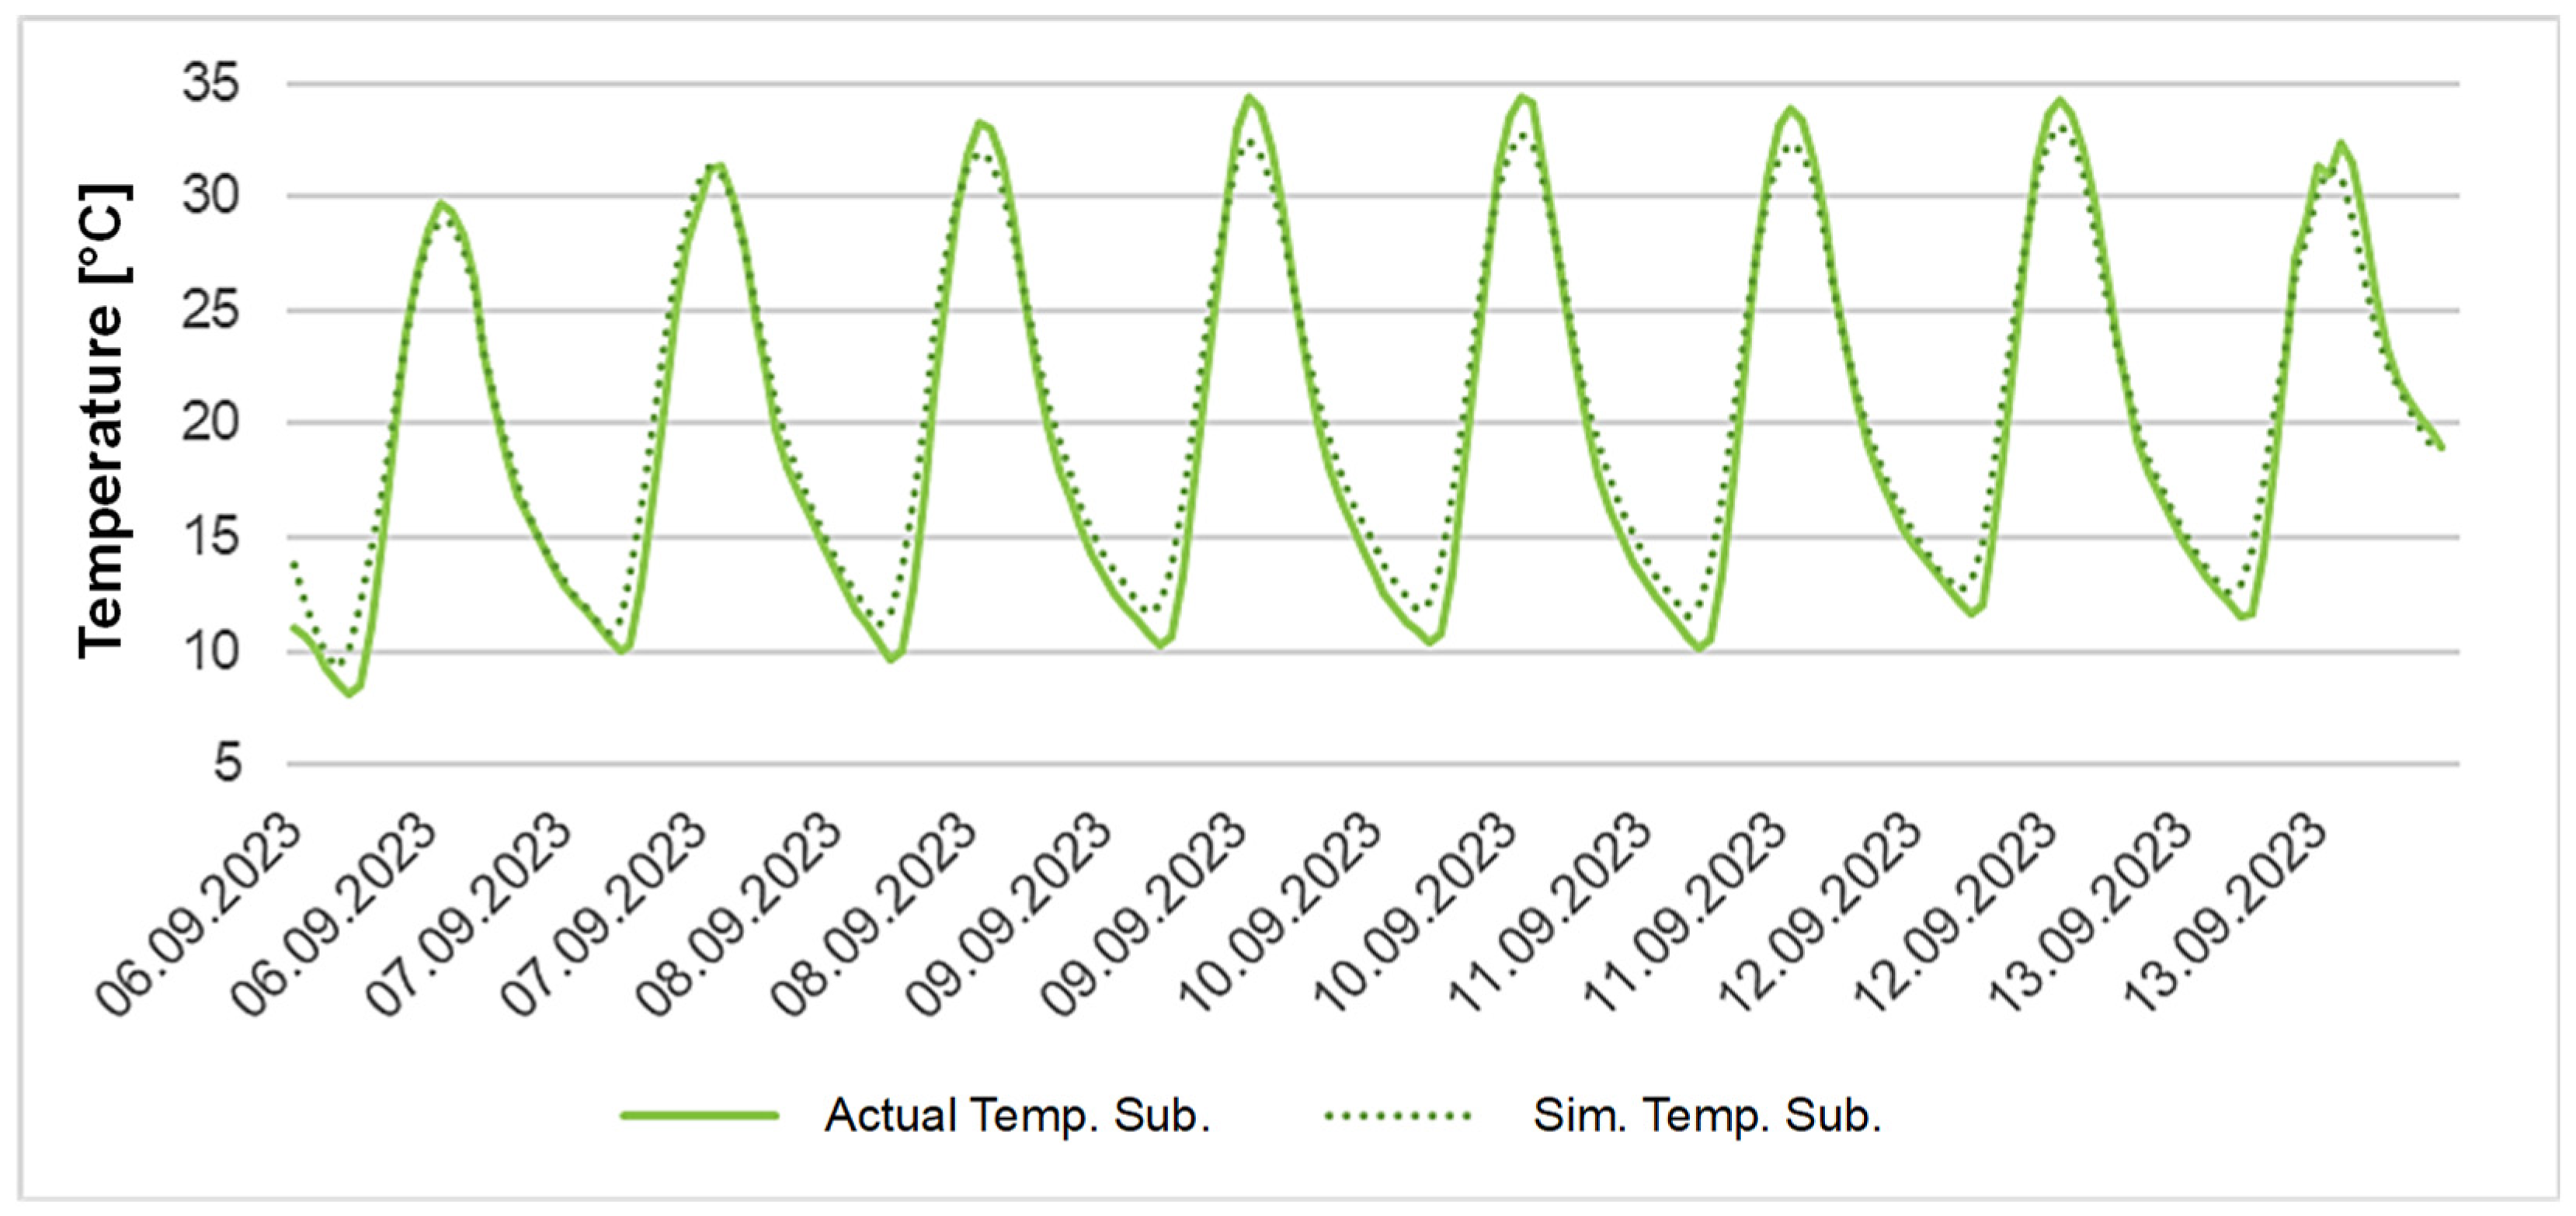
Based on the favorable validation of the simulation model of the reference roof, the simulation of the vegetation layer and the creation of the basic variant V0 were carried out. For the vegetation layer, validation was more challenging due to pronounced fluctuations in substrate moisture, which significantly affects thermal conductivity and heat capacity. In the simulations performed in WUFI, transpiration was modeled within the standard SVAT (soil–vegetation–atmosphere transfer) calculations, based on generalized characteristics of the vegetation layer, without explicit differentiation of plant species or a detailed description of LAI (leaf area index) and stomatal resistance. This modeling approach was chosen because WUFI is capable of simulating generalized cooling effects without the need for detailed botanical classification, which allows the results to be applied across different climatic conditions. In addition, the comparative nature of this study was addressed, focusing on the difference between roof compositions (EGR vs. RR vs. PV), while maintaining consistent model conditions. The scientific literature demonstrates that parameters such as LAI, vegetation type, stomatal properties, and substrate moisture content significantly influence heat and moisture transfer through vegetation structures [36,37,38]. However, these detailed parameters have been the focus of studies investigating the impact of specific plant types and vegetation, where these boundary conditions appeared to be the most important. In our research, however, we focused on the diametrically different input boundary conditions of various design variants, specifically the type and thickness of the supporting structure and the thickness of the substrate. Future work will extend the model by explicitly defining LAI, stomatal resistance, and species composition of the vegetation cover, which will allow for more detailed calibration of the model results against experimental data and increase the accuracy of the simulation. Despite these challenges, the simulation was optimized to reproduce the roof’s thermal behavior with reasonable accuracy. The results of the validation of the simulation model with the vegetation layer are shown in the graphs in Figure 6, Figure 7, Figure 8 and Figure 9, where the solid line represents the actual measured values, and the dotted line represents the simulated results.

2.4. Model Variants for Parametric Study

The successfully validated green roof model (V0) subsequently served as the reference for further parametric variants.
Three design variants were gradually created:
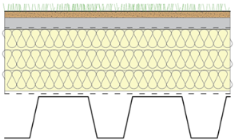
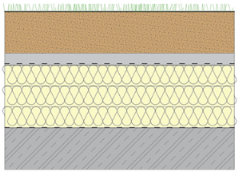
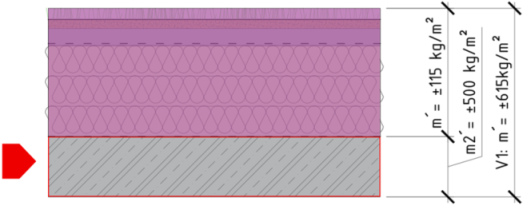
  • V1: modification of the type of load-bearing layer from the original trapezoidal sheet metal to a reinforced concrete slab (200 mm thick), with an unchanged vegetation layer, in order to analyze its accumulation capacity for the thermal response of the roof structure;
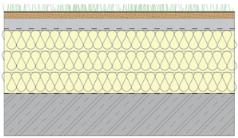
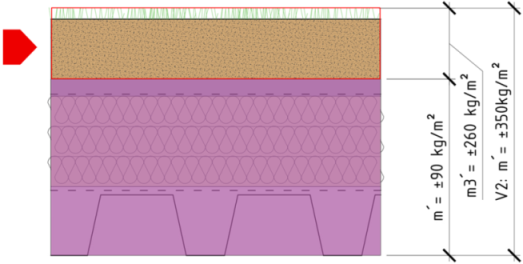
  • V2: modification of the thickness of the vegetation substrate from 30 mm to 200 mm while maintaining the original load-bearing layer (transition from extensive to intensive vegetation structure);
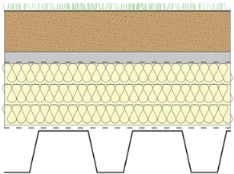
  • V3: combination of both modifications—reinforced concrete load-bearing slab and increased substrate thickness.
A detailed summary of the design modifications in each variant, accompanied by a schematic illustration, is provided in Table 5.

3. Results

This section presents the results of the numerical simulations for individual variants of green roofs. Variants V1, V2, and V3 were analyzed, each benchmarked against the basic reference model, V0. The aim of the comparison was to assess the impact of individual design modifications on the thermal behavior of the roof cladding and to identify possible improvements in terms of thermal stability. These variants were then compared with each other, providing a comprehensive assessment of the effectiveness and synergy of the individual changes.
The analysis focused on the temperature and heat flow at selected levels of the roof structure (Figure 1), specifically:
  • At the interface between the vegetation substrate and the hydroaccumulation board (Sub);
  • At the level of waterproofing membrane (M);
  • Under the top layer of thermal insulation (TI);
  • At the interface between the vapor barrier (VB) and the supporting structure.
For a detailed analysis, a three-day period (8–10 September 2023) was selected from the validated period (6–13 September 2023). This interval was chosen to enhance the clarity of the graphical outputs, as displaying the entire time range would reduce readability and make it difficult to identify differences between individual model scenarios. The selected period is located in the central portion of the validated period, which eliminates potential edge effects and ensures the representativeness of the results for the assessed climatic and operating conditions. The simulation commenced on 8 August 2023 and lasted three days. The selected simulated interval is from 8–10 September 2023. The results are graphically processed so that each analyzed layer is color-coded according to the scheme in Figure 1.

3.1. Comparison of Variants with Reference Solution (V0)

Variant V1—Modification of the supporting structure:
A comparison of variant V1 with the reference solution (V0) indicates that replacing the thin-walled steel profile with a more robust reinforced concrete structure has a limited effect on the temperature distribution of roof cladding layers. A more significant effect was observed primarily in the attenuation of heat flux fluctuations at the vapor barrier level, where a decrease in amplitude was recorded. Differences in other layers were negligible.
Temperature profiles confirm the minimal impact of the supporting layer modification. The only notable difference was observed at the vapor barrier level, where the maximum temperature decreased by approximately 2.3 °C. The type and thickness of thermal insulation, rather than the supporting structure, continue to dominate heat transfer.
Variant V2—Modification of substrate thickness:
Increasing the vegetation substrate thickness from the original 50 mm (V0) to 200 mm (V2) had a substantial impact on the thermal behavior of the roof. Heat flux fluctuations at the substrate level were reduced to approximately 18% of the original V0 values. A significant reduction in fluctuations was also observed in other layers, for example, at the level of thermal insulation, where they were reduced by half. A significant phase shift of up to 6 h was also recorded, indicating better accumulation and delayed heat transfer.
Temperature differences between variants were most pronounced at the waterproofing membrane (M) layer, where maximum temperature deviations exceeded 8 °C. While in variant V0 the temperature peak was reached around noon, in variant V2, it shifted to nighttime hours, which indicates the accumulation capacity of the substrate. However, the disadvantage of this variant remains the unsuitable supporting structure—steel trapezoidal sheet metal has low thermal capacity and cannot prevent heat from penetrating into the interior, which reduces the efficiency of the entire composition.
Variant V3—Combined modification of substrate thickness and type of supporting structure:
The combination of a thicker substrate layer and a massive, reinforced concrete supporting structure in variant V3 brought a synergistic effect from both previous changes. The results presented the most significant reduction in heat flow fluctuations in all monitored layers—from a twofold to a sixfold reduction compared to variant V0. No heat gains were recorded at the level M and VB during the period analyzed.
Temperature profiles confirm effective attenuation of thermal oscillations—at the M level, fluctuations decreased from 18.9 °C (V0) to 4.7 °C (V3) and at the TI level from 8.2 °C to 3.2 °C. V3 exhibited the highest thermal stability, as the combination of substrate and reinforced concrete provides high thermal storage capacity and effectively delays and dampens heat transfer to the interior.

3.2. Comparison of Variants

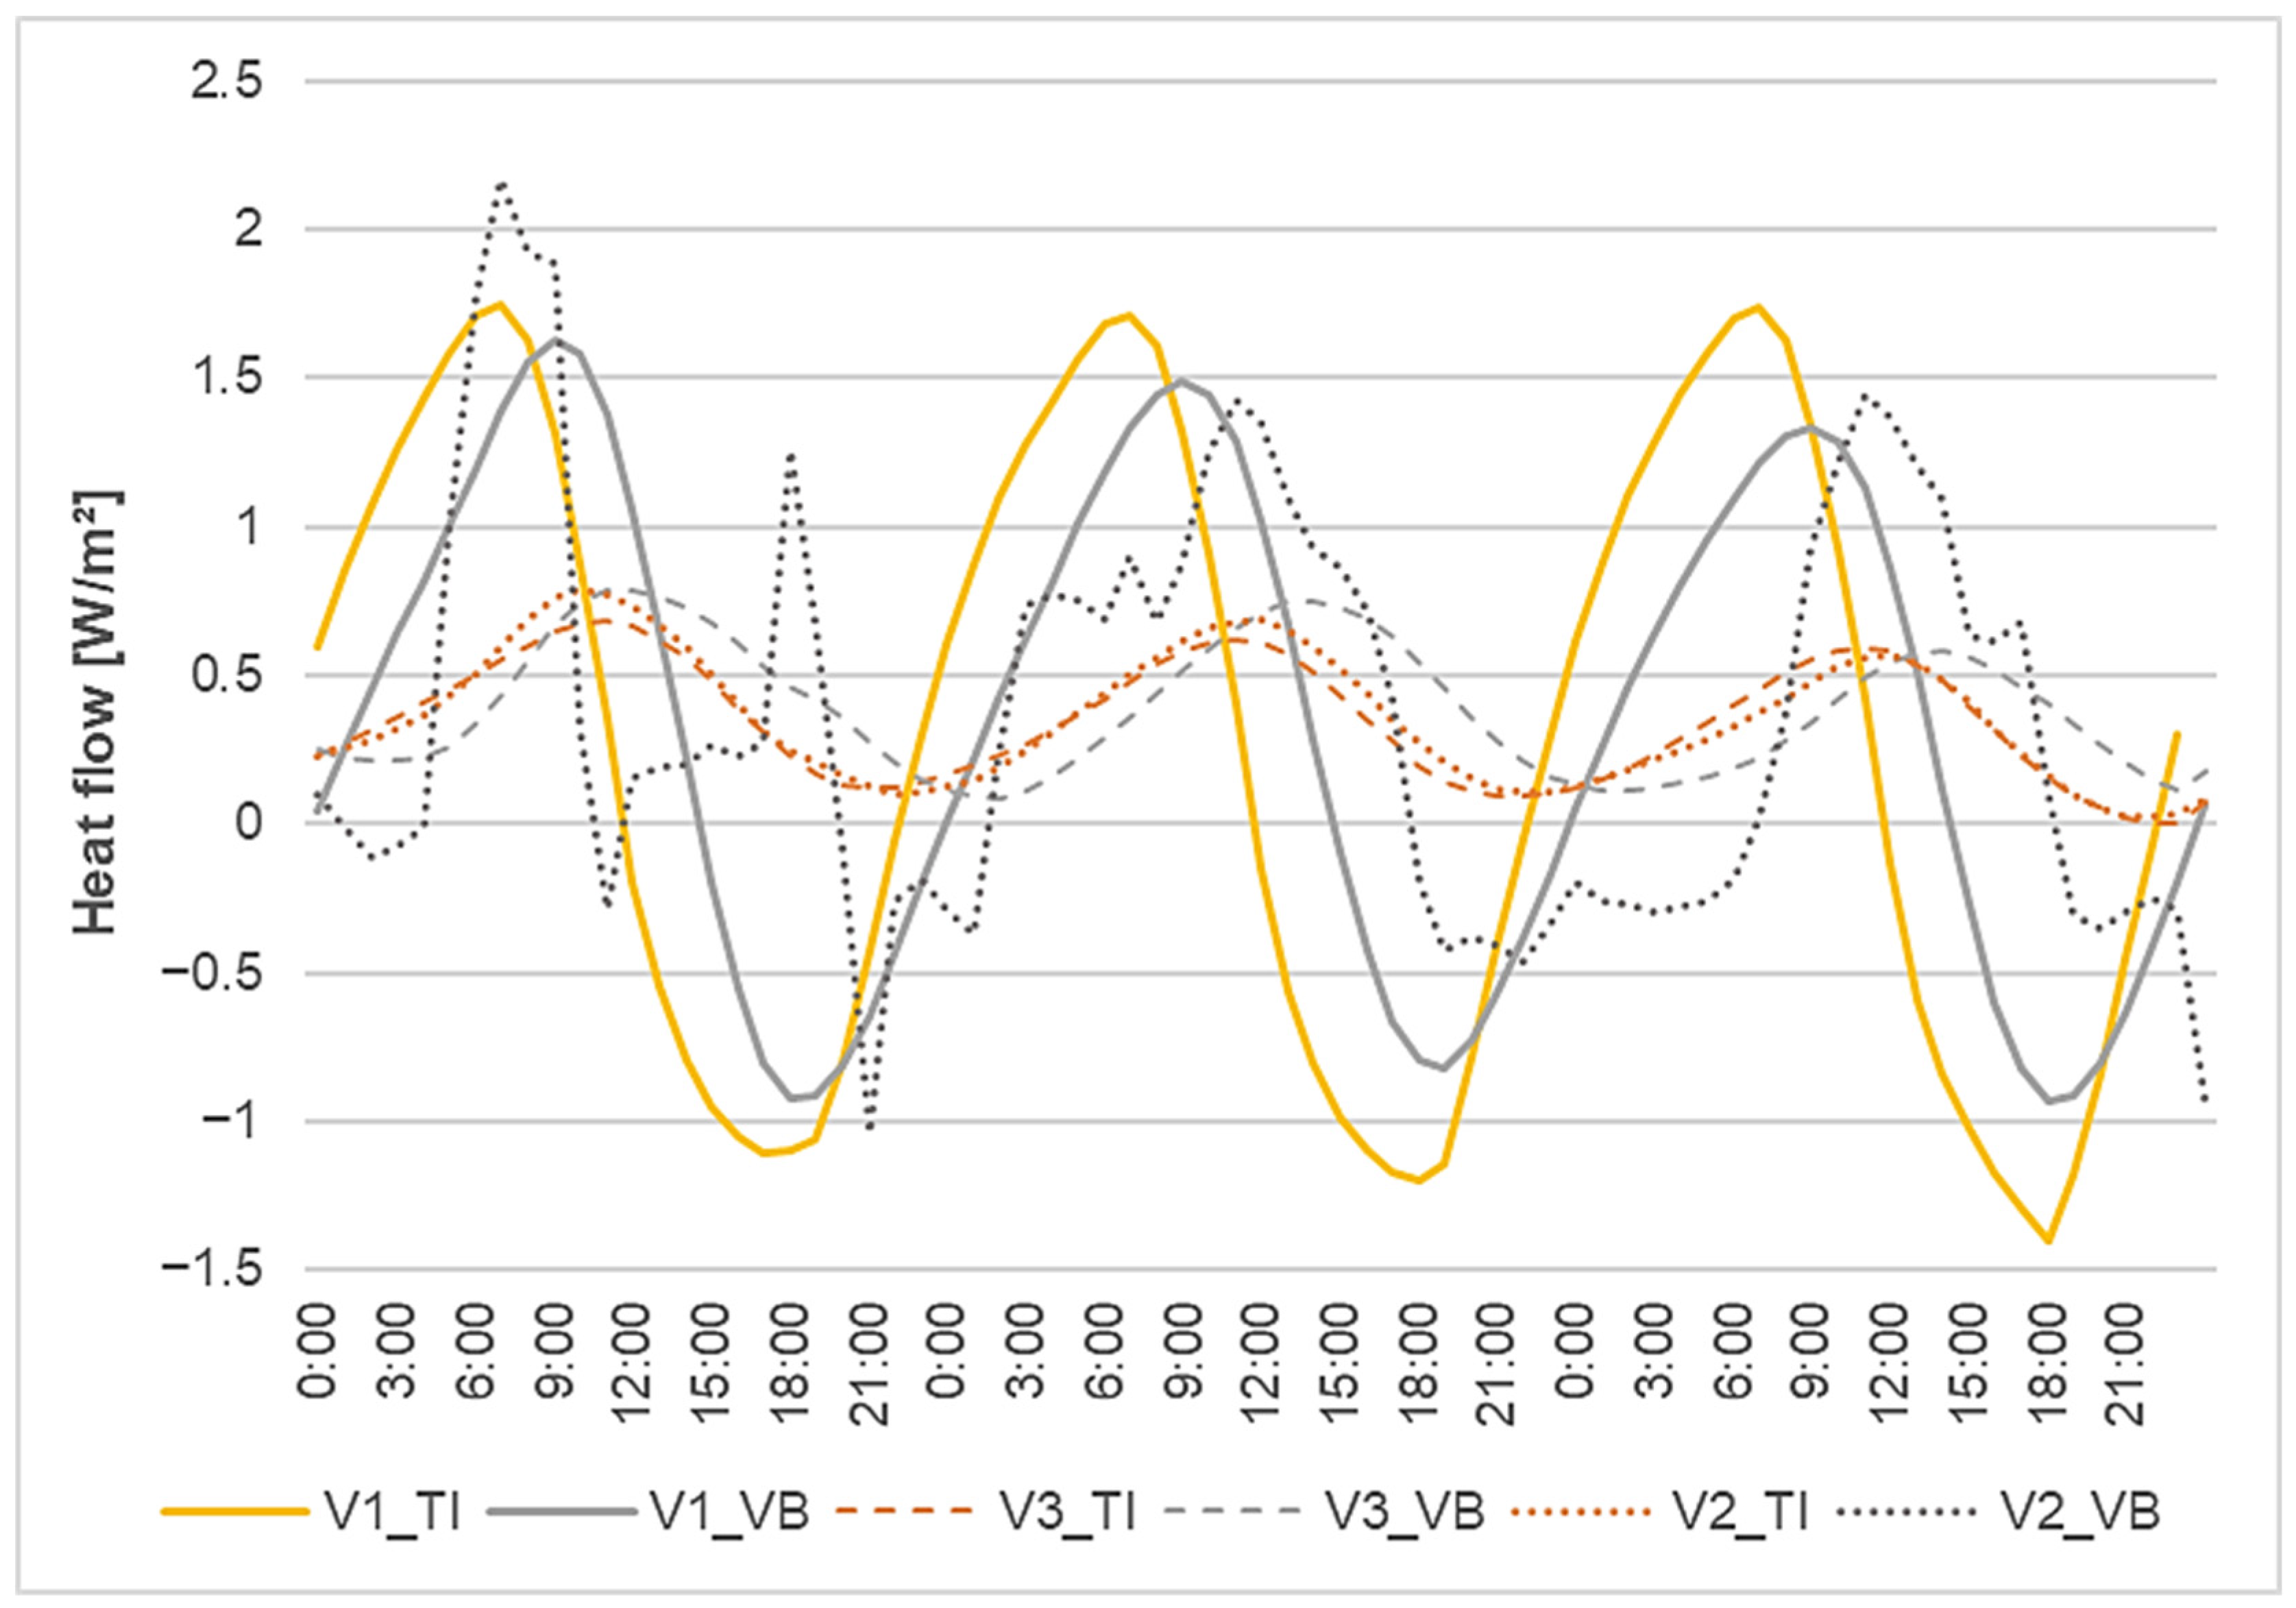
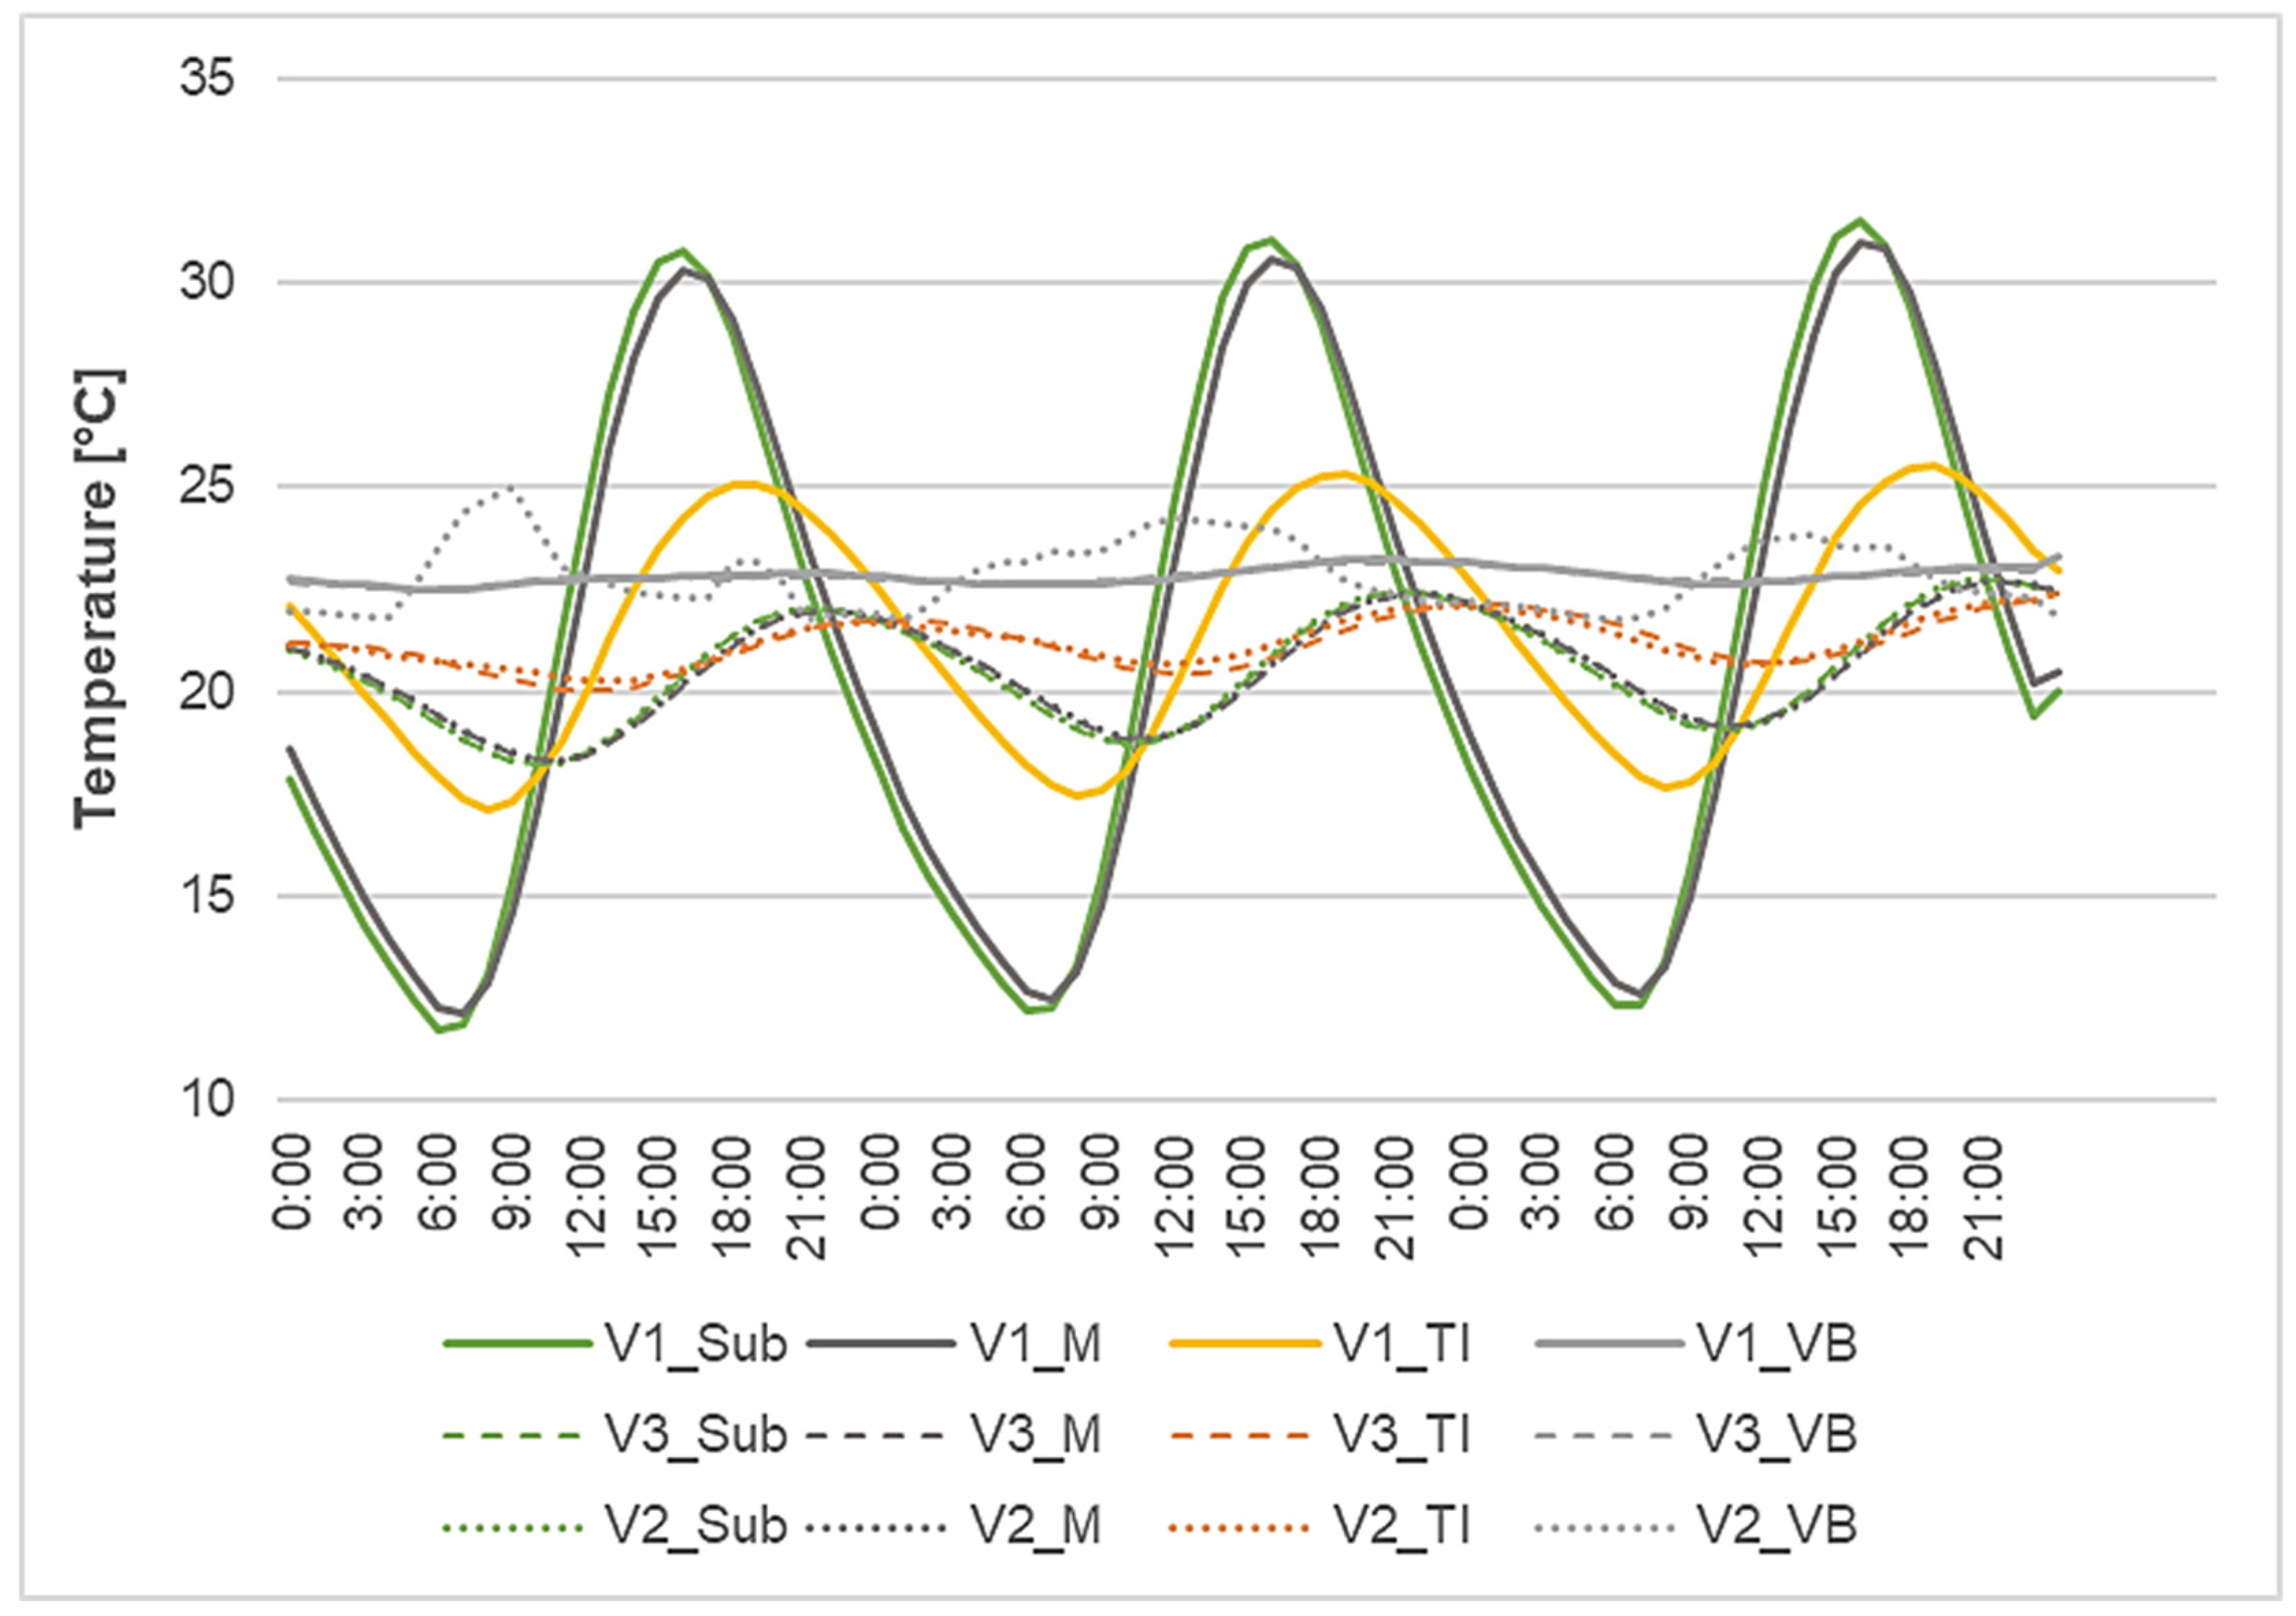
In this section, the focus was on comparing the results of the individual modified variants to determine the most suitable variation in the parametric study. The graphs in Figure 10 and Figure 11 present the heat flow curves for the selected period for variants V1, V2, and V3. The graph in Figure 12 shows the temperature profiles within the composition of the selected variants. The solid line represents the values for variant V1, the dotted line represents the values for variant V2, and the dashed line represents the values for variant V3.
The heat flow curve at the substrate level highlights a significant influence of substrate thickness, which is particularly evident in variants V2 and V3. Due to the sufficient thickness of the substrate, heat transport through the structure is effectively reduced. The heat flow oscillation around the value of 0 ranges up to 10 W/m2, while in the case of a 30 mm substrate, significantly higher heat gains are achieved by the substrate layer, reaching almost 70 W/m2. Regarding heat flow transport through other layers of the structure (Figure 11), the most favorable results are seen in variant V3. The graph demonstrated that variant V1 has a minimal impact on heat flow transport through the structure. However, it has a significant role in comparison with V2 at the VB level, where the trapezoidal sheet metal carrier layer’s lack of accumulation capacity is evident. Here, there is a significant fluctuation caused by the interior temperature. A massive reinforced concrete slab can effectively dampen these oscillations.
Similar patterns are observed in the temperature distribution within the structure (Figure 12). The change in the supporting structure affects the temperature profile primarily at the VB level, as the absence of substrate heat accumulation leads to large temperature fluctuations at the substrate and M levels. The minimal impact of substrate thickness on the temperature regime in variant V1 is clearly evident. Conversely, the combination of greater substrate thickness and the modification of the supporting structure optimizes temperature stabilization throughout the roof assembly.

4. Discussion

The parametric study provided valuable insights into the impact of structural modifications to green roofs on their thermal performance during the summer months. Simulation results based on a validated numerical model enabled an objective comparison of the impact of vegetation substrate thickness and support structure type on temperature and heat flow patterns in individual layers of the roof structure. Table 6 illustrates the temperatures at the levels of the M and VB in numerical form. Temperature stabilization at the M level is one of the benefits of EGR. The influence of the supporting structure on the temperature curve at the VB level in the structure was also demonstrated.
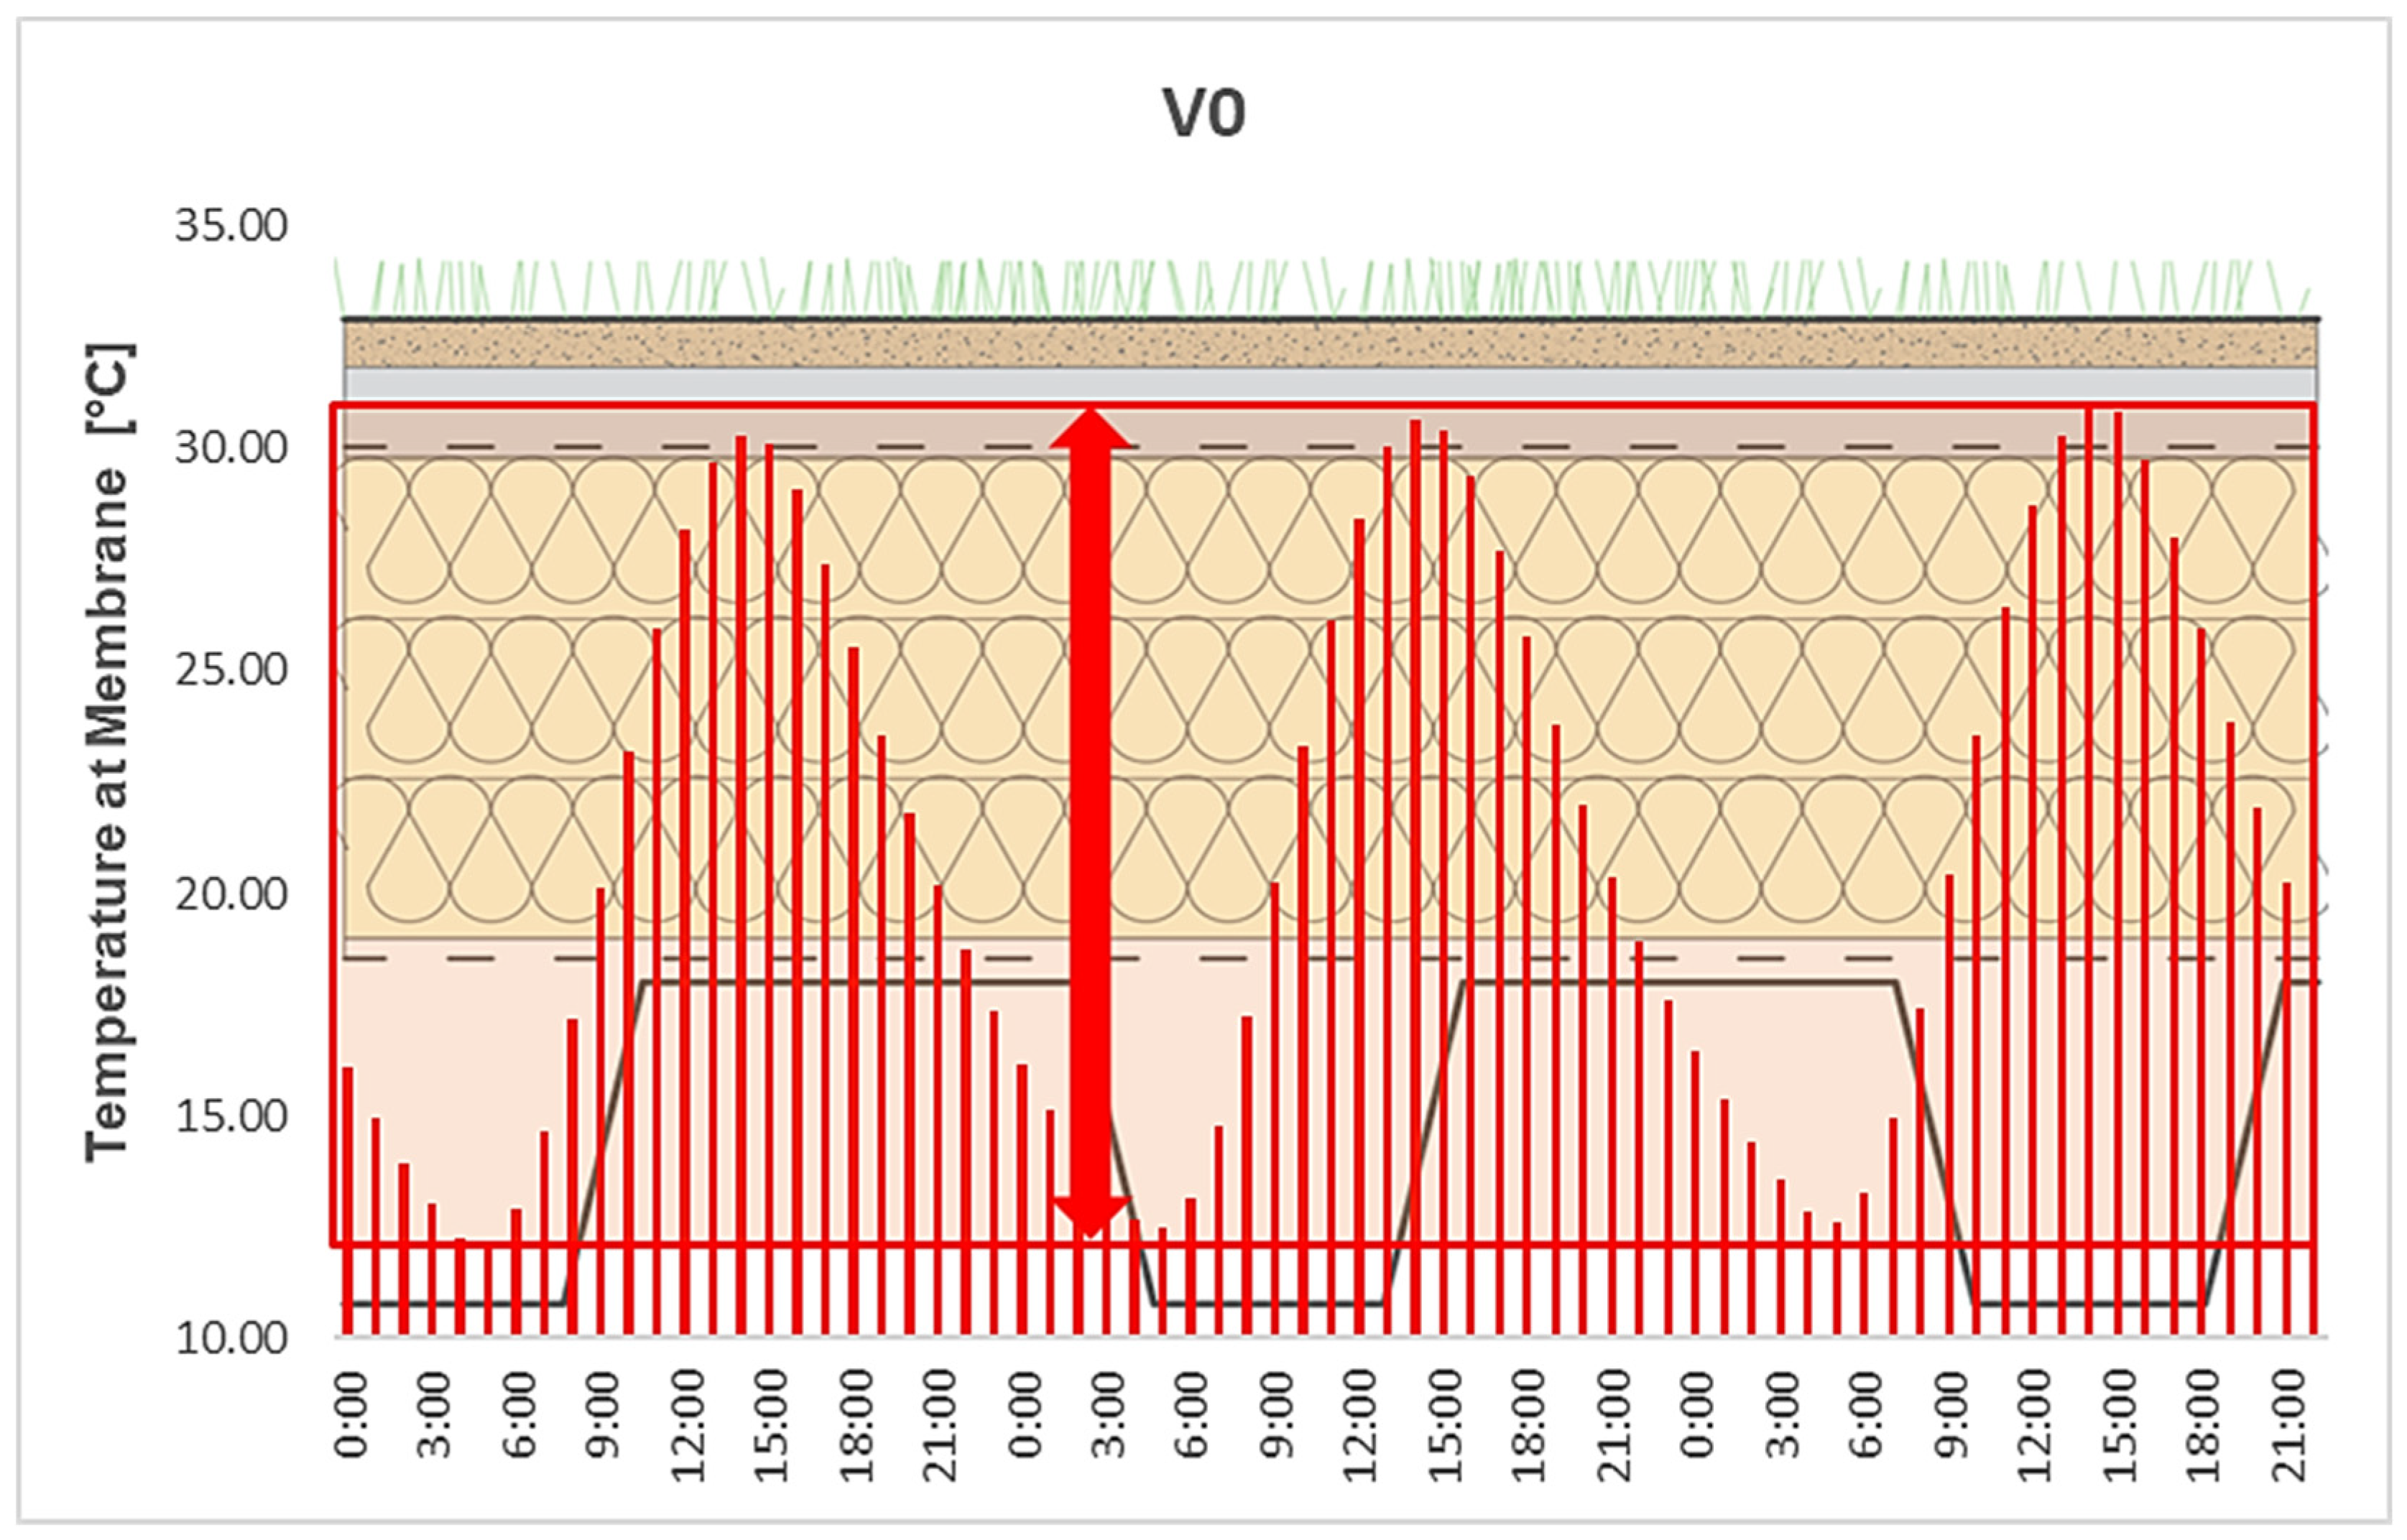
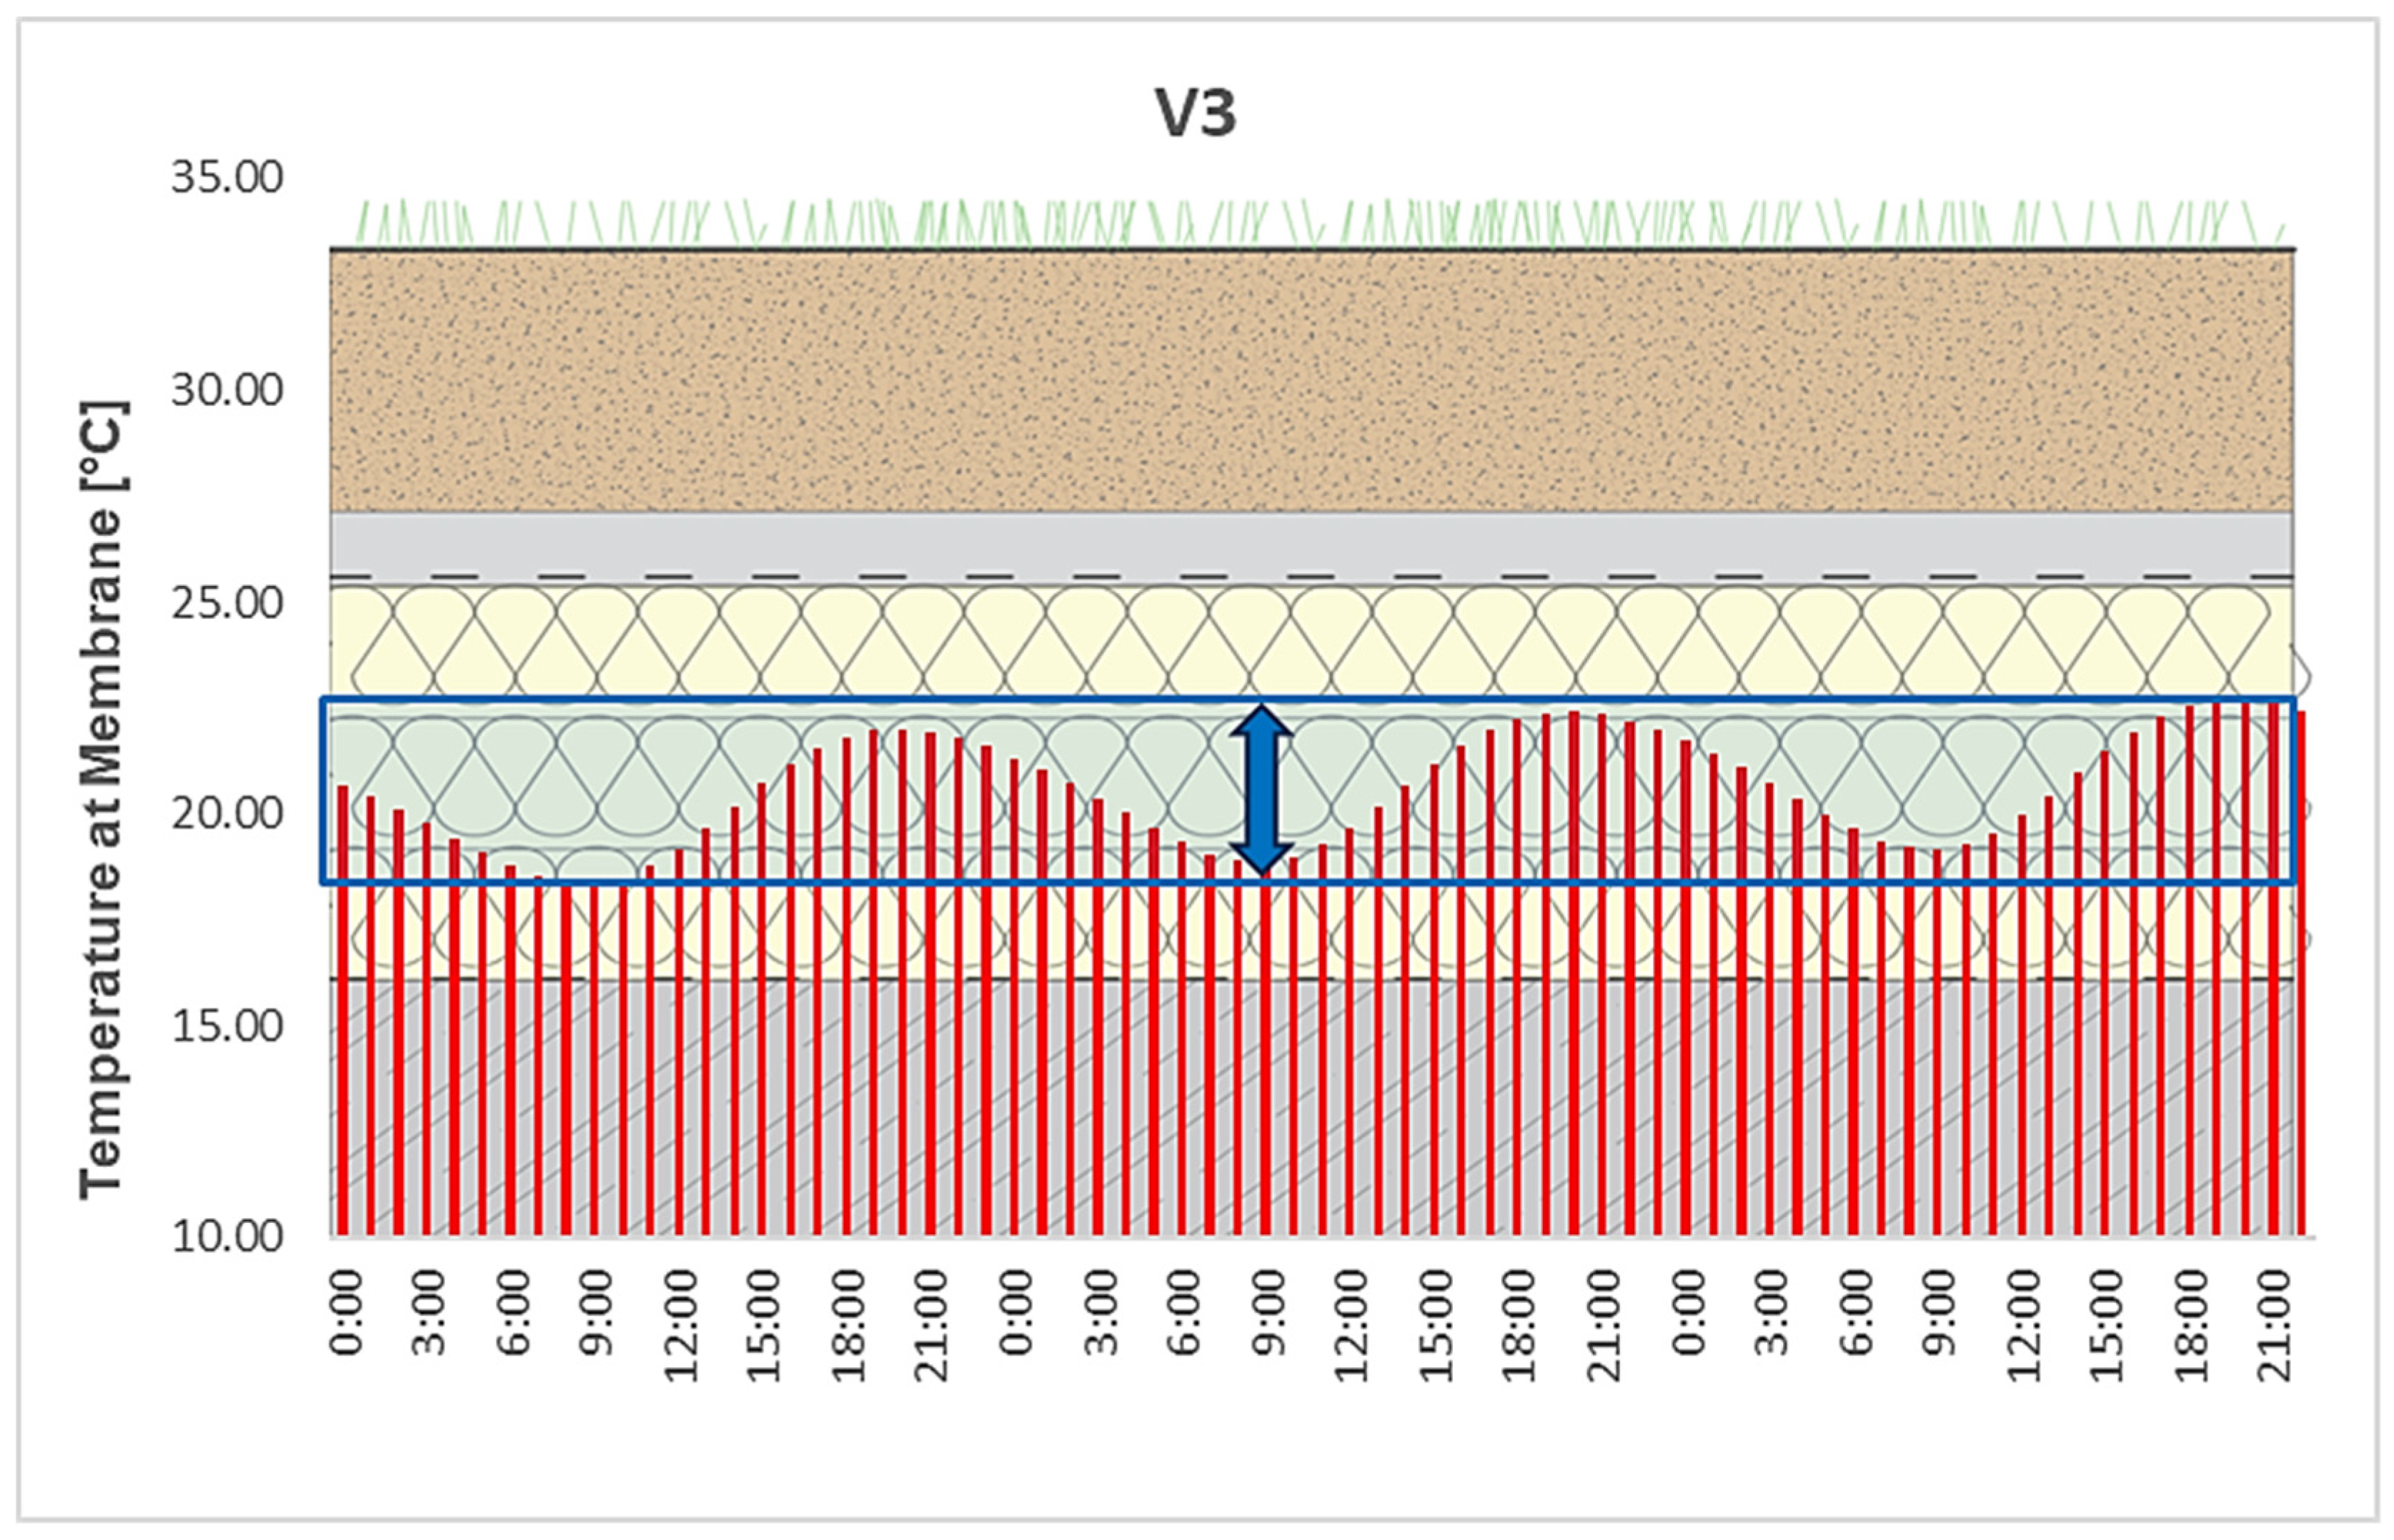
Among the individual graphs illustrating temperature curves, variant V3 presented the best temperature curves. A thicker substrate layer significantly reduced temperature fluctuations at the M level from the original 21 °C (V0) to 6 °C (V3); see Figure 13 and Figure 14 for the corresponding graphs. Although variant 2 performs better in this comparison, when comparing temperature fluctuations at the vapor barrier level, variant V3, together with V1, demonstrated the best results. Based on these measurements, the variant using a thicker substrate and a massive supporting structure is the most suitable alternative for the design of a green roof.
However, it is important to note that, although a thicker substrate appears to yield the most favorable results, it results in substantial changes in the weight of the roof structure. This is particularly relevant for hall buildings (such as the simulated model using only a 50 mm hydro-accumulation board and 30 mm of vegetation substrate), where such a considerable increase in weight can significantly complicate the structural design and the dimensions of the load-bearing elements. These buildings have a relatively “economical” structural design. It should be noted that the maximum temperatures for the reference roof ranged from 35 °C to 37 °C at the M level and from 28 °C to 32 °C for the roof with a vegetation layer. Extensive roofs with a relatively shallow layer of vegetation can effectively dampen temperature fluctuations and reduce heat flow transport with a low vegetation surface weight. The reduction in weight affects not only the load-bearing capacity and structural design of the elements but also the cost of the overall construction.
In order to better define the mechanisms of heat flow through the roof structure, an analysis of individual layers was performed for variants V1, V2, and V3. The substrate layer (SUB), in comparison with the hydroaccumulation board, has a major role in heat accumulation. Variant V1, with a minimum substrate thickness, exhibited significant daily fluctuations in heat flow at the substrate level, reaching up to 70 W/m2 during peak outdoor temperatures (Figure 10). This indicates that the low thermal mass of V1 is insufficient to compensate for short-term heat gains, resulting in direct transfer into the building. Variants V2 and V3, with thicker substrates, exhibited significantly lower oscillations, around ±10 W/m2. A thicker substrate provides greater thermal mass, effectively damping thermal peaks and reducing net heat transfer through the roof layers. In particular, V3, which combines a thicker substrate with a modified supporting structure, showed the most stable heat flux profiles across all measured layers (Figure 10 and Figure 11).
At the VB layer, the supporting structure significantly influences heat flow dynamics. The trapezoidal sheet metal in V1 offers limited heat accumulation capacity, leading to significant fluctuations in response to changes in internal temperature. In contrast, the massive reinforced concrete slab in V3 effectively dampens these oscillations and ensures a smoother heat flow through the roof system. This structural effect is also reflected in the vapor barrier and insulation layers, where V3 demonstrates lower heat flow variability compared to V1 and V2.
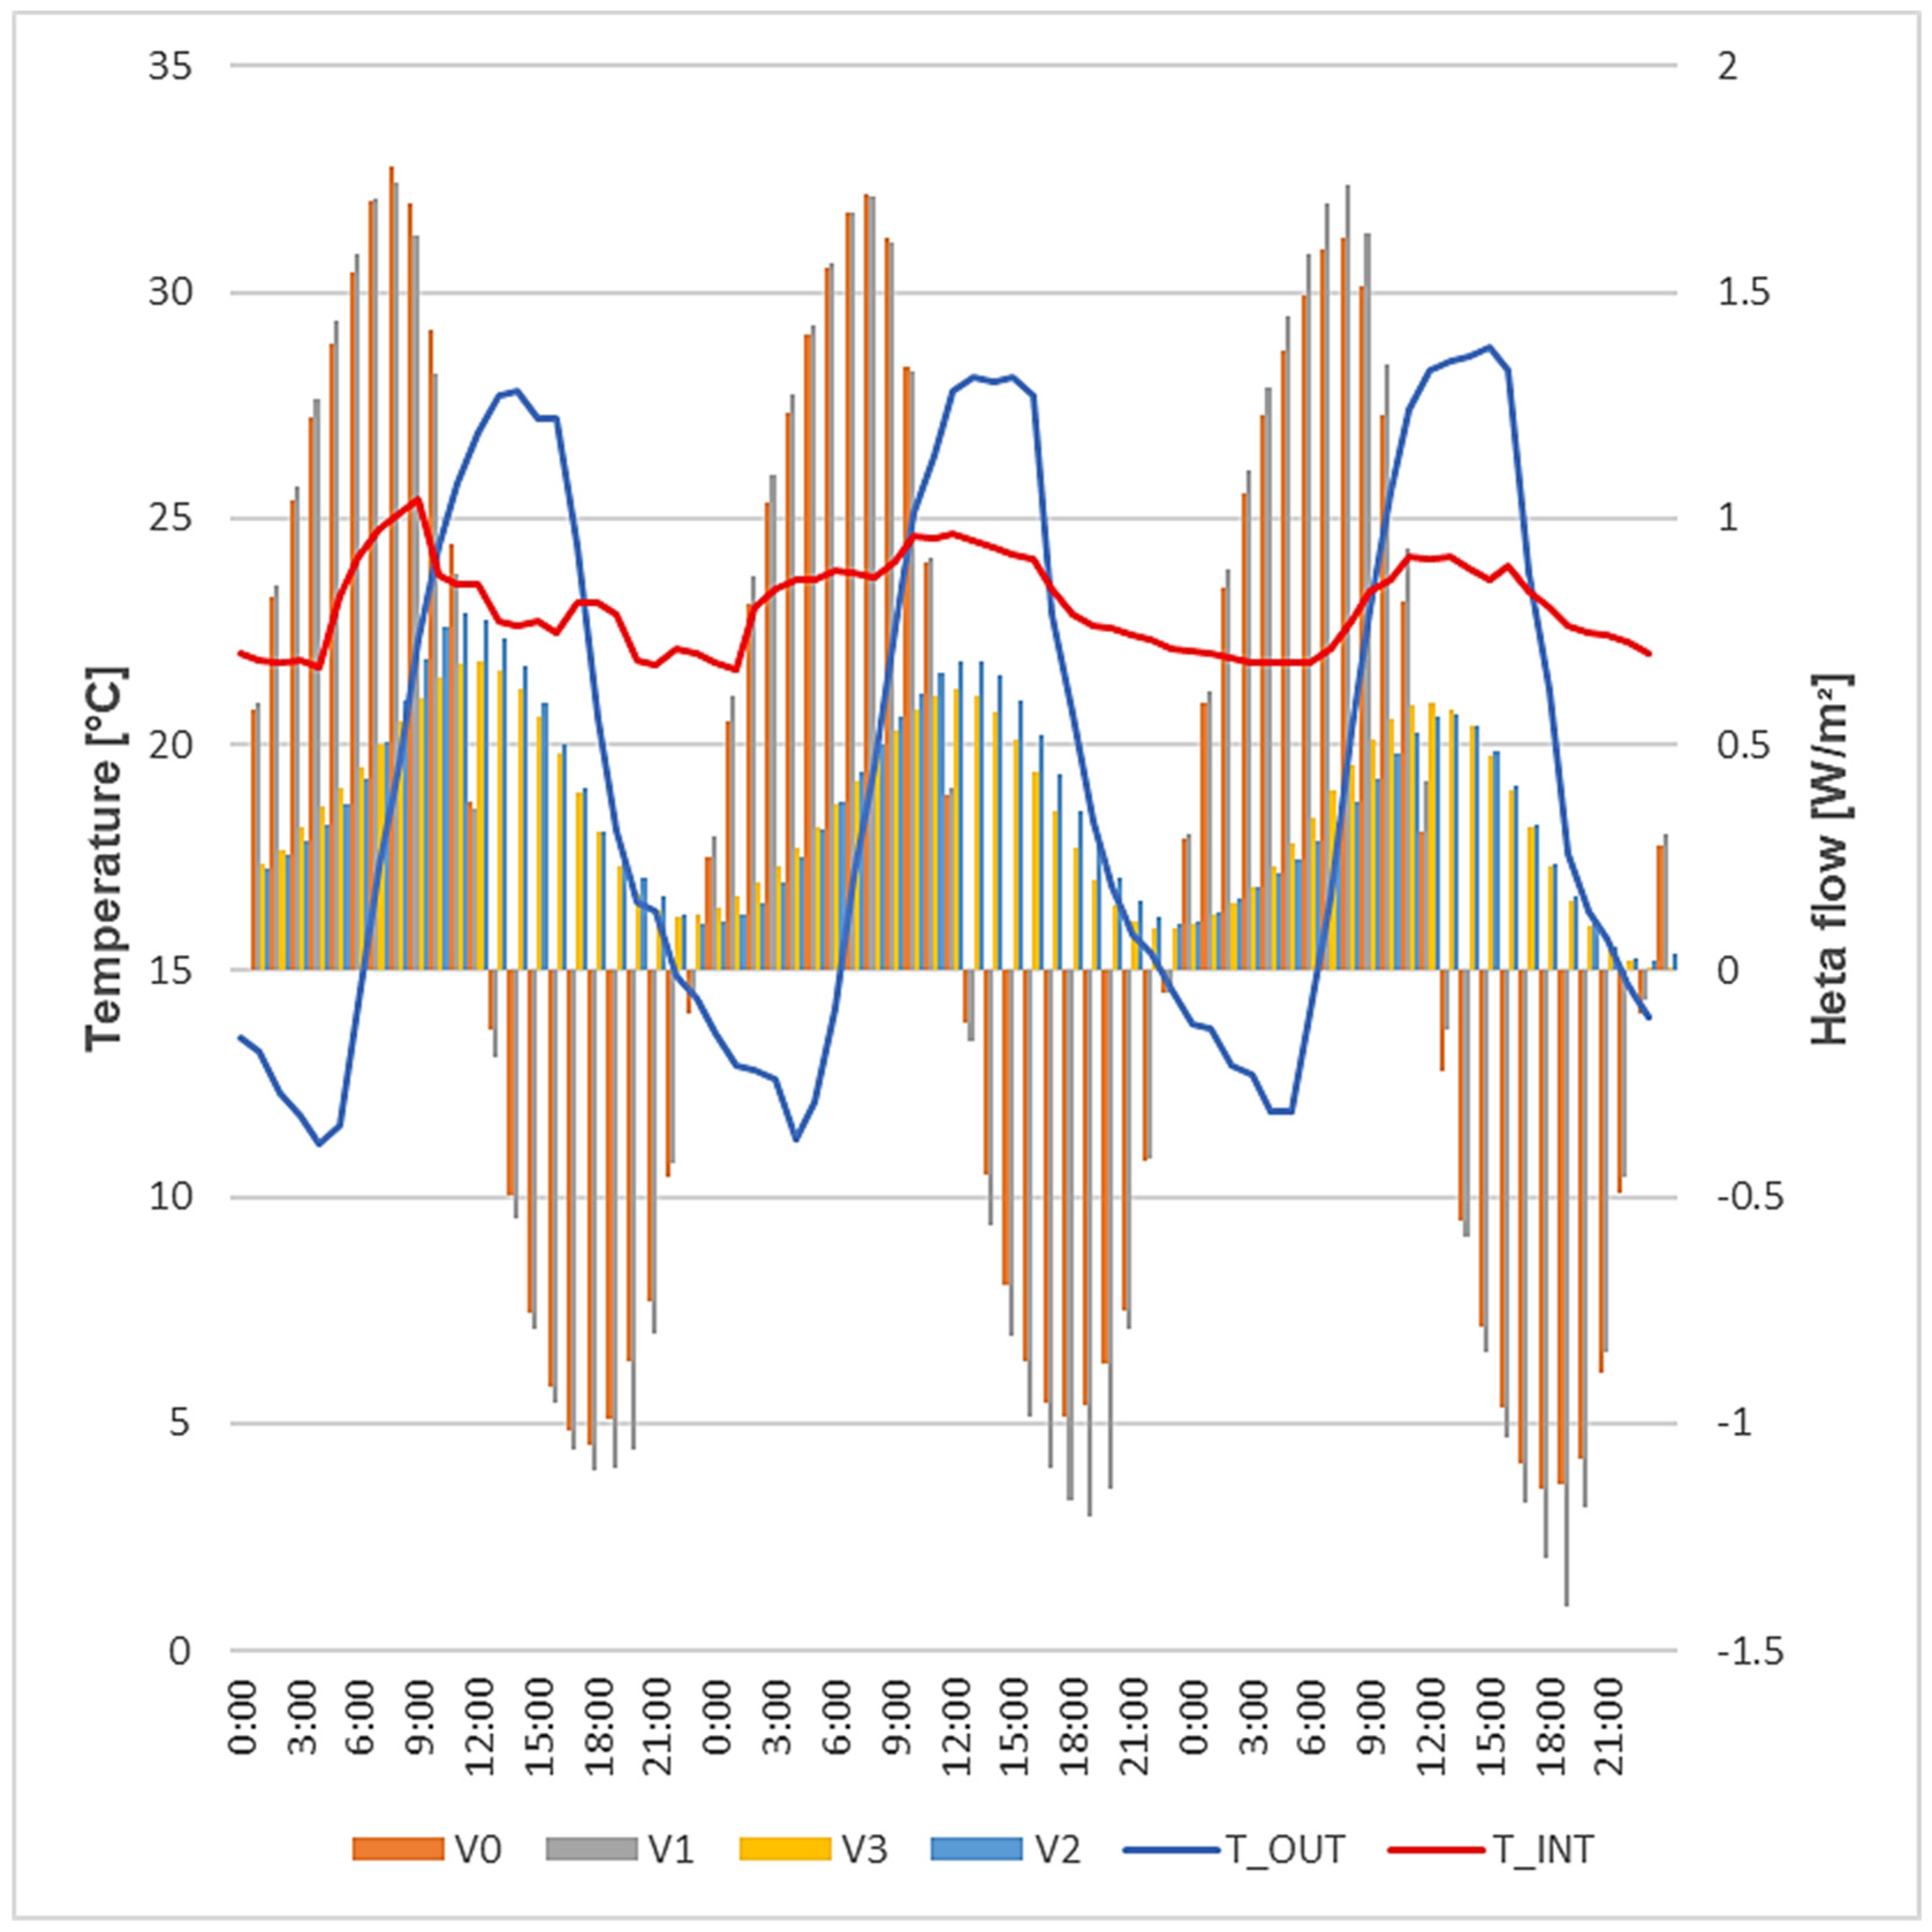
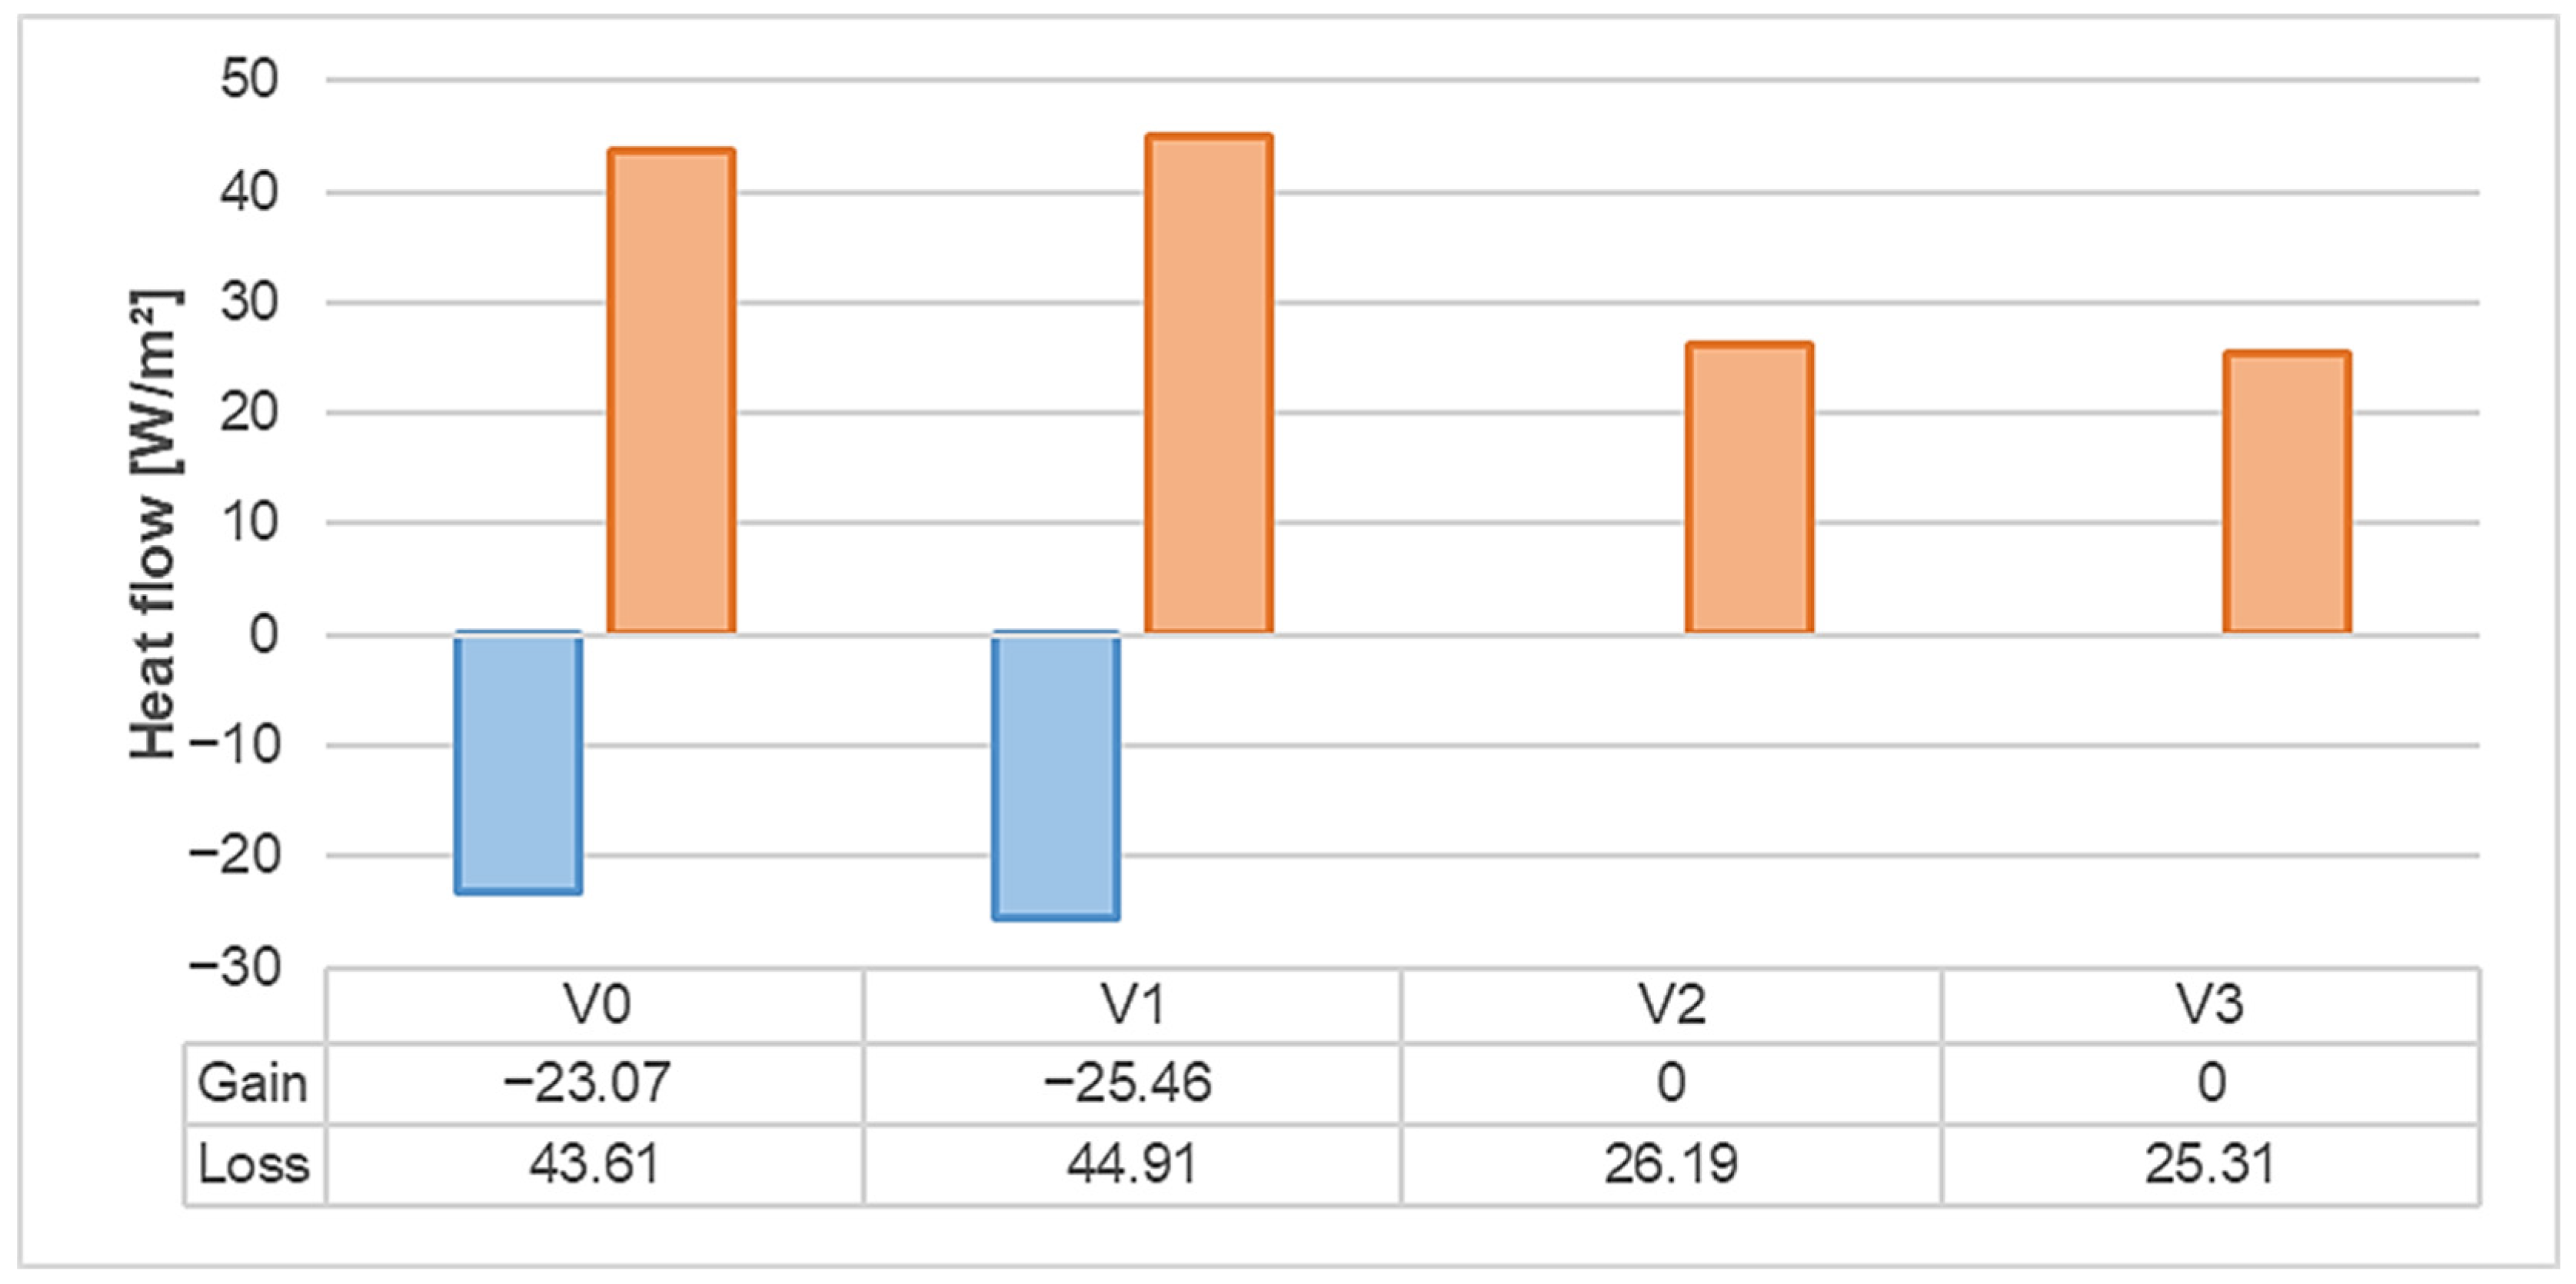
When analyzing heat flow transport through the roof structure, values below the first layer of thermal insulation were considered, where a plate for measuring heat flow is placed during real measurements. The analysis of heat gains and heat losses for each variant is shown in the graph in Figure 15. The graph illustrates the course of the outdoor air temperature (blue solid line) and the indoor air temperature (red solid line). This analysis indicates that the variant with a thicker substrate does not exhibit heat gains during the analyzed summer days. Conversely, during temperature peaks in shallow-vegetation samples, heat begins to penetrate the interior, generating potential heat gains.
Figure 16 presents the cumulative heat flow for the individual variants over the analyzed three-day period, measured below the first layer of thermal insulation (TI). For the sample with a massive substrate layer, no heat gains occur during daytime. The thick, heat-accumulating substrate effectively reduces solar heat gains, and combined with evaporative cooling, prevents heat from penetrating into the interior space. It appears that a massive substrate layer, combined with evaporative cooling, ensures appropriate thermal stability of the interior environment.

4.1. Impact of Material Changes on Structural Weight and Thermal Performance

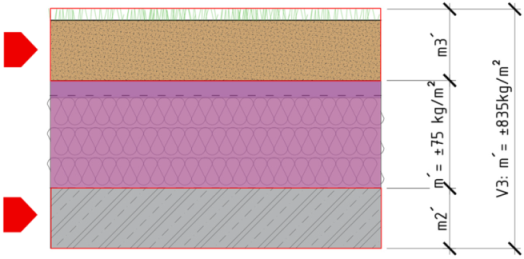
The analysis of the areal weight of the individual variants revealed significant differences related to modifications of the substrate thickness and the supporting structure (Table 7). The reference, variant V0, representing the original roof construction used for the validation of the simulation model, exhibits an areal weight of approximately 130 kg/m2 (consisting of approximately 15 kg/m2 for the supporting layer, 75 kg/m2 for the consistently occurring layers—marked with purple border in Table 7, and 40 kg/m2 for the substrate and vegetation layers). Changes in variants are highlighted with a red label in Table 7.
Variant V1, involving the replacement of the original trapezoidal sheet metal deck with a massive reinforced concrete slab while maintaining the original substrate, results in an aerial weight of 615 kg/m2 (473% of V0). The thermal performance also improves due to the increased heat storage capacity of the concrete layer; however, the significant weight increase may pose practical challenges, especially in lightweight industrial hall structures where additional loads could exceed structural limits.
Variant V2, in which the substrate thickness was increased from 30 mm to 200 mm, shows an increased areal weight of 350 kg/m2, corresponding to 269% of the original weight. This increase in substrate thickness positively influences the building’s thermal performance by enhancing heat storage capacity and reducing peak heat fluxes, thereby contributing to the improved thermal stability of the indoor environment.
Finally, the combined variant V3, integrating both the thicker substrate and the reinforced concrete deck, reaches an aerial weight of 835 kg/m2, representing an extraordinary 642% increase over the reference variant. While this combination offers the most favorable reduction in heat flux and optimal thermal balance across the roof structure, the extreme increase in structural weight renders this design impractical for typical lightweight hall constructions. Therefore, although the thickened substrate alone significantly enhances thermal performance, the combined approach with a monolithic concrete deck is inefficient in terms of structural feasibility, cost, and overall design practicality.
These findings highlight the trade-offs between thermal optimization and structural efficiency, emphasizing that improvements in the thermal performance of extensive green roofs must be balanced against the increased material weight, associated costs, and potential limitations in lightweight industrial buildings.

4.2. Limitations and Recommendations

This study provides new insights into the influence of substrate thickness and structural composition on the hygrothermal performance of extensive green roofs in the Central European context. The analysis of areal weight additionally revealed significant structural constraints that must be considered in practical applications. The findings highlight that improvements in thermal stability achieved through thicker substrates or massive structural layers must be carefully balanced against load-bearing capacity, costs, and overall feasibility.
Nevertheless, several limitations of this work should be acknowledged. The analysis was conducted for the summer period for a single industrial hall in Slovakia, which restricts the direct transferability of the results to other climatic regions. The simulations assumed constant vegetation properties and a simplified seasonal dynamic, while structural feasibility, installation costs, and maintenance aspects were assessed only qualitatively.
In addition, the long-term degradation of materials used in green roof assemblies may significantly affect their thermal and hygrothermal performance. Processes such as the gradual ageing of waterproofing membranes, the mechanical wear of geotextiles, substrate compaction or erosion, and moisture-related changes in insulation properties can alter the efficiency of the system over time. Although this study did not explicitly address material ageing, acknowledging these processes highlights the importance of future durability assessments.
Based on these limitations, several recommendations for future research can be formulated:
  • Long-term monitoring of experimental roofs in various climatic conditions to capture interannual variability and vegetation dynamics;
  • Development and assessment of lightweight or hybrid solutions that can balance thermal performance with structural constraints in industrial and lightweight buildings;
  • Integration of economic and life cycle assessments as a complement to hygrothermal analysis to support decision-making in sustainable construction;
  • Expansion of parametric studies to include additional design variables, such as different vegetation types, water-retention systems, or reflective membranes, aiming for comprehensive optimization.
Focusing on these directions will enable future research to build upon the present findings and contribute to more robust and widely applicable design strategies for green roofs in Central Europe and beyond.

5. Conclusions

The following findings can be drawn from the parametric study devoted to the thermal analysis of green roofs:
  • Variant V1 (concrete slab):
    • The concrete supporting structure exerts only a minor effect on the stabilization of heat flow in the lower layers (especially above in the vapor barrier);
    • The influence on the thermal performance of the roof structure is marginal, since the thickness of the thermal insulation layer remains the primary factor determining temperature distribution.
  • Variant V2 (thicker substrate):
    • Significantly reduces heat flow fluctuations, e.g., by up to 82% in the substrate and by half in the thermal insulation;
    • There is a phase shift of maximum temperatures by 6 h, which is beneficial for thermal balancing;
    • Significant cooling effect of the substrate—the temperature difference between the reference V0 and V2 reaches up to 8 °C.
  • Variant V3 (combined—concrete slab and thicker substrate):
    • Achieves the most effective stabilization of temperatures and heat flows throughout the entire structure;
    • Temperature and flow fluctuations are significantly dampened—by a factor of 4 to 6 compared to V0;
    • Temperature differences are reduced, e.g., in M from 21 °C (V0) to 6 °C (V3).
    • There is no overheating or night cooling in the interior—thanks to the accumulation of concrete and substrate.
In terms of heat gains and losses, the variant with a thicker substrate proved to be the most energy-efficient; during the analyzed days, it did not exhibit any heat gains under the thermal insulation layer. The combination of the substrate’s high storage capacity and evaporative cooling thus ensures the stability of the indoor environment.
The parametric study demonstrated that the combination of a thick substrate layer and the change of the supporting structure (variant V3) provides the most significant improvement in limiting heat flow transport and stabilizing indoor temperatures. However, this approach results in an extreme increase in the roof structure’s areal weight, reaching up to 542 % compared to the reference variant V0, which represents a substantial structural constraint and requires changes in structural systems for lightweight industrial buildings. The increase in substrate thickness alone (variant V1) proved to be effective in terms of building thermal performance and protection, while the areal weight increased only to 169 % of the original value.
These results indicate that an optimal design solution should balance the thermal benefits of a thicker substrate with appropriate structural modifications, achieving a compromise between enhanced thermal performance and practical structural limitations.

Author Contributions

Conceptualization, M.C. and P.J.; methodology, M.C. and P.J.; software, M.C.; validation, M.C. and P.J.; formal analysis, M.C.; investigation, P.J.; resources, M.C.; data curation, M.C.; writing—original draft preparation, M.C.; writing—review and editing, M.C. and P.J.; visualization, M.C.; supervision, P.J.; project administration, M.C. and P.J.; funding acquisition, M.C. and P.J. All authors have read and agreed to the published version of the manuscript.

Funding

This research was funded by the Slovak Scientific Grant Agency (VEGA), grant number 1/0404/24, and PROMA.

Data Availability Statement

The raw data supporting the conclusions of this article will be made available by the author on request.

Conflicts of Interest

The authors declare no conflicts of interest.

References

  1. Dutta Pramanik, P.; Mukherjee, B.; Pal, S.; Pal, T.; Singh, S.P. Green Smart Building: Requisites, Architecture, Challenges, and Use Cases. In Research Anthology on Environmental and Societal Well-Being Considerations in Buildings and Architecture; IGI Global: Hershey, PA, USA, 2019; pp. 1–50. ISBN 9781522597544. [Google Scholar]
  2. Cascone, S. Green Roof Design: State of the Art on Technology and Materials. Sustainability 2019, 11, 3020. [Google Scholar] [CrossRef]
  3. Bevilacqua, P. The Effectiveness of Green Roofs in Reducing Building Energy Consumptions across Different Climates. A Summary of Literature Results. Renew. Sustain. Energy Rev. 2021, 151, 111523. [Google Scholar] [CrossRef]
  4. Penn, A. Living Roofs; Taschen: Cologne, Germany, 2022. [Google Scholar]
  5. Vera, S.; Pinto, C.; Tabares-Velasco, P.C.; Bustamante, W.; Victorero, F.; Gironás, J.; Bonilla, C.A. Influence of Vegetation, Substrate, and Thermal Insulation of an Extensive Vegetated Roof on the Thermal Performance of Retail Stores in Semiarid and Marine Climates. Energy Build. 2017, 146, 312–321. [Google Scholar] [CrossRef]
  6. Wang, X.; Li, H.; Sodoudi, S. The Effectiveness of Cool and Green Roofs in Mitigating Urban Heat Island and Improving Human Thermal Comfort. Build. Environ. 2022, 217, 109082. [Google Scholar] [CrossRef]
  7. Santamouris, M. Cooling the Cities—A Review of Reflective and Green Roof Mitigation Technologies to Fight Heat Island and Improve Comfort in Urban Environments. Sol. Energy 2014, 103, 682–703. [Google Scholar] [CrossRef]
  8. Zhang, S.; Lin, Z.; Zhang, S.; Ge, D. Stormwater Retention and Detention Performance of Green Roofs with Different Substrates: Observational Data and Hydrological Simulations. J. Environ. Manag. 2021, 291, 112682. [Google Scholar] [CrossRef]
  9. Zhang, Y.; Zhang, L.; Meng, Q. Dynamic Heat Transfer Model of Vertical Green Façades and Its Co-Simulation with a Building Energy Modelling Program in Hot-Summer/Warm-Winter Zones. J. Build. Eng. 2022, 58, 105008. [Google Scholar] [CrossRef]
  10. Ponechal, R. Simulácie Budov; EDIS—Vydavateľské Centrum Žilinskej Univerzity: Žilina, Slovakia, 2015. [Google Scholar]
  11. Guattari, C.; Evangelisti, L.; Asdrubali, F.; De Lieto Vollaro, R.L. Experimental Evaluation and Numerical Simulation of the Thermal Performance of a Green Roof. Appl. Sci. 2020, 10, 1767. [Google Scholar] [CrossRef]
  12. Poljak, M.; Ponechal, R. Microclimatic Monitoring—The Beginning of Saving Historical Sacral Buildings in Europe. Energies 2023, 16, 1156. [Google Scholar] [CrossRef]
  13. Ponechal, R.; Barňák, P.; Ďurica, P. Comparison of Simulation and Measurement in a Short-Term Evaluation of the Thermal Comfort Parameters of an Office in a Low-Carbon Building. Buildings 2022, 12, 349. [Google Scholar] [CrossRef]
  14. Sun, T.; Bou-Zeid, E.; Wang, Z.-H.; Zerba, E.; Ni, G.-H. Hydrometeorological Determinants of Green Roof Performance via a Vertically-Resolved Model for Heat and Water Transport. Build. Environ. 2013, 60, 211–224. [Google Scholar] [CrossRef]
  15. Vertaľ, M.; Zozulák, M.; Vašková, A.; Korjenic, A. Hygrothermal Initial Condition for Simulation Process of Green Building Construction. Energy Build. 2018, 167, 166–176. [Google Scholar] [CrossRef]
  16. Sailor, D.J. A Green Roof Model for Building Energy Simulation Programs. Energy Build. 2008, 40, 1466–1478. [Google Scholar] [CrossRef]
  17. Pianella, A.; Aye, L.; Chen, Z.; Williams, N.S.G. Substrate Depth, Vegetation and Irrigation Affect Green Roof Thermal Performance in a Mediterranean Type Climate. Sustainability 2017, 9, 1451. [Google Scholar] [CrossRef]
  18. Wu, D.; Wang, Z.; Yang, J.; Liu, X.; Wang, T. Analysis and Application of Heat Transfer Coefficient in Roof Greening Modules. J. Asian Archit. Build. Eng. 2025, 1–9. [Google Scholar] [CrossRef]
  19. de Araújo Moura, C.; de Freitas, B.B.; Alves Filho, A.P.; Albuquerque, C. Green Roofs on Shipping Containers: How Substrate Thickness Affects Thermal Performance. Buildings 2024, 14, 1246. [Google Scholar] [CrossRef]
  20. Reyes, R.; Bustamante, W.; Gironás, J.; Pastén, P.A.; Rojas, V.; Suárez, F.; Vera, S.; Victorero, F.; Bonilla, C.A. Effect of Substrate Depth and Roof Layers on Green Roof Temperature and Water Requirements in a Semi-Arid Climate. Ecol. Eng. 2016, 97, 624–632. [Google Scholar] [CrossRef]
  21. Jamei, E.; Thirunavukkarasu, G.; Abuseif, M.; Seyedmahmoudian, M.; Mekhilef, S.; Stojcevski, A.; Chau, H.-W. Simulation-Based Study on the Effect of Green Roofs on Summer Energy Performance in Melbourne. Land 2023, 12, 2105. [Google Scholar] [CrossRef]
  22. Wang, Y.; Wang, Z.-H.; Rahmatollahi, N.; Hou, H. The Impact of Roof Systems on Cooling and Building Energy Efficiency. Appl. Energy 2024, 376, 124339. [Google Scholar] [CrossRef]
  23. Kulumkanov, N.; Nadeem, A.; Tokbolat, S. Green Roof Energy Performance in Different Climate Zones: A Simulation Study. J. Phys. Conf. Ser. 2023, 2600, 092027. [Google Scholar] [CrossRef]
  24. Nasr, Y.; El Zakhem, H.; Hamami, A.E.A.; El Bachawati, M.; Belarbi, R. Comprehensive Assessment of the Impact of Green Roofs and Walls on Building Energy Performance: A Scientific Review. Energies 2024, 17, 5160. [Google Scholar] [CrossRef]
  25. Versini, P.-A.; Castellanos-Diaz, L.A.; Ramier, D.; Tchiguirinskaia, I. Evapotranspiration Evaluation Using Three Different Protocols on a Large Green roof in the Greater Paris Area. Earth Syst. Sci. Data 2024, 16, 2351–2366. [Google Scholar] [CrossRef]
  26. Tudiwer, D.; Vertal’, M.; Korjenic, A.; Čakyová, K. Abbildung Der Wärmedämmenden Wirkung Eines Fassadengebundenen Begrünungssystems in Einem Simulationsmodell. Bauphysik 2019, 41, 155–161. [Google Scholar] [CrossRef]
  27. Vertal, M.; Cakyova, K.L.; Pencik, J.; Beckovsky, D.; Vargova, A.; Jan, V. Thermal Performance of Two Different Green Roofs throughout Three Winters in Slovakia. Energy Build. 2025, 344, 116024. [Google Scholar] [CrossRef]
  28. Zirkelbach, D.; Mehra, S.-R.; Sedlbauer, K.-P.; Künzel, H.-M.; Stöckl, B. A Hygrothermal Green Roof Model to Simulate Moisture and Energy Performance of Building Components. Energy Build. 2017, 145, 79–91. [Google Scholar] [CrossRef]
  29. Libralato, M.; De Angelis, A.; Tornello, G.; Saro, O.; D’Agaro, P.; Cortella, G. Evaluation of Multiyear Weather Data Effects on Hygrothermal Building Energy Simulations Using WUFI Plus. Energies 2021, 14, 7157. [Google Scholar] [CrossRef]
  30. Shugai, G. Modeling and Simulation of Non-Newtonian Fluid Flow Using COMSOL Multiphysics®. Annu. Trans. Nord. Rheol. Soc. 2025, 33, 117–126. [Google Scholar] [CrossRef]
  31. Ouldboukhitine, S.-E.; Bakkour, A.; Amziane, S.; Belarbi, R. A Comparative Study of Energy Performance of Green, White, and Gravel Roofs in a Temperate Climate through In-Situ Measurement and Dynamic Simulation. Energy Build. 2024, 320, 114630. [Google Scholar] [CrossRef]
  32. Nusser, B.; Teibinger, M. Coupled Heat and Moisture Transfer in Building Components-Implementing WUFI Approaches in COMSOL Multiphysics. In Proceedings of the Comsol Conference Europe, Milan, Italy, 10–12 October 2012. [Google Scholar]
  33. Patent PP 50032-2009. Available online: https://wbr.indprop.gov.sk/WebRegistre/Patent/Detail/50032-2009?csrt=14595615948903669724 (accessed on 29 July 2025).
  34. Chabada, M.; Durica, P.; Juras, P. Experimental Analysis of the Influence of Seasonality on the Temperature Regime of Extensive Roofs in Central Europe. Buildings 2024, 14, 812. [Google Scholar] [CrossRef]
  35. de Myttenaere, A.; Golden, B.; Le Grand, B.; Rossi, F. Mean Absolute Percentage Error for Regression Models. Neurocomputing 2016, 192, 38–48. [Google Scholar] [CrossRef]
  36. Chen, P.-Y. Effects of Meteorological Variables and Substrate Moisture on Evapotranspiration and Thermal Performance of a Green Roof in a Subtropical Climate. Ecol. Eng. 2022, 180, 106663. [Google Scholar] [CrossRef]
  37. Tabares-Velasco, P.C.; Srebric, J. A Heat Transfer Model for Assessment of Plant Based Roofing Systems in Summer Conditions. Build. Environ. 2012, 49, 310–323. [Google Scholar] [CrossRef]
  38. Charpentier, S. Simulation of Water Regime and Sensible Heat Exchange Phenomena in Green Roof Substrates. Vadose Zone J. 2015, 14, vzj2014.07.0090. [Google Scholar] [CrossRef]
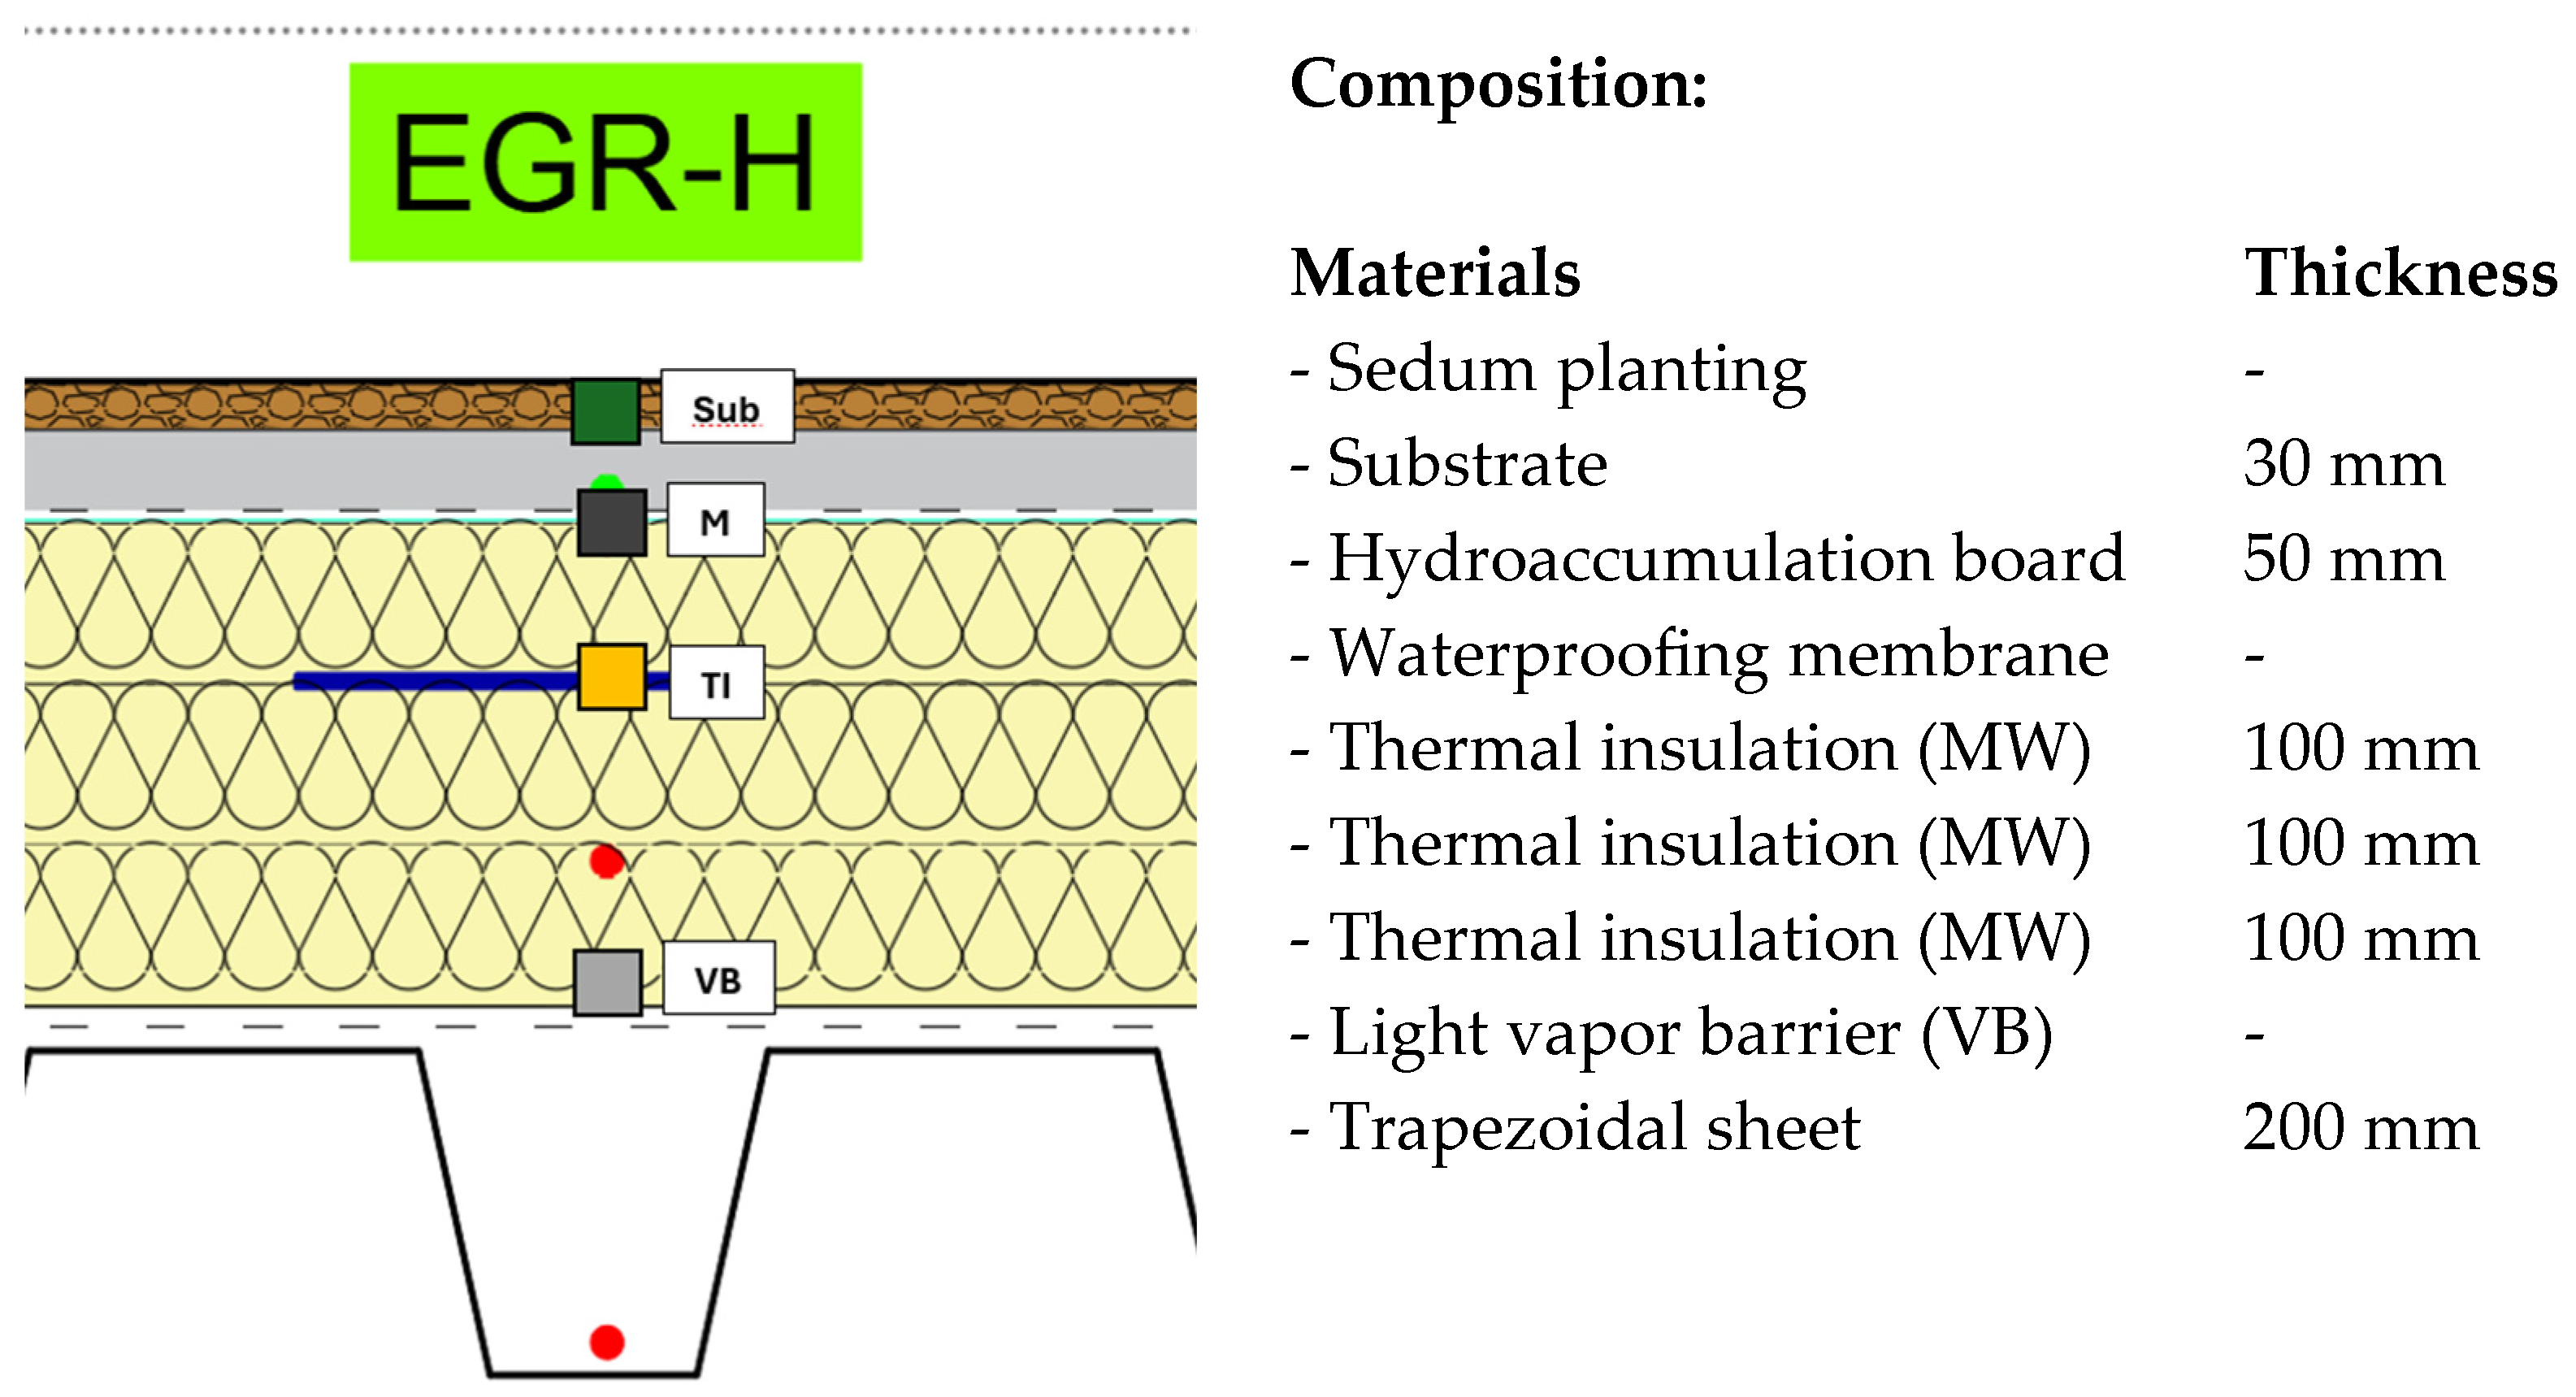
Figure 1. Extensive green roof composition used for the calibration of the simulation model and later as the V0 reference model. The positions of the sensors are marked for the analyzed layer. The red dots represent the actual placement of the sensors within the structure, which are not included as control points in the simulation.
Buildings 15 03240 g001
Figure 2. The course of outdoor air temperature and solar radiation intensity for the analyzed month of September with a marked excerpt for calibration.
Buildings 15 03240 g002
Figure 3. Results of solar radiation, outdoor air temperature, and temperature at the waterproofing level (M) from the simulation and experimental roof. The Sim. Temp. and Actual Temp. curves and actual radiation and Sim. Radiation curves are very similar in character and almost overlap.
Buildings 15 03240 g003
Figure 4. Temperature results under the top layer of thermal insulation (TI) from both the simulation and experimental roof.
Buildings 15 03240 g004
Figure 5. Results of indoor air temperature (INT) and temperature at the vapor barrier (VB) from both the simulation and experimental roof. The Sim. Temp. INT and Actual Temp. INT curves are very similar in character and almost overlap.
Buildings 15 03240 g005
Figure 6. Temperature results at substrate level (Sub.).
Buildings 15 03240 g006
Figure 7. Temperature results at waterproof membrane level (M).
Buildings 15 03240 g007
Figure 8. Temperature results under the top layer of thermal insulation (TI).
Buildings 15 03240 g008
Figure 9. Temperature results at the vapor barrier level (VB).
Buildings 15 03240 g009
Figure 10. Heat flow at substrate level for variants V1, V2, and V3 during the period 8–10 September 2023; the curves for V2 and V3 overlap and appear as a single trajectory.
Buildings 15 03240 g010
Figure 11. Heat flows in the V1–V2–V3 composition. Selected period from 8 September 2023 to 10 September 2023; the V3_TI and V2_TI curves are very similar in character and almost overlap.
Buildings 15 03240 g011
Figure 12. Temperature curves in structure V1–V2–V3. Selected period from 8 September 2023 to 10 September 2023.
Buildings 15 03240 g012
Figure 13. Temperature fluctuation at the waterproofing level in the reference variant V0: a temperature difference of up to 21 °C, which is highlighted by a red arrow and rectangle, indicating the temperature difference, which is shown by the temperature scale. Selected period from 8 September 2023 to 10 September 2023.
Buildings 15 03240 g013
Figure 14. Temperature fluctuation at the waterproofing level in the most suitable variant, V3: a temperature difference of up to 6 °C, which is highlighted by a blue arrow and rectangle, indicating the temperature difference, which is shown by the temperature scale. Selected period from 8 September 2023 to 10 September 2023.
Buildings 15 03240 g014
Figure 15. Heat flows under the top TI layer for the analyzed variant. Selected period from 8 September 2023 to 10 September 2023.
Buildings 15 03240 g015
Figure 16. Heat flow sums for individual variants over the analyzed period (08.09–10.09) under the top TI layer. Heat losses are presented in positive values (orange blocks) and heat gains are presented in negative values (blue blocks).
Buildings 15 03240 g016
Table 1. Overview of simulation software for hygrothermal and thermal performance of vegetated structures [30,31,32].
Simulation ToolApplicationStrengthsLimitationsSuitability for Green Roof Studies
WUFI
(Fraunhofer IBP, Germany)
Coupled heat and moisture (HAM) in multilayer assembliesValidated against experiments, good representation of transient hygrothermal processes, practical input of material propertiesSimplified vegetation model (empirical evapotranspiration), limited representation of plant physiologyHigh—suitable for hygrothermal parametric studies
EnergyPlus
(US DOE)
Whole-building energy balanceStrong for HVAC, comfort and annual performance, integration with weather filesLimited treatment of transient moisture, vegetation represented in a simplified mannerMedium—useful for energy demand, less accurate for HAM in substrates
TRNSYS
University of Wisconsin–Madison, Solar Energy Laboratory (USA)
Dynamic building energy simulationModular structure, good for system integration and long-term performanceLimited hygrothermal detail in multilayer structuresMedium—good for annual system studies, weaker for substrate-level processes
COMSOL Multiphysics
COMSOL AB, Sweden
General Multiphysics PDE solverHigh flexibility, possibility to couple plant physiology, detailed physicsRequires high expertise, significant computational resourcesHigh (research level)—best for detailed process detail, not practical for parametric studies
Table 2. Specification of individual layers of the simulation model. The values are from the WUFI library.
LayerDensity
[kg/m3]
Porosity
[m3/m3]
Specific Heat Capacity
[J/kgK]
Thermal Conductivity
[W/mK]
Diffusion Resistance
[-]
Sedum15000.510000.25
Substrate13000.6515000.93.3
Hydroaccumulation Board2500.9140015.7
Waterproofing
Membrane
19000.00110000.530,000
Thermal insulation 1000.958000.0451
Vapor Barrier1130.00118100.2767,800
Trapezoidal Sheet78000.001450466400
Table 3. Exterior boundary conditions for HAM simulation.
Exterior (Left Side)
NameUnitValue
Heat Resistance/Includes Long-wave Radiation[(m2K)/W]0.0526/Yes
Short-wave Radiation Absorptivity [-]0.6
Long-wave Radiation Absorptivity[-]0.9
Adhering Fraction of Rain[-]1.0
Explicit Radiation Balance[-]Yes
Terrestrial Short-wave Reflectivity[-]0.2
Terrestrial Long-wave Emissivity[-]0.9
Terrestrial Long-wave Reflectivity[-]0.1
Cloud Index[-]0.1
Table 4. Comparison of measured values and values obtained from the simulation.
Temperature
at Level
Temperature DifferenceFluctuation of
Actual Roof [°C]
Fluctuation
Simulation [°C]
Fluctuation
Difference
Mean Absolute Percentage
Error (MAPE) [%]
MAXMIN
M2.601.4229.1530.331.184.05
TI0.091.4815.4114.021.399.02
VB0.340.163.273.760.4914.99
Table 5. Parametric study variants.
VariantChangeMain PurposeGraphic Scheme
V0Reference green roofReal structure
Calibration model
Buildings 15 03240 i001
V1Modification of supporting structure (sheet metal → reinforced concrete)Investigates the accumulation capacity of reinforced concreteBuildings 15 03240 i002
V2Modification of substrate thickness (30 mm → 200 mm)Impact of substrate thicknessBuildings 15 03240 i003
V3Combination V1 and V2Synergy of both changesBuildings 15 03240 i004
Table 6. Temperature at levels M and VB.
Temperature [°C]
MVB
MAXMINDifferenceMAXMINDifference
V031.2910.3420.9625.0420.005.04
V131.2710.3020.9723.3520.003.35
V223.0517.195.8625.1620.005.16
V323.0517.135.9223.3120.003.35
Table 7. Determination of the surface weight of the variants with graphical illustration.
VariantGraphic SchemePercentage of Weight
V0Buildings 15 03240 i005100%
V1Buildings 15 03240 i006473%
V2Buildings 15 03240 i007269%
V3Buildings 15 03240 i008642%
Disclaimer/Publisher’s Note: The statements, opinions and data contained in all publications are solely those of the individual author(s) and contributor(s) and not of MDPI and/or the editor(s). MDPI and/or the editor(s) disclaim responsibility for any injury to people or property resulting from any ideas, methods, instructions or products referred to in the content.