Article

Geotechnical Data-Driven Mapping for Resilient Infrastructure: An Augmented Spatial Interpolation Framework

1
School of Civil Engineering, Quanzhou University of Information Engineering, Quanzhou 362000, China
2
Key Laboratory of Geotechnical and Underground Engineering of Ministry of Education, Department of Geotechnical Engineering, College of Civil Engineering, Tongji University, Shanghai 200092, China
3
School of Engineering, College of Science and Engineering, University of Derby, Derby DE22 3AW, UK
4
School of Civil and Environmental Engineering (SCEE), National University of Sciences and Technology (NUST), Islamabad 44000, Pakistan
5
Department of Civil Engineering, The Hong Kong University of Science and Technology, Hong Kong
6
Communication and Works Department, Government of Punjab, Lahore 54000, Pakistan
*
Author to whom correspondence should be addressed.
Buildings 2025, 15(17), 3211; https://doi.org/10.3390/buildings15173211
Submission received: 1 August 2025 / Revised: 26 August 2025 / Accepted: 2 September 2025 / Published: 5 September 2025
(This article belongs to the Special Issue Stability and Performance of Building Foundations)

Abstract

Spatial heterogeneity in soil deposition poses a significant challenge to accurate geotechnical characterization, which is essential for sustainable infrastructure development. This study presents an advanced geotechnical data-driven mapping framework, based on a monotonized and augmented formulation of Shepard’s inverse distance weighting (IDW) algorithm, implemented through the Google Earth Engine (GEE) platform. The approach is rigorously evaluated through a comparative analysis against the classical IDW and Kriging techniques using standard key performance indices (KPIs). Comprehensive field and laboratory data repositories were developed in accordance with international geotechnical standards (e.g., ASTM). Key geotechnical parameters, i.e., standard penetration test (SPT-N) values, shear wave velocity (Vs), soil classification, and plasticity index (PI), were used to generate high-resolution geospatial models for a previously unmapped region, thereby providing essential baseline data for building infrastructure design. The results indicate that the augmented IDW approach exhibits the best spatial gradient conservation and local anomaly detection performance, in alignment with Tobler’s First Law of Geography, and outperforms Kriging and classical IDW in terms of predictive accuracy and geologic plausibility. Compared to classical IDW and Kriging, the augmented IDW algorithm achieved up to a 44% average reduction in the RMSE and MAE, along with an approximately 30% improvement in NSE and PC. The difference in spatial areal coverage was found to be up to 20%, demonstrating an improved capacity to model spatial subsurface heterogeneity. Thematic design maps of the load intensity (LI), safe bearing capacity (SBC), and optimum foundation depth (OD) were constructed for ready application in practical design. This work not only establishes the inadequacy of conventional geostatistical methods in highly heterogeneous soil environments but also provides a scalable framework for geotechnical mapping with accuracy in data-poor environments.

1. Introduction

The integrity and resilience of built infrastructure are fundamentally linked to the accuracy of subsurface geotechnical evaluations, especially in regions facing rapid urbanization and environmental stressors. Soil characterization in the early stages of site development accurately determines the foundation design, structural load distribution, and long-term durability of the constructed infrastructure [1]. Nevertheless, the spatial heterogeneity at shallow soil strata is shaped through complex depositional conditions and topographic variability, weathering processes, and anthropogenic alterations [2]. These spatial heterogeneities lead to severe risks to building structures, i.e., differential settlement affects load-bearing walls, problematic soils may induce foundation distortion, and liquefiable layers may cause catastrophic collapse during earthquakes [3]. To minimize these risks, geotechnical data-driven maps (GDMs) have been established as a principal tool in early-stage site appraisal, with the ability to generate high-resolution spatial descriptions of subsurface characteristics from limited or sparse data. Such GDM plays a critical role in informing decisions for site selection and anticipated geohazards, e.g., road collapse, slope failure, and ground subsidence, along with the types and depth of foundations and permissible bearing capacity [4,5,6]. Despite GDM’s importance, existing techniques bear inherent limitations, oversimplify complex soil behavior, and fail to scale in heterogeneous geotechnical formations.
Despite their widespread application in geospatial interpolation, classical spatial interpolation techniques, especially inverse distance weighting (IDW) and Kriging, exhibit major limitations in dealing with geotechnically heterogeneous environments [7,8,9]. IDW, as a pure weight determinant method, distributes weights exclusively with respect to proximity, without accounting for the spatial structure and directional trends in the data; therefore, it frequently presents sudden transitions and unrealistic surface characteristics [10]. Kriging, which is more advanced, likewise largely relies on the assumption of spatial stationarity and exact semivariogram modeling, with assumptions that are often in conflict in heterogeneous soils [11]. In data-scarce regions or irrationally covered terrain, both schemes are prone to oversmoothing localized variability and obscuring significant anomalies, thereby deviating from Tobler’s First Law of Geography, which asserts that spatially proximate entities should exhibit stronger similarity [12,13]. Recent studies have shown that GDMs developed using classical interpolation techniques often yield considerably higher validation errors, limiting their practical applicability [14,15,16]. Moreover, these studies are typically limited in scale, being applied to small or site-specific areas, and fail to adequately incorporate the variability of complex geotechnical formations. The evaluation of model accuracy has also been constrained to a narrow set of statistical parameters, without deeper uncertainty quantification or stratified performance analysis. Furthermore, most existing approaches rely on single-parameter datasets, with little integration of multiple geotechnical indicators, thereby reducing the practical value of the outputs for engineering design in data-scarce regions.
To overcome these limitations, this study focused on an augmented spatial interpolation framework through the modification of Shepard’s inverse distance weighting (IDW) algorithm. This augmented model incorporates a monotonization step, which provides spatial smoothness and continuity simultaneously, while preserving the local variability that persists, therefore following Tobler’s First Law of Geography [17] more strictly. However, it is pertinent to mention that Tobler’s First Law of Geography and spatial autocorrelation, while related, are not interchangeable, as “near things are more related than distant things” [18]. In this context, classical IDW based on the Shepard formulation reflects only the distance decay aspect of Tobler’s Law, without formally incorporating autocorrelation with constant exponent weights based solely on the Euclidean distance. This results in instability in prediction near data points and a lack of local smoothness. On the other hand, the augmented Shepard-based IDW approach introduced in this study bridges these perspectives: (i) it retains the conceptual logic of Tobler’s Law while embedding gradient-sensitive weighting; (ii) it incorporates adaptive schemes and localized gradient controls to account for directional dependencies and nonlinear spatial trends. Meanwhile, the inclusion of monotonization coefficients ensures smooth and continuous transitions between interpolated points, mitigating the formation of artificial peaks or troughs that can arise from overfitting or abrupt surface changes. This enhancement is particularly important in highly complex geologies or data-scarce regions, where classical algorithms produce unreliable or smooth surfaces [19]. Through enhancing the weighting logic and spatial autocorrelation with gradient-aware adjustments, the augmented approach more precisely reflects the geotechnical heterogeneity and consequently generates more reliable predictions. This augmented approach not only improves the prediction quality of GDMs but also offers a scalable platform for risk-informed infrastructure design in varying subsurface terrain.
To demonstrate the applicability of the proposed interpolation model in a geotechnically variable environment, this study focuses on the Muzaffargarh district of Punjab, Pakistan. This region is positioned in the Indus alluvial plain, marked by stratified deposits of silts, clays, and sands by active river systems, hence dominated by extensive subsurface variations across short intervals [20]. Despite the landscape appearing topographically uniform at the surface level, the subsurface conditions are highly heterogeneous, based on the influence of fluvial actions, varying groundwater depth conditions, and time-based saturation. The region has experienced extensive urbanization over the last few years, with the establishment of residential districts, institutional facilities, and transport corridors spread across soil-extreme and flood-prone zones. Such constructions are often undertaken with limited subsurface evaluations and hence enhance the likelihood of structural collapse, as well as differential settlement and poor foundation performance. Given the absence of detailed GDMs in the region, this area presents an ideal case study for the validation of high-resolution spatial modeling tools. The application of the augmented modified Shepard-based IDW algorithm in the region is intended to provide planners and developers with reliable geospatial inputs towards the resilient construction of infrastructures and careful site selection within the administrative boundary.
Based on the aforementioned research gaps, the primary objective of this study is to develop and validate an advanced geospatial interpolation model for accurate GDMs in a geologically diverse region. Specifically, the research aims are as follows: (i) utilize the augmented Shepard-based IDW model with the additional monotonization function for improved spatial continuity and the minimization of interpolation bias; (ii) generate high-fidelity GDMs for significant soil properties like SPT-N and the shear wave velocity (Vs), as well as soil classification and the plasticity index (PI); (iii) compare the augmented approach with classical IDW and the Kriging model based on key performance indicators (KPIs); and (iv) demonstrate the practical application of the developed GDMs for foundation layout, as well as the classification of the site. Based on the above, this study contributes a scalable, accurate, and field-validated framework to support resilient building practices and geotechnical risk mitigation in undercharacterized regions.

2. Geospatial Interpolation Techniques

2.1. Classical Inverse Distance Weighting (IDW)

IDW is the most used deterministic spatial interpolation technique, based on the notion that points close to each other in space will have a greater influence on the estimated value as compared to points that are far away [21,22]. It is grounded in the spatial autocorrelation assumption, as proposed by Tobler’s First Law of Geography: “everything is related to everything else, but near things are more related than distant things.” In its classical formulation, IDW estimates the value Z ( x 0 ) at an unknown location x 0 based on the weighted average of known values Z ( x i ) , where the weights are inversely proportional to the distance between x 0 and each known point x i . The governing equation is given as
Z ( x 0 ) = i = 1 n ω i ( x 0 ) . Z ( x i ) i = 1 n ω i ( x 0 )
where Z ( x 0 ) is the interpolated value at location x 0 ; Z ( x i ) is the known value at the sample point x i ; and ω i ( x 0 ) is the weight assigned to point x i , calculated as
ω i ( x 0 ) = 1 d ( x 0 , x i ) p
where d ( x 0 , x i ) is the Euclidean distance between the prediction location x 0 and the observed location x i , while p is the power parameter (commonly 2), which controls the degree of influence of nearby points. The selection of the power parameter p greatly affects the output: larger values of p add more weight to proximate points for more localized interpolation, and smaller values give smoother surfaces with a greater effect from distant points. Despite its computational simplicity and widespread adoption, classical IDW exhibits several limitations in geotechnical applications. For instance, it does not account for directionally varying spatial trends [23]. For extremely heterogeneous terrain, the adoption of a global power parameter typically does not hold well. In addition, it does not account for fine structures or local gradients other than the distance. Moreover, IDW results in the development of sharp discontinuities along interrelated surfaces when the sampling distributions are sparse or irregular. Such constraints necessitate the implementation of better approaches, such as the monotonization-incorporating modified Shepard-based IDW approach, to deal with subsurface geotechnical complexities. Additionally, the documented studies on IDW are limited to small regions, which are unable to account for the geological heterogeneity; this limits the true efficacy of the classical IDW technique.

2.2. Augmented IDW

To overcome the limitations of classical IDW, the current study adopts an augmented formulation through the modification of the Shepard method, primarily proposed by Shepard (1968) and then extended for various geospatial applications [22]. The essential extensions are coupling with adaptive weights, gradient-corrective adjustments, and a monotonization step to improve the spatial continuity and uphold the regional heterogeneity in complex geotechnical formations. In contrast to classical IDW, which is primarily based on isotropic inverse distance-based weights, the augmented IDW is equipped with localized control functions that incorporate the spatial configuration of the adjacent points and their relative gradients. The general formulation of the augmented method is presented as follows:
Z ( x 0 ) = i = 1 n W i ( x 0 ) . Z ( x i ) i = 1 n W i ( x 0 )
where W i ( x 0 ) is dynamically modified to include both distance-dependent and gradient-sensitive components:
W i ( x 0 ) = 1 d ( x 0 , x i ) p + ϵ . G ( x i , x 0 )
Here, d ( x 0 , x i ) is the Euclidean distance between the prediction and a known point, p is the adaptive power parameter, ϵ is the regularization term, and G ( x i , x 0 ) is the gradient-based adjustment function to control the influence of directional variability and is defined in Equations (5)–(7):
G x i ,   x o = 1 +   λ . | Δ Q x ( x o ) |
Q k x , y = f k + a k 2 x x k + a k 3 y y k + a k 4 x x k 2 + a k 2 ( x x k ) x x k + a k 6 y y k 2 , k = 1 . , N
a ^ k 2 = i = 1 i k N [ a i 2 p i + f 2 ] i = 1 i k N [ 1 p i + f 2 ]
Here, λ controls the strength of the gradient influence; | Δ Q x ( x o ) | indicates the local gradient magnitude, derived from the partial derivatives of Q x ( x o ) ; and the coefficients ( a k 2 , a k 3 ,…) represent local directional derivatives and curvature information estimated around each node. Meanwhile, smooth variation and the control of spatial diffusion across the prediction grid is ensured through the integration of monotonization coefficients ( a ^ k 2 ) to adjust the coefficient fields using the weighted average, as delineated in Equation (7).
This critical addition to the above framework uses a monotonization step to apply spatial smoothness without compromising the natural transitions in geotechnical properties. This step ensures that the values to be interpolated will not fluctuate randomly between the nearest observations, especially where data are concentrated or sparse. Monotonization is achieved through the alteration of the gradient of the interpolated surface in such a manner that preserves the relative ordering of known values. This constraint prevents the generation of artificial peaks or troughs, which commonly occur in classical IDW and Kriging when data sampling is irregular.

2.3. Ordinary Kriging

Ordinary Kriging is a geostatistical interpolation technique that provides the Best Linear Unbiased Estimator (BLUE) of spatial variables based on the use of both the distance between known points and the spatial autocorrelation structure of the dataset [24]. Unlike a deterministic approach, such as IDW, Kriging incorporates a model of spatial variance, which is specified through a semivariogram, estimating unknown values to minimize the estimation error. The basic Kriging estimator for the location of interest x 0 is given by
Z ( x 0 ) = i = 1 n λ i . Z ( x i )
where Z ( x 0 ) is the interpolated value at location x 0 ; Z ( x i ) is the known value at the sample point   x i ; λ i is the Kriging weight assigned to Z ( x i ) , derived by solving the Kriging system; and n is the number of neighboring observations. These weights λ i are calculated by solving the set of linear equations derived from the function of the semivariogram γ ( h ) , quantifying how data similarity decline with a rising distance of separation h. Ordinary Kriging assumes that the mean of the spatial variable is unknown but remains constant within the neighborhood.
The semivariogram γ ( h ) is central to Kriging’s performance and is defined as
γ ( h ) = 1 2 N ( h ) i = 1 N ( h ) [ Z ( x i ) Z ( x i + h ) ] 2
where h is the lag distance and N(h) is the number of point pairs separated by h. Common semivariogram models include the spherical, exponential, and Gaussian models, each characterized by the following parameters: nugget, sill, and range. Despite its statistical strengths, ordinary Kriging often underperforms in geotechnical mapping due to its assumptions of stationarity, sensitivity to variogram fitting, and tendency to oversmooth spatial variability. It also struggles with sparse or irregular data and is computationally intensive, limiting its reliability in heterogeneous subsurface conditions.

2.4. Performance Evaluation of Interpolation Algorithms

To assess the accuracy and reliability of the interpolation algorithms, this study employs four key statistical metrics: the root mean square error (RMSE), mean absolute error (MAE), Nash–Sutcliffe efficiency (NSE), and Pearson correlation coefficient (PC) [25,26]. These indicators provide a comprehensive evaluation of model performance by measuring both the magnitude of prediction errors and the strength of agreement between the observed field data and predicted geotechnical values. The mathematical expressions for each performance metric are detailed in Equations (10)–(13):
R M S E = i = 1 n ( E i M i ) 2 n
M A E = i = 1 n E i M i n
N S E = 1 i = 1 n E i M i 2 i = 1 n M i M ¯ i 2
R 2 = i = 1 n E i E ¯ i M i M ¯ i i = 1 n E i E ¯ i 2 i = 1 n M i M ¯ i 2
Here, E i denotes the predicted value, M i indicates the observed value, M ¯ i is the of observed values, and n shows the total number of observations.

3. Study Region and Research Methodology

3.1. Study Region

The Muzaffargarh region, located between 28.50° N–30.45° N latitude and 70.30° E–71.90° E longitude, lies in the southwestern part of Punjab, Pakistan. Covering an area of approximately 8249 km2, the region is bounded by the Indus River to the west and the Chenab River to the east, forming part of the broader Indo-Gangetic alluvial plain [27]. Although the surface terrain appears relatively flat, the underlying geotechnical conditions exhibit significant spatial heterogeneity due to historical fluvial deposition [28], variable erosion processes, and anthropogenic modification (Figure 1a–c). This is a semiarid to arid region with maximum summer temperatures above 40 °C and intense rainfall within the monsoonal months of July–September (Figure 1d) [29]. Such a climatic regime leads to seasonal variation in groundwater levels and soil moisture conditions, with implications for subsurface strength parameters, and hence contributes to soil volumetric change behavior, foundation instability, and drainage-related failures, especially in fast-growing urban areas. It is important to note that the study area’s selection was based on it being a geotechnically sensitive zone with a higher incidence of reported geotechnical failures in recent years [30]. Moreover, it remains underexplored, with limited or no geotechnical mapping studies, and it is experiencing rapid infrastructure development, creating a strong need for reliable design maps to support engineering practice.

3.2. Geotechnical and Environmental Attributes

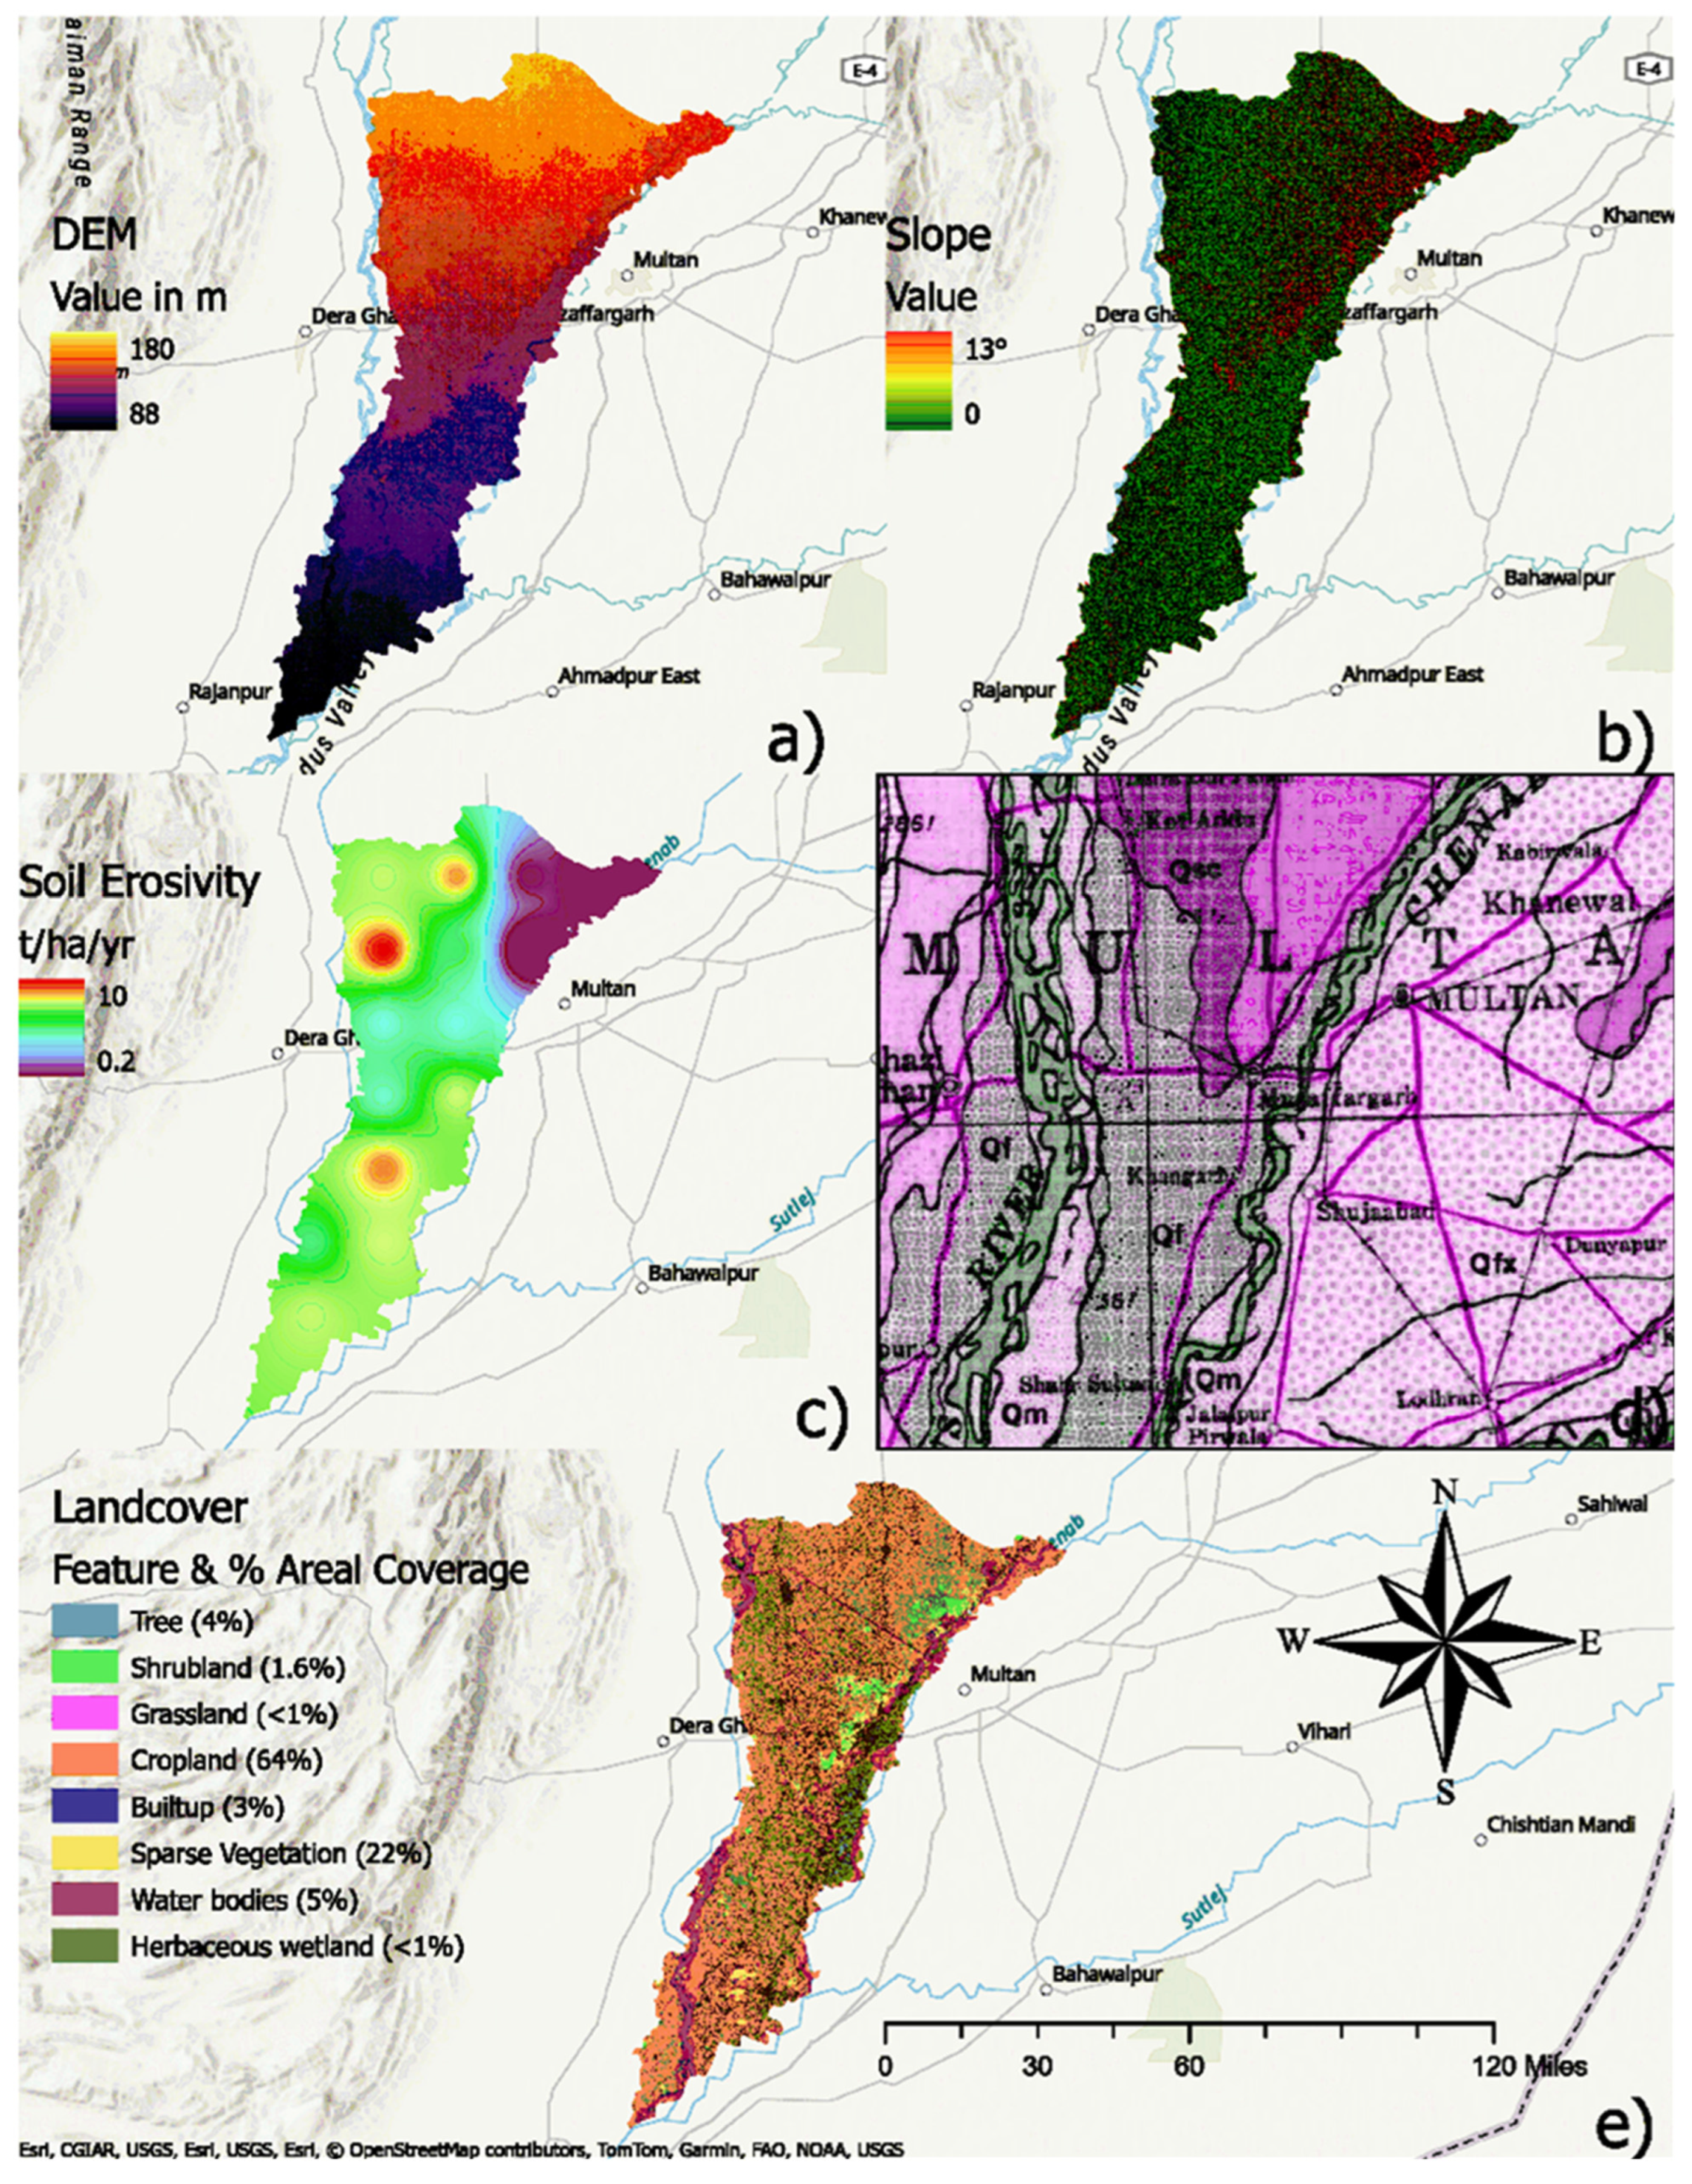
Figure 2 displays the most significant environmental variables for the study area. The digital elevation model (DEM) (Figure 2a) (SRTM, 30 m resolution, 2020 release) shows minimal elevation gradients within the northwest–southeast directions, ranging between 88 and 180m above the mean sea level (MSL). Meanwhile, the slope map (Figure 2b) shows that a large part of this region falls within 0–3°, estimating generally non-padded terrain with a potential slow flow and waterlogging within lower catchments [31]. The soil erosivity map (Figure 2c) detects foci of high erosion potential, mainly around riverside and bare surface areas [32]. Land cover investigation (Figure 2e) shows cropland prevalence (64%), as well as sparse vegetation (22%), reflecting the impact of farming activity upon soil compaction and erosion processes [33].

3.3. Soil and Subsurface Properties

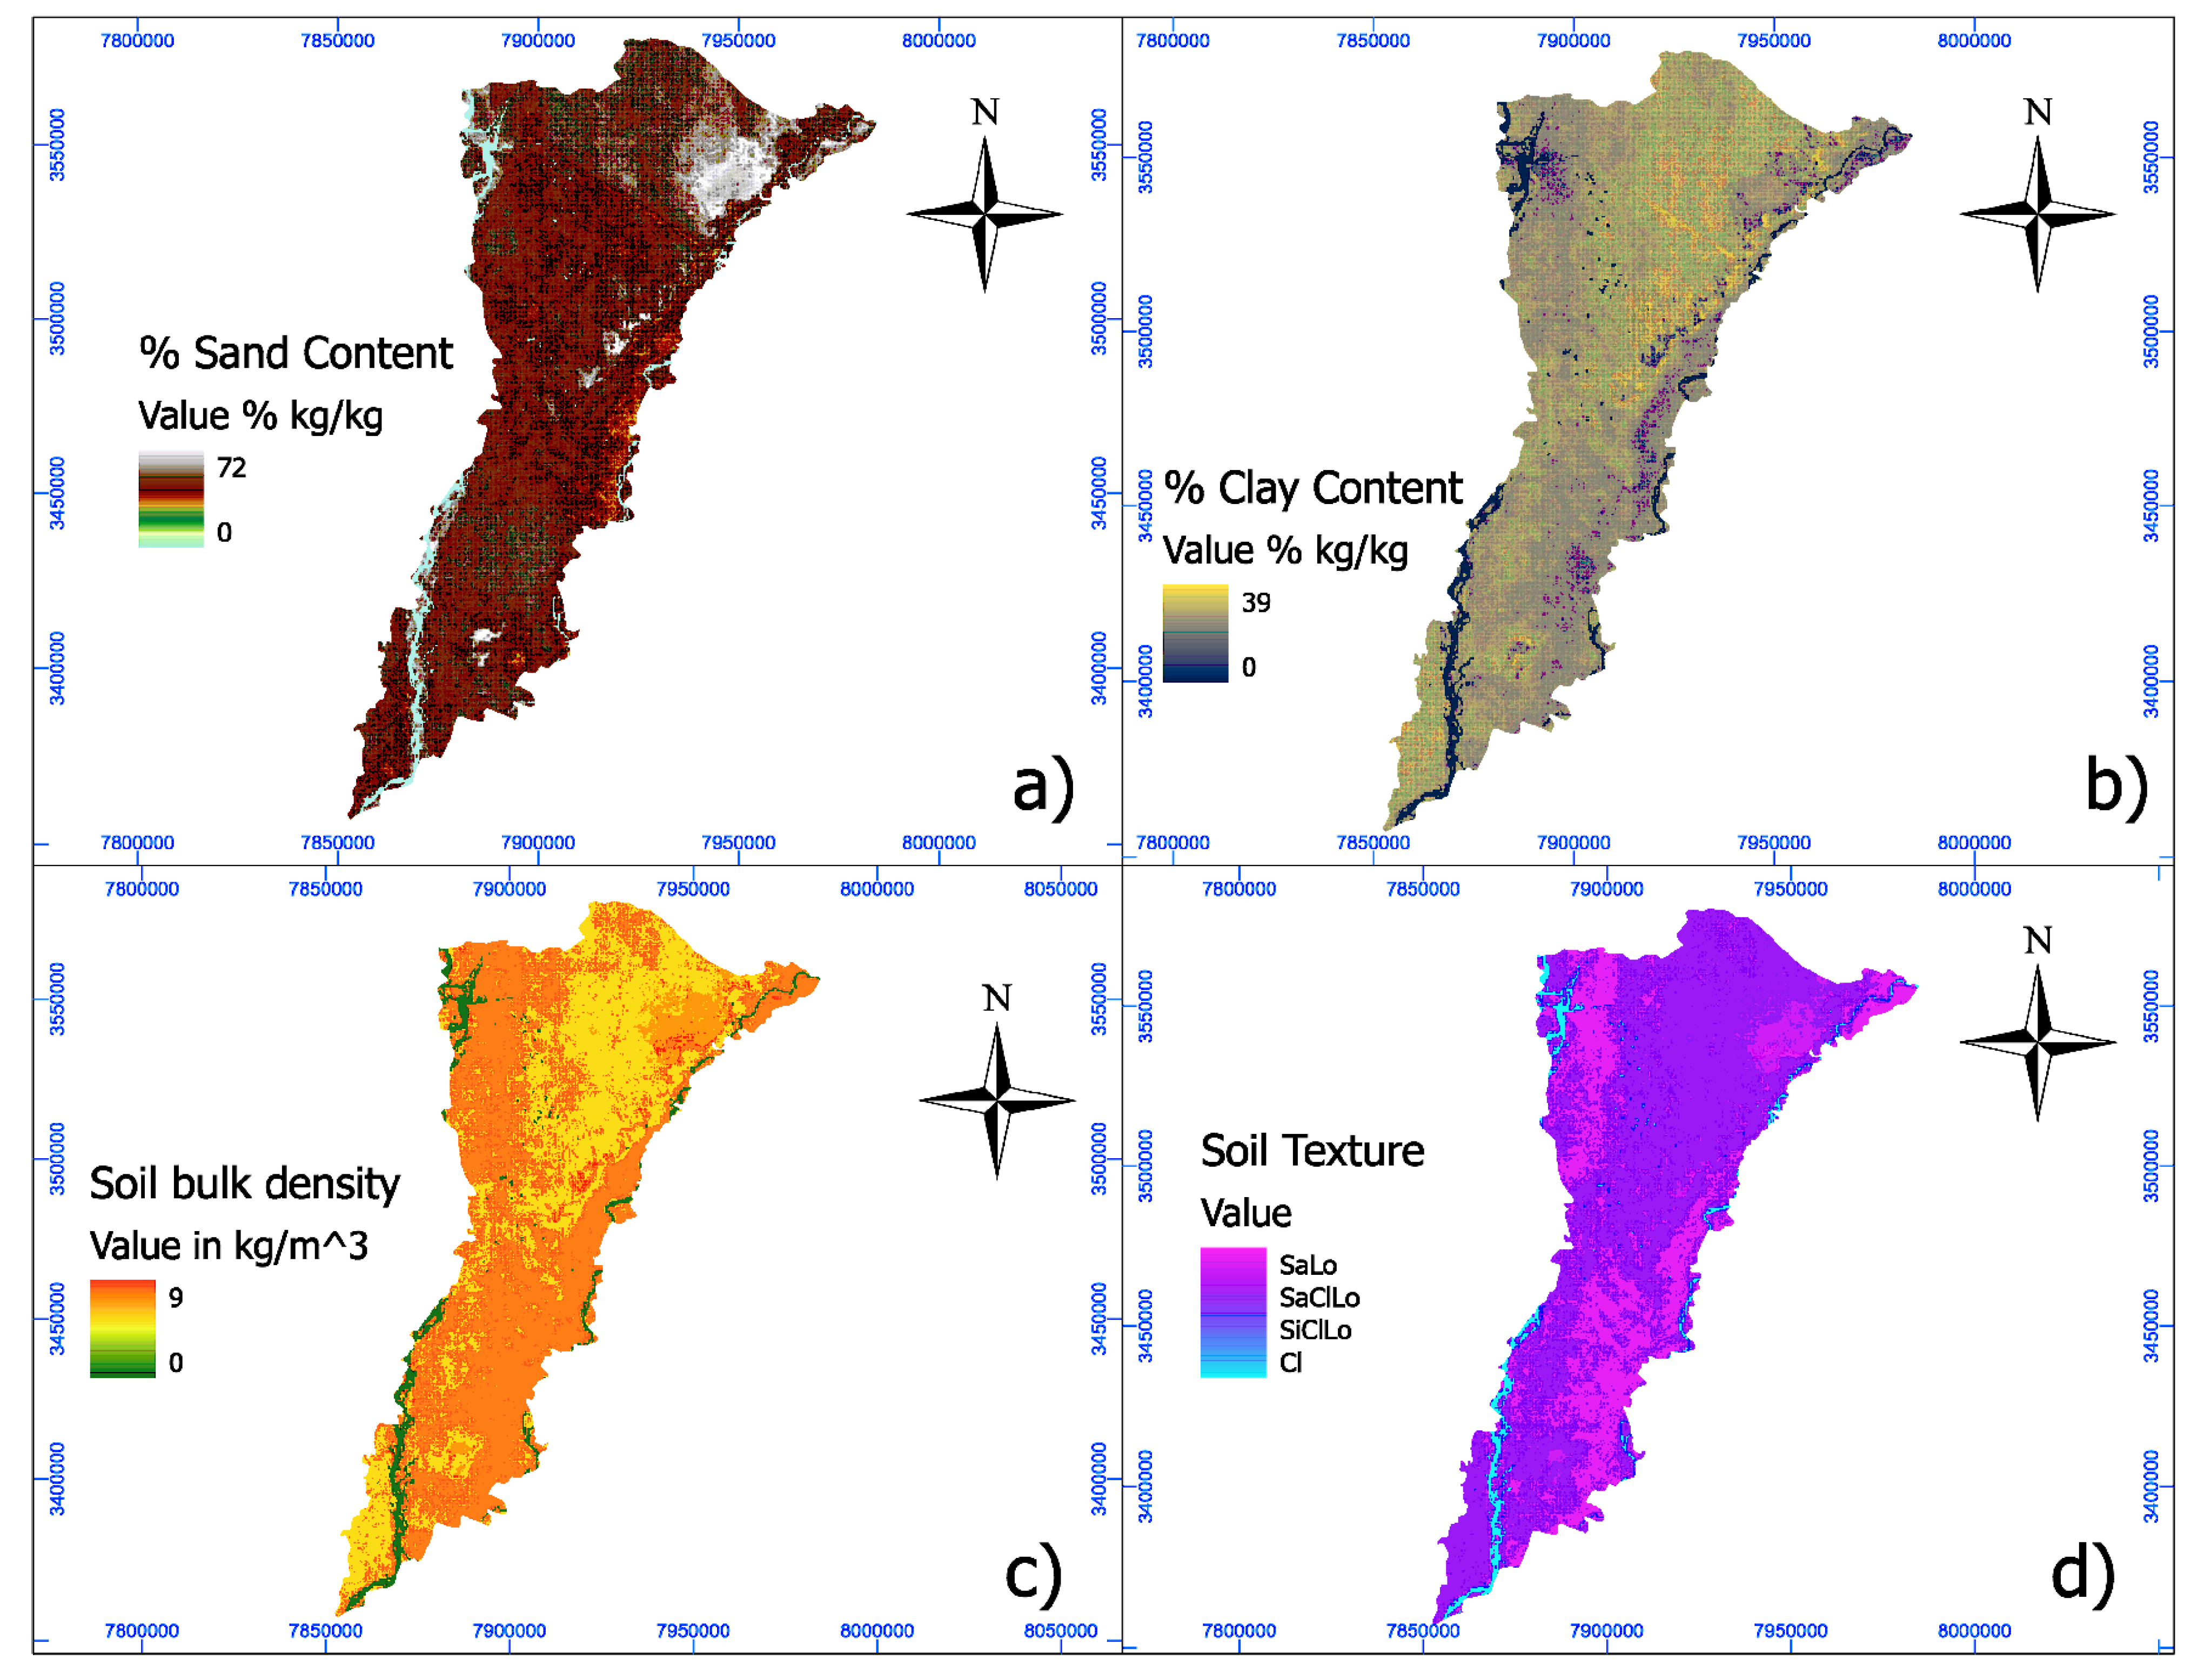
A critical problem within this region pertains to high geotechnical variability at shallow layers, as can be seen from Figure 3. The volumetric content of sand varies between 0 and 72% (Figure 3a), with prevalent impacts of sand being experienced within the western and southern parts, while higher clay content (Figure 3b) occurs within the eastern parts, with uneven bearing capacity within the district [34]. The bulk density of soil (Figure 3c) reaches up to 9 kg/m3, with an impact upon the shear capacity and compressibility as well. The texture classification of the soil (Figure 3d) shows a patchwork combination of loamy and clayey textures, further emphasizing the non-uniform conditions within the subsurface profile.

3.4. Geotechnical Database

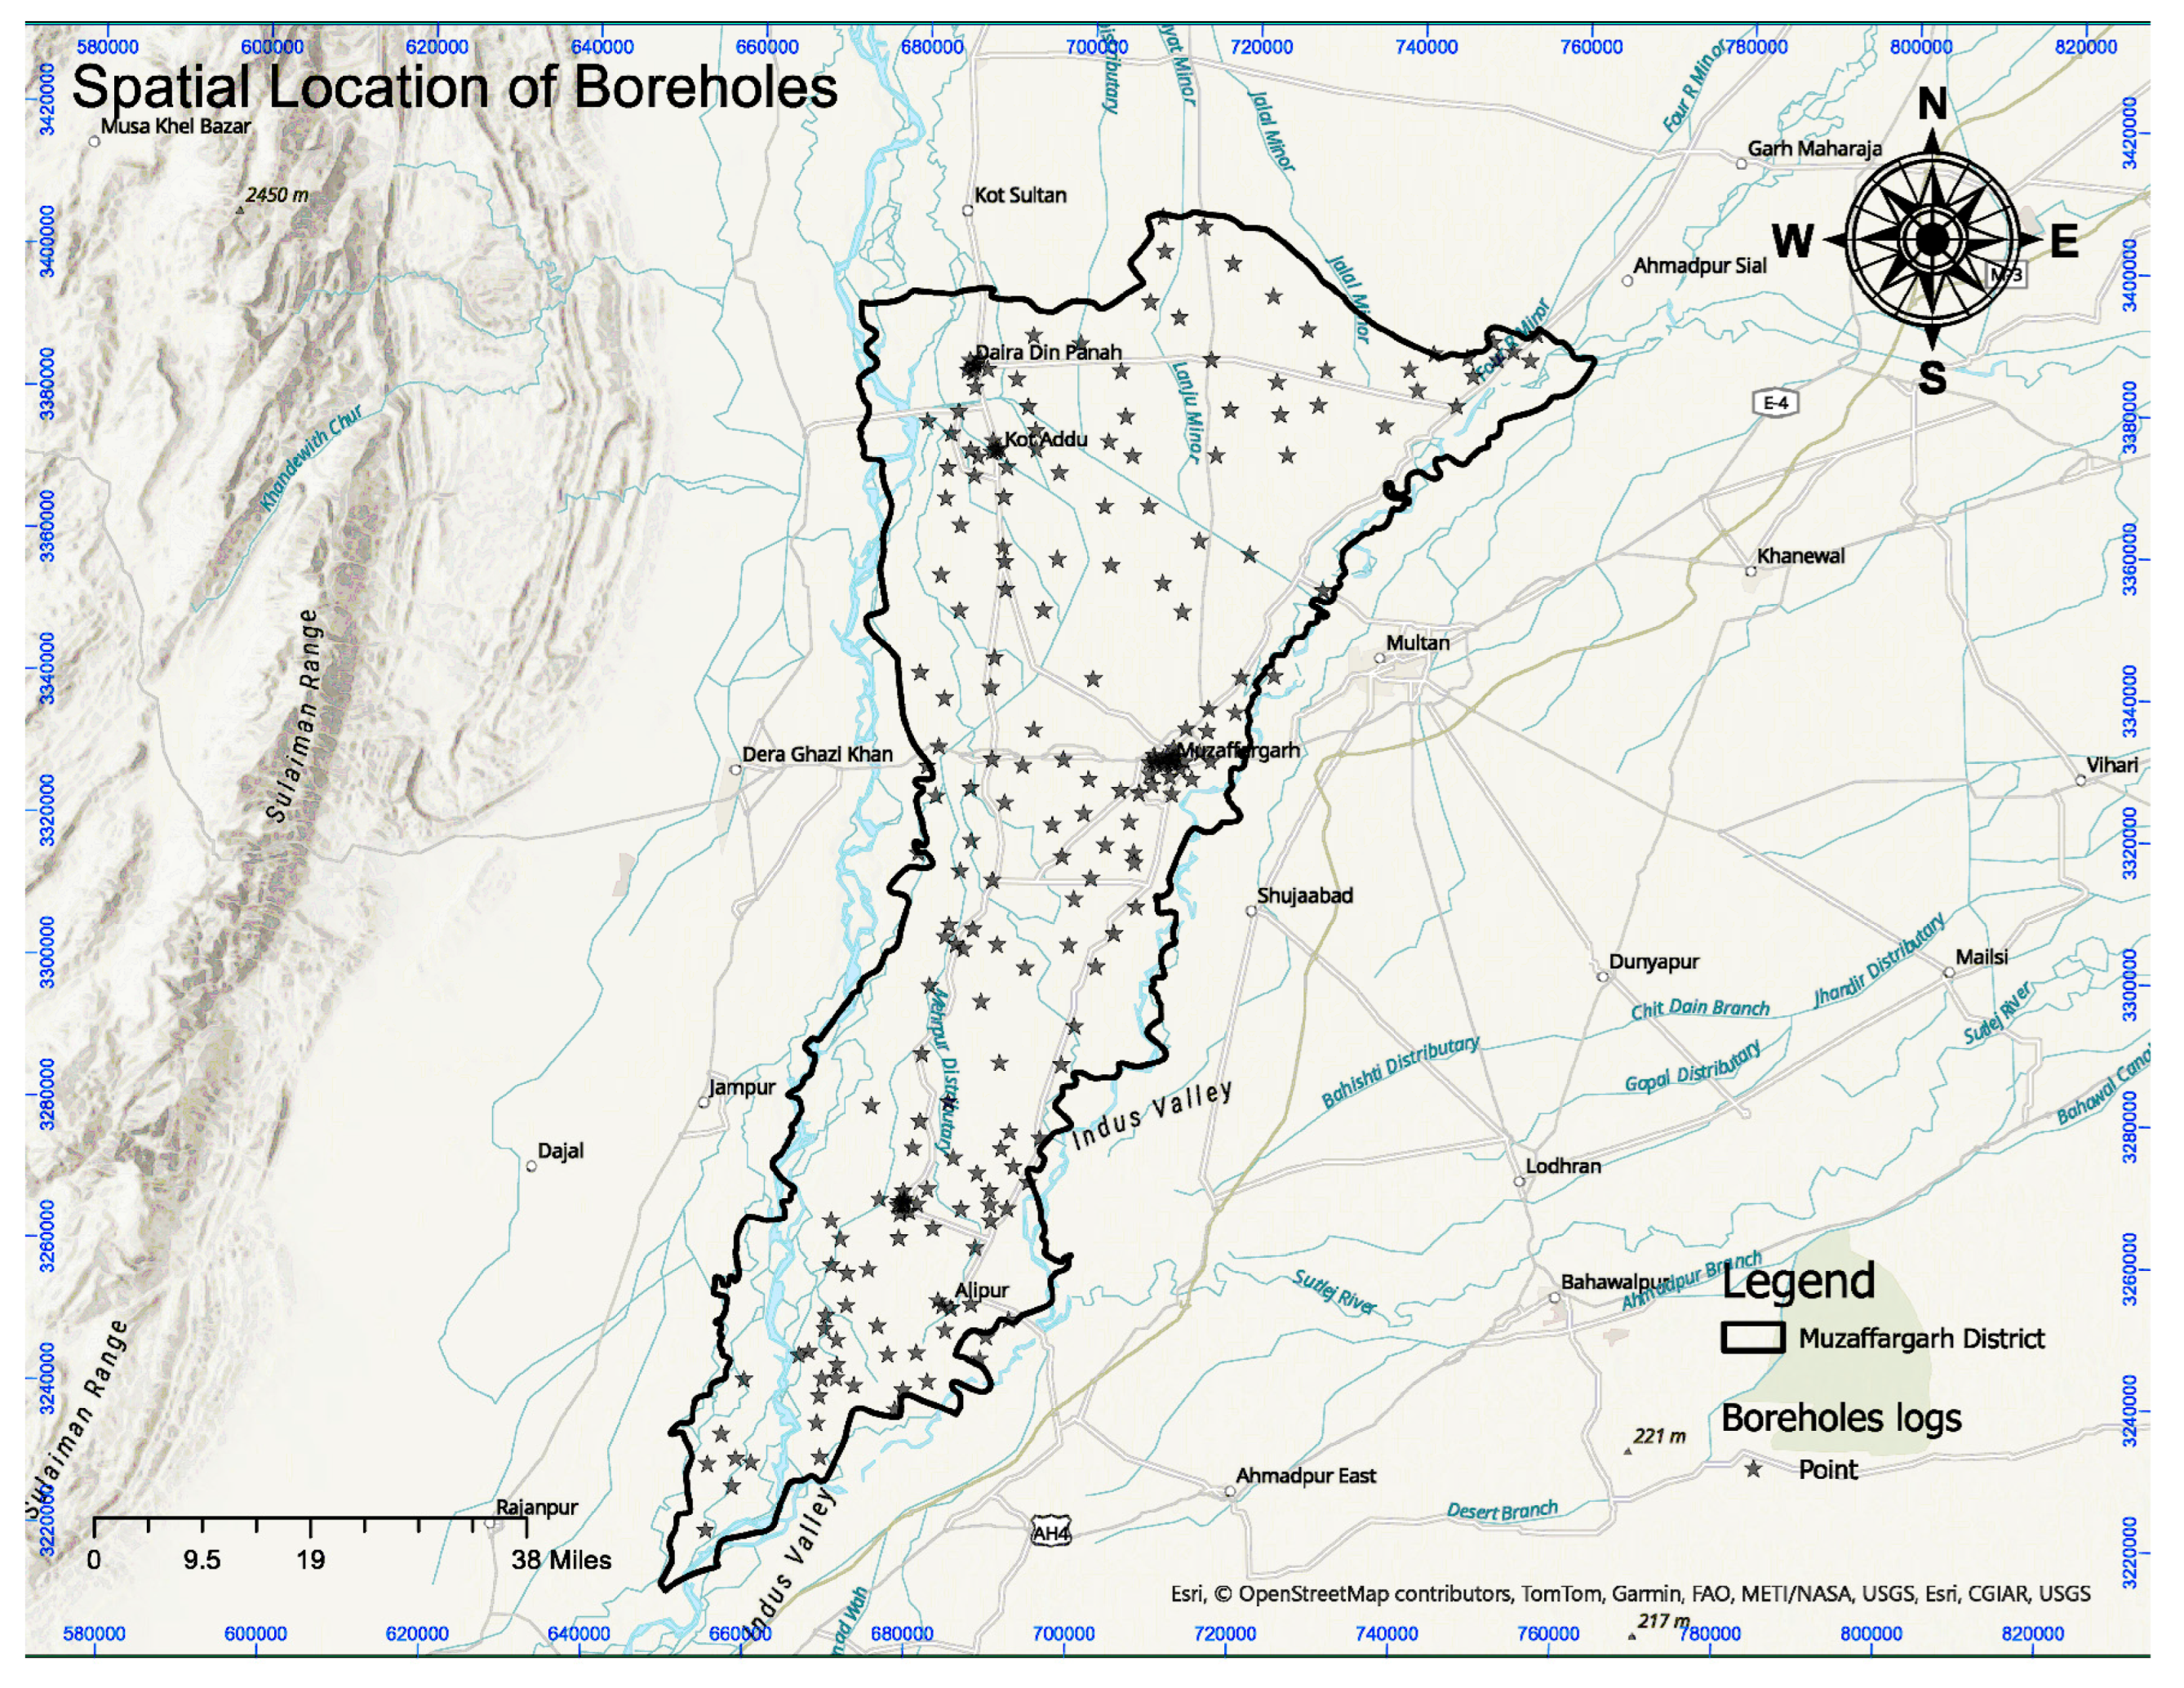
A spatially detailed geotechnical database repository has been developed for this study to facilitate the interpolation and verification of the subsurface soil conditions within the study region. The dataset integrates recent site explorations, laboratory tests, site investigation reports from completed projects, and historical subsurface profiling surveys [35]. The internationally compatible approach employed followed mainly that of the American Society for Testing and Materials (ASTM) to ensure the consistency, accuracy, and replicability of the methods. The geotechnical properties selected for spatial modeling were based on their significance in foundation engineering, seismic response assessments, and infrastructure performance under varying subsurface conditions. For instance, standard penetration test (SPT-N) measurements serve as substitutes for the soil relative strength and density and are widely used within empirical relations for bearing capacity, liquefaction potential, and settlement predictions (ASTM D1586) [36]. The shear wave velocity (Vs) is used for seismicity evaluations and defines the dynamic stiffness, and it is one of the main inputs in site classification for seismic code design (e.g., IBC, Eurocode 8) [37]. The plasticity index (PI), representing the soil’s potential for plastic deformation, is important to assess volume change tendencies and shrink–swell properties (ASTM D4318). The classification of soil by the Unified Soil Classification System (USCS) is used to direct geotechnical classification in engineering applications. The collected data consist of 350 discrete sites of geotechnical measurements, randomly distributed within the area under investigation, with a depth range of 0–10 m (Figure 4). The data are spatially irregular due to the effects of practical constraints associated with borehole installation and past sampling densities, representing a realistic but challenging scenario in which to assess the spatial interpolation algorithm’s robustness. The preprocessing of the data included outlier detection, normalization to unit scales, the removal of inconsistent records, and stratification by depth as required. The datasets for the geotechnical parameters were georeferenced to ensure the precise positioning of borehole logs. The final dataset is a heterogeneous but technically valid foundation for the development of high-resolution GDMs.

3.5. Research Methodology

This study employs an integrated geospatial modeling technique for the development and evaluation of GDMs with augmented as well as conventional interpolation techniques. The methods involve five core phases: (i) preprocessing and collating geotechnical datasets; (ii) the implementation of spatial interpolation models; (iii) surface prediction by using a grid pattern layout; (iv) performance benchmarking using standardized metrics; and (v) spatial interpretation for planning and infrastructure development. These models were executed via the Google Earth Engine (GEE) platform by using a custom-coded JavaScript environment for raster-based visualization.

3.5.1. Data Structuring and Input Preparation

Geotechnical data with spatial location were acquired from field investigations that were conducted at different construction sites within the study region, as presented in Figure 4. Key soil attributes responsible for foundation design and structural response were acquired, including SPT-N, Vs, PI, and USCS classification. The data from boreholes were spatially referenced to enable seamless integration into the GEE environment. Prior to spatial modeling, all inputs were formatted to point vector layers and then subjected to quality control procedures like checking for outliers, consistency checking, and the deletion of null or anomalous values. The data were then converted to raster-ready inputs by means of a point-to-grid transformation with an optimized spatial resolution to capture local variability without inducing interpolation noise.

3.5.2. Implementation of Spatial Interpolation Algorithms

Three spatial interpolation models were employed in this study to produce GDMs, i.e., classical IDW, with a constant exponent distance-weighted function; standard ordinary Kriging by semivariogram modeling; and augmented modified Shepard-type IDW, with a gradient-sensitive weighting function and a monotonization step to reduce artificial discontinuities. These approaches were implemented with independently parameterized modules to allow consistent control of the spatial resolution, neighborhood radius, and interpolation kernel. For Kriging, an exponential semivariogram model was selected after comparison with spherical and Gaussian options, with the empirical best-fit performance being resolved by residual variance and spatial continuity.

3.5.3. Model Calibration and Validation Protocol

To ensure an unbiased performance evaluation, the dataset was divided randomly into training and validation sets, ensuring that the uniform geographic distribution was maintained. The data were cross-validated against each observed value to comprehensively validate the prediction surfaces generated by the utilized algorithms against the field observations. This approach helped to quantify the predicted accuracy across the densely and sparsely distributed sample regions. The predicted values across the generated grids were extracted from raster to point extraction tools, which were cross-validated through key performance indicators (KPIs). Four KPIs were used to estimate model accuracy numerically: (i) the RMSE measures the mean magnitude of the predictive error; (ii) the MAE calculates the absolute error with reference to observed values; (iii) NSE considers the model’s ability to recreate the variability of field data; and (iv) R2 indicates the level of linearity between predicted and measured values. Such measures collectively provided data concerning the model’s predictive ability, as well as the spatial representativeness of the surfaces that were interpolated.

3.5.4. Geospatial Processing and Visualization

All interpolation and validation was conducted using the GEE platform, which provided scalable, high-speed parallel processing. The GDMs were generated as raster tiles of all the geotechnical parameters, which can be interpreted visually and directly utilized by engineers for application. Additionally, spatial overlay between values that were predicted with land uses served to create risk-informed plans for infrastructure.

3.5.5. Integration with Foundation Design Guidelines

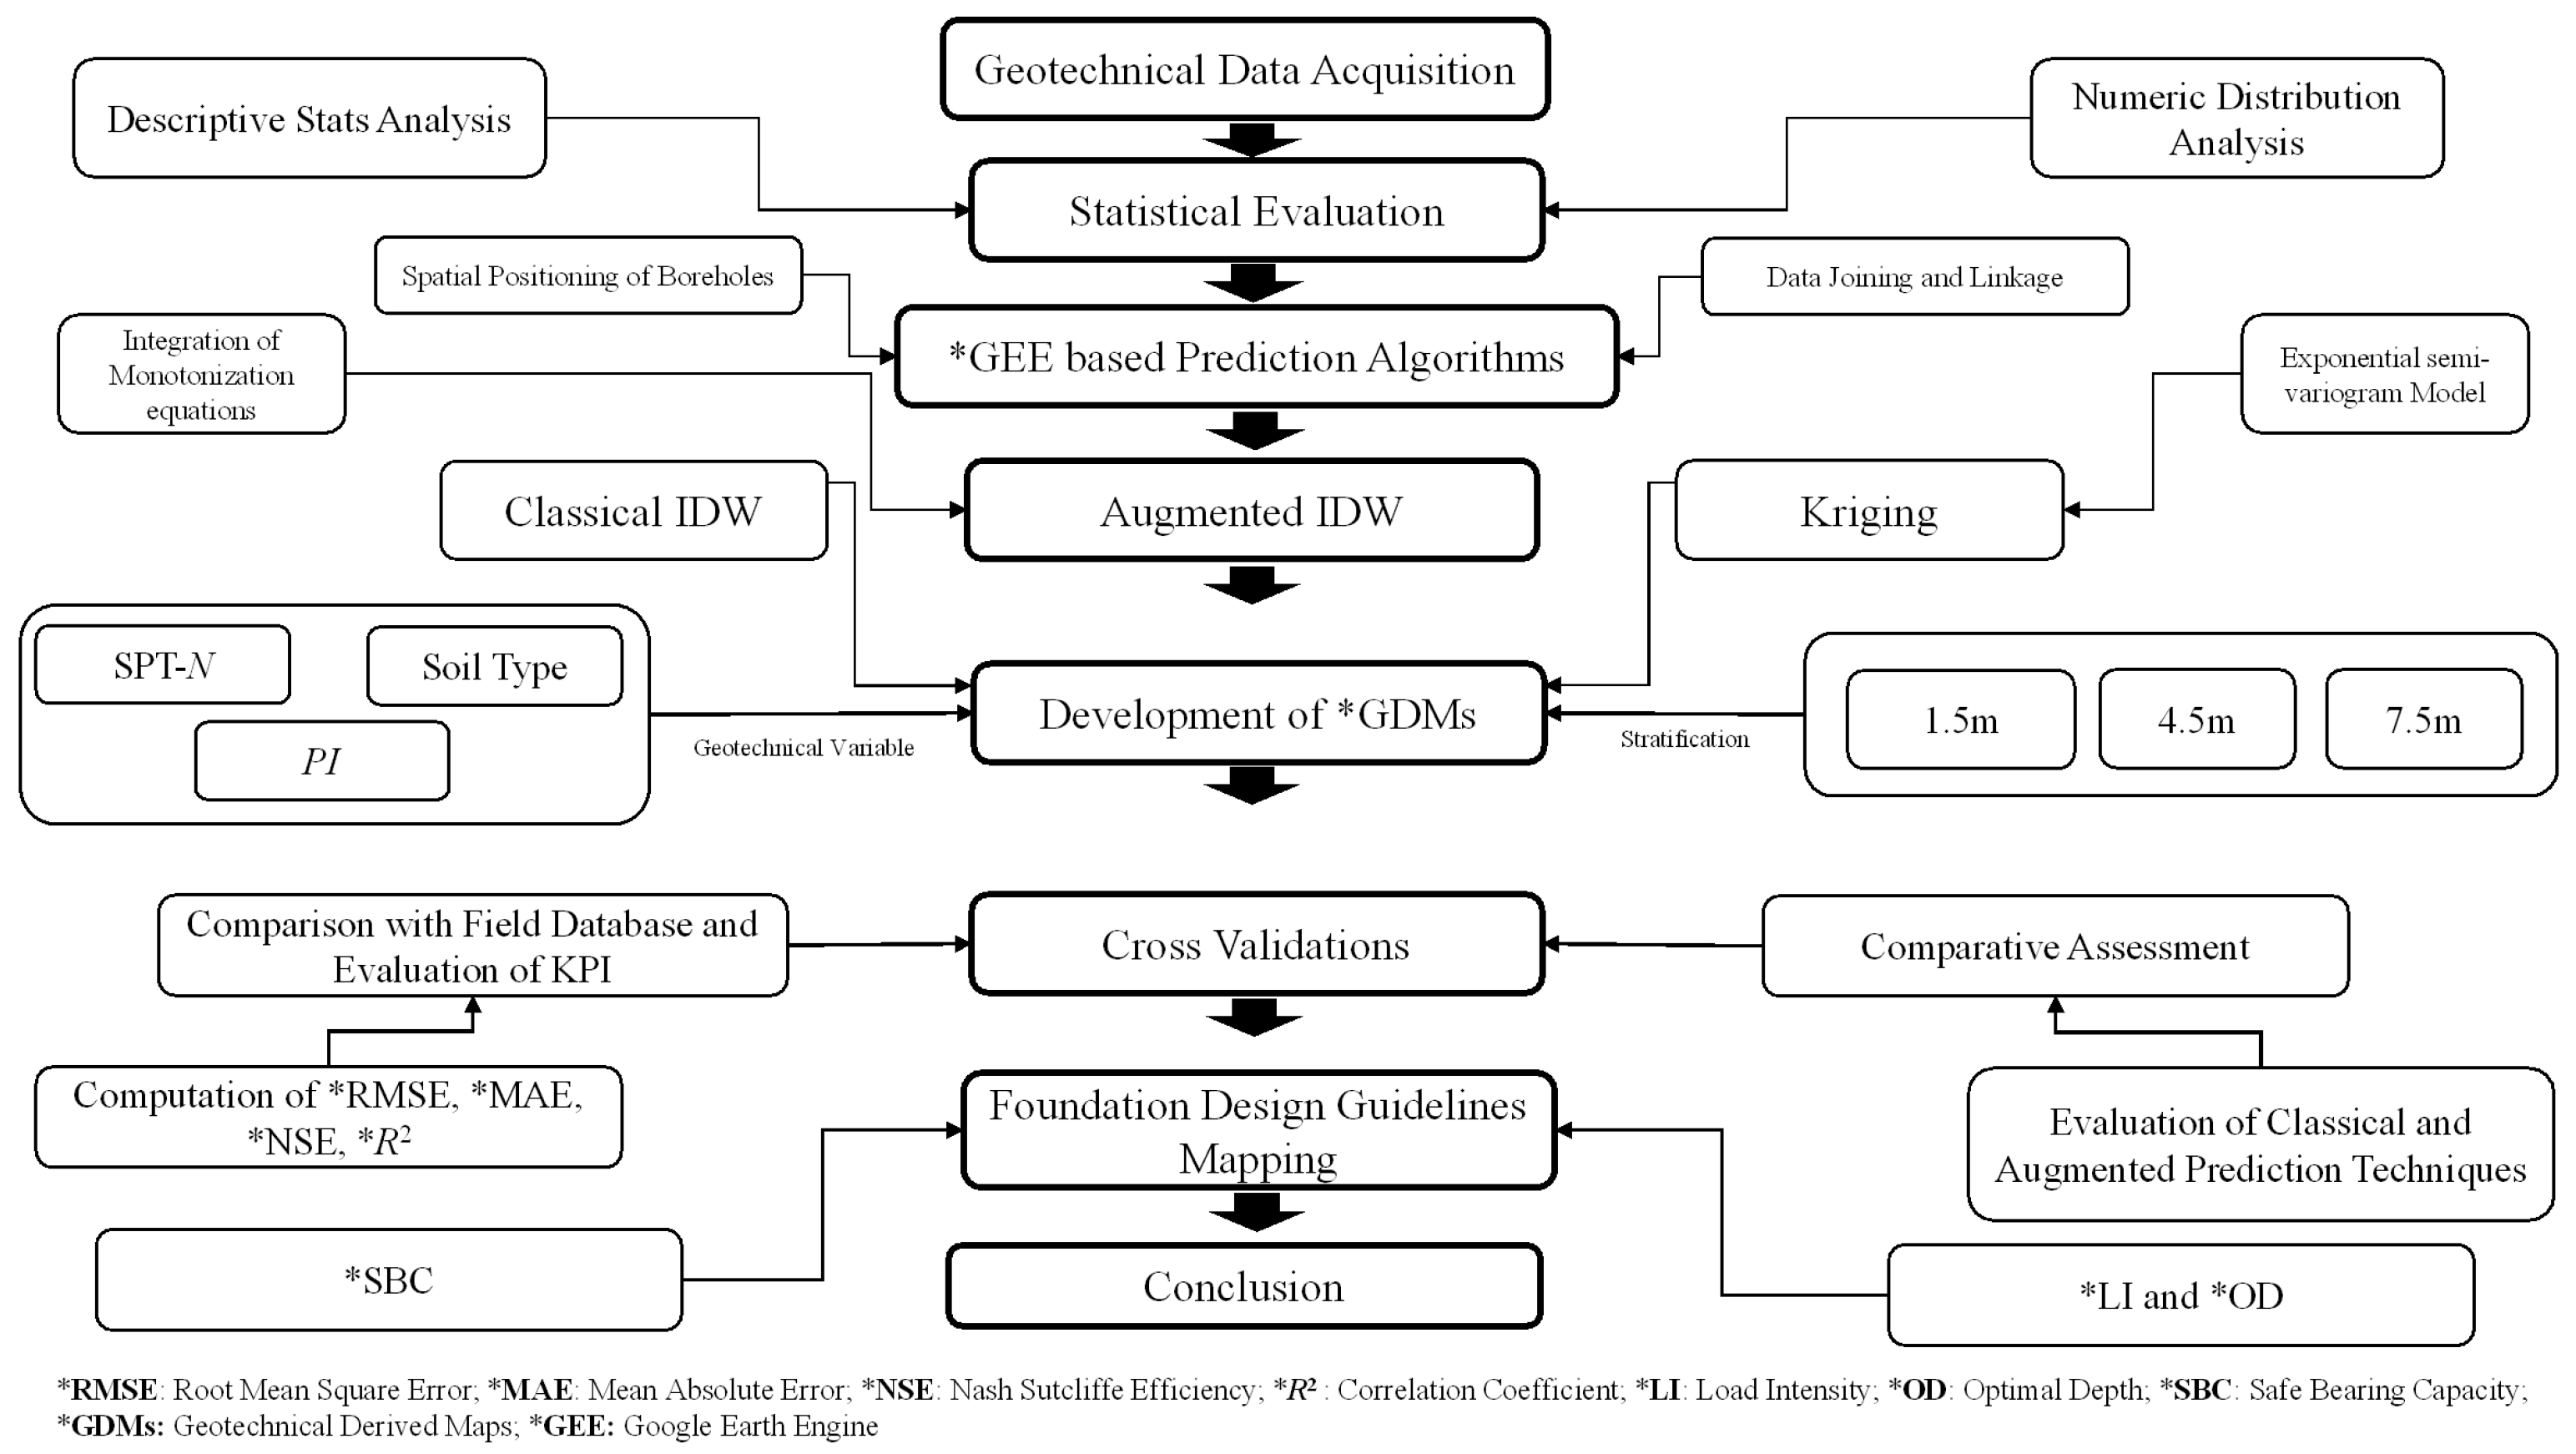
To extend the applicability of the GDMs for engineering design purposes, interpolated parameters such as SPT-N, Vs, and PI were transformed systematically into foundation-related parameters, i.e., safe bearing capacity (SBC), load intensity (LI), and optimal depth (OD) of foundation. These design parameters were derived using standard empirical correlations and established geotechnical practices and reclassified into suitability zones for practical interpretation. The outcomes were then superimposed over ancillary spatial coverages (e.g., slope, land cover, erosion risk) to define foundation suitability zones and offer a spatial decision support platform for risk-informed infrastructure planning. Figure 5 presents the detailed methodological framework of the study.

4. Results and Discussion

4.1. Statistical Analysis of the Database

A multivariate statistical analysis of the subsurface geotechnical data was carried out to assess the characteristics of their distribution, their depth-wise variability, and their suitability for spatial interpolation. The key geotechnical parameters, namely SPT-N, Vs, soil type, and PI, were investigated across standard depth increments (1.5 m, 4.5 m, and 7.5 m) with a set of robust statistical measures, as can be seen in Table 1 and Figure 6 and Figure 7.

4.1.1. Depth-Dependent Behavior and Variability

The SPT-N values, indicative of the resistance and density of soils, sharply increased with depth, with a distinct upward trend, from a mean of 6.4 at 1.5 m to 16.3 at 7.5 m (Figure 6a–c). This implies that, throughout alluvial plains, strata become more consolidated with increasing depth. The standard deviations and skewness values corresponding to them, between 0.8 to 1.1, indicate distributions with a moderate right-skew shape, suggesting a higher frequency of lower-strength soils near the ground. The gradual reduction in kurtosis indicates a shift from peaked to more normally distributed patterns with depth. On the other hand, the soil type, numerically encoded, was less variable and skewed with an increase in depth. However, its kurtosis rose significantly at 4.5–7.5 m (up to 14.9), indicative of heavy-tailed distributions that are likely a consequence of interbedded layers. Notably, values of −3.8 for skewness indicate a severe left skew, a trait that hints at the predominance of small numerical codes or possibly cohesive soils within center depth layers (Figure 6d–f). Meanwhile, PI, a significant predictor of volume change behavior and the percentage of clay, was highly erratic. It had significant skewness (5.4) and kurtosis (28.7) at 4.5 m, indicating a dataset that consisted largely of very small PI values with a few high-plasticity zones. The absence of any variability at 7.5 m suggests homogeneous low-plasticity deposits (Figure 6g–i). Overall, the geotechnical variables exhibited depth-dependent trends, highlighting the statistical consistency and confirming the dataset’s suitability for geotechnical mapping and for the evaluation of classical versus augmented interpolation algorithms.

4.1.2. Distribution and Range Analysis

The histograms, cumulative distribution, and violin plot, as presented in Figure 7, confirm that the geotechnical parameters are non-normal with depth. For instance, the SPT-N distributions positively shift with depth but are still leptokurtic (peaked), further supporting their non-Gaussian character. The soil type exhibits multimodality, reflecting shifting lithologies even within narrow depth bands. The PI values are highly skewed, with a large number of data points near zero, highlighting non-plastic behavior, whereas a small number of extremely high values shift the distribution. These patterns are of central importance to interpolation, as data that demonstrate heavy-tailed or skewed distributions could compromise prediction models by causing bias, especially where techniques such as Kriging assume underlying normality and stationarity. This observation provides a solid reason to include an improved IDW protocol with local weighting, since it is able to accommodate spatial anomalies without being overly constrained by strict distributional assumptions. The presence of widespread heterogeneity reveals a pervasive need to use data-based, high-resolution interpolation techniques with the ability to cope with local heterogeneity. Moreover, depth-dependent data spread increments (e.g., IQR and MAD measures of SPT-N) suggest that deeper strata are spatially more complicated, with a greater need to utilize advanced modeling approaches.

4.2. GDMs Based on SPT-N

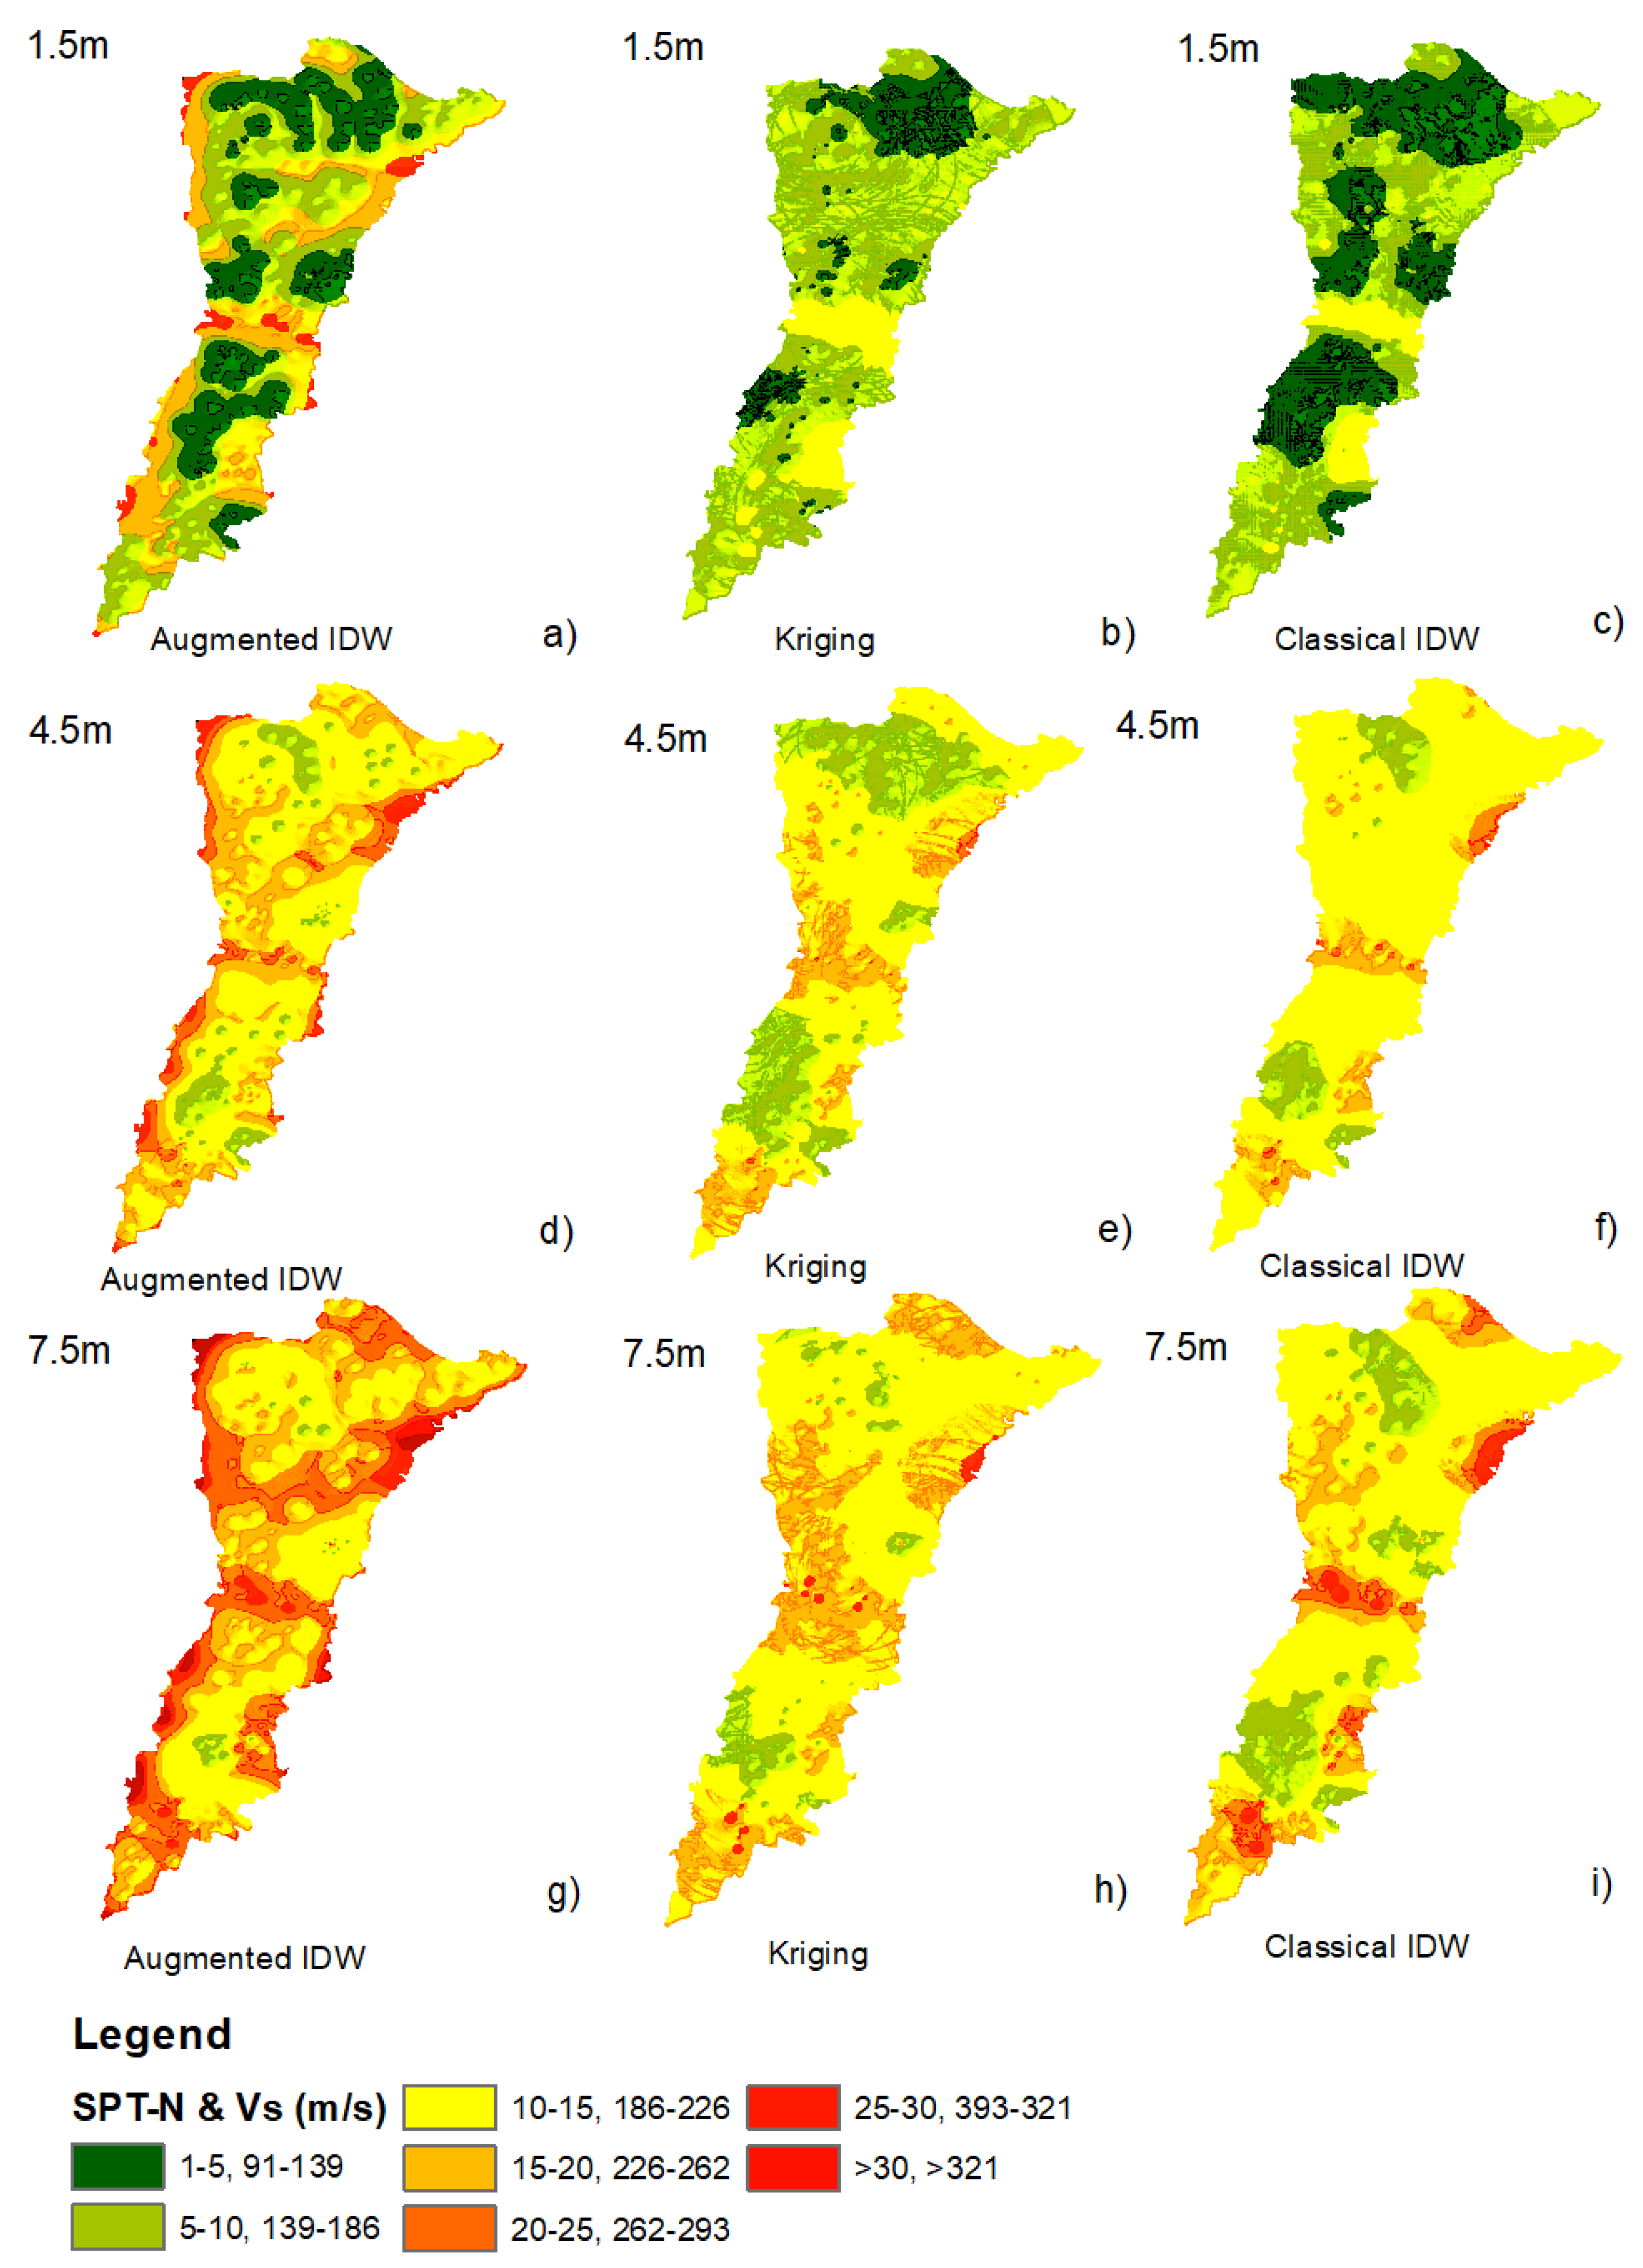
Figure 8 presents the GDMs based on SPT-N and Vs across three different depth intervals (1.5 m, 4.5 m, and 7.5 m), derived from three interpolation methods, namely augmented IDW, ordinary Kriging, and classical IDW. To capture the variability in soil consistency and stiffness with depth, both SPT-N and the corresponding Vs were stratified. SPT-N was classified into seven classes, i.e., 1–5, 5–10, 10–15, 15–20, 20–25, 25–30, and >30. Correspondingly, Vs is grouped as 91–139, 139–186, 186–226, 226–262, 262–293, 293–321, and >321 m/s. These ranges enable the joint interpretation of strength and stiffness characteristics across the depth profile.
At a 1.5 m depth, augmented IDW demonstrates better spatial continuity and the accurate delineation of discrete regions with low-strength soil (SPT-N: 1–5; Vs: 91–139 m/s), as can be seen in Figure 8a, with high fidelity, especially in peripheral and riverine zones. In contrast, Kriging appears to overgeneralize spatial trends, leading to excessive smoothing to suppress weak zones (e.g., SPT-N < 5 and Vs < 140 m/s), which may compromise the reliability of load-bearing capacity and seismic vulnerability assessments. Classical IDW (Figure 8c) demonstrates stepping transitions and radial artifacts away from sample locations, due to its vulnerability to non-uniform data densities and intrinsic inability to delineate gradients. For instance, high-SPT-N and -Vs zones appear exaggerated near dense sampling clusters, violating geophysical plausibility.
At a depth of 4.5 m, the differences become considerably larger. Augmented IDW (Figure 8d) still preserves the continuity of stratified low-strength zones, especially within subregions in the south and east. For instance, it delineates transitional ranges in SPT-N (15–25) and the corresponding Vs values (226–293 m/s), effectively capturing the geologically plausible changes without developing artificial discontinuities. Kriging (Figure 8e) still maintains average variability but, again, oversmooths crucial transition regions. Classical IDW (Figure 8f) still fails, with fragmented surfaces of prediction and visual interpolation bias near data clusters, producing abrupt shifts in SPT-N and Vs that do not align with known lithological processes. At a 7.5 m depth, augmented IDW’s advantages (Figure 8g) are particularly apparent. It retains satisfactory grades over weak and strong regions of soil and accounts for the directional heterogeneity existing within depositional grounds. High-SPT-N and -Vs zones (≥30 and ≥321 m/s) are well localized, supporting better site differentiation for foundation depth decisions. The interpolated patterns of SPT-N and Vs evolve smoothly with depth and across the horizontal plane, ensuring spatial continuity and avoiding the abrupt artificial discontinuities typical of classical IDW. Kriging (Figure 8h), although visually smoother, skips several significant anomalous locations of low strength, misleading the load-bearing and seismic assessment. Classical IDW (Figure 8i) has wide homogeneous areas and does not exhibit sensitivity to subsurface variability. Overall, augmented IDW outperforms Kriging and classical IDW in SPT-N and Vs mapping by enforcing gradients and retaining the stratigraphic continuity due to Shepard-based smoothing. This improves the reliability in key design aspects, such as site classification and seismic response. Kriging’s oversmoothing and model dependency, and classical IDW’s interpolation artifacts, however, limit their reliability, particularly in outlining SPT-N- and Vs-sensitive transitions.

4.3. GDMs Based on Soil Type

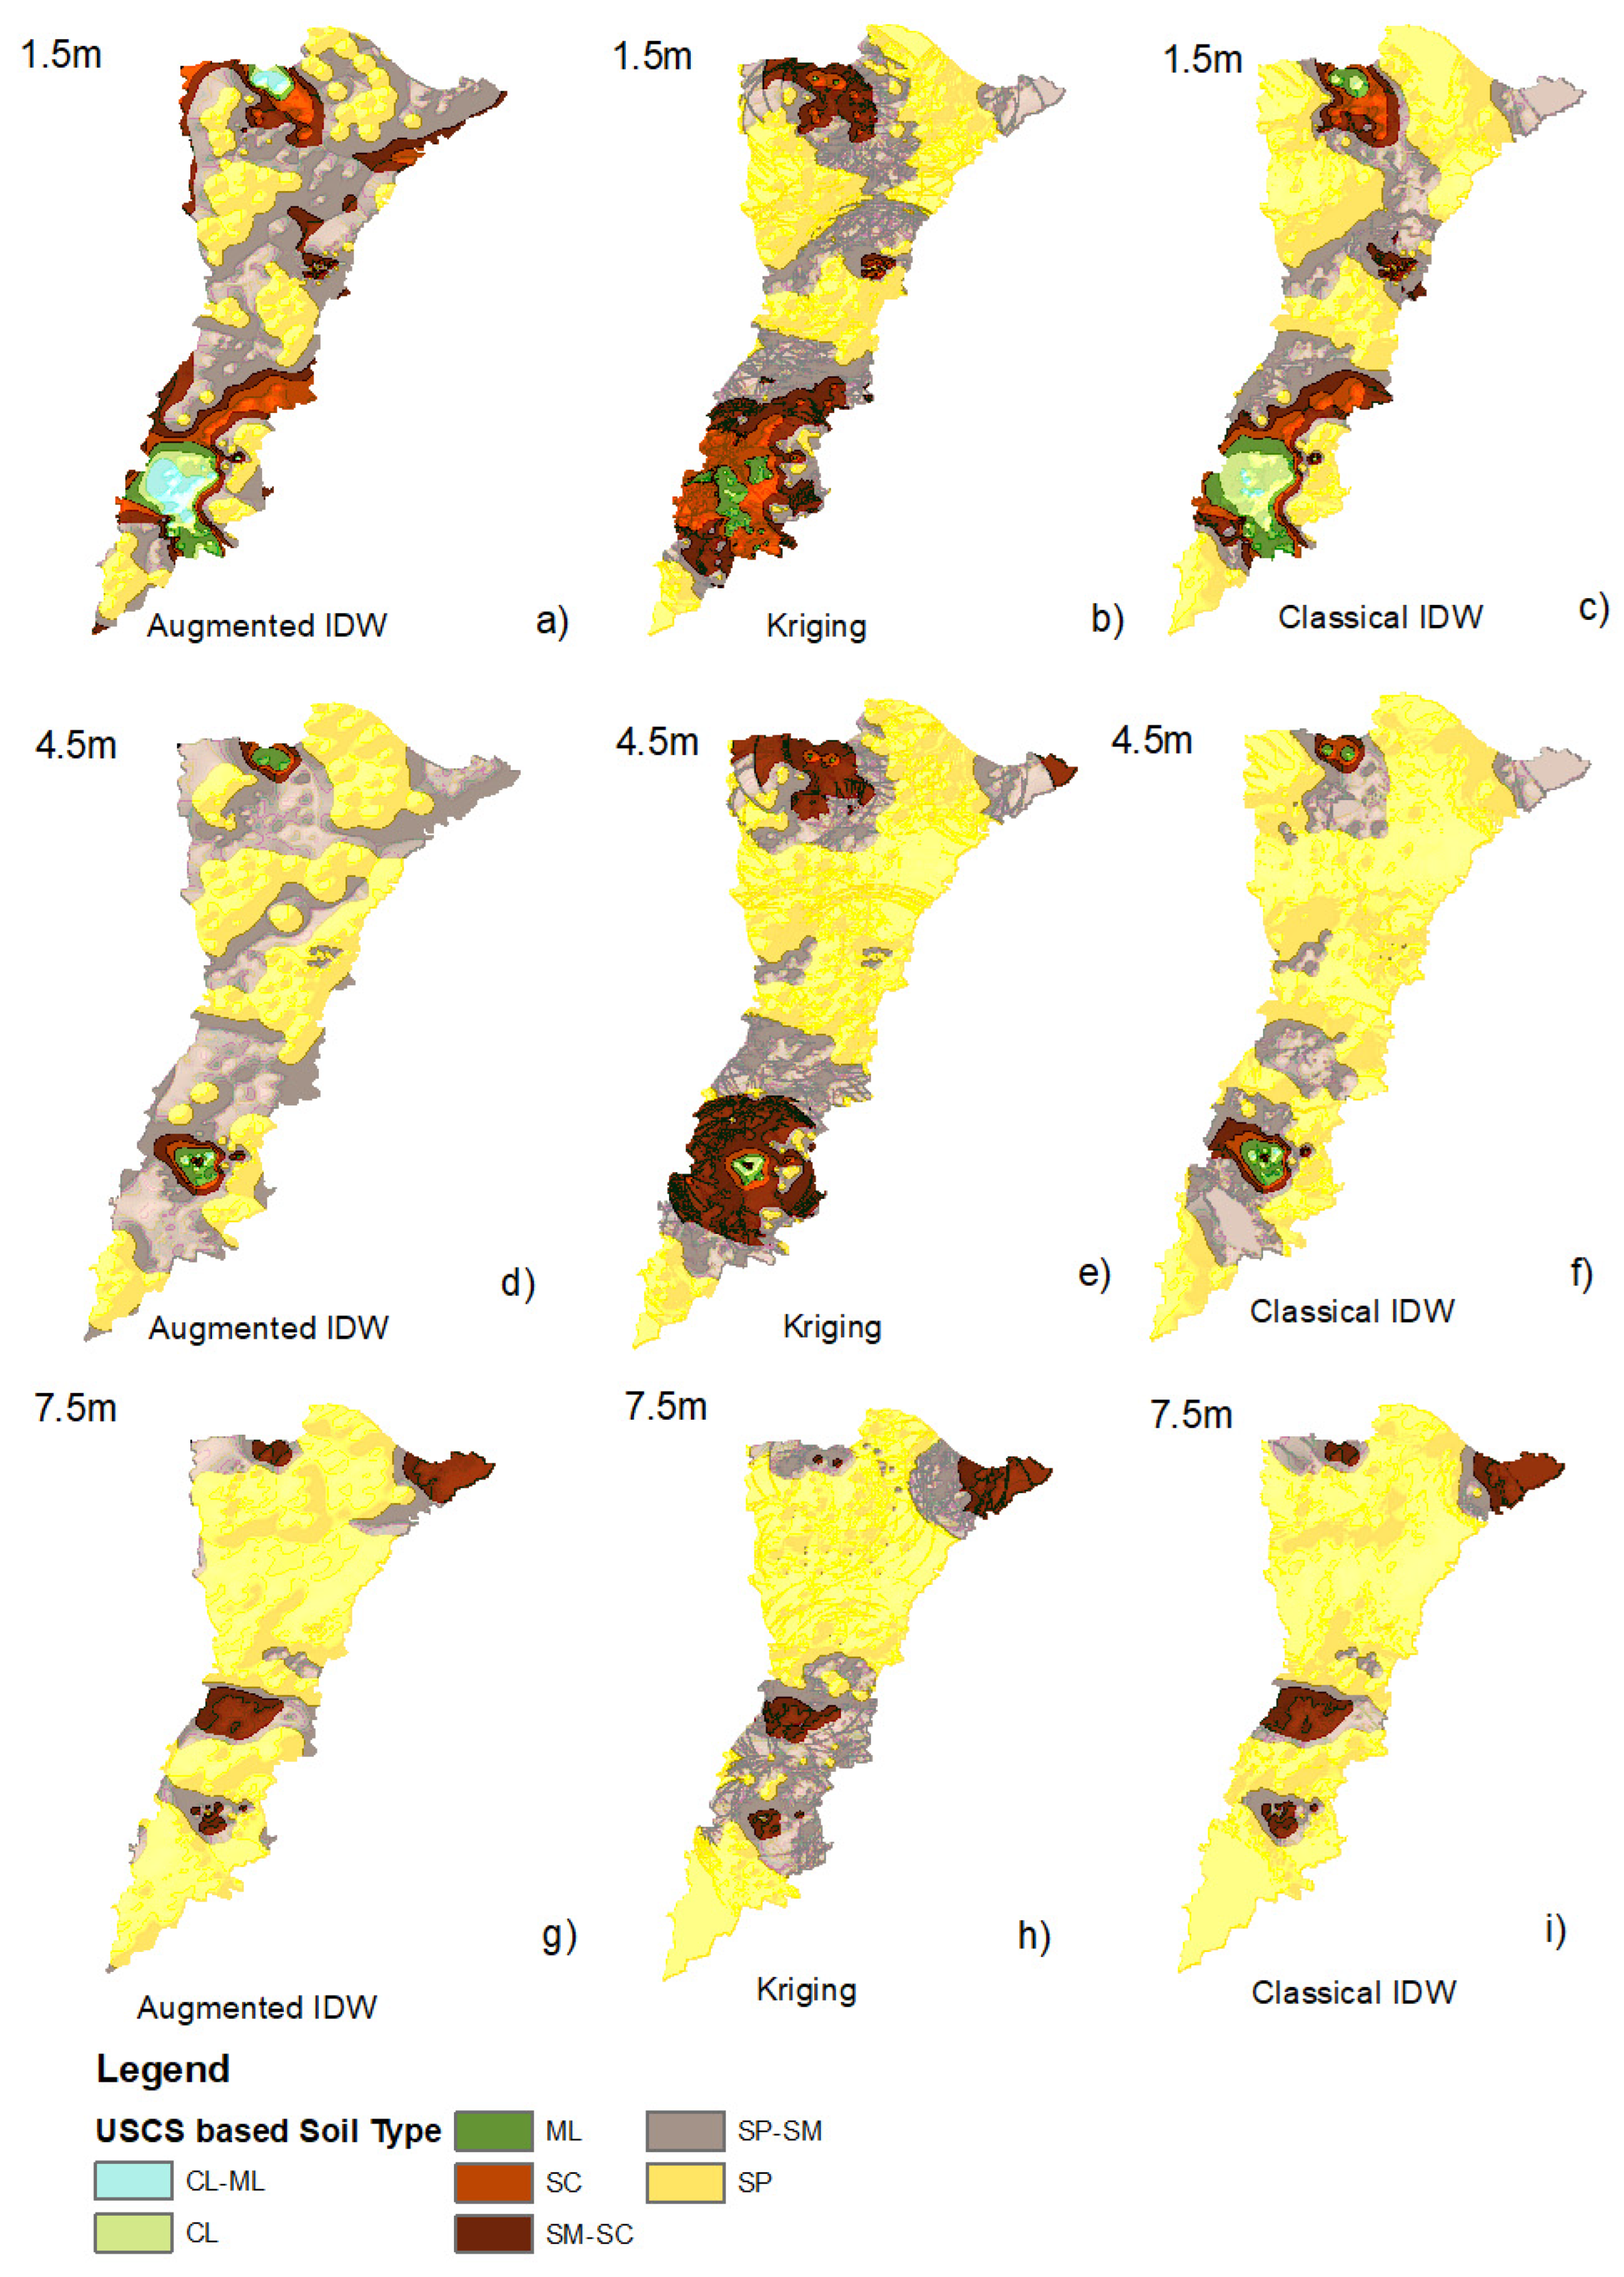
Figure 9 reveals the GDMs based on the soil type at three different depths (1.5 m, 4.5 m, and 7.5 m), obtained by employing the augmented IDW, classical Kriging, and classical IDW techniques. The capability of each technique to preserve the lithological boundaries and spatial heterogeneity is critically assessed. Based on the geotechnical database, the study area was delineated into seven soil classes as per the USCS, including fine-grained soils, i.e., CL, CL-ML, and ML, and coarse-grained soils, i.e., SC, SP, SP-SM, and SM-SC. This classification captures the region’s lithological variability, reflecting its geotechnical behavior in terms of plasticity, drainage, erodibility, and compaction characteristics. At a 1.5 m depth, augmented IDW (Figure 9a) delineates unit limits with high spatial coherence, successfully outlining areas with low-plasticity silts (ML) and clayey–silt association (CL-ML), especially within the eastern and western floodplains. It maintains sharp limits with local variability, without forming radial or smoothing artifacts. Kriging (Figure 9b), on the other hand, gives smoother limits but suffers from edge bleeding and clustering artifacts, especially where data are scarce. Classical IDW (Figure 9c), while outlining major broad classes including SP (poorly graded sands), has a problem with contouring bias and does not outline small inclusions. At a 4.5 m depth, augmented IDW (Figure 9d) remains robust, outlining buried cloddy soil pockets (CL, SC) and clayey sands (SM-SC) within dominant sandy conditions. Its ability to delineate isolated-lens areas and transition areas, central to foundation hazard assessment, significantly surpasses that of the other methods. The interpolated distribution of soil types exhibits gradual transitions with depth and across the horizontal plane, ensuring spatial continuity and minimizing the abrupt, artificial boundaries often produced by classical techniques. Kriging (Figure 8e) overextends clusters, with a propensity to inaccurately delineate the northern depositional transitions. Classical IDW (Figure 9f) shows poor definition again, with very simplified spatial patches. At a 7.5 m depth, the subsurface variability reduces, but augmented IDW (Figure 9g) performs better, especially when incorporating the tiny ridges of buried clay-rich strata. Kriging (Figure 9h) introduces spatial artifacts and loses delineation in low-density sampling zones, while classical IDW (Figure 9i) does not account for deeper changes within stratification, exhibiting a very homogenous soil matrix. Overall, the augmented IDW technique exhibits increased classification fidelity, spatial realism, and sensitivity to local lithological variation. These aspects are critically important in foundation planning, where soil transitions and anomalies directly influence the bearing capacity, settlement behavior, and seismic response. Whereas Kriging’s smoothing effect and classical IDW’s abrupt radial distortions are undesirable, the monotonic extension utilized within the augmented Shepard algorithm exhibits better continuity without compromising the geological precision.

4.4. GDMs Based on PI

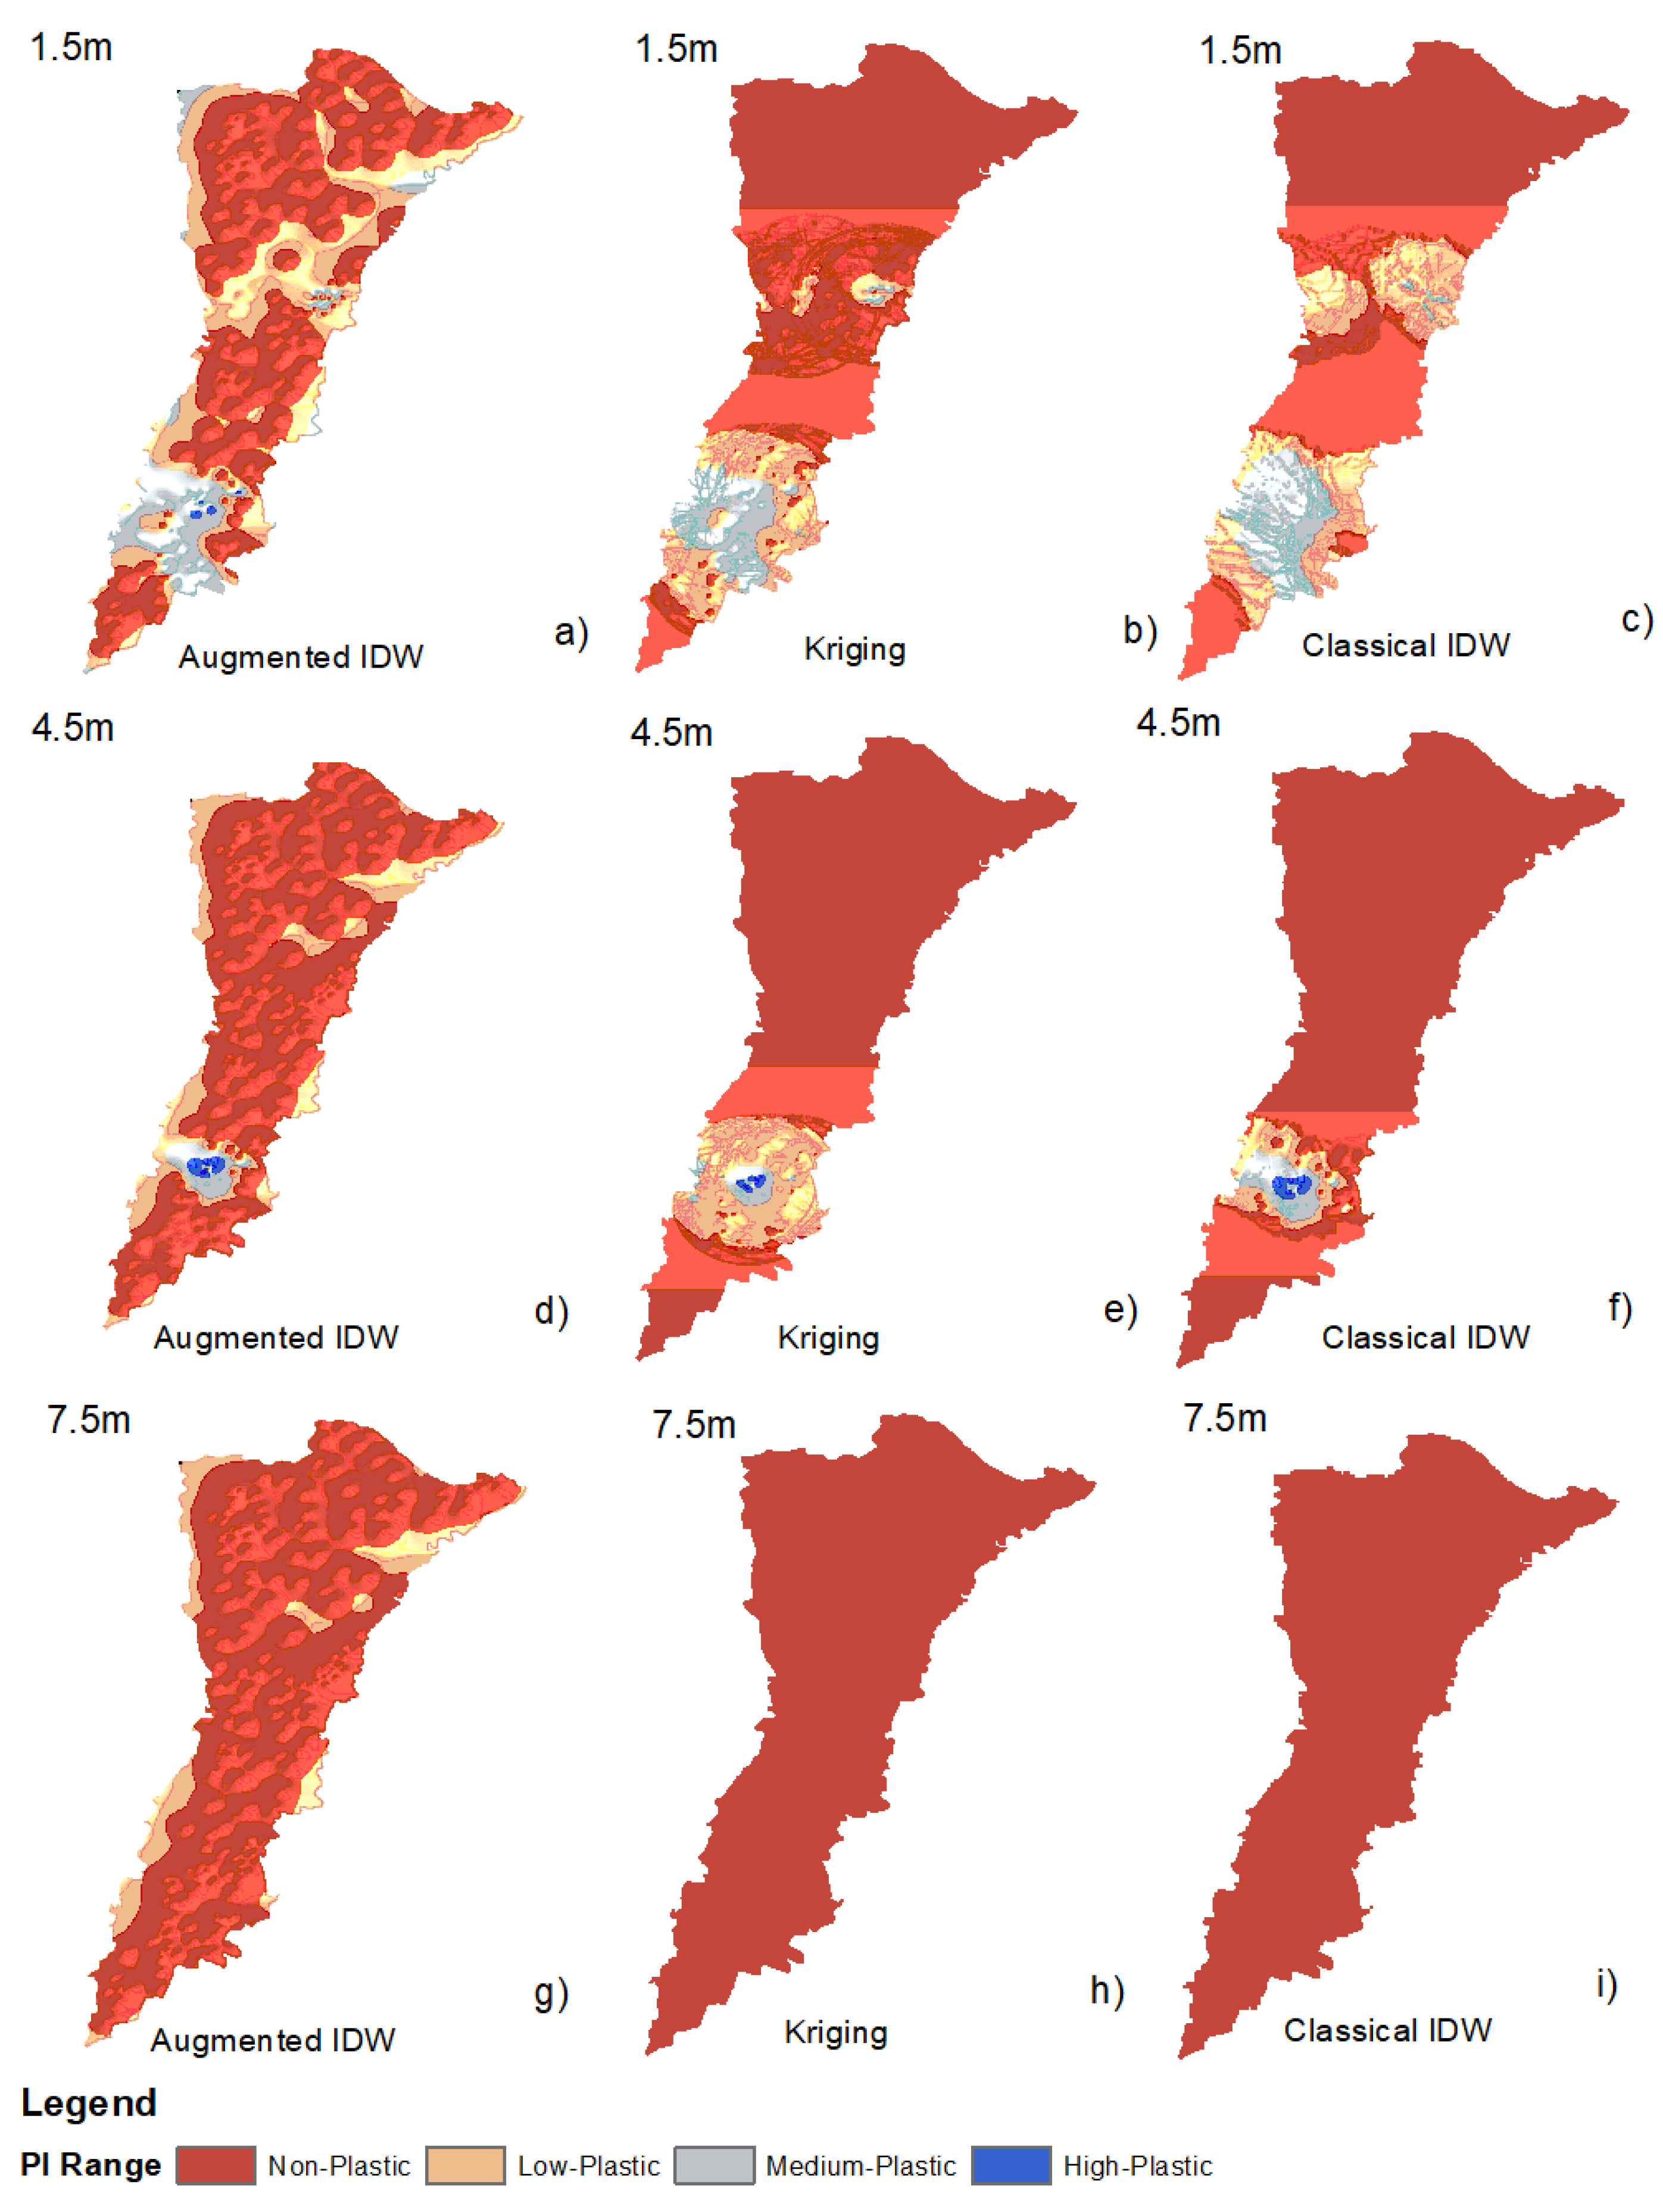
Figure 10 presents the GDMs based on PI using the augmented IDW, Kriging, and classical IDW algorithms, respectively, corresponding to depths of 1.5 m, 4.5 m, and 7.5 m. The performance of each technique is compared by considering their ability to delineate fine changes in plasticity and to display acceptable subsurface behavior. PI was classified into four categories, i.e., non-plastic (PI = 0), minimally plastic (0–7), moderately plastic (7–17), and highly plastic (17–30), reflecting gradations in soil plasticity behavior. At a 1.5 m depth, augmented IDW (Figure 10a) depicts distinct zonation of PI classes, particularly within southern and southeastern regions, where small clumps of highly plastic clays (PI > 17–30) are delineated with crisp boundaries. This local sensitivity proves critical to estimate volumetric change behavior and foundation integrity in swelling soil regions. Kriging (Figure 10b), although capturing the overall north–south differentiation, imposes spurious patch-like clustering and smooths transitions, with probable underestimation within high-risk zones. Classical IDW (Figure 10c) results in spatially homogenized maps with less defined transitions, with a likelihood of missing microzones of medium to high plasticity, critical to estimate differential settlement.
At 4.5 m, better contrast and resolution are exhibited by augmented IDW (Figure 10d). It effectively outlines subsurface inclusions of moderately to highly plastic strata embedded within a dominant non-plastic region, an important factor to consider during long-term deformation behavior assessment. Kriging (Figure 10e) and classical IDW (Figure 10f) exhibit regions with constant values with extremely wide transitions, which fail to account for the spatial variability manifested in the field data. In particular, Kriging introduces steep gradients within boundary regions due to its reliance on global variogram models. At a 7.5 m depth, the difference in prediction is more prominent. Kriging and classical IDW (Figure 10h,i) inherently map to a uniform non-plastic state across a wide region, which is inconsistent with the known geological complexity in alluvial depositional systems. Meanwhile, augmented IDW (Figure 10g) identifies residual areas of highly and moderately plastic soils within the central and southeastern pockets, an indication of persistent clay lenses, which are significant for deep foundation design and seismic response. In conclusion, augmented IDW consistently outperforms the other two approaches by virtue of its spatial continuity, indication of local plasticity anomalies, and suppression of oversmoothing—traits that are essential for geotechnical design. Kriging’s smoothing bias and variogram dependency make it less reliable within sparsely sampled domains. Classical IDW, by virtue of its simplicity, fails to offer sufficient adaptive monotonic control to mimic large PI gradients, especially in heterogeneous depositional environments like the Indus Basin alluvium.

4.5. Model Validation and Comparison: A Discussion

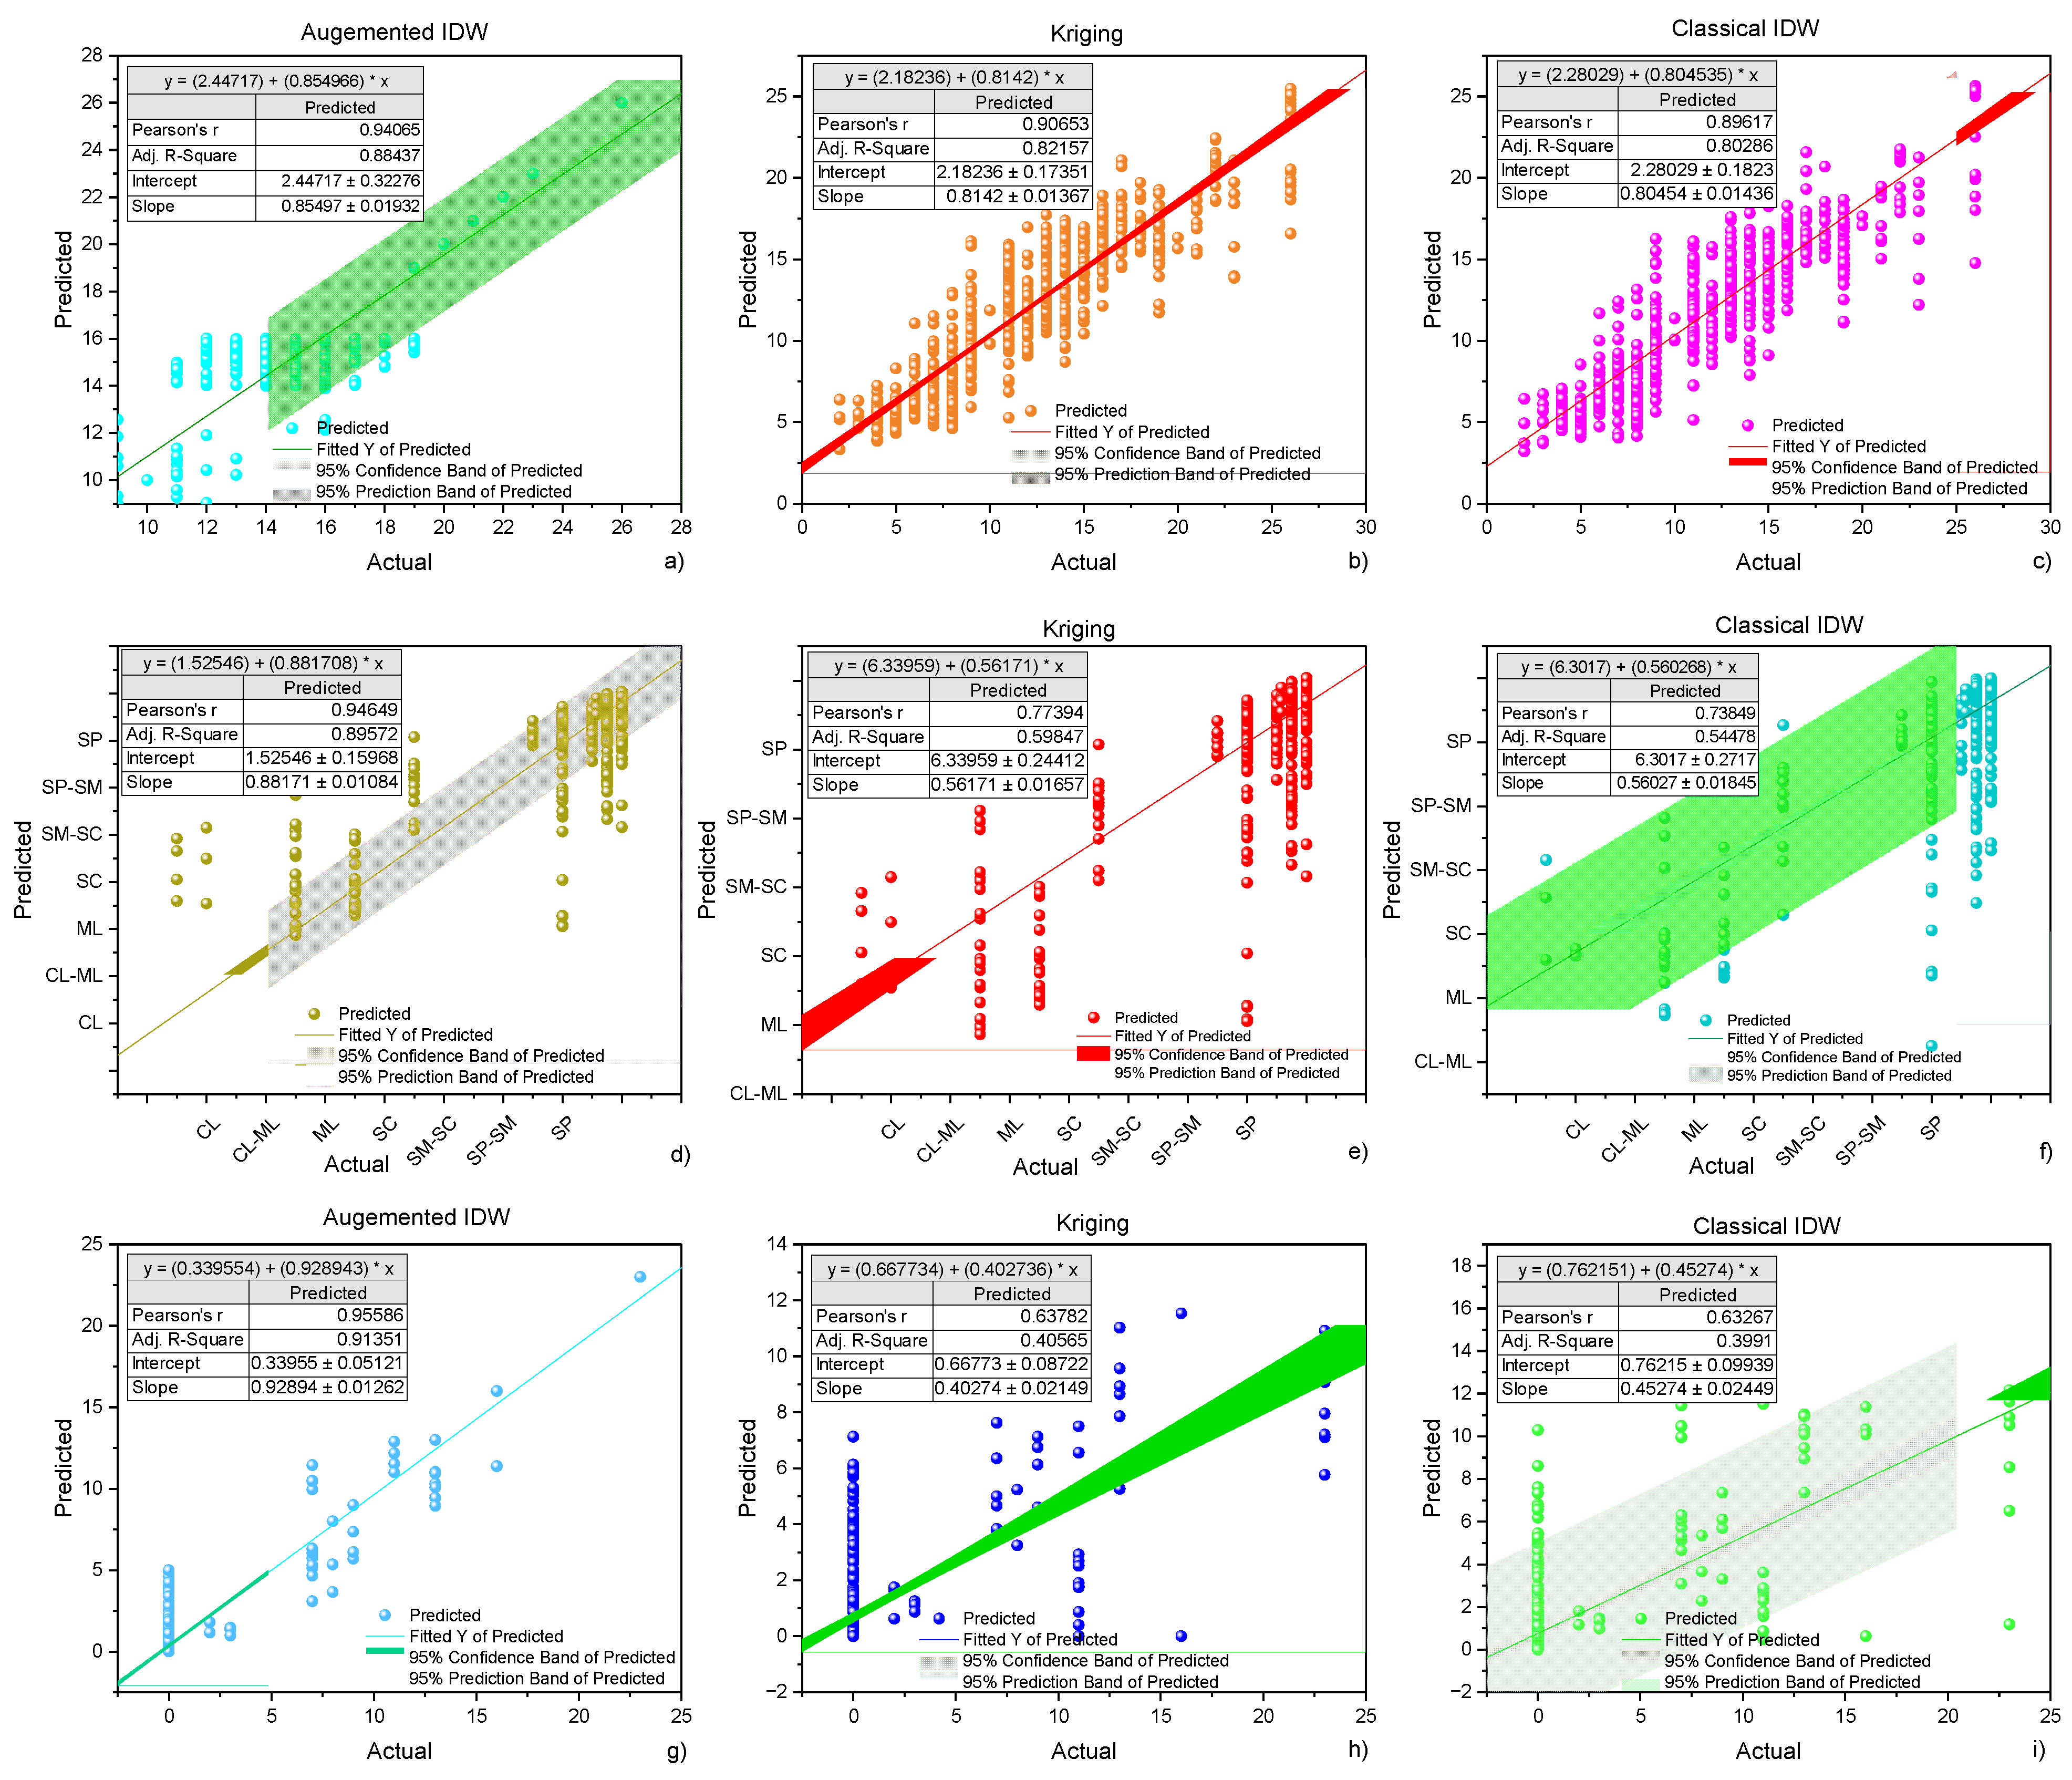
To precisely examine the predictive reliability of the interpolation techniques, quantitative cross-validation was performed. The augmented IDW, Kriging, and classical IDW models were tested regarding several KPIs—Pearson’s correlation coefficient (PC), the coefficient of determination (R2), the regression slope, and the RMSE, MAE, and NSE—and the results are presented in the form of scatter plots in Figure 11, with performance metrics in Figure 12. The RMSE and MAE for augmented IDW for various geotechnical parameters range between 0.502 and 1.74, while NSE and PC ranged between 0.88 and 0.95. Overall, augmented IDW outperforms Kriging and classical IDW at all depths and variables. It possesses the highest values in terms of correlations with field data and unity slope values, denoting the best agreement between the observed and estimated values. Note that the model exhibits minimal dispersion around the regression line, particularly for SPT-N and Vs, implying the greatest fidelity in subsurface consistency and stiffness mapping. NSE values near 0.9 further validate its strength in prediction. The resultant superior performance is due to its intrinsic gradient conservation and localized smoothing, which preserves the global and localized spatial structure. Meanwhile, Kriging, while statistically grounded, exhibits variable performance. The accuracy of its predictions shows average strength (R2 ~0.45–0.82) but it tends to underestimate regional variability in the form of underfit regression slopes (e.g., ~0.6). This poor performance results from the semivariogram-induced sensitivity in its prediction estimates, which significantly compromises localized geotechnical transitions. Classical IDW exhibits the lowest validation results. The weaker correlation coefficients (R2 ~0.45–0.65) and higher scatter show poor generalization and overprediction around densely populated borehole regions. The interpolation bias around the data clusters leads to large RMSE and small NSE values (often <0.5), and so it is not appropriate for spatially highly complex or data-scarce regions. Overall, compared to classical IDW and Kriging, the augmented IDW algorithm achieved up to a 44% average reduction in the RMSE and MAE, along with an approximately 30% improvement in NSE and PC. Thus, this comparative validation emphasizes the superiority of augmented IDW in the estimation of the magnitudes and spatial trends of geotechnical parameters.
In conclusion, by integrating gradient-sensitive weighting and a monotonization step, the augmented IDW method preserves local anomalies while ensuring regional continuity, thereby reducing interpolation artifacts such as radial bias and abrupt transitions, which are common in classical IDW. Compared with Kriging, it is less constrained by strict statistical assumptions and performs particularly well in heterogeneous and data-scarce regions. Moreover, its ability to produce engineering-ready thematic maps, such as those of the safe bearing capacity, load intensity, and optimum depth, demonstrates its practical value in bearing capacity zoning, seismic site classification, and urban infrastructure planning. Nonetheless, augmented IDW is more computationally demanding than classical IDW and requires careful parameter tuning to balance smoothness and local detail. While robust under typical geotechnical conditions, in extremely sparse datasets, its ability to capture directional variability may be reduced. Looking ahead, challenges remain in establishing standardized guidelines for consistent adoption in engineering practice and in validating their performance through large-scale field applications across diverse geological settings. Addressing these issues will be critical in consolidating its role as a reliable tool in future geotechnical and infrastructure planning.

4.6. Foundation Design Guideline Mapping

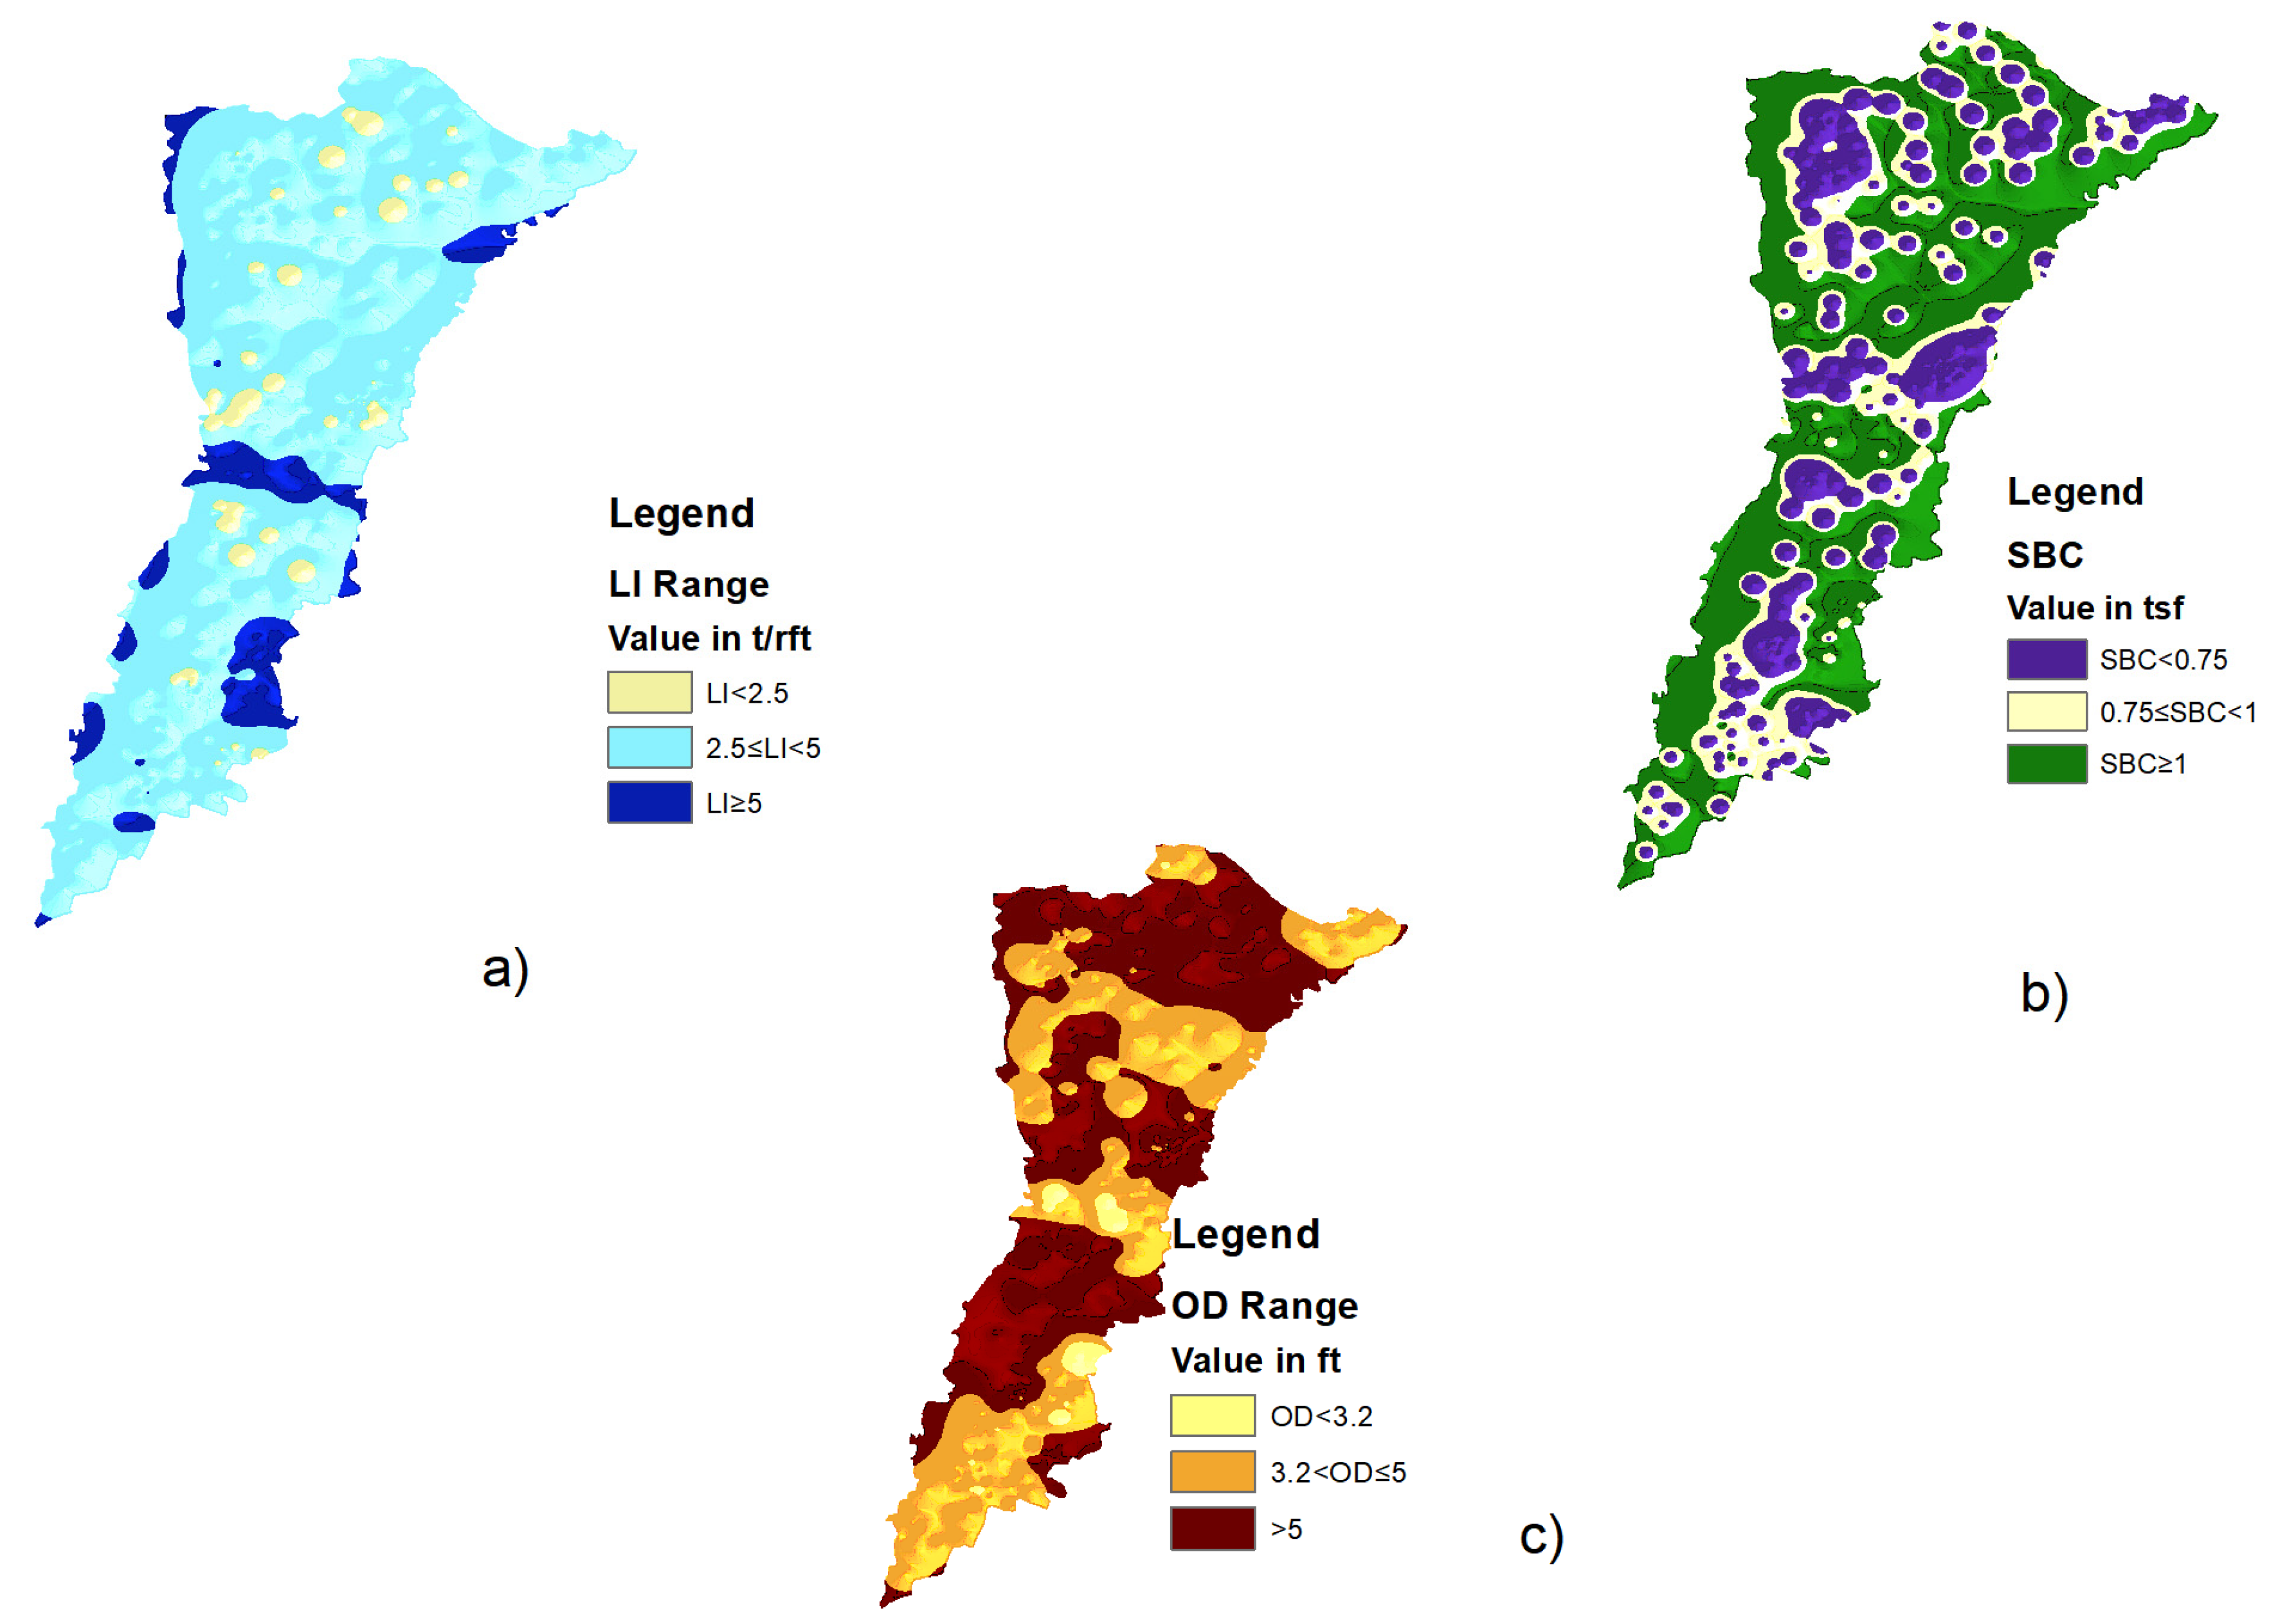
In this section, this study translates the results of geotechnical interpolation into useful engineering information through the identification of three critical foundation design parameters: the load intensity (LI), safe bearing capacity (SBC), and optimum depth (OD) of foundation. Figure 13 presents the spatial distribution maps of the indices, which could serve as a decision assistance layer for preliminary foundation planning.

4.6.1. Load Intensity (LI)

Figure 13a presents the spatial distribution of LI, based on the interpolated values of SPT-N, and reveals that a vast extent of the study area is capable of handling light to moderate loads (<2.5 tsf/ft), indicating soft to medium-density soil. Clusters of relatively higher LI values (≥5 tsf/ft) are localized and coincide with higher values of SPT-N, particularly in the southern and northwestern regions. These regions are suitable for shallow footings of low- to medium-rise structures. However, the localized nature of the regions justifies the need for intensive site-specific validation, especially for the transition regions.

4.6.2. Safe Bearing Capacity (SBC)

Figure 13b presents the SBC map, which is critical for engineering-oriented interpretation for practitioners. The vast majority of the district is located in moderate-bearing areas (0.75–1 tsf), and higher-SBC pockets (≥1 tsf) mainly occur wherever SPT-N and Vs also exhibit higher values. Note that areas of SBC < 0.75 tsf are common in the river proximity and southern subregions and need soil improvement or deep foundation measures. The SBC map thus serves as a useful early-stage screening tool for design possibilities, especially for infrastructure in flood-prone or alluvial regions.

4.6.3. Optimal Depth (OD)

Figure 13c presents the OD map, demonstrating the depth at which the soil properties become geotechnically suitable, considering the stratified layers. The regions with OD > 5 ft cover the southwestern and corridor central areas and indicate deeper deposition-competent strata and possibly related fluvial sedimentation dynamics. Regions with OD < 3.2 ft appear scattered but offer economic opportunities for shallow footings. The apparent demarcation in the OD facilitates the rational selection of excavation depths and eliminates the risk of under-designed footings and overexcavation.
Overall, the maps represent a clear geotechnical-informed design framework. By accounting for a range of indicators (LI, SBC, and OD) on the basis of reasonable interpolation schemes, the maps enable subtle zoning so that economic and safe structural design is possible. The visually represented results bridge the gap between geostatistical simulation and usability in engineering and enable accurate application, particularly in semiurban or data-scarce regions undergoing rapid growth.

5. Conclusions

This study presents an advanced geospatial modeling technique for the development of high-resolution geotechnical data-driven maps (GDMs) considering an unexplored region. The approach integrates classical and augmented interpolation techniques in order to capture the spatial variability in subsurface parameters that are significant for foundation design, like the standard penetration test (SPT-N), shear wave velocity (Vs), soil type, and plasticity index (PI). The key outcomes of this study are as follows.
  • Augmented IDW outperforms classical IDW and Kriging in preserving the local heterogeneity and gradient continuity across all depths (1.5 m, 4.5 m, and 7.5 m). Constraining the smooth monotonic behavior while retaining the important localized anomalies proves essential for subsurface interpretation that is credible.
  • Despite its theoretical validity, Kriging’s performance was undermined by its semivariogram sensitivity and stationarity assumptions. This resulted in overgeneralization, particularly in regions with soils that are soft (SPT-N < 5 and Vs < 139 m/s), and these play important roles in seismic design and settlement estimation.
  • Classical IDW produced interpolation artifacts and radial biasing effects due to its inverse distance exponent function. It could not model the realistic geotechnical property transition and thus is limited in its usage in stratified or heterogeneous soil settings.
  • Descriptive and inferential statistics, like skewness, kurtosis, and robust measures of variation, revealed pronounced vertical and lateral variability in geotechnical properties. These findings highlight the benefit of data-informed zoning in vertically and laterally heterogeneous depositional settings.
  • Quantitative validation with the RMSE, MAE, NSE, and PC consistently ranked augmented IDW highest across all key performance indices. Compared to classical IDW and Kriging, the augmented IDW algorithm achieved up to a 44% average reduction in the RMSE and MAE, along with an approximately 30% improvement in NSE and PC. Moreover, scatterplots indicated better predictive consistency with field observation values from the boreholes, through cross-validation, demonstrating tightly packed clusters of predicted values along the trend line.
  • The derived spatial maps of the load intensity (LI), safe bearing capacity (SBC), and optimum depth (OD) offer a translational connection between geostatistical modeling and the design of civil infrastructure. The thematic maps support early-stage planning, reduce excavation depth uncertainty, and offer cost-saving foundation planning.
  • Augmented IDW offers computational scalability and rapid prototyping for geotechnical evaluations over large scales. The method can be extended to other regions facing geologic sparsity or variability.
This work highlights the need for geotechnical interpolation method refinement. By demonstrating the practical advantages of augmented IDW, it not only enhances the ability to predict more accurately but also produces results that are useful for engineers, planners, and decision-making officials in rapidly urbanizing and hazard-prone settings.

Author Contributions

Conceptualization, N.I.; Methodology, N.I.; Software, N.I.; Data curation, N.I.; Investigation, N.I.; Project administration, N.I.; Writing—original draft preparation, N.I.; Conceptualization, Z.I.; Methodology, Z.I.; Validation, Z.I.; Software, Z.I.; Data curation, Z.I.; Investigation, Z.I.; Review and editing, Z.I.; Visualization, Z.I.; Supervision, N.Z.; Formal analysis, N.Z.; Writing—review and editing, N.Z.; Formal analysis, Z.u.R.; Visualization, Z.u.R.; Writing—review and editing, Z.u.R.; Validation, S.T.A.J.; Formal analysis, S.T.A.J.; Writing—review and editing, S.T.A.J.; Formal analysis, H.I.; Visualization, H.I.; Writing—review and editing, H.I.; Investigation, A.I.; Formal analysis, A.I.; Writing—review and editing, A.I. All authors have read and agreed to the published version of the manuscript.

Funding

This research was supported by the Fujian Provincial Department of Science and Technology under the 2025 Provincial Natural Science Foundation Project (Grant No. 2025J011609) and the 2024 Fujian Provincial Young and Middle-Aged Teachers Education Research Project (Science and Technology category) under Grant No. JZ240082.

Data Availability Statement

The original contributions presented in the study are included in the article; further inquiries can be directed to the corresponding author.

Acknowledgments

The authors would like to express their sincere gratitude to Quanzhou University of Information Engineering, Tongji University, and the Communication and Works Department for their invaluable support and contributions to this study.

Conflicts of Interest

The authors declare no conflicts of interest.

References

  1. Sadeghi, H.; Kiani, M.; Sadeghi, M.; Jafarzadeh, F. Geotechnical characterization and collapsibility of a natural dispersive loess. Eng. Geol. 2019, 250, 89–100. [Google Scholar] [CrossRef]
  2. Bicocchi, G.; Tofani, V.; D’aMbrosio, M.; Tacconi-Stefanelli, C.; Vannocci, P.; Casagli, N.; Lavorini, G.; Trevisani, M.; Catani, F. Geotechnical and hydrological characterization of hillslope deposits for regional landslide prediction modeling. Bull. Eng. Geol. Environ. 2019, 78, 4875–4891. [Google Scholar] [CrossRef]
  3. Huang, G.; Wu, Y.; Cheng, L.; Zhou, D.; Wang, X.; Ding, M.; Wang, P.; Wang, Y. Spatial heterogeneity of soil moisture caused by drainage and its effects on cadmium variation in rice grain within individual fields. Sci. Total Environ. 2024, 946, 174500. [Google Scholar] [CrossRef]
  4. Domènech, G.; Alvioli, M.; Corominas, J. Preparing first-time slope failures hazard maps: From pixel-based to slope unit-based. Landslides 2020, 17, 249–265. [Google Scholar] [CrossRef]
  5. Bagheri-Gavkosh, M.; Hosseini, S.M.; Ataie-Ashtiani, B.; Sohani, Y.; Ebrahimian, H.; Morovat, F.; Ashrafi, S. Land subsidence: A global challenge. Sci. Total Environ. 2021, 778, 146193. [Google Scholar] [CrossRef]
  6. Alhaji, M.M.; Alhassan, M.; Adejumo, T.W.; Abdulkadir, H. Road pavement collapse from overloaded trucks due to traffic diversion: A case study of Minna-Kateregi-Bida Road, Nigeria. Eng. Fail. Anal. 2022, 131, 105829. [Google Scholar] [CrossRef]
  7. Harman, B.I.; Koseoglu, H.; Yigit, C.O. Performance evaluation of IDW, Kriging and multiquadric interpolation methods in producing noise mapping: A case study at the city of Isparta, Turkey. Appl. Acoust. 2016, 112, 147–157. [Google Scholar] [CrossRef]
  8. Khan, M.; Almazah, M.M.; EIlahi, A.; Niaz, R.; Al-Rezami, A.Y.; Zaman, B. Spatial interpolation of water quality index based on Ordinary kriging and Universal kriging. Geomat. Nat. Hazards Risk 2023, 14, 2190853. [Google Scholar] [CrossRef]
  9. Ijaz, Z.; Zhao, C.; Ijaz, N.; Rehman, Z.U.; Ijaz, A. Development and optimization of geotechnical soil maps using various geostatistical and spatial interpolation techniques: A comprehensive study. Bull. Eng. Geol. Environ. 2023, 82, 215. [Google Scholar] [CrossRef]
  10. Sheng, J.; Yu, P.; Zhang, H.; Wang, Z. Spatial variability of soil Cd content based on IDW and RBF in Fujiang River, Mianyang, China. J. Soils Sediments 2021, 21, 419–429. [Google Scholar] [CrossRef]
  11. Zhang, L.; Lu, Z.; Wang, P. Efficient structural reliability analysis method based on advanced Kriging model. Appl. Math. Model. 2015, 39, 781–793. [Google Scholar] [CrossRef]
  12. Nikiforova, A.A.; Fleis, M.E.; Nyrtsov, M.V.; Kazantsev, N.N.; Kim, K.V.; Belyonova, N.K.; Kim, J.K. Problems of modern soil mapping and ways to solve them. Catena 2020, 195, 104885. [Google Scholar] [CrossRef]
  13. Wadoux, A.M.C.; Minasny, B.; McBratney, A.B. Machine learning for digital soil mapping: Applications, challenges and suggested solutions. Earth-Sci. Rev. 2020, 210, 103359. [Google Scholar] [CrossRef]
  14. Hassan, W.; Alshameri, B.; Nawaz, M.N.; Ijaz, Z.; Qasim, M. Geospatial and statistical interpolation of geotechnical data for modeling zonation maps of Islamabad, Pakistan. Environ. Earth Sci. 2022, 81, 547. [Google Scholar] [CrossRef]
  15. Civelekler, E.; Pekkan, E. The application of GIS in visualization of geotechnical data (SPT-Soil Properties): A case study in Eskisehir-Tepebaşı, Turkey. Int. J. Eng. Geosci. 2022, 7, 302–313. [Google Scholar] [CrossRef]
  16. Griffiths, J.S.; Fookes, P.G.; Hardingham, A.D.; Barsby, R.D. Geotechnical soils mapping for construction purposes in Central Saudi Arabia. In Engineering Characteristics of Arid Soils; CRC Press: Boca Raton, FL, USA, 2020; pp. 69–85. [Google Scholar]
  17. Walker, R.T. Geography, Von Thünen, and Tobler’s first law: Tracing the evolution of a concept. Geogr. Rev. 2022, 112, 591–607. [Google Scholar] [CrossRef]
  18. Zhu, A.X.; Turner, M. How is the third law of geography different? Ann. GIS 2022, 28, 57–67. [Google Scholar] [CrossRef]
  19. Ijaz, Z.; Zhao, C.; Ijaz, N.; Rehman, Z.U.; Ijaz, A. Statistical evaluation of multiple interpolation techniques for spatial mapping of highly variable geotechnical facets of soil in natural deposition. Earth Sci. Inform. 2023, 16, 105–129. [Google Scholar] [CrossRef]
  20. Ahmad, D.; Afzal, M. Flood hazards and livelihood vulnerability of flood-prone farm-dependent Bait households in Punjab, Pakistan. Environ. Sci. Pollut. Res. 2022, 29, 11553–11573. [Google Scholar] [CrossRef]
  21. Al-Mamoori, S.K.; Al-Maliki, L.A.; Al-Sulttani, A.H.; El-Tawil, K.; Al-Ansari, N. Statistical analysis of the best GIS interpolation method for bearing capacity estimation in An-Najaf City, Iraq. Environ. Earth Sci. 2021, 80, 683. [Google Scholar] [CrossRef]
  22. Ijaz, N.; Ijaz, Z.; Zhou, N.; Rehman, Z.U.; Ijaz, H.; Ijaz, A.; Hamza, M. Optimizing subsurface geotechnical data integration for sustainable building infrastructure. Buildings 2025, 15, 140. [Google Scholar] [CrossRef]
  23. Maleika, W. Inverse distance weighting method optimization in the process of digital terrain model creation based on data collected from a multibeam echosounder. Appl. Geomat. 2020, 12, 397–407. [Google Scholar] [CrossRef]
  24. Gia Pham, T.; Kappas, M.; Van Huynh, C.; Hoang Khanh Nguyen, L. Application of ordinary kriging and regression kriging method for soil properties mapping in hilly region of central Vietnam. ISPRS Int. J. Geo-Inf. 2019, 8, 147. [Google Scholar] [CrossRef]
  25. Chai, T. Root Mean Square. In Encyclopedia of Mathematical Geosciences; Springer International Publishing: Cham, Switzerland, 2022; pp. 1–3. [Google Scholar]
  26. Melsen, L.A.; Puy, A.; Torfs, P.J.J.F.; Saltelli, A. The rise of the Nash-Sutcliffe efficiency in hydrology. Hydrol. Sci. J. 2025, 70, 1248–1259. [Google Scholar] [CrossRef]
  27. Afzal, M.; Liu, T.; Butt, A.Q.; Nadeem, A.A.; Ali, S.; Pan, X. Geospatial assessment of managed aquifer recharge potential sites in Punjab, Pakistan. Remote Sens. 2023, 15, 3988. [Google Scholar] [CrossRef]
  28. Latif, R.M.A.; He, J. Flood Susceptibility Mapping in Punjab, Pakistan: A Hybrid Approach Integrating Remote Sensing and Analytical Hierarchy Process. Atmosphere 2024, 16, 22. [Google Scholar] [CrossRef]
  29. Elahi, E.; Khalid, Z.; Tauni, M.Z.; Zhang, H.; Lirong, X. Extreme weather events risk to crop-production and the adaptation of innovative management strategies to mitigate the risk: A retrospective survey of rural Punjab, Pakistan. Technovation 2022, 117, 102255. [Google Scholar] [CrossRef]
  30. Paras, I.; Mohey-Ud-Din, G.; Fareed, F. Infrastructure development in punjab, pakistan: From assessment to spatiotemporal analysis at district level. J. Quant. Methods 2018, 2, 75–103. [Google Scholar] [CrossRef]
  31. Simard, M.; Denbina, M.; Marshak, C.; Neumann, M. A global evaluation of radar-derived digital elevation models: SRTM, NASADEM, and GLO-30. J. Geophys. Res. Biogeosci. 2024, 129, e2023JG007672. [Google Scholar] [CrossRef]
  32. Panagos, P.; Borrelli, P.; Poesen, J.; Ballabio, C.; Lugato, E.; Meusburger, K.; Montanarella, L.; Alewell, C. The new assessment of soil loss by water erosion in Europe. Environ. Sci. Policy 2015, 54, 438–447. [Google Scholar] [CrossRef]
  33. Hussain, S.; Karuppannan, S. Land use/land cover changes and their impact on land surface temperature using remote sensing technique in district Khanewal, Punjab Pakistan. Geol. Ecol. Landsc. 2023, 7, 46–58. [Google Scholar] [CrossRef]
  34. Hengl, T. Sand Content in % (kg/kg) at 6 Standard Depths (0, 10, 30, 60, 100 and 200 cm) at 250 m Resolution (Version v02) [Data Set]. Zenodo. 2018. Available online: https://zenodo.org/records/2525662 (accessed on 25 July 2025).
  35. Wang, Z.Z.; Jiang, S.H. Characterizing geotechnical site investigation data: A comparative study using a novel distribution model. Acta Geotech. 2023, 18, 1821–1839. [Google Scholar] [CrossRef]
  36. Hatta, K.A.; Syed Osman, S.B.A. Correlation of electrical resistivity and SPT-N value from standard penetration test (SPT) of sandy soil. Appl. Mech. Mater. 2015, 785, 702–706. [Google Scholar] [CrossRef]
  37. Ghazi, A.; Moghadas, N.H.; Sadeghi, H.; Ghafoori, M.; Lashkaripur, G.R. Empirical relationships of shear wave velocity, SPT-N value and vertical effective stress for different soils in Mashhad, Iran. Ann. Geophys. 2015, 58, S0325. [Google Scholar] [CrossRef]
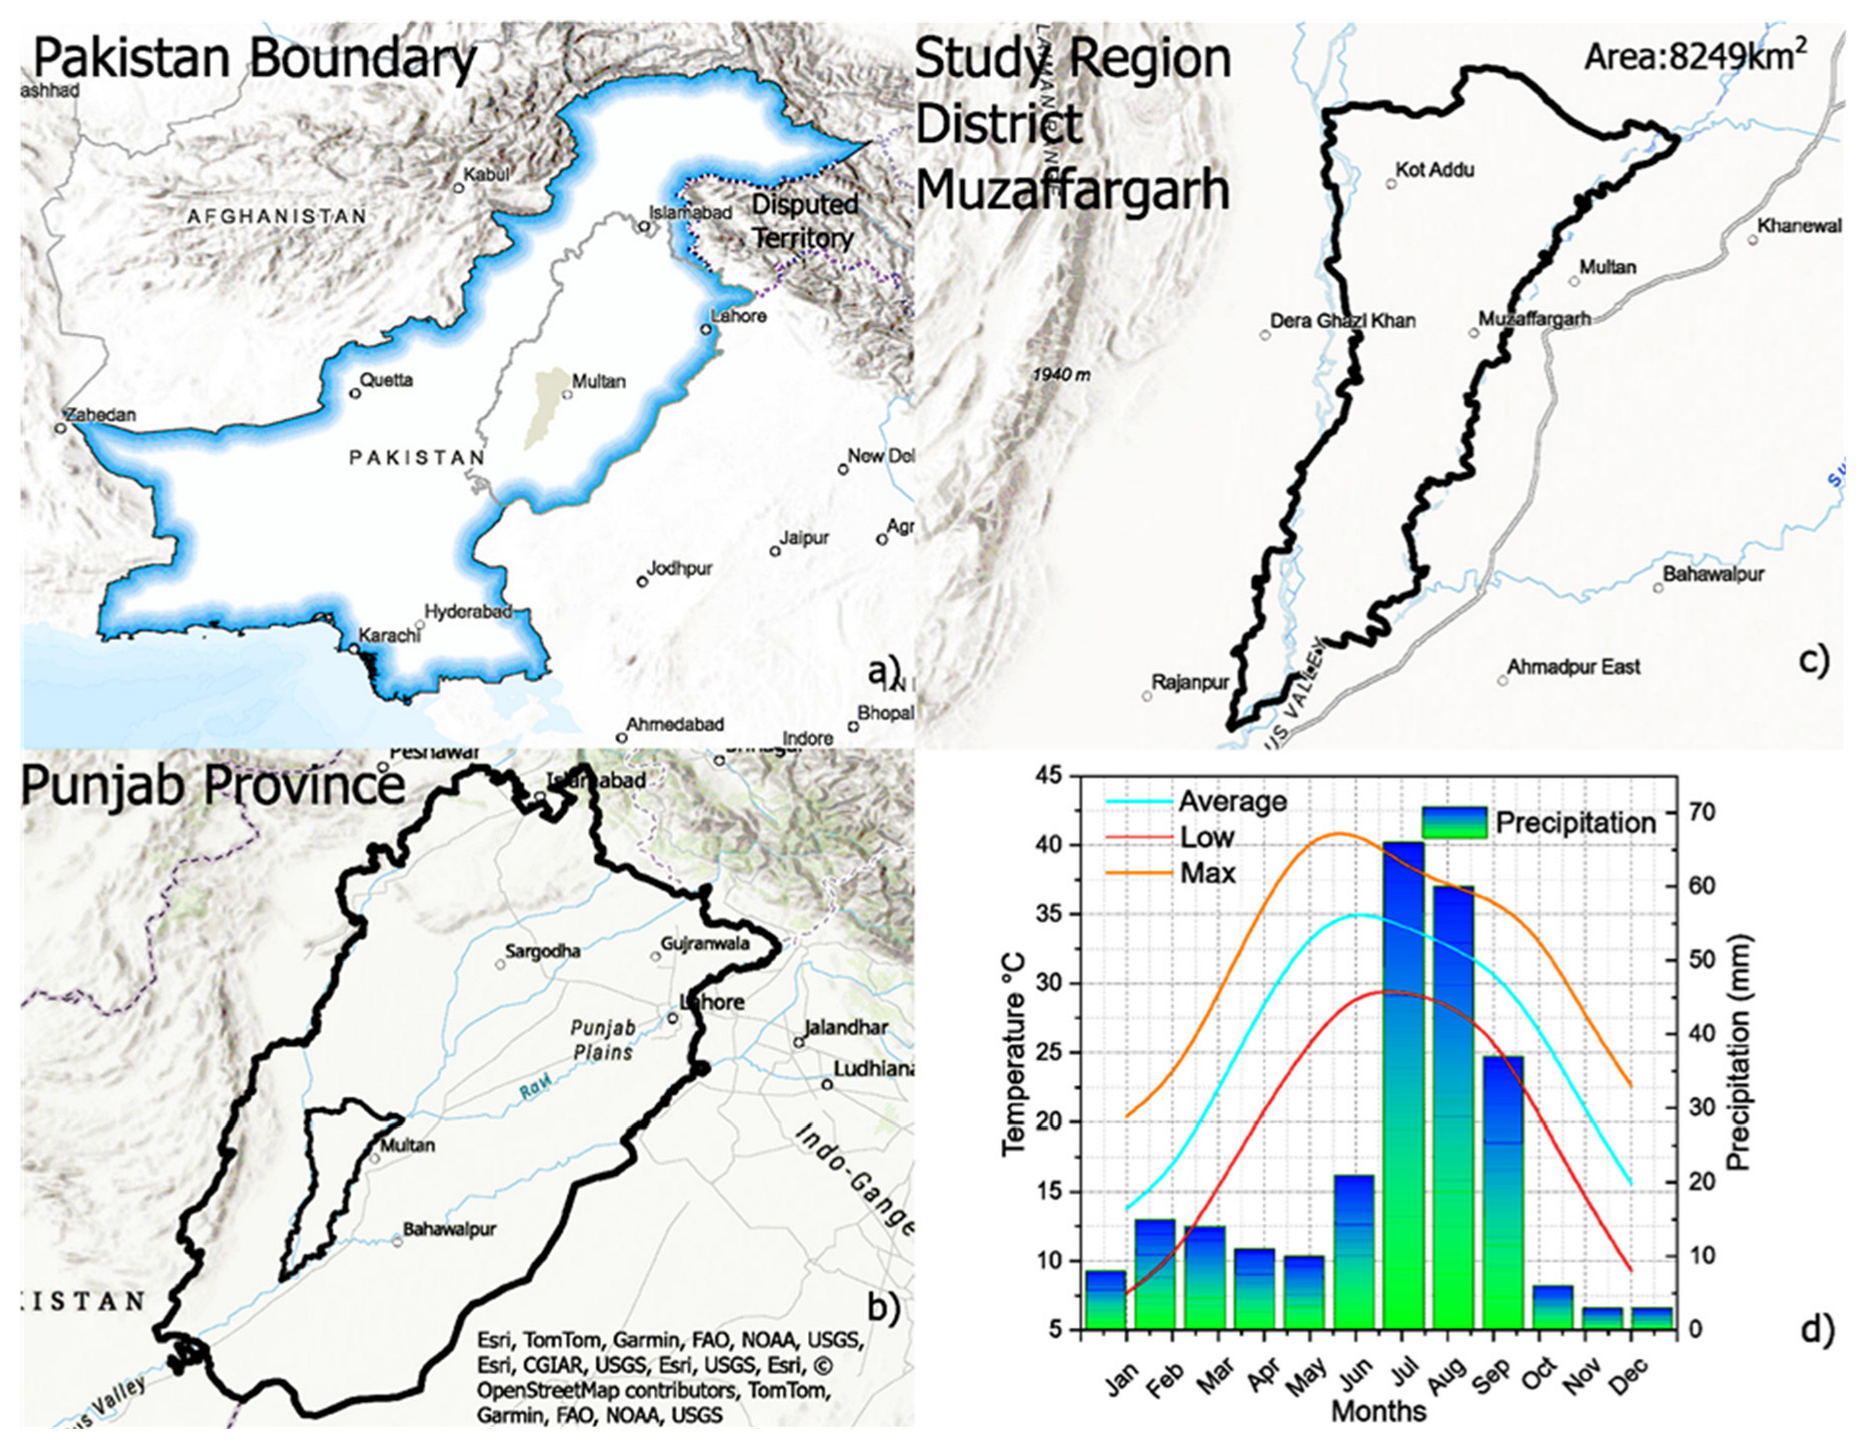
Figure 1. Study region: (a) Muzaffargarh region within Pakistan; (b) Muzaffargarh region within Punjab Province; (c) boundaries of Muzaffargarh region; (d) annual temperature and precipitation variations.
Buildings 15 03211 g001
Figure 2. Spatial characteristics of the study region: (a) elevation (DEM), (b) slope, (c) soil erosivity, (d) geological formations, and (e) land cover with areal percentages.
Buildings 15 03211 g002
Figure 3. Soil physical properties across the study area: (a) sand content, (b) clay content, (c) bulk density, and (d) USDA-based soil texture classification.
Buildings 15 03211 g003
Figure 4. Spatial distribution of borehole locations across the study region.
Buildings 15 03211 g004
Figure 5. Methodological framework of the study.
Buildings 15 03211 g005
Figure 6. Histograms and density plots showing distribution patterns by depth: (ac) SPT-N, (df) soil type, and (gi). PI.
Buildings 15 03211 g006
Figure 7. Violin plots illustrating depth-wise variability and spread: (a) SPT-N, (b) soil type, and (c) PI.
Buildings 15 03211 g007
Figure 8. GDMs based on SPT-N and Vs at 1.5 m, 4.5 m, and 7.5 m using augmented IDW (a,d,g), Kriging (b,e,h), and classical IDW (c,f,i).
Buildings 15 03211 g008
Figure 9. GDMs based on soil type at 1.5 m, 4.5 m, and 7.5 m using augmented IDW (a,d,g), Kriging (b,e,h), and classical IDW (c,f,i).
Buildings 15 03211 g009
Figure 10. GDMs based on PI at 1.5 m, 4.5 m, and 7.5 m using augmented IDW (a,d,g), Kriging (b,e,h), and classical IDW (c,f,i).
Buildings 15 03211 g010
Figure 11. Validation performance of interpolation models across key geotechnical parameters using regression plots and KPIs: (a,d,g) Augmented IDW, (b,e,h) Kriging, and (c,f,i) classical IDW.
Buildings 15 03211 g011
Figure 12. Comparative evaluation of interpolation models based on average performance metricsusing KPIs: (a) SPT-N, (b) Vs, and (c) PI.
Buildings 15 03211 g012
Figure 13. Spatial distribution maps for foundation design parameters—(a) load intensity (LI), (b) safe bearing capacity (SBC), and (c) optimum depth (OD)—across the study region.
Buildings 15 03211 g013
Table 1. Statistical summary of key geotechnical parameters across depths.
VariableDepthMeanSDSE * of MeanSkewnessKurtosisMAD *IQR *RCV *
SPT-N1.56.42.40.11.11.61.83.00.2
4.512.13.50.20.80.72.75.00.2
7.516.33.90.20.90.43.05.00.3
Soil Type1.513.43.50.2−1.40.52.71.50.0
4.514.52.70.2−3.814.91.41.50.0
7.514.82.60.2−3.814.61.42.00.0
PI1.51.53.70.22.44.82.50.0-
4.50.73.70.25.428.71.40.0-
7.50.00.00.0--0.00.0-
* SE: Standard Error; * MAD: Mean Absolute Deviation; * IQR: Interquartile Range; * RCV: Robust Coefficient of Variation.
Disclaimer/Publisher’s Note: The statements, opinions and data contained in all publications are solely those of the individual author(s) and contributor(s) and not of MDPI and/or the editor(s). MDPI and/or the editor(s) disclaim responsibility for any injury to people or property resulting from any ideas, methods, instructions or products referred to in the content.