1. Introduction
In architectural design, spatial planning involves accommodating the intended activities and requirements of users, including both clients and occupants [
1]. This process requires the consideration of functional spatial requirements—such as spatial layout, scale, and the arrangement of furniture and equipment—within the constraints of project budgets and legal and technical standards [
1,
2]. However, during the early design phase, users often face challenges in clearly and specifically articulating their spatial needs under various conditions. Users tend to have limitations in explicitly expressing their spatial preferences and requirements at this stage [
3], which results in a time- and effort-intensive decision-making process related to spatial planning. This uncertainty in early-stage user input becomes a fundamental constraint that inhibits the development of user-centered floor plans [
4,
5].
Various studies have aimed to support users’ spatial understanding and design decision-making in the early stages of design [
6,
7]. Traditional tools such as sketches, interior imagery, floor plans, and 3D models have been widely employed to aid user comprehension of space [
8,
9,
10]. However, such tools are limited in conveying the physical sense of space and its structural characteristics effectively [
9,
11]. Furthermore, evaluating the cost-effectiveness of multiple design alternatives during the early design stage often requires substantial time and effort, with limited accuracy in cost estimation [
12,
13].
Recent developments in advanced digital technologies have naturally integrated into architectural design workflows, enhancing the process of feasibility studies. Immersive technologies such as virtual reality (VR) and augmented reality (AR) now allow users to intuitively grasp the scale, form, function, and meaning of spaces prior to construction [
11,
14]. VR, in particular, enables effective spatial visualization and supports improved spatial understanding compared to traditional 2D representations [
15]. Nevertheless, existing studies predominantly focus on visualizing and reviewing design alternatives from the perspective of construction professionals [
6,
11,
16,
17], with limited research on interactive environments that support spatial understanding and evaluation from the user’s point of view.
To clearly define their spatial needs, users must be provided with opportunities to engage in and evaluate a variety of spatial experiences [
18]. In addition to spatial visualization and navigation, interactive features that allow for the arrangement, composition, and modification of spaces and furniture are essential [
11,
19,
20]. Moreover, an environment that facilitates the technical and economic evaluation of planned spaces at the early design stage is also required [
3,
21].
Building Information Modeling (BIM)-based building performance analysis has been utilized to enhance understanding of building performance during early design stages [
21,
22]. This approach supports the development of high energy-efficiency design strategies [
23] and enables accurate and rapid cost estimation [
12,
13]. However, BIM-based environments often lack integration with interactive systems that allow effective evaluation of spatial functions. Integrating VR with building performance analysis environments may provide a comprehensive platform for multidimensional spatial review in the early design process.
In addition to developing space feasibility assessment tools, it is essential to verify their effectiveness through empirical evaluation. A tool-supported assessment process must demonstrate superior effectiveness compared to conventional manual workflows to establish its practical value. However, most prior studies only suggest the potential utility of such tools without empirically validating their performance in real-world contexts [
9,
11].
Accordingly, the objective of this study is to validate whether a BIM- and VR-integrated space feasibility assessment process can effectively support user decision-making in early-stage spatial planning. The outcomes of this validation are expected to clarify both the capabilities and limitations of the proposed digital process, thereby offering guidance for future research and technological development in user-centered design tools.
The space feasibility assessment process proposed in this study is based on the Space FeAsibility aSsessment (SFAS) system, which automatically generates Building Information Modeling (BIM) models from user-provided sketch inputs, visualizes them effectively within a virtual reality (VR) environment, and simultaneously provides building performance analysis information. To validate the effectiveness of this novel process, the study adopted the Charrette test method proposed by Clayton et al. [
24].
According to Clayton et al. [
24], the effectiveness of a system-supported process can be assessed by comparing it with a conventional manual process. This is achieved by measuring the task performance of participants who engage in both processes, thereby enabling comparative evaluation of the new approach. Based on this methodology, the present study established an experimental scenario involving two types of feasibility assessment workflows: one using the SFAS system and the other relying on a manual, sketch-based process.
Participants performed tasks using both approaches, and their performance was quantitatively evaluated in terms of three key criteria: speed, accuracy, and usability. The measured results were used as empirical indicators to validate the effectiveness of the proposed SFAS-based space feasibility assessment process.
2. Literature Review: Methodological Approaches to Evaluating the Effectiveness of VR- and BIM-Based Spatial Assessment in Early Design Phases
In the field of architectural design, digital tools that leverage Virtual Reality (VR) and Building Information Modeling (BIM) technologies have been actively developed with the goals of improving workflow efficiency, enhancing design productivity, and supporting stakeholder decision-making [
6,
7]. The development of these tools is premised on the implementation of improved workflows; thus, any newly proposed process must demonstrate greater effectiveness compared to conventional design processes [
24]. However, prior studies have primarily relied on theoretical validations, such as expert interviews and prototype development, or limited empirical validations including demonstrations, usage scenarios, and functional tests [
11,
18,
20,
25,
26,
27].
Such validation approaches are limited in their ability to comprehensively verify the generalizability, reliability, validity, and practical utility of new processes [
24]. Especially during the early design phase, there is a clear need for objective and rigorous evaluation methods to substantiate the effectiveness of digital tools that support space feasibility assessments.
Demonstration-based methods can serve to introduce the proposed tools to users beyond the research team and verify potential applicability in design practices [
11,
25,
27]. However, this approach merely confirms the usability of the tool and does not sufficiently establish its practical value in improving actual design outcomes. As a result, it remains unclear whether such tools proposed in prior research can meaningfully enhance design efficiency.
Expert interviews are often employed as a complementary validation method to demonstrations. Yet, expert judgments may be biased by individual experiences and subjective perceptions, which undermines the objectivity of the evaluation [
20,
25]. Furthermore, in the absence of well-defined performance metrics, it becomes difficult to assess the practical value that a tool provides to end users. To address this, user interviews based on clearly defined performance indicators may offer a more valid alternative [
18].
Additionally, statistical analysis of survey results [
26], along with diverse task scenarios and repeated experiments, may improve the reliability of validation results [
20]. However, many existing studies fail to clarify whether the proposed processes are simply alternative approaches or are demonstrably more effective than existing ones. If the superiority of a new process is not empirically validated, its practical value and justification for implementation are diminished.
In response to these limitations, this study adopts the Charrette test method proposed by Clayton et al. [
24] to empirically validate the effectiveness of a novel space feasibility assessment process based on the Space FeAsibility aSsessment (SFAS) system. The conventional process used for comparison is defined as a manual, sketch-based spatial assessment procedure. Participants were tasked with generating (or composing) spatial configurations and subsequently evaluating the created space.
The performance of both processes was compared based on task completion time, accuracy of results, and user-perceived usefulness measured through a structured questionnaire on system functionality. Furthermore, sufficiently large number of participants were recruited to ensure statistical reliability of the evaluation results.
3. Methodology
This section presents an overview of the Space FeAsibility aSsessment (SFAS) system and the methodology used for its validation. It begins by introducing the development objectives, implementation strategy, and core spatial evaluation features embedded within the SFAS system. Subsequently, the Charrette test method adopted in this study is described, along with the experimental validation process constructed based on that method.
Within the validation process, three primary hypotheses were formulated, and corresponding measurement methods were defined. The results derived from these measurements served as key indicators for assessing the effectiveness of the proposed space feasibility assessment process. Additionally, the backgrounds of the experimental participants and the specific tasks assigned to them were described to clarify the context and rationale underpinning the experimental design.
3.1. System Overview of SFAS
3.1.1. Purpose
The Space FeAsibility aSsessment (SFAS) system was developed to effectively support user decision-making in spatial planning during the early design phase. The system accepts preliminary sketch-based floor plan information from the user and automatically converts it into explicit architectural objects, such as walls, floors, and roofs.
By visualizing the generated architectural spaces using virtual reality (VR) technology, the SFAS system offers qualitative spatial evaluation capabilities that enable intuitive assessment of spatial dimensions, layout, and circulation. In addition, the system is equipped with quantitative evaluation functions for economic feasibility, such as estimating annual electricity and gas costs and calculating direct material costs. These combined features provide an integrated environment for both technical and economic assessment of spatial configurations.
3.1.2. Operational Mechanism and Implementation of the SFAS System
The operational mechanism of the Space FeAsibility aSsessment (SFAS) system consists of two main stages: (1) the automatic generation of a Building Information Modeling (BIM) model based on user-provided sketch information, and (2) the integration of the BIM model with a virtual reality (VR) environment.
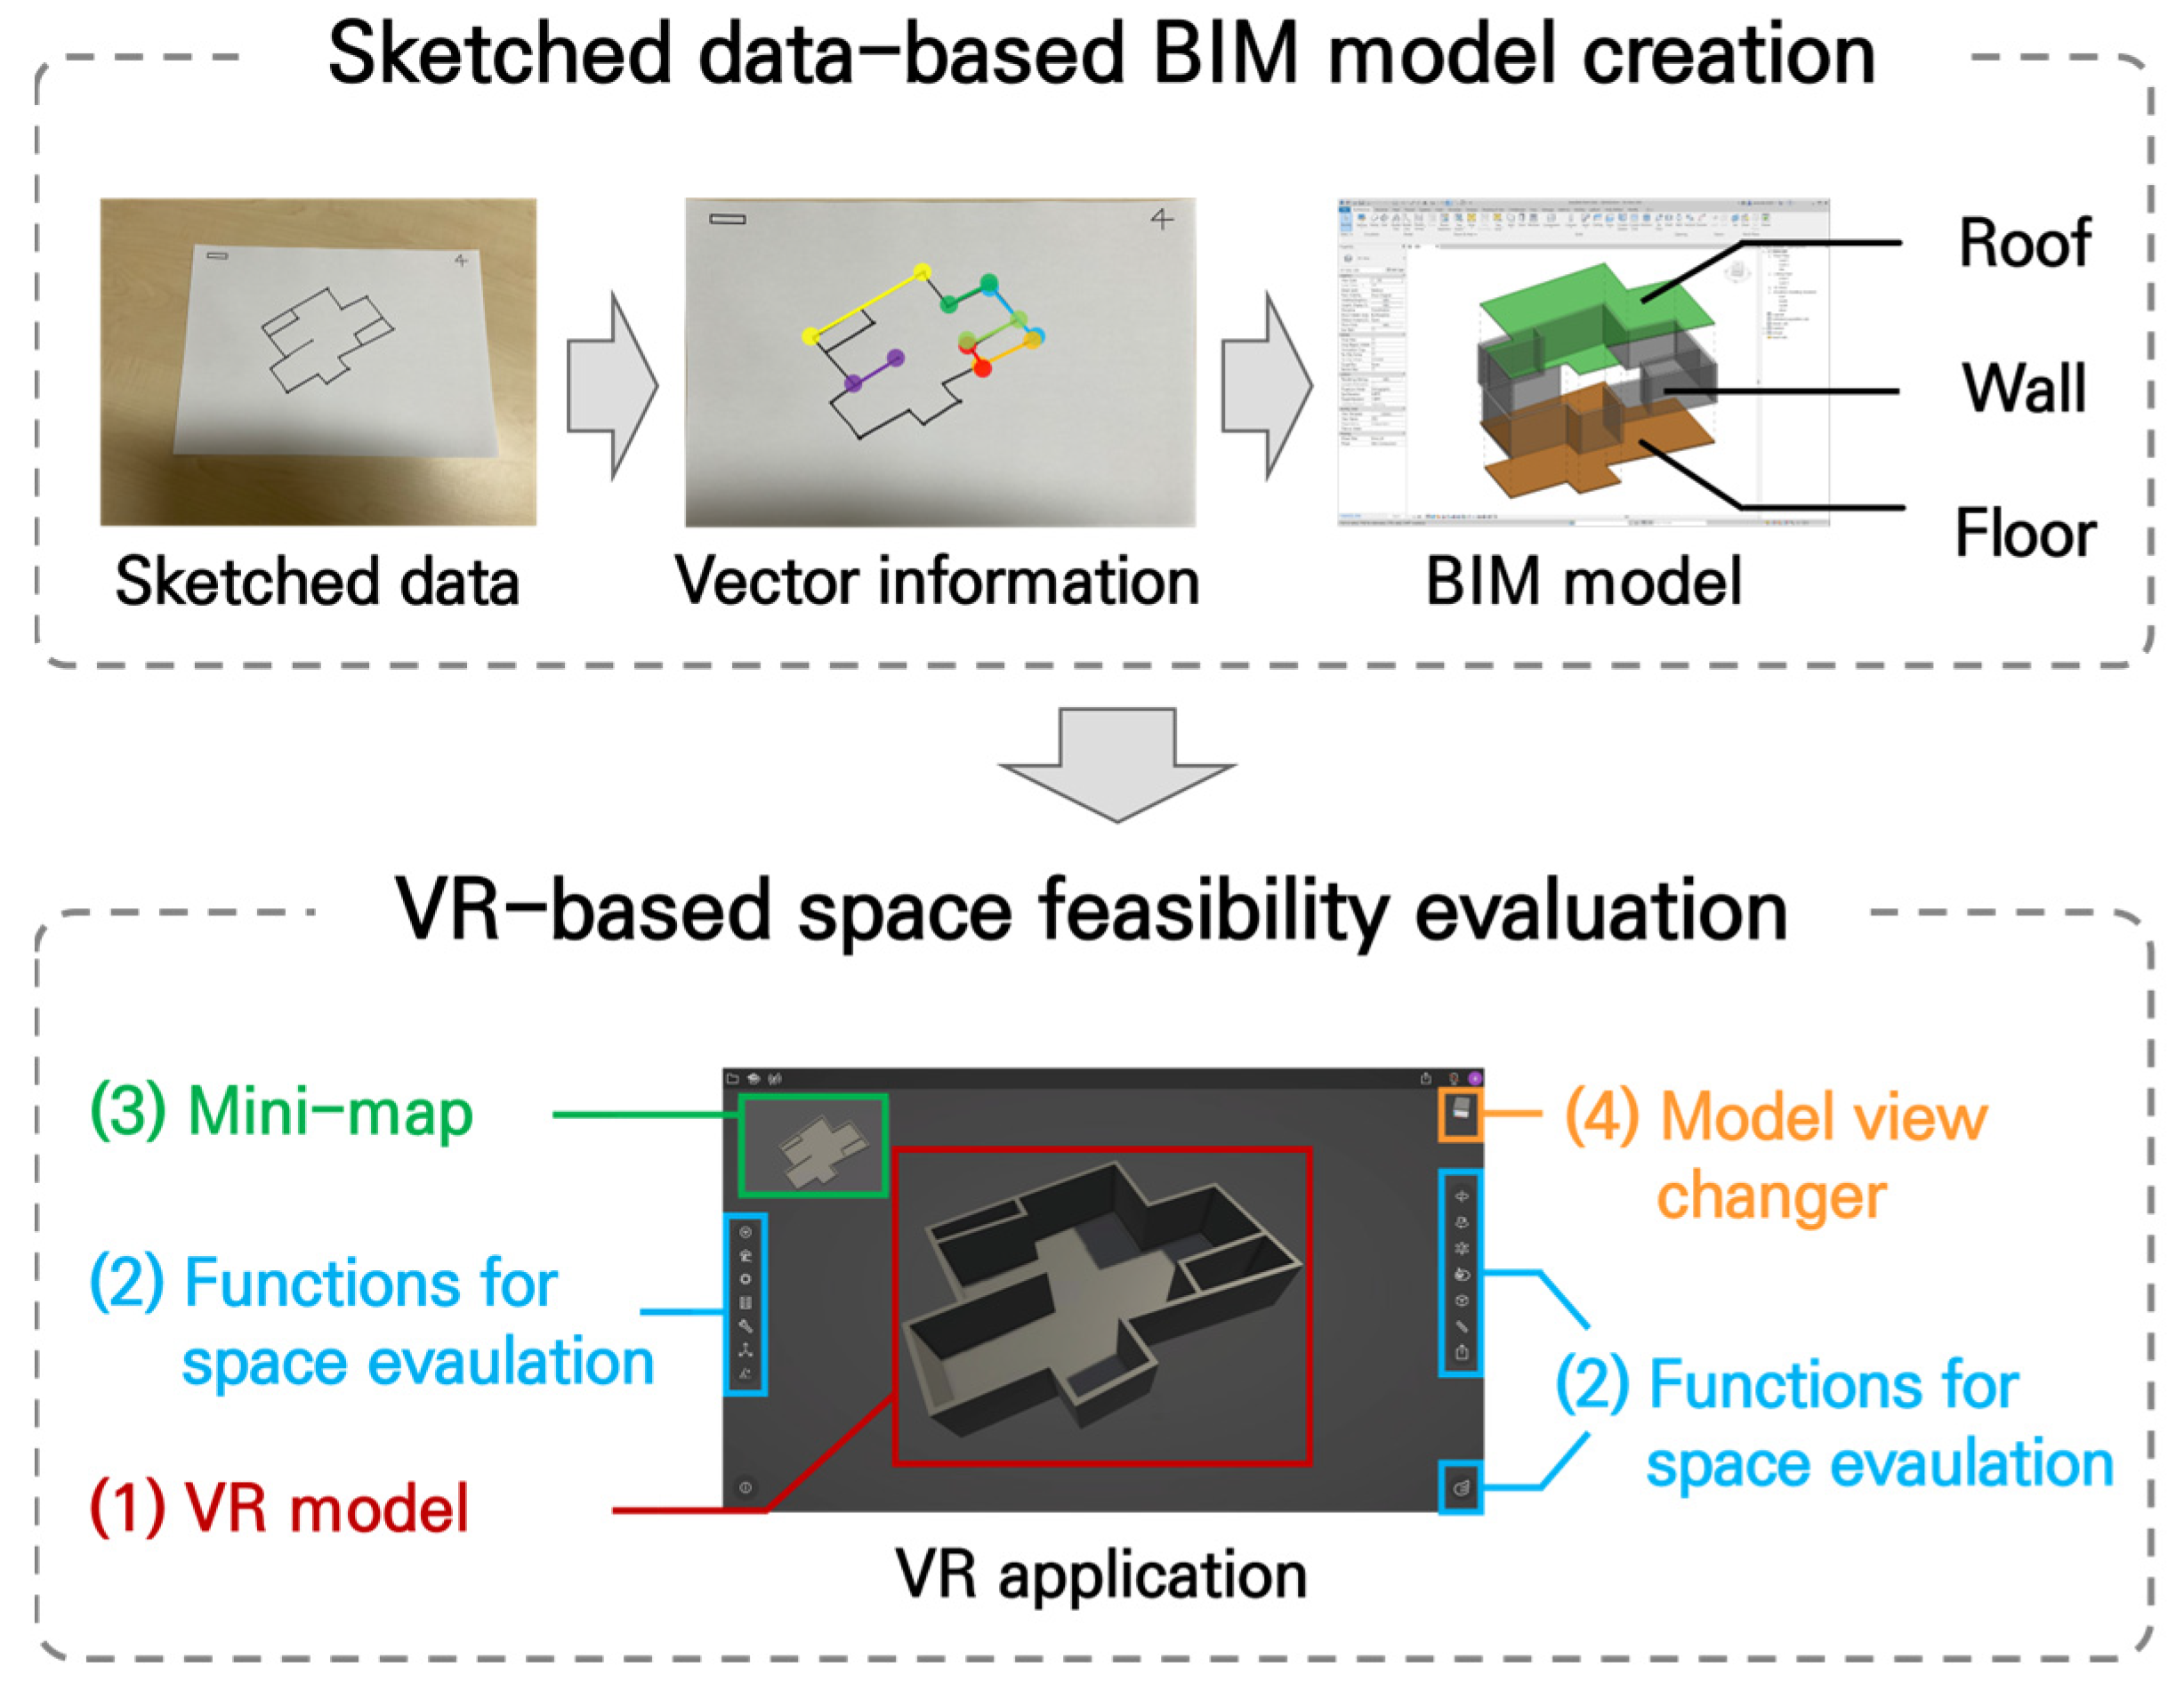
Figure 1 illustrates the overall workflow of the SFAS system.
In the first stage, the system receives sketched data as input from the user and extracts vector data from the sketch strokes to automatically generate architectural components such as walls, floors, and roofs in a BIM model. The generated components include material information, which can be combined with predefined unit cost data for economic performance evaluation. Revit 2022 [
28] was used as the BIM authoring tool. The automation framework for sketch-based BIM model generation was developed and validated in previous research [
3].
In the second stage, the architectural components generated in the BIM model are automatically transferred to a VR application. The integration between the BIM model and the VR environment was achieved using the Unity Reflect Application Programming Interface (API) [
29], enabling real-time synchronization across platforms.
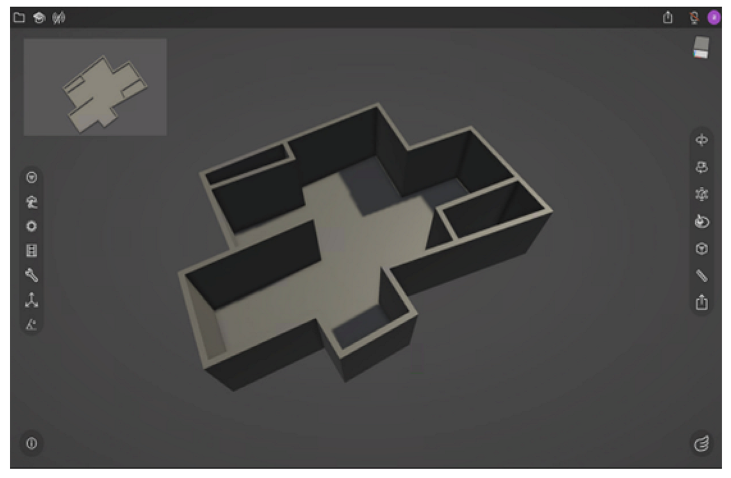
Within the VR application, users can conduct space feasibility assessments using a variety of embedded functions. For instance, furniture generation and editing functions allow users to place and adjust furniture directly within the VR environment, thereby facilitating intuitive evaluations of spatial dimensions and layout suitability. The VR application and its integrated functionalities were developed using the Unity Reflect Viewer Template [
30], Unity Scripting API [
31], and the C# programming language [
32].
The VR application operates within the Building Information Modeling-based Computer-Aided Virtual Environment (BIMCAVE) system [
33], and users interact with the system through standard input devices such as a mouse and keyboard.
3.1.3. Spatial Evaluation Functions of the SFAS System
The Space FeAsibility aSsessment (SFAS) system provides both qualitative and quantitative spatial evaluation functions that allow users to assess the functional and economic feasibility of a given space within a virtual reality (VR) environment.
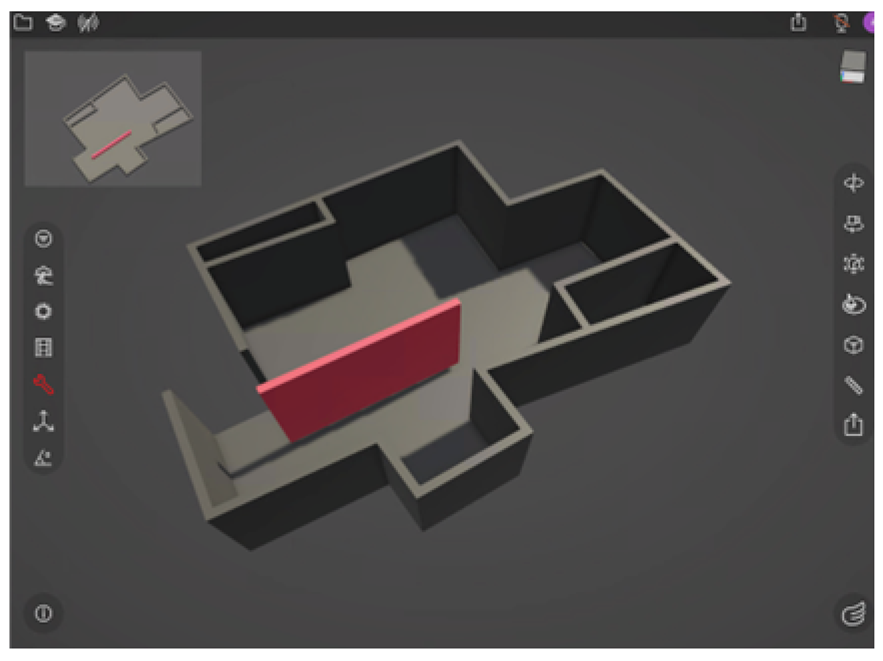
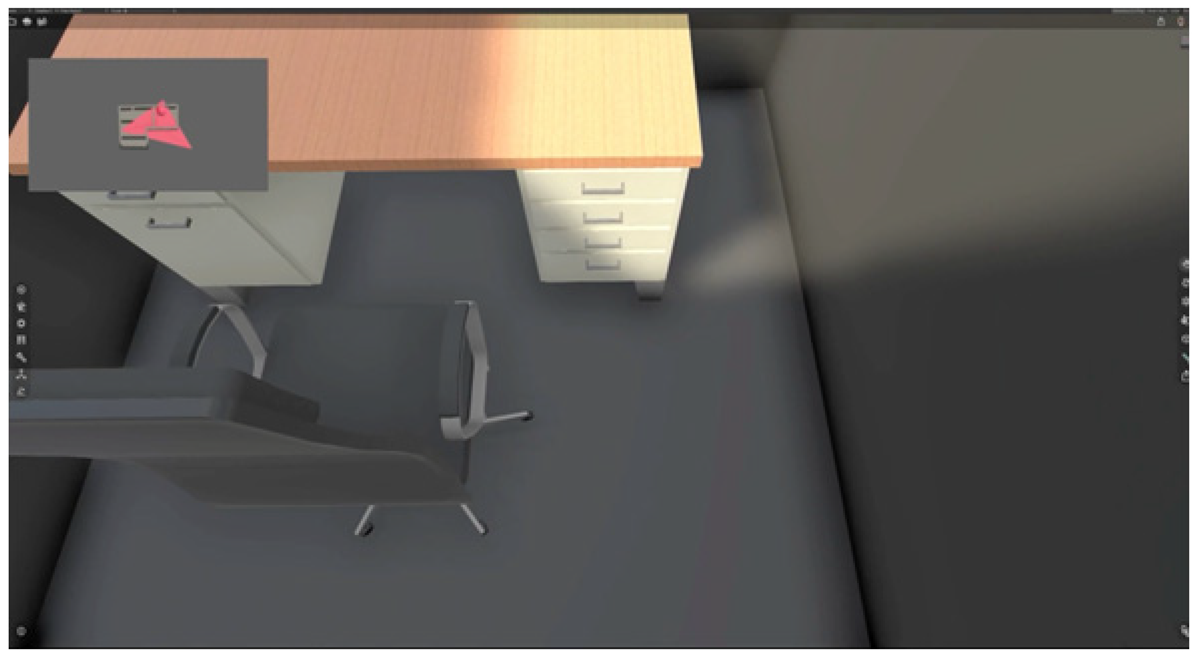
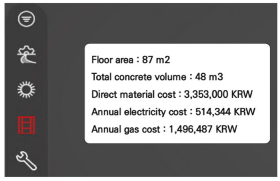
Table 1 presents an overview and operational interface of these evaluation features.
The qualitative evaluation functions are designed to enhance users’ intuitive understanding of spatial dimensions and physical characteristics, thereby enabling them to easily explore and implement a variety of spatial requirements. The core functionalities include:
Wall creation and editing (translation, rotation, length adjustment);
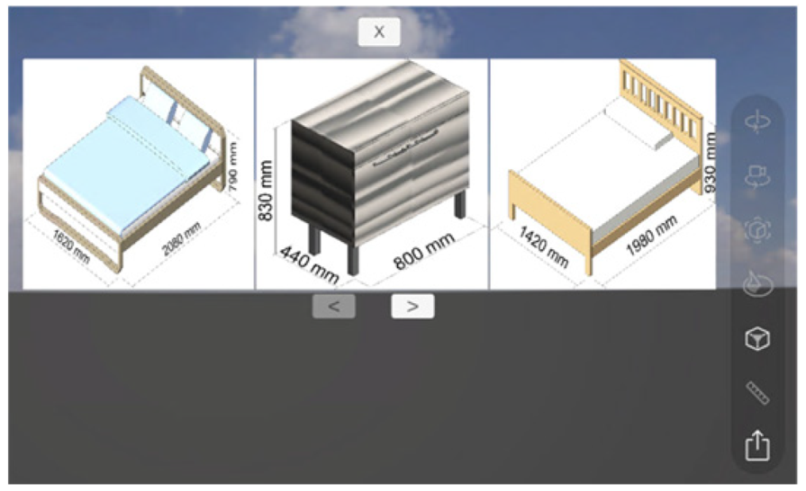
Furniture creation and editing (translation, rotation);
First-person/third-person view switching;
Spatial measurement tools;
Model view switching;
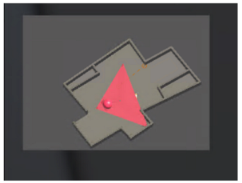
Mini-map functionality for tracking current position and field of view.
The wall creation and editing feature supports space partitioning and layout based on architectural boundaries, while the furniture placement tools provide users with a tangible sense of scale and spatial configuration. The view-switching capability enables users to inspect space at human scale in first-person view for circulation and dimension assessment. The mini-map feature enhances spatial awareness by offering real-time feedback on current location and orientation within the floor plan. In third-person view mode, users can utilize the model view switching tool to observe the entire space from various angles and camera positions. Additionally, the distance measurement function offers precise numerical data within the VR environment, contributing to a more accurate understanding of spatial relationships.
The quantitative evaluation functions support preliminary cost assessments for both construction and operational phases. The cost estimation tool calculates annual energy consumption costs by multiplying the floor area by the unit rates of electricity and gas consumption. Furthermore, the tool computes the estimated material cost by summing the total volume of walls and floors within the model and applying the unit cost of concrete per cubic meter.
3.2. Validation Method for the Space Feasibility Assessment Process Using the Charrette Test Method
The Charrette test method employed in this study is based on a within-subject experimental design, where each participant performs both a conventional manual process and a novel system-assisted process for space feasibility assessment. In this method, participant performance is evaluated across three dimensions: speed, accuracy, and usability. If the performance of the new process is found to be superior in these aspects, its effectiveness can be empirically validated.
This study compares a space feasibility assessment process using the Space FeAsibility aSsessment (SFAS) system with a conventional manual process. The effectiveness of the SFAS system-supported process is examined through the following three hypotheses:
The SFAS system enables more accurate cost estimation than the manual process.
The SFAS system enables faster cost estimation than the manual process.
The SFAS system provides greater usability for users.
For each hypothesis, distinct measurement criteria and procedures were defined. These served as the basis for the empirical validation of the proposed space feasibility assessment process.
The Charrette test method offers the advantage of reducing variability caused by individual differences in knowledge and technical skills, as each participant is exposed to all experimental conditions. This design also improves efficiency by requiring a relatively small number of participants. In this study, the order of experimental conditions was randomized for each participant.
The purpose of this procedure was not to control learning effects across repeated trials, since only a single-trial was conducted per participant, but rather to prevent potential bias within a single-trial. Specifically, it aimed to avoid situations in which participants might reference system-generated values in advance to verify or adjust their own manual calculations. While the Charrette test method guidelines recommend a minimum of three, participants per condition, the six participants were recruited in total. Of these, three completed the manual process first, and the remaining three began with the SFAS system-supported process.
3.2.1. Validation Procedure and Task Description
The Charrette test method-based validation procedure in this study consists of two space feasibility assessment processes: (1) a manual (hand-drawn) process and (2) a system-supported process using the Space FeAsibility aSsessment (SFAS) system. Each process comprises five sequential tasks: (1) sketched data creation, (2) quantitative spatial evaluation, (3) measurement of the quantitative evaluation, (4) qualitative spatial evaluation, and (5) measurement of the qualitative evaluation.
Table 2 summarizes the overall validation procedure and the tasks associated with each process.
The sketched data creation task, common to both processes, involves participants using pen and paper to develop a spatial configuration based on wall-based partitioning. Participants sketch the floor shape and arrange one or more rooms, indicating the form, size, and layout of each. The resulting sketch serves as the input for the SFAS system in the system-supported process.
The quantitative spatial evaluation involves estimating annual electricity and gas energy consumption costs and calculating direct material costs based on the sketch information. In the manual process, participants are provided with unit prices and formulas for calculating energy costs per unit area, and for computing material costs using the unit price per cubic meter of concrete. Participants measure and compute the floor area and the combined volume of walls and floors from the sketch, then multiply these by the corresponding unit costs to estimate total values. Measurements are taken manually using a scale ruler.
Table 3 lists the essential information provided to participants during the manual cost estimation task. All unit costs are denominated in South Korean Won (KRW).
In contrast, the SFAS system-supported process automates the quantitative evaluation. The sketch is converted into a BIM-based VR model, and the system’s built-in cost estimation functions automatically calculate annual energy consumption and direct material costs.
Measurement of the quantitative evaluation compares the two methods in terms of time required and accuracy of the results. For the manual method, the time measurement starts at the beginning of the calculation and ends upon completion. For the SFAS system-supported process, the time includes sketch input, model conversion, and cost estimation execution within the VR application. Accuracy is assessed by comparing the participant’s manual cost estimates to the results produced by the SFAS system.
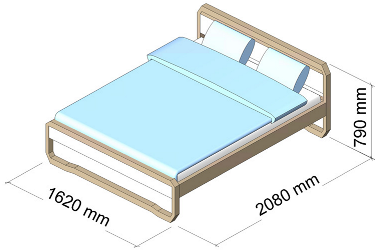
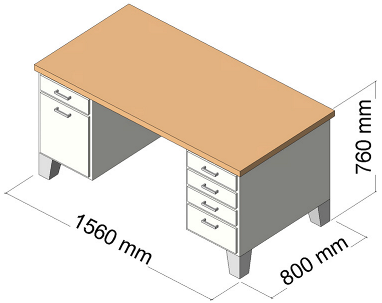
Qualitative spatial evaluation involves assessing the adequacy of space size, layout, and circulation by placing furniture and modifying the wall layout to produce a finalized spatial configuration.
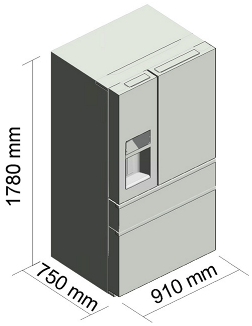
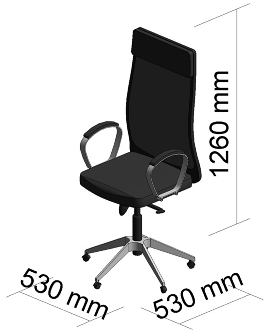
Table 4 presents examples of the furniture types and dimensions provided to participants. In the manual process, participants arrange furniture using printed information and assess the suitability of the layout, after which they finalize the space by tracing the updated design on a transparent overlay sheet placed over the original sketched data.
In the SFAS system-supported process, participants use the qualitative evaluation functions within the VR environment to place furniture and evaluate spatial dimensions and layout. They then use the system’s wall creation and editing tools to modify the space and finalize the design as a VR model.
Measurement of the qualitative evaluation is conducted via a structured questionnaire designed to assess whether the SFAS system-supported process is more effective than the manual process. The questionnaire comprises six items, each rated on a 5-point Likert scale (1 = very dissatisfied, 5 = very satisfied). Item 1 evaluates the overall usefulness of the SFAS system-supported qualitative evaluation compared to the manual method. Items 2 through 6 assess participant satisfaction with individual system functions:
Item 2: Creation and editing of architectural components (walls, furniture);
Item 3: View switching functionality (first-person/third-person perspective);
Item 4: Spatial recognition tools, including the mini-map for current position and field-of-view recognition;
Item 5: Spatial measurement tools for calculating distances between two points;
Item 6: Navigation and movement within the virtual space.
3.2.2. Hypotheses
To evaluate the effectiveness of the SFAS system-supported space feasibility assessment process, the following three hypotheses were established. Each hypothesis is grounded in measurable evaluation criteria and serves as a basis for comparative analysis of the proposed and conventional methods.
Hypothesis 1 (Speed): The SFAS system enables faster execution of quantitative spatial evaluation compared to the manual process.
Hypothesis 2 (Accuracy): The SFAS system enables more accurate cost estimation during quantitative spatial evaluation than the manual process.
Hypothesis 3 (Usability): The SFAS system’s sketch-based VR model generation and qualitative evaluation functions effectively support users in articulating spatial requirements and evaluating functional appropriateness.
If supported by the experimental results, these hypotheses would collectively demonstrate that the SFAS system-supported space feasibility assessment process provides a rational and effective approach for supporting user-centered decision-making in early-stage architectural planning.
3.2.3. Participant Background and Training
A total of six participants took part in the experiment, each with varying academic backgrounds and levels of expertise. Among them, one participant was a graduate student from a non-architecture discipline, lacking experience in reading or producing architectural drawings and possessing limited overall knowledge of architecture. Three participants were first-year students majoring in architectural engineering who had completed coursework involving design tools such as Revit and AutoCAD for producing architectural drawings and 3D models. The remaining two participants were second-year students in architectural engineering who had received theoretical instruction on residential space planning processes but had not acquired sufficient knowledge or skills in building performance analysis or the use of related simulation tools. Consequently, these participants were likely to encounter difficulty when conducting technical evaluations such as cost estimation for designed spaces.
Most participants lacked practical experience with computer-aided design (CAD) systems and spatial planning tasks. Therefore, all participants were categorized as non-experts for the purpose of this study.
Prior to the experiment, all participants received individual training sessions on both space feasibility assessment processes, the manual (sketch-based) method and the novel method using the SFAS system. The training materials included simple practical examples, such as creating the sketched data using pen and paper, and manually calculating material and energy costs using provided formulas. This preparatory training ensured that all participants had a basic understanding of the workflows and were adequately prepared to complete the tasks associated with both processes.
4. Experimental Results
All participants completed the space feasibility assessment using both the manual process and the novel process utilizing the SFAS system. The three hypotheses established in this study—speed, accuracy, and usability—provided a clear framework for comparing the performance of the two processes. The experimental results indicate that the SFAS system-supported process is a more efficient and effective approach to space feasibility assessment compared to the conventional manual method.
4.1. Speed Measurement Results and Interpretation
All participants successfully completed cost estimation tasks using both the manual method and the SFAS system.
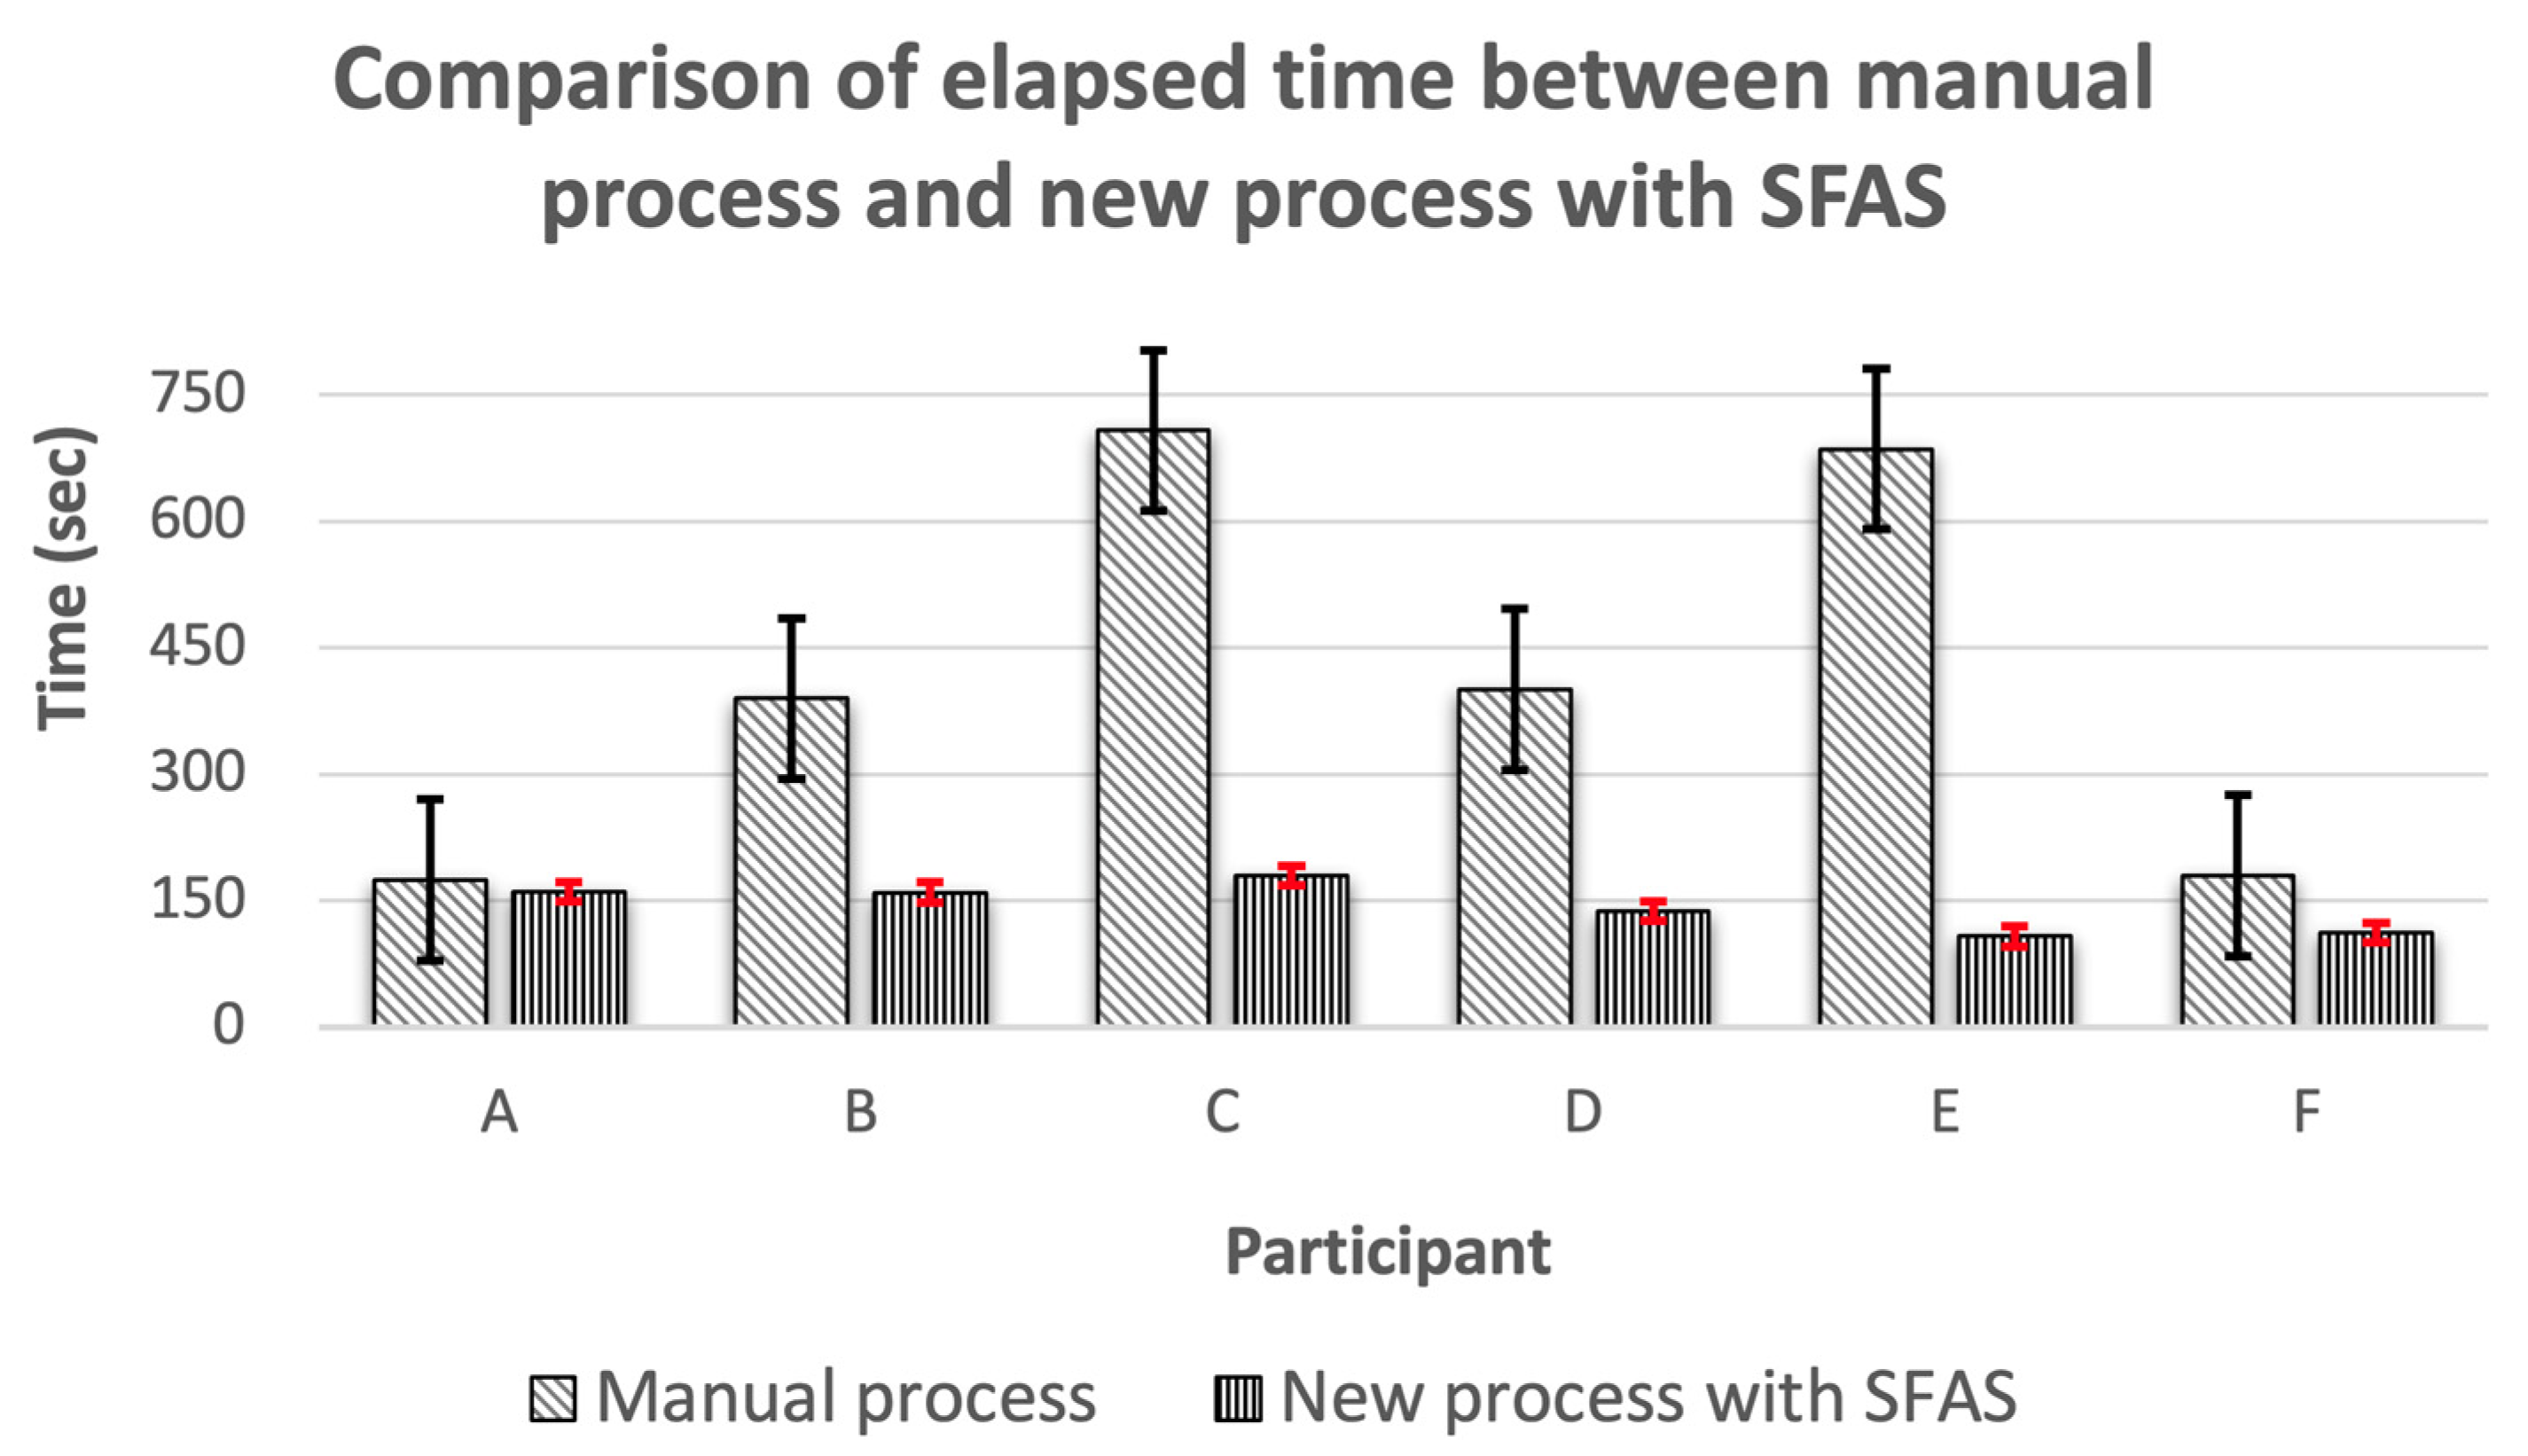
Table 5 presents the time required for each participant to complete the task, along with the average values, while
Figure 2 illustrates the time distribution across participants using a bar chart.
The average time required for the manual process was 423 s, while the system-supported process required an average of 143 s, which is approximately 0.34 times the duration of the manual method. This clearly demonstrates that the system-supported process was significantly faster.
Although factors such as hardware performance and the number of wall elements can influence the time required for cost estimation in the SFAS system, the system exhibited relatively consistent performance compared to the manual method. In contrast, the manual process showed considerable variability depending on the complexity of the sketch (e.g., number and layout of rooms, wall configuration) and the participant’s computational ability. For example, participants A and B completed the SFAS task in similar durations with comparable sketch complexity, but in the manual task, their completion times differed by more than a factor of two. These findings suggest that the SFAS system can offer more reliable performance in repetitive cost estimation tasks.
4.2. Accuracy Measurement Results and Interpretation
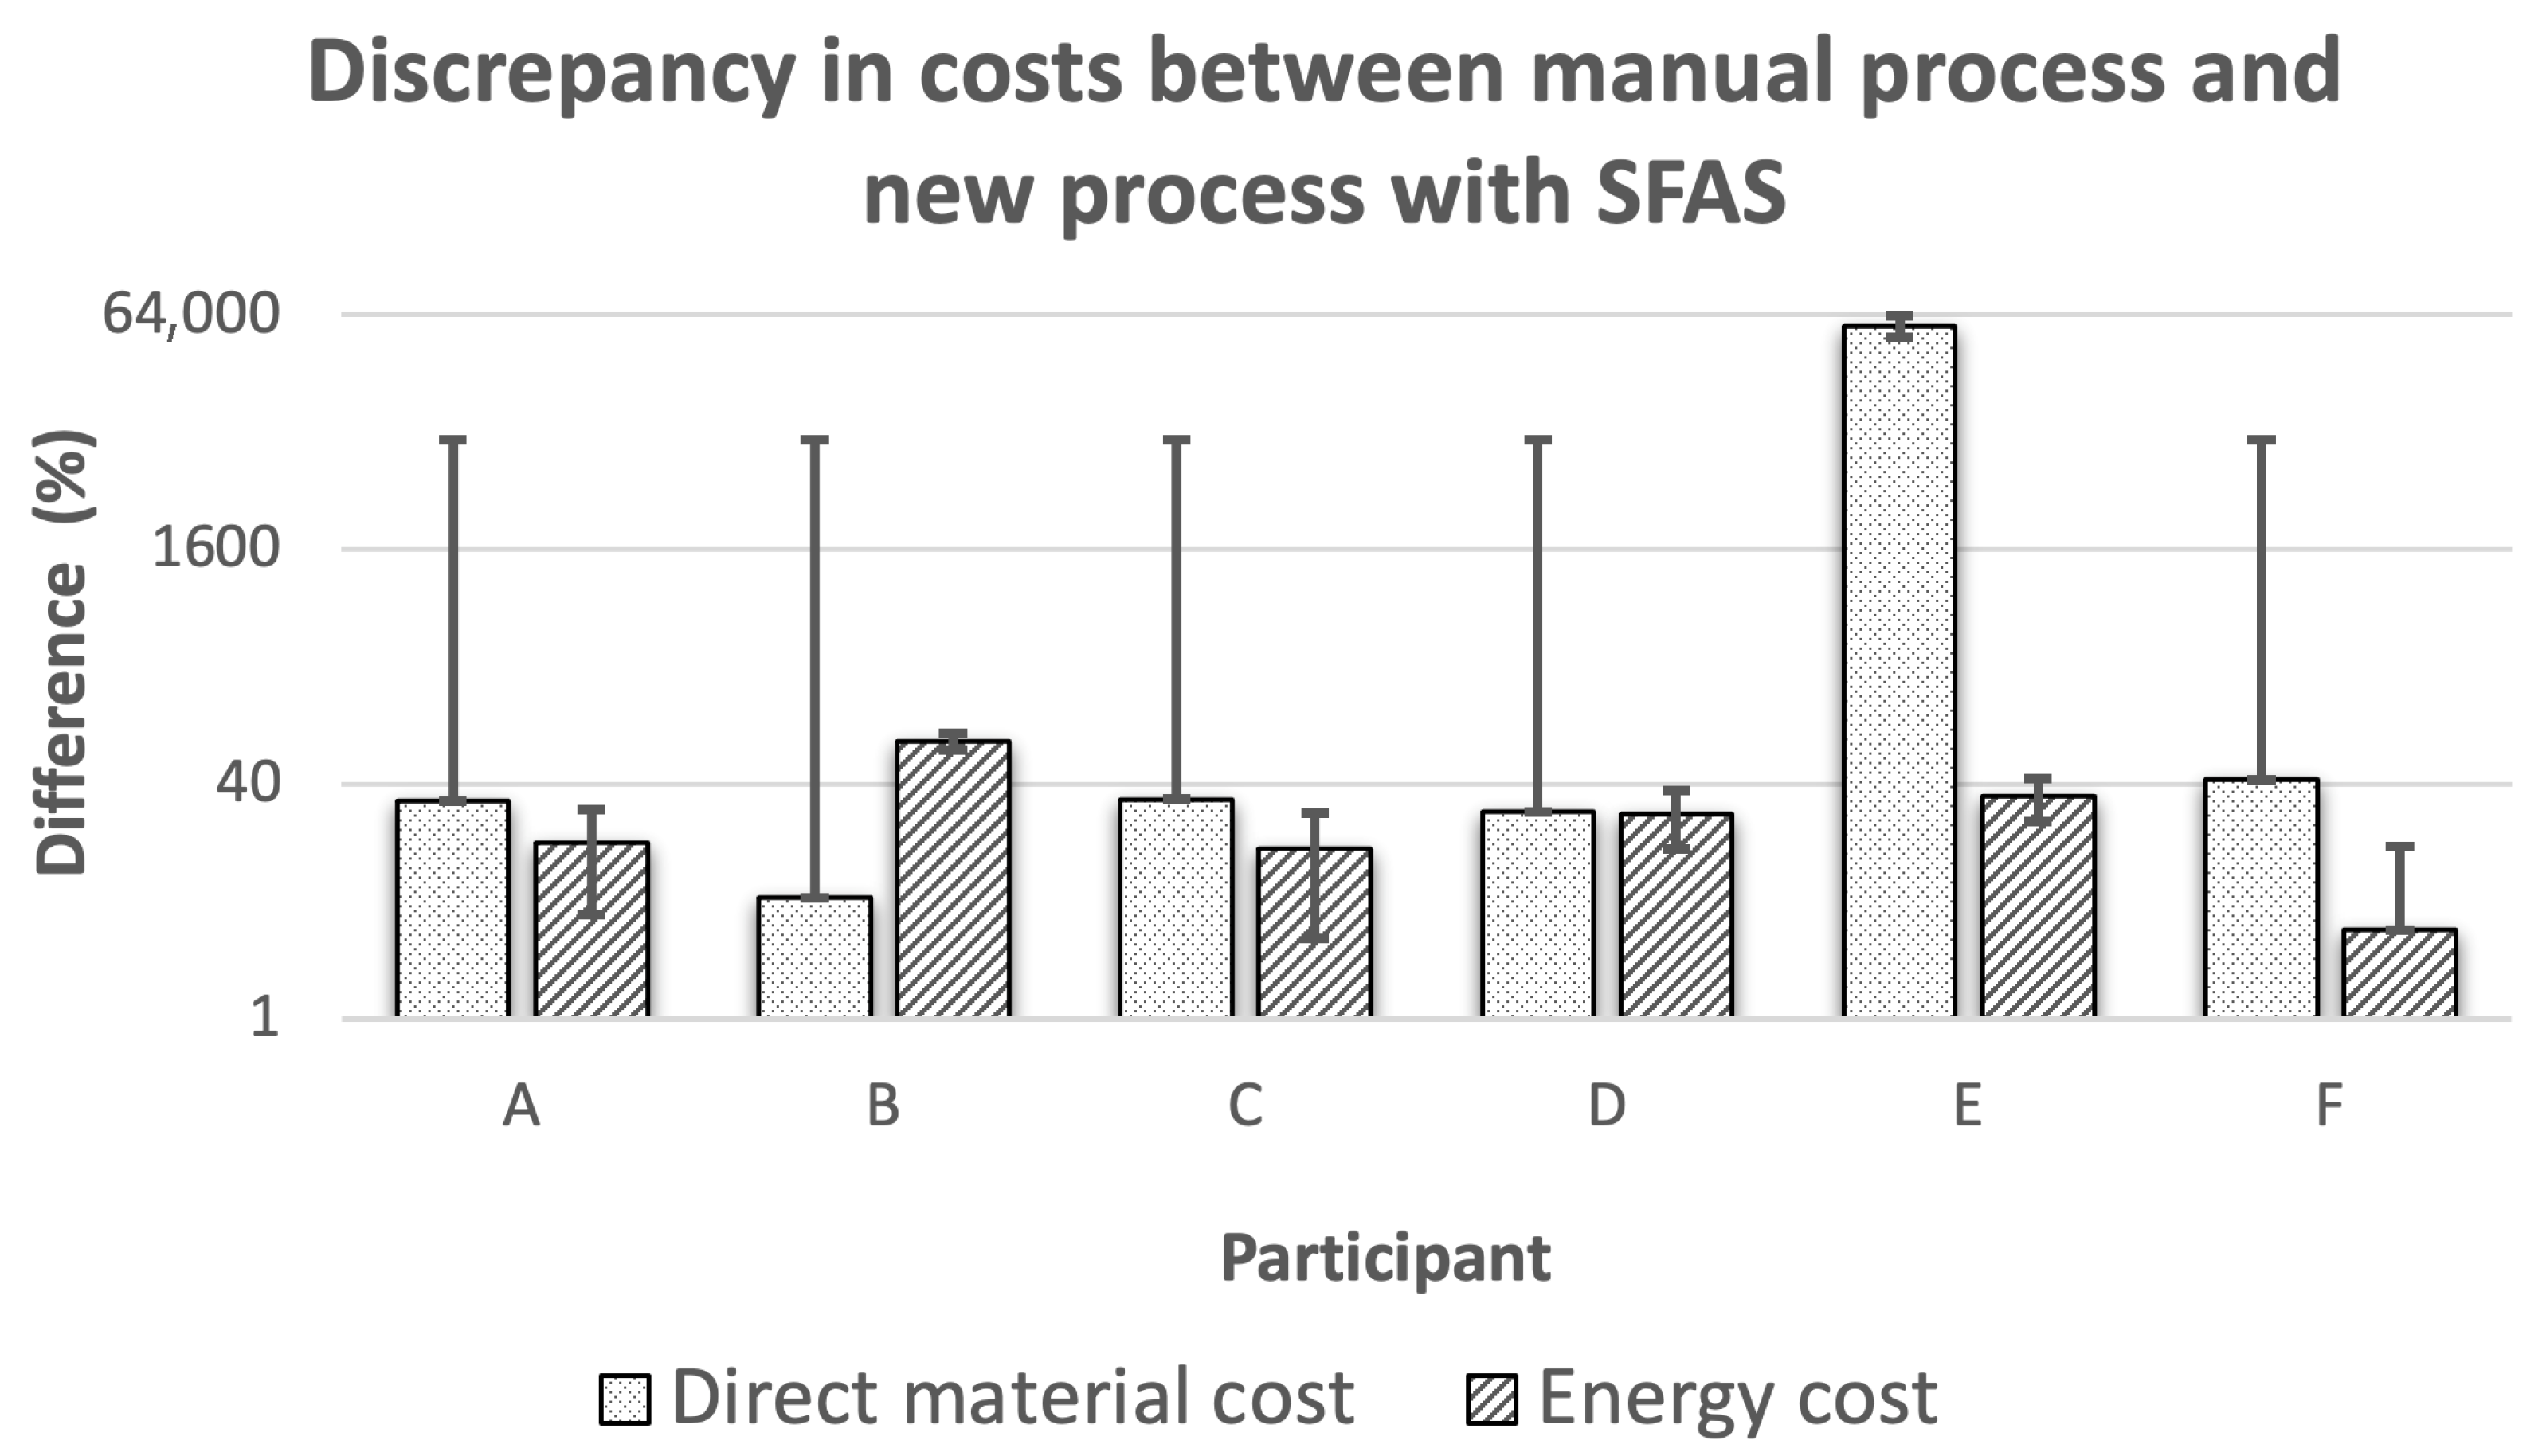
Table 6 shows the estimated cost values for each participant and the differences between the manual and the SFAS system-supported methods.
Figure 3 visualizes the participant-level discrepancies in estimated costs between the two approaches. All participants produced manual estimates that differed from those calculated by the SFAS system, indicating that the system-supported method provided more consistent and accurate results.
Direct material costs calculated using the manual method ranged from KRW 840,000 to KRW 1,386,000,000, with a variance of KRW 1,385,160,000. In contrast, SFAS system estimates ranged from KRW 1,205,399 to KRW 2,584,399, with a much smaller variance of KRW 1,379,000. Similarly, the system-supported method demonstrated greater consistency in estimating annual energy consumption costs.
For instance, participant A produced relatively similar results across both methods; however, detailed analysis revealed a 30% error in direct material costs and a 16% error in energy cost estimation in the manual calculation. This may suggest that the participant prioritized speed over accuracy. Participant E exhibited a significant error in material cost estimation due to a dimensional miscalculation. The manual process requires floor area estimation for energy costs and volume calculations for material costs, increasing the potential for error. Such errors may result from dimensional miscalculations, double-counting or omission of wall elements, or inaccuracies in manual measurement of sketch strokes’ lengths.
These findings highlight that manual cost estimation is highly sensitive to sketch complexity and individual skill levels, often leading to inconsistent and inaccurate results. Conversely, the SFAS system-supported quantitative evaluation demonstrated superiority in both accuracy and reliability.
4.3. Usability Survey Results and Interpretation
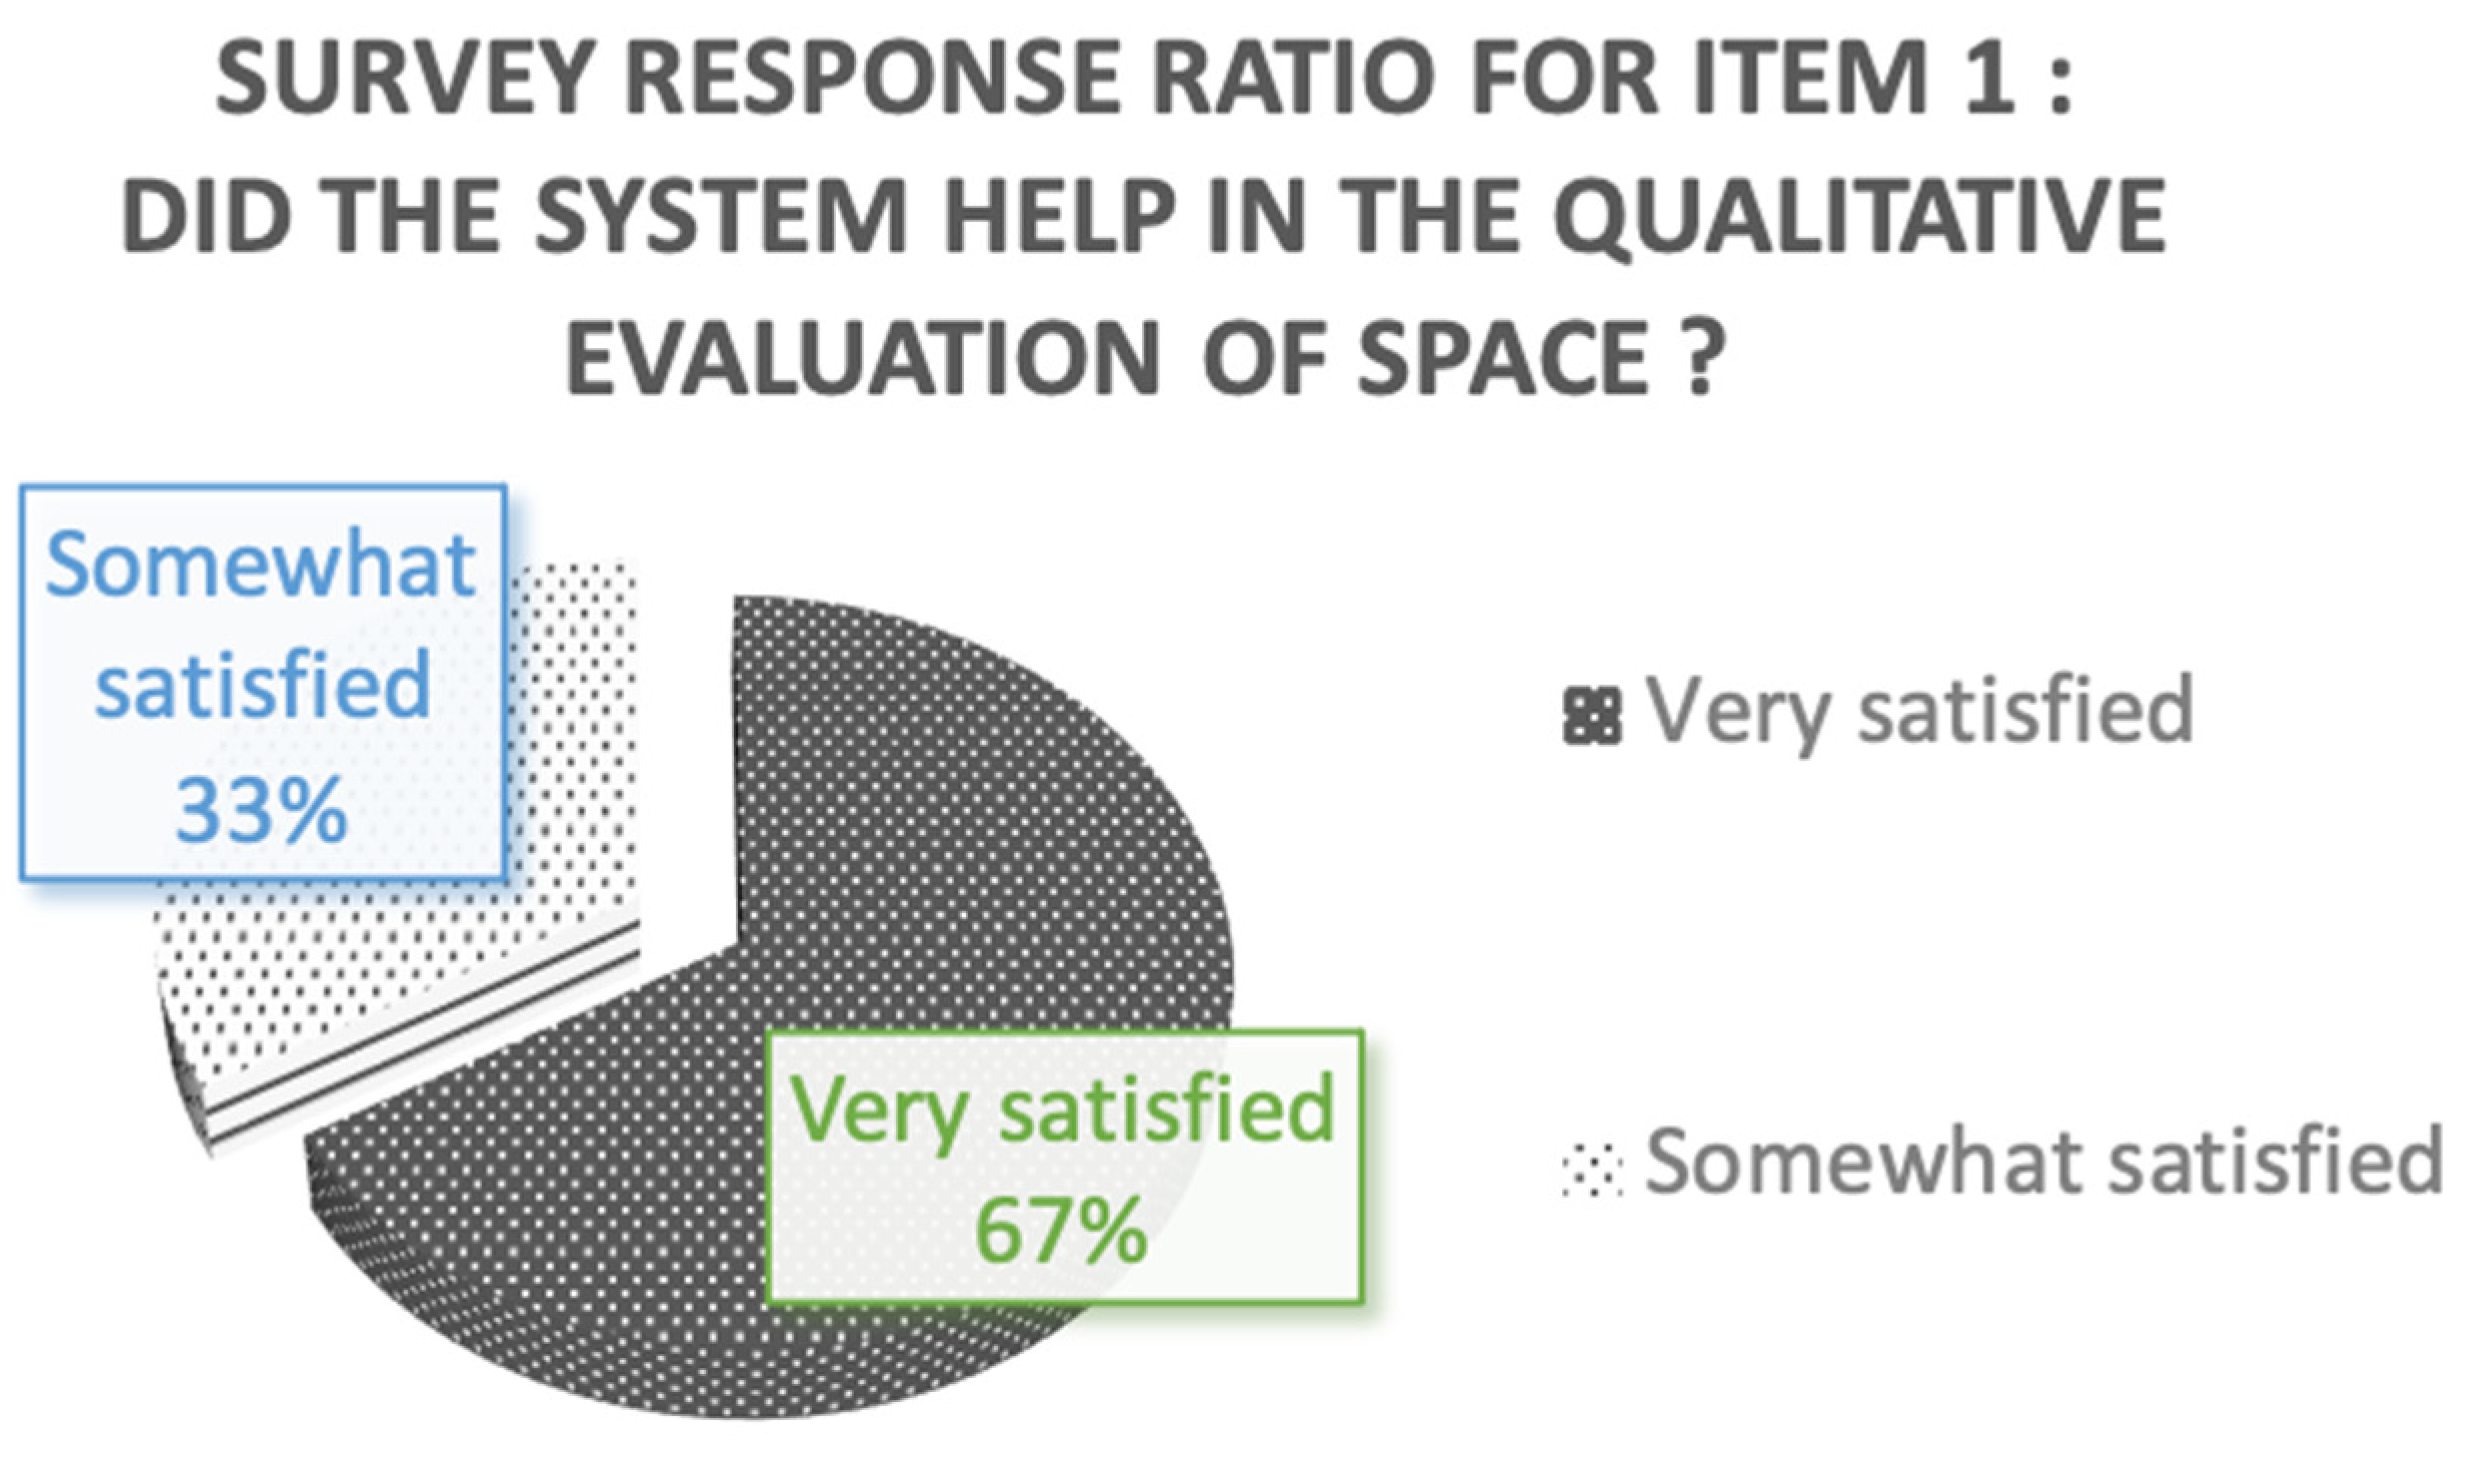
Figure 4 presents the distribution of participant responses to Item 1, which evaluated the overall usefulness of the SFAS system for qualitative spatial evaluation. All participants responded with “somewhat satisfied” or higher, indicating that the system-supported process was perceived as helpful.
Table 7 summarizes responses to Items 1 through 6, converted to a 0–100 scale (0 = very dissatisfied, 100 = very satisfied).
Figure 5 presents the distribution of individual participant responses for Items 1 through 6 as bar graphs, with the corresponding median (solid line) and mean (dashed line) overlaid, highlighting central tendency and item-level variability. Mean satisfaction scores across items ranged from 66.67 to 95.83, covering a range from neutral to very satisfied. Median satisfaction scores ranged from 75 to 100, indicating that participants were generally somewhat to very satisfied. These results suggest that participants generally had a favorable perception of the SFAS system’s spatial evaluation capabilities.
However, Item 2, pertaining to the creation and editing of wall and furniture elements, received the lowest scores in both the median (75) and the mean (66.67). The depressed scores observed for Item 2 appear to be strongly influenced by participant E, who consistently rated all items lower than the other participants and assigned a particularly low score of 25 for the object editing function. This pattern suggests that the depressed mean and median for Item 2 may be partly attributable to an outlier effect. Nevertheless, even when accounting for this potential bias, Item 2 still exhibits the lowest central tendency measures overall. This may reflect participants’ challenges in understanding and operating functions such as rotation, translation, and resizing of wall components. To enhance usability, the SFAS system’s interface should be refined to provide a more intuitive and consistent user experience. Despite this, overall results support the conclusion that the SFAS system-supported process is more effective for qualitative spatial evaluation than the manual approach.
4.4. Effects of Learning
Since this study was conducted using a single-trial design per participant, it was not possible to directly estimate or control learning effects or individual differences. In other words, potential practice or adaptation effects that might emerge from repeated trials could not be assessed. The randomization of process order aimed to prevent potential bias within a single trial—specifically, to avoid situations in which participants might reference system-generated values in advance when performing manual calculations. This feature represents a potential limitation for the interpretation of the results.
However, the results demonstrated that the novel process consistently outperformed the conventional process in terms of both speed and accuracy. Learning effects are generally not expected to produce simultaneous improvements in both speed and accuracy. Thus, the observed results are unlikely to be fully explained by learning effects alone.
Furthermore, considering that participants were generally more familiar with the conventional process, the single-trial design may have disadvantaged the novel process. Nevertheless, the fact that the novel process indicated superior performance across both measures can be regarded as partial evidence supporting the validity of the results.
5. Conclusions
This study empirically validated that the proposed space feasibility assessment process can effectively support non-expert users in making spatial planning decisions during the early design phase. The proposed process is centered on the Space FeAsibility aSsessment (SFAS) system, which automatically generates a BIM model from a user-provided schematic floor sketch and enables furniture layout and cost estimation in a virtual reality (VR) environment. Through the SFAS system, users can directly experience multiple alternatives and immediately examine each option’s space utility, performance, and cost.
The effectiveness of the proposed process was evaluated using the Charrette evaluation method with six participants. Each participant performed space feasibility assessments using both a manual process and the SFAS system-supported process. Comparative analysis was conducted in terms of speed, accuracy, and usability. The SFAS system-supported process outperformed the manual process in both quantitative evaluations (showing higher speed and accuracy) and qualitative evaluations (demonstrating greater usability) These findings indicate that the SFAS system holds potential as a tool to support decision-making by non-expert users in architectural design. Building on this empirical basis, the following sections articulate the distinguishing characteristics of the conventional (manual) process relative to the SFAS system-supported process.
5.1. The SFAS System Is Usable for Space Feasibility Evaluation
Participants successfully conducted space feasibility evaluation using the SFAS system, and the system’s functions were generally easy to learn and use. In addition, the SFAS system-supported process appears to correspond directly to core activities in early-stage design. For example, the activity of translating user spatial needs into an architectural representation aligns with generating a VR-based 3D model from the sketched data. Likewise, activities such as reviewing spatial configurations and reviewing costs correspond to SFAS system’s qualitative and quantitative evaluation, respectively.
5.2. The SFAS System-Supported Process May Be Faster and More Accurate
For cost estimation of the generated spaces, the SFAS system-supported process was faster and more accurate than the baseline. The SFAS system reduces errors arising from manual measurement and calculation, and its advantage is expected to increase as spatial complexity and the number of architectural objects grow. Despite their non-expert status and limited familiarity with cost estimation, participants completed accurate and timely evaluations when supported by the SFAS system.
5.3. The SFAS System May Exhibit High Usability
The SFAS system effectively assists with reviewing spatial utility, and most internal functions demonstrated generally good usability. Participants responded favorably to automatic sketch-to-model conversion and VR interaction capabilities. However, difficulties were reported in object editing functions. When the mechanisms for object rotation, translation, length adjustment, deletion, and creation lack a consistent operational structure, the learning burden increases. Accordingly, providing sufficient training and acclimation time may yield higher levels of usability. Designing a more intuitive interaction scheme and offering task-contingent guidance are also promising directions for improving the usability of the current prototype.
6. Implications
Additional observations and feedback could provide several implications for refining the experimental design, expanding participant groups, enhancing system performance, and ensuring platform independence and data interoperability.
6.1. Refinement of Experimental Design
The study employed a single-trial, single-measure design, which limited the ability to directly estimate or control learning effects and individual differences. The execution order of the two processes was randomized to minimize within-session bias—specifically, to reduce the possibility that participants might preview system-generated values and factor them into manual calculations—but this procedure only addresses certain biases in a single session. It does not constitute a design that directly controls the effects of procedural acclimation or conceptual learning on performance.
Future research should incorporate repeated-measures designs, counterbalancing, and warm-up trials to strengthen internal validity. The proposed spatial assessment process is clearly defined and thus likely to induce procedural learning. For non-experts confronting unfamiliar tasks, such learning may enhance perceived usability. However, it should be treated as a potential limitation in interpreting results. More rigorous designs are needed that control learning effects while maintaining validity.
6.2. Expansion of Participant Groups
The investigation examined the decision-support potential of the SFAS system for non-architects in the early design stage. The six recruited participants cannot be considered representative of the broader non-expert population, which exhibits considerable heterogeneity in age, professional background, and familiarity with digital tools; therefore, generalizability is limited.
These constraints are acceptable when the study is positioned as a formative evaluation. As discussed by Hix and Hartson [
34] and Nielsen [
35], the aim of formative evaluation is to support iterative design improvement and early identification of major usability issues rather than to statistically validate final system performance. Rapid feedback is prioritized over complex statistical analyses, and small samples (typically 3–5 participants) are often recommended as an economical and effective approach. Within this context, conducting the study with a small sample is justified.
Subsequent research should nonetheless broaden the participant pool and increase sample size to enhance statistical generalizability. Requirements that emerge across heterogeneous user groups will provide more granular evidence for system refinement.
6.3. Improvement of System Performance
The implemented system remains at the prototype stage, with substantial room for improvement in processing speed and usability. The pipeline that converts sketch-based input into a BIM model and a VR-based 3D model—followed by cost estimation—depends heavily on hardware performance and software optimization. Adoption of more recent hardware and higher levels of optimization can markedly improve processing speed across these stages.
Survey results indicate comparatively lower satisfaction with object creation and editing, suggesting that the qualitative spatial evaluation features warrant user-interface improvements. Participants noted that the execution of these functions was complex and insufficiently intuitive. Simplifying manipulation procedures and providing contextual help are therefore required. Such enhancements are expected to flatten the learning curve and improve overall usability.
6.4. Platform Independence and Data Interoperability
The VR application developed for this study runs on the BIMCAVE platform. Future work should adopt platform-independent architecture so that it can also operate on devices such as Head-Mounted Displays (HMDs), thereby providing a more intuitive and immersive spatial experience.
Mechanisms are also needed to convert user-generated outputs in the VR environment, such as spatial configurations and furniture layouts, into BIM-compatible objects. Implementing this capability would allow early-stage results to move beyond purely visual artifacts and to be integrated directly into BIM-based downstream workflows used by architects and other professionals. Such integration would reduce discontinuities between early decision-making and downstream design processes and support data consistency.
