Article

A Study on the Nonlinear Relationship Between the Microenvironment of Cold-Region Tunnels and Workers’ Unsafe Behaviors

by
Sheng Zhang
1,
Hao Sun
2,3,*,
Youyou Jiang
1,
Xingxin Nie
1,
Mingdong Kuang
2 and
Zheng Liu
1
1
School of Resource Engineering, Xi’an University of Architecture and Technology, Xi’an 710055, China
2
College of Urban and Environmental Sciences, Northwest University, Xi’an 710127, China
3
Shaanxi Provincial Key Laboratory of Surface System and Environmental Carrying Capacity, Xi’an 710127, China
*
Author to whom correspondence should be addressed.
Buildings 2025, 15(17), 3155; https://doi.org/10.3390/buildings15173155
Submission received: 27 June 2025 / Revised: 29 August 2025 / Accepted: 29 August 2025 / Published: 2 September 2025
(This article belongs to the Section Building Energy, Physics, Environment, and Systems)

Abstract

As a typical enclosed engineering microenvironment, tunnel construction sites exert a profound influence on workers’ unsafe behaviors. This impact is particularly significant in cold regions, where extreme environmental conditions are more likely to trigger unsafe behavior among construction workers. This study utilized two exemplary tunnels in cold regions of China as case studies. During the construction period, microenvironmental data were systematically collected, encompassing temperature, humidity, noise, and dust concentration. In parallel, data on workers’ unsafe behaviors were integrated to construct a nonlinear relationship model, and the importance of each microenvironmental variable was assessed using the random forest algorithm. The results indicate that various microenvironmental factors exhibit significant nonlinear effects on unsafe behavior. Among them, dust concentration had the strongest impact (22.56%), followed by noise (17.40%), humidity (15.02%), and temperature (9.21%). Specifically, the maintenance of temperature control close to 0 °C, humidity levels maintained at 60% to 65%, noise levels not exceeding 82 dB, and dust concentrations below 12 mg/m3 contributed to a significant reduction in unsafe behavior scores. The present study investigates the mechanism of the microenvironment of cold-region tunnel construction on personnel behavioral risk. The study’s findings provide a threshold reference and strategy support for safety optimization and engineering site management of cold-region tunnel construction environments.

1. Introduction

Against the backdrop of the advancing global sustainable development agenda, how to ensure the health, safety, and well-being of on-site workers while maintaining efficient infrastructure construction has become one of the core issues of engineering sustainability [1,2,3]. As a typical high-risk and enclosed working environment, tunnel engineering faces macro-level sustainability challenges, such as resource consumption and carbon emissions, while also relying heavily on workers’ physiological adaptation and behavioral safety within confined microenvironments [4,5]. Therefore, from a human-centered perspective, establishing an intrinsically safe strategy driven by the synergy between microenvironmental optimization and behavioral intervention represents a key pathway for the sustainable transformation of complex engineering projects.
Currently, international studies in related fields such as subways, mining, and industrial confined spaces have begun to reveal the complex mechanisms through which microenvironmental factors, such as temperature, humidity, noise, and air quality, affect workers’ physiological responses, cognitive states, and behavioral patterns [6,7,8,9,10]. However, research remains relatively limited on how microenvironmental factors systematically influence unsafe behaviors among personnel during tunnel construction. Tunnel construction is a special operating environment that combines high confinement, high intensity, and spatiotemporal continuity. However, existing literature has primarily focused on the effects of workload intensity and workplace atmosphere on workers’ long-term health, with a lack of systematic investigations starting from the “microenvironment–behavior” pathway. On the other hand, under extreme environmental conditions (e.g., tunnels in cold regions), the nonlinear influence of microenvironmental factors on workers’ behavioral mechanisms remains largely unexplored, particularly in terms of quantitative analysis and model validation based on empirical data.
The gradual extension of China’s infrastructure construction to high altitudes and tunnels in cold regions and other special areas has led to an increase in the complexity of the microenvironmental pressure faced by construction sites. As a result, operators are exposed to long-term low temperatures, drastic changes in humidity, high noise levels, and high concentrations of dust. This exposure, in combination with the superimposed stimulation of physiological load, psychological stress, and behavioral stability, poses significant challenges to operators [11,12,13,14]. Temperature fluctuations have been demonstrated to influence fatigue and attention levels by modulating the metabolic rate and vascular constriction. High humidity has been observed to induce mood swings and physical discomfort. Noise exposure has been shown to be associated with cognitive disturbances. Dust and aerosols have been implicated in the induction of respiratory illnesses, neuroinflammatory responses, and cognitive dysfunction, which may result in impaired risk perception, operational judgment, and behavioral control [14,15,16,17,18]. These environmental stress factors do not exist in isolation; rather, they interact with each other through a complex pathway to influence workers’ behavioral decision-making processes. This process often results in the manifestation of unsafe behaviors and an elevated probability of accidents.
Although the potential links between microenvironmental conditions and work behaviors have attracted considerable scholarly attention, most existing studies have been conducted under conventional or mild climate conditions, with a lack of systematic identification and modeling analysis for extreme scenarios such as severe cold, low atmospheric pressure, and frequent snowstorms [19,20,21,22,23]. In typical cold-region tunnel projects such as those in Xinjiang and Qinghai, China, extreme low temperatures and complex humidity fluctuations not only affect construction progress and workload intensity but may also indirectly increase workers’ physiological and psychological stress, potentially leading to impaired cognitive function, reduced attention, and other risk-prone behaviors [24,25,26]. Consequently, within the conceptual framework of the “tunnel microenvironment”, it is necessary to systematically incorporate multi-dimensional parameters such as temperature, humidity, noise, dust, and others, in order to carry out research that is both contextualized and data-driven [27].
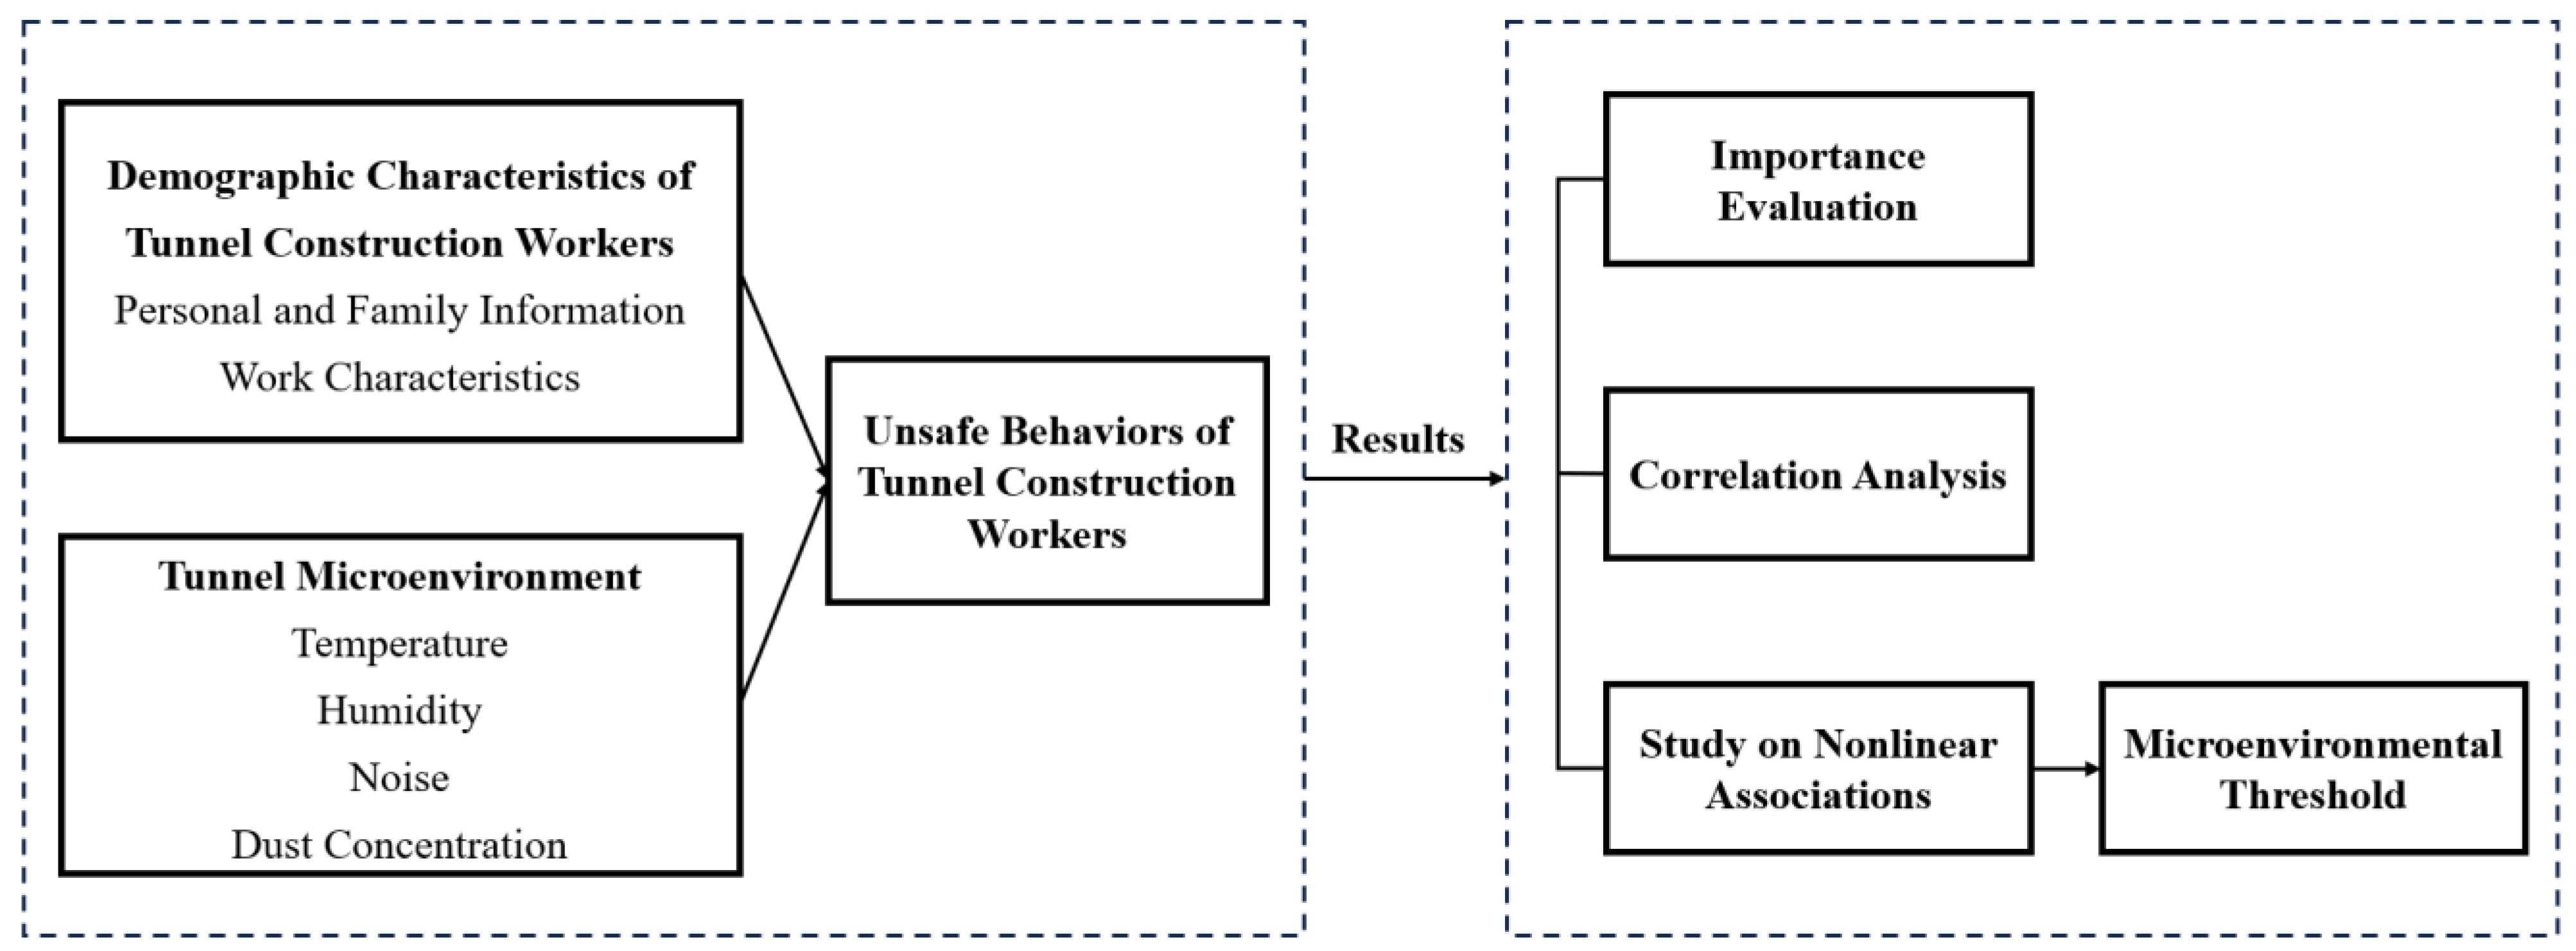
In light of this, this paper proposes a definition for “tunnel microenvironment”. The term refers to a set of pivotal environmental variables that have the potential to exert a substantial influence on the physiological state, psychological response, and behavioral patterns of construction personnel operating in closed, continuous, and high-intensity conditions. This definition encompasses conventional indicators, such as temperature, humidity, noise levels, and dust concentration. Based on this foundation, this study selects two representative cold-region tunnels in China as field cases. By deploying an environmental sensor network and a construction behavior tracking system, the research systematically collected multi-source environmental measurements and records of unsafe behaviors during construction. A nonlinear response model based on the random forest algorithm was then developed to identify the relative importance and nonlinear influence pathways of key microenvironmental variables. Furthermore, several targeted environmental control thresholds have been proposed to support the optimization of on-site safety management. The research framework is illustrated in Figure 1.
The primary contributions of this study are as follows: The integration of microenvironmental and behavioral data from multiple sources, a pioneering achievement in the field, was successfully implemented at the construction site of cold-region tunnels. This initiative partially fills the research gap in understanding behavioral mechanisms under extreme environmental conditions and provides a valuable reference for further exploration in related fields. Secondly, the nonlinear influence of environmental variables on unsafe behavior was identified based on the random forest method. This method overcomes the analytical limitations of the linear hypothesis model, thereby revealing the complex response relationship between the microenvironment and behavior. Thirdly, operational environmental safety control thresholds are proposed to provide theoretical foundations and engineering application references for intelligent environmental regulation, health management of operating personnel, and intrinsic safety design in cold-region tunnels.

2. Data and Methods

2.1. Study Area

The permafrost distribution in China is characterized by significant geographical extensiveness and environmental diversity, given the extensive coverage of cold regions throughout the country. According to the most recent statistics, the area of permafrost in China (with the exception of glaciers and lakes) is approximately 1.59 million km2, which constitutes 16.6 percent of the country’s total land area. Specifically, high-latitude permafrost is primarily distributed in Northeast China, covering approximately 240,000 km2, while high-altitude permafrost is widely found on the Qinghai–Tibet Plateau and in the mountainous regions of Northwest China, with a total area of about 1.35 million km2. In addition, seasonally frozen ground covers an even larger area, approximately 5.36 million km2, accounting for 55.8% of the country’s land area. In recent years, as China’s national transportation infrastructure strategy continues to expand into western and remote regions, an increasing number of tunnel projects have traversed areas of permafrost and seasonally frozen ground, facing challenges posed by high altitudes, low temperatures, and intense freeze–thaw cycles under extreme climatic and geological conditions [28,29,30,31,32]. This places greater demands on the design, construction, and maintenance technologies of tunnels. Furthermore, it is imperative that a more profound understanding of the characteristics of the cold-region permafrost environment be developed in order to enhance the safety and sustainability of the project.
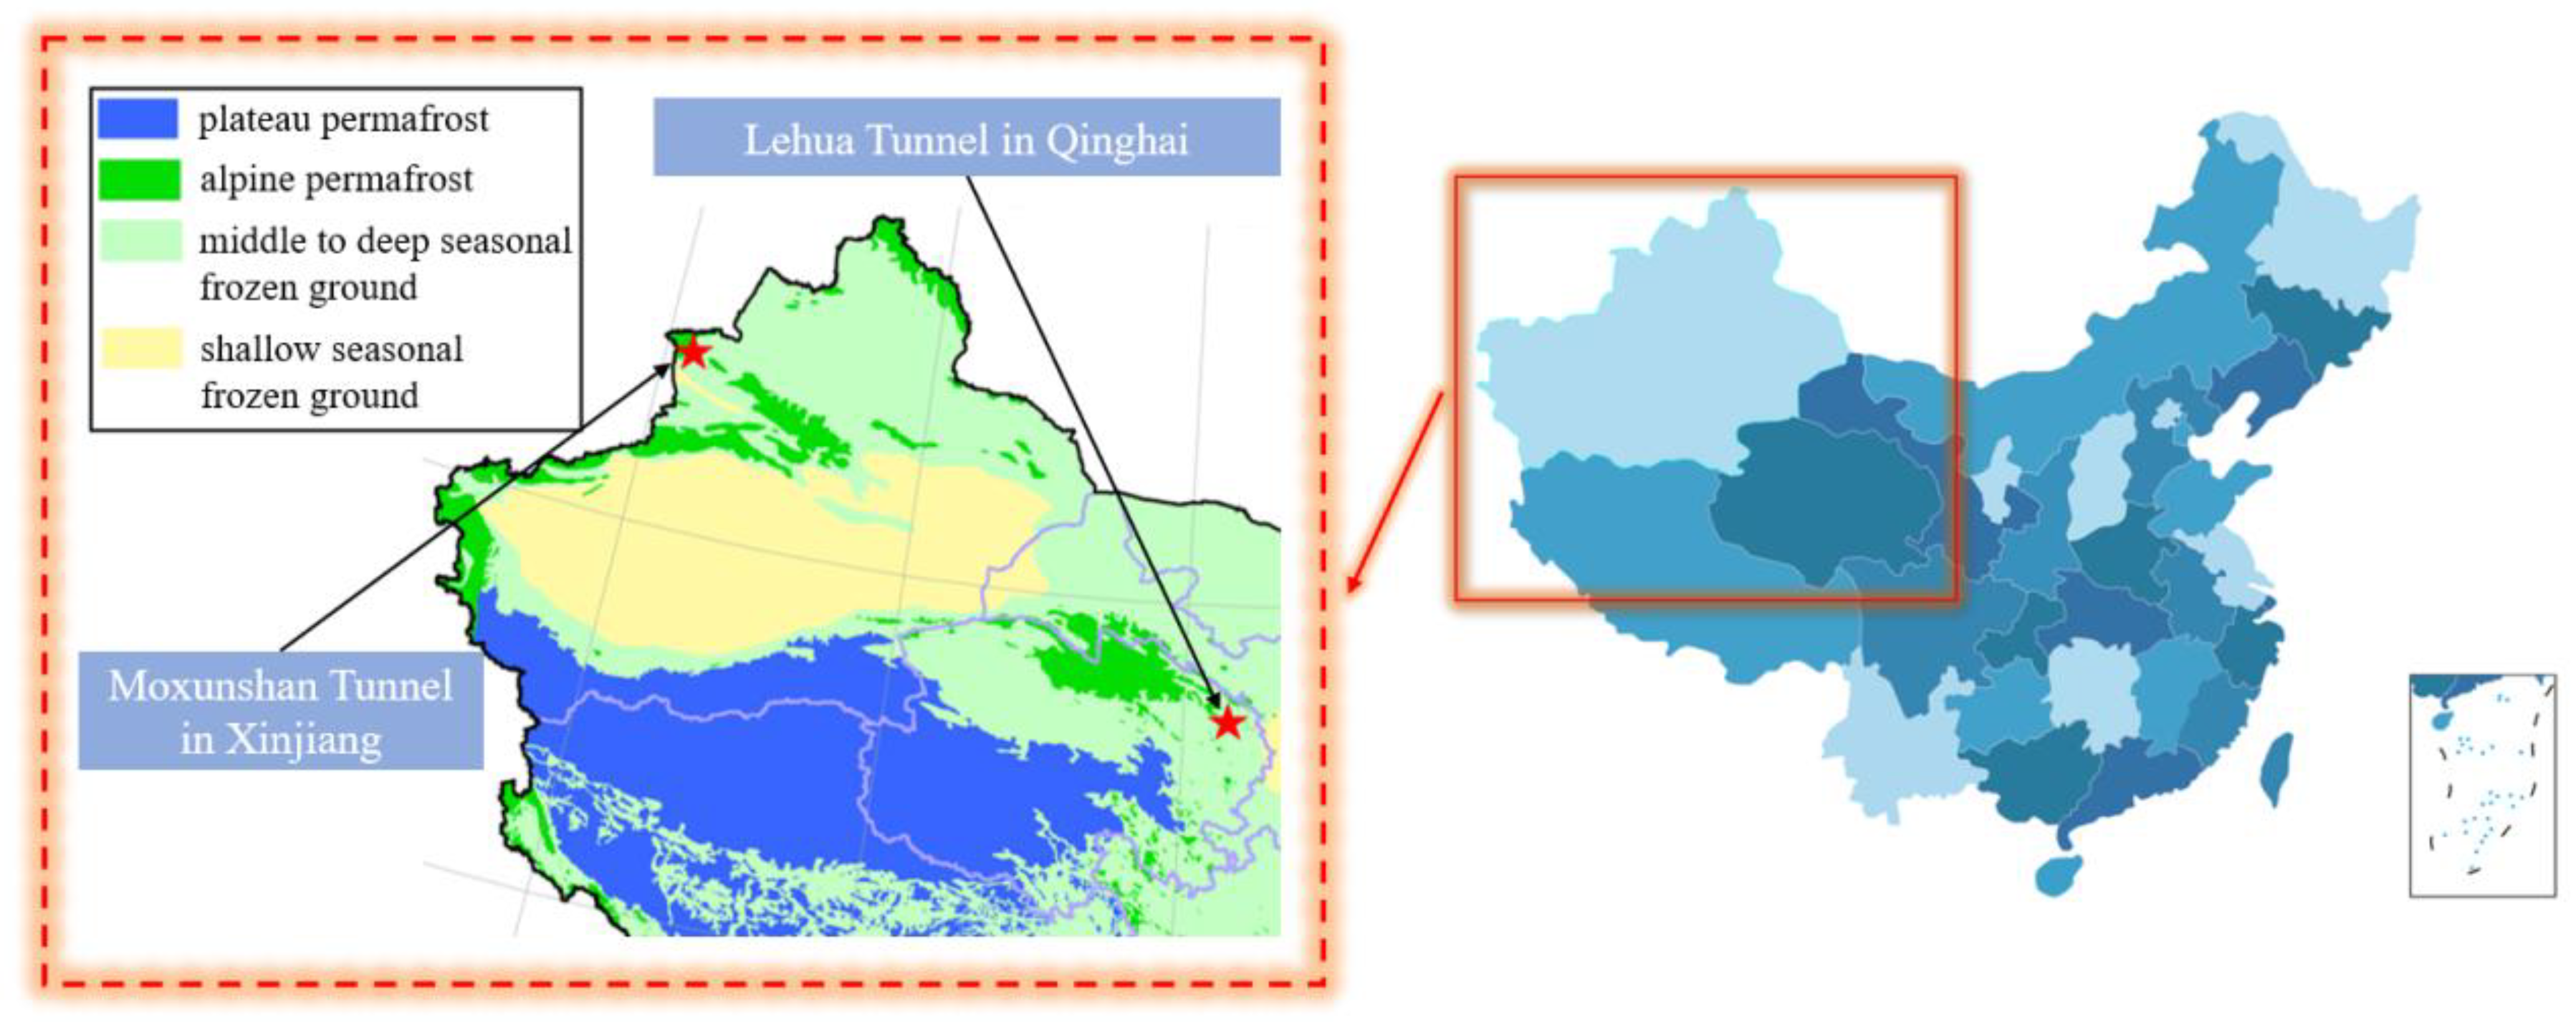
The study focuses on two representative under-construction tunnels in the cold regions of Xinjiang and Qinghai, China. The specific geographic locations of these tunnels are shown in Figure 2. The tunnels are the Moxunshan Tunnel in Xinjiang and the Lehua Tunnel in Qinghai. Both tunnels are situated in typical cold-region microenvironments characterized by high altitude, low temperatures, and fluctuating humidity. These features make them representative and well-suited for studying the relationship between cold-region tunnel construction environments and worker behavior. Specifically, the Moxunshan Tunnel in Xinjiang has a total length of 942 m, with a clear width of 8.59 m and a clear height of 10.8 m. The Lehua Tunnel in Qinghai is 879 m long, with a clear width of 7.38 m and a clear height of 10.98 m. The tunnels selected for this study are located in typical cold plateau regions of Xinjiang and Qinghai, both characterized by continental arid or semi-arid climates. The frequent freeze–thaw cycles in these areas pose significant challenges to tunnel structural stability and construction safety. The geological strata of the project area are primarily composed of Quaternary loose sediments, including sandy soil, silt, gravel layers, and locally interbedded clay. The soil is loosely structured, highly permeable, exhibits certain collapsibility, and has a pronounced frost heave potential. Field investigation data indicate that the multi-year average permafrost depth generally ranges from 1.4 to 2.0 m, and the soil is typically classified as frost resistance grade II. In some areas, the soil exhibits poor frost resistance, making it prone to generating frost heave pressure during winter.
The selection of these two projects aims to explore the impact mechanisms of unsafe behaviors among construction workers under the complex microenvironmental conditions in cold regions, and to provide regional insights and empirical support for safety management in tunnel construction in cold areas. Both Xinjiang and Qinghai are located in the typical cold plateau regions of Northwest China. Tunnel projects in these areas often face multiple environmental challenges, including low temperatures, large temperature fluctuations, dryness, strong winds, and intense radiation. Additionally, they encounter construction difficulties due to complex geological structures and poor ventilation. These factors not only increase the difficulty of project organization and management but also have a lasting impact on the physiological load, psychological state, and decision-making ability of construction workers. Compared to tunnel projects in Central and East China, the construction environment in the northwestern cold regions is more severe, and the working conditions are more representative. As a result, it serves as an important experimental field for studying the relationship between tunnel microenvironments and unsafe behaviors. The Moxunshan Tunnel is an important ongoing transportation project in the Ili region of Xinjiang. Located in a high-altitude mountainous area, it experiences low temperatures for most of the year, with significant humidity fluctuations inside the tunnel. The construction process is often accompanied by persistent high noise levels and dust disturbances, making it a typical example of a cold, enclosed working space. The Lehua Tunnel in Qinghai is located in the plateau–hill region, with a fractured geological structure. Inside the tunnel, there are large diurnal temperature variations and poor ventilation. Particularly during the winter construction period, the tunnel environment significantly affects the human body in terms of thermal stress, sensory fatigue, and psychological pressure. These two tunnels not only represent typical characteristics of construction in cold regions in terms of geographic and climatic features but also employ the same mining method construction technique, making it easier to compare data across projects and establish models.
The research team conducted a series of field studies in the vicinity of the two tunnels in late 2023 and early 2024. They entered the construction sites and systematically collected microenvironmental exposure information, as well as data on the psychological health status and safety behavior of the frontline construction workers. The focus of the survey was on frontline workers with long exposure times and higher risk levels. A stratified sampling approach was used, targeting different job types, work areas, and teams. A total of 540 questionnaires were distributed, with 498 valid responses collected, covering typical positions such as ventilation workers, blasting workers, shotcrete workers, and haulage workers. Additionally, semi-structured interviews were conducted to supplement the data with frontline workers’ subjective experiences and behavioral feedback in extreme microenvironments. This paper conducts an in-depth empirical study of two typical tunnels in the cold regions of Xinjiang and Qinghai, with the objective of revealing the key factors influencing the safety behavior of construction personnel under alpine and complex conditions from the microenvironmental dimension. The paper’s findings provide both theoretical support and practical paths for the safety control of tunnel construction in cold regions.

2.2. Research Data

To systematically evaluate the potential impact of the tunnel microenvironment on construction workers’ unsafe behavior, this study selects four representative physical environmental factors—temperature, relative humidity, noise, and dust concentration—as key microenvironmental indicators. These factors not only represent the most common environmental exposure sources during tunnel construction but also serve as core variables influencing workers’ physiological health, psychological state, and behavioral performance [33].
The selection of indicators is based on three main criteria: First, numerous studies have shown that the above environmental factors are commonly present in tunnel and underground construction and are highly correlated with workers’ health and safety behavior; second, these factors exhibit significant fluctuations in typical cold-region tunnels, being influenced by climate conditions, construction stages, and types of work; and third, the relevant indicators are measurable on-site and quantifiable, facilitating comparative analysis across multiple work types and scenarios.
During the on-site data acquisition process, several limitations and challenges were encountered. First, the tunnels are located in high-altitude cold regions with harsh climatic conditions, and extremely low winter temperatures occasionally caused sensor malfunctions or data interruptions. Second, due to the complex and dynamic construction environment, the placement of some monitoring points was constrained by ongoing excavation activities, safety requirements, and ventilation layouts, resulting in partial data gaps or reduced sampling frequency. Additionally, for parameters such as instantaneous dust concentration and high-frequency noise fluctuations, repeated measurements using portable high-sensitivity instruments were necessary, which increased the difficulty of calibration and verification. Although these challenges imposed certain limitations on data completeness and acquisition efficiency, supplementary measurements, cross-validation, and careful preprocessing were adopted to ensure data reliability as much as possible.
With regard to the collection of data, the present study employs a multi-source fusion data acquisition strategy in conjunction with field research on the Moxunshan Tunnel in Xinjiang and the Lehua Tunnel in Qinghai. On the one hand, portable environmental monitoring instruments (such as temperature and humidity loggers, sound-level meters, and dust concentration monitors) were deployed in typical work areas classified by job type and construction phase to conduct real-time dynamic monitoring of temperature, humidity, noise, and dust levels. The monitoring period covered multiple critical construction phases to ensure the representativeness and timeliness of the data. On the other hand, information on workers’ job types, working hours, and operational areas was collected through questionnaires and precisely matched with the monitoring data in terms of space and time, thereby estimating the actual environmental exposure levels of individual workers.
In this study, all tunnel microenvironment data were obtained through systematic on-site measurements to ensure the authenticity and representativeness of the data. Microenvironmental variables were obtained through discrete observations using portable devices to record key indicators—such as temperature, humidity, dust concentration, and noise levels—at different time points. Although the data were not collected continuously, this approach effectively captured the typical variations in the tunnel microenvironment during construction. Based on a systematic review of existing literature on tunnel engineering and environmental monitoring, this study selected drilling, mucking, and shotcreting as representative construction operations with significant environmental impact. Combined with key spatial nodes such as the tunnel entrance, tunnel midpoint, secondary lining, air outlet, and tunnel face, a multi-condition and multi-point microenvironment monitoring framework was established. Specifically, each tunnel is systematically tested under 15 different combinations of working conditions and measurement points, with three independent measurements in each group, and the average value is taken as the final reference data. This process reduces chance errors and deviations caused by instrument fluctuations, and enhances the robustness and repeatability of the data. This study utilizes a multi-dimensional and standardized sampling design, enabling the capture of the spatial–temporal variability characteristics of the tunnel microenvironment. This provides a solid data foundation for subsequent correlation analysis and mechanism exploration.
To systematically assess the variation characteristics of the temperature environment within the tunnel workspace, this study employed the SMART Sensor AR847+ handheld industrial-grade high-precision temperature and humidity detector (Shenzhen Smart Sensor Co., Ltd., Shenzhen, China) for continuous on-site monitoring. The device has an environmental temperature measurement range of −10 °C to 50 °C, with a resolution of 0.1 °C. It features rapid response and real-time display capabilities. During the measurement process, data were collected every 5 s and averaged on an hourly basis to capture the dynamic temperature variation characteristics across different construction phases. Regarding sensor placement, five representative monitoring points were arranged along the longitudinal central axis of each tunnel, located at (1) the tunnel face, (2) the air outlet, (3) the secondary lining, (4) the tunnel midpoint, and (5) the tunnel entrance. All monitoring points were positioned at a height of 1.5 m above the ground to approximate the breathing zone of the construction workers. Monitoring was conducted daily between 9:00 a.m. and 6:00 p.m., covering three typical construction activities: drilling, mucking, and shotcreting. This sensor placement strategy ensured the representativeness, comparability, and spatial coverage of the measurement data [34,35,36].
To comprehensively characterize the thermal and humidity variations within the tunnel workspace, this study conducted synchronous and continuous humidity measurements using the same SMART Sensor AR847+ handheld temperature and humidity detector (Shenzhen Smart Sensor Co., Ltd., Shenzhen, China) employed for temperature monitoring. The device has a humidity measurement range of 5.0% to 98.0% relative humidity (RH), with a resolution of 0.1%, and is capable of stable operation in high-humidity and high-dust environments. Humidity monitoring points were consistent with those for temperature, located at five positions: the tunnel face, air outlet, secondary lining, tunnel midpoint, and tunnel entrance. All sensors were installed at a height of 1.5 m above the tunnel floor to simulate the actual working environment of construction personnel. Monitoring was conducted during typical construction working hours (9:00–18:00), with a data sampling frequency of once every 5 s. By comparing humidity variations across different construction conditions and spatial locations, the study reveals the dynamic characteristics of the thermal–humidity environment within enclosed workspaces [37,38,39].
Tunnel construction noise primarily originates from the operation of high-intensity machinery, such as drilling rigs, transport vehicles, and shotcreting equipment, which can have potential impacts on workers’ hearing and psychological health. This study employed a SMART Sensor AS844+ handheld industrial-grade sound-level meter (Shenzhen Smart Sensor Co., Ltd., Shenzhen, China) for high-precision on-site measurements. The device has a measurement range of 30 dB to 130 dB, with a resolution of 0.1 dB, and is equipped with A-weighting and Leq (equivalent continuous sound level) measurement modes. Five noise monitoring points were set up in each tunnel, located at the following positions: the tunnel face, air outlet, secondary lining, tunnel midpoint, and tunnel entrance. The testing equipment was mounted on a tripod at a height of 1.3 m, maintaining the same spatial position as the other environmental parameters being monitored. The measurement duration at each location was 10 min, with typical working conditions selected for recording. Ultimately, this study used the “A-weighted equivalent continuous sound level” (Leq) to characterize noise intensity. This parameter reflects the average noise energy level over a specific period and is a widely used noise exposure indicator in occupational and environmental health research. All instruments were calibrated for sound before measurement to ensure data accuracy and repeatability [40,41].
Dust exposure is one of the key factors affecting the health of tunnel workers. To obtain the spatiotemporal distribution characteristics of dust concentration at the construction site, this study employed a CCZ-1000 direct-reading dust concentration meter (Suzhou Yilian Electromechanical Technology Co., Ltd., Suzhou, China) for continuous sampling. The instrument has a measurement range of 0.01 mg/m3 to 1000 mg/m3, with a resolution of 0.01 mg/m3. It features a real-time display, data storage, and USB export functions, making it suitable for the complex and variable tunnel construction environment. The dust monitoring points were arranged in accordance with the noise monitoring points, positioned at five representative locations. All sensors were uniformly mounted on tripods at a height of 1.3 m above the ground to ensure consistency and comparability of data across different spatial samples. The measurement period covered three major construction phases. Instruments were activated 30 min prior to the start of each construction phase to ensure the capture of the entire dust generation process. The data collection duration was five minutes per session, and the data were subsequently analyzed by time intervals [42,43,44].
By integrating on-site monitoring data with questionnaire responses, this study developed microenvironmental exposure profiles for workers of different trades under specific working conditions. This approach helped to reveal the interactive effects among microenvironmental factors in tunnel construction, laying a data-driven foundation for exploring their influence pathways on unsafe behaviors and providing scientific support for targeted improvements to the working environment.

2.3. Research Results

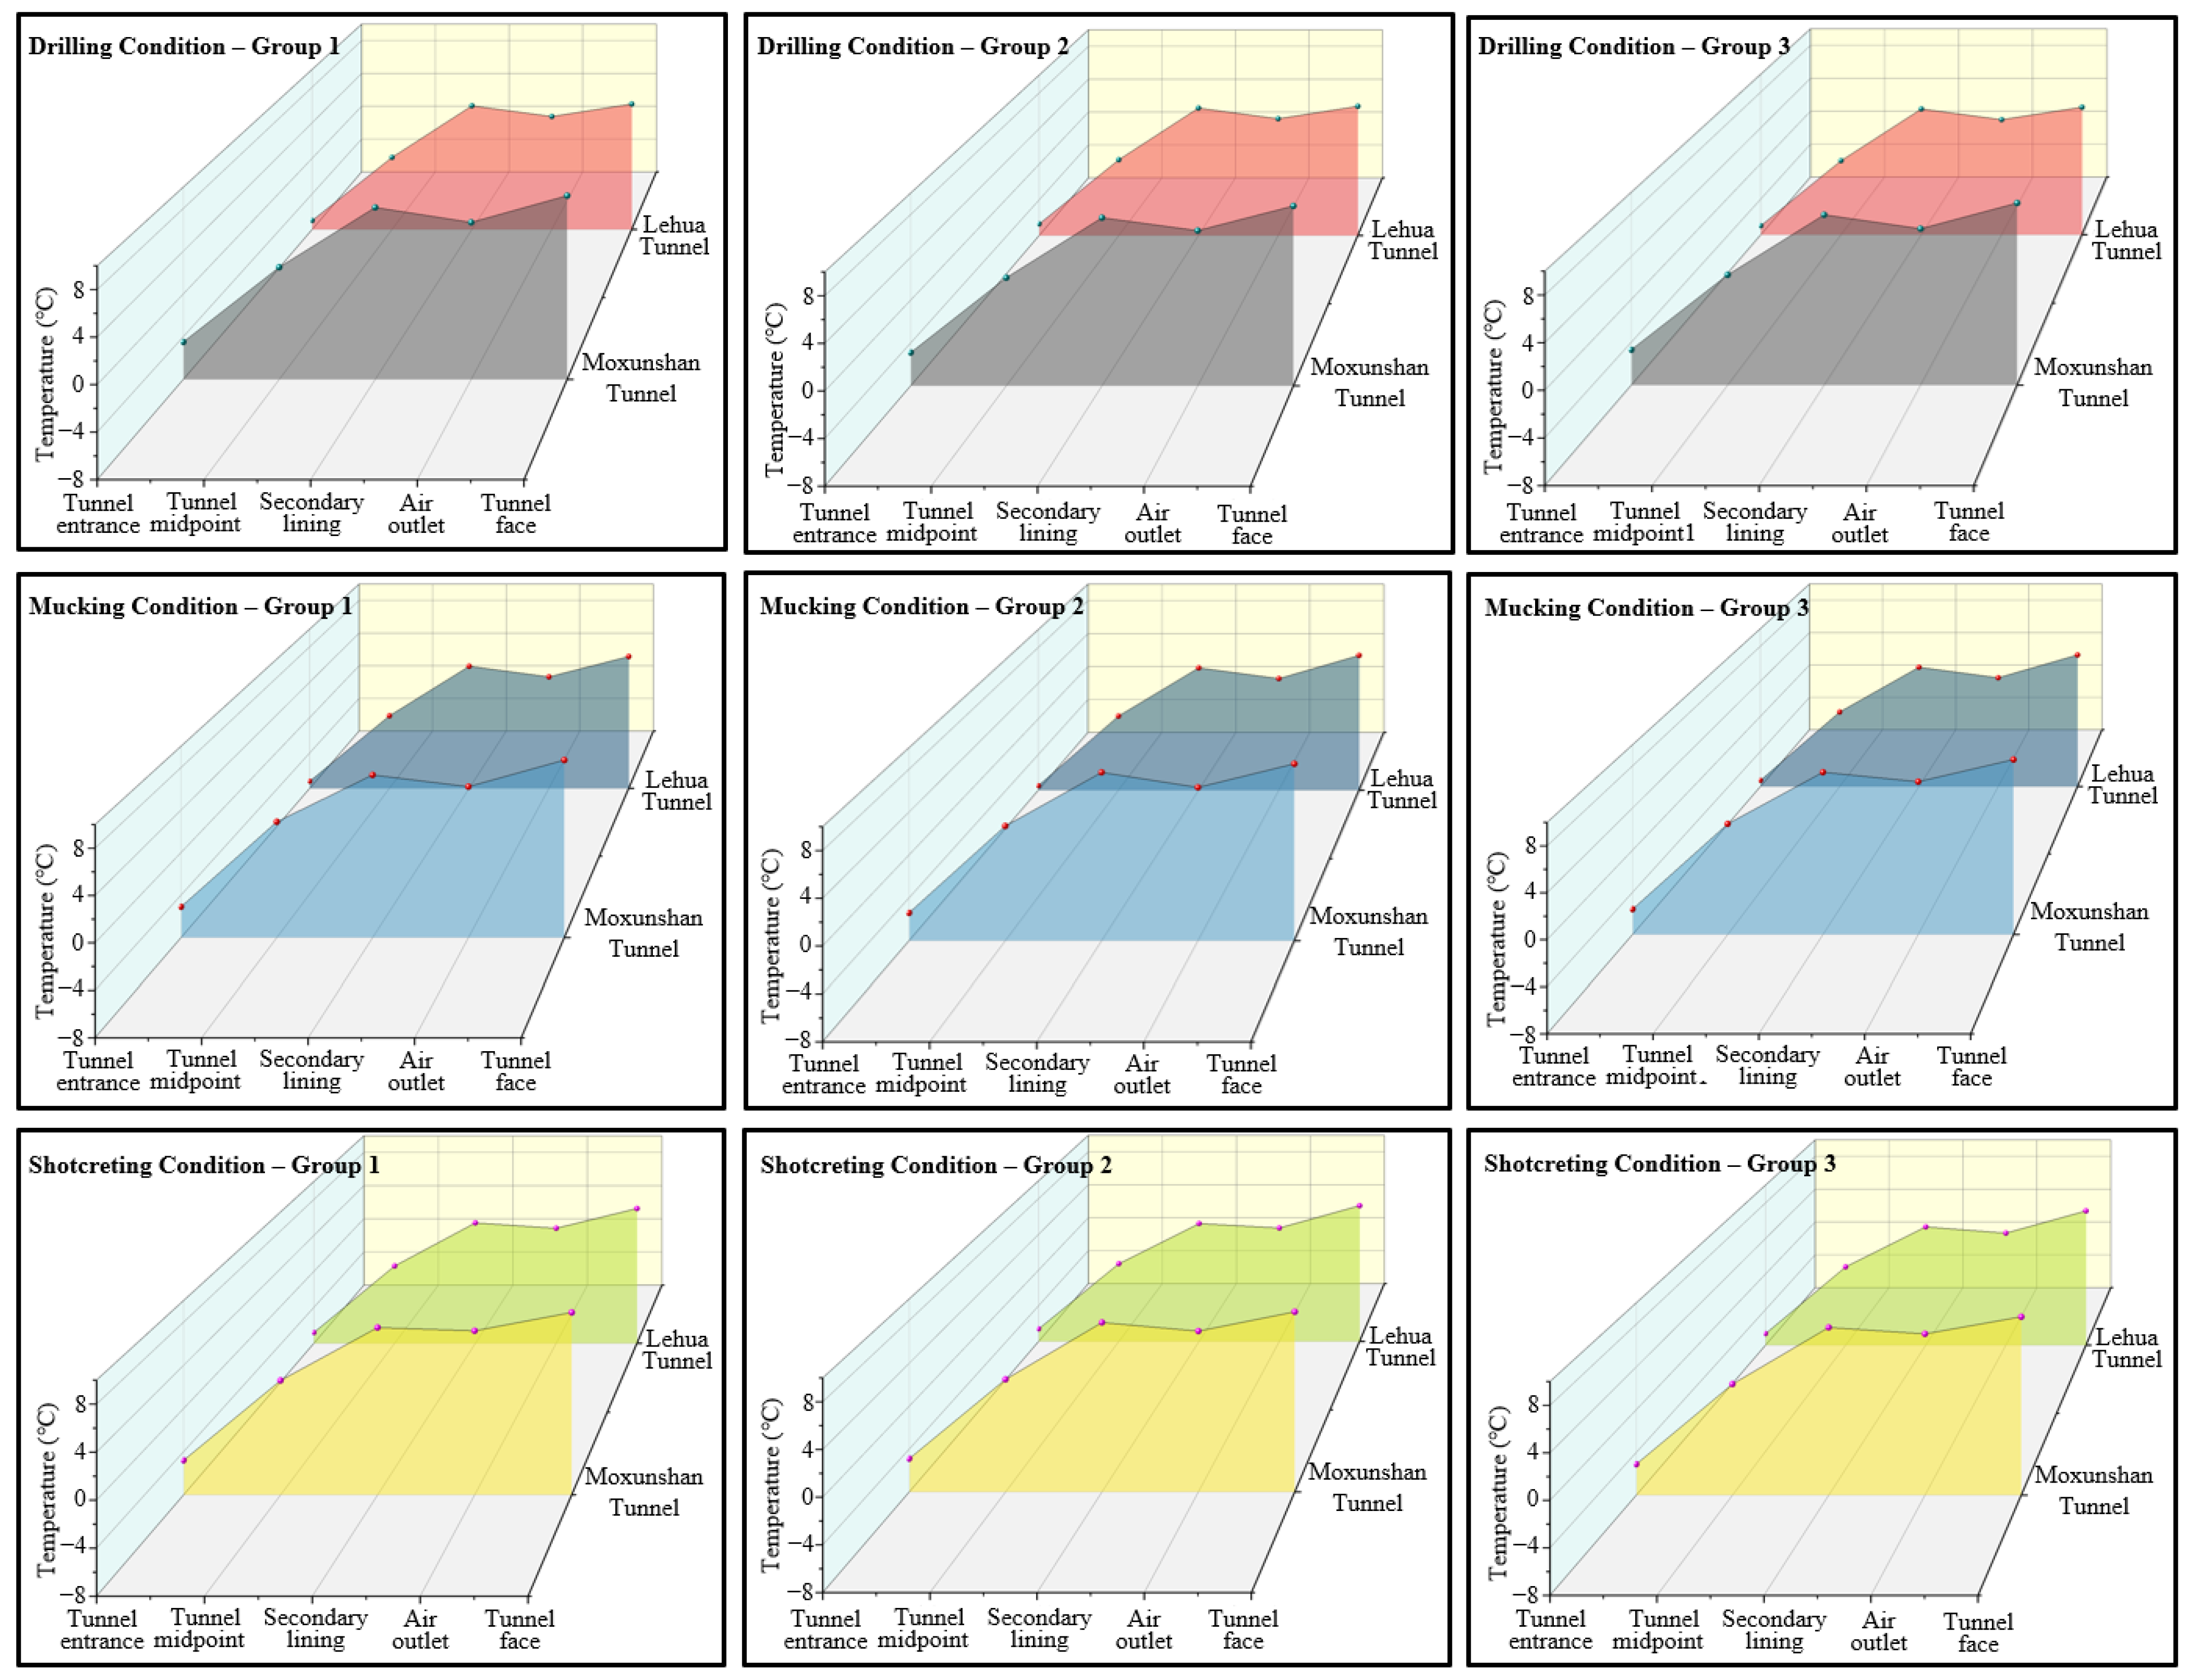
As shown in Figure 3, the analysis of 18 sets of measured data reveals that the temperature in the tunnel face area is consistently the highest. This reflects the combined effects of concentrated heat sources from construction machinery, limited local ventilation, and high work intensity. The temperature in the secondary lining construction area is also notably elevated, possibly due to the heat released from concrete hydration and the enclosed construction conditions. In contrast, the temperatures in areas such as the tunnel entrance, tunnel midpoint, and air outlet are significantly lower, being more influenced by external temperature and ventilation conditions. In terms of working condition comparison, the temperature distribution trends under the three typical operation conditions—drilling, mucking, and shotcreting—are generally consistent, with no significant differences observed between the conditions. Therefore, no separate distinction is made in subsequent analyses.
Monitoring results indicate that temperatures at the tunnel face are consistently higher than those in other sections, showing a distinct spatial variation. This pattern can be attributed to several interacting mechanisms: As the foremost working zone, the tunnel face hosts concentrated operations of heavy machinery such as drills and loaders, which continuously generate heat. Additionally, the high density of workers and their physically intensive activities contribute metabolic heat to the microenvironment. Moreover, limited or unidirectional ventilation in this area hinders effective heat dissipation, leading to a “thermal accumulation effect” within the relatively enclosed space. These factors collectively result in the persistently elevated temperatures observed at the tunnel face.
Table 1 presents the statistical indicators of operational temperature at different measurement locations in the Moxunshan and Lehua tunnels, including the mean, standard deviation, minimum, maximum, range, and median values.
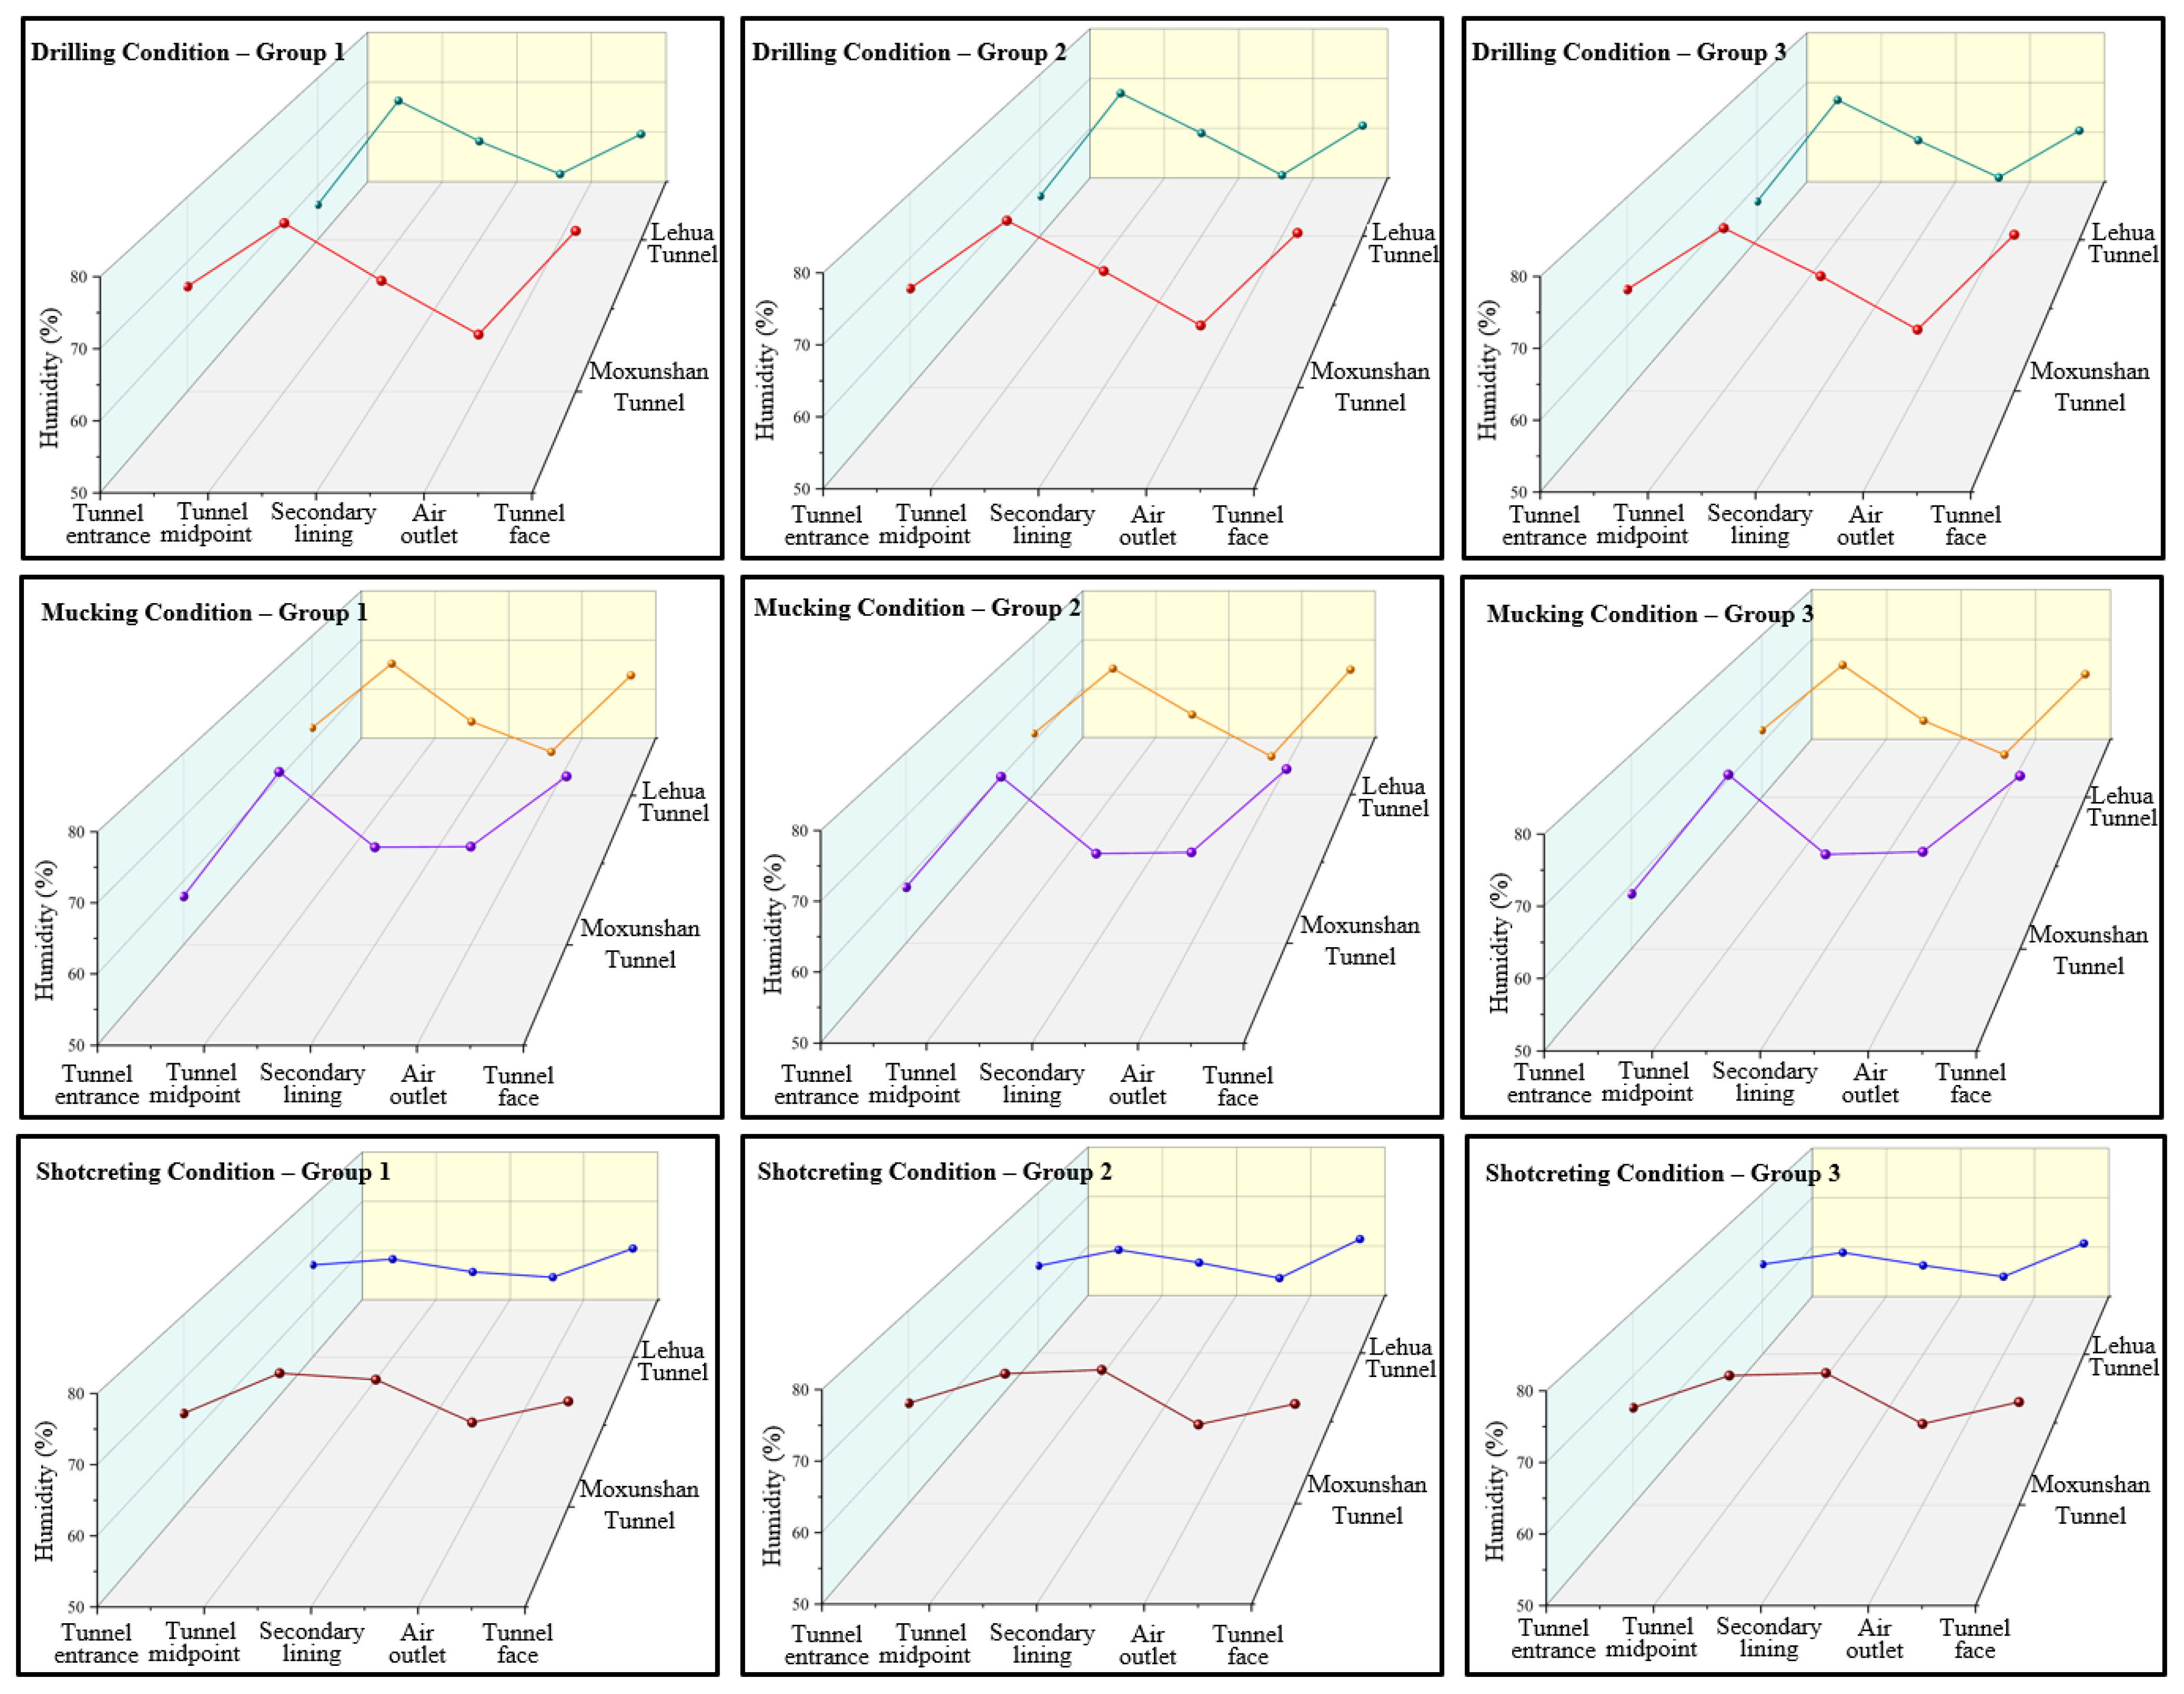
As shown in Figure 4, under drilling and mucking conditions, the humidity levels in the tunnel midpoint are generally higher, likely due to limited ventilation and the accumulation of moisture. In contrast, the air outlet exhibits the lowest humidity, influenced by the inflow of dry external air, reflecting a clear spatial gradient. Humidity variations in other areas are relatively stable, with minimal fluctuations. Notably, under shotcreting conditions, the extensive use of water during construction, combined with deliberate humidity control measures, leads to a convergence in humidity levels across tunnel locations. This results in significantly reduced overall fluctuation and exhibits a high degree of spatial homogeneity. This result not only reveals the dynamic variation patterns of humidity under different working conditions but also indicates that humidity distribution during specific construction phases may potentially affect workers’ comfort, physiological load, and operational efficiency. It provides essential data support for the optimization of thermal–humidity environments and the enhancement of construction safety management.
Table 2 present the statistical indicators of operational humidity at different measurement locations in the Moxunshan and Lehua tunnels, including the mean, standard deviation, minimum, maximum, range, and median values.
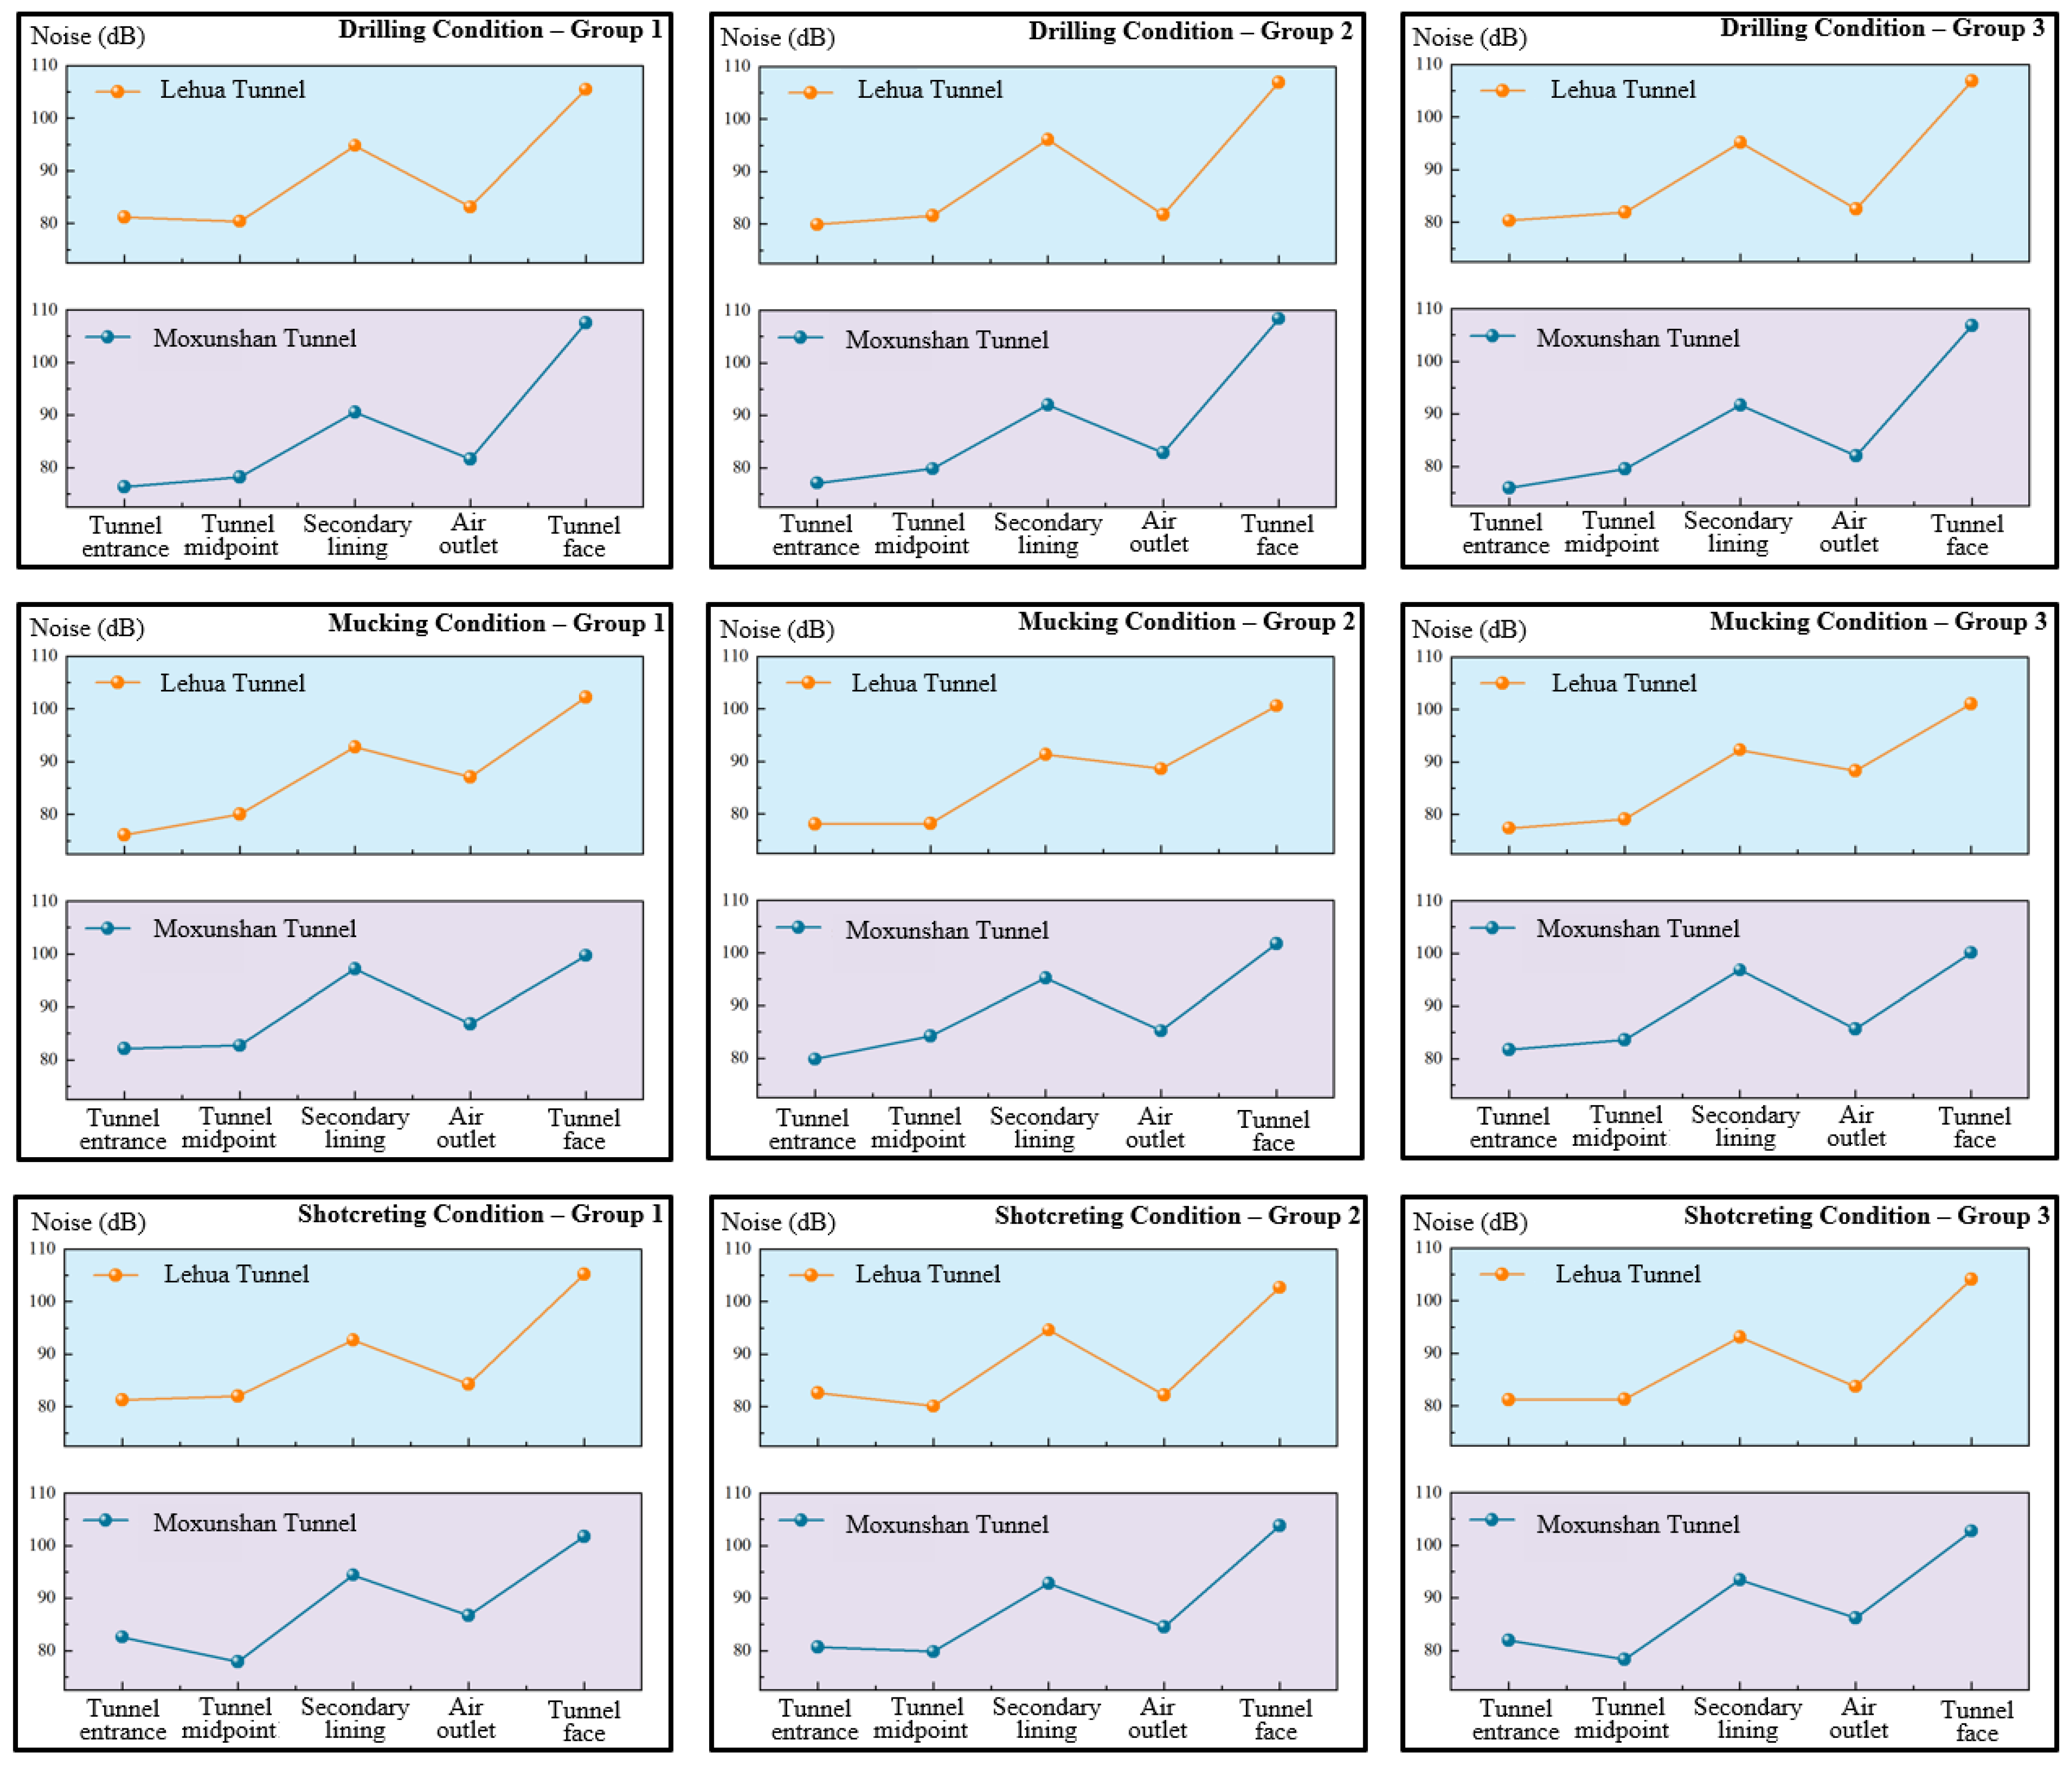
As shown in Figure 5, the noise variation trends under the three typical working conditions—drilling, mucking, and shotcreting—are generally consistent; therefore, no separate comparison between these conditions was conducted. In terms of spatial distribution, the noise level at the tunnel face is the highest, with multiple measurements exceeding 100 dB(A). This significantly surpasses the occupational noise exposure limits set by the International Labor Organization (ILO) and the World Health Organization (WHO)—typically 85 dB(A) for an 8 h workday—as well as the mandatory protection threshold of 90 dB(A) for 8 h of exposure established by the U.S. Occupational Safety and Health Administration (OSHA). Furthermore, noise levels are consistently above 80 dB(A) at the majority of the measurement points, indicating that the tunnel construction environment is generally exposed to high levels of noise. Prolonged exposure to such high-intensity noise can lead to hearing damage (e.g., noise-induced hearing loss), neurological fatigue, reduced attention, and slower reaction times, thereby significantly increasing the risk of operational errors and workplace accidents. This result highlights the urgent need for effective noise control and personal protection measures in tunnel construction.
Table 3 presents the statistical indicators of operational noise at different measurement locations in the Moxunshan and Lehua tunnels, including the mean, standard deviation, minimum, maximum, range, and median values.
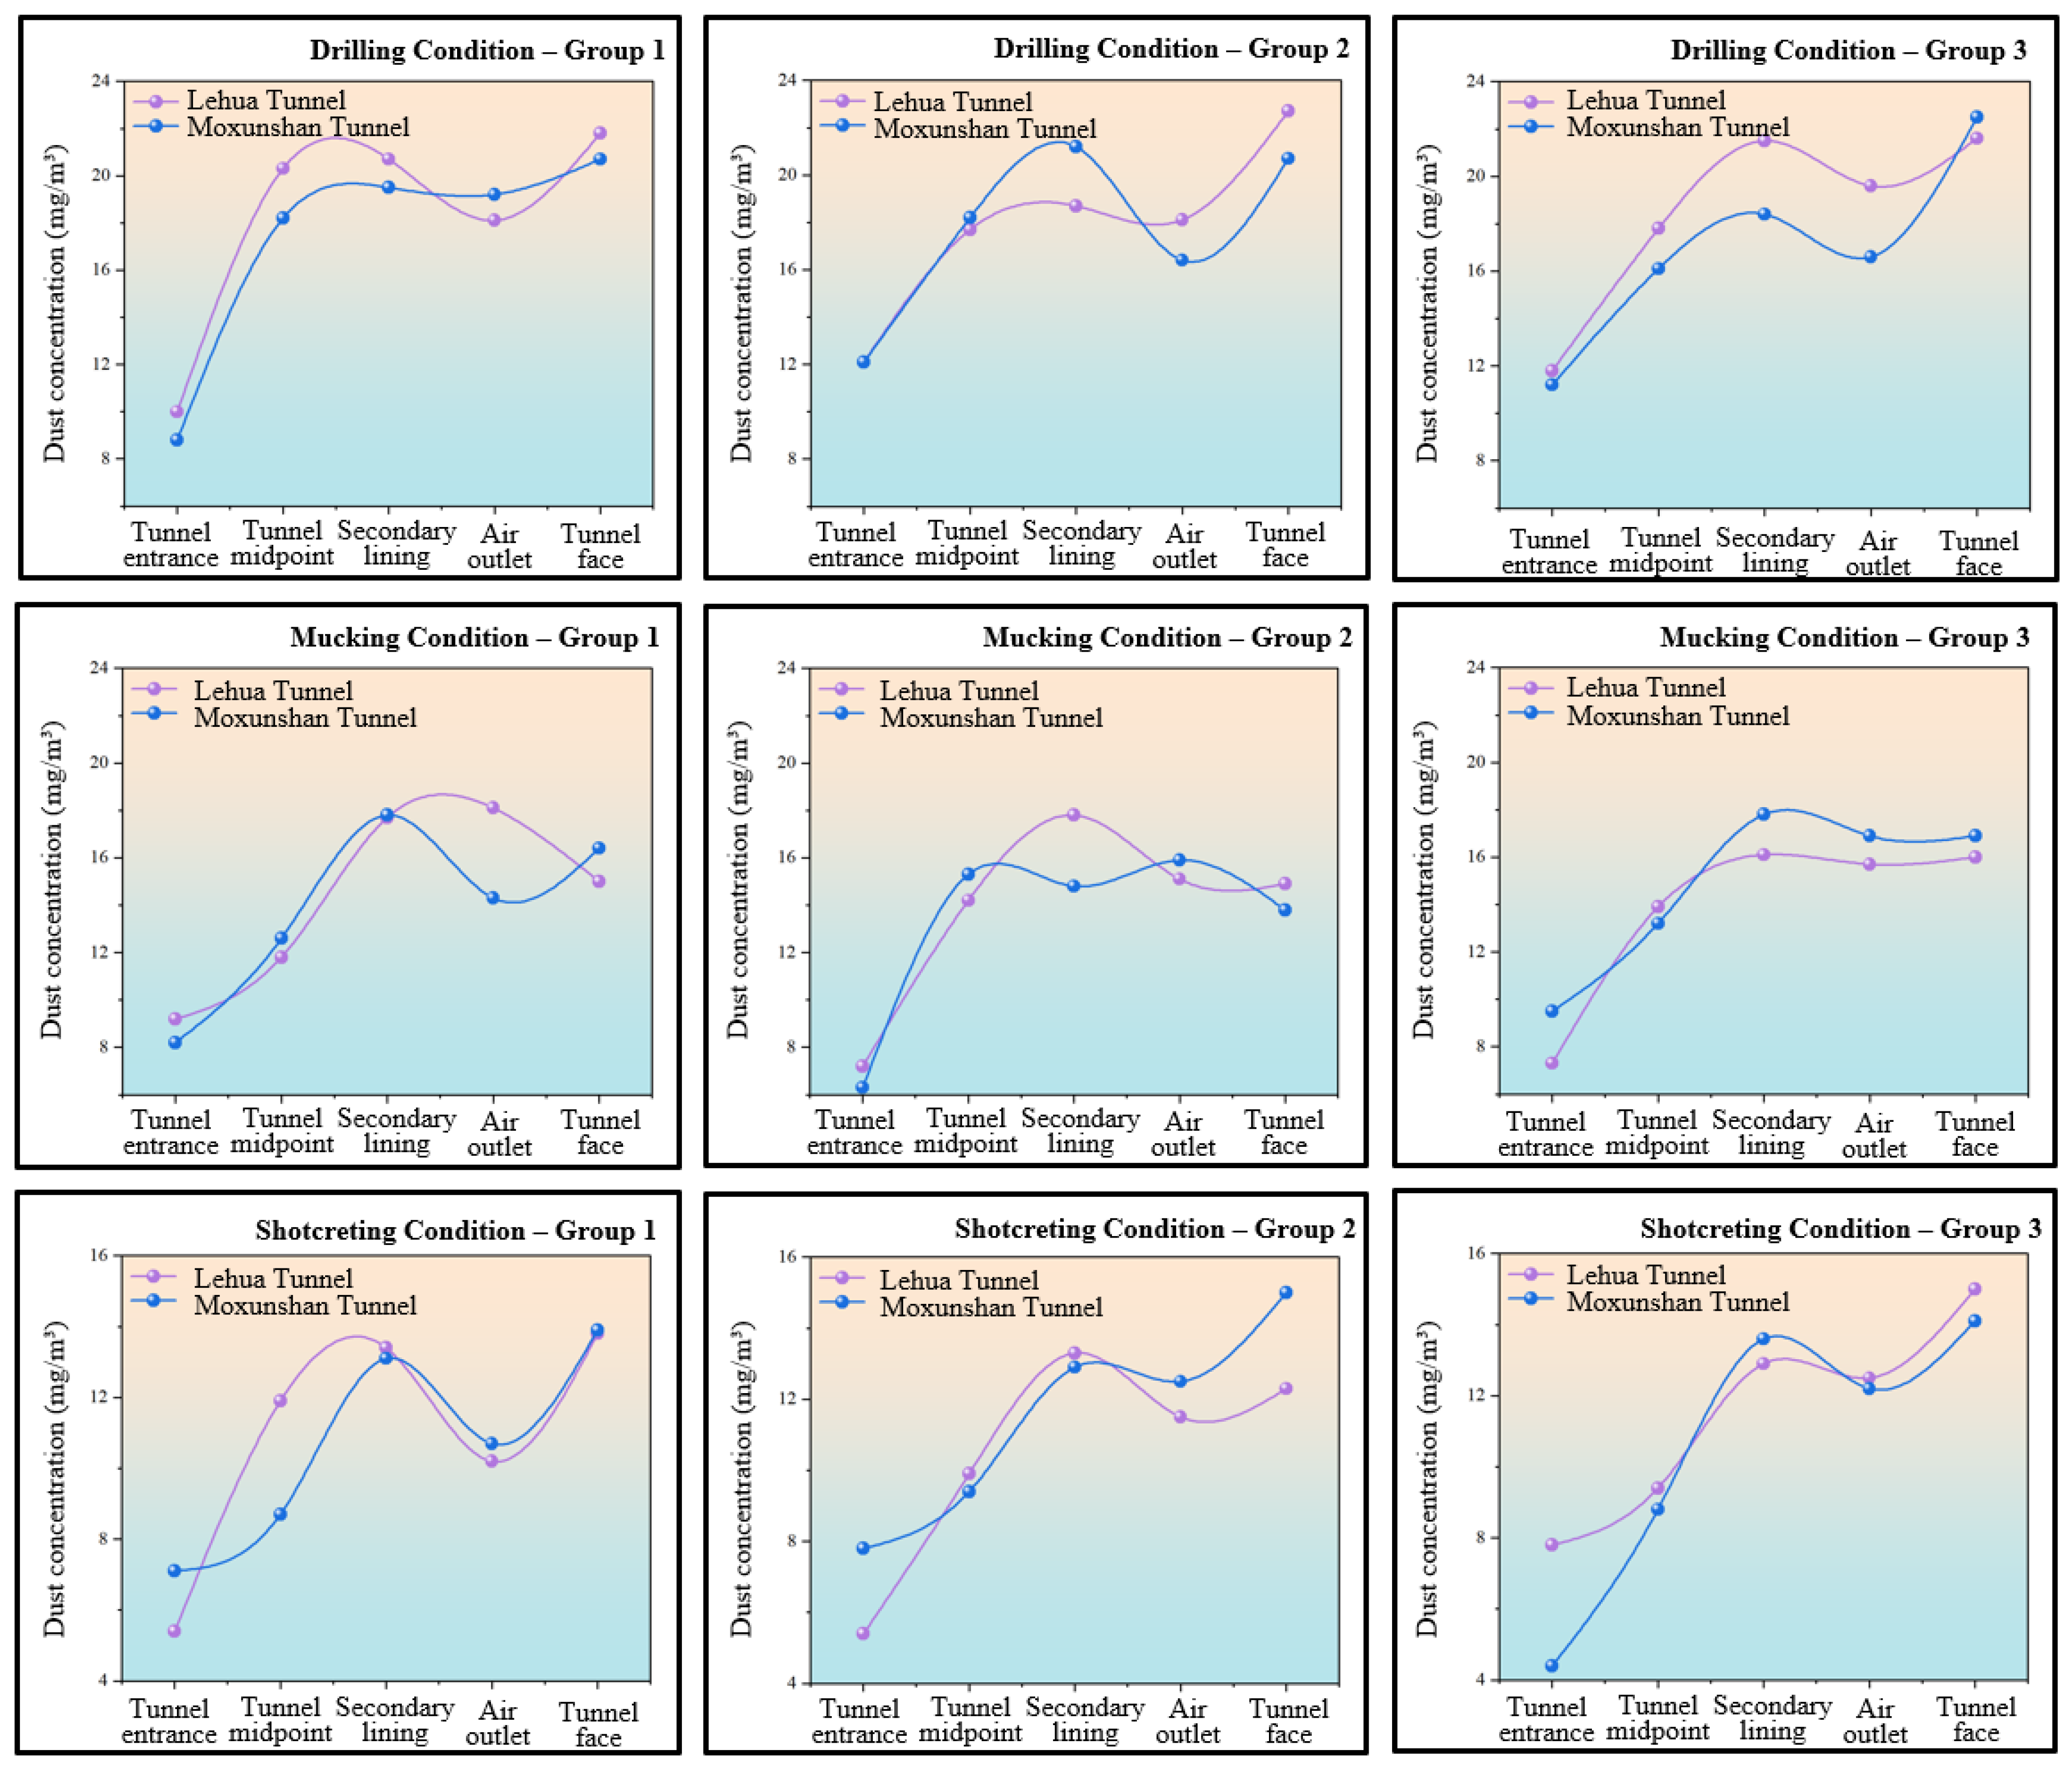
As shown in Figure 6, in terms of spatial distribution, dust concentration is highest at the tunnel face, reaching or exceeding 20 mg/m3. This level significantly exceeds the World Health Organization (WHO) recommended occupational exposure limit for dust (typically 10 mg/m3), posing a serious threat to workers’ respiratory health and overall well-being. In addition, the dust concentration in the secondary lining construction area remains relatively high. Although lower than that at the tunnel face, it still reaches levels considered harmful to human health. By contrast, dust concentrations at other monitoring points are relatively low, particularly near tunnel air outlets and in areas with effective airflow, where air quality shows noticeable improvement. Notably, the dust concentration trends under all three working conditions are generally consistent, characterized by localized high concentrations and overall fluctuations. Therefore, this study did not conduct a separate analysis of inter-condition differences. Prolonged exposure to such high concentrations of dust may pose risks to construction workers, including respiratory diseases (such as pneumoconiosis), impaired lung function, and even early-onset cardiovascular diseases. Furthermore, the impact of dust on task accuracy, attention, and reaction speed may also indirectly increase the incidence of operational accidents.
Table 4 presents the statistical indicators of operational dust concentration at different measurement locations in the Moxunshan and Lehua tunnels, including the mean, standard deviation, minimum, maximum, range, and median values.

2.4. Research Methods

To investigate the relationship between tunnel microenvironmental factors and construction workers’ unsafe behaviors in depth, multiple analytical methods were employed to examine the data. Statistical analysis and machine learning algorithms were integrated to enhance the scientific rigor and explanatory power of the research.
Initially, preliminary statistical analyses and cleaning processes were executed on the collected variable data using SPSS 27.0 software. These processes included missing value processing, outlier identification, and variable normality testing. On this basis, Pearson correlation coefficients were calculated to examine the bivariate associations between tunnel microenvironmental factors (such as temperature, humidity, noise, and dust concentration) and unsafe behaviors among construction workers.
Secondly, to identify the most influential microenvironmental variables affecting unsafe behavior, a random forest algorithm was employed for variable importance analysis. The model was implemented in a Python 3.10 environment using the Scikit-learn library, constructing multiple decision trees and incorporating out-of-bag (OOB) samples to estimate model accuracy. Variable importance was measured using the mean decrease in the Gini index, with factors ranked based on their influence. The reasons for selecting the random forest model are as follows: Firstly, random forest can effectively handle complex nonlinear relationships and higher-order interactions between variables, while also being robust to noisy data and outliers. Secondly, the model does not require extensive assumptions, allowing it to reveal potentially important variables. Finally, random forest improves model stability and generalization ability through cross-validation. Therefore, random forest was chosen as the primary modeling tool for this study to ensure the reliability and interpretability of the results.
After identifying the key variables, a nonlinear regression model was further developed to characterize the complex relationship between critical microenvironmental factors and unsafe behaviors. Considering the potential nonlinearity and interaction effects among variables, polynomial regression and support vector regression were primarily used for fitting, with cross-validation employed to assess the model’s stability and generalizability. Model performance was comprehensively evaluated using the coefficient of determination, root mean square error, and mean absolute error. The model with the best performance was ultimately selected for interpretation and prediction.
3. Results Analysis

3.1. Descriptive Statistics and Reliability Analysis

The data in this study were derived from participants’ self-reports, which may have introduced common method bias. When administering the survey to tunnel construction workers, the anonymity and confidentiality of the questionnaire were emphasized, and it was explained that the data would only be used for scientific research, in order to minimize common method bias. In addition, the Harman single-factor test was used to detect common method bias. The results show that three factors with eigenvalues greater than 1 were obtained without rotation analysis, with the first factor explaining 28.06% of the variance (less than 40%), indicating that there was no significant common method bias in this study.
To verify the reliability and construct validity of the questionnaire, internal consistency analysis and KMO testing were conducted. The Cronbach’s alpha coefficient was 0.782, indicating acceptable internal consistency. The Kaiser–Meyer–Olkin (KMO) measure of sampling adequacy was 0.812, and Bartlett’s test of sphericity was significant (p < 0.001), suggesting that the data were suitable for factor analysis. These statistical results demonstrate that the measurement instrument used in this study had good reliability and validity, supporting the robustness of the subsequent analysis.
The 17 variables were subjected to descriptive statistics and correlation analyses using SPSS 27.0 software, the results of which are displayed in Table 5. As illustrated in Table 5, a correlation existed between microenvironmental factors and unsafe behaviors. The findings indicated a significant and positive correlation between unsafe behaviors and temperature (r = 0.195, p < 0.05), noise (r = 0.338, p < 0.01), and dust concentration (r = 0.270, p < 0.01). These results suggest that poor microenvironmental conditions may directly contribute to an increase in the incidence of unsafe behaviors among construction workers. Among them, the association between noise and unsafe behavior was the most significant, suggesting that noise exposure may be an important environmental stressor affecting behavioral performance. In contrast, the correlation between humidity and unsafe behavior was not significant (r = 0.051, p > 0.05), suggesting that variations in humidity may have a limited role in the formation of behavioral risks.
Furthermore, anxiety showed a strong positive correlation with unsafe behavior (r = 0.519, p < 0.01), suggesting that mental health status may play a mediating role in the process by which the microenvironment affects behavior. However, given the weak correlation between stress and some environmental variables (e.g., humidity), it is more critical for this study to emphasize the direct path of action of microenvironmental factors on unsafe behaviors.
Further analysis indicated that, apart from key variables such as temperature, noise, dust concentration, and stress, most occupational characteristics and individual attributes exhibited low correlations with unsafe behavior. For example, variables such as length of service, monthly rest days, daily working hours, type of operation, and work location did not show significant correlations, suggesting that these occupational background factors have limited explanatory power for behavioral performance. In addition, the correlation coefficients of individual attribute variables, including height, weight, gender, marital status, and education level, were all below 0.1 and did not pass the test of significance. This finding indicates that these types of static individual characteristics are not the primary drivers of insecure behaviors in the current sample and scenario.
This finding further supports the research hypothesis that in dynamic and high-risk tunnel construction environments, environmental stressors are more likely than individual background attributes to trigger unsafe behavior. Therefore, future safety intervention strategies should focus on real-time monitoring of micro-environmental conditions, rather than allocating excessive resources to individual attributes that are difficult to modify.

3.2. Evaluation of Variable Importance in Influencing Unsafe Behavior

This study aimed to assess unsafe behaviors among tunnel construction workers and provide data support for safety research. The questionnaire design was based on Rafiq’s safety behavior questionnaire for construction workers, covering four dimensions: personal protective equipment, operational protocols, environmental interactions, and individual status. The questionnaire includes four questions: failure to wear necessary protective equipment, failure to operate equipment according to regulations, ignoring safety signs or warnings, and working while fatigued or ill. Each question was rated using a 10-point Likert scale (10, 8, 6, 4, 2). Finally, the total score of the four items was calculated to obtain the unsafe behavior score, which was then classified according to the predefined threshold [45,46,47].
To assess the relative importance of environmental and individual variables in influencing unsafe behaviors among construction workers, this study employed the random forest algorithm for quantitative variable importance analysis. Random forest is an ensemble learning method that constructs multiple decision trees and integrates their outputs to achieve robust predictive performance and assess the sensitivity to input variables. In this study, the occurrence of unsafe behavior was defined as the response variable, while temperature, humidity, noise, dust concentration, psychological stress, years of work experience, and daily working hours were used as input variables to construct a classification-based random forest (RF) model. The importance of each variable was quantified by the average reduction in Gini impurity resulting from its use in node splitting within the model, as measured by the “Mean Decrease in Gini” index. This metric reflects the contribution of each variable to the classification accuracy of unsafe behavior within the model. The resulting importance scores were used to rank the relative influence of variables, thereby identifying the key contributing factors.
As illustrated in Table 6, among all variables, the “stress” factor under psychological status exhibited the highest importance, with an IncMSE value reaching 57.99%, significantly surpassing other variables. This indicates that stress has the strongest predictive effect on unsafe behavior among construction workers. Construction workers are often exposed to high-intensity, high-risk work environments for extended periods. Their psychological stress stems from various sources, including tight project deadlines, interpersonal conflicts, fear of safety accidents, and prolonged work-related fatigue. Under high-pressure conditions, individuals are more prone to emotional fluctuations, distraction, and diminished self-control, which significantly increases the likelihood of unsafe behaviors. This finding is consistent with existing research, indicating that chronic stress not only weakens individuals’ safety decision-making and execution abilities but also may trigger harmful behaviors by interfering with physiological mechanisms such as sleep quality, anxiety levels, and hormone balance. That is, individuals’ psychological state significantly influences their unsafe behaviors, but this is not the focus of this study, so no further discussion will be carried out.
Tunnel microenvironmental factors demonstrated overall high importance in the model, especially dust concentration (22.56%) and noise (17.40%), which have particularly significant impacts on unsafe behaviors. High dust concentration not only poses long-term harm to the respiratory system but also disrupts work focus due to short-term discomforts (such as chest tightness, coughing, and blurred vision), further triggering irritability and resistance. Environmental psychology studies indicate that high concentrations of inhalable particulate matter suppress cognitive control and executive functions, increasing the risk of operational errors and rule violations. Noise is a typical acute stressor. High-decibel noise not only disrupts verbal communication but also triggers physiological stress responses (such as increased heart rate and cortisol secretion), which in turn affect the emotional state and cognitive efficiency of workers. Especially in narrow and enclosed tunnel spaces, the echo and superposition effects of noise are more pronounced, which can easily trigger irritability, fatigue, and decreased attention, thereby increasing the risk of unsafe operations.
Although the IncMSE values of humidity (15.02%) and temperature (9.21%) were lower than those of dust and noise, they still exert considerable influence on behavior in the specific context of tunnel construction. High-humidity environments can accelerate the onset of physical fatigue, causing skin discomfort, excessive sweating, and clothing adhesion among workers, thereby reducing comfort and impairing motor coordination. Relevant studies have also shown that hot and humid environments reduce workers’ tolerance and judgment, with particularly pronounced effects during summer construction activities. Temperature fluctuations should not be overlooked either: Low temperatures can cause physical stiffness and slowed reactions, while high temperatures may lead to heatstroke, dehydration, and other physiological issues, all of which can indirectly contribute to judgment errors or delayed responses. Especially under continuous construction conditions, the interaction between temperature and humidity significantly affects workers’ heat stress levels. Without timely adjustments to rest schedules and hydration strategies, this may further trigger unsafe behaviors. Therefore, although humidity and temperature may appear to be peripheral variables, they are in fact fundamental to ensuring operational comfort and stability.
In contrast, the IncMSE values of occupational characteristics and individual attribute variables were generally in the low to moderate range, indicating their relatively weak influence on unsafe behavior, though they may still hold significance in specific contexts. For instance, the findings indicate that both the educational level (12.27%) and the length of service (10.21%) have a significant moderating effect on behavior, suggesting that cognitive ability and professional experience continue to play a pivotal role in shaping outcomes. Experienced workers are generally better at identifying risks and taking preventive measures, while those with higher education levels are more likely to understand and comply with safety regulations.
With regard to individual physiological characteristics, the variable importance of height (18.21%) and weight (15.10%) was significantly higher than that of other individual attributes. This suggests that body size may indirectly influence the occurrence of unsafe behaviors by affecting operational comfort, spatial adaptability or body loading. For example, individuals with greater height or heavier weight may experience fatigue or unstable posture more easily in narrow or low-ceiling workspaces, thus increasing the risk of operational errors. In comparison, gender (3.21%) and respiratory diseases (1.71%) have a weaker impact on behavior, suggesting that such uncontrollable factors should not be the main focus of safety management interventions.
In the study of unsafe behaviors among tunnel construction workers, there is often a discrepancy between the results of correlation analysis and variable importance evaluation, a phenomenon commonly observed in high-level literature. Correlation analysis primarily reveals the linear or monotonic relationships between variables and unsafe behaviors, but it overlooks the influence of other variables and the interactions between variables. In contrast, the variable importance evaluation method can comprehensively consider the nonlinear relationships and synergistic effects between multiple variables, thereby assessing the relative explanatory power of each variable in the overall model. Therefore, some variables may not be significant in correlation analysis, but due to their interaction with other variables, they may have high importance in a complex model. This difference reflects that unsafe behavior is the result of the interaction of multiple factors, making it difficult to simply assess the influence of variables through a single indicator.

3.3. Nonlinear Impact of Tunnel Microenvironment on Unsafe Behaviors of Construction Workers

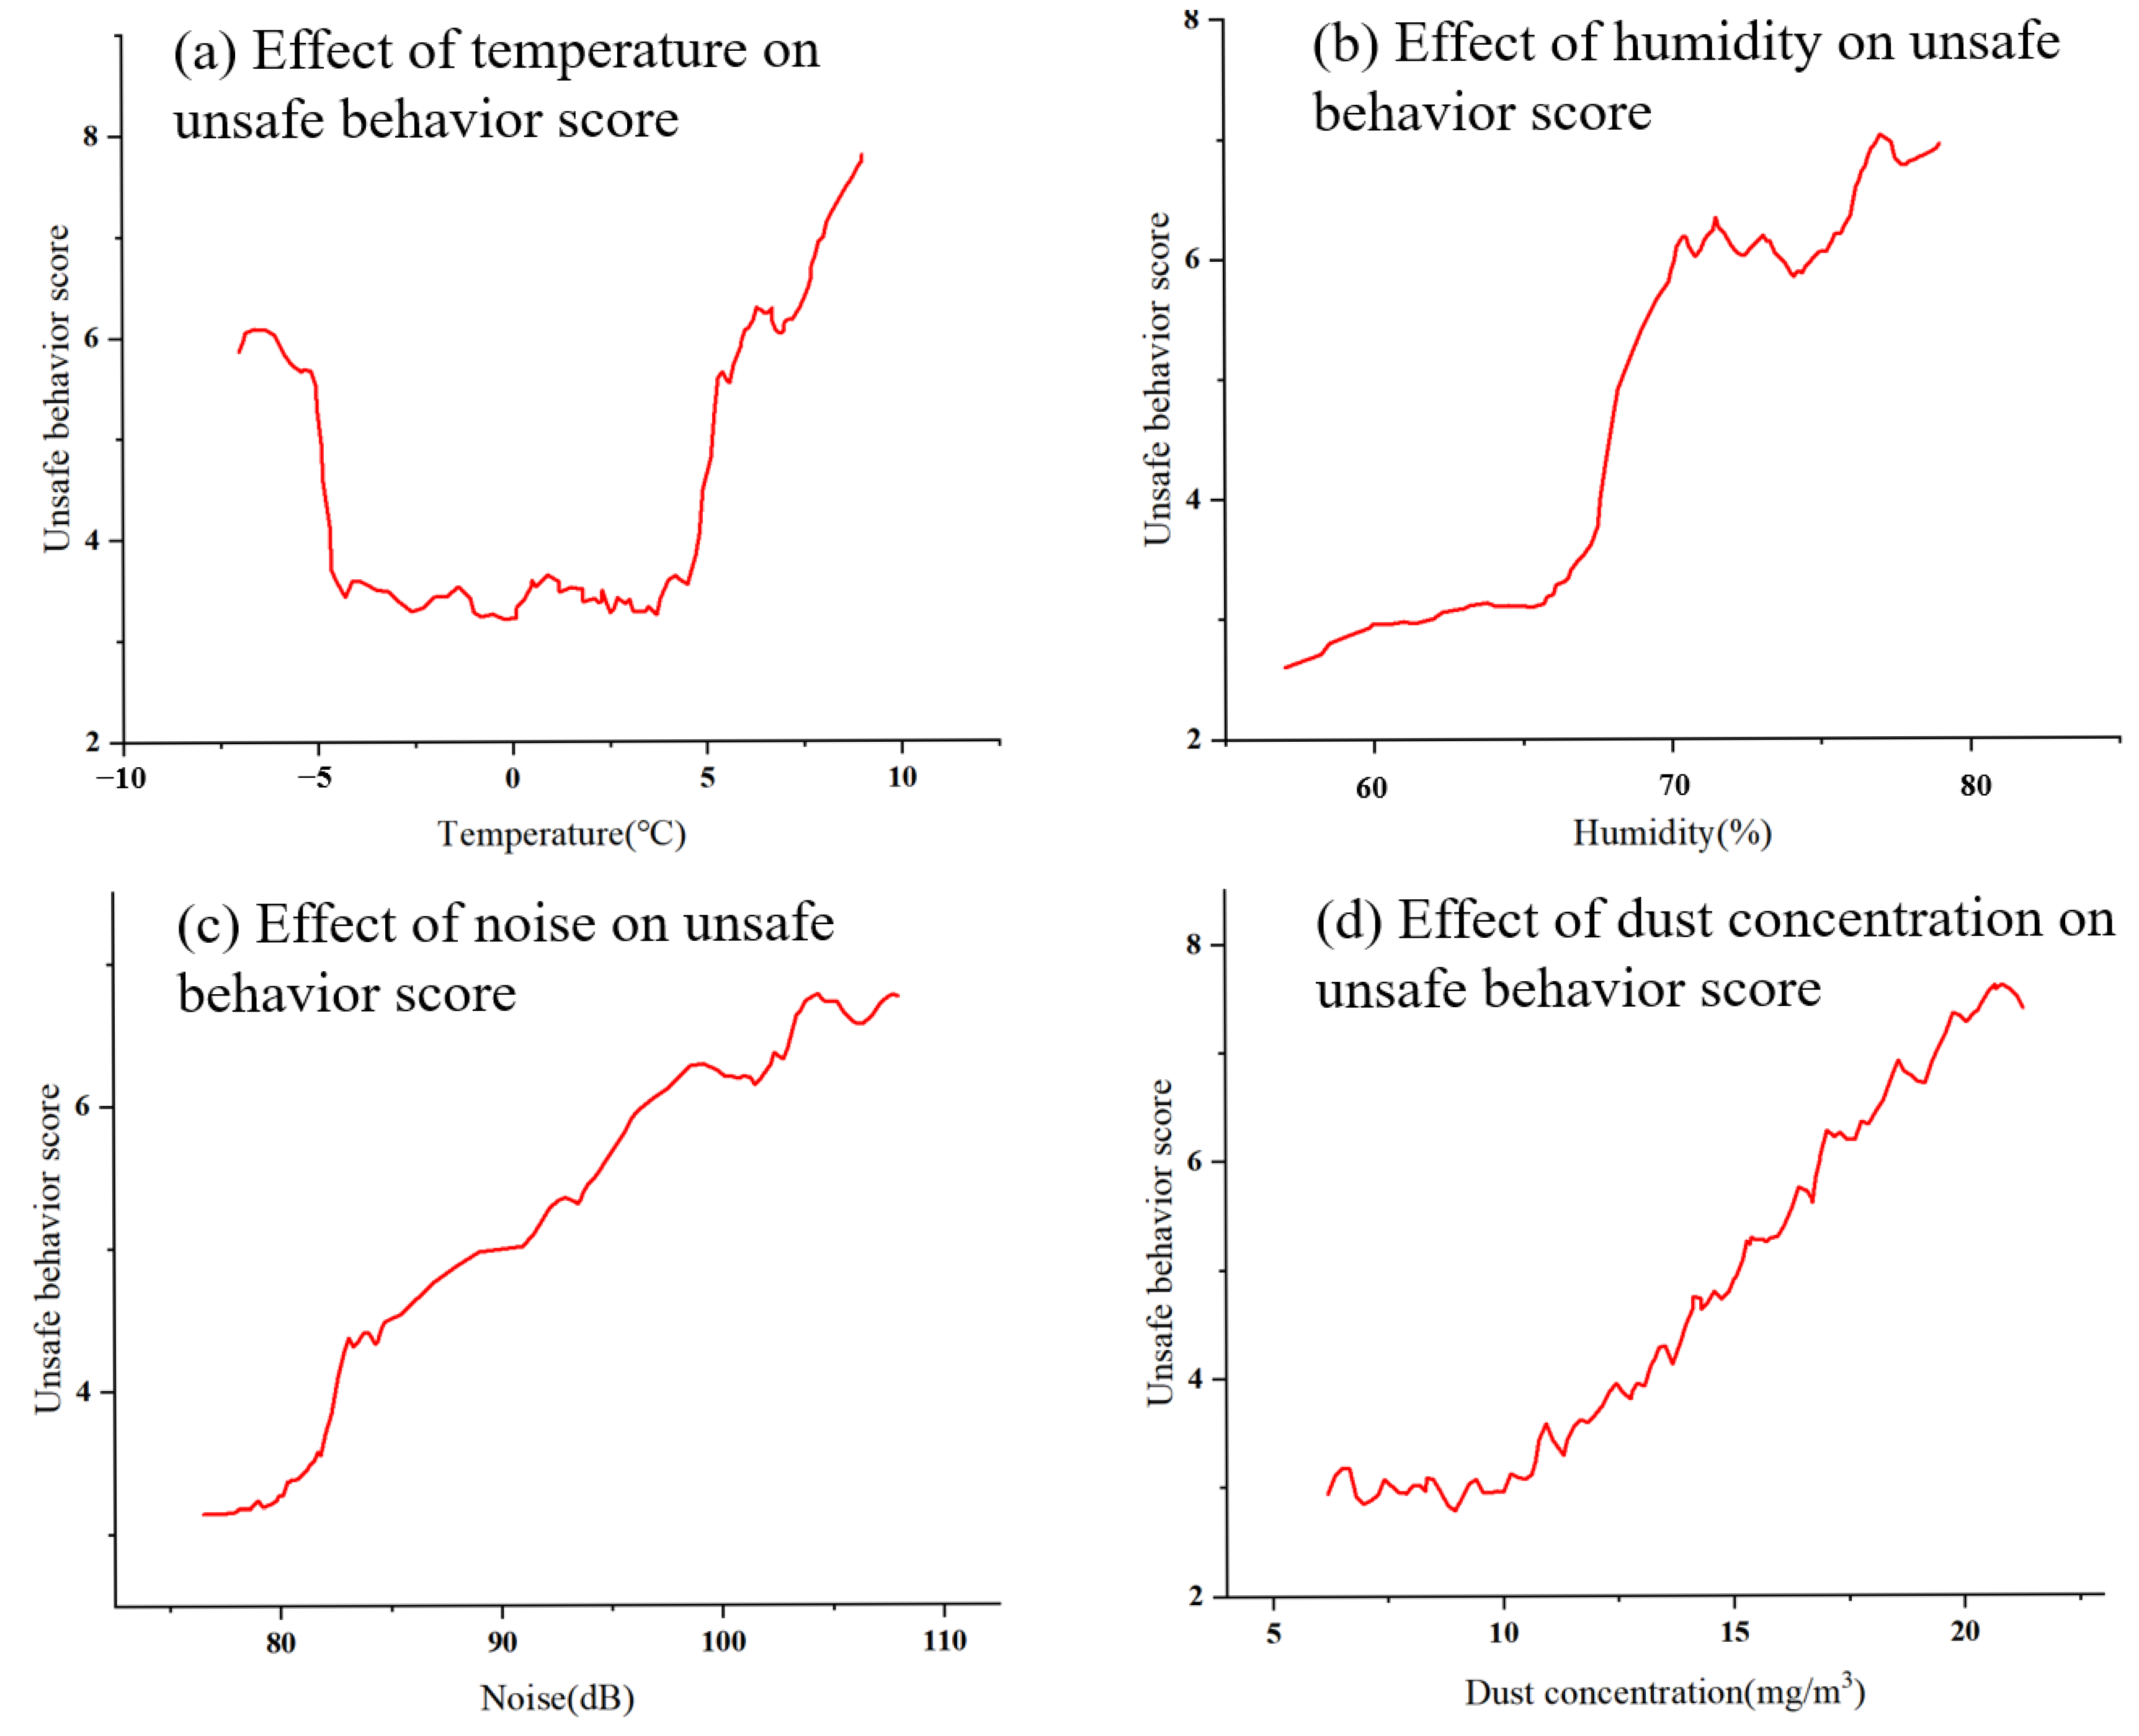
Figure 7 presents the nonlinear regression fitting results of the relationship between tunnel microenvironment variables and unsafe behaviors of construction workers. The results indicate that, when controlling for other variables in the model, the impact of microenvironmental factors on unsafe behavior exhibited significant non-linear and complex characteristics. Given that the obtained non-linear curve exhibited certain local fluctuations when reflecting the relationship between the two, subsequent analyses focused on understanding the overall trend to systematically explore the changing relationship between the microenvironment and unsafe behavior. In Figure 7, unsafe behavior scores are categorized into five levels—2, 4, 6, 8, and 10—corresponding to risk levels of none, low, moderate, high, and extremely high, respectively.
As demonstrated in Figure 7 (a), a U-shaped relationship is evident between temperature and unsafe behavior scores, whereby the scores initially decreased and subsequently increased. Collectively, the unsafe behavior scores decreased significantly as the temperature increased from approximately −10 °C to 0 °C, reaching a minimum level near 0 °C. Thereafter, as the temperature continued to increase above 10 °C, the unsafe behavior scores increased rapidly. This indicates that construction workers are more prone to unsafe behaviors in both low- and high-temperature conditions, while environments near 0 °C are more conducive to reducing the occurrence of such behaviors. Therefore, approximately 0 °C can be regarded as the optimal temperature range for minimizing unsafe behaviors, as both excessively high and low temperatures may increase the risk of such behaviors. This result is reasonable within the context of construction activities in cold regions. As the study area is located in a cold climate, outdoor temperatures are generally low, frequently remaining below 0 °C during the winter months. In such contexts, construction workers typically wear heavier and warmer attire. When the ambient temperature approaches 0 °C, it is neither cold enough to cause physical stiffness and delayed reactions, nor hot enough to induce excessive sweating or discomfort due to bulky clothing. Under such conditions, the body maintains a relatively stable thermal balance, which helps workers stay alert and focused, thereby reducing the likelihood of unsafe behaviors. When the temperature rises above 5 °C and even exceeds 10 °C, workers who continue to wear winter clothing are prone to heat-related discomforts, such as sweating, irritability, and reduced concentration. These physiological and psychological responses significantly impair cognitive function and operational focus, thereby increasing the risk of unsafe behaviors. Therefore, temperatures around 0 °C can be considered the “thermal comfort” threshold for construction workers in cold regions. Within this temperature range, their body and clothing are more likely to achieve a state of adaptive balance, thereby reducing the occurrence of unsafe behaviors.
As demonstrated in Figure 7 (b), there was a significant increase in unsafe behavior scores with increasing humidity, indicating a strong positive correlation between the two variables. Particularly, during the period when humidity gradually rose from 65% to 75%, the unsafe behavior score increased rapidly and fluctuated at a high level. This result indicates that when the humidity exceeds 65%, the tendency for unsafe behavior among construction workers significantly increases, possibly due to discomfort and reduced attention caused by the high-humidity environment. Therefore, controlling the operating environment humidity to between 60% and 65% helps reduce the occurrence of unsafe behaviors.
Figure 7 (c) shows a stable positive correlation trend between noise levels and unsafe behavior scores. The unsafe behavior scores exhibited an upward trend as the noise level increased from approximately 78 dB to 110 dB, with the rate of increase accelerating notably above 90 dB. This finding suggests that 82 dB may represent a critical threshold for noise-induced unsafe behavior, with a substantial increase in such behavior observed among construction workers at this level. Noise, as an environmental stressor, may disrupt cognitive judgment, increase psychological stress, and subsequently trigger unsafe behavior. Therefore, it is recommended to control the noise level in the working environment to below 78–82 dB.
As shown in Figure 7 (d), as the dust concentration increased from 5 mg/m3 to 20 mg/m3, the unsafe behavior score exhibited an almost linear increase, indicating a significant positive correlation between the two. Especially after the dust concentration exceeded 12 mg/m3, the rate of increase in the score accelerated significantly. This finding suggests that high-concentration dust environments may increase the risk of unsafe behaviors among construction workers through pathways that affect respiratory health, occlusion of vision, and discomfort at work. It is recommended to control the dust concentration in the work environment to below 10–12 mg/m3 to reduce the occurrence of unsafe behavior.
In summary, temperature, humidity, noise, and dust all have a significant impact on unsafe behavior among construction workers, with evident threshold effects. To provide a clearer understanding of the tunnel microenvironment parameters investigated in this study, Table 7 presents four major environmental factors: dust concentration, noise level, humidity, and temperature. It summarizes their specific impact on unsafe behavior, effect direction, optimal threshold range, relative importance, and influence degree. Optimizing microenvironmental conditions (e.g., controlling temperature near 0 °C, humidity to 60–65%, noise levels below 82 dB, and dust concentrations under 12 mg/m3) can effectively reduce the risk of unsafe behaviors in the workplace, providing an important basis for improving on-site safety management.

3.4. Tunnel Microenvironment Control and Behavioral Safety Optimization Strategy

In response to the harsh microenvironment, high work intensity, and prominent human-related risks commonly encountered in cold-region tunnel construction, this study proposes a systematic strategy for environmental optimization and safety management, grounded in on-site monitoring data and behavioral analysis. This strategy, based on three aspects—environmental control, microclimate regulation, and institutional support—aims to effectively reduce the probability of unsafe behaviors among workers while ensuring construction efficiency. It also seeks to enhance workers’ psychological adaptability, ultimately achieving the intrinsic safety and sustainable development goals of cold-region tunnel construction. The specific measures are as follows:
In terms of environmental control technology, it is recommended to introduce an integrated intelligent ventilation and efficient dust removal system to achieve dynamic and coordinated management of multiple sources of pollutants. Specifically, a high-pressure water curtain spraying system with intelligent sensing linkage can be used, in conjunction with real-time particulate concentration monitoring devices, to dynamically adjust spray intensity and frequency based on dust distribution, ensuring that the dust concentration is stably controlled below 12 mg/m3. At the same time, it is recommended to promote low-noise, low-vibration equipment and install local sound barriers or sound-absorbing materials to control the noise level in the construction area below 82 dB, thereby reducing environmental stress from the source. In addition, the system should incorporate a data feedback loop mechanism to enable automatic warning and regulation, providing technical support for dynamic environmental management.
In terms of microclimate regulation, considering the significant temperature fluctuations, with frequent alternation of local heat stress and cold exposure in cold-region tunnel construction environments, it is recommended to deploy intelligent local thermal regulation devices in areas with harsh microenvironments, such as the tunnel face. These devices could include infrared electric heating modules or thermal energy recovery insulation covers, which, in combination with a real-time temperature and humidity sensing system, automatically adjust the heating intensity to maintain a stable environment temperature as close to 0 °C as possible. Simultaneously, micro-mist humidifiers or air–water mixed spray systems should be introduced, with their placement optimized based on airflow simulation results, to maintain relative humidity between 60% and 65%. This will effectively reduce the impact of dry environments on workers’ respiratory systems and psychological state.
In terms of institutional design and standard integration, the key microenvironmental safety thresholds proposed in this study (such as temperature, humidity, noise, and dust concentration) are recommended to be incorporated into the safety standards system for cold-region tunnel construction. These thresholds should serve as key indicators for construction organization design, dynamic safety assessment, and the formulation of environmental control measures. Concurrently, the development of a data-driven multi-field coupled safety assessment model should be promoted. This model can be used to guide the implementation of the phased construction environment regulation strategy and to enhance the ability to guarantee the intrinsic safety of tunneling projects at the institutional level.

4. Conclusions

This study uses two tunnels under construction in cold regions as samples, combining on-site environmental monitoring, worker behavior scoring, and random forest modeling to systematically reveal the nonlinear impact mechanisms of tunnel microenvironments on unsafe behaviors. Field monitoring results indicate significant spatial variations in the tunnel’s internal environmental parameters: Dust concentration in the tunnel face area generally exceeded 20 mg/m3, noise levels were repeatedly measured above 100 dB(A), and it was the hottest area of the tunnel. The highest humidity levels, however, were observed in the tunnel midpoint. The areas of extreme environmental conditions overlapped significantly with the regions of frequent unsafe behaviors, suggesting that tunnel microenvironmental factors may be a key trigger for behavioral deviations.
The study indicates a clear “threshold–effect” relationship between temperature, humidity, noise, dust concentration, and unsafe behaviors. Specifically, temperature exhibits a “U-shaped” impact on unsafe behaviors, with the lowest behavioral risk occurring around 0 °C; humidity within the range of 60% to 65% is most conducive to normative behavior; and both noise levels exceeding 82 dB and dust concentrations above 12 mg/m3 significantly increase the risk of unsafe behaviors. Variable importance analysis shows that dust concentration is the most critical influencing factor, followed by noise, humidity, and temperature. This indicates that the behavioral safety of construction workers is significantly affected by physiological load and psychological stress.
The environmental sensitivity thresholds proposed in this study provide a quantitative basis for environmental regulation and risk prevention in cold-region tunnel construction sites. It is recommended to maintain the temperature in the construction area around 0 °C, control humidity to between 60% and 65%, limit noise levels to below 82 dB, and keep dust concentration under 12 mg/m3. Additionally, a dynamic monitoring and intelligent early warning system should be implemented to enhance the safety of the working environment.
Previous studies on tunnel construction environments have often described environmental factors in vague terms, such as simply referring to “high temperature,” “humidity,” or “dust,” without specific quantification of key parameters. Moreover, limited attention has been paid to their actual impact on workers’ behaviors [7,14]. This has, to some extent, limited the practical applicability of related research findings in guiding on-site safety management. In contrast, this study collected detailed tunnel microenvironmental data through on-site monitoring and integrated them with unsafe behavior scores and machine learning-based variable importance analysis. The results systematically identified temperature, humidity, dust, and noise as the key environmental factors influencing unsafe behaviors, and corresponding microenvironmental risk thresholds were further proposed.
Despite the progress made in this study, there are still limitations. Firstly, the study sample includes only two cold-region tunnels, limiting its spatial representativeness and making it insufficient to fully represent other geographic areas or types of operations. Secondly, the behavioral data primarily rely on subjective questionnaire ratings, which may be influenced by cognitive biases or response effects. Thirdly, whether the proposed methodology and framework are applicable to non-frigid or tropical regions warrants further investigation.
Overall, this study fills the research gap regarding the influence of cold-region tunnel microenvironments on worker behavior, highlighting the importance of nonlinear modeling and variable interactions. In the future, integrating physiological and psychological monitoring data could further deepen the study of the “environment–physiology–psychology–behavior” coupling mechanism, providing scientific decision support for construction safety management under different climatic conditions.

Author Contributions

S.Z.: conceptualization, investigation, data curation, writing. H.S.: review, validation, writing, funding acquisition. Y.J.: investigation, validation. X.N.: investigation, supervision. M.K.: literature, investigation. Z.L.: data curation. All authors have read and agreed to the published version of the manuscript.

Funding

We appreciate all valuable and helpful comments from editor and reviewers. This work was supported by the Natural Science Basic Research Program of Shaanxi Province (Youth Project) (2024JC-YBQN-0519).

Institutional Review Board Statement

Prior to data collection, informed consent was obtained from all participants or their legal guardians, as appropriate, ensuring that their rights and welfare were protected throughout the research process.

Informed Consent Statement

Informed consent was obtained from all subjects involved in the study. All participants in the study provided their informed consent.

Data Availability Statement

If requested, the corresponding author can make the data presented in this study available.

Conflicts of Interest

The authors declare no conflict of interest.

References

  1. Silvestre, B.S.; Ţîrcă, D.M. Innovations for sustainable development: Moving toward a sustainable future. J. Clean. Prod. 2019, 208, 325–332. [Google Scholar] [CrossRef]
  2. Broman, G.I.; Robèrt, K.H. A framework for strategic sustainable development. J. Clean. Prod. 2017, 140, 17–31. [Google Scholar] [CrossRef]
  3. Hák, T.; Janoušková, S.; Moldan, B. Sustainable Development Goals: A need for relevant indicators. Ecol. Indic. 2016, 60, 565–573. [Google Scholar] [CrossRef]
  4. Lim, S.; Chi, S.; Lee, J.D.; Lee, H.J.; Choi, H. Analyzing psychological conditions of field-workers in the construction industry. Int. J. Occup. Environ. Health 2017, 23, 261–281. [Google Scholar] [CrossRef] [PubMed]
  5. Oluwole, A.P.; Olaniran, F.O. Empirical analysis of the determinants of environmentally sustainable practices in the UK construction industry. Constr. Innov. 2013, 13, 352–373. [Google Scholar] [CrossRef]
  6. Sun, Y.P.; Zhu, N. Study on assessment of high temperature and humidity in working environment on human health. Adv. Mater. Res. 2013, 610, 739–742. [Google Scholar] [CrossRef]
  7. Chen, X.; Guo, C.; Song, J.; Wang, X.; Cheng, J. Occupational health risk assessment based on actual dust exposure in a tunnel construction adopting roadheader in Chongqing, China. Build. Environ. 2019, 165, 106415. [Google Scholar] [CrossRef]
  8. Yunpeng, H.; Mingnian, W.; Qiling, W.; Dagang, L.; Jianjun, T. Field test of thermal environment and thermal adaptation of workers in high geothermal tunnel. Build. Environ. 2019, 160, 106174. [Google Scholar] [CrossRef]
  9. Li, Q.; Zhang, D.; Zhang, J. Study on the influence of individual characteristics and environment on unsafe behavior of construction workers. Proj. Manag. Technol. 2023, 21, 147–154. (In Chinese) [Google Scholar]
  10. Ye, Y.; Zang, Z. Impact of underground environmental factors on spot personnel behavior. Nonferr. Met. 2001, 53, 6–9. (In Chinese) [Google Scholar]
  11. Mantler, A.; Logan, A.C. Natural environments and mental health. Adv. Integr. Med. 2015, 2, 5–12. [Google Scholar] [CrossRef]
  12. Cianconi, P.; Betrò, S.; Janiri, L. The impact of climate change on mental health: A systematic descriptive review. Front. Psychiatry 2020, 11, 490206. [Google Scholar] [CrossRef]
  13. Wang, C.; Wang, J.; Wang, X.; Yu, H.; Bai, L.; Sun, Q. Exploring the impacts of factors contributing to unsafe behavior of coal miners. Saf. Sci. 2019, 115, 339–348. [Google Scholar] [CrossRef]
  14. Dodoo, J.E.; Al-Samarraie, H. Factors leading to unsafe behavior in the twenty first century workplace: A review. Manag. Rev. Q. 2019, 69, 391–414. [Google Scholar] [CrossRef]
  15. Eaves, S.; Gyi, D.E.; Gibb, A.G.F. Building healthy construction workers: Their views on health, wellbeing and better workplace design. Appl. Ergon. 2016, 54, 10–18. [Google Scholar] [CrossRef] [PubMed]
  16. Li, X.; Chow, K.H.; Zhu, Y.; Lin, Y. Evaluating the impacts of high-temperature outdoor working environments on construction labor productivity in China: A case study of rebar workers. Build. Environ. 2016, 95, 42–52. [Google Scholar] [CrossRef]
  17. Shi, X.; Zhu, N.; Zheng, G. The combined effect of temperature, relative humidity and work intensity on human strain in hot and humid environments. Build. Environ. 2013, 69, 72–80. [Google Scholar] [CrossRef]
  18. Galea, K.S.; Mair, C.; Alexander, C.; De, V.F.; van Tongeren, M. Occupational exposure to respirable dust, respirable crystalline silica and diesel engine exhaust emissions in the London tunnelling environment. Ann. Occup. Hyg. 2016, 60, 263–269. [Google Scholar] [CrossRef]
  19. Alasamri, H.; Chrisp, M.T.; Bowles, G. A framework for enhancing and improving the safety culture on Saudi construction sites. In Proceedings of the the 28th Annual ARCOM Conference, Association of Researchers in Construction Management, Edinburgh, UK, 3–5 September 2012; pp. 475–485. [Google Scholar]
  20. Sanni-Anibire, M.O.; Mahmoud, A.S.; Hassanain, M.A.; Salami, B.A. A risk assessment approach for enhancing construction safety performance. Saf. Sci. 2020, 121, 15–29. [Google Scholar] [CrossRef]
  21. Al-Bayati, A.J. Impact of construction safety culture and construction safety climate on safety behavior and safety motivation. Safety 2021, 7, 41. [Google Scholar] [CrossRef]
  22. Zhou, W.; Whyte, J.; Sacks, R. Construction safety and digital design: A review. Autom. Constr. 2012, 22, 102–111. [Google Scholar] [CrossRef]
  23. Strzemecka, J.; Gozdziewska, M.; Skrodziuk, J. Factors of work environment hazardous for health in opinions of employees working underground in the ‘Bogdanka’coal mine. Ann. Agric. Environ. Med. 2019, 26, 409–414. [Google Scholar] [CrossRef]
  24. Farbu, E.H.; Skandfer, M.; Nielsen, C.; Brenn, T.; Stubhaug, A.; Höper, A.C. Working in a cold environment, feeling cold at work and chronic pain: A cross-sectional analysis of the Tromsø Study. BMJ Open 2019, 9, e031248. [Google Scholar] [CrossRef]
  25. Skandfer, M.; Talykova, L.; Brenn, T.; Nilsson, T.; Vaktskjold, A. Low back pain among mineworkers in relation to driving, cold environment and ergonomics. Ergonomics 2014, 57, 1541–1548. [Google Scholar] [CrossRef]
  26. Renberg, J.; Wiggen, Ø.N.; Tvetene, P.Ø.S.; Færevik, H.; Van Beekvelt, M.; Roeleveld, K. Effect of working position and cold environment on muscle activation level and fatigue in the upper limb during manual work tasks. Int. J. Ind. Ergon. 2020, 80, 103035. [Google Scholar] [CrossRef]
  27. Sun, H.; Zhang, S.; Jiang, Y.; Nie, X.; Kuang, M.; Liu, Z. The Impact of the Tunnel Micro-Environment on Workers’ Behavior: Considering the Mediating Role of Mental Health. Sustainability 2025, 17, 2631. [Google Scholar] [CrossRef]
  28. Wang, X.; Chen, R.; Liu, G.; Han, C.; Yang, Y.; Song, Y.; Zheng, Q. Response of low flows under climate warming in high-altitude permafrost regions in western China. Hydrol. Process. 2019, 33, 66–75. [Google Scholar] [CrossRef]
  29. Wang, Z.; Wang, Q.; Wu, X.; Zhao, L.; Yue, G.; Nan, Z.; Shi, J. Vegetation changes in the permafrost regions of the Qinghai-Tibetan Plateau from 1982–2012: Different responses related to geographical locations and vegetation types in high-altitude areas. PLoS ONE 2017, 12, e0169732. [Google Scholar] [CrossRef]
  30. Cheng, G.; Jin, H. Permafrost and groundwater on the Qinghai-Tibet Plateau and in northeast China. Hydrogeol. J. 2013, 21, 5–23. [Google Scholar] [CrossRef]
  31. Cuo, L.; Zhang, Y.; Bohn, T.J.; Zhao, L.; Li, J.; Liu, Q.; Zhou, B. Frozen soil degradation and its effects on surface hydrology in the northern Tibetan Plateau. J. Geophys. Res. Atmos. 2015, 120, 8276–8298. [Google Scholar] [CrossRef]
  32. Gao, T.; Zhang, T.; Cao, L.; Kang, S.; Sillanpää, M. Reduced winter runoff in a mountainous permafrost region in the northern Tibetan Plateau. Cold Reg. Sci. Technol. 2016, 126, 36–43. [Google Scholar] [CrossRef]
  33. Zhao, S.; Wen, S.; Guo, Y.; Sun, B.; Chen, W.; Wang, S.; Guo, C. Impact of altitude on worker health and project efficiency in tunnel construction. Int. J. Ind. Ergon. 2025, 105, 103694. [Google Scholar] [CrossRef]
  34. Jun, K.J.; Hwang, Y.C.; Yune, C.Y. Field measurement of temperature inside tunnel in winter in Gangwon, Korea. Cold Reg. Sci. Technol. 2017, 143, 32–42. [Google Scholar] [CrossRef]
  35. Zhao, P.; Chen, J.; Luo, Y.; Li, Y.; Chen, L.; Wang, C.; Hu, T. Field measurement of air temperature in a cold region tunnel in northeast China. Cold Reg. Sci. Technol. 2020, 171, 102957. [Google Scholar] [CrossRef]
  36. Wen, T.; Hu, Z.; Wang, Y.; Zhang, Z.; Sun, J. Monitoring and analysis of geotemperature during the tunnel construction. Energies 2022, 15, 736. [Google Scholar] [CrossRef]
  37. Ren, T.; Li, A.; Lv, W. Field and laboratory tests and analyses on temperature and relative humidity in underground multi-tunnels. Procedia Eng. 2017, 205, 27–34. [Google Scholar] [CrossRef]
  38. Tai, C.; Tian, G.; Lei, W.; Wang, J. A field measurement of temperature and humidity in a utility tunnel and a brief analysis of the exhaust heat recovery system. Indoor Built Environ. 2021, 30, 487–501. [Google Scholar] [CrossRef]
  39. Chen, X.; Zhou, X.; Wang, Y.; Liang, N.; Xu, B. Study on ambient temperature and humidity in the construction tunnel under the influence of ventilation and hot water gushing. Tunn. Undergr. Space Technol. 2024, 143, 105501. [Google Scholar] [CrossRef]
  40. Katalin, Á. Studying noise measurement and analysis. Procedia Manuf. 2018, 22, 533–538. [Google Scholar] [CrossRef]
  41. Lokhande, S.K.; Kale, V.B.; Jain, M.C. Road tunnel noise: Monitoring, prediction and evaluation of noise-induced hearing loss. Environ. Sci. Pollut. Res. 2023, 30, 86338–86351. [Google Scholar] [CrossRef]
  42. Liu, C.; Nie, W.; Bao, Q.; Liu, Q.; Wei, C.; Hua, Y. The effects of the pressure outlet’s position on the diffusion and pollution of dust in tunnel using a shield tunneling machine. Energy Build. 2018, 176, 232–245. [Google Scholar] [CrossRef]
  43. Xu, J.; Guo, C.; Yu, L. Factors influencing and methods of predicting greenhouse gas emissions from highway tunnel construction in southwestern China. J. Clean. Prod. 2019, 229, 337–349. [Google Scholar] [CrossRef]
  44. Xu, J.; Guo, C.; Chen, X.; Zhang, Z.; Yang, L.; Wang, M.; Yang, K. Emission transition of greenhouse gases with the surrounding rock weakened–A case study of tunnel construction. J. Clean. Prod. 2019, 209, 169–179. [Google Scholar] [CrossRef]
  45. Choudhry, R.M.; Fang, D. Why operatives engage in unsafe work behavior: Investigating factors on construction sites. Saf. Sci. 2008, 46, 566–584. [Google Scholar] [CrossRef]
  46. Asilian-Mahabadi, H.; Khosravi, Y.; Hassanzadeh-Rangi, N.; Hajizadeh, E.; Behzadan, A.H. Factors affecting unsafe behavior in construction projects: Development and validation of a new questionnaire. Int. J. Occup. Saf. Ergon. 2020, 26, 219–226. [Google Scholar] [CrossRef]
  47. Zhu, J.; Wang, X.; Yang, L.; Qin, Z.; Geng, J.; Zhang, X. Research on the construction of a comprehensive evaluation model of psychological factors in coal mine workers’ safety: Investigation and analysis of 1500 miners in east China. Front. Public Health 2022, 10, 849733. [Google Scholar] [CrossRef]
Figure 1. Research framework of the impact of tunnel microenvironment on unsafe behaviors of tunnel construction workers.
Buildings 15 03155 g001
Figure 2. Permafrost distribution in Xinjiang and Qinghai Provinces, China.
Buildings 15 03155 g002
Figure 3. Temperature distribution.
Buildings 15 03155 g003
Figure 4. Humidity distribution.
Buildings 15 03155 g004
Figure 5. Noise distribution characteristics.
Buildings 15 03155 g005
Figure 6. Spatial distribution of dust concentration.
Buildings 15 03155 g006
Figure 7. Nonlinear regression fitting results of tunnel microenvironment and unsafe behaviors of construction workers.
Buildings 15 03155 g007
Table 1. Summary statistics of temperature data at different measurement locations in the Moxunshan and Lehua tunnels.
Temperature (1—Moxunshan Tunnel, 2—Lehua Tunnel)Mean (°C)Standard Deviation (°C)Minimum (°C)Maximum (°C)Range (°C)Median (°C)
Tunnel entrance (drilling)1−4.71.2−6.2−3.23.0−4.9
2−6.91.4−8.4−5.33.1−6.7
Tunnel midpoint (drilling)12.30.91.03.52.52.2
20.31.1−0.82.02.80.7
Secondary lining (drilling)17.91.36.59.22.77.8
26.11.04.87.52.76.4
Air outlet (drilling)16.60.85.88.02.27.1
24.90.73.86.12.34.7
Tunnel face (drilling)19.01.07.610.63.08.7
26.30.95.47.82.46.2
Tunnel entrance (mucking)1−5.41.0−6.9−4.12.8−5.2
2−7.40.6−8.5−6.81.7−7.6
Tunnel midpoint (mucking)12.71.21.54.63.13.0
20.41.0−0.81.92.70.3
Secondary lining (mucking)17.51.06.29.02.87.3
25.71.14.37.22.95.9
Air outlet (mucking)16.41.35.07.92.96.1
24.50.93.56.12.64.4
Tunnel face (mucking)18.61.27.310.12.88.9
27.01.25.99.13.27.1
Tunnel entrance (shotcreting)1−4.90.5−6.1−5.01.1−4.8
2−6.70.6−7.8−6.21.6−6.9
Tunnel midpoint (shotcreting)12.51.01.64.32.72.6
20.70.8−0.32.12.40.8
Secondary lining (shotcreting)17.71.26.29.43.27.5
25.31.14.17.02.95.2
Air outlet (shotcreting)17.10.86.48.82.47.3
24.70.93.86.22.44.9
Tunnel face (shotcreting)18.80.97.910.52.68.7
27.11.16.09.03.07.0
Table 2. Summary statistics of humidity data at different measurement locations in the Moxunshan and Lehua tunnels.
Humidity (1—Moxunshan Tunnel, 2—Lehua Tunnel)Mean (%)Standard Deviation (%)Minimum (%)Maximum (%)Range (%)Median (%)
Tunnel entrance (drilling)165.71.663.867.03.265.5
257.01.755.859.13.357.3
Tunnel midpoint (drilling)175.52.172.977.04.175.2
276.31.974.277.93.776.0
Secondary lining (drilling)167.61.566.069.13.167.3
268.81.866.570.03.568.7
Air outlet (drilling)159.31.657.760.83.159.5
261.71.360.262.82.661.5
Tunnel face (drilling)174.31.972.576.23.774.5
270.11.668.471.53.170.2
Tunnel entrance (mucking)158.21.456.759.52.858.3
262.11.660.363.53.262.0
Tunnel midpoint (mucking)176.71.374.977.62.776.5
274.32.072.176.03.974.2
Secondary lining (mucking)164.81.563.266.12.964.7
264.51.762.866.23.464.7
Air outlet (mucking)164.91.763.166.53.464.7
257.71.655.959.23.357.6
Tunnel face (mucking)176.91.874.778.33.676.8
273.11.871.074.53.573.0
Tunnel entrance (shotcreting)165.11.463.666.52.965.0
266.81.766.068.12.166.8
Tunnel midpoint (shotcreting)170.41.768.772.13.470.2
268.92.866.970.93.969.5
Secondary lining (shotcreting)170.41.868.572.23.770.5
266.51.364.468.33.966.5
Air outlet (shotcreting)162.71.561.164.02.962.8
264.52.763.765.72.164.5
Tunnel face (shotcreting)166.01.664.467.63.266.0
270.92.268.672.84.270.2
Table 3. Summary statistics of noise data at different measurement locations in the Moxunshan and Lehua tunnels.
Noise (1—Moxunshan Tunnel, 2—Lehua Tunnel)Mean (dB)Standard Deviation (dB)Minimum (dB)Maximum (dB)Range (dB)Median (dB)
Tunnel entrance (drilling)176.52.173.879.25.476.3
280.52.377.183.66.580.2
Tunnel midpoint (drilling)179.02.575.582.36.878.7
281.02.078.183.85.781.1
Secondary lining (drilling)191.23.286.595.08.591.5
295.53.590.899.68.895.2
Air outlet (drilling)182.12.778.685.46.882.0
282.42.678.885.76.982.7
Tunnel face (drilling)1108.04.1102.5112.49.9107.5
2106.23.9101.5110.08.5106.0
Tunnel entrance (mucking)181.22.477.884.36.581.0
277.22.274.180.05.977.0
Tunnel midpoint (mucking)183.52.879.687.17.583.7
279.12.375.682.06.479.2
Secondary lining (mucking)196.43.691.7100.28.596.0
292.13.487.496.08.692.0
Air outlet (mucking)185.92.981.889.47.686.2
288.03.083.691.68.088.2
Tunnel face (mucking)1100.53.795.8104.78.9100.8
2101.33.896.7105.58.8101.0
Tunnel entrance (shotcreting)181.72.578.385.06.781.5
281.72.478.284.86.681.5
Tunnel midpoint (shotcreting)178.72.175.681.55.978.5
281.12.377.884.06.281.0
Secondary lining (shotcreting)193.53.588.797.48.793.8
293.53.488.897.28.493.7
Air outlet (shotcreting)185.82.981.789.57.886.0
283.42.779.686.87.283.0
Tunnel face (shotcreting)1102.93.998.2107.18.9102.7
2104.04.099.2108.59.3103.8
Table 4. Summary statistics of dust concentration data at different measurement locations in the Moxunshan and Lehua tunnels.
Dust Concentration (1—Moxunshan Tunnel, 2—Lehua Tunnel)Mean (mg/m3)Standard Deviation (mg/m3)Minimum (mg/m3)Maximum (mg/m3)Range (mg/m3)Median (mg/m3)
Tunnel entrance (drilling)111.30.910.512.72.211.4
210.70.89.811.82.010.6
Tunnel midpoint (drilling)118.61.117.319.82.518.7
217.51.016.418.72.317.6
Secondary lining (drilling)120.31.219.021.62.620.2
219.71.218.521.02.519.8
Air outlet (drilling)118.61.017.519.82.318.5
217.40.916.318.62.317.3
Tunnel face (drilling)120.71.119.521.92.420.8
221.31.320.022.62.621.2
Tunnel entrance (mucking)17.90.77.28.91.77.8
28.00.87.19.01.98.1
Tunnel midpoint (mucking)113.31.012.114.42.313.2
213.71.012.614.82.213.6
Secondary lining (mucking)117.21.016.118.42.317.1
216.81.115.718.02.316.7
Air outlet (mucking)116.31.115.217.62.416.2
215.71.014.616.92.315.8
Tunnel face (mucking)115.30.914.316.52.215.4
215.70.914.716.82.115.6
Tunnel entrance (shotcreting)16.20.75.67.31.76.3
25.70.65.16.71.65.8
Tunnel midpoint (shotcreting)110.40.99.511.62.110.3
29.60.98.710.72.09.5
Secondary lining (shotcreting)113.21.012.014.32.313.1
212.81.011.713.92.212.7
Air outlet (shotcreting)111.40.810.512.52.011.5
212.60.911.613.72.112.5
Tunnel face (shotcreting)113.71.112.514.92.413.6
214.31.113.215.52.314.4
Table 5. Correlation analysis of variables.
HeightWeightGenderMarital statusAgeEducation levelLength of serviceDaily working hours
Unsafe−0.118−0.078−0.0390.0820.120−0.105−0.015−0.013
Monthly rest daysJob typeWork locationTemperatureHumidityNoiseParticulate matter concentrationDepression
Unsafe0.060−0.0320.0820.1950.0510.338 **0.270 **0.519 **
Note: ** p < 0.01.
Table 6. Evaluation of the variable importance in affecting unsafe behaviors of tunnel construction workers.
VariableIncMSE/%
Tunnel microenvironmentTemperature9.21
Humidity15.02
Noise17.40
Dust concentration22.56
Mental health statusStress57.99
Occupational characteristicsLength of service10.21
Monthly rest days8.58
Daily working hours7.47
Work location5.07
Type of operation11.08
Individual attributesHeight18.21
Weight15.10
Gender3.21
Education level12.27
Marital status8.66
Respiratory diseases1.71
Table 7. Summary of environmental parameters and their effects on unsafe behaviors in tunnel construction.
Environmental ParameterSpecific Impact on Unsafe BehaviorEffect DirectionOptimal Threshold RangeRelative Importance (RF Rank)Influence Degree
Dust concentrationImpairs respiratory function and attention; increases fatigue and operational errorPositive≤12 mg/m31 (highest)Very high
Noise levelAffects communication, induces cognitive fatigue and stressPositive≤82 dB(A)2High
HumidityAffects thermal comfort, skin moisture, and mood stabilityNonlinear 60~65%3Moderate
TemperatureAffects thermal stress, physical workload, and mood regulationNonlinear Around 0 °C4Moderate
Disclaimer/Publisher’s Note: The statements, opinions and data contained in all publications are solely those of the individual author(s) and contributor(s) and not of MDPI and/or the editor(s). MDPI and/or the editor(s) disclaim responsibility for any injury to people or property resulting from any ideas, methods, instructions or products referred to in the content.